Alliance, OH
Alliance Map
Alliance Overview
21,603
TOTAL POPULATION
10,657
MALE POPULATION
10,946
FEMALE POPULATION
97.36
MALES / 100 FEMALES
102.71
FEMALES / 100 MALES
35.9
MEDIAN AGE
3.0
AVG FAMILY SIZE
2.4
AVG HOUSEHOLD SIZE
$25,606
PER CAPITA INCOME
$62,123
AVG FAMILY INCOME
$51,721
AVG HOUSEHOLD INCOME
29.7%
WAGE / INCOME GAP [ % ]
70.3¢/ $1
WAGE / INCOME GAP [ $ ]
$10,383
FAMILY INCOME DEFICIT
0.43
INEQUALITY / GINI INDEX
10,436
LABOR FORCE [ PEOPLE ]
59.8%
PERCENT IN LABOR FORCE
4.0%
UNEMPLOYMENT RATE
Alliance Zip Codes
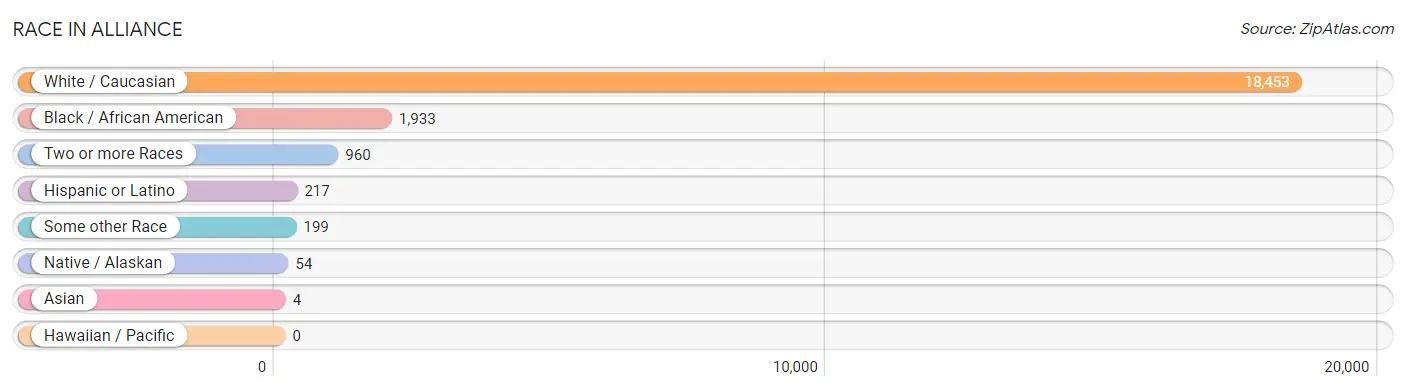
Race in Alliance
The most populous races in Alliance are White / Caucasian (18,453 | 85.4%), Black / African American (1,933 | 8.9%), and Two or more Races (960 | 4.4%).
| Race | # Population | % Population |
| Asian | 4 | 0.0% |
| Black / African American | 1,933 | 8.9% |
| Hawaiian / Pacific | 0 | 0.0% |
| Hispanic or Latino | 217 | 1.0% |
| Native / Alaskan | 54 | 0.3% |
| White / Caucasian | 18,453 | 85.4% |
| Two or more Races | 960 | 4.4% |
| Some other Race | 199 | 0.9% |
| Total | 21,603 | 100.0% |
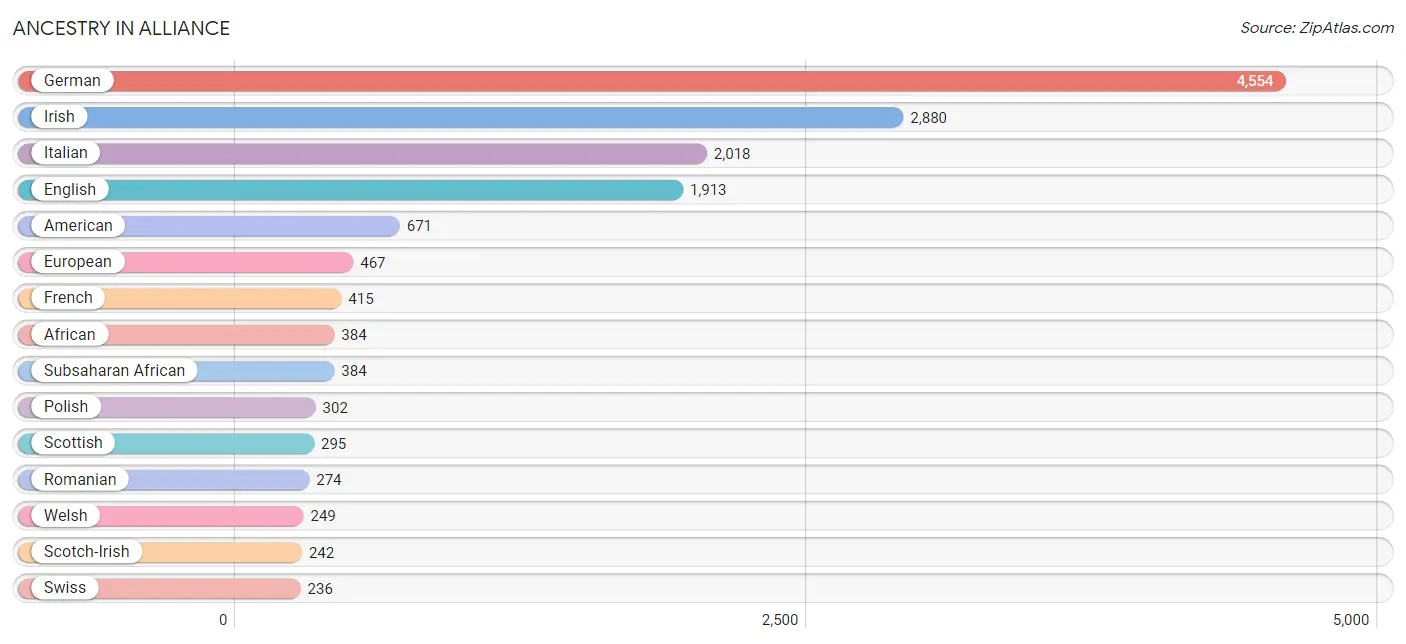
Ancestry in Alliance
The most populous ancestries reported in Alliance are German (4,554 | 21.1%), Irish (2,880 | 13.3%), Italian (2,018 | 9.3%), English (1,913 | 8.9%), and American (671 | 3.1%), together accounting for 55.7% of all Alliance residents.
| Ancestry | # Population | % Population |
| African | 384 | 1.8% |
| American | 671 | 3.1% |
| Arab | 52 | 0.2% |
| Armenian | 6 | 0.0% |
| Australian | 15 | 0.1% |
| Austrian | 39 | 0.2% |
| Belgian | 57 | 0.3% |
| Bhutanese | 16 | 0.1% |
| Blackfeet | 24 | 0.1% |
| Brazilian | 9 | 0.0% |
| British | 63 | 0.3% |
| Central American | 74 | 0.3% |
| Cherokee | 33 | 0.2% |
| Croatian | 67 | 0.3% |
| Czech | 92 | 0.4% |
| Czechoslovakian | 32 | 0.2% |
| Danish | 34 | 0.2% |
| Dutch | 232 | 1.1% |
| Eastern European | 2 | 0.0% |
| English | 1,913 | 8.9% |
| European | 467 | 2.2% |
| Finnish | 21 | 0.1% |
| French | 415 | 1.9% |
| German | 4,554 | 21.1% |
| Greek | 73 | 0.3% |
| Guatemalan | 14 | 0.1% |
| Hungarian | 233 | 1.1% |
| Indian (Asian) | 4 | 0.0% |
| Iraqi | 3 | 0.0% |
| Irish | 2,880 | 13.3% |
| Iroquois | 14 | 0.1% |
| Italian | 2,018 | 9.3% |
| Korean | 11 | 0.1% |
| Lebanese | 49 | 0.2% |
| Lithuanian | 9 | 0.0% |
| Mexican | 71 | 0.3% |
| Mexican American Indian | 54 | 0.3% |
| Mongolian | 90 | 0.4% |
| Northern European | 11 | 0.1% |
| Norwegian | 102 | 0.5% |
| Pakistani | 6 | 0.0% |
| Panamanian | 8 | 0.0% |
| Pennsylvania German | 65 | 0.3% |
| Polish | 302 | 1.4% |
| Portuguese | 86 | 0.4% |
| Puerto Rican | 44 | 0.2% |
| Romanian | 274 | 1.3% |
| Russian | 80 | 0.4% |
| Salvadoran | 52 | 0.2% |
| Scandinavian | 41 | 0.2% |
| Scotch-Irish | 242 | 1.1% |
| Scottish | 295 | 1.4% |
| Serbian | 141 | 0.6% |
| Sioux | 12 | 0.1% |
| Slavic | 9 | 0.0% |
| Slovak | 39 | 0.2% |
| Slovene | 51 | 0.2% |
| Subsaharan African | 384 | 1.8% |
| Swedish | 51 | 0.2% |
| Swiss | 236 | 1.1% |
| Thai | 163 | 0.7% |
| Turkish | 16 | 0.1% |
| Ukrainian | 23 | 0.1% |
| Welsh | 249 | 1.1% | View All 64 Rows |
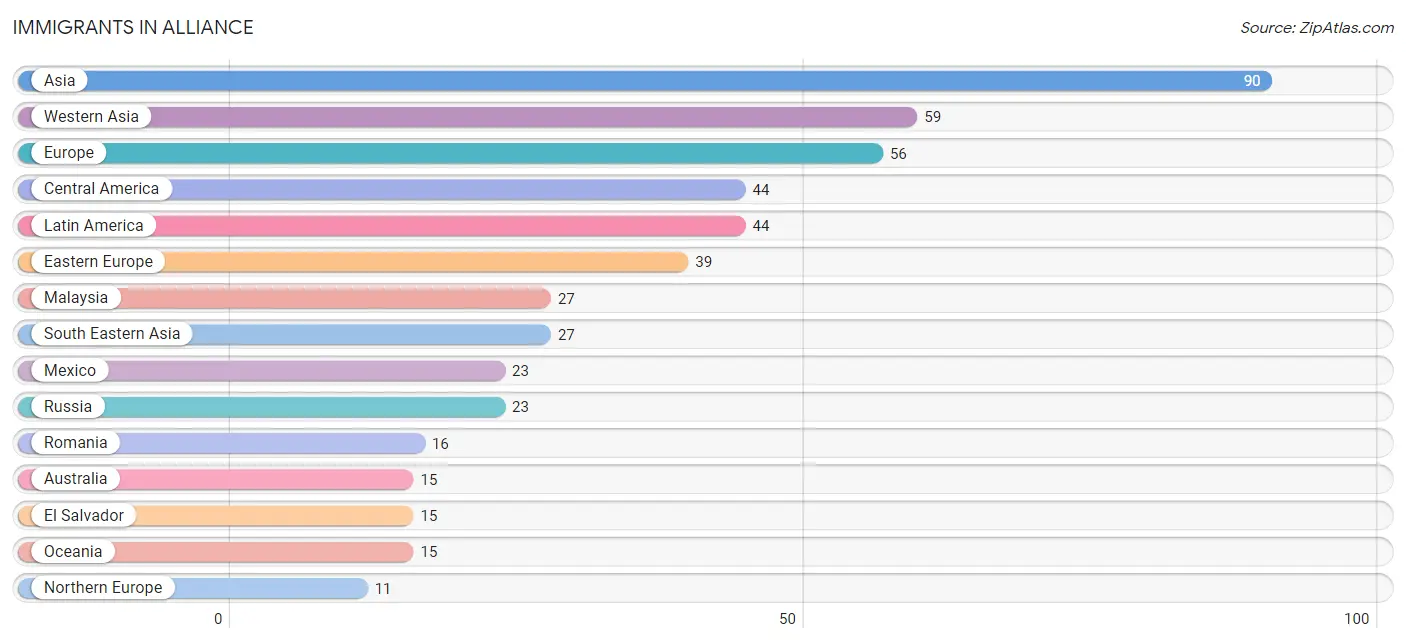
Immigrants in Alliance
The most numerous immigrant groups reported in Alliance came from Asia (90 | 0.4%), Western Asia (59 | 0.3%), Europe (56 | 0.3%), Central America (44 | 0.2%), and Latin America (44 | 0.2%), together accounting for 1.3% of all Alliance residents.
| Immigration Origin | # Population | % Population |
| Asia | 90 | 0.4% |
| Australia | 15 | 0.1% |
| Central America | 44 | 0.2% |
| Eastern Asia | 4 | 0.0% |
| Eastern Europe | 39 | 0.2% |
| El Salvador | 15 | 0.1% |
| Europe | 56 | 0.3% |
| Germany | 6 | 0.0% |
| Guatemala | 6 | 0.0% |
| Japan | 4 | 0.0% |
| Latin America | 44 | 0.2% |
| Malaysia | 27 | 0.1% |
| Mexico | 23 | 0.1% |
| Northern Europe | 11 | 0.1% |
| Norway | 3 | 0.0% |
| Oceania | 15 | 0.1% |
| Romania | 16 | 0.1% |
| Russia | 23 | 0.1% |
| South Eastern Asia | 27 | 0.1% |
| Sweden | 8 | 0.0% |
| Western Asia | 59 | 0.3% |
| Western Europe | 6 | 0.0% | View All 22 Rows |
Sex and Age in Alliance
Sex and Age in Alliance
The most populous age groups in Alliance are 20 to 24 Years (1,157 | 10.9%) for men and 20 to 24 Years (905 | 8.3%) for women.
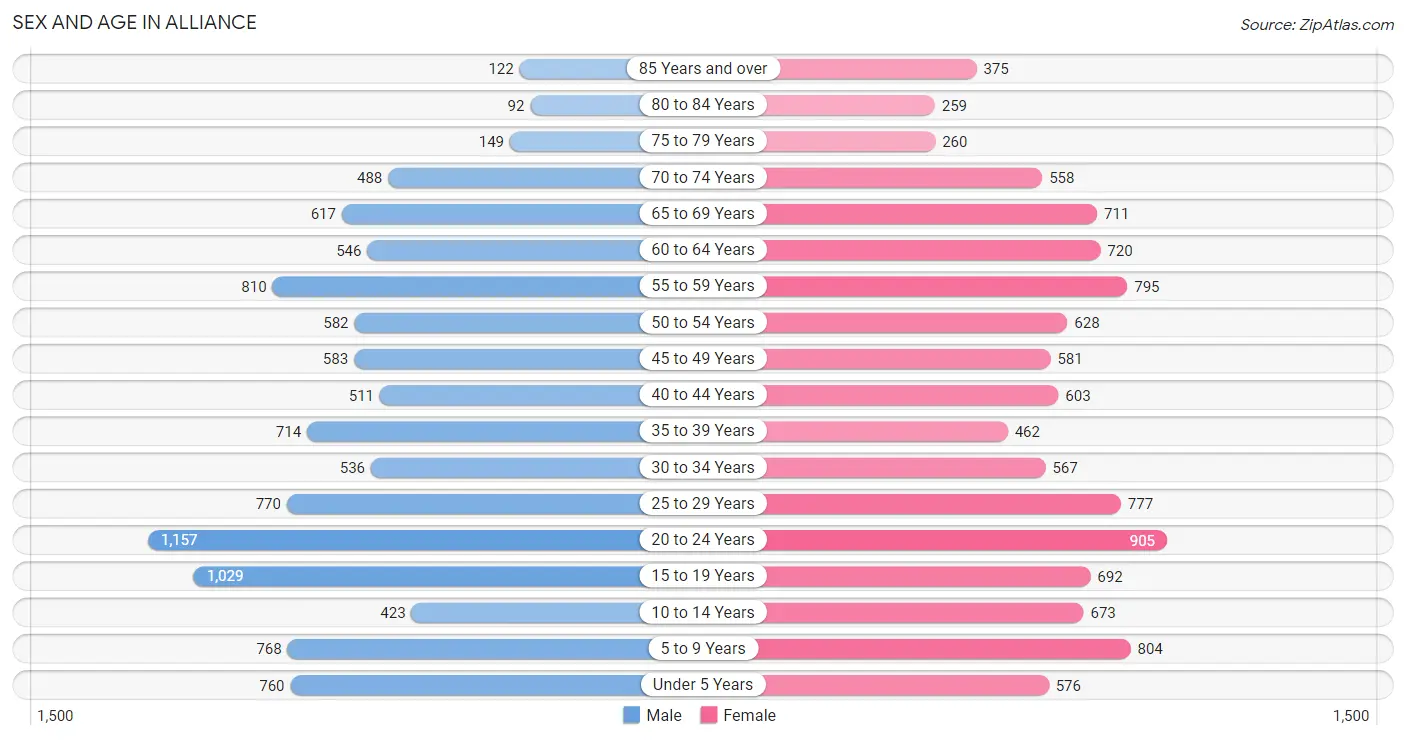
| Age Bracket | Male | Female |
| Under 5 Years | 760 (7.1%) | 576 (5.3%) |
| 5 to 9 Years | 768 (7.2%) | 804 (7.3%) |
| 10 to 14 Years | 423 (4.0%) | 673 (6.1%) |
| 15 to 19 Years | 1,029 (9.7%) | 692 (6.3%) |
| 20 to 24 Years | 1,157 (10.9%) | 905 (8.3%) |
| 25 to 29 Years | 770 (7.2%) | 777 (7.1%) |
| 30 to 34 Years | 536 (5.0%) | 567 (5.2%) |
| 35 to 39 Years | 714 (6.7%) | 462 (4.2%) |
| 40 to 44 Years | 511 (4.8%) | 603 (5.5%) |
| 45 to 49 Years | 583 (5.5%) | 581 (5.3%) |
| 50 to 54 Years | 582 (5.5%) | 628 (5.7%) |
| 55 to 59 Years | 810 (7.6%) | 795 (7.3%) |
| 60 to 64 Years | 546 (5.1%) | 720 (6.6%) |
| 65 to 69 Years | 617 (5.8%) | 711 (6.5%) |
| 70 to 74 Years | 488 (4.6%) | 558 (5.1%) |
| 75 to 79 Years | 149 (1.4%) | 260 (2.4%) |
| 80 to 84 Years | 92 (0.9%) | 259 (2.4%) |
| 85 Years and over | 122 (1.1%) | 375 (3.4%) |
| Total | 10,657 (100.0%) | 10,946 (100.0%) |
Families and Households in Alliance
Median Family Size in Alliance
The median family size in Alliance is 2.97 persons per family, with married-couple families (2,776 | 58.5%) accounting for the largest median family size of 2.99 persons per family. On the other hand, single male/father families (512 | 10.8%) represent the smallest median family size with 2.84 persons per family.
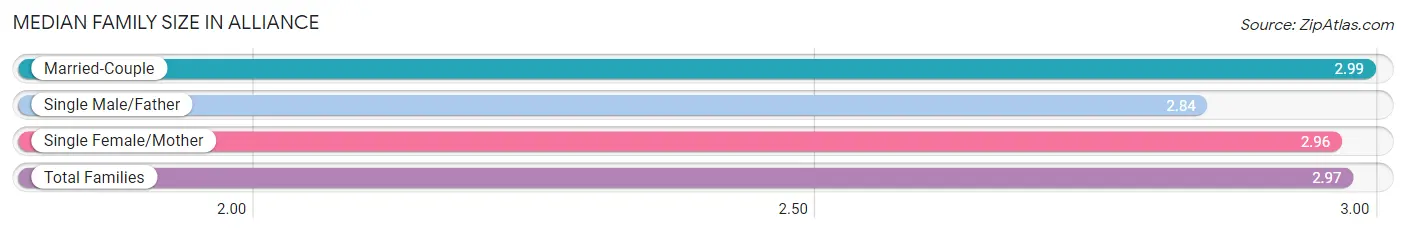
| Family Type | # Families | Family Size |
| Married-Couple | 2,776 (58.5%) | 2.99 |
| Single Male/Father | 512 (10.8%) | 2.84 |
| Single Female/Mother | 1,456 (30.7%) | 2.96 |
| Total Families | 4,744 (100.0%) | 2.97 |
Median Household Size in Alliance
The median household size in Alliance is 2.42 persons per household, with single male/father households (512 | 6.2%) accounting for the largest median household size of 3.61 persons per household. non-family households (3,534 | 42.7%) represent the smallest median household size with 1.35 persons per household.
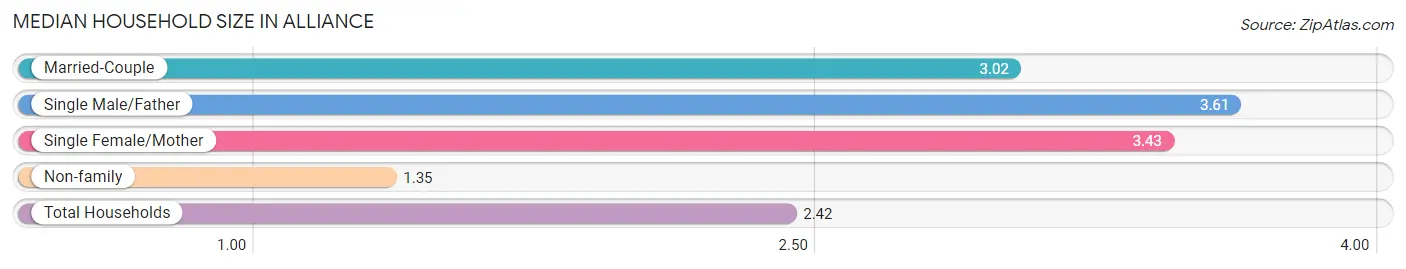
| Household Type | # Households | Household Size |
| Married-Couple | 2,776 (33.5%) | 3.02 |
| Single Male/Father | 512 (6.2%) | 3.61 |
| Single Female/Mother | 1,456 (17.6%) | 3.43 |
| Non-family | 3,534 (42.7%) | 1.35 |
| Total Households | 8,278 (100.0%) | 2.42 |
Household Size by Marriage Status in Alliance
Out of a total of 8,278 households in Alliance, 4,744 (57.3%) are family households, while 3,534 (42.7%) are nonfamily households. The most numerous type of family households are 2-person households, comprising 2,195, and the most common type of nonfamily households are 1-person households, comprising 2,684.
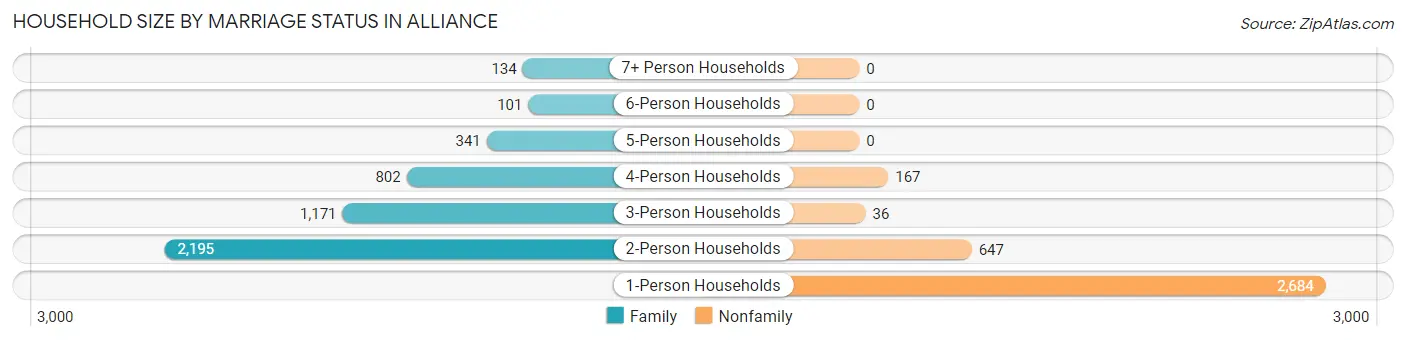
| Household Size | Family Households | Nonfamily Households |
| 1-Person Households | - | 2,684 (32.4%) |
| 2-Person Households | 2,195 (26.5%) | 647 (7.8%) |
| 3-Person Households | 1,171 (14.1%) | 36 (0.4%) |
| 4-Person Households | 802 (9.7%) | 167 (2.0%) |
| 5-Person Households | 341 (4.1%) | 0 (0.0%) |
| 6-Person Households | 101 (1.2%) | 0 (0.0%) |
| 7+ Person Households | 134 (1.6%) | 0 (0.0%) |
| Total | 4,744 (57.3%) | 3,534 (42.7%) |
Female Fertility in Alliance
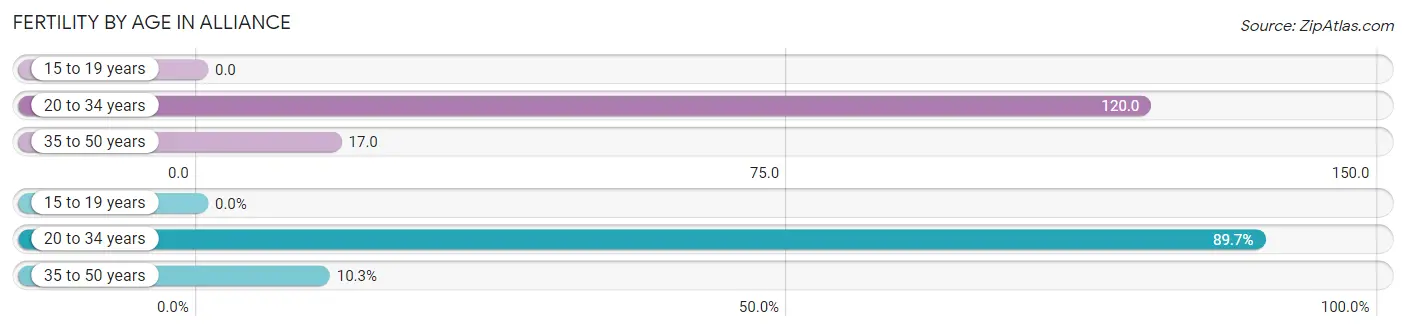
Fertility by Age in Alliance
Average fertility rate in Alliance is 63.0 births per 1,000 women. Women in the age bracket of 20 to 34 years have the highest fertility rate with 120.0 births per 1,000 women. Women in the age bracket of 20 to 34 years acount for 89.7% of all women with births.
| Age Bracket | Women with Births | Births / 1,000 Women |
| 15 to 19 years | 0 (0.0%) | 0.0 |
| 20 to 34 years | 269 (89.7%) | 120.0 |
| 35 to 50 years | 31 (10.3%) | 17.0 |
| Total | 300 (100.0%) | 63.0 |
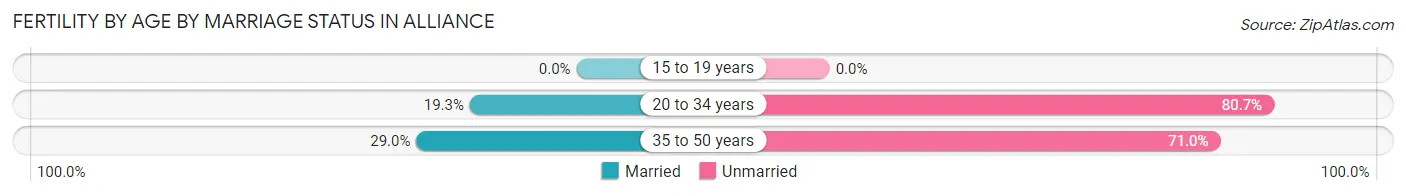
Fertility by Age by Marriage Status in Alliance
20.3% of women with births (300) in Alliance are married. The highest percentage of unmarried women with births falls into 20 to 34 years age bracket with 80.7% of them unmarried at the time of birth, while the lowest percentage of unmarried women with births belong to 35 to 50 years age bracket with 71.0% of them unmarried.
| Age Bracket | Married | Unmarried |
| 15 to 19 years | 0 (0.0%) | 0 (0.0%) |
| 20 to 34 years | 52 (19.3%) | 217 (80.7%) |
| 35 to 50 years | 9 (29.0%) | 22 (71.0%) |
| Total | 61 (20.3%) | 239 (79.7%) |
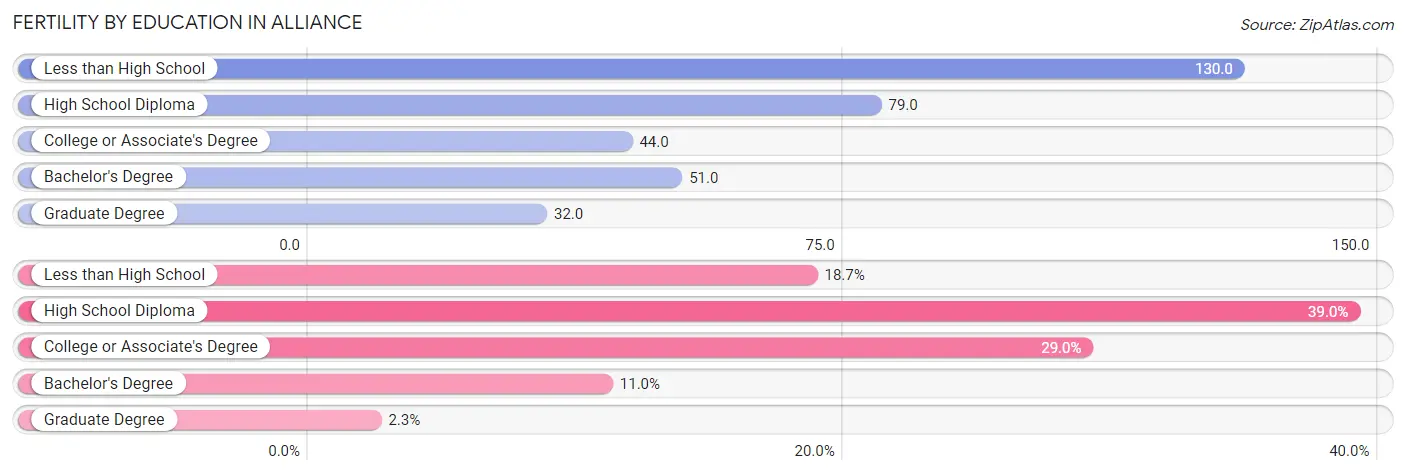
Fertility by Education in Alliance
Average fertility rate in Alliance is 63.0 births per 1,000 women. Women with the education attainment of less than high school have the highest fertility rate of 130.0 births per 1,000 women, while women with the education attainment of graduate degree have the lowest fertility at 32.0 births per 1,000 women. Women with the education attainment of high school diploma represent 39.0% of all women with births.
| Educational Attainment | Women with Births | Births / 1,000 Women |
| Less than High School | 56 (18.7%) | 130.0 |
| High School Diploma | 117 (39.0%) | 79.0 |
| College or Associate's Degree | 87 (29.0%) | 44.0 |
| Bachelor's Degree | 33 (11.0%) | 51.0 |
| Graduate Degree | 7 (2.3%) | 32.0 |
| Total | 300 (100.0%) | 63.0 |
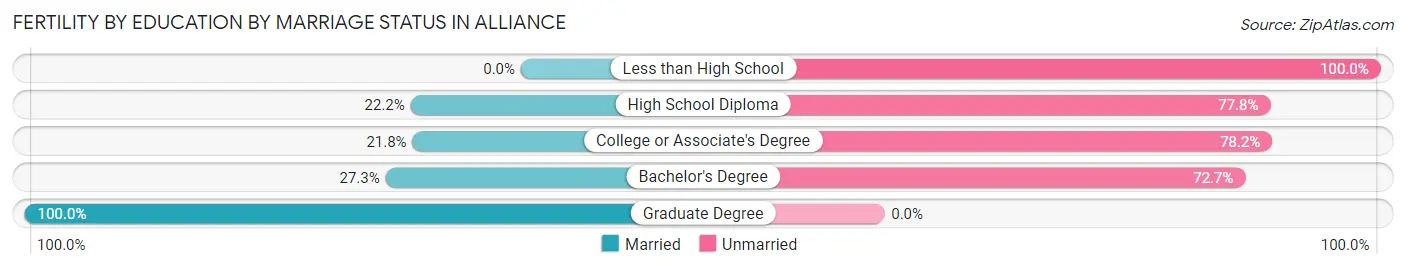
Fertility by Education by Marriage Status in Alliance
79.7% of women with births in Alliance are unmarried. Women with the educational attainment of graduate degree are most likely to be married with 100.0% of them married at childbirth, while women with the educational attainment of less than high school are least likely to be married with 100.0% of them unmarried at childbirth.
| Educational Attainment | Married | Unmarried |
| Less than High School | 0 (0.0%) | 56 (100.0%) |
| High School Diploma | 26 (22.2%) | 91 (77.8%) |
| College or Associate's Degree | 19 (21.8%) | 68 (78.2%) |
| Bachelor's Degree | 9 (27.3%) | 24 (72.7%) |
| Graduate Degree | 7 (100.0%) | 0 (0.0%) |
| Total | 61 (20.3%) | 239 (79.7%) |
Income in Alliance
Income Overview in Alliance
Per Capita Income in Alliance is $25,606, while median incomes of families and households are $62,123 and $51,721 respectively.
| Characteristic | Number | Measure |
| Per Capita Income | 21,603 | $25,606 |
| Median Family Income | 4,744 | $62,123 |
| Mean Family Income | 4,744 | $71,294 |
| Median Household Income | 8,278 | $51,721 |
| Mean Household Income | 8,278 | $63,327 |
| Income Deficit | 4,744 | $10,383 |
| Wage / Income Gap (%) | 21,603 | 29.71% |
| Wage / Income Gap ($) | 21,603 | 70.29¢ per $1 |
| Gini / Inequality Index | 21,603 | 0.43 |
Earnings by Sex in Alliance
Average Earnings in Alliance are $29,003, $32,732 for men and $23,006 for women, a difference of 29.7%.
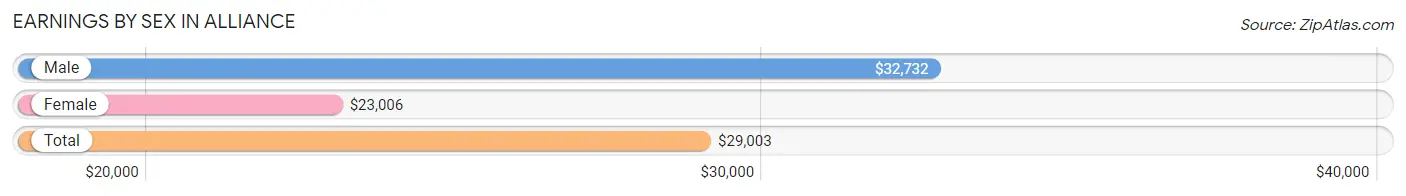
| Sex | Number | Average Earnings |
| Male | 6,285 (55.2%) | $32,732 |
| Female | 5,095 (44.8%) | $23,006 |
| Total | 11,380 (100.0%) | $29,003 |
Earnings by Sex by Income Bracket in Alliance
The most common earnings brackets in Alliance are $25,000 to $29,999 for men (486 | 7.7%) and $30,000 to $34,999 for women (485 | 9.5%).
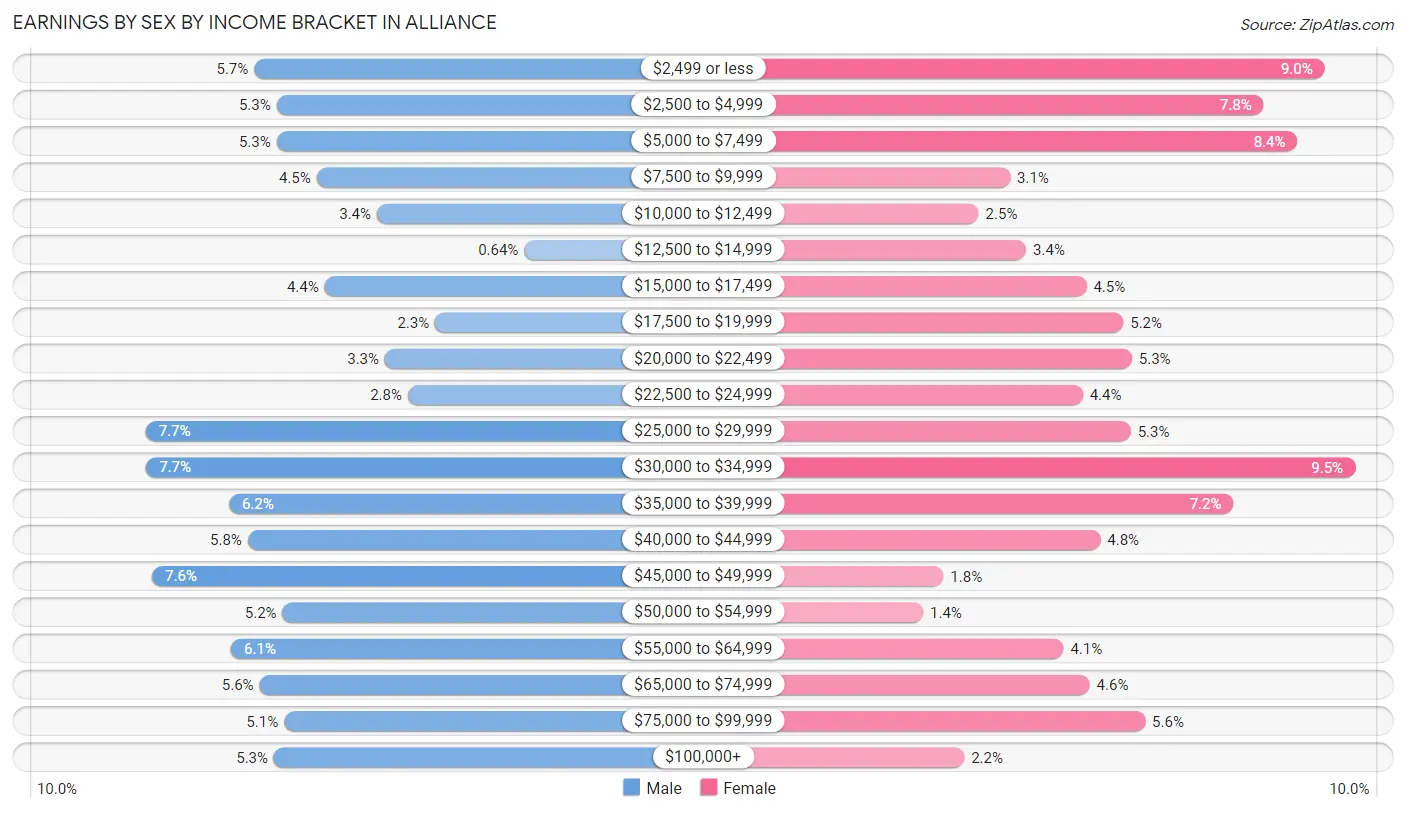
| Income | Male | Female |
| $2,499 or less | 358 (5.7%) | 456 (8.9%) |
| $2,500 to $4,999 | 332 (5.3%) | 398 (7.8%) |
| $5,000 to $7,499 | 332 (5.3%) | 430 (8.4%) |
| $7,500 to $9,999 | 285 (4.5%) | 156 (3.1%) |
| $10,000 to $12,499 | 214 (3.4%) | 126 (2.5%) |
| $12,500 to $14,999 | 40 (0.6%) | 171 (3.4%) |
| $15,000 to $17,499 | 275 (4.4%) | 229 (4.5%) |
| $17,500 to $19,999 | 145 (2.3%) | 264 (5.2%) |
| $20,000 to $22,499 | 204 (3.3%) | 272 (5.3%) |
| $22,500 to $24,999 | 177 (2.8%) | 225 (4.4%) |
| $25,000 to $29,999 | 486 (7.7%) | 271 (5.3%) |
| $30,000 to $34,999 | 485 (7.7%) | 485 (9.5%) |
| $35,000 to $39,999 | 388 (6.2%) | 369 (7.2%) |
| $40,000 to $44,999 | 366 (5.8%) | 242 (4.8%) |
| $45,000 to $49,999 | 478 (7.6%) | 92 (1.8%) |
| $50,000 to $54,999 | 325 (5.2%) | 73 (1.4%) |
| $55,000 to $64,999 | 385 (6.1%) | 207 (4.1%) |
| $65,000 to $74,999 | 352 (5.6%) | 232 (4.5%) |
| $75,000 to $99,999 | 323 (5.1%) | 285 (5.6%) |
| $100,000+ | 335 (5.3%) | 112 (2.2%) |
| Total | 6,285 (100.0%) | 5,095 (100.0%) |
Earnings by Sex by Educational Attainment in Alliance
Average earnings in Alliance are $41,587 for men and $30,589 for women, a difference of 26.5%. Men with an educational attainment of bachelor's degree enjoy the highest average annual earnings of $60,083, while those with less than high school education earn the least with $26,958. Women with an educational attainment of bachelor's degree earn the most with the average annual earnings of $58,750, while those with less than high school education have the smallest earnings of $17,500.
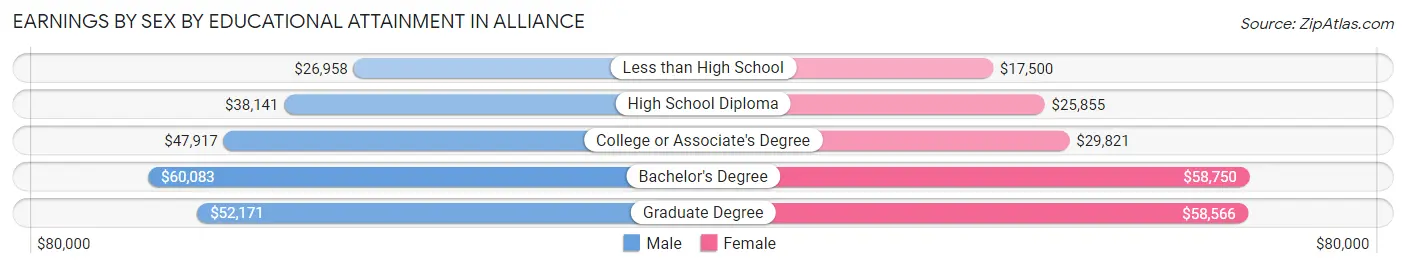
| Educational Attainment | Male Income | Female Income |
| Less than High School | $26,958 | $17,500 |
| High School Diploma | $38,141 | $25,855 |
| College or Associate's Degree | $47,917 | $29,821 |
| Bachelor's Degree | $60,083 | $58,750 |
| Graduate Degree | $52,171 | $58,566 |
| Total | $41,587 | $30,589 |
Family Income in Alliance
Family Income Brackets in Alliance
According to the Alliance family income data, there are 1,129 families falling into the $50,000 to $74,999 income range, which is the most common income bracket and makes up 23.8% of all families. Conversely, the $200,000+ income bracket is the least frequent group with only 90 families (1.9%) belonging to this category.
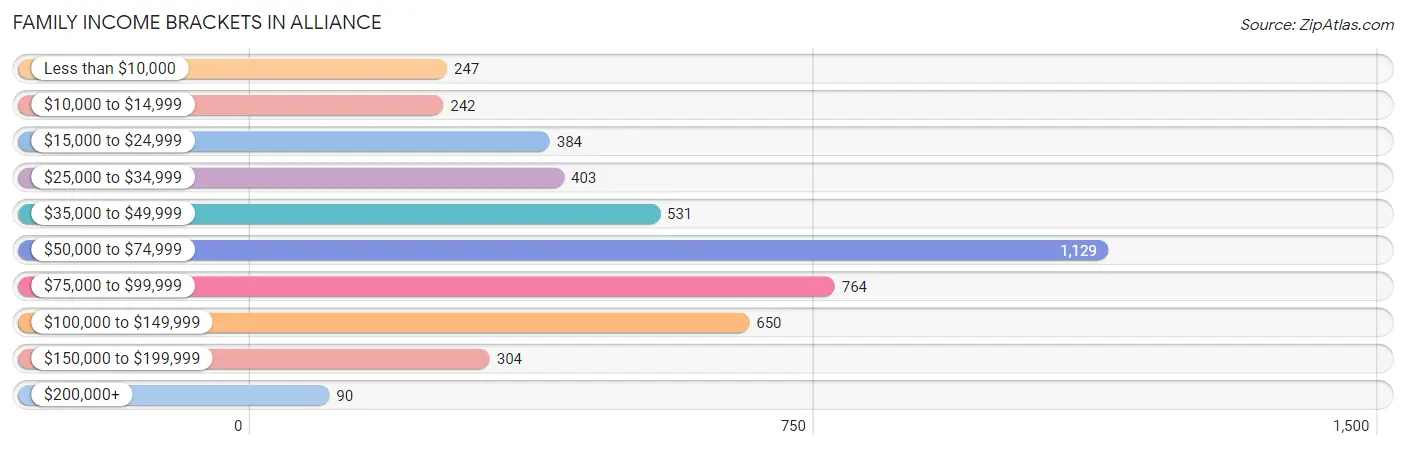
| Income Bracket | # Families | % Families |
| Less than $10,000 | 247 | 5.2% |
| $10,000 to $14,999 | 242 | 5.1% |
| $15,000 to $24,999 | 384 | 8.1% |
| $25,000 to $34,999 | 403 | 8.5% |
| $35,000 to $49,999 | 531 | 11.2% |
| $50,000 to $74,999 | 1,129 | 23.8% |
| $75,000 to $99,999 | 764 | 16.1% |
| $100,000 to $149,999 | 650 | 13.7% |
| $150,000 to $199,999 | 304 | 6.4% |
| $200,000+ | 90 | 1.9% |
Family Income by Famaliy Size in Alliance
5-person families (245 | 5.2%) account for the highest median family income in Alliance with $67,899 per family, while 2-person families (2,538 | 53.5%) have the highest median income of $31,589 per family member.
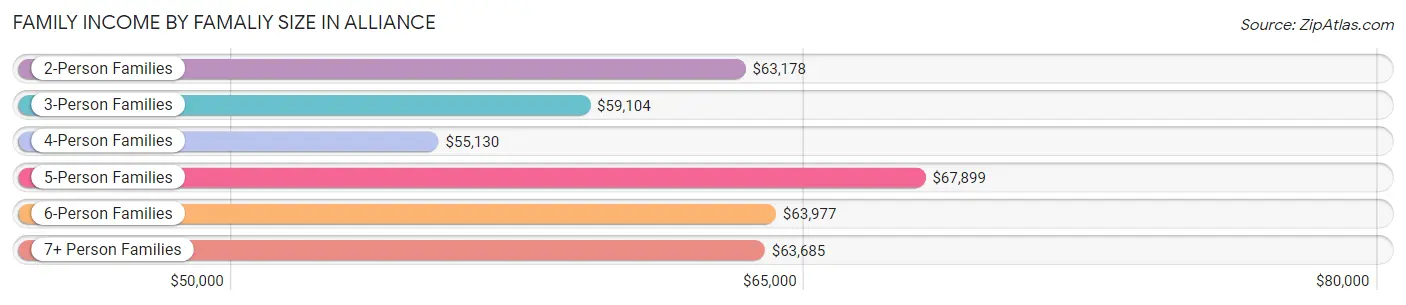
| Income Bracket | # Families | Median Income |
| 2-Person Families | 2,538 (53.5%) | $63,178 |
| 3-Person Families | 1,259 (26.5%) | $59,104 |
| 4-Person Families | 505 (10.6%) | $55,130 |
| 5-Person Families | 245 (5.2%) | $67,899 |
| 6-Person Families | 94 (2.0%) | $63,977 |
| 7+ Person Families | 103 (2.2%) | $63,685 |
| Total | 4,744 (100.0%) | $62,123 |
Family Income by Number of Earners in Alliance
The median family income in Alliance is $62,123, with families comprising 2 earners (1,795) having the highest median family income of $85,650, while families with no earners (769) have the lowest median family income of $30,382, accounting for 37.8% and 16.2% of families, respectively.
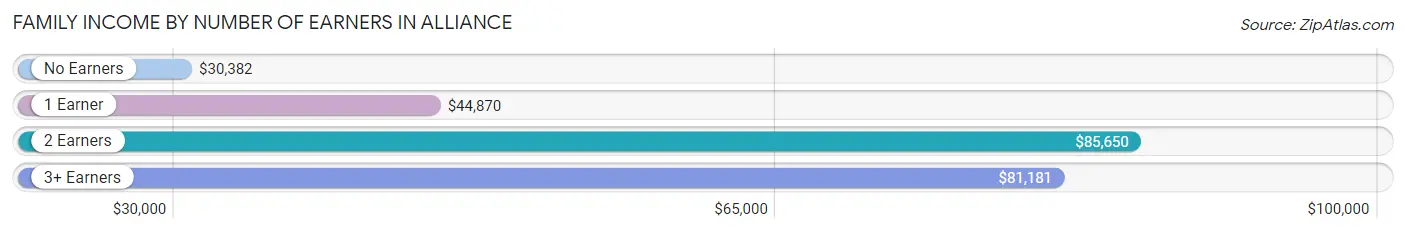
| Number of Earners | # Families | Median Income |
| No Earners | 769 (16.2%) | $30,382 |
| 1 Earner | 1,855 (39.1%) | $44,870 |
| 2 Earners | 1,795 (37.8%) | $85,650 |
| 3+ Earners | 325 (6.9%) | $81,181 |
| Total | 4,744 (100.0%) | $62,123 |
Household Income in Alliance
Household Income Brackets in Alliance
With 1,714 households falling in the category, the $50,000 to $74,999 income range is the most frequent in Alliance, accounting for 20.7% of all households. In contrast, only 132 households (1.6%) fall into the $200,000+ income bracket, making it the least populous group.
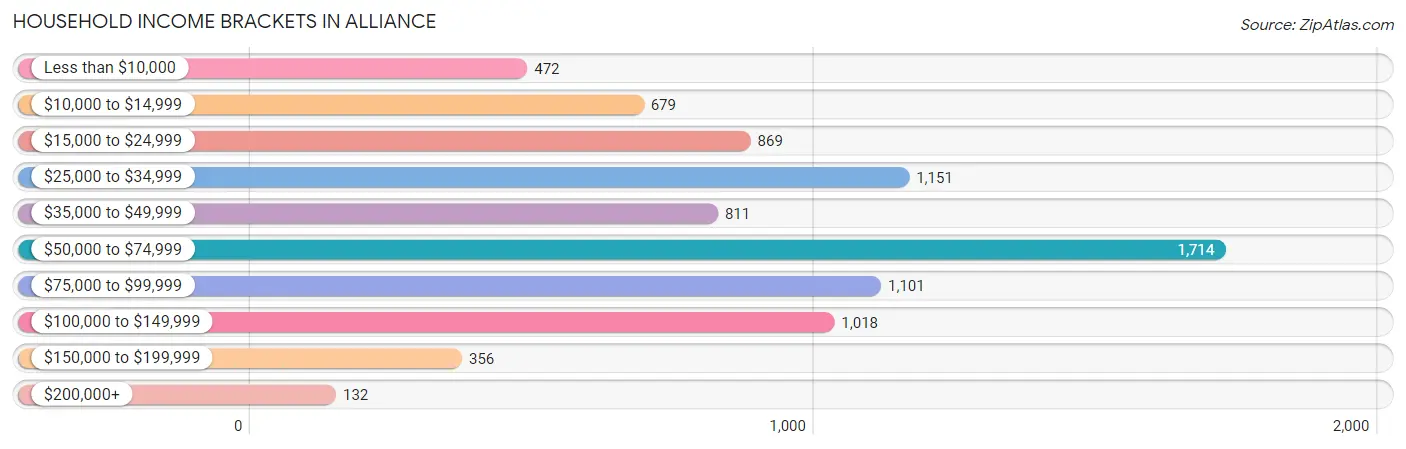
| Income Bracket | # Households | % Households |
| Less than $10,000 | 472 | 5.7% |
| $10,000 to $14,999 | 679 | 8.2% |
| $15,000 to $24,999 | 869 | 10.5% |
| $25,000 to $34,999 | 1,151 | 13.9% |
| $35,000 to $49,999 | 811 | 9.8% |
| $50,000 to $74,999 | 1,714 | 20.7% |
| $75,000 to $99,999 | 1,101 | 13.3% |
| $100,000 to $149,999 | 1,018 | 12.3% |
| $150,000 to $199,999 | 356 | 4.3% |
| $200,000+ | 132 | 1.6% |
Household Income by Householder Age in Alliance
The median household income in Alliance is $51,721, with the highest median household income of $59,608 found in the 25 to 44 years age bracket for the primary householder. A total of 2,447 households (29.6%) fall into this category. Meanwhile, the 65+ years age bracket for the primary householder has the lowest median household income of $34,764, with 2,319 households (28.0%) in this group.
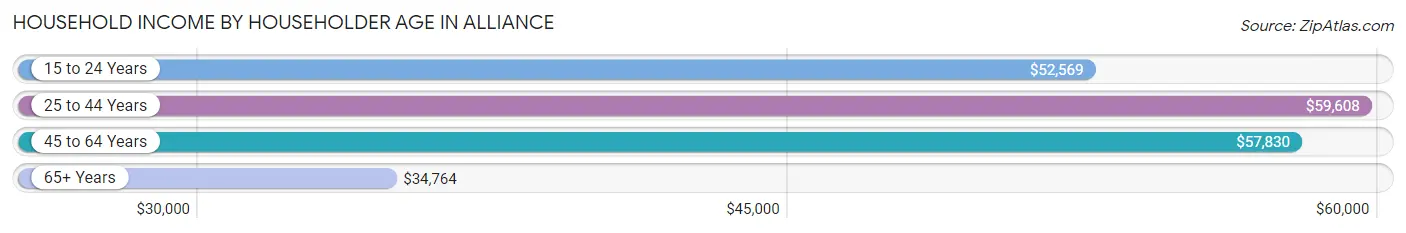
| Income Bracket | # Households | Median Income |
| 15 to 24 Years | 543 (6.6%) | $52,569 |
| 25 to 44 Years | 2,447 (29.6%) | $59,608 |
| 45 to 64 Years | 2,969 (35.9%) | $57,830 |
| 65+ Years | 2,319 (28.0%) | $34,764 |
| Total | 8,278 (100.0%) | $51,721 |
Poverty in Alliance
Income Below Poverty by Sex and Age in Alliance
With 17.4% poverty level for males and 28.7% for females among the residents of Alliance, 15 year old males and 16 and 17 year old females are the most vulnerable to poverty, with 83 males (89.2%) and 77 females (52.4%) in their respective age groups living below the poverty level.
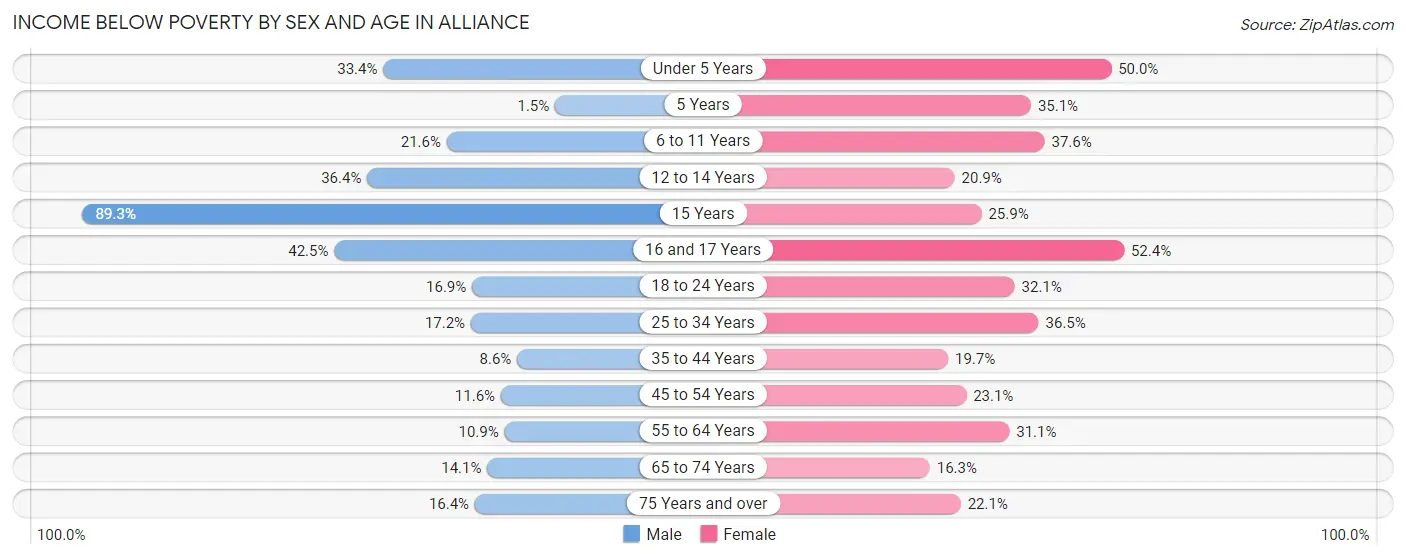
| Age Bracket | Male | Female |
| Under 5 Years | 254 (33.4%) | 288 (50.0%) |
| 5 Years | 2 (1.5%) | 33 (35.1%) |
| 6 to 11 Years | 167 (21.6%) | 312 (37.6%) |
| 12 to 14 Years | 91 (36.4%) | 116 (20.9%) |
| 15 Years | 83 (89.2%) | 14 (25.9%) |
| 16 and 17 Years | 108 (42.5%) | 77 (52.4%) |
| 18 to 24 Years | 207 (16.9%) | 257 (32.1%) |
| 25 to 34 Years | 224 (17.2%) | 491 (36.5%) |
| 35 to 44 Years | 105 (8.6%) | 210 (19.7%) |
| 45 to 54 Years | 135 (11.6%) | 275 (23.1%) |
| 55 to 64 Years | 147 (10.9%) | 462 (31.1%) |
| 65 to 74 Years | 153 (14.1%) | 203 (16.3%) |
| 75 Years and over | 53 (16.4%) | 160 (22.1%) |
| Total | 1,729 (17.4%) | 2,898 (28.7%) |
Income Above Poverty by Sex and Age in Alliance
According to the poverty statistics in Alliance, males aged 5 years and females aged 65 to 74 years are the age groups that are most secure financially, with 98.5% of males and 83.7% of females in these age groups living above the poverty line.
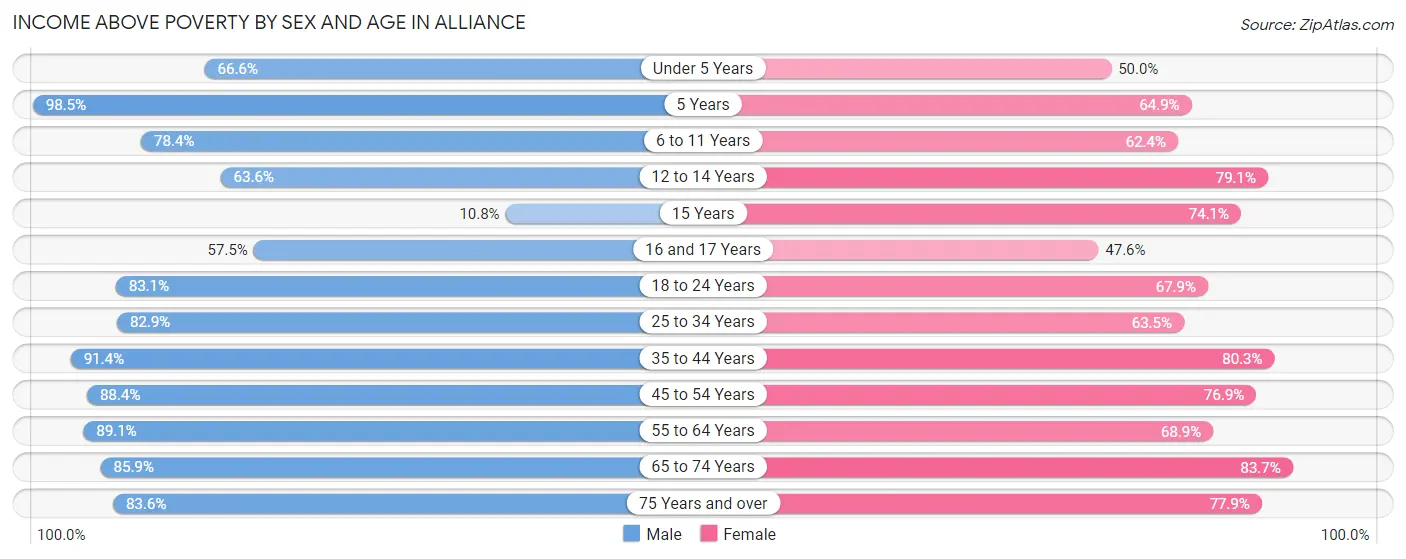
| Age Bracket | Male | Female |
| Under 5 Years | 506 (66.6%) | 288 (50.0%) |
| 5 Years | 129 (98.5%) | 61 (64.9%) |
| 6 to 11 Years | 605 (78.4%) | 517 (62.4%) |
| 12 to 14 Years | 159 (63.6%) | 438 (79.1%) |
| 15 Years | 10 (10.7%) | 40 (74.1%) |
| 16 and 17 Years | 146 (57.5%) | 70 (47.6%) |
| 18 to 24 Years | 1,015 (83.1%) | 544 (67.9%) |
| 25 to 34 Years | 1,082 (82.9%) | 853 (63.5%) |
| 35 to 44 Years | 1,120 (91.4%) | 855 (80.3%) |
| 45 to 54 Years | 1,030 (88.4%) | 916 (76.9%) |
| 55 to 64 Years | 1,199 (89.1%) | 1,024 (68.9%) |
| 65 to 74 Years | 931 (85.9%) | 1,039 (83.7%) |
| 75 Years and over | 270 (83.6%) | 565 (77.9%) |
| Total | 8,202 (82.6%) | 7,210 (71.3%) |
Income Below Poverty Among Married-Couple Families in Alliance
The poverty statistics for married-couple families in Alliance show that 3.9% or 109 of the total 2,776 families live below the poverty line. Families with 3 or 4 children have the highest poverty rate of 8.6%, comprising of 18 families. On the other hand, families with 1 or 2 children have the lowest poverty rate of 2.5%, which includes 15 families.
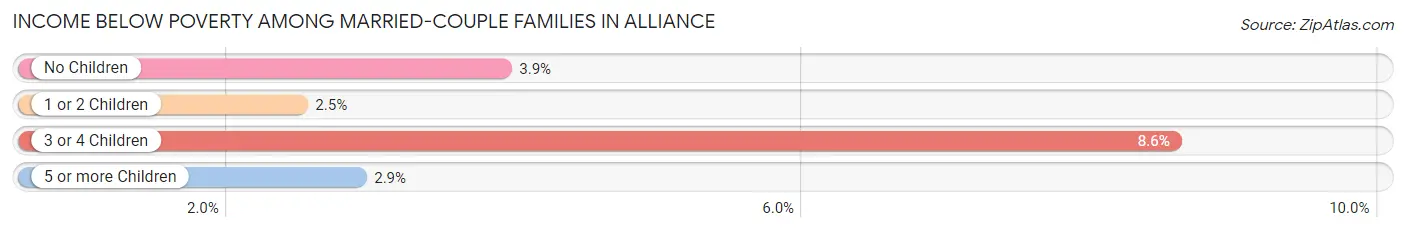
| Children | Above Poverty | Below Poverty |
| No Children | 1,821 (96.1%) | 74 (3.9%) |
| 1 or 2 Children | 587 (97.5%) | 15 (2.5%) |
| 3 or 4 Children | 192 (91.4%) | 18 (8.6%) |
| 5 or more Children | 67 (97.1%) | 2 (2.9%) |
| Total | 2,667 (96.1%) | 109 (3.9%) |
Income Below Poverty Among Single-Parent Households in Alliance
According to the poverty data in Alliance, 12.7% or 65 single-father households and 43.8% or 638 single-mother households are living below the poverty line. Among single-father households, those with 5 or more children have the highest poverty rate, with 22 households (100.0%) experiencing poverty. Likewise, among single-mother households, those with 5 or more children have the highest poverty rate, with 19 households (100.0%) falling below the poverty line.
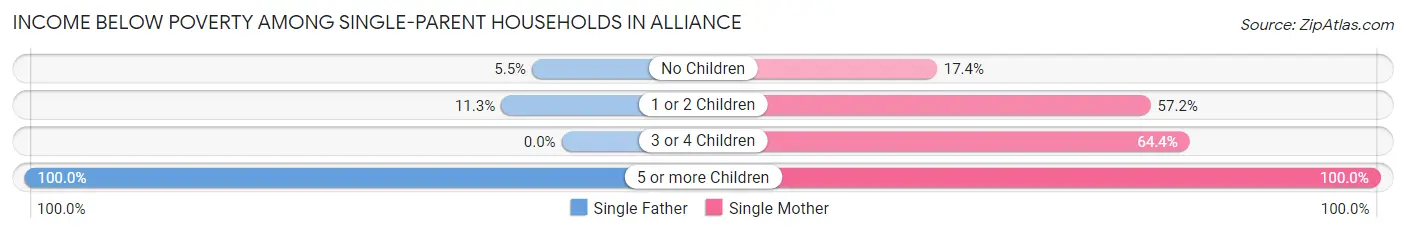
| Children | Single Father | Single Mother |
| No Children | 11 (5.5%) | 93 (17.3%) |
| 1 or 2 Children | 32 (11.3%) | 430 (57.2%) |
| 3 or 4 Children | 0 (0.0%) | 96 (64.4%) |
| 5 or more Children | 22 (100.0%) | 19 (100.0%) |
| Total | 65 (12.7%) | 638 (43.8%) |
Income Below Poverty Among Married-Couple vs Single-Parent Households in Alliance
The poverty data for Alliance shows that 109 of the married-couple family households (3.9%) and 703 of the single-parent households (35.7%) are living below the poverty level. Within the married-couple family households, those with 3 or 4 children have the highest poverty rate, with 18 households (8.6%) falling below the poverty line. Among the single-parent households, those with 5 or more children have the highest poverty rate, with 41 household (100.0%) living below poverty.
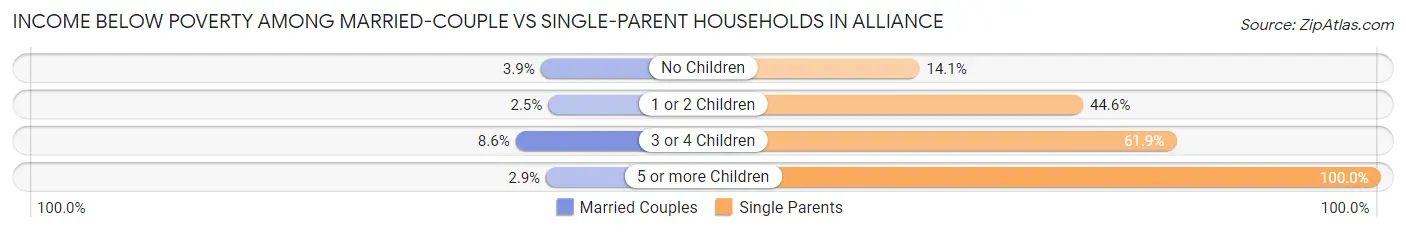
| Children | Married-Couple Families | Single-Parent Households |
| No Children | 74 (3.9%) | 104 (14.1%) |
| 1 or 2 Children | 15 (2.5%) | 462 (44.6%) |
| 3 or 4 Children | 18 (8.6%) | 96 (61.9%) |
| 5 or more Children | 2 (2.9%) | 41 (100.0%) |
| Total | 109 (3.9%) | 703 (35.7%) |
Employment Characteristics in Alliance
Employment by Class of Employer in Alliance
Among the 9,788 employed individuals in Alliance, private company employees (7,060 | 72.1%), not-for-profit organizations (1,383 | 14.1%), and local government employees (644 | 6.6%) make up the most common classes of employment.
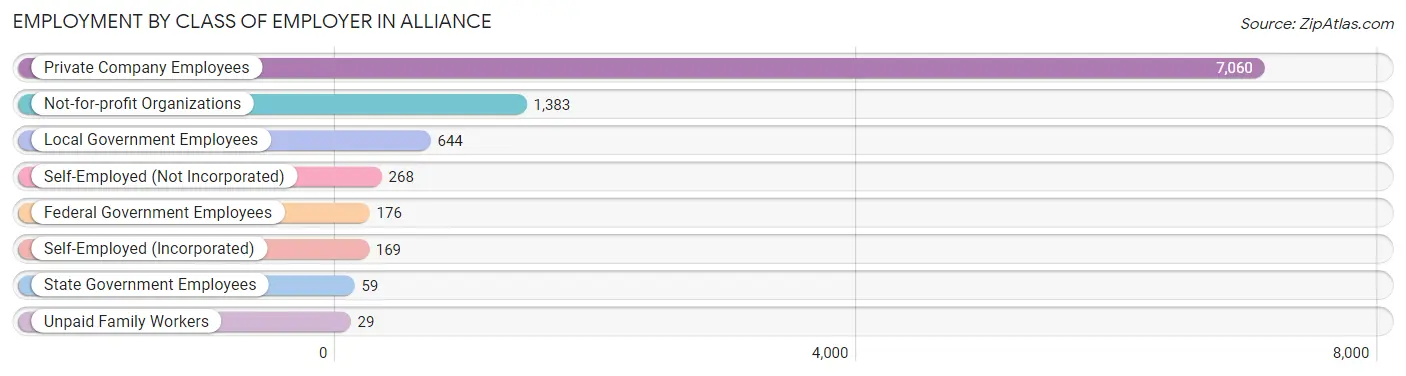
| Employer Class | # Employees | % Employees |
| Private Company Employees | 7,060 | 72.1% |
| Self-Employed (Incorporated) | 169 | 1.7% |
| Self-Employed (Not Incorporated) | 268 | 2.7% |
| Not-for-profit Organizations | 1,383 | 14.1% |
| Local Government Employees | 644 | 6.6% |
| State Government Employees | 59 | 0.6% |
| Federal Government Employees | 176 | 1.8% |
| Unpaid Family Workers | 29 | 0.3% |
| Total | 9,788 | 100.0% |
Employment Status by Age in Alliance
According to the labor force statistics for Alliance, out of the total population over 16 years of age (17,452), 59.8% or 10,436 individuals are in the labor force, with 4.0% or 417 of them unemployed. The age group with the highest labor force participation rate is 30 to 34 years, with 83.7% or 923 individuals in the labor force. Within the labor force, the 16 to 19 years age range has the highest percentage of unemployed individuals, with 17.8% or 107 of them being unemployed.
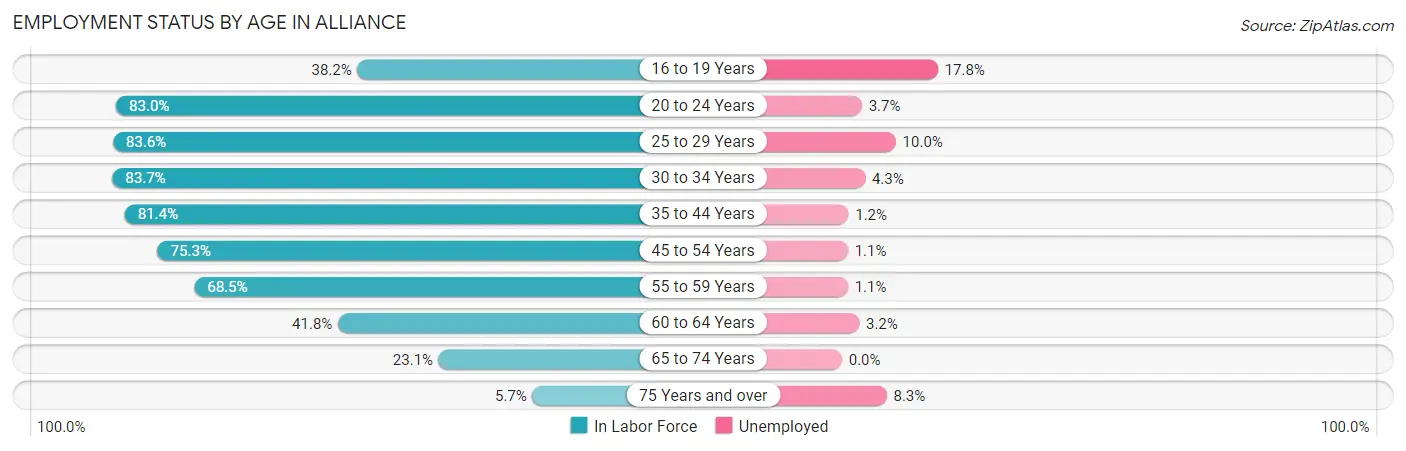
| Age Bracket | In Labor Force | Unemployed |
| 16 to 19 Years | 601 (38.2%) | 107 (17.8%) |
| 20 to 24 Years | 1,711 (83.0%) | 63 (3.7%) |
| 25 to 29 Years | 1,293 (83.6%) | 129 (10.0%) |
| 30 to 34 Years | 923 (83.7%) | 40 (4.3%) |
| 35 to 44 Years | 1,864 (81.4%) | 22 (1.2%) |
| 45 to 54 Years | 1,788 (75.3%) | 20 (1.1%) |
| 55 to 59 Years | 1,099 (68.5%) | 12 (1.1%) |
| 60 to 64 Years | 529 (41.8%) | 17 (3.2%) |
| 65 to 74 Years | 548 (23.1%) | 0 (0.0%) |
| 75 Years and over | 72 (5.7%) | 6 (8.3%) |
| Total | 10,436 (59.8%) | 417 (4.0%) |
Employment Status by Educational Attainment in Alliance
According to labor force statistics for Alliance, 73.6% of individuals (7,496) out of the total population between 25 and 64 years of age (10,185) are in the labor force, with 3.2% or 240 of them being unemployed. The group with the highest labor force participation rate are those with the educational attainment of bachelor's degree or higher, with 79.9% or 1,473 individuals in the labor force. Within the labor force, individuals with college / associate degree education have the highest percentage of unemployment, with 6.2% or 132 of them being unemployed.
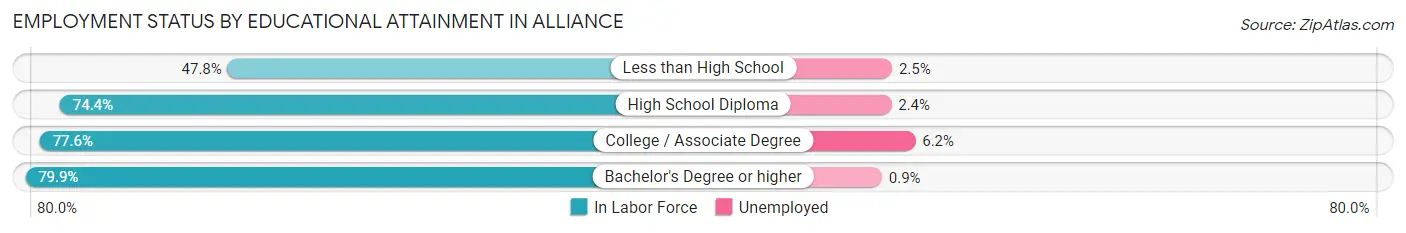
| Educational Attainment | In Labor Force | Unemployed |
| Less than High School | 481 (47.8%) | 25 (2.5%) |
| High School Diploma | 3,408 (74.4%) | 110 (2.4%) |
| College / Associate Degree | 2,137 (77.6%) | 171 (6.2%) |
| Bachelor's Degree or higher | 1,473 (79.9%) | 17 (0.9%) |
| Total | 7,496 (73.6%) | 326 (3.2%) |
Employment Occupations by Sex in Alliance
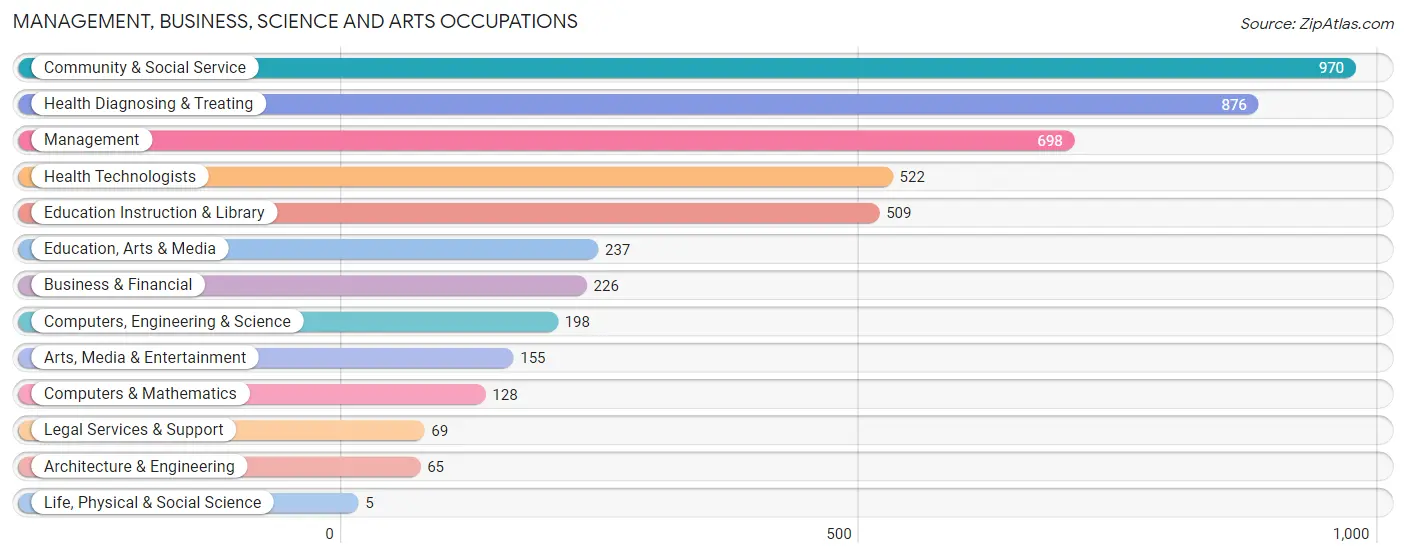
Management, Business, Science and Arts Occupations
The most common Management, Business, Science and Arts occupations in Alliance are Community & Social Service (970 | 9.7%), Health Diagnosing & Treating (876 | 8.8%), Management (698 | 7.0%), Health Technologists (522 | 5.2%), and Education Instruction & Library (509 | 5.1%).
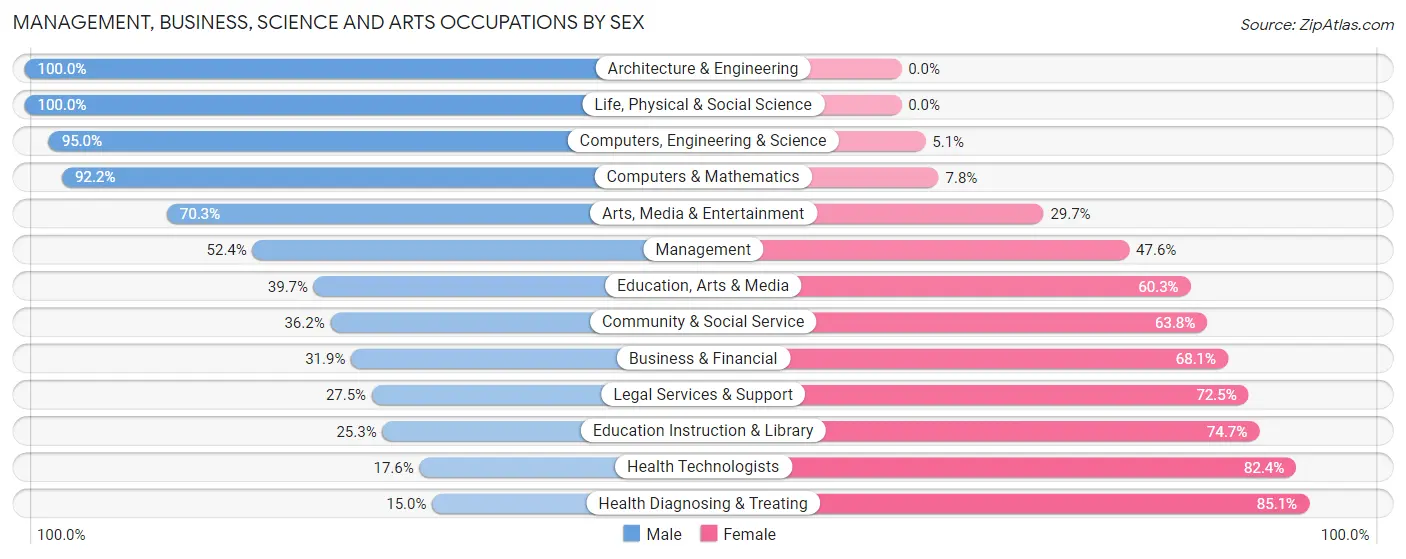
Management, Business, Science and Arts Occupations by Sex
Within the Management, Business, Science and Arts occupations in Alliance, the most male-oriented occupations are Architecture & Engineering (100.0%), Life, Physical & Social Science (100.0%), and Computers, Engineering & Science (95.0%), while the most female-oriented occupations are Health Diagnosing & Treating (85.1%), Health Technologists (82.4%), and Education Instruction & Library (74.7%).
| Occupation | Male | Female |
| Management | 366 (52.4%) | 332 (47.6%) |
| Business & Financial | 72 (31.9%) | 154 (68.1%) |
| Computers, Engineering & Science | 188 (95.0%) | 10 (5.1%) |
| Computers & Mathematics | 118 (92.2%) | 10 (7.8%) |
| Architecture & Engineering | 65 (100.0%) | 0 (0.0%) |
| Life, Physical & Social Science | 5 (100.0%) | 0 (0.0%) |
| Community & Social Service | 351 (36.2%) | 619 (63.8%) |
| Education, Arts & Media | 94 (39.7%) | 143 (60.3%) |
| Legal Services & Support | 19 (27.5%) | 50 (72.5%) |
| Education Instruction & Library | 129 (25.3%) | 380 (74.7%) |
| Arts, Media & Entertainment | 109 (70.3%) | 46 (29.7%) |
| Health Diagnosing & Treating | 131 (14.9%) | 745 (85.1%) |
| Health Technologists | 92 (17.6%) | 430 (82.4%) |
| Total (Category) | 1,108 (37.3%) | 1,860 (62.7%) |
| Total (Overall) | 5,454 (54.6%) | 4,542 (45.4%) |
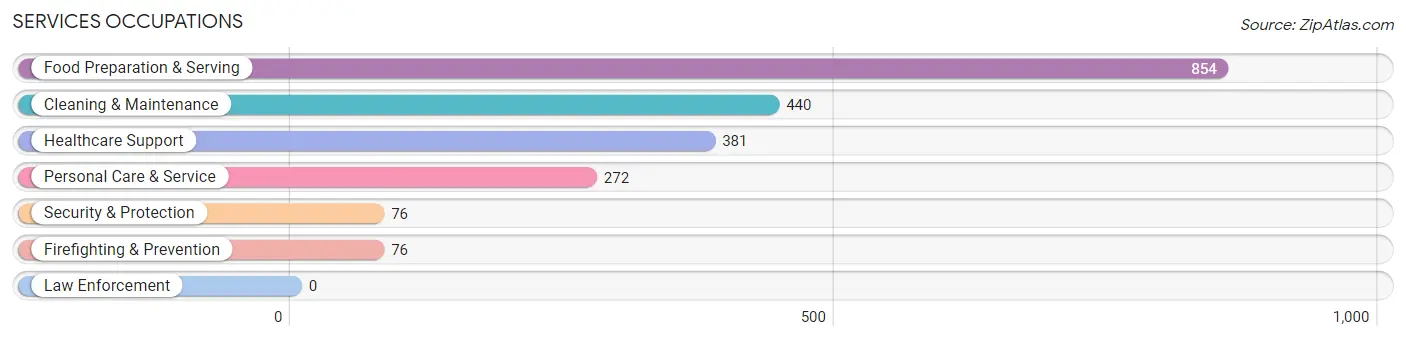
Services Occupations
The most common Services occupations in Alliance are Food Preparation & Serving (854 | 8.5%), Cleaning & Maintenance (440 | 4.4%), Healthcare Support (381 | 3.8%), Personal Care & Service (272 | 2.7%), and Security & Protection (76 | 0.8%).
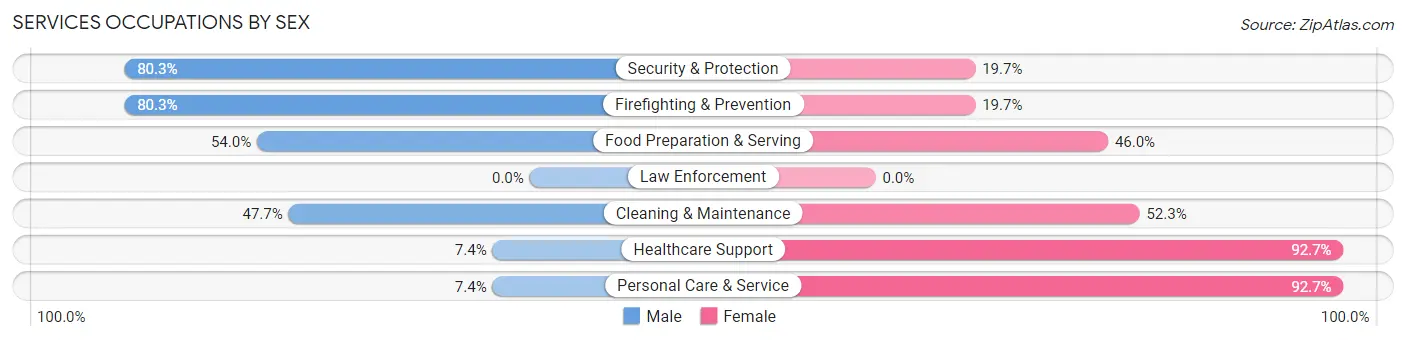
Services Occupations by Sex
Within the Services occupations in Alliance, the most male-oriented occupations are Security & Protection (80.3%), Firefighting & Prevention (80.3%), and Food Preparation & Serving (54.0%), while the most female-oriented occupations are Healthcare Support (92.6%), Personal Care & Service (92.6%), and Cleaning & Maintenance (52.3%).
| Occupation | Male | Female |
| Healthcare Support | 28 (7.3%) | 353 (92.6%) |
| Security & Protection | 61 (80.3%) | 15 (19.7%) |
| Firefighting & Prevention | 61 (80.3%) | 15 (19.7%) |
| Law Enforcement | 0 (0.0%) | 0 (0.0%) |
| Food Preparation & Serving | 461 (54.0%) | 393 (46.0%) |
| Cleaning & Maintenance | 210 (47.7%) | 230 (52.3%) |
| Personal Care & Service | 20 (7.3%) | 252 (92.6%) |
| Total (Category) | 780 (38.6%) | 1,243 (61.4%) |
| Total (Overall) | 5,454 (54.6%) | 4,542 (45.4%) |
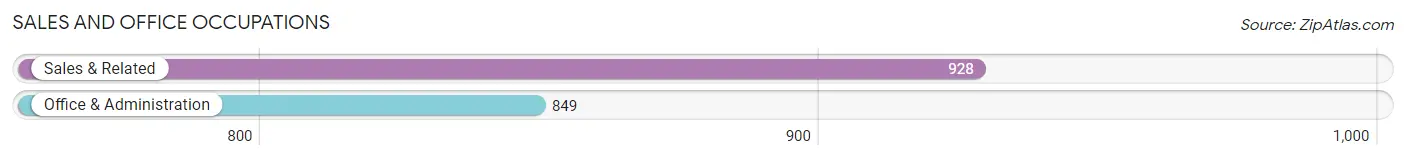
Sales and Office Occupations
The most common Sales and Office occupations in Alliance are Sales & Related (928 | 9.3%), and Office & Administration (849 | 8.5%).
Sales and Office Occupations by Sex
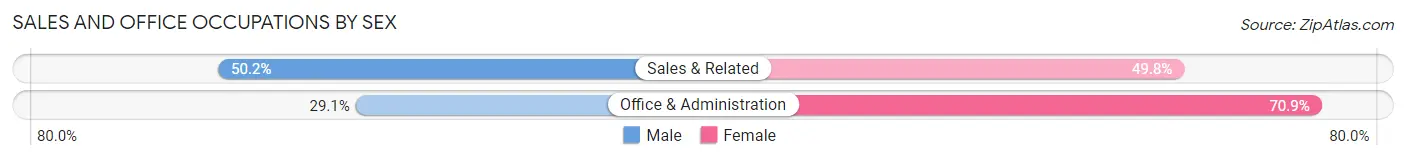
| Occupation | Male | Female |
| Sales & Related | 466 (50.2%) | 462 (49.8%) |
| Office & Administration | 247 (29.1%) | 602 (70.9%) |
| Total (Category) | 713 (40.1%) | 1,064 (59.9%) |
| Total (Overall) | 5,454 (54.6%) | 4,542 (45.4%) |
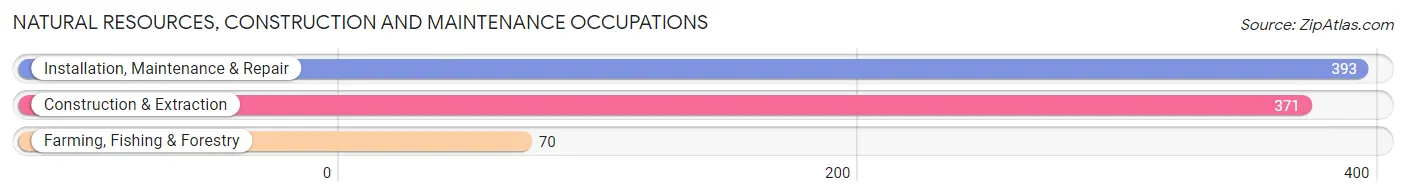
Natural Resources, Construction and Maintenance Occupations
The most common Natural Resources, Construction and Maintenance occupations in Alliance are Installation, Maintenance & Repair (393 | 3.9%), Construction & Extraction (371 | 3.7%), and Farming, Fishing & Forestry (70 | 0.7%).
Natural Resources, Construction and Maintenance Occupations by Sex
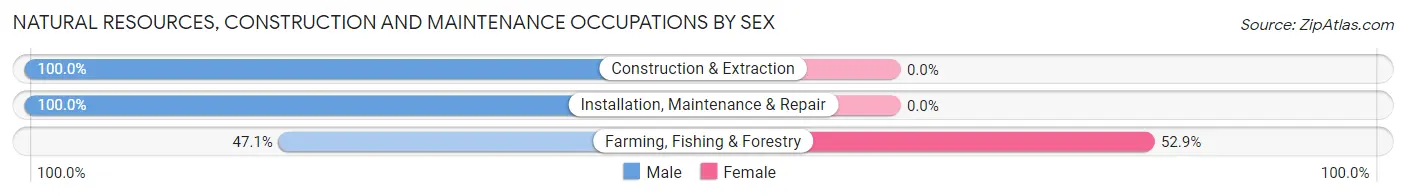
| Occupation | Male | Female |
| Farming, Fishing & Forestry | 33 (47.1%) | 37 (52.9%) |
| Construction & Extraction | 371 (100.0%) | 0 (0.0%) |
| Installation, Maintenance & Repair | 393 (100.0%) | 0 (0.0%) |
| Total (Category) | 797 (95.6%) | 37 (4.4%) |
| Total (Overall) | 5,454 (54.6%) | 4,542 (45.4%) |
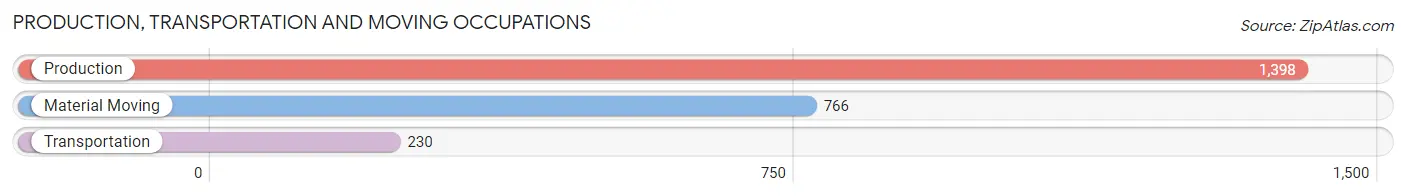
Production, Transportation and Moving Occupations
The most common Production, Transportation and Moving occupations in Alliance are Production (1,398 | 14.0%), Material Moving (766 | 7.7%), and Transportation (230 | 2.3%).
Production, Transportation and Moving Occupations by Sex
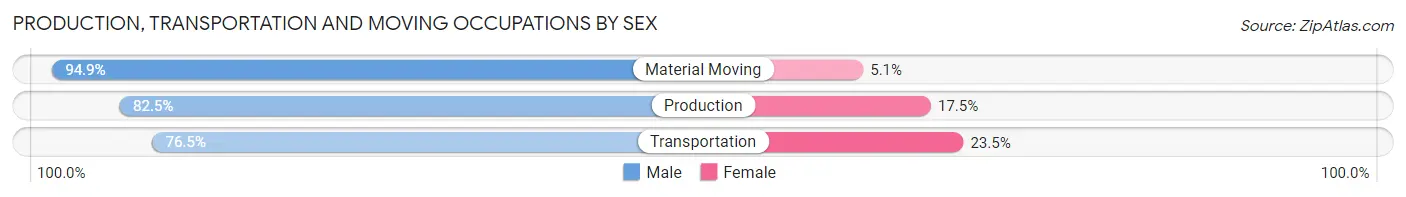
| Occupation | Male | Female |
| Production | 1,153 (82.5%) | 245 (17.5%) |
| Transportation | 176 (76.5%) | 54 (23.5%) |
| Material Moving | 727 (94.9%) | 39 (5.1%) |
| Total (Category) | 2,056 (85.9%) | 338 (14.1%) |
| Total (Overall) | 5,454 (54.6%) | 4,542 (45.4%) |
Employment Industries by Sex in Alliance
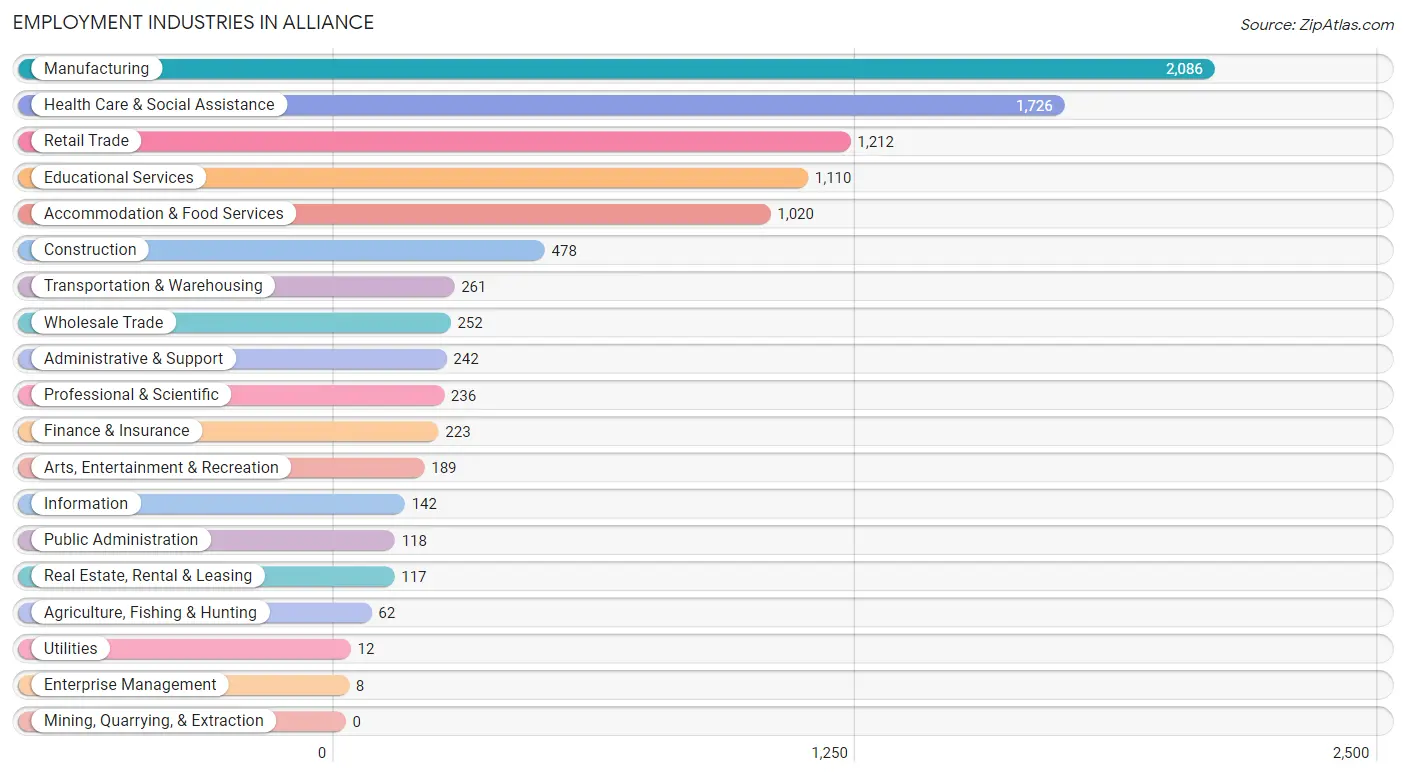
Employment Industries in Alliance
The major employment industries in Alliance include Manufacturing (2,086 | 20.9%), Health Care & Social Assistance (1,726 | 17.3%), Retail Trade (1,212 | 12.1%), Educational Services (1,110 | 11.1%), and Accommodation & Food Services (1,020 | 10.2%).
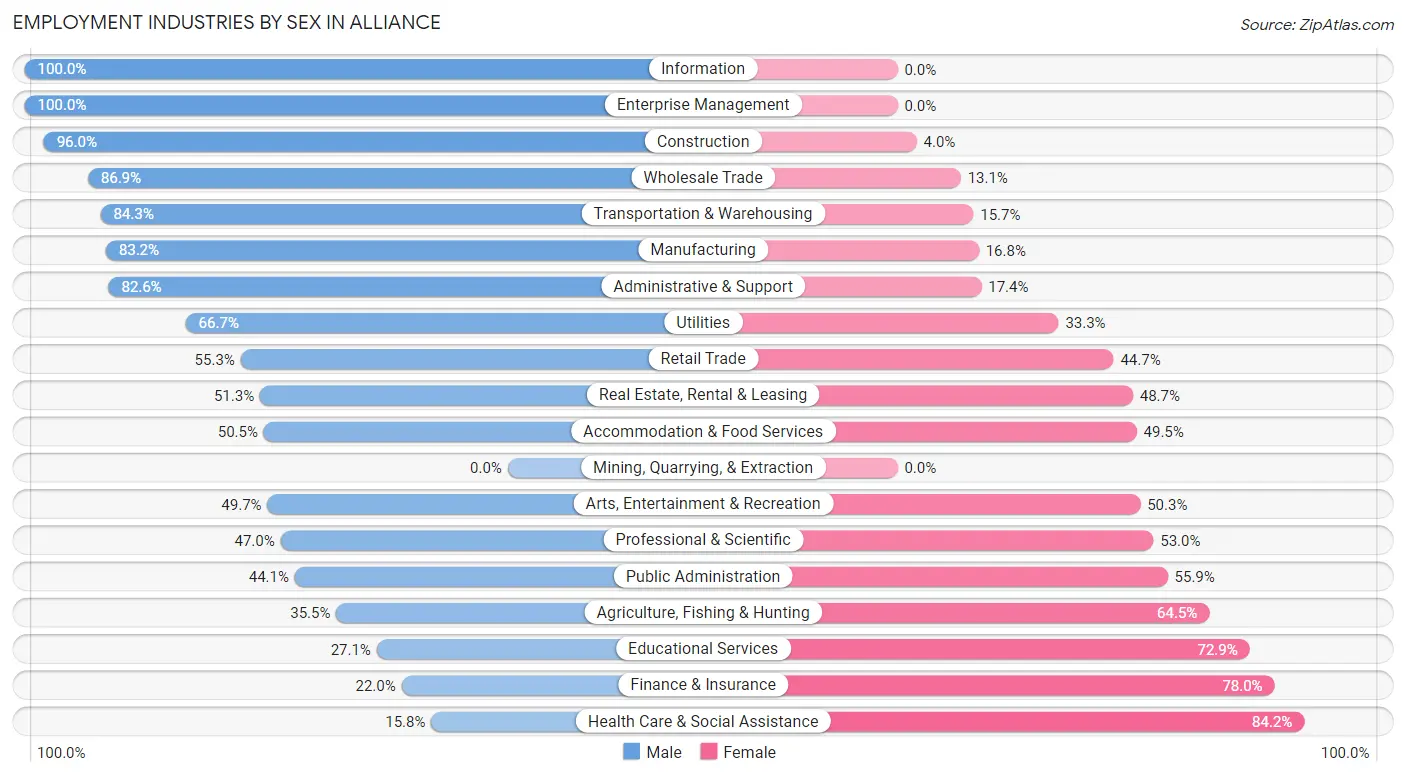
Employment Industries by Sex in Alliance
The Alliance industries that see more men than women are Information (100.0%), Enterprise Management (100.0%), and Construction (96.0%), whereas the industries that tend to have a higher number of women are Health Care & Social Assistance (84.2%), Finance & Insurance (78.0%), and Educational Services (72.9%).
| Industry | Male | Female |
| Agriculture, Fishing & Hunting | 22 (35.5%) | 40 (64.5%) |
| Mining, Quarrying, & Extraction | 0 (0.0%) | 0 (0.0%) |
| Construction | 459 (96.0%) | 19 (4.0%) |
| Manufacturing | 1,735 (83.2%) | 351 (16.8%) |
| Wholesale Trade | 219 (86.9%) | 33 (13.1%) |
| Retail Trade | 670 (55.3%) | 542 (44.7%) |
| Transportation & Warehousing | 220 (84.3%) | 41 (15.7%) |
| Utilities | 8 (66.7%) | 4 (33.3%) |
| Information | 142 (100.0%) | 0 (0.0%) |
| Finance & Insurance | 49 (22.0%) | 174 (78.0%) |
| Real Estate, Rental & Leasing | 60 (51.3%) | 57 (48.7%) |
| Professional & Scientific | 111 (47.0%) | 125 (53.0%) |
| Enterprise Management | 8 (100.0%) | 0 (0.0%) |
| Administrative & Support | 200 (82.6%) | 42 (17.4%) |
| Educational Services | 301 (27.1%) | 809 (72.9%) |
| Health Care & Social Assistance | 273 (15.8%) | 1,453 (84.2%) |
| Arts, Entertainment & Recreation | 94 (49.7%) | 95 (50.3%) |
| Accommodation & Food Services | 515 (50.5%) | 505 (49.5%) |
| Public Administration | 52 (44.1%) | 66 (55.9%) |
| Total | 5,454 (54.6%) | 4,542 (45.4%) |
Education in Alliance
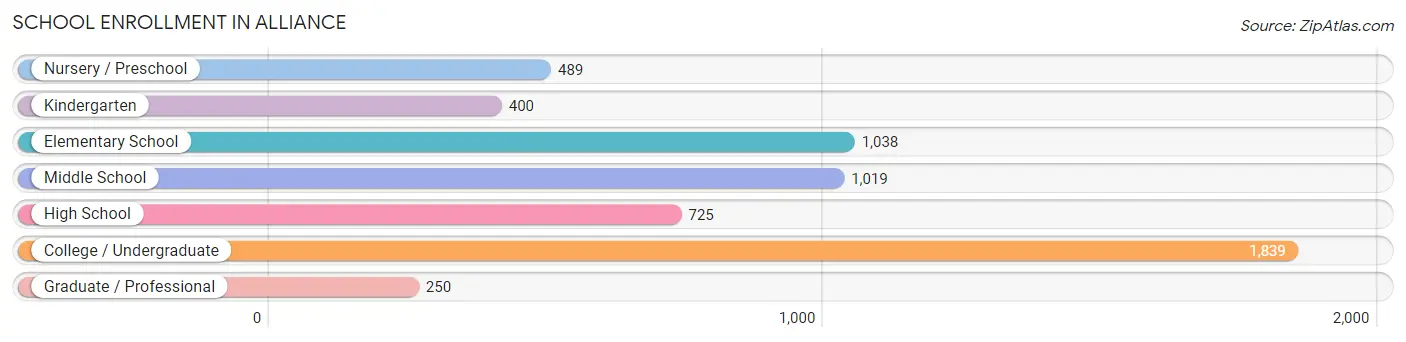
School Enrollment in Alliance
The most common levels of schooling among the 5,760 students in Alliance are college / undergraduate (1,839 | 31.9%), elementary school (1,038 | 18.0%), and middle school (1,019 | 17.7%).
| School Level | # Students | % Students |
| Nursery / Preschool | 489 | 8.5% |
| Kindergarten | 400 | 6.9% |
| Elementary School | 1,038 | 18.0% |
| Middle School | 1,019 | 17.7% |
| High School | 725 | 12.6% |
| College / Undergraduate | 1,839 | 31.9% |
| Graduate / Professional | 250 | 4.3% |
| Total | 5,760 | 100.0% |
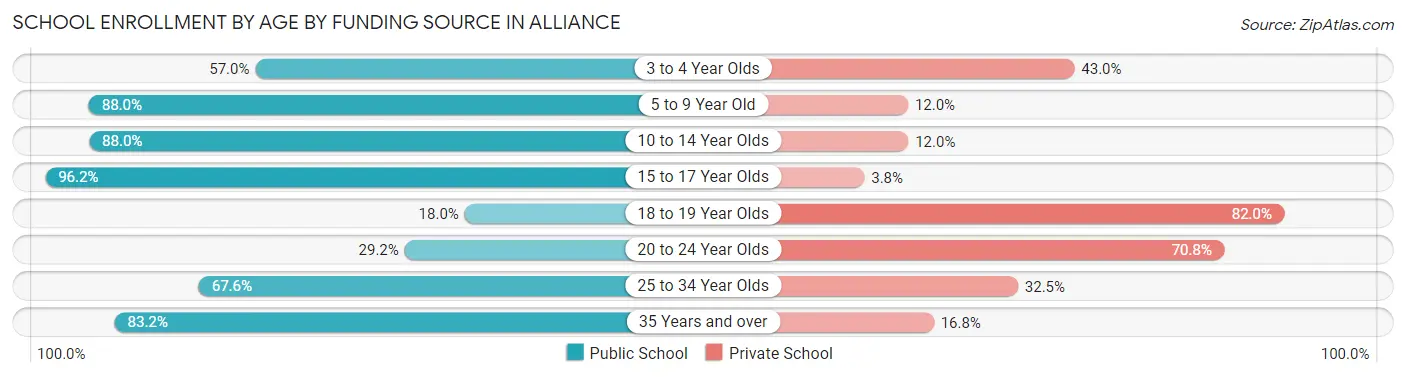
School Enrollment by Age by Funding Source in Alliance
Out of a total of 5,760 students who are enrolled in schools in Alliance, 2,068 (35.9%) attend a private institution, while the remaining 3,692 (64.1%) are enrolled in public schools. The age group of 18 to 19 year olds has the highest likelihood of being enrolled in private schools, with 823 (82.0% in the age bracket) enrolled. Conversely, the age group of 15 to 17 year olds has the lowest likelihood of being enrolled in a private school, with 526 (96.2% in the age bracket) attending a public institution.
| Age Bracket | Public School | Private School |
| 3 to 4 Year Olds | 219 (57.0%) | 165 (43.0%) |
| 5 to 9 Year Old | 1,317 (88.0%) | 179 (12.0%) |
| 10 to 14 Year Olds | 914 (88.0%) | 125 (12.0%) |
| 15 to 17 Year Olds | 526 (96.2%) | 21 (3.8%) |
| 18 to 19 Year Olds | 181 (18.0%) | 823 (82.0%) |
| 20 to 24 Year Olds | 275 (29.2%) | 666 (70.8%) |
| 25 to 34 Year Olds | 127 (67.5%) | 61 (32.5%) |
| 35 Years and over | 134 (83.2%) | 27 (16.8%) |
| Total | 3,692 (64.1%) | 2,068 (35.9%) |
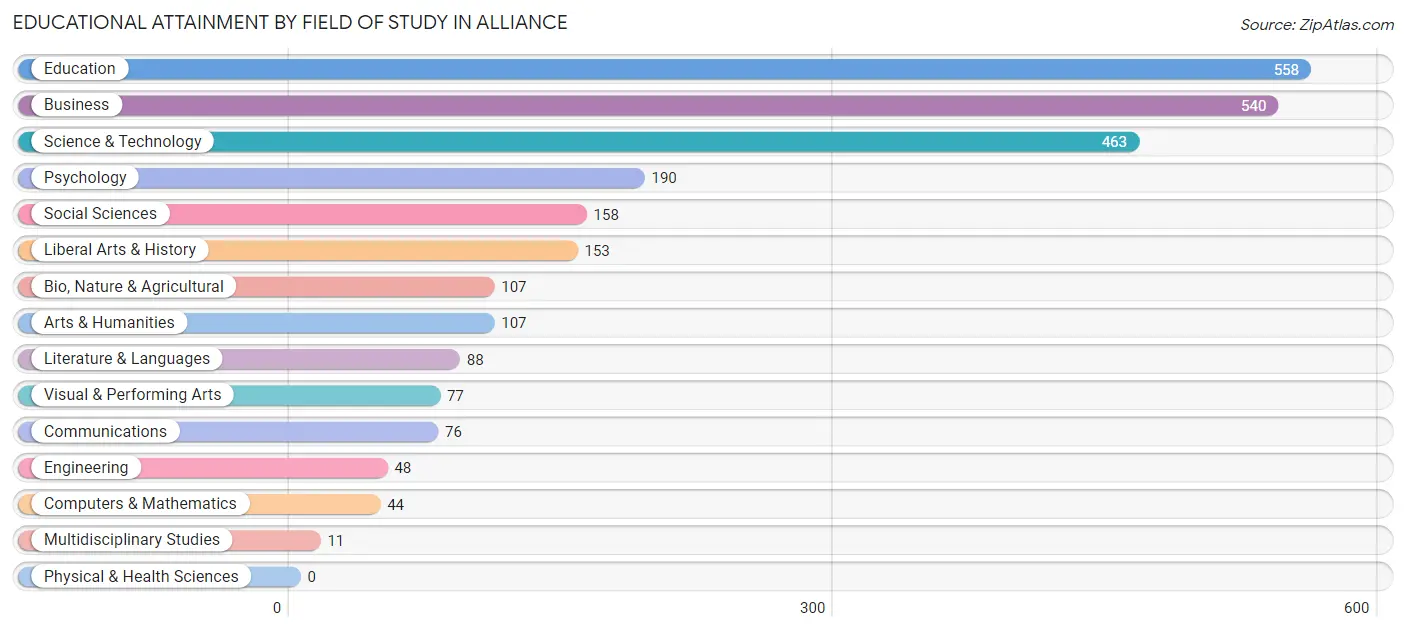
Educational Attainment by Field of Study in Alliance
Education (558 | 21.3%), business (540 | 20.6%), science & technology (463 | 17.7%), psychology (190 | 7.2%), and social sciences (158 | 6.0%) are the most common fields of study among 2,620 individuals in Alliance who have obtained a bachelor's degree or higher.
| Field of Study | # Graduates | % Graduates |
| Computers & Mathematics | 44 | 1.7% |
| Bio, Nature & Agricultural | 107 | 4.1% |
| Physical & Health Sciences | 0 | 0.0% |
| Psychology | 190 | 7.2% |
| Social Sciences | 158 | 6.0% |
| Engineering | 48 | 1.8% |
| Multidisciplinary Studies | 11 | 0.4% |
| Science & Technology | 463 | 17.7% |
| Business | 540 | 20.6% |
| Education | 558 | 21.3% |
| Literature & Languages | 88 | 3.4% |
| Liberal Arts & History | 153 | 5.8% |
| Visual & Performing Arts | 77 | 2.9% |
| Communications | 76 | 2.9% |
| Arts & Humanities | 107 | 4.1% |
| Total | 2,620 | 100.0% |
Transportation & Commute in Alliance
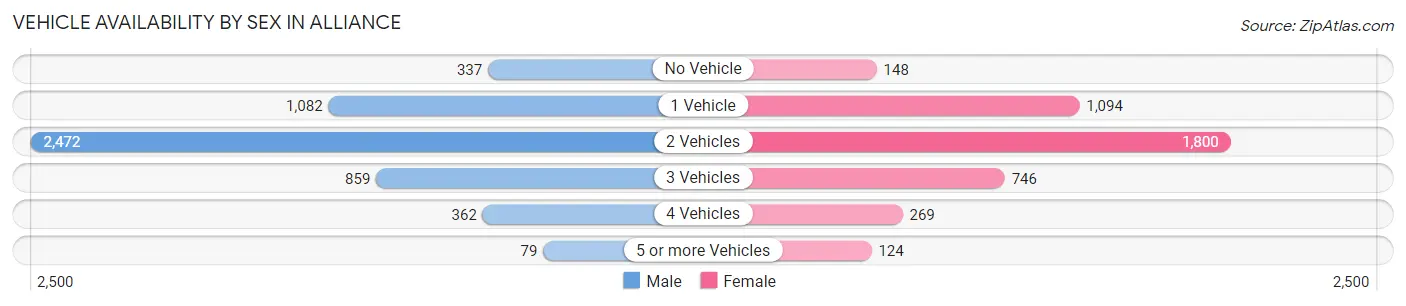
Vehicle Availability by Sex in Alliance
The most prevalent vehicle ownership categories in Alliance are males with 2 vehicles (2,472, accounting for 47.6%) and females with 2 vehicles (1,800, making up 59.1%).
| Vehicles Available | Male | Female |
| No Vehicle | 337 (6.5%) | 148 (3.5%) |
| 1 Vehicle | 1,082 (20.8%) | 1,094 (26.2%) |
| 2 Vehicles | 2,472 (47.6%) | 1,800 (43.0%) |
| 3 Vehicles | 859 (16.6%) | 746 (17.8%) |
| 4 Vehicles | 362 (7.0%) | 269 (6.4%) |
| 5 or more Vehicles | 79 (1.5%) | 124 (3.0%) |
| Total | 5,191 (100.0%) | 4,181 (100.0%) |
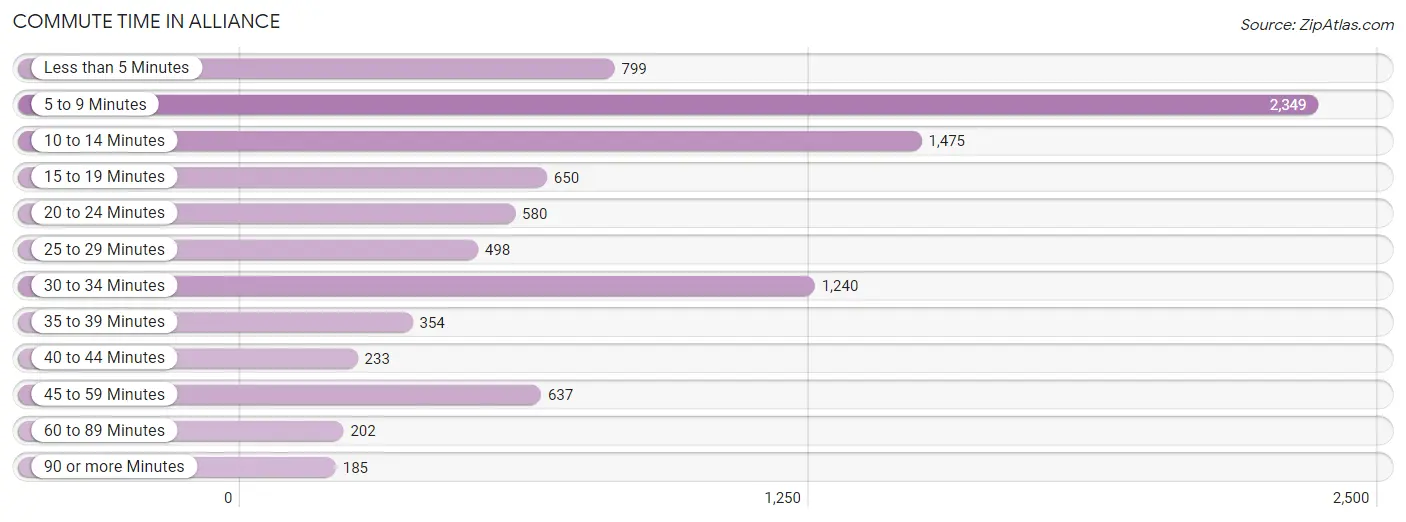
Commute Time in Alliance
The most frequently occuring commute durations in Alliance are 5 to 9 minutes (2,349 commuters, 25.5%), 10 to 14 minutes (1,475 commuters, 16.0%), and 30 to 34 minutes (1,240 commuters, 13.5%).
| Commute Time | # Commuters | % Commuters |
| Less than 5 Minutes | 799 | 8.7% |
| 5 to 9 Minutes | 2,349 | 25.5% |
| 10 to 14 Minutes | 1,475 | 16.0% |
| 15 to 19 Minutes | 650 | 7.1% |
| 20 to 24 Minutes | 580 | 6.3% |
| 25 to 29 Minutes | 498 | 5.4% |
| 30 to 34 Minutes | 1,240 | 13.5% |
| 35 to 39 Minutes | 354 | 3.8% |
| 40 to 44 Minutes | 233 | 2.5% |
| 45 to 59 Minutes | 637 | 6.9% |
| 60 to 89 Minutes | 202 | 2.2% |
| 90 or more Minutes | 185 | 2.0% |
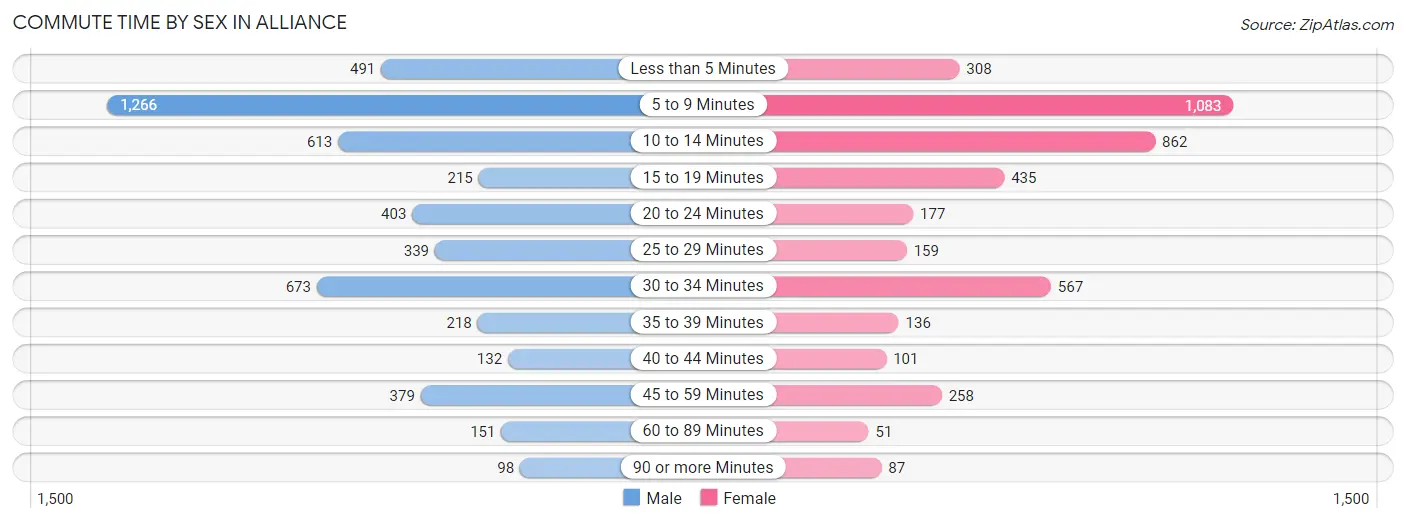
Commute Time by Sex in Alliance
The most common commute times in Alliance are 5 to 9 minutes (1,266 commuters, 25.4%) for males and 5 to 9 minutes (1,083 commuters, 25.6%) for females.
| Commute Time | Male | Female |
| Less than 5 Minutes | 491 (9.9%) | 308 (7.3%) |
| 5 to 9 Minutes | 1,266 (25.4%) | 1,083 (25.6%) |
| 10 to 14 Minutes | 613 (12.3%) | 862 (20.4%) |
| 15 to 19 Minutes | 215 (4.3%) | 435 (10.3%) |
| 20 to 24 Minutes | 403 (8.1%) | 177 (4.2%) |
| 25 to 29 Minutes | 339 (6.8%) | 159 (3.8%) |
| 30 to 34 Minutes | 673 (13.5%) | 567 (13.4%) |
| 35 to 39 Minutes | 218 (4.4%) | 136 (3.2%) |
| 40 to 44 Minutes | 132 (2.6%) | 101 (2.4%) |
| 45 to 59 Minutes | 379 (7.6%) | 258 (6.1%) |
| 60 to 89 Minutes | 151 (3.0%) | 51 (1.2%) |
| 90 or more Minutes | 98 (2.0%) | 87 (2.1%) |
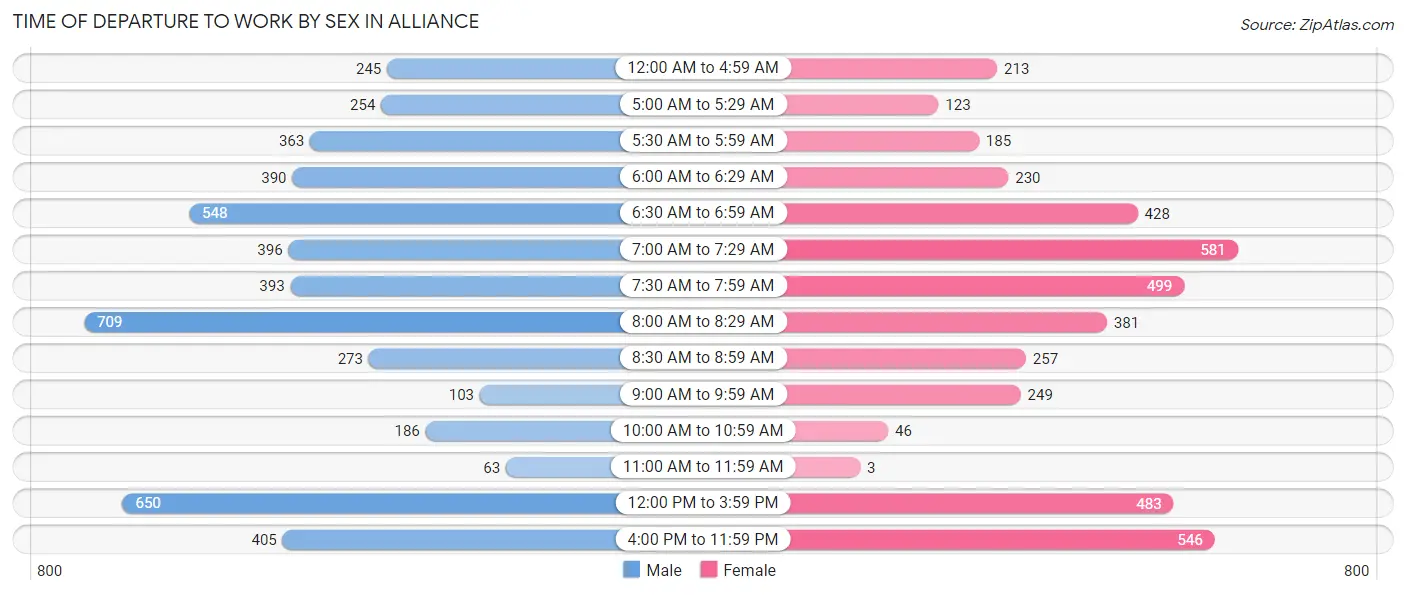
Time of Departure to Work by Sex in Alliance
The most frequent times of departure to work in Alliance are 8:00 AM to 8:29 AM (709, 14.2%) for males and 7:00 AM to 7:29 AM (581, 13.8%) for females.
| Time of Departure | Male | Female |
| 12:00 AM to 4:59 AM | 245 (4.9%) | 213 (5.0%) |
| 5:00 AM to 5:29 AM | 254 (5.1%) | 123 (2.9%) |
| 5:30 AM to 5:59 AM | 363 (7.3%) | 185 (4.4%) |
| 6:00 AM to 6:29 AM | 390 (7.8%) | 230 (5.4%) |
| 6:30 AM to 6:59 AM | 548 (11.0%) | 428 (10.1%) |
| 7:00 AM to 7:29 AM | 396 (8.0%) | 581 (13.8%) |
| 7:30 AM to 7:59 AM | 393 (7.9%) | 499 (11.8%) |
| 8:00 AM to 8:29 AM | 709 (14.2%) | 381 (9.0%) |
| 8:30 AM to 8:59 AM | 273 (5.5%) | 257 (6.1%) |
| 9:00 AM to 9:59 AM | 103 (2.1%) | 249 (5.9%) |
| 10:00 AM to 10:59 AM | 186 (3.7%) | 46 (1.1%) |
| 11:00 AM to 11:59 AM | 63 (1.3%) | 3 (0.1%) |
| 12:00 PM to 3:59 PM | 650 (13.1%) | 483 (11.4%) |
| 4:00 PM to 11:59 PM | 405 (8.1%) | 546 (12.9%) |
| Total | 4,978 (100.0%) | 4,224 (100.0%) |
Housing Occupancy in Alliance
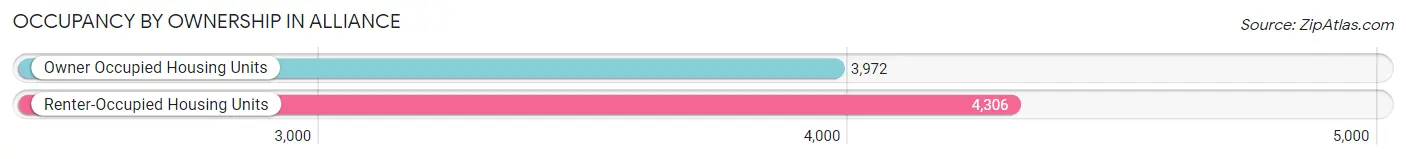
Occupancy by Ownership in Alliance
Of the total 8,278 dwellings in Alliance, owner-occupied units account for 3,972 (48.0%), while renter-occupied units make up 4,306 (52.0%).
| Occupancy | # Housing Units | % Housing Units |
| Owner Occupied Housing Units | 3,972 | 48.0% |
| Renter-Occupied Housing Units | 4,306 | 52.0% |
| Total Occupied Housing Units | 8,278 | 100.0% |
Occupancy by Household Size in Alliance
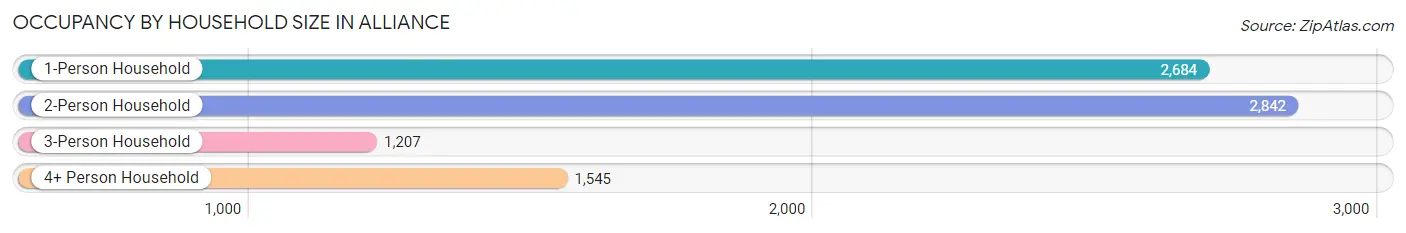
| Household Size | # Housing Units | % Housing Units |
| 1-Person Household | 2,684 | 32.4% |
| 2-Person Household | 2,842 | 34.3% |
| 3-Person Household | 1,207 | 14.6% |
| 4+ Person Household | 1,545 | 18.7% |
| Total Housing Units | 8,278 | 100.0% |
Occupancy by Ownership by Household Size in Alliance
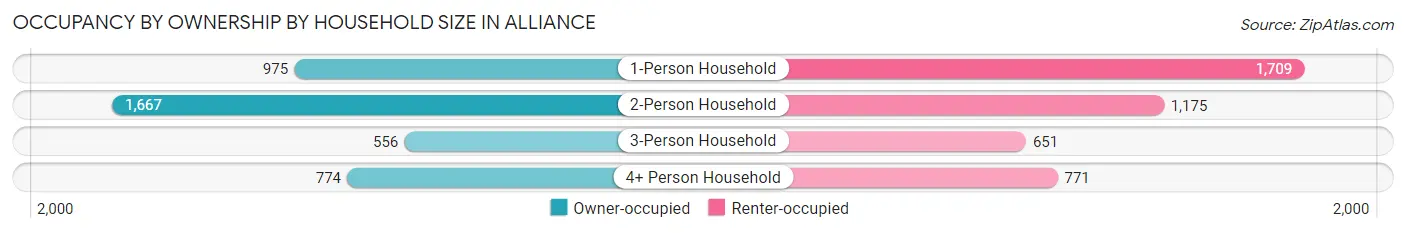
| Household Size | Owner-occupied | Renter-occupied |
| 1-Person Household | 975 (36.3%) | 1,709 (63.7%) |
| 2-Person Household | 1,667 (58.7%) | 1,175 (41.3%) |
| 3-Person Household | 556 (46.1%) | 651 (53.9%) |
| 4+ Person Household | 774 (50.1%) | 771 (49.9%) |
| Total Housing Units | 3,972 (48.0%) | 4,306 (52.0%) |
Occupancy by Educational Attainment in Alliance
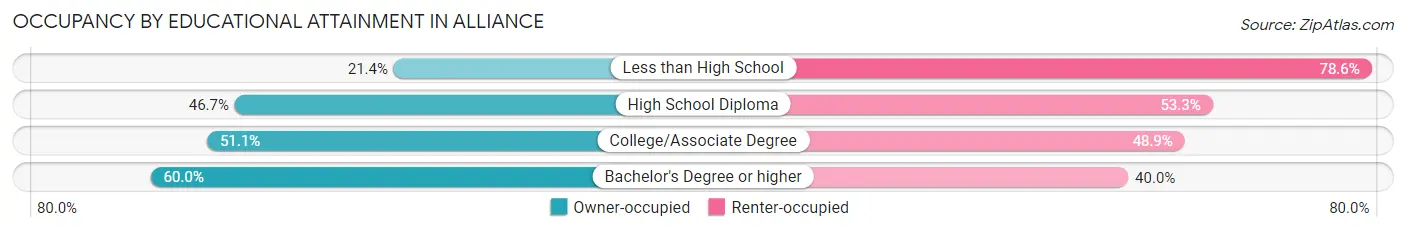
| Household Size | Owner-occupied | Renter-occupied |
| Less than High School | 196 (21.4%) | 718 (78.6%) |
| High School Diploma | 1,607 (46.7%) | 1,837 (53.3%) |
| College/Associate Degree | 1,050 (51.1%) | 1,006 (48.9%) |
| Bachelor's Degree or higher | 1,119 (60.0%) | 745 (40.0%) |
Occupancy by Age of Householder in Alliance
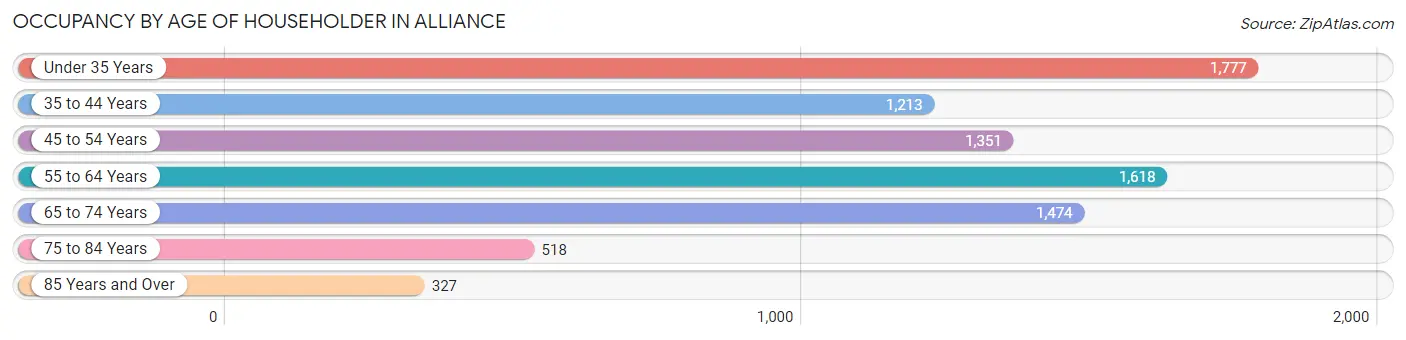
| Age Bracket | # Households | % Households |
| Under 35 Years | 1,777 | 21.5% |
| 35 to 44 Years | 1,213 | 14.6% |
| 45 to 54 Years | 1,351 | 16.3% |
| 55 to 64 Years | 1,618 | 19.6% |
| 65 to 74 Years | 1,474 | 17.8% |
| 75 to 84 Years | 518 | 6.3% |
| 85 Years and Over | 327 | 4.0% |
| Total | 8,278 | 100.0% |
Housing Finances in Alliance
Median Income by Occupancy in Alliance
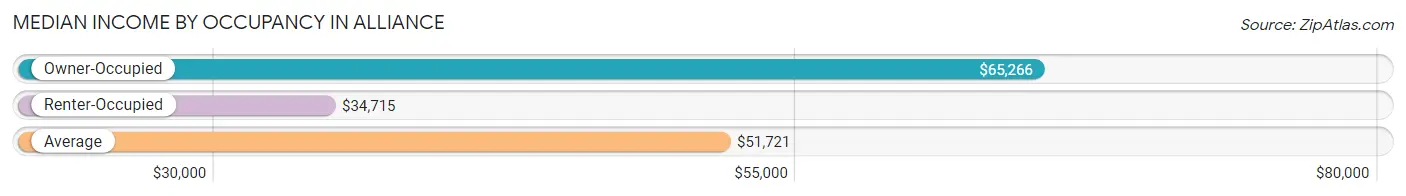
| Occupancy Type | # Households | Median Income |
| Owner-Occupied | 3,972 (48.0%) | $65,266 |
| Renter-Occupied | 4,306 (52.0%) | $34,715 |
| Average | 8,278 (100.0%) | $51,721 |
Occupancy by Householder Income Bracket in Alliance
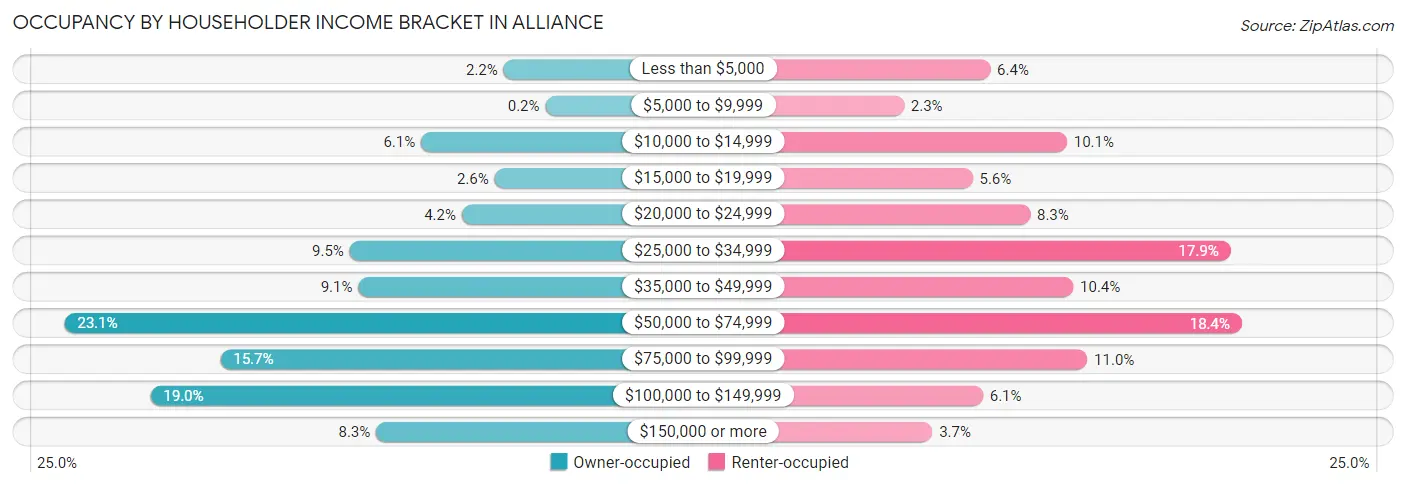
| Income Bracket | Owner-occupied | Renter-occupied |
| Less than $5,000 | 87 (2.2%) | 276 (6.4%) |
| $5,000 to $9,999 | 8 (0.2%) | 99 (2.3%) |
| $10,000 to $14,999 | 243 (6.1%) | 433 (10.1%) |
| $15,000 to $19,999 | 104 (2.6%) | 240 (5.6%) |
| $20,000 to $24,999 | 166 (4.2%) | 358 (8.3%) |
| $25,000 to $34,999 | 378 (9.5%) | 769 (17.9%) |
| $35,000 to $49,999 | 362 (9.1%) | 446 (10.4%) |
| $50,000 to $74,999 | 918 (23.1%) | 792 (18.4%) |
| $75,000 to $99,999 | 623 (15.7%) | 475 (11.0%) |
| $100,000 to $149,999 | 755 (19.0%) | 261 (6.1%) |
| $150,000 or more | 328 (8.3%) | 157 (3.6%) |
| Total | 3,972 (100.0%) | 4,306 (100.0%) |
Monthly Housing Cost Tiers in Alliance
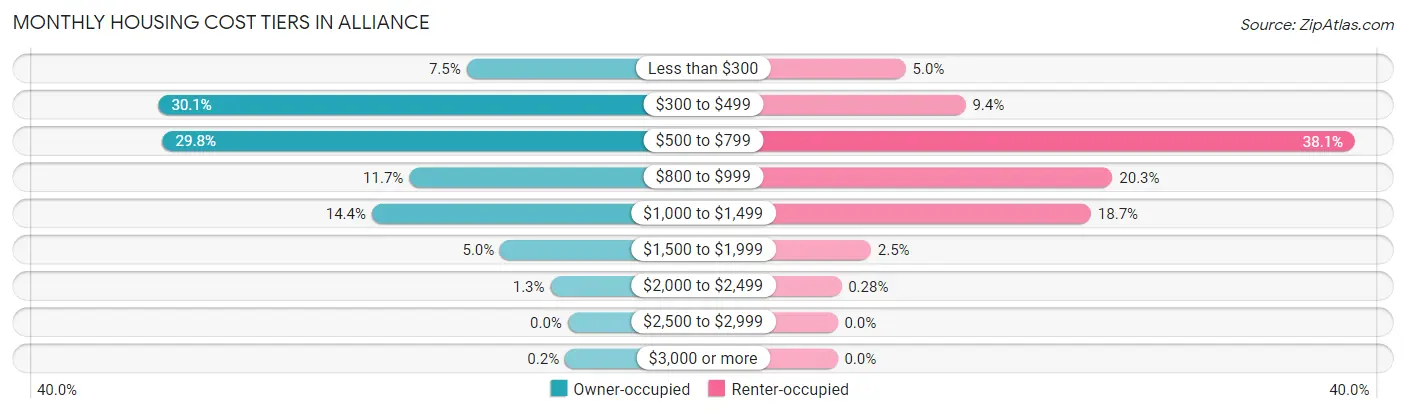
| Monthly Cost | Owner-occupied | Renter-occupied |
| Less than $300 | 296 (7.4%) | 216 (5.0%) |
| $300 to $499 | 1,197 (30.1%) | 406 (9.4%) |
| $500 to $799 | 1,185 (29.8%) | 1,641 (38.1%) |
| $800 to $999 | 464 (11.7%) | 872 (20.3%) |
| $1,000 to $1,499 | 573 (14.4%) | 804 (18.7%) |
| $1,500 to $1,999 | 198 (5.0%) | 106 (2.5%) |
| $2,000 to $2,499 | 51 (1.3%) | 12 (0.3%) |
| $2,500 to $2,999 | 0 (0.0%) | 0 (0.0%) |
| $3,000 or more | 8 (0.2%) | 0 (0.0%) |
| Total | 3,972 (100.0%) | 4,306 (100.0%) |
Physical Housing Characteristics in Alliance
Housing Structures in Alliance
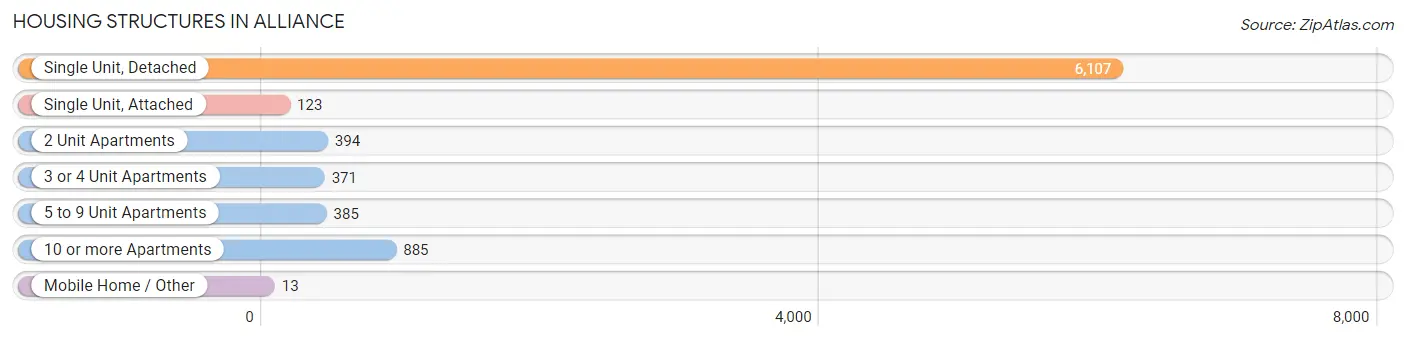
| Structure Type | # Housing Units | % Housing Units |
| Single Unit, Detached | 6,107 | 73.8% |
| Single Unit, Attached | 123 | 1.5% |
| 2 Unit Apartments | 394 | 4.8% |
| 3 or 4 Unit Apartments | 371 | 4.5% |
| 5 to 9 Unit Apartments | 385 | 4.6% |
| 10 or more Apartments | 885 | 10.7% |
| Mobile Home / Other | 13 | 0.2% |
| Total | 8,278 | 100.0% |
Housing Structures by Occupancy in Alliance
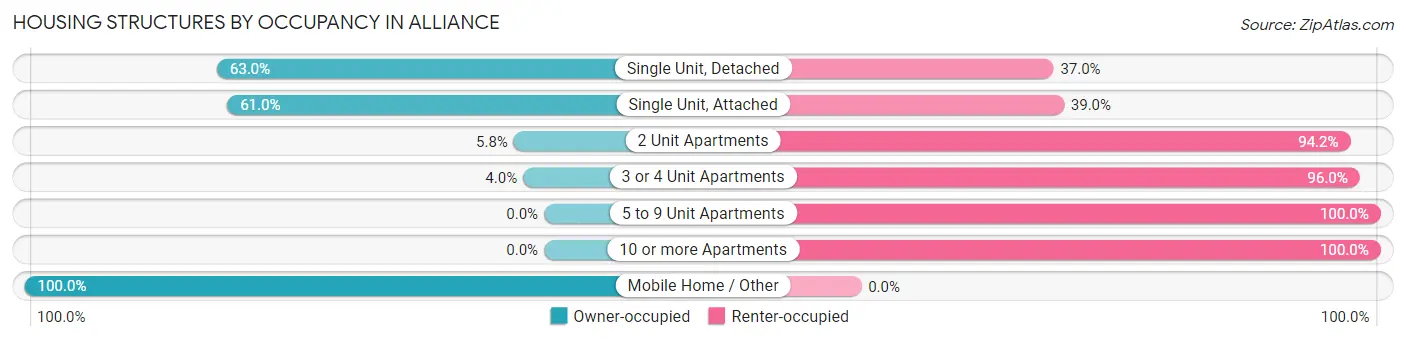
| Structure Type | Owner-occupied | Renter-occupied |
| Single Unit, Detached | 3,846 (63.0%) | 2,261 (37.0%) |
| Single Unit, Attached | 75 (61.0%) | 48 (39.0%) |
| 2 Unit Apartments | 23 (5.8%) | 371 (94.2%) |
| 3 or 4 Unit Apartments | 15 (4.0%) | 356 (96.0%) |
| 5 to 9 Unit Apartments | 0 (0.0%) | 385 (100.0%) |
| 10 or more Apartments | 0 (0.0%) | 885 (100.0%) |
| Mobile Home / Other | 13 (100.0%) | 0 (0.0%) |
| Total | 3,972 (48.0%) | 4,306 (52.0%) |
Housing Structures by Number of Rooms in Alliance
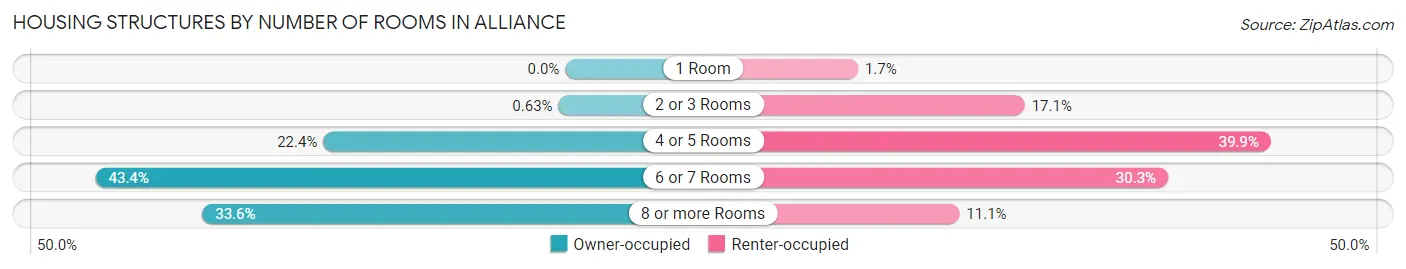
| Number of Rooms | Owner-occupied | Renter-occupied |
| 1 Room | 0 (0.0%) | 72 (1.7%) |
| 2 or 3 Rooms | 25 (0.6%) | 736 (17.1%) |
| 4 or 5 Rooms | 889 (22.4%) | 1,716 (39.9%) |
| 6 or 7 Rooms | 1,725 (43.4%) | 1,306 (30.3%) |
| 8 or more Rooms | 1,333 (33.6%) | 476 (11.1%) |
| Total | 3,972 (100.0%) | 4,306 (100.0%) |
Housing Structure by Heating Type in Alliance
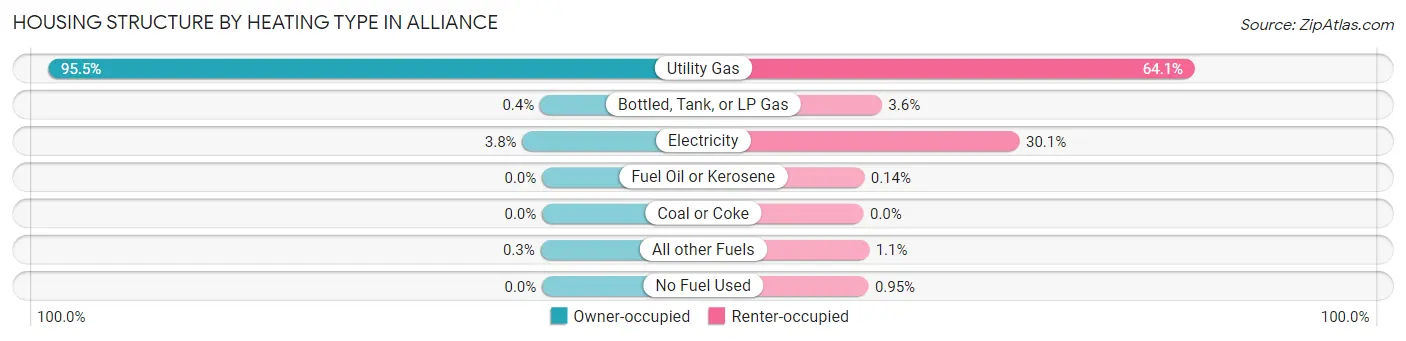
| Heating Type | Owner-occupied | Renter-occupied |
| Utility Gas | 3,793 (95.5%) | 2,761 (64.1%) |
| Bottled, Tank, or LP Gas | 16 (0.4%) | 153 (3.5%) |
| Electricity | 151 (3.8%) | 1,298 (30.1%) |
| Fuel Oil or Kerosene | 0 (0.0%) | 6 (0.1%) |
| Coal or Coke | 0 (0.0%) | 0 (0.0%) |
| All other Fuels | 12 (0.3%) | 47 (1.1%) |
| No Fuel Used | 0 (0.0%) | 41 (0.9%) |
| Total | 3,972 (100.0%) | 4,306 (100.0%) |
Household Vehicle Usage in Alliance
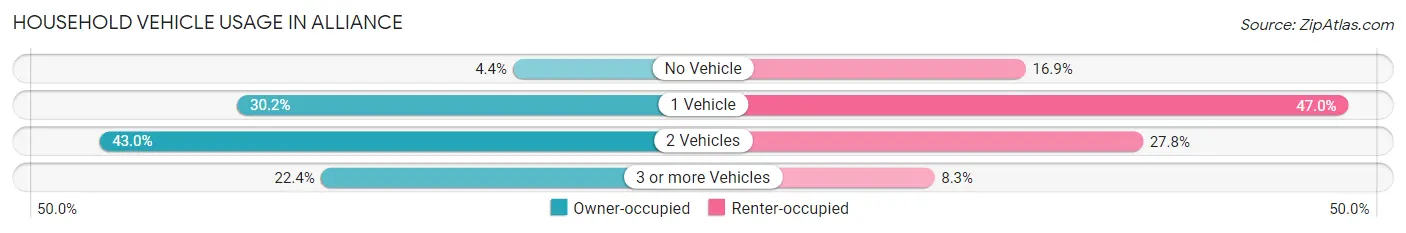
| Vehicles per Household | Owner-occupied | Renter-occupied |
| No Vehicle | 176 (4.4%) | 726 (16.9%) |
| 1 Vehicle | 1,198 (30.2%) | 2,024 (47.0%) |
| 2 Vehicles | 1,709 (43.0%) | 1,197 (27.8%) |
| 3 or more Vehicles | 889 (22.4%) | 359 (8.3%) |
| Total | 3,972 (100.0%) | 4,306 (100.0%) |
Real Estate & Mortgages in Alliance
Real Estate and Mortgage Overview in Alliance
| Characteristic | Without Mortgage | With Mortgage |
| Housing Units | 1,798 | 2,174 |
| Median Property Value | $109,900 | $106,800 |
| Median Household Income | $54,419 | $182 |
| Monthly Housing Costs | $407 | $8 |
| Real Estate Taxes | $1,088 | $42 |
Property Value by Mortgage Status in Alliance
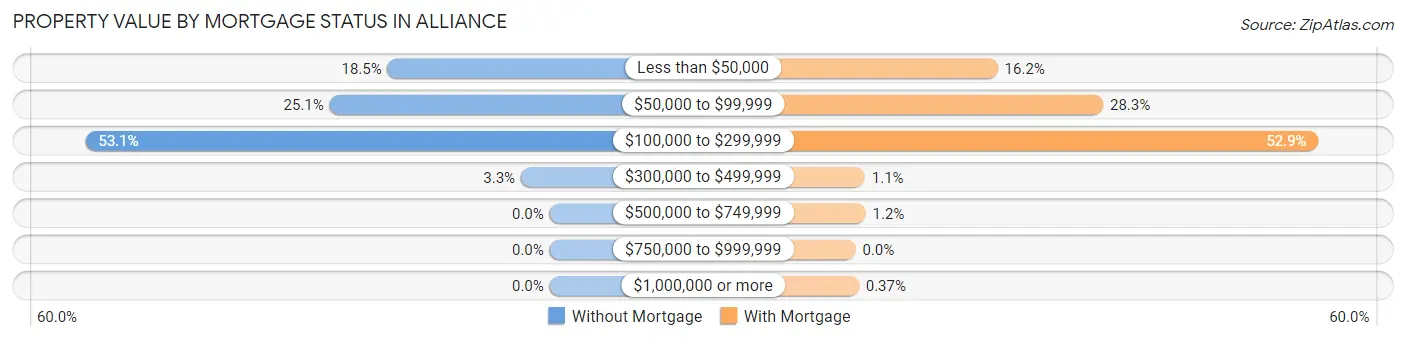
| Property Value | Without Mortgage | With Mortgage |
| Less than $50,000 | 333 (18.5%) | 353 (16.2%) |
| $50,000 to $99,999 | 452 (25.1%) | 615 (28.3%) |
| $100,000 to $299,999 | 954 (53.1%) | 1,150 (52.9%) |
| $300,000 to $499,999 | 59 (3.3%) | 23 (1.1%) |
| $500,000 to $749,999 | 0 (0.0%) | 25 (1.1%) |
| $750,000 to $999,999 | 0 (0.0%) | 0 (0.0%) |
| $1,000,000 or more | 0 (0.0%) | 8 (0.4%) |
| Total | 1,798 (100.0%) | 2,174 (100.0%) |
Household Income by Mortgage Status in Alliance
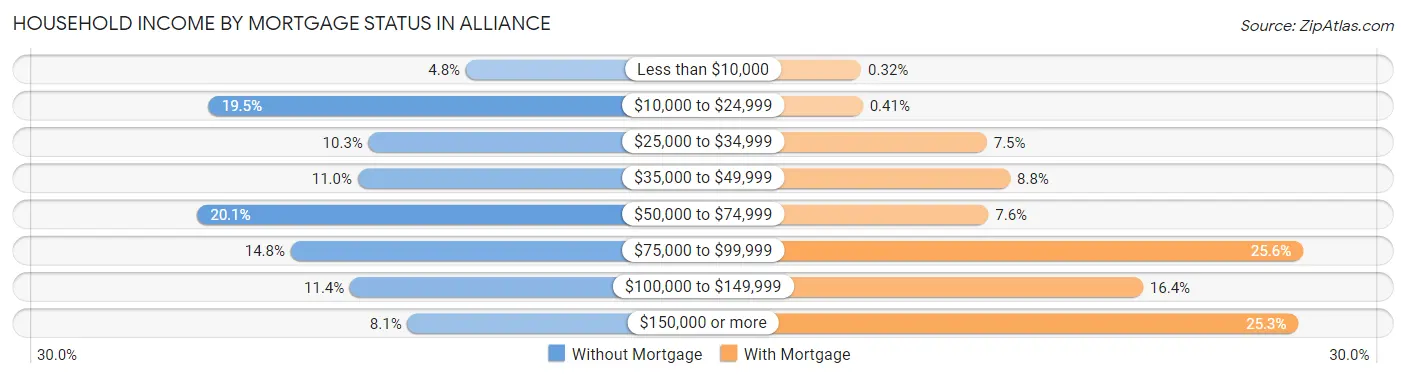
| Household Income | Without Mortgage | With Mortgage |
| Less than $10,000 | 86 (4.8%) | 7 (0.3%) |
| $10,000 to $24,999 | 350 (19.5%) | 9 (0.4%) |
| $25,000 to $34,999 | 186 (10.3%) | 163 (7.5%) |
| $35,000 to $49,999 | 197 (11.0%) | 192 (8.8%) |
| $50,000 to $74,999 | 362 (20.1%) | 165 (7.6%) |
| $75,000 to $99,999 | 266 (14.8%) | 556 (25.6%) |
| $100,000 to $149,999 | 205 (11.4%) | 357 (16.4%) |
| $150,000 or more | 146 (8.1%) | 550 (25.3%) |
| Total | 1,798 (100.0%) | 2,174 (100.0%) |
Property Value to Household Income Ratio in Alliance
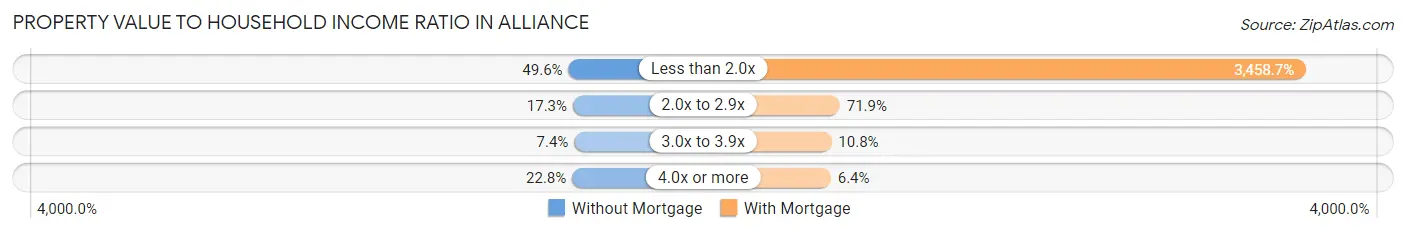
| Value-to-Income Ratio | Without Mortgage | With Mortgage |
| Less than 2.0x | 891 (49.6%) | 75,192 (3,458.7%) |
| 2.0x to 2.9x | 311 (17.3%) | 1,562 (71.9%) |
| 3.0x to 3.9x | 133 (7.4%) | 235 (10.8%) |
| 4.0x or more | 410 (22.8%) | 139 (6.4%) |
| Total | 1,798 (100.0%) | 2,174 (100.0%) |
Real Estate Taxes by Mortgage Status in Alliance
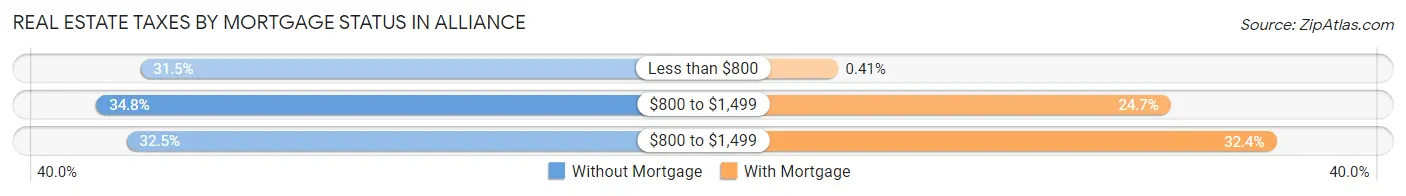
| Property Taxes | Without Mortgage | With Mortgage |
| Less than $800 | 567 (31.5%) | 9 (0.4%) |
| $800 to $1,499 | 625 (34.8%) | 536 (24.7%) |
| $800 to $1,499 | 585 (32.5%) | 704 (32.4%) |
| Total | 1,798 (100.0%) | 2,174 (100.0%) |
Health & Disability in Alliance
Health Insurance Coverage by Age in Alliance
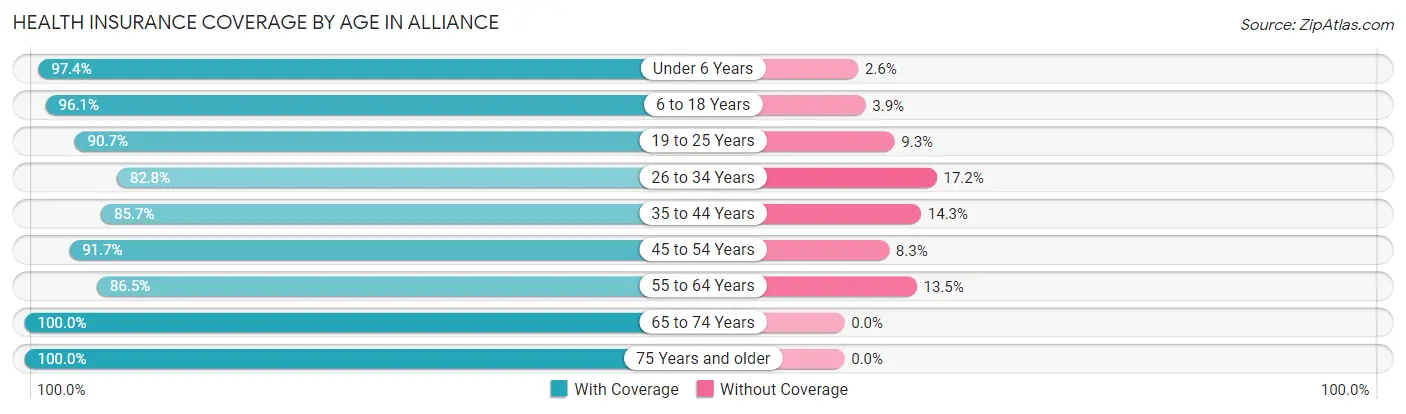
| Age Bracket | With Coverage | Without Coverage |
| Under 6 Years | 1,521 (97.4%) | 40 (2.6%) |
| 6 to 18 Years | 3,433 (96.1%) | 140 (3.9%) |
| 19 to 25 Years | 2,601 (90.7%) | 268 (9.3%) |
| 26 to 34 Years | 2,002 (82.8%) | 416 (17.2%) |
| 35 to 44 Years | 1,963 (85.7%) | 327 (14.3%) |
| 45 to 54 Years | 2,160 (91.7%) | 196 (8.3%) |
| 55 to 64 Years | 2,450 (86.5%) | 382 (13.5%) |
| 65 to 74 Years | 2,326 (100.0%) | 0 (0.0%) |
| 75 Years and older | 1,048 (100.0%) | 0 (0.0%) |
| Total | 19,504 (91.7%) | 1,769 (8.3%) |
Health Insurance Coverage by Citizenship Status in Alliance
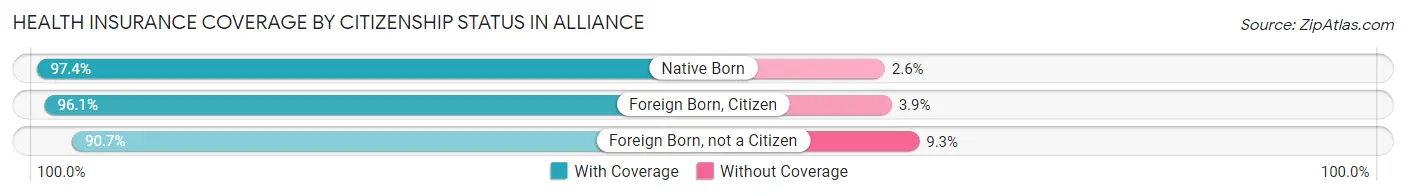
| Citizenship Status | With Coverage | Without Coverage |
| Native Born | 1,521 (97.4%) | 40 (2.6%) |
| Foreign Born, Citizen | 3,433 (96.1%) | 140 (3.9%) |
| Foreign Born, not a Citizen | 2,601 (90.7%) | 268 (9.3%) |
Health Insurance Coverage by Household Income in Alliance
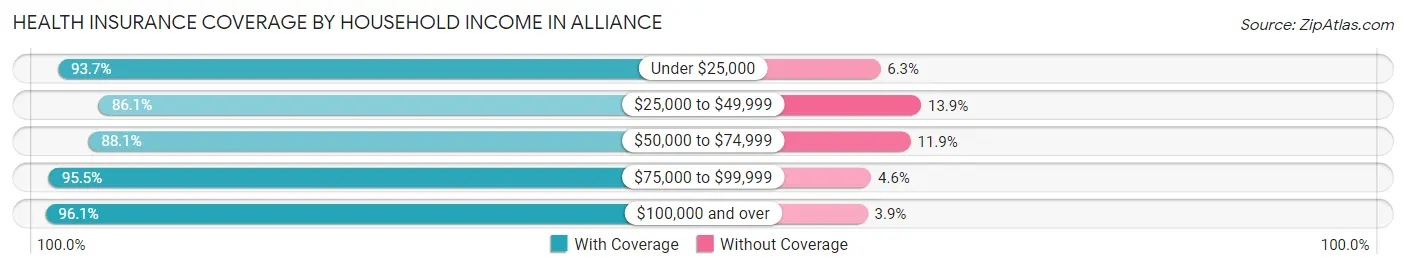
| Household Income | With Coverage | Without Coverage |
| Under $25,000 | 3,186 (93.7%) | 213 (6.3%) |
| $25,000 to $49,999 | 3,347 (86.1%) | 541 (13.9%) |
| $50,000 to $74,999 | 4,895 (88.1%) | 664 (11.9%) |
| $75,000 to $99,999 | 3,024 (95.5%) | 144 (4.5%) |
| $100,000 and over | 3,829 (96.1%) | 155 (3.9%) |
Public vs Private Health Insurance Coverage by Age in Alliance
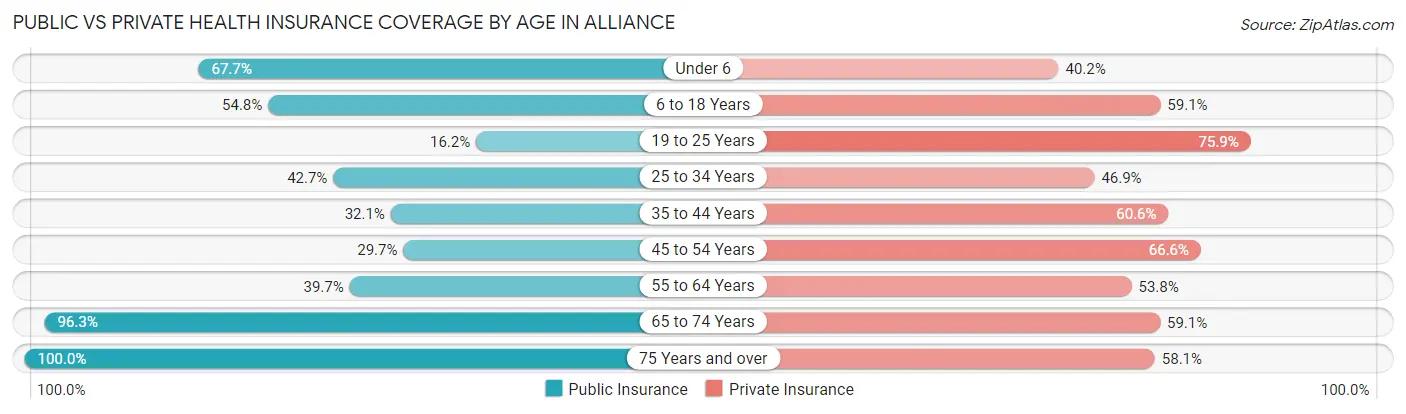
| Age Bracket | Public Insurance | Private Insurance |
| Under 6 | 1,057 (67.7%) | 628 (40.2%) |
| 6 to 18 Years | 1,958 (54.8%) | 2,113 (59.1%) |
| 19 to 25 Years | 465 (16.2%) | 2,177 (75.9%) |
| 25 to 34 Years | 1,033 (42.7%) | 1,134 (46.9%) |
| 35 to 44 Years | 734 (32.1%) | 1,388 (60.6%) |
| 45 to 54 Years | 700 (29.7%) | 1,570 (66.6%) |
| 55 to 64 Years | 1,124 (39.7%) | 1,523 (53.8%) |
| 65 to 74 Years | 2,240 (96.3%) | 1,374 (59.1%) |
| 75 Years and over | 1,048 (100.0%) | 609 (58.1%) |
| Total | 10,359 (48.7%) | 12,516 (58.8%) |
Disability Status by Sex by Age in Alliance
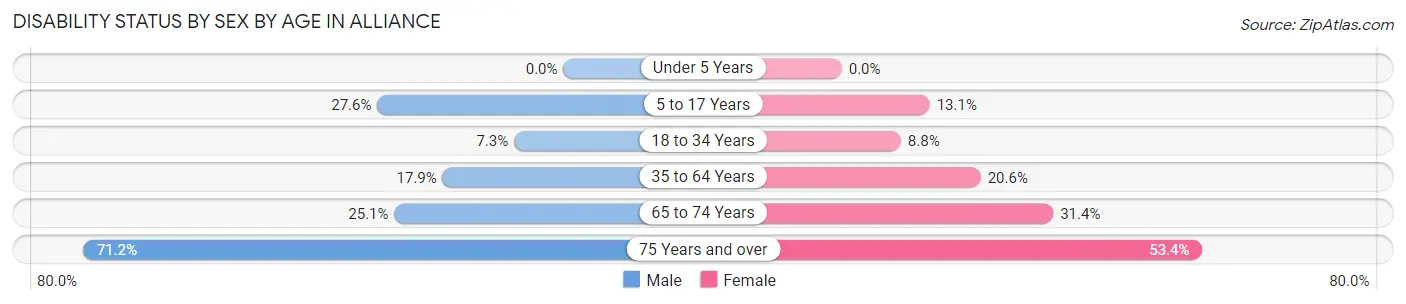
| Age Bracket | Male | Female |
| Under 5 Years | 0 (0.0%) | 0 (0.0%) |
| 5 to 17 Years | 425 (27.6%) | 220 (13.1%) |
| 18 to 34 Years | 229 (7.3%) | 240 (8.8%) |
| 35 to 64 Years | 670 (17.9%) | 772 (20.6%) |
| 65 to 74 Years | 272 (25.1%) | 390 (31.4%) |
| 75 Years and over | 230 (71.2%) | 387 (53.4%) |
Disability Class by Sex by Age in Alliance
Disability Class: Hearing Difficulty
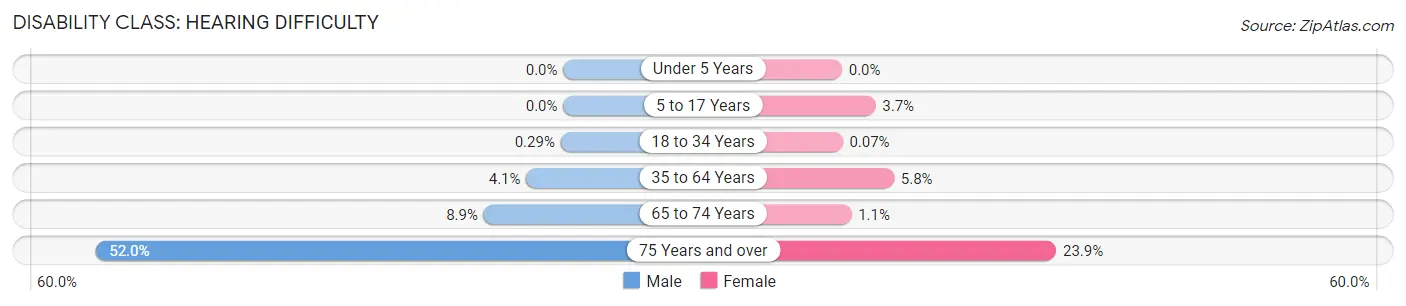
| Age Bracket | Male | Female |
| Under 5 Years | 0 (0.0%) | 0 (0.0%) |
| 5 to 17 Years | 0 (0.0%) | 63 (3.7%) |
| 18 to 34 Years | 9 (0.3%) | 2 (0.1%) |
| 35 to 64 Years | 154 (4.1%) | 217 (5.8%) |
| 65 to 74 Years | 96 (8.9%) | 13 (1.1%) |
| 75 Years and over | 168 (52.0%) | 173 (23.9%) |
Disability Class: Vision Difficulty
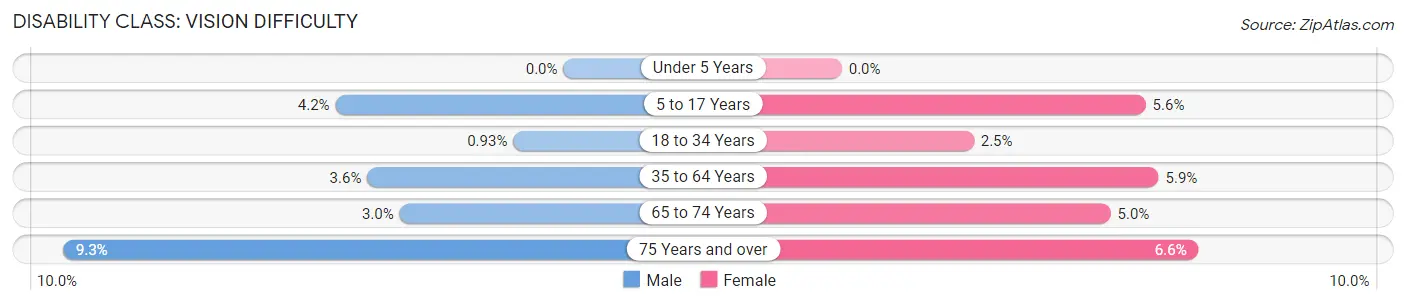
| Age Bracket | Male | Female |
| Under 5 Years | 0 (0.0%) | 0 (0.0%) |
| 5 to 17 Years | 65 (4.2%) | 95 (5.6%) |
| 18 to 34 Years | 29 (0.9%) | 67 (2.5%) |
| 35 to 64 Years | 136 (3.6%) | 220 (5.9%) |
| 65 to 74 Years | 33 (3.0%) | 62 (5.0%) |
| 75 Years and over | 30 (9.3%) | 48 (6.6%) |
Disability Class: Cognitive Difficulty
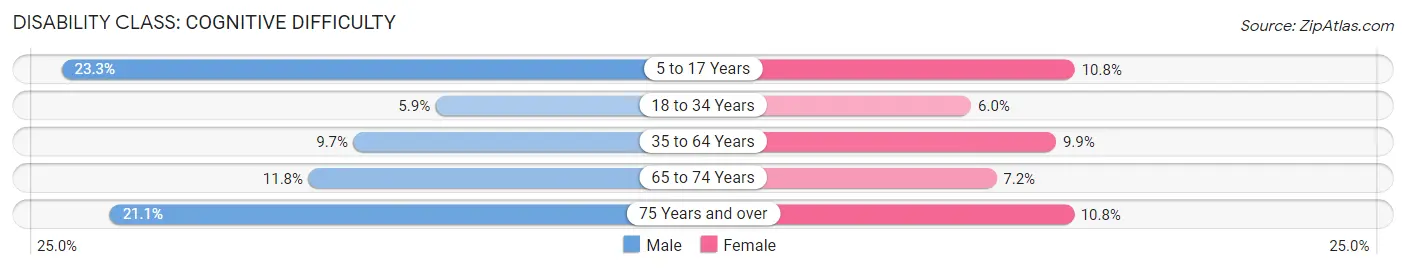
| Age Bracket | Male | Female |
| 5 to 17 Years | 358 (23.3%) | 182 (10.8%) |
| 18 to 34 Years | 185 (5.9%) | 164 (6.0%) |
| 35 to 64 Years | 363 (9.7%) | 372 (9.9%) |
| 65 to 74 Years | 128 (11.8%) | 89 (7.2%) |
| 75 Years and over | 68 (21.0%) | 78 (10.8%) |
Disability Class: Ambulatory Difficulty
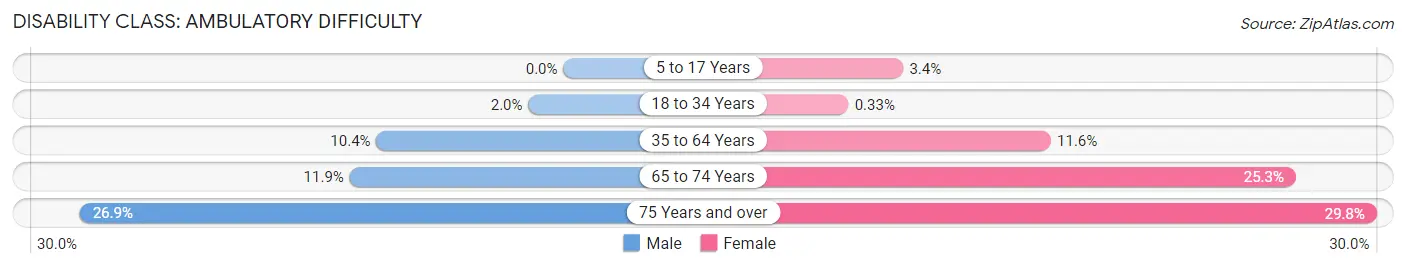
| Age Bracket | Male | Female |
| 5 to 17 Years | 0 (0.0%) | 57 (3.4%) |
| 18 to 34 Years | 61 (1.9%) | 9 (0.3%) |
| 35 to 64 Years | 389 (10.4%) | 434 (11.6%) |
| 65 to 74 Years | 129 (11.9%) | 314 (25.3%) |
| 75 Years and over | 87 (26.9%) | 216 (29.8%) |
Disability Class: Self-Care Difficulty
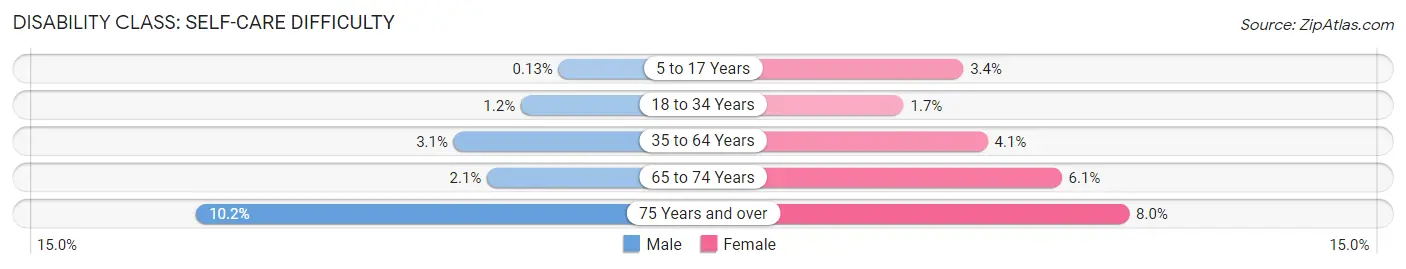
| Age Bracket | Male | Female |
| 5 to 17 Years | 2 (0.1%) | 57 (3.4%) |
| 18 to 34 Years | 37 (1.2%) | 47 (1.7%) |
| 35 to 64 Years | 114 (3.0%) | 152 (4.1%) |
| 65 to 74 Years | 23 (2.1%) | 76 (6.1%) |
| 75 Years and over | 33 (10.2%) | 58 (8.0%) |
Technology Access in Alliance
Computing Device Access in Alliance
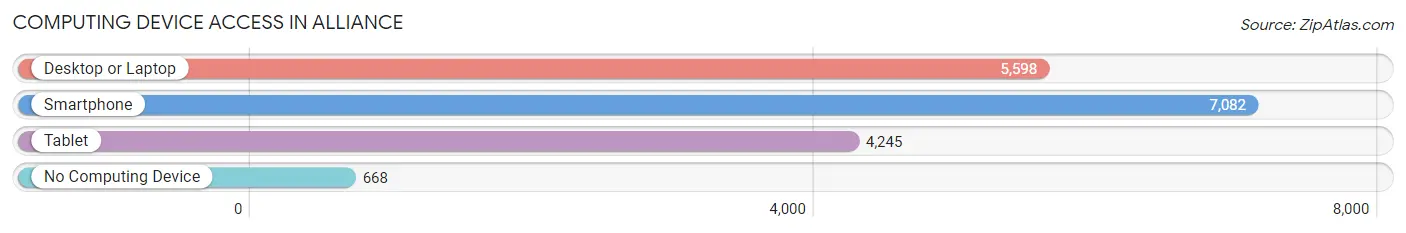
| Device Type | # Households | % Households |
| Desktop or Laptop | 5,598 | 67.6% |
| Smartphone | 7,082 | 85.6% |
| Tablet | 4,245 | 51.3% |
| No Computing Device | 668 | 8.1% |
| Total | 8,278 | 100.0% |
Internet Access in Alliance
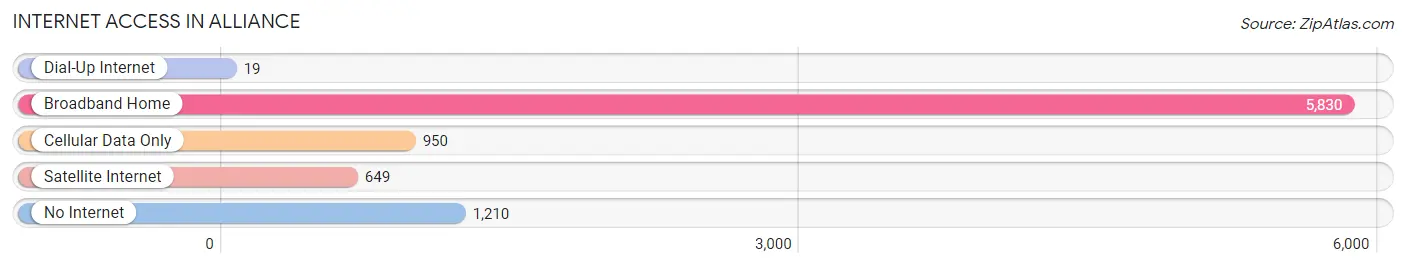
| Internet Type | # Households | % Households |
| Dial-Up Internet | 19 | 0.2% |
| Broadband Home | 5,830 | 70.4% |
| Cellular Data Only | 950 | 11.5% |
| Satellite Internet | 649 | 7.8% |
| No Internet | 1,210 | 14.6% |
| Total | 8,278 | 100.0% |
Alliance Summary
Alliance, Ohio is a city located in Stark County, Ohio, United States. It is located in the northeastern part of the state, approximately 60 miles south of Cleveland and 30 miles north of Canton. The city has a population of 22,322 as of the 2010 census, making it the largest city in Stark County.
History
Alliance was founded in 1854 by a group of settlers from Connecticut, led by William Henry Harrison. The settlers named the city after the Alliance of the Six Nations, a Native American confederacy that had been formed in the area in the late 1700s. The city was officially incorporated in 1854, and the first mayor was elected in 1855.
The city grew rapidly in the late 19th century, due to its location on the Pennsylvania and Ohio Railroad. The railroad connected Alliance to other cities in the region, and allowed for the transportation of goods and services. The city also became a major center for the production of steel and other industrial products.
In the early 20th century, Alliance was home to several large manufacturing companies, including the Alliance Machine Company, the Alliance Foundry Company, and the Alliance Steel Company. These companies provided employment for many of the city’s residents, and helped to fuel the city’s growth.
Geography
Alliance is located in northeastern Ohio, approximately 60 miles south of Cleveland and 30 miles north of Canton. The city is situated in the Mahoning Valley, which is part of the larger Great Lakes region. The city is located on the Mahoning River, which flows through the city and provides a source of water for the city’s residents.
The city has a total area of 8.3 square miles, of which 8.2 square miles is land and 0.1 square miles is water. The city is located in a humid continental climate zone, with hot summers and cold winters.
Economy
Alliance’s economy is largely based on manufacturing and industry. The city is home to several large manufacturing companies, including the Alliance Machine Company, the Alliance Foundry Company, and the Alliance Steel Company. These companies provide employment for many of the city’s residents, and help to fuel the city’s economy.
The city is also home to several other businesses, including retail stores, restaurants, and other service-based businesses. The city is also home to several educational institutions, including the University of Mount Union and the Alliance City School District.
Demographics
As of the 2010 census, Alliance had a population of 22,322. The racial makeup of the city was 87.3% White, 8.2% African American, 0.4% Native American, 0.7% Asian, 0.1% Pacific Islander, 1.2% from other races, and 2.1% from two or more races. Hispanic or Latino of any race were 3.2% of the population.
The median income for a household in the city was $37,945, and the median income for a family was $45,945. The per capita income for the city was $19,945. About 13.2% of families and 16.3% of the population were below the poverty line, including 22.3% of those under age 18 and 8.2% of those age 65 or over.
Common Questions
What is the Total Population of Alliance?
Total Population of Alliance is 21,603.
What is the Total Male Population of Alliance?
Total Male Population of Alliance is 10,657.
What is the Total Female Population of Alliance?
Total Female Population of Alliance is 10,946.
What is the Ratio of Males per 100 Females in Alliance?
There are 97.36 Males per 100 Females in Alliance.
What is the Ratio of Females per 100 Males in Alliance?
There are 102.71 Females per 100 Males in Alliance.
What is the Median Population Age in Alliance?
Median Population Age in Alliance is 35.9 Years.
What is the Average Family Size in Alliance
Average Family Size in Alliance is 3.0 People.
What is the Average Household Size in Alliance
Average Household Size in Alliance is 2.4 People.
What is Per Capita Income in Alliance?
Per Capita income in Alliance is $25,606.
What is the Median Family Income in Alliance?
Median Family Income in Alliance is $62,123.
What is the Median Household income in Alliance?
Median Household Income in Alliance is $51,721.
What is Income or Wage Gap in Alliance?
Income or Wage Gap in Alliance is 29.7%.
Women in Alliance earn 70.3 cents for every dollar earned by a man.
What is Family Income Deficit in Alliance?
Family Income Deficit in Alliance is $10,383.
Families that are below poverty line in Alliance earn $10,383 less on average than the poverty threshold level.
What is Inequality or Gini Index in Alliance?
Inequality or Gini Index in Alliance is 0.43.
How Large is the Labor Force in Alliance?
There are 10,436 People in the Labor Forcein in Alliance.
What is the Percentage of People in the Labor Force in Alliance?
59.8% of People are in the Labor Force in Alliance.
What is the Unemployment Rate in Alliance?
Unemployment Rate in Alliance is 4.0%.