Lebanon, OH
Lebanon Map
Lebanon Overview
20,999
TOTAL POPULATION
10,221
MALE POPULATION
10,778
FEMALE POPULATION
94.83
MALES / 100 FEMALES
105.45
FEMALES / 100 MALES
37.8
MEDIAN AGE
3.0
AVG FAMILY SIZE
2.5
AVG HOUSEHOLD SIZE
$36,077
PER CAPITA INCOME
$89,205
AVG FAMILY INCOME
$75,665
AVG HOUSEHOLD INCOME
38.9%
WAGE / INCOME GAP [ % ]
61.1¢/ $1
WAGE / INCOME GAP [ $ ]
0.39
INEQUALITY / GINI INDEX
10,288
LABOR FORCE [ PEOPLE ]
64.7%
PERCENT IN LABOR FORCE
2.0%
UNEMPLOYMENT RATE
Lebanon Zip Codes
Lebanon Area Codes
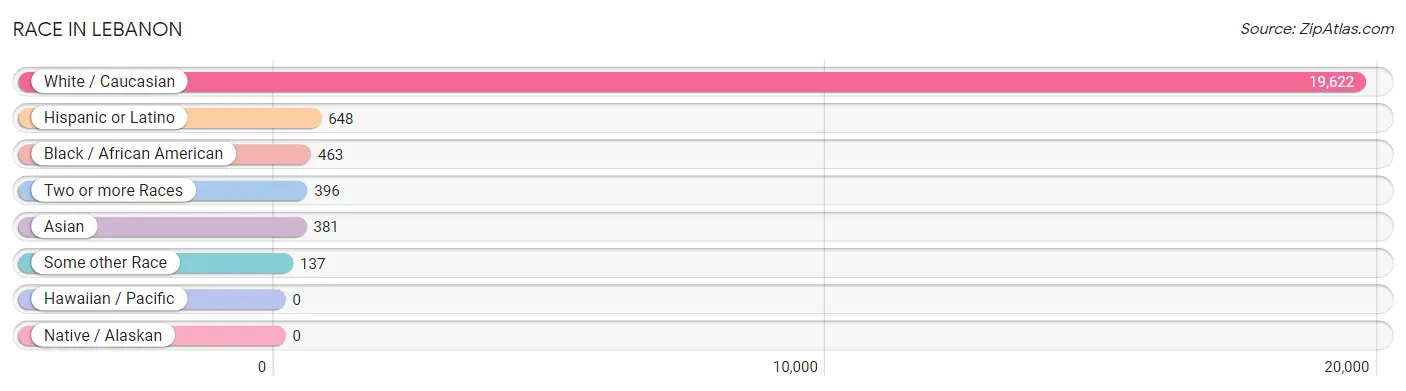
Race in Lebanon
The most populous races in Lebanon are White / Caucasian (19,622 | 93.4%), Hispanic or Latino (648 | 3.1%), and Black / African American (463 | 2.2%).
| Race | # Population | % Population |
| Asian | 381 | 1.8% |
| Black / African American | 463 | 2.2% |
| Hawaiian / Pacific | 0 | 0.0% |
| Hispanic or Latino | 648 | 3.1% |
| Native / Alaskan | 0 | 0.0% |
| White / Caucasian | 19,622 | 93.4% |
| Two or more Races | 396 | 1.9% |
| Some other Race | 137 | 0.6% |
| Total | 20,999 | 100.0% |
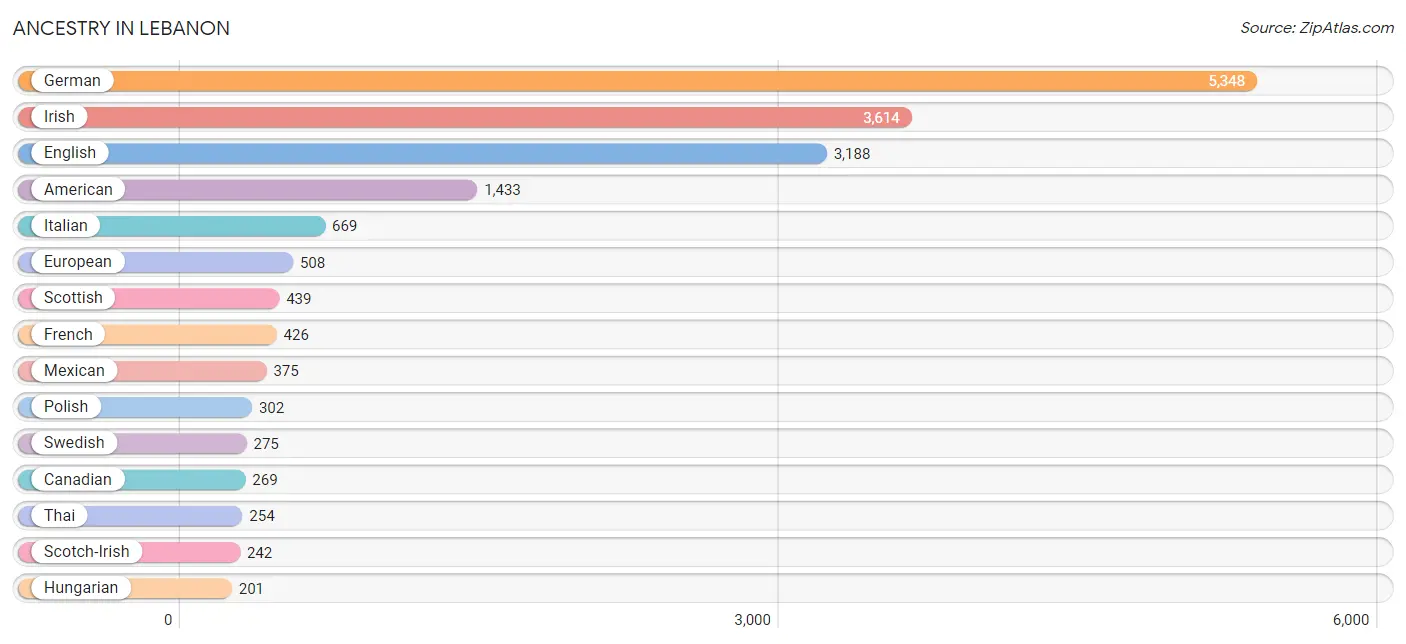
Ancestry in Lebanon
The most populous ancestries reported in Lebanon are German (5,348 | 25.5%), Irish (3,614 | 17.2%), English (3,188 | 15.2%), American (1,433 | 6.8%), and Italian (669 | 3.2%), together accounting for 67.9% of all Lebanon residents.
| Ancestry | # Population | % Population |
| African | 25 | 0.1% |
| American | 1,433 | 6.8% |
| Arab | 47 | 0.2% |
| Austrian | 89 | 0.4% |
| Belgian | 61 | 0.3% |
| Bhutanese | 125 | 0.6% |
| British | 179 | 0.9% |
| Canadian | 269 | 1.3% |
| Central American | 66 | 0.3% |
| Cherokee | 27 | 0.1% |
| Chickasaw | 7 | 0.0% |
| Creek | 7 | 0.0% |
| Croatian | 16 | 0.1% |
| Czech | 97 | 0.5% |
| Czechoslovakian | 9 | 0.0% |
| Danish | 94 | 0.4% |
| Dutch | 190 | 0.9% |
| Eastern European | 75 | 0.4% |
| Egyptian | 28 | 0.1% |
| English | 3,188 | 15.2% |
| European | 508 | 2.4% |
| Finnish | 12 | 0.1% |
| French | 426 | 2.0% |
| French Canadian | 21 | 0.1% |
| German | 5,348 | 25.5% |
| Guatemalan | 2 | 0.0% |
| Honduran | 64 | 0.3% |
| Hungarian | 201 | 1.0% |
| Indian (Asian) | 10 | 0.1% |
| Irish | 3,614 | 17.2% |
| Italian | 669 | 3.2% |
| Jamaican | 17 | 0.1% |
| Korean | 32 | 0.2% |
| Lebanese | 8 | 0.0% |
| Luxembourger | 17 | 0.1% |
| Mexican | 375 | 1.8% |
| Native Hawaiian | 51 | 0.2% |
| Nigerian | 26 | 0.1% |
| Norwegian | 59 | 0.3% |
| Polish | 302 | 1.4% |
| Puerto Rican | 21 | 0.1% |
| Russian | 51 | 0.2% |
| Scandinavian | 39 | 0.2% |
| Scotch-Irish | 242 | 1.1% |
| Scottish | 439 | 2.1% |
| Slovak | 47 | 0.2% |
| Slovene | 16 | 0.1% |
| Spaniard | 39 | 0.2% |
| Subsaharan African | 51 | 0.2% |
| Swedish | 275 | 1.3% |
| Syrian | 11 | 0.1% |
| Thai | 254 | 1.2% |
| Welsh | 61 | 0.3% | View All 53 Rows |
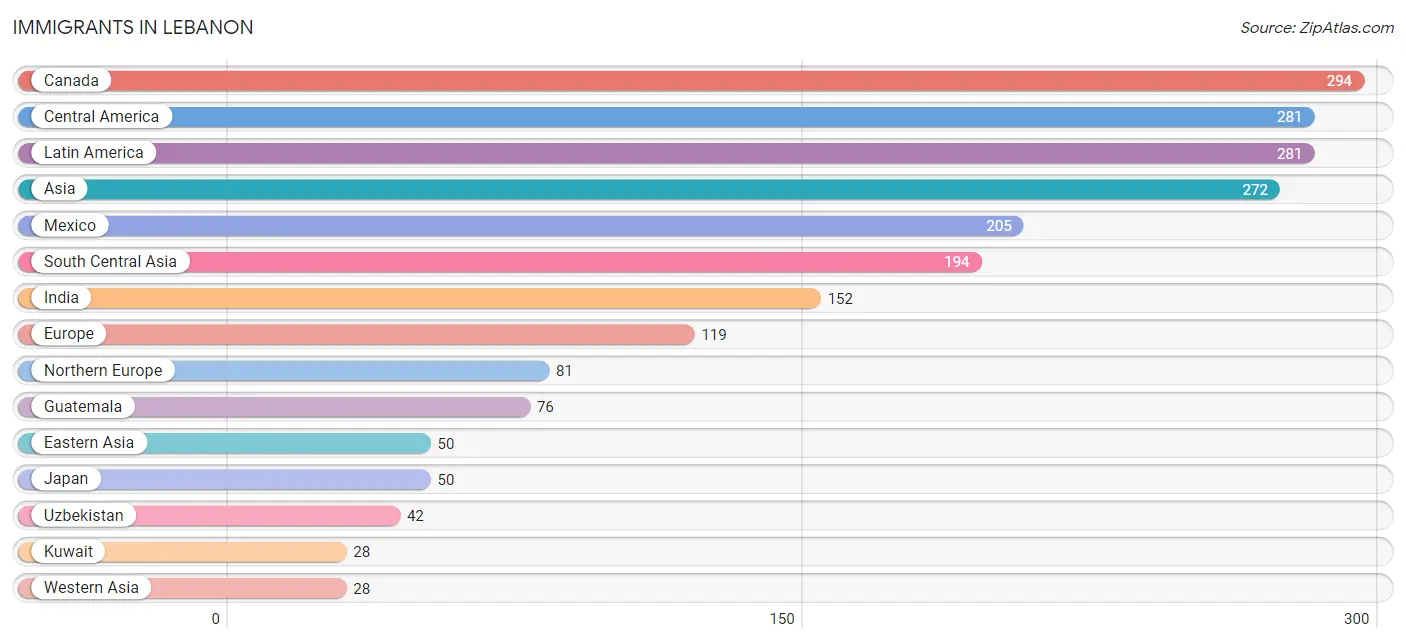
Immigrants in Lebanon
The most numerous immigrant groups reported in Lebanon came from Canada (294 | 1.4%), Central America (281 | 1.3%), Latin America (281 | 1.3%), Asia (272 | 1.3%), and Mexico (205 | 1.0%), together accounting for 6.4% of all Lebanon residents.
| Immigration Origin | # Population | % Population |
| Africa | 11 | 0.1% |
| Asia | 272 | 1.3% |
| Canada | 294 | 1.4% |
| Central America | 281 | 1.3% |
| Eastern Africa | 11 | 0.1% |
| Eastern Asia | 50 | 0.2% |
| Eastern Europe | 10 | 0.1% |
| Europe | 119 | 0.6% |
| France | 17 | 0.1% |
| Germany | 11 | 0.1% |
| Guatemala | 76 | 0.4% |
| India | 152 | 0.7% |
| Japan | 50 | 0.2% |
| Kuwait | 28 | 0.1% |
| Latin America | 281 | 1.3% |
| Mexico | 205 | 1.0% |
| Northern Europe | 81 | 0.4% |
| South Central Asia | 194 | 0.9% |
| Ukraine | 10 | 0.1% |
| Uzbekistan | 42 | 0.2% |
| Western Asia | 28 | 0.1% |
| Western Europe | 28 | 0.1% | View All 22 Rows |
Sex and Age in Lebanon
Sex and Age in Lebanon
The most populous age groups in Lebanon are 35 to 39 Years (828 | 8.1%) for men and 60 to 64 Years (868 | 8.1%) for women.
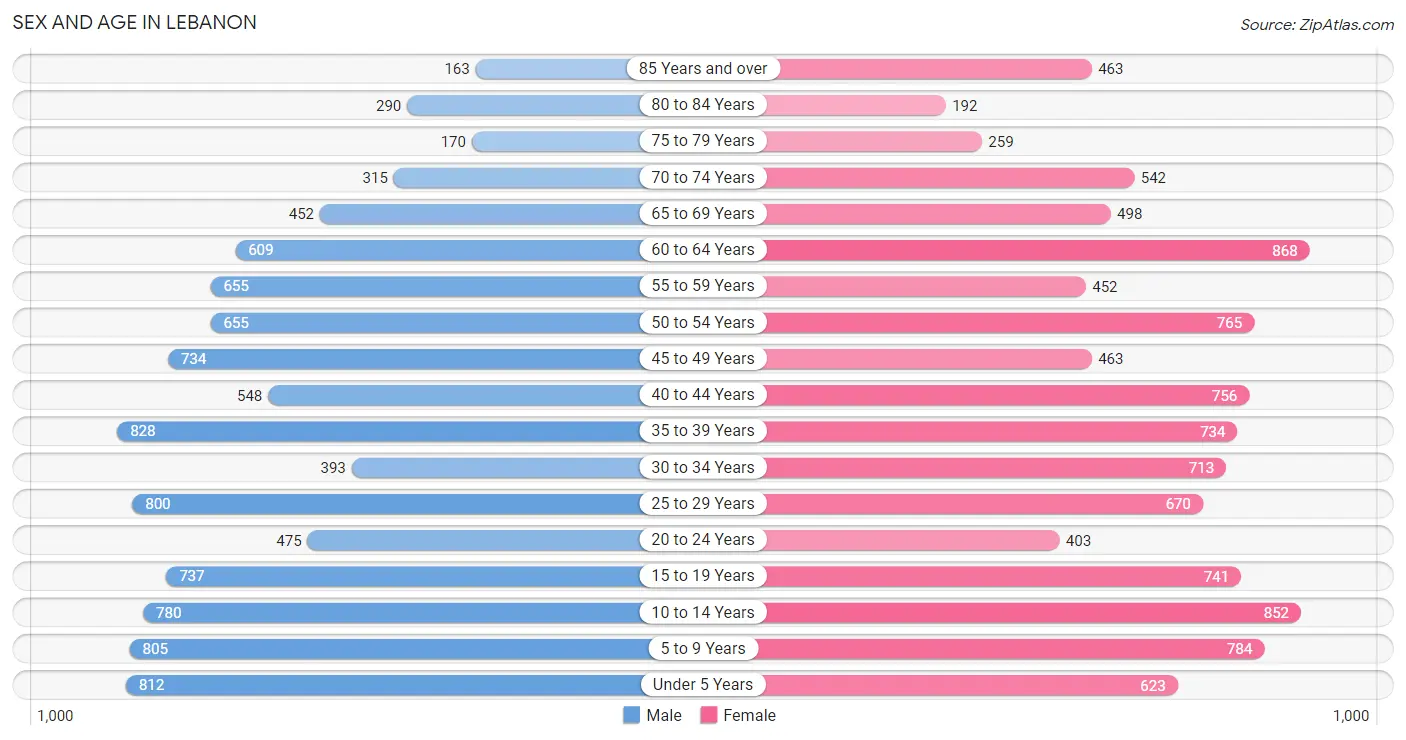
| Age Bracket | Male | Female |
| Under 5 Years | 812 (7.9%) | 623 (5.8%) |
| 5 to 9 Years | 805 (7.9%) | 784 (7.3%) |
| 10 to 14 Years | 780 (7.6%) | 852 (7.9%) |
| 15 to 19 Years | 737 (7.2%) | 741 (6.9%) |
| 20 to 24 Years | 475 (4.6%) | 403 (3.7%) |
| 25 to 29 Years | 800 (7.8%) | 670 (6.2%) |
| 30 to 34 Years | 393 (3.8%) | 713 (6.6%) |
| 35 to 39 Years | 828 (8.1%) | 734 (6.8%) |
| 40 to 44 Years | 548 (5.4%) | 756 (7.0%) |
| 45 to 49 Years | 734 (7.2%) | 463 (4.3%) |
| 50 to 54 Years | 655 (6.4%) | 765 (7.1%) |
| 55 to 59 Years | 655 (6.4%) | 452 (4.2%) |
| 60 to 64 Years | 609 (6.0%) | 868 (8.1%) |
| 65 to 69 Years | 452 (4.4%) | 498 (4.6%) |
| 70 to 74 Years | 315 (3.1%) | 542 (5.0%) |
| 75 to 79 Years | 170 (1.7%) | 259 (2.4%) |
| 80 to 84 Years | 290 (2.8%) | 192 (1.8%) |
| 85 Years and over | 163 (1.6%) | 463 (4.3%) |
| Total | 10,221 (100.0%) | 10,778 (100.0%) |
Families and Households in Lebanon
Median Family Size in Lebanon
The median family size in Lebanon is 3.02 persons per family, with single male/father families (310 | 5.5%) accounting for the largest median family size of 3.21 persons per family. On the other hand, single female/mother families (936 | 16.7%) represent the smallest median family size with 2.80 persons per family.
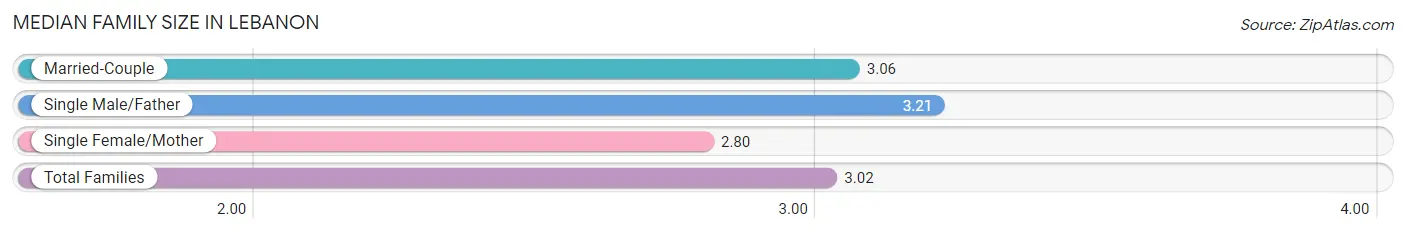
| Family Type | # Families | Family Size |
| Married-Couple | 4,352 (77.7%) | 3.06 |
| Single Male/Father | 310 (5.5%) | 3.21 |
| Single Female/Mother | 936 (16.7%) | 2.80 |
| Total Families | 5,598 (100.0%) | 3.02 |
Median Household Size in Lebanon
The median household size in Lebanon is 2.54 persons per household, with single male/father households (310 | 3.8%) accounting for the largest median household size of 4.24 persons per household. non-family households (2,456 | 30.5%) represent the smallest median household size with 1.26 persons per household.
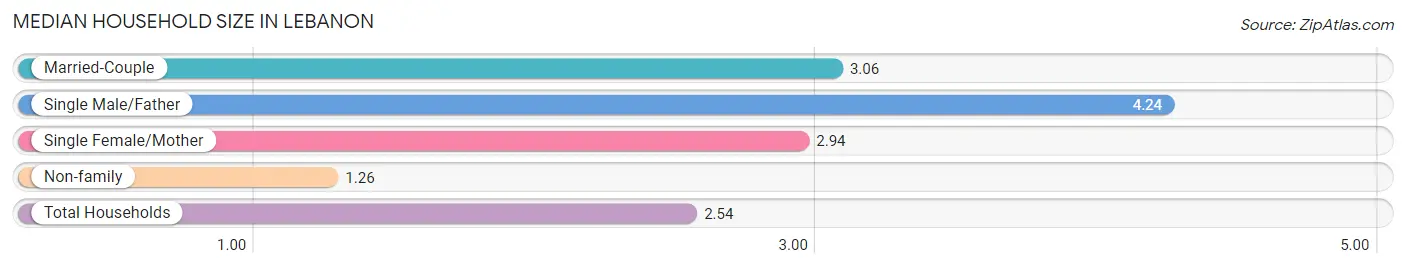
| Household Type | # Households | Household Size |
| Married-Couple | 4,352 (54.0%) | 3.06 |
| Single Male/Father | 310 (3.8%) | 4.24 |
| Single Female/Mother | 936 (11.6%) | 2.94 |
| Non-family | 2,456 (30.5%) | 1.26 |
| Total Households | 8,054 (100.0%) | 2.54 |
Household Size by Marriage Status in Lebanon
Out of a total of 8,054 households in Lebanon, 5,598 (69.5%) are family households, while 2,456 (30.5%) are nonfamily households. The most numerous type of family households are 2-person households, comprising 2,750, and the most common type of nonfamily households are 1-person households, comprising 1,876.
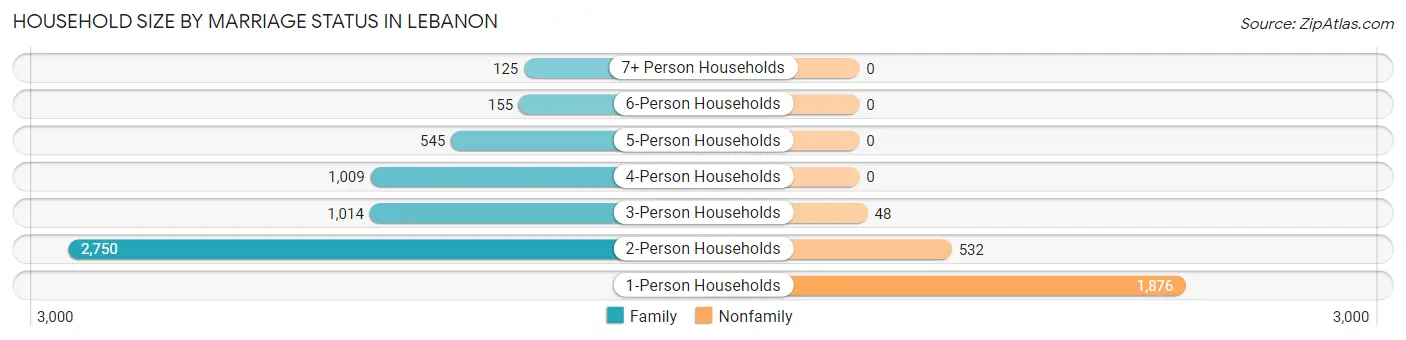
| Household Size | Family Households | Nonfamily Households |
| 1-Person Households | - | 1,876 (23.3%) |
| 2-Person Households | 2,750 (34.1%) | 532 (6.6%) |
| 3-Person Households | 1,014 (12.6%) | 48 (0.6%) |
| 4-Person Households | 1,009 (12.5%) | 0 (0.0%) |
| 5-Person Households | 545 (6.8%) | 0 (0.0%) |
| 6-Person Households | 155 (1.9%) | 0 (0.0%) |
| 7+ Person Households | 125 (1.5%) | 0 (0.0%) |
| Total | 5,598 (69.5%) | 2,456 (30.5%) |
Female Fertility in Lebanon
Fertility by Age in Lebanon
Average fertility rate in Lebanon is 40.0 births per 1,000 women. Women in the age bracket of 20 to 34 years have the highest fertility rate with 85.0 births per 1,000 women. Women in the age bracket of 20 to 34 years acount for 79.9% of all women with births.
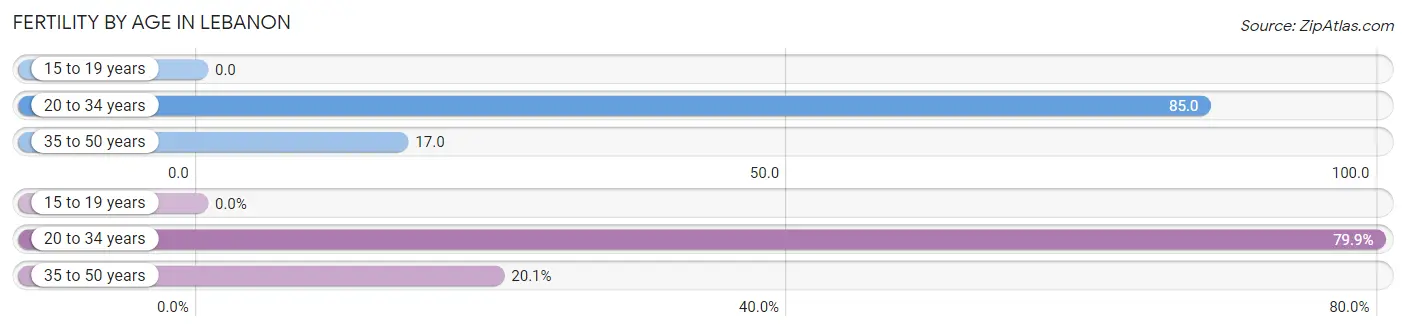
| Age Bracket | Women with Births | Births / 1,000 Women |
| 15 to 19 years | 0 (0.0%) | 0.0 |
| 20 to 34 years | 151 (79.9%) | 85.0 |
| 35 to 50 years | 38 (20.1%) | 17.0 |
| Total | 189 (100.0%) | 40.0 |
Fertility by Age by Marriage Status in Lebanon
92.6% of women with births (189) in Lebanon are married. The highest percentage of unmarried women with births falls into 35 to 50 years age bracket with 18.4% of them unmarried at the time of birth, while the lowest percentage of unmarried women with births belong to 20 to 34 years age bracket with 4.6% of them unmarried.
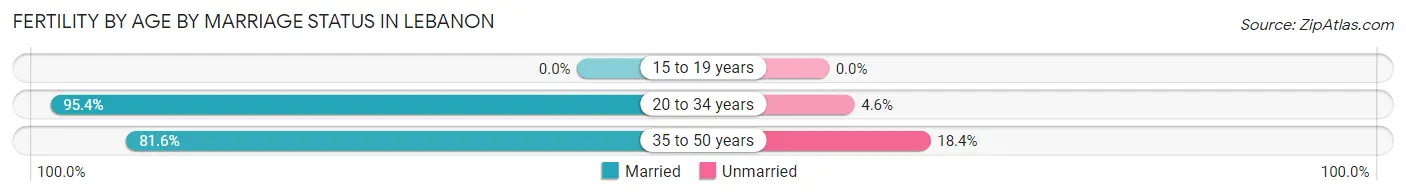
| Age Bracket | Married | Unmarried |
| 15 to 19 years | 0 (0.0%) | 0 (0.0%) |
| 20 to 34 years | 144 (95.4%) | 7 (4.6%) |
| 35 to 50 years | 31 (81.6%) | 7 (18.4%) |
| Total | 175 (92.6%) | 14 (7.4%) |
Fertility by Education in Lebanon
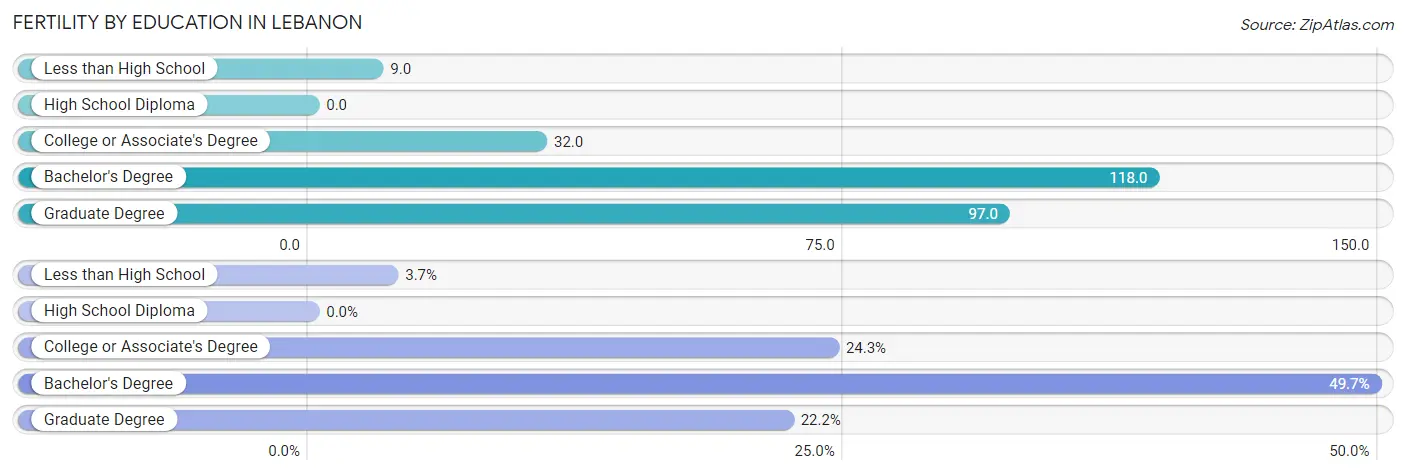
| Educational Attainment | Women with Births | Births / 1,000 Women |
| Less than High School | 7 (3.7%) | 9.0 |
| High School Diploma | 0 (0.0%) | 0.0 |
| College or Associate's Degree | 46 (24.3%) | 32.0 |
| Bachelor's Degree | 94 (49.7%) | 118.0 |
| Graduate Degree | 42 (22.2%) | 97.0 |
| Total | 189 (100.0%) | 40.0 |
Fertility by Education by Marriage Status in Lebanon
7.4% of women with births in Lebanon are unmarried. Women with the educational attainment of bachelor's degree are most likely to be married with 100.0% of them married at childbirth, while women with the educational attainment of less than high school are least likely to be married with 100.0% of them unmarried at childbirth.
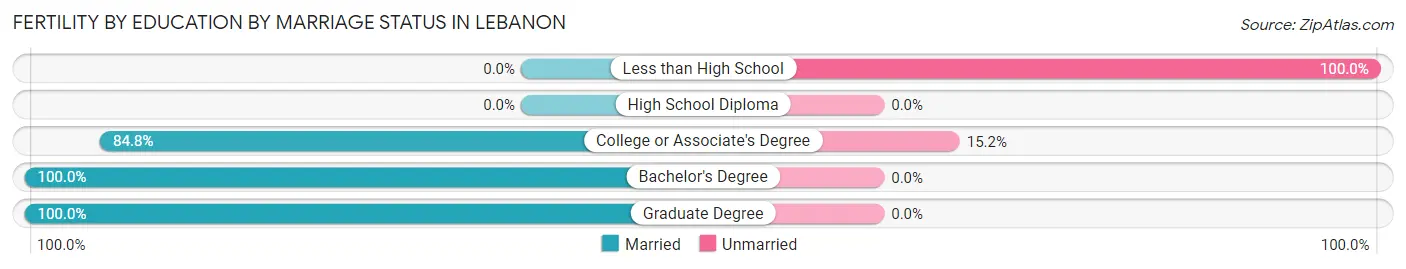
| Educational Attainment | Married | Unmarried |
| Less than High School | 0 (0.0%) | 7 (100.0%) |
| High School Diploma | 0 (0.0%) | 0 (0.0%) |
| College or Associate's Degree | 39 (84.8%) | 7 (15.2%) |
| Bachelor's Degree | 94 (100.0%) | 0 (0.0%) |
| Graduate Degree | 42 (100.0%) | 0 (0.0%) |
| Total | 175 (92.6%) | 14 (7.4%) |
Income in Lebanon
Income Overview in Lebanon
Per Capita Income in Lebanon is $36,077, while median incomes of families and households are $89,205 and $75,665 respectively.
| Characteristic | Number | Measure |
| Per Capita Income | 20,999 | $36,077 |
| Median Family Income | 5,598 | $89,205 |
| Mean Family Income | 5,598 | $104,488 |
| Median Household Income | 8,054 | $75,665 |
| Mean Household Income | 8,054 | $92,016 |
| Income Deficit | 5,598 | $0 |
| Wage / Income Gap (%) | 20,999 | 38.85% |
| Wage / Income Gap ($) | 20,999 | 61.15¢ per $1 |
| Gini / Inequality Index | 20,999 | 0.39 |
Earnings by Sex in Lebanon
Average Earnings in Lebanon are $46,495, $58,584 for men and $35,824 for women, a difference of 38.9%.
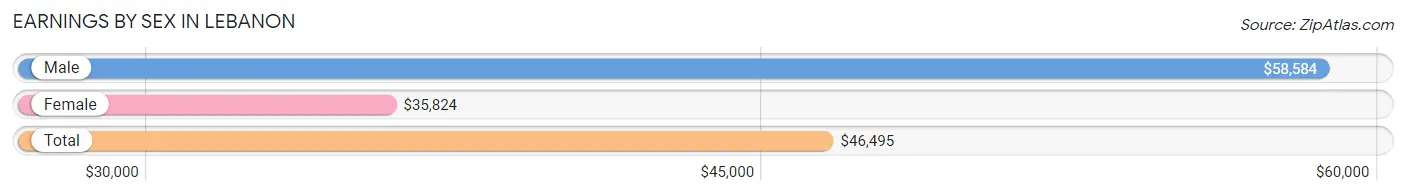
| Sex | Number | Average Earnings |
| Male | 5,558 (50.9%) | $58,584 |
| Female | 5,368 (49.1%) | $35,824 |
| Total | 10,926 (100.0%) | $46,495 |
Earnings by Sex by Income Bracket in Lebanon
The most common earnings brackets in Lebanon are $100,000+ for men (1,014 | 18.2%) and $45,000 to $49,999 for women (539 | 10.0%).
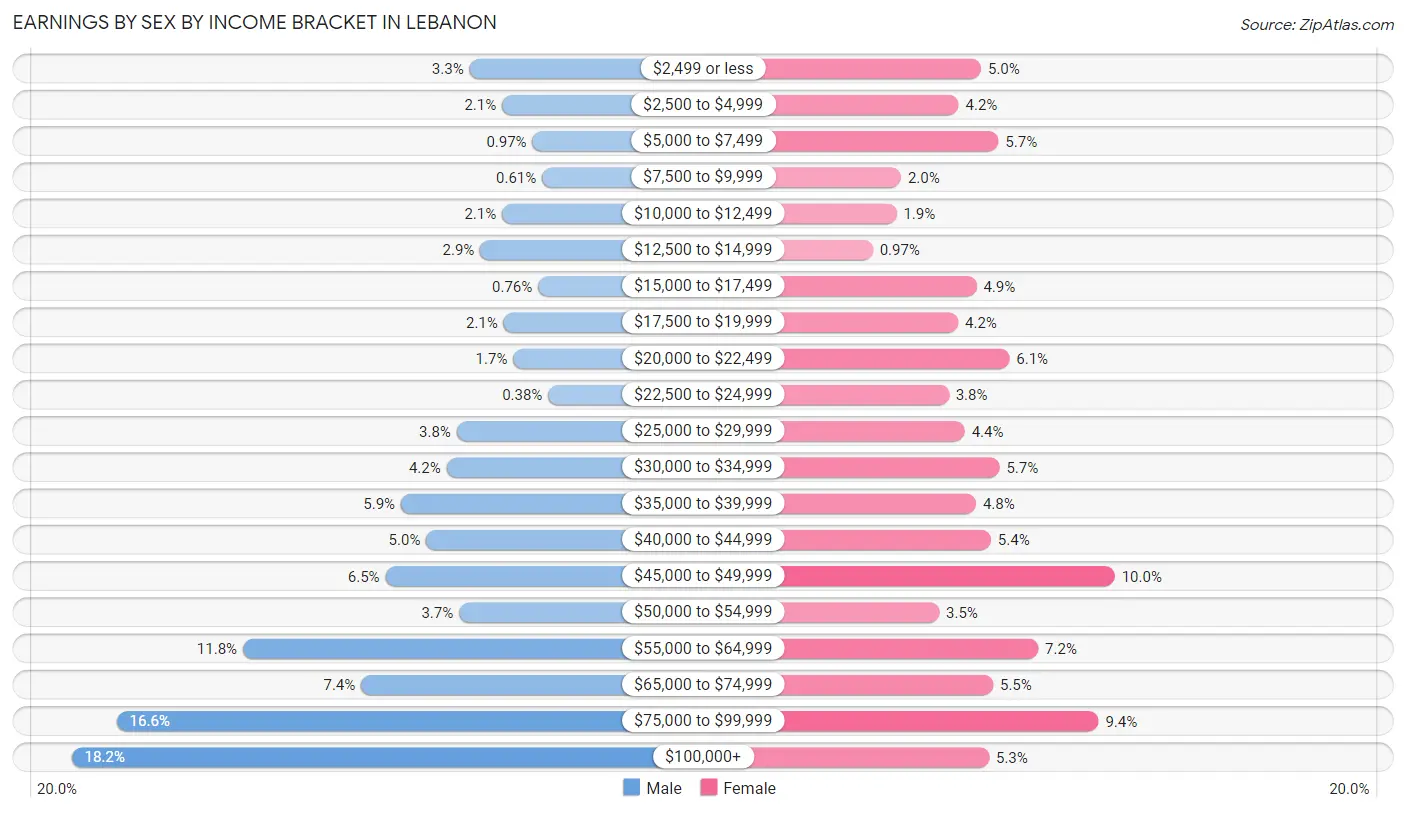
| Income | Male | Female |
| $2,499 or less | 185 (3.3%) | 270 (5.0%) |
| $2,500 to $4,999 | 117 (2.1%) | 225 (4.2%) |
| $5,000 to $7,499 | 54 (1.0%) | 305 (5.7%) |
| $7,500 to $9,999 | 34 (0.6%) | 109 (2.0%) |
| $10,000 to $12,499 | 117 (2.1%) | 100 (1.9%) |
| $12,500 to $14,999 | 163 (2.9%) | 52 (1.0%) |
| $15,000 to $17,499 | 42 (0.8%) | 261 (4.9%) |
| $17,500 to $19,999 | 114 (2.1%) | 224 (4.2%) |
| $20,000 to $22,499 | 94 (1.7%) | 327 (6.1%) |
| $22,500 to $24,999 | 21 (0.4%) | 205 (3.8%) |
| $25,000 to $29,999 | 212 (3.8%) | 237 (4.4%) |
| $30,000 to $34,999 | 233 (4.2%) | 307 (5.7%) |
| $35,000 to $39,999 | 328 (5.9%) | 260 (4.8%) |
| $40,000 to $44,999 | 275 (5.0%) | 290 (5.4%) |
| $45,000 to $49,999 | 360 (6.5%) | 539 (10.0%) |
| $50,000 to $54,999 | 207 (3.7%) | 186 (3.5%) |
| $55,000 to $64,999 | 657 (11.8%) | 385 (7.2%) |
| $65,000 to $74,999 | 411 (7.4%) | 294 (5.5%) |
| $75,000 to $99,999 | 920 (16.6%) | 506 (9.4%) |
| $100,000+ | 1,014 (18.2%) | 286 (5.3%) |
| Total | 5,558 (100.0%) | 5,368 (100.0%) |
Earnings by Sex by Educational Attainment in Lebanon
Average earnings in Lebanon are $62,772 for men and $43,740 for women, a difference of 30.3%. Men with an educational attainment of bachelor's degree enjoy the highest average annual earnings of $98,750, while those with less than high school education earn the least with $27,083. Women with an educational attainment of graduate degree earn the most with the average annual earnings of $76,729, while those with less than high school education have the smallest earnings of $28,587.
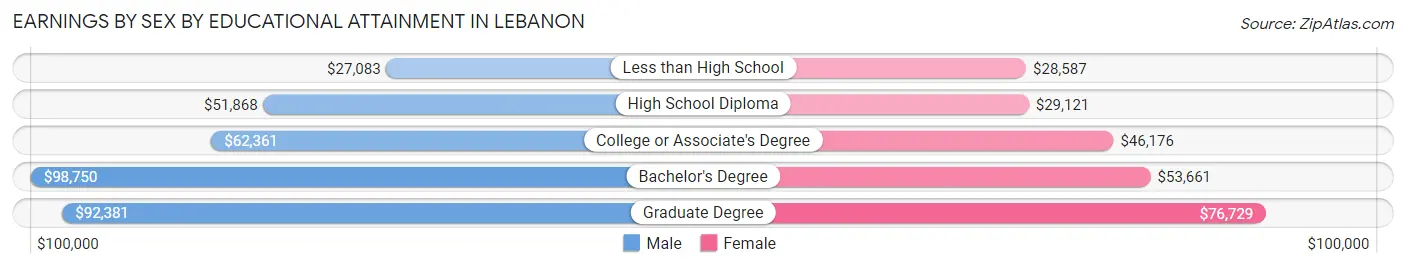
| Educational Attainment | Male Income | Female Income |
| Less than High School | $27,083 | $28,587 |
| High School Diploma | $51,868 | $29,121 |
| College or Associate's Degree | $62,361 | $46,176 |
| Bachelor's Degree | $98,750 | $53,661 |
| Graduate Degree | $92,381 | $76,729 |
| Total | $62,772 | $43,740 |
Family Income in Lebanon
Family Income Brackets in Lebanon
According to the Lebanon family income data, there are 1,517 families falling into the $100,000 to $149,999 income range, which is the most common income bracket and makes up 27.1% of all families. Conversely, the less than $10,000 income bracket is the least frequent group with only 78 families (1.4%) belonging to this category.
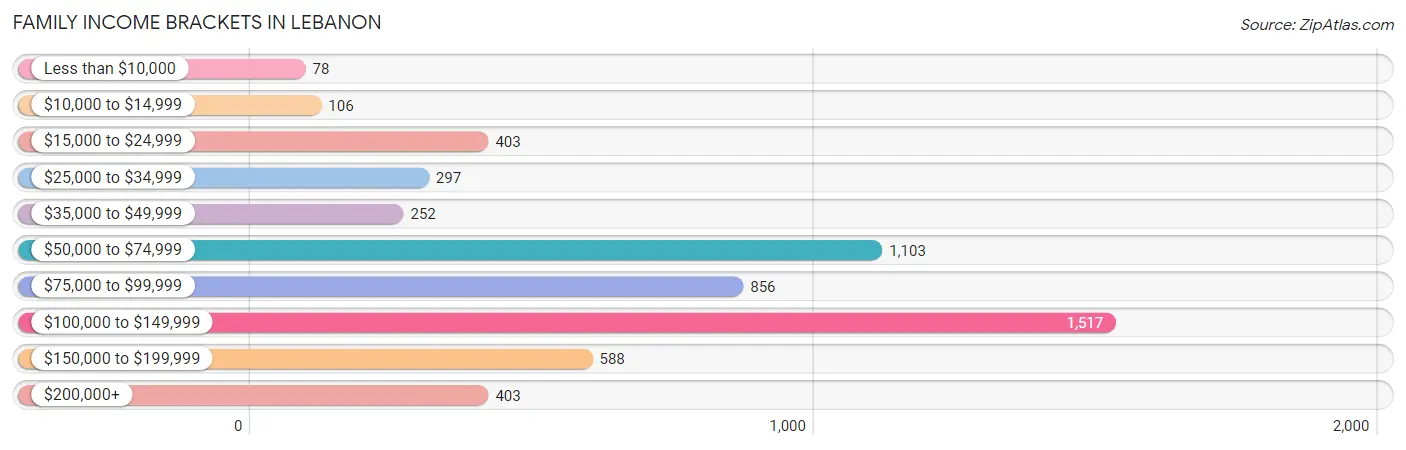
| Income Bracket | # Families | % Families |
| Less than $10,000 | 78 | 1.4% |
| $10,000 to $14,999 | 106 | 1.9% |
| $15,000 to $24,999 | 403 | 7.2% |
| $25,000 to $34,999 | 297 | 5.3% |
| $35,000 to $49,999 | 252 | 4.5% |
| $50,000 to $74,999 | 1,103 | 19.7% |
| $75,000 to $99,999 | 856 | 15.3% |
| $100,000 to $149,999 | 1,517 | 27.1% |
| $150,000 to $199,999 | 588 | 10.5% |
| $200,000+ | 403 | 7.2% |
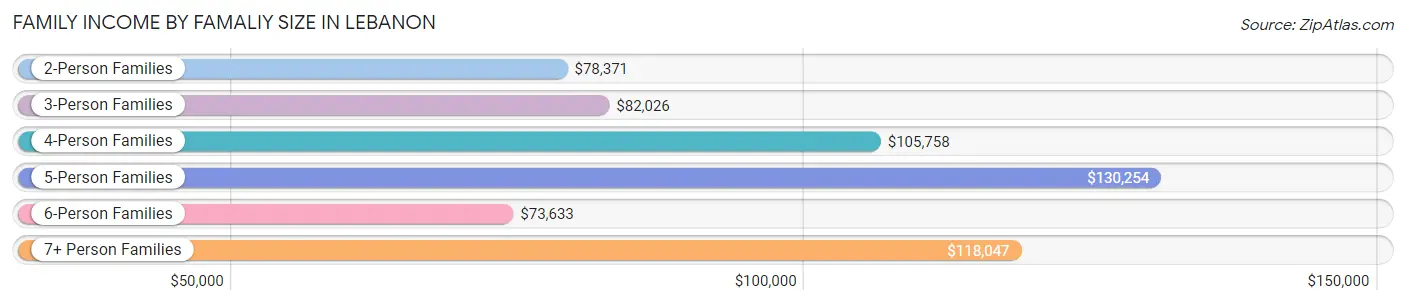
Family Income by Famaliy Size in Lebanon
5-person families (502 | 9.0%) account for the highest median family income in Lebanon with $130,254 per family, while 2-person families (2,851 | 50.9%) have the highest median income of $39,186 per family member.
| Income Bracket | # Families | Median Income |
| 2-Person Families | 2,851 (50.9%) | $78,371 |
| 3-Person Families | 1,034 (18.5%) | $82,026 |
| 4-Person Families | 990 (17.7%) | $105,758 |
| 5-Person Families | 502 (9.0%) | $130,254 |
| 6-Person Families | 155 (2.8%) | $73,633 |
| 7+ Person Families | 66 (1.2%) | $118,047 |
| Total | 5,598 (100.0%) | $89,205 |
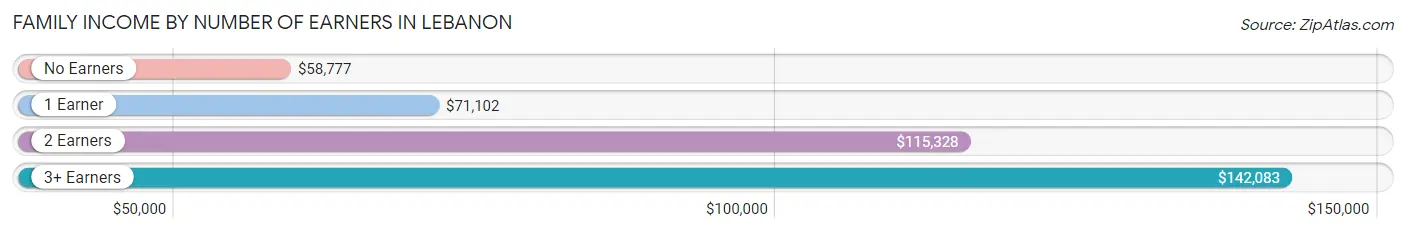
Family Income by Number of Earners in Lebanon
The median family income in Lebanon is $89,205, with families comprising 3+ earners (464) having the highest median family income of $142,083, while families with no earners (1,031) have the lowest median family income of $58,777, accounting for 8.3% and 18.4% of families, respectively.
| Number of Earners | # Families | Median Income |
| No Earners | 1,031 (18.4%) | $58,777 |
| 1 Earner | 1,708 (30.5%) | $71,102 |
| 2 Earners | 2,395 (42.8%) | $115,328 |
| 3+ Earners | 464 (8.3%) | $142,083 |
| Total | 5,598 (100.0%) | $89,205 |
Household Income in Lebanon
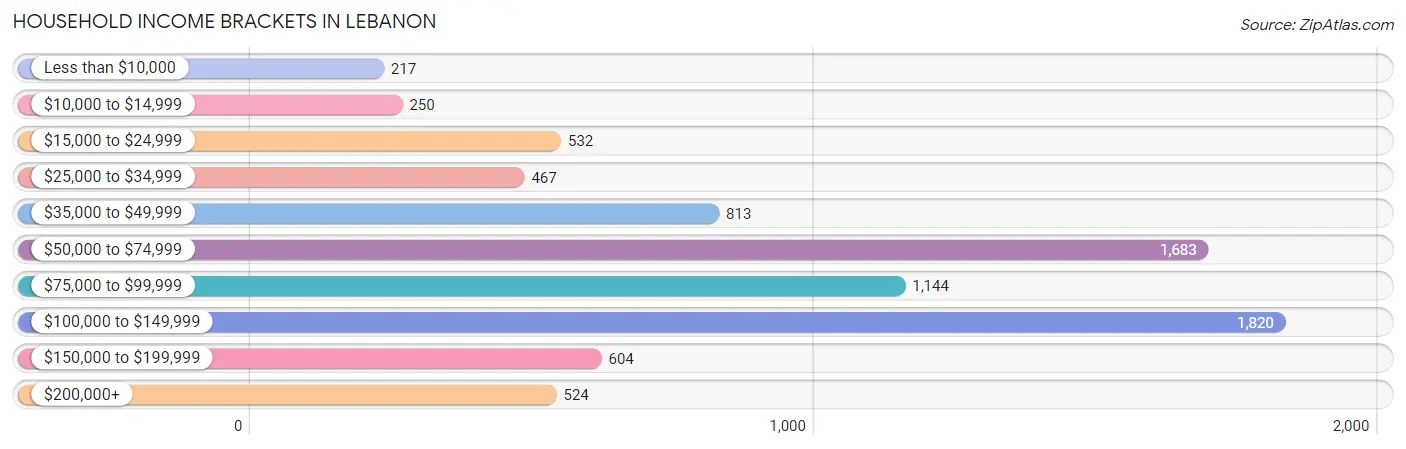
Household Income Brackets in Lebanon
With 1,820 households falling in the category, the $100,000 to $149,999 income range is the most frequent in Lebanon, accounting for 22.6% of all households. In contrast, only 217 households (2.7%) fall into the less than $10,000 income bracket, making it the least populous group.
| Income Bracket | # Households | % Households |
| Less than $10,000 | 217 | 2.7% |
| $10,000 to $14,999 | 250 | 3.1% |
| $15,000 to $24,999 | 532 | 6.6% |
| $25,000 to $34,999 | 467 | 5.8% |
| $35,000 to $49,999 | 813 | 10.1% |
| $50,000 to $74,999 | 1,683 | 20.9% |
| $75,000 to $99,999 | 1,144 | 14.2% |
| $100,000 to $149,999 | 1,820 | 22.6% |
| $150,000 to $199,999 | 604 | 7.5% |
| $200,000+ | 524 | 6.5% |
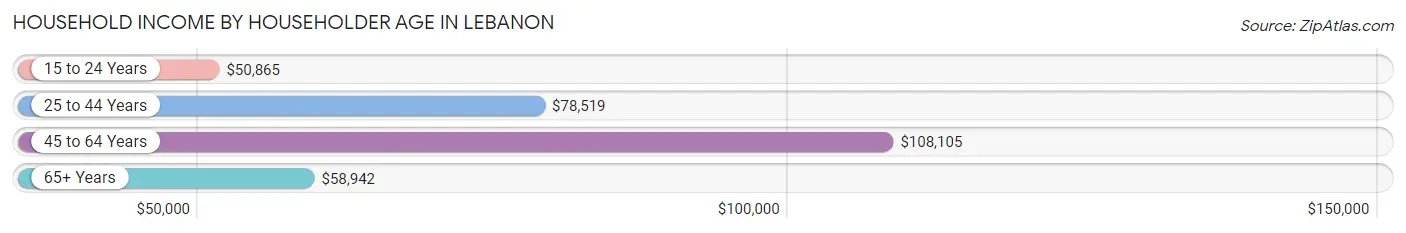
Household Income by Householder Age in Lebanon
The median household income in Lebanon is $75,665, with the highest median household income of $108,105 found in the 45 to 64 years age bracket for the primary householder. A total of 3,026 households (37.6%) fall into this category. Meanwhile, the 15 to 24 years age bracket for the primary householder has the lowest median household income of $50,865, with 318 households (4.0%) in this group.
| Income Bracket | # Households | Median Income |
| 15 to 24 Years | 318 (4.0%) | $50,865 |
| 25 to 44 Years | 2,666 (33.1%) | $78,519 |
| 45 to 64 Years | 3,026 (37.6%) | $108,105 |
| 65+ Years | 2,044 (25.4%) | $58,942 |
| Total | 8,054 (100.0%) | $75,665 |
Poverty in Lebanon
Income Below Poverty by Sex and Age in Lebanon
With 5.5% poverty level for males and 9.1% for females among the residents of Lebanon, 5 year old males and 25 to 34 year old females are the most vulnerable to poverty, with 41 males (48.2%) and 266 females (19.4%) in their respective age groups living below the poverty level.
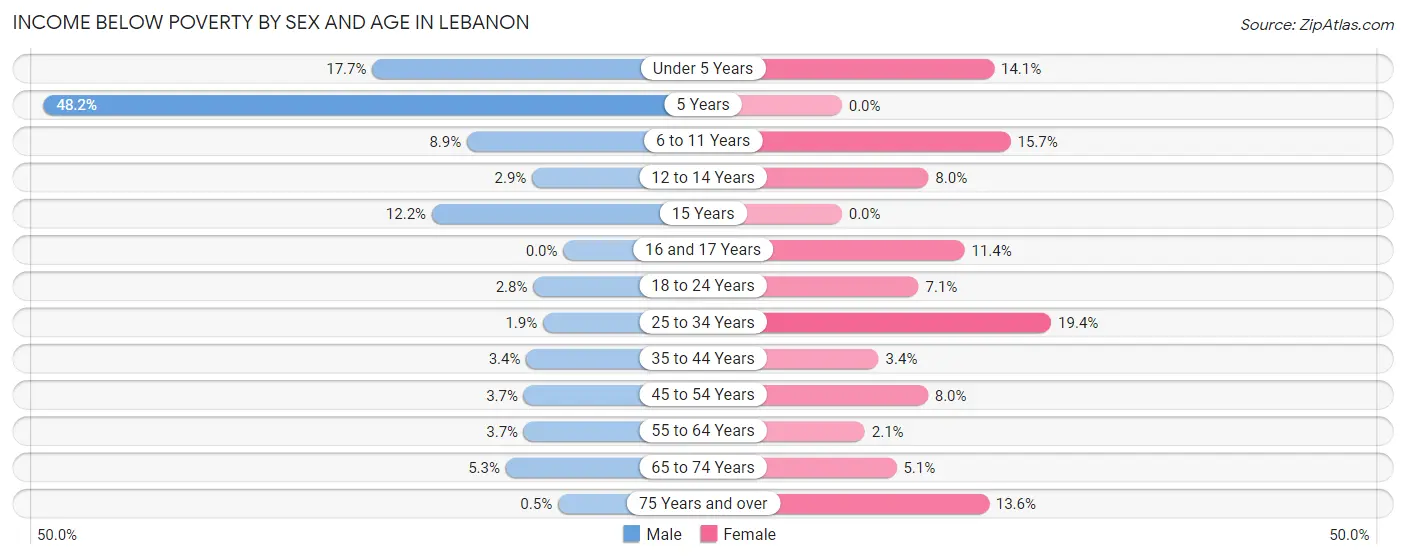
| Age Bracket | Male | Female |
| Under 5 Years | 144 (17.7%) | 88 (14.1%) |
| 5 Years | 41 (48.2%) | 0 (0.0%) |
| 6 to 11 Years | 86 (8.9%) | 145 (15.7%) |
| 12 to 14 Years | 14 (2.9%) | 44 (8.0%) |
| 15 Years | 40 (12.2%) | 0 (0.0%) |
| 16 and 17 Years | 0 (0.0%) | 23 (11.4%) |
| 18 to 24 Years | 19 (2.8%) | 59 (7.1%) |
| 25 to 34 Years | 21 (1.9%) | 266 (19.4%) |
| 35 to 44 Years | 45 (3.4%) | 49 (3.4%) |
| 45 to 54 Years | 50 (3.7%) | 98 (8.0%) |
| 55 to 64 Years | 45 (3.7%) | 28 (2.1%) |
| 65 to 74 Years | 40 (5.3%) | 51 (5.1%) |
| 75 Years and over | 3 (0.5%) | 114 (13.6%) |
| Total | 548 (5.5%) | 965 (9.1%) |
Income Above Poverty by Sex and Age in Lebanon
According to the poverty statistics in Lebanon, males aged 16 and 17 years and females aged 5 years are the age groups that are most secure financially, with 100.0% of males and 100.0% of females in these age groups living above the poverty line.
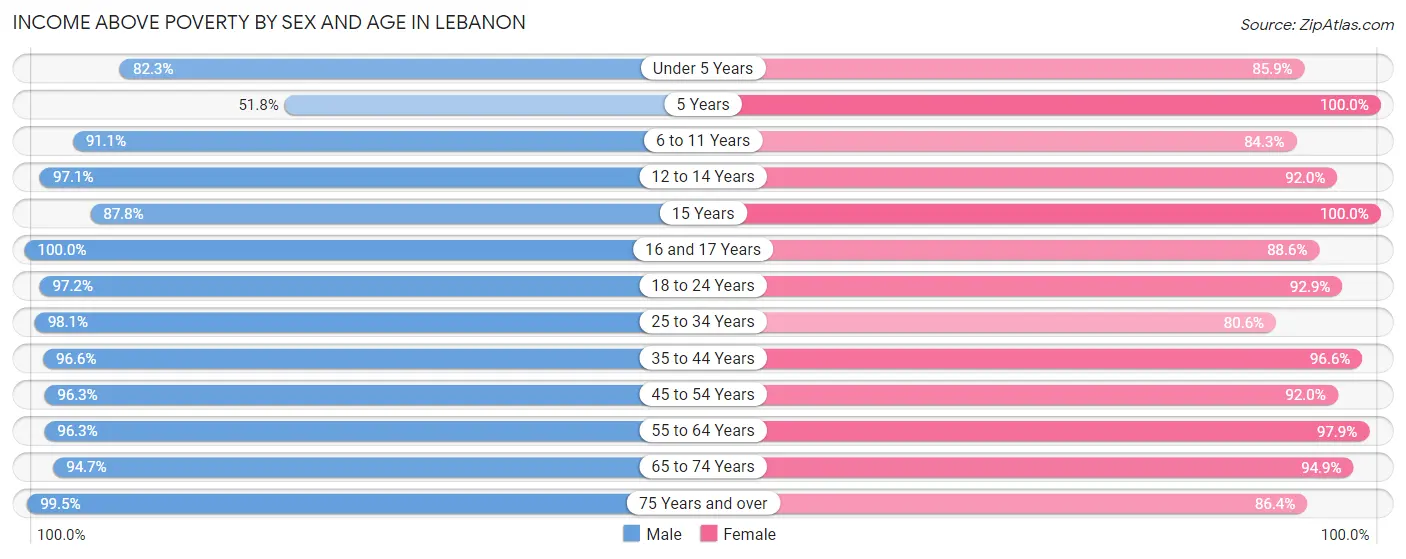
| Age Bracket | Male | Female |
| Under 5 Years | 668 (82.3%) | 535 (85.9%) |
| 5 Years | 44 (51.8%) | 132 (100.0%) |
| 6 to 11 Years | 876 (91.1%) | 781 (84.3%) |
| 12 to 14 Years | 470 (97.1%) | 503 (92.0%) |
| 15 Years | 288 (87.8%) | 114 (100.0%) |
| 16 and 17 Years | 176 (100.0%) | 179 (88.6%) |
| 18 to 24 Years | 661 (97.2%) | 769 (92.9%) |
| 25 to 34 Years | 1,098 (98.1%) | 1,103 (80.6%) |
| 35 to 44 Years | 1,262 (96.6%) | 1,382 (96.6%) |
| 45 to 54 Years | 1,312 (96.3%) | 1,130 (92.0%) |
| 55 to 64 Years | 1,185 (96.3%) | 1,283 (97.9%) |
| 65 to 74 Years | 709 (94.7%) | 955 (94.9%) |
| 75 Years and over | 595 (99.5%) | 722 (86.4%) |
| Total | 9,344 (94.5%) | 9,588 (90.9%) |
Income Below Poverty Among Married-Couple Families in Lebanon
The poverty statistics for married-couple families in Lebanon show that 2.0% or 87 of the total 4,352 families live below the poverty line. Families with 1 or 2 children have the highest poverty rate of 5.1%, comprising of 69 families. On the other hand, families with no children have the lowest poverty rate of 0.0%, which includes 0 families.
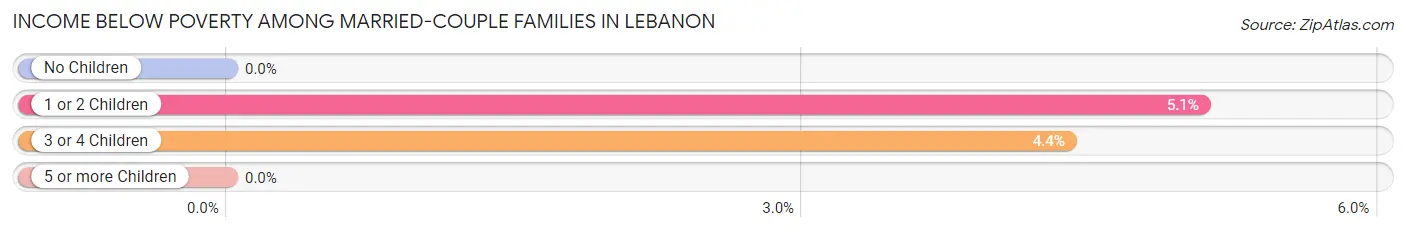
| Children | Above Poverty | Below Poverty |
| No Children | 2,552 (100.0%) | 0 (0.0%) |
| 1 or 2 Children | 1,288 (94.9%) | 69 (5.1%) |
| 3 or 4 Children | 393 (95.6%) | 18 (4.4%) |
| 5 or more Children | 32 (100.0%) | 0 (0.0%) |
| Total | 4,265 (98.0%) | 87 (2.0%) |
Income Below Poverty Among Single-Parent Households in Lebanon
According to the poverty data in Lebanon, 2.3% or 7 single-father households and 21.6% or 202 single-mother households are living below the poverty line. Among single-father households, those with 3 or 4 children have the highest poverty rate, with 7 households (7.9%) experiencing poverty. Likewise, among single-mother households, those with 3 or 4 children have the highest poverty rate, with 39 households (58.2%) falling below the poverty line.
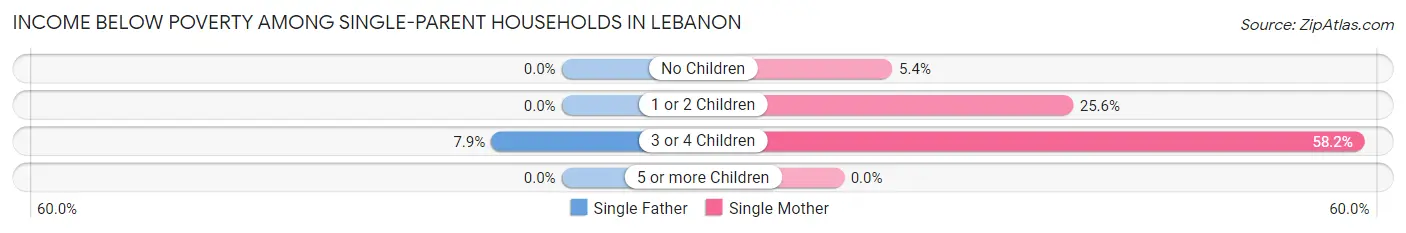
| Children | Single Father | Single Mother |
| No Children | 0 (0.0%) | 16 (5.4%) |
| 1 or 2 Children | 0 (0.0%) | 147 (25.6%) |
| 3 or 4 Children | 7 (7.9%) | 39 (58.2%) |
| 5 or more Children | 0 (0.0%) | 0 (0.0%) |
| Total | 7 (2.3%) | 202 (21.6%) |
Income Below Poverty Among Married-Couple vs Single-Parent Households in Lebanon
The poverty data for Lebanon shows that 87 of the married-couple family households (2.0%) and 209 of the single-parent households (16.8%) are living below the poverty level. Within the married-couple family households, those with 1 or 2 children have the highest poverty rate, with 69 households (5.1%) falling below the poverty line. Among the single-parent households, those with 3 or 4 children have the highest poverty rate, with 46 household (29.5%) living below poverty.
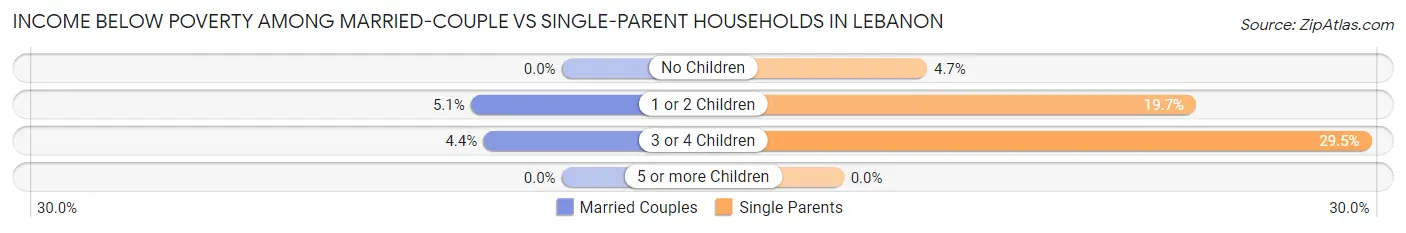
| Children | Married-Couple Families | Single-Parent Households |
| No Children | 0 (0.0%) | 16 (4.7%) |
| 1 or 2 Children | 69 (5.1%) | 147 (19.7%) |
| 3 or 4 Children | 18 (4.4%) | 46 (29.5%) |
| 5 or more Children | 0 (0.0%) | 0 (0.0%) |
| Total | 87 (2.0%) | 209 (16.8%) |
Employment Characteristics in Lebanon
Employment by Class of Employer in Lebanon
Among the 9,893 employed individuals in Lebanon, private company employees (7,472 | 75.5%), local government employees (745 | 7.5%), and not-for-profit organizations (690 | 7.0%) make up the most common classes of employment.
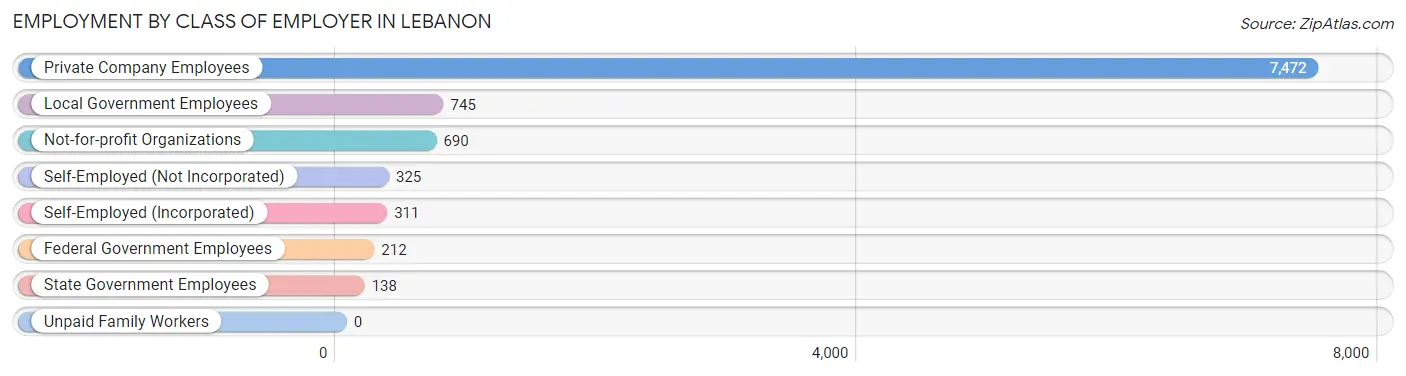
| Employer Class | # Employees | % Employees |
| Private Company Employees | 7,472 | 75.5% |
| Self-Employed (Incorporated) | 311 | 3.1% |
| Self-Employed (Not Incorporated) | 325 | 3.3% |
| Not-for-profit Organizations | 690 | 7.0% |
| Local Government Employees | 745 | 7.5% |
| State Government Employees | 138 | 1.4% |
| Federal Government Employees | 212 | 2.1% |
| Unpaid Family Workers | 0 | 0.0% |
| Total | 9,893 | 100.0% |
Employment Status by Age in Lebanon
According to the labor force statistics for Lebanon, out of the total population over 16 years of age (15,901), 64.7% or 10,288 individuals are in the labor force, with 2.0% or 206 of them unemployed. The age group with the highest labor force participation rate is 45 to 54 years, with 87.0% or 2,277 individuals in the labor force. Within the labor force, the 75 years and over age range has the highest percentage of unemployed individuals, with 49.5% or 51 of them being unemployed.
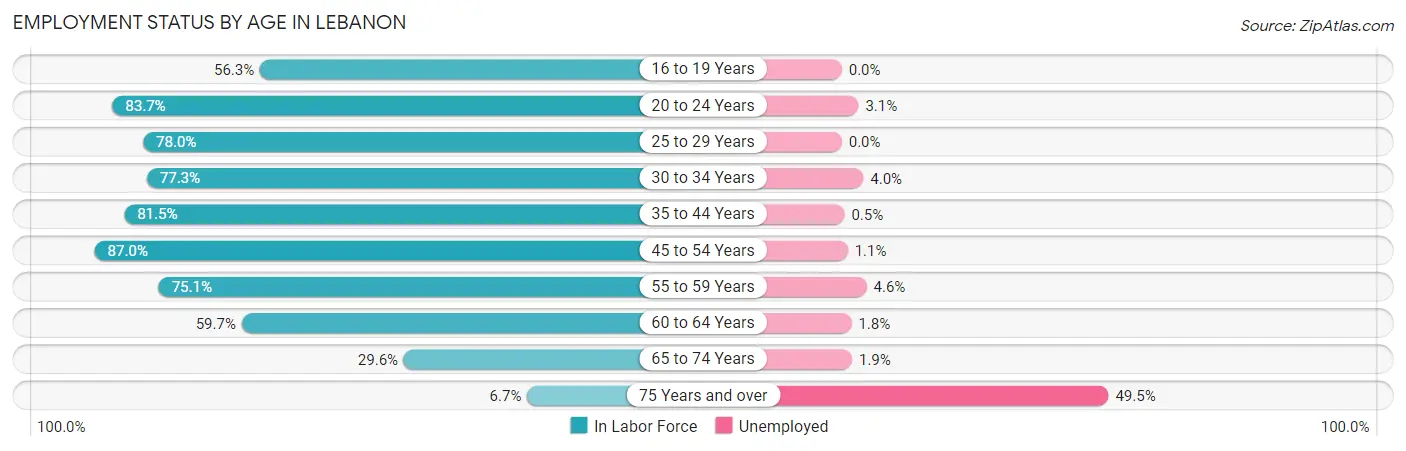
| Age Bracket | In Labor Force | Unemployed |
| 16 to 19 Years | 583 (56.3%) | 0 (0.0%) |
| 20 to 24 Years | 735 (83.7%) | 23 (3.1%) |
| 25 to 29 Years | 1,147 (78.0%) | 0 (0.0%) |
| 30 to 34 Years | 855 (77.3%) | 34 (4.0%) |
| 35 to 44 Years | 2,336 (81.5%) | 12 (0.5%) |
| 45 to 54 Years | 2,277 (87.0%) | 25 (1.1%) |
| 55 to 59 Years | 831 (75.1%) | 38 (4.6%) |
| 60 to 64 Years | 882 (59.7%) | 16 (1.8%) |
| 65 to 74 Years | 535 (29.6%) | 10 (1.9%) |
| 75 Years and over | 103 (6.7%) | 51 (49.5%) |
| Total | 10,288 (64.7%) | 206 (2.0%) |
Employment Status by Educational Attainment in Lebanon
According to labor force statistics for Lebanon, 78.2% of individuals (8,323) out of the total population between 25 and 64 years of age (10,643) are in the labor force, with 1.5% or 125 of them being unemployed. The group with the highest labor force participation rate are those with the educational attainment of bachelor's degree or higher, with 84.1% or 2,892 individuals in the labor force. Within the labor force, individuals with less than high school education have the highest percentage of unemployment, with 4.1% or 12 of them being unemployed.
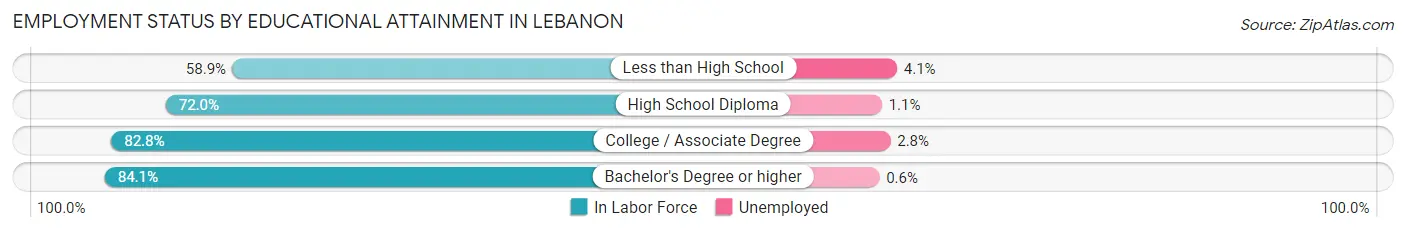
| Educational Attainment | In Labor Force | Unemployed |
| Less than High School | 294 (58.9%) | 20 (4.1%) |
| High School Diploma | 2,728 (72.0%) | 42 (1.1%) |
| College / Associate Degree | 2,414 (82.8%) | 82 (2.8%) |
| Bachelor's Degree or higher | 2,892 (84.1%) | 21 (0.6%) |
| Total | 8,323 (78.2%) | 160 (1.5%) |
Employment Occupations by Sex in Lebanon
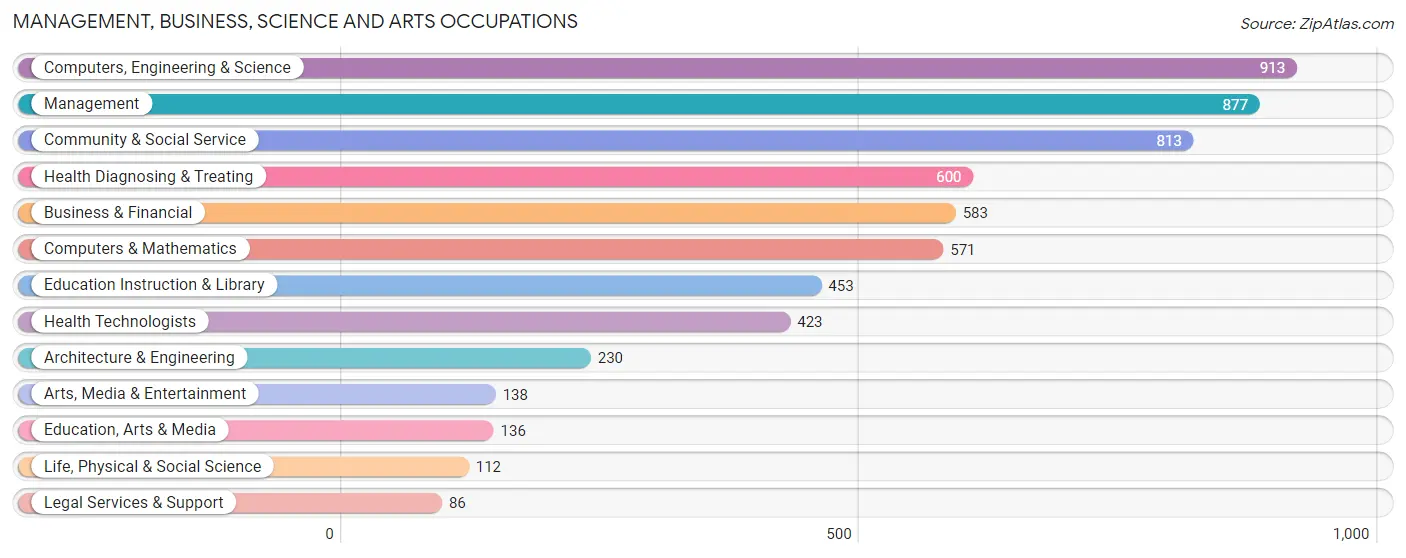
Management, Business, Science and Arts Occupations
The most common Management, Business, Science and Arts occupations in Lebanon are Computers, Engineering & Science (913 | 9.1%), Management (877 | 8.7%), Community & Social Service (813 | 8.1%), Health Diagnosing & Treating (600 | 6.0%), and Business & Financial (583 | 5.8%).
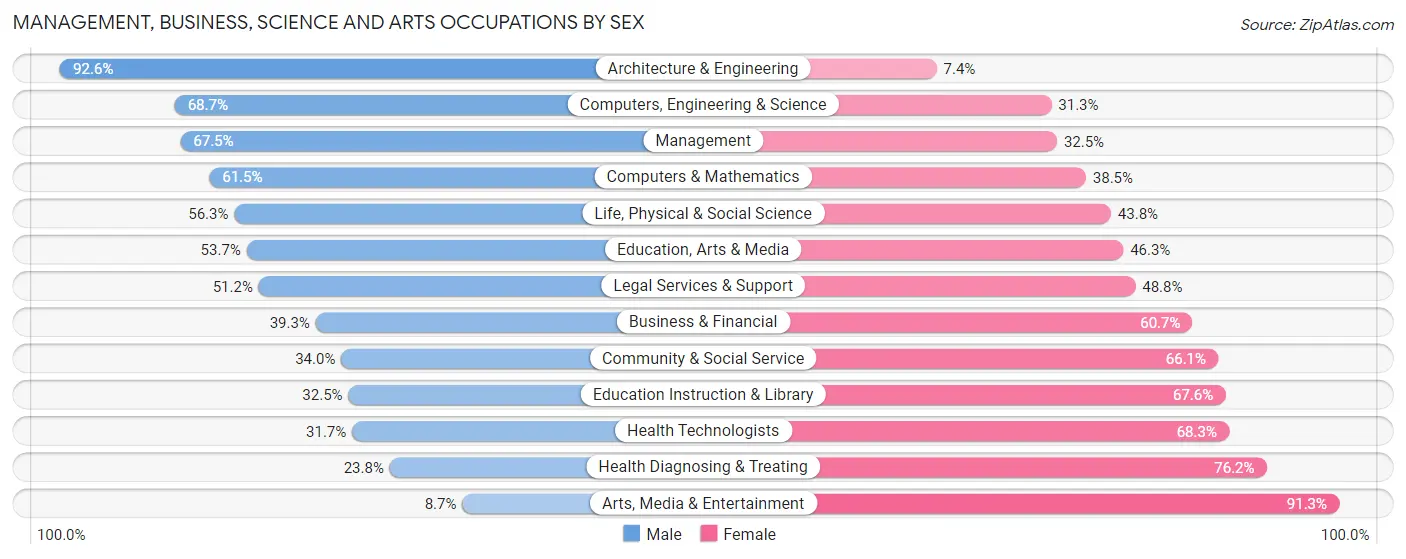
Management, Business, Science and Arts Occupations by Sex
Within the Management, Business, Science and Arts occupations in Lebanon, the most male-oriented occupations are Architecture & Engineering (92.6%), Computers, Engineering & Science (68.7%), and Management (67.5%), while the most female-oriented occupations are Arts, Media & Entertainment (91.3%), Health Diagnosing & Treating (76.2%), and Health Technologists (68.3%).
| Occupation | Male | Female |
| Management | 592 (67.5%) | 285 (32.5%) |
| Business & Financial | 229 (39.3%) | 354 (60.7%) |
| Computers, Engineering & Science | 627 (68.7%) | 286 (31.3%) |
| Computers & Mathematics | 351 (61.5%) | 220 (38.5%) |
| Architecture & Engineering | 213 (92.6%) | 17 (7.4%) |
| Life, Physical & Social Science | 63 (56.2%) | 49 (43.8%) |
| Community & Social Service | 276 (34.0%) | 537 (66.0%) |
| Education, Arts & Media | 73 (53.7%) | 63 (46.3%) |
| Legal Services & Support | 44 (51.2%) | 42 (48.8%) |
| Education Instruction & Library | 147 (32.5%) | 306 (67.5%) |
| Arts, Media & Entertainment | 12 (8.7%) | 126 (91.3%) |
| Health Diagnosing & Treating | 143 (23.8%) | 457 (76.2%) |
| Health Technologists | 134 (31.7%) | 289 (68.3%) |
| Total (Category) | 1,867 (49.3%) | 1,919 (50.7%) |
| Total (Overall) | 5,172 (51.3%) | 4,901 (48.6%) |
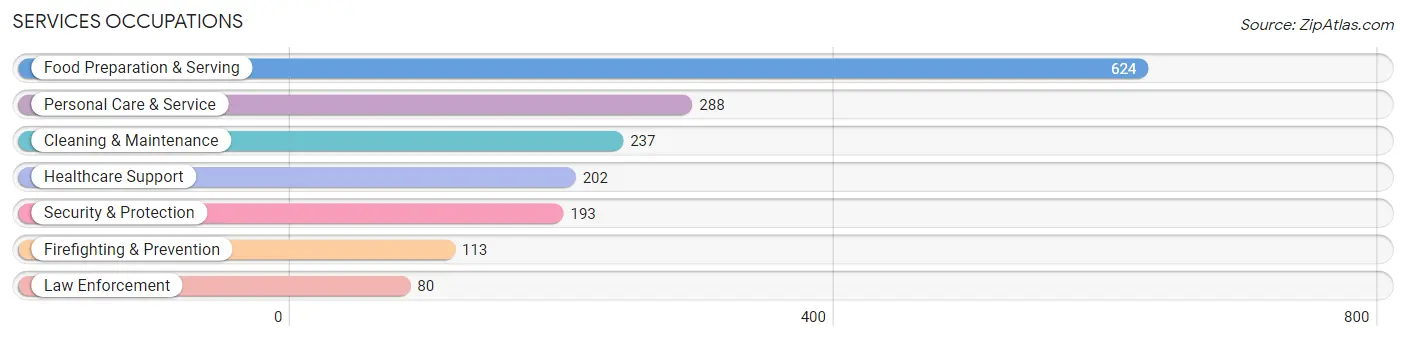
Services Occupations
The most common Services occupations in Lebanon are Food Preparation & Serving (624 | 6.2%), Personal Care & Service (288 | 2.9%), Cleaning & Maintenance (237 | 2.4%), Healthcare Support (202 | 2.0%), and Security & Protection (193 | 1.9%).
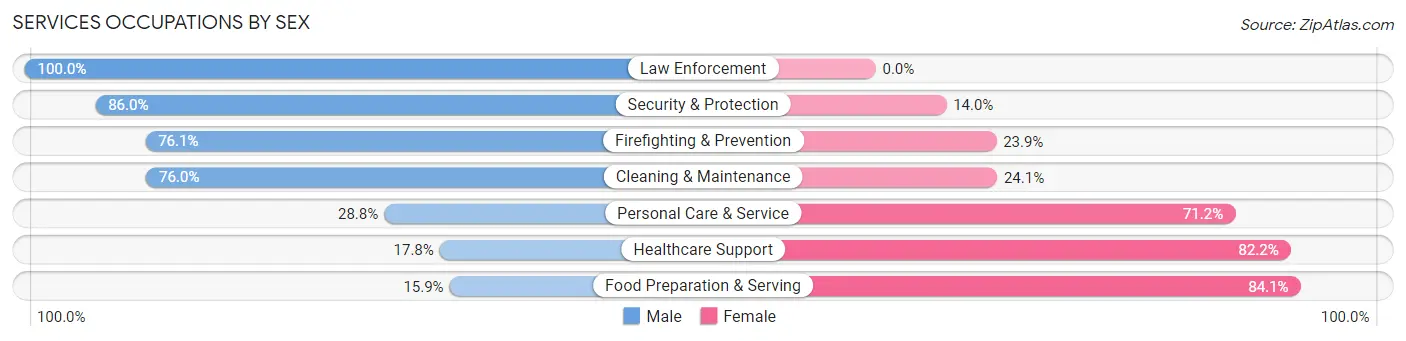
Services Occupations by Sex
Within the Services occupations in Lebanon, the most male-oriented occupations are Law Enforcement (100.0%), Security & Protection (86.0%), and Firefighting & Prevention (76.1%), while the most female-oriented occupations are Food Preparation & Serving (84.1%), Healthcare Support (82.2%), and Personal Care & Service (71.2%).
| Occupation | Male | Female |
| Healthcare Support | 36 (17.8%) | 166 (82.2%) |
| Security & Protection | 166 (86.0%) | 27 (14.0%) |
| Firefighting & Prevention | 86 (76.1%) | 27 (23.9%) |
| Law Enforcement | 80 (100.0%) | 0 (0.0%) |
| Food Preparation & Serving | 99 (15.9%) | 525 (84.1%) |
| Cleaning & Maintenance | 180 (75.9%) | 57 (24.0%) |
| Personal Care & Service | 83 (28.8%) | 205 (71.2%) |
| Total (Category) | 564 (36.5%) | 980 (63.5%) |
| Total (Overall) | 5,172 (51.3%) | 4,901 (48.6%) |
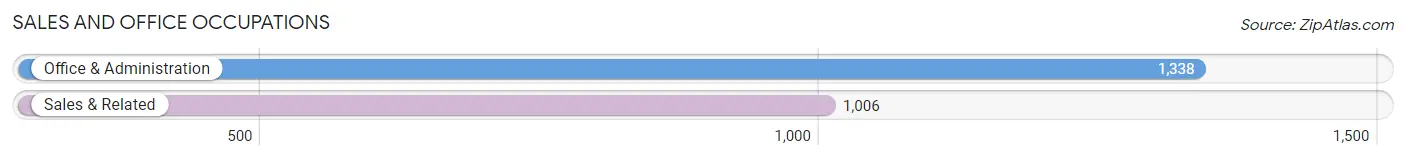
Sales and Office Occupations
The most common Sales and Office occupations in Lebanon are Office & Administration (1,338 | 13.3%), and Sales & Related (1,006 | 10.0%).
Sales and Office Occupations by Sex
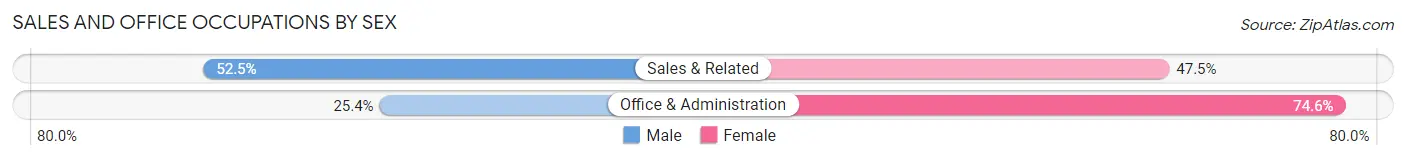
| Occupation | Male | Female |
| Sales & Related | 528 (52.5%) | 478 (47.5%) |
| Office & Administration | 340 (25.4%) | 998 (74.6%) |
| Total (Category) | 868 (37.0%) | 1,476 (63.0%) |
| Total (Overall) | 5,172 (51.3%) | 4,901 (48.6%) |
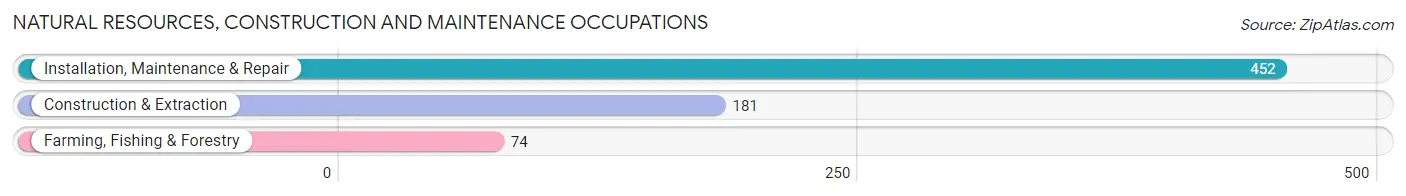
Natural Resources, Construction and Maintenance Occupations
The most common Natural Resources, Construction and Maintenance occupations in Lebanon are Installation, Maintenance & Repair (452 | 4.5%), Construction & Extraction (181 | 1.8%), and Farming, Fishing & Forestry (74 | 0.7%).
Natural Resources, Construction and Maintenance Occupations by Sex
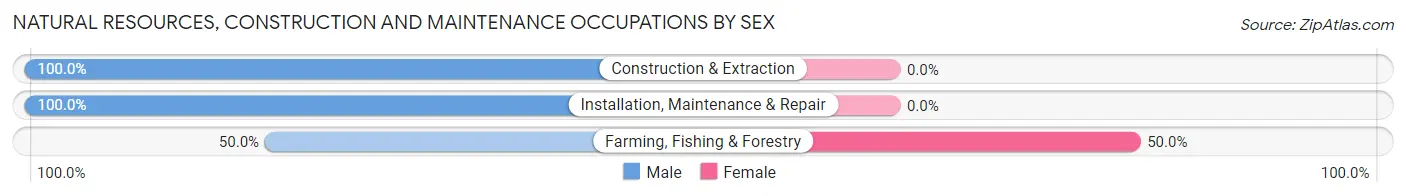
| Occupation | Male | Female |
| Farming, Fishing & Forestry | 37 (50.0%) | 37 (50.0%) |
| Construction & Extraction | 181 (100.0%) | 0 (0.0%) |
| Installation, Maintenance & Repair | 452 (100.0%) | 0 (0.0%) |
| Total (Category) | 670 (94.8%) | 37 (5.2%) |
| Total (Overall) | 5,172 (51.3%) | 4,901 (48.6%) |
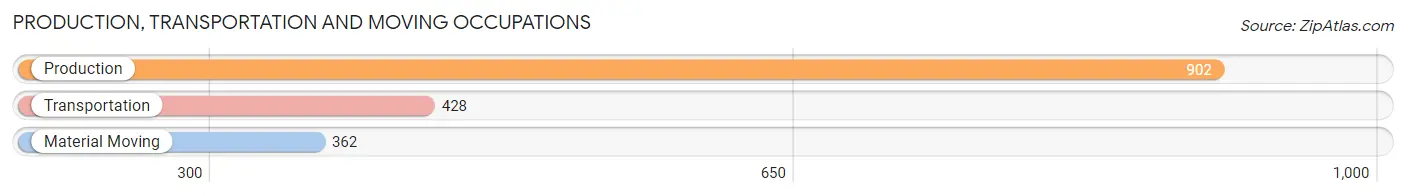
Production, Transportation and Moving Occupations
The most common Production, Transportation and Moving occupations in Lebanon are Production (902 | 8.9%), Transportation (428 | 4.3%), and Material Moving (362 | 3.6%).
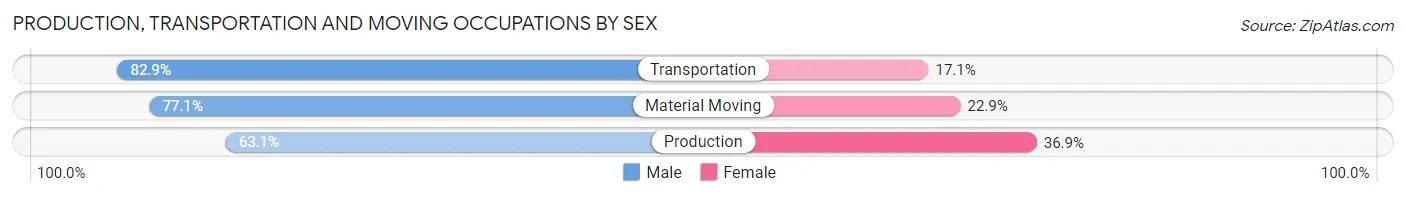
Production, Transportation and Moving Occupations by Sex
| Occupation | Male | Female |
| Production | 569 (63.1%) | 333 (36.9%) |
| Transportation | 355 (82.9%) | 73 (17.1%) |
| Material Moving | 279 (77.1%) | 83 (22.9%) |
| Total (Category) | 1,203 (71.1%) | 489 (28.9%) |
| Total (Overall) | 5,172 (51.3%) | 4,901 (48.6%) |
Employment Industries by Sex in Lebanon
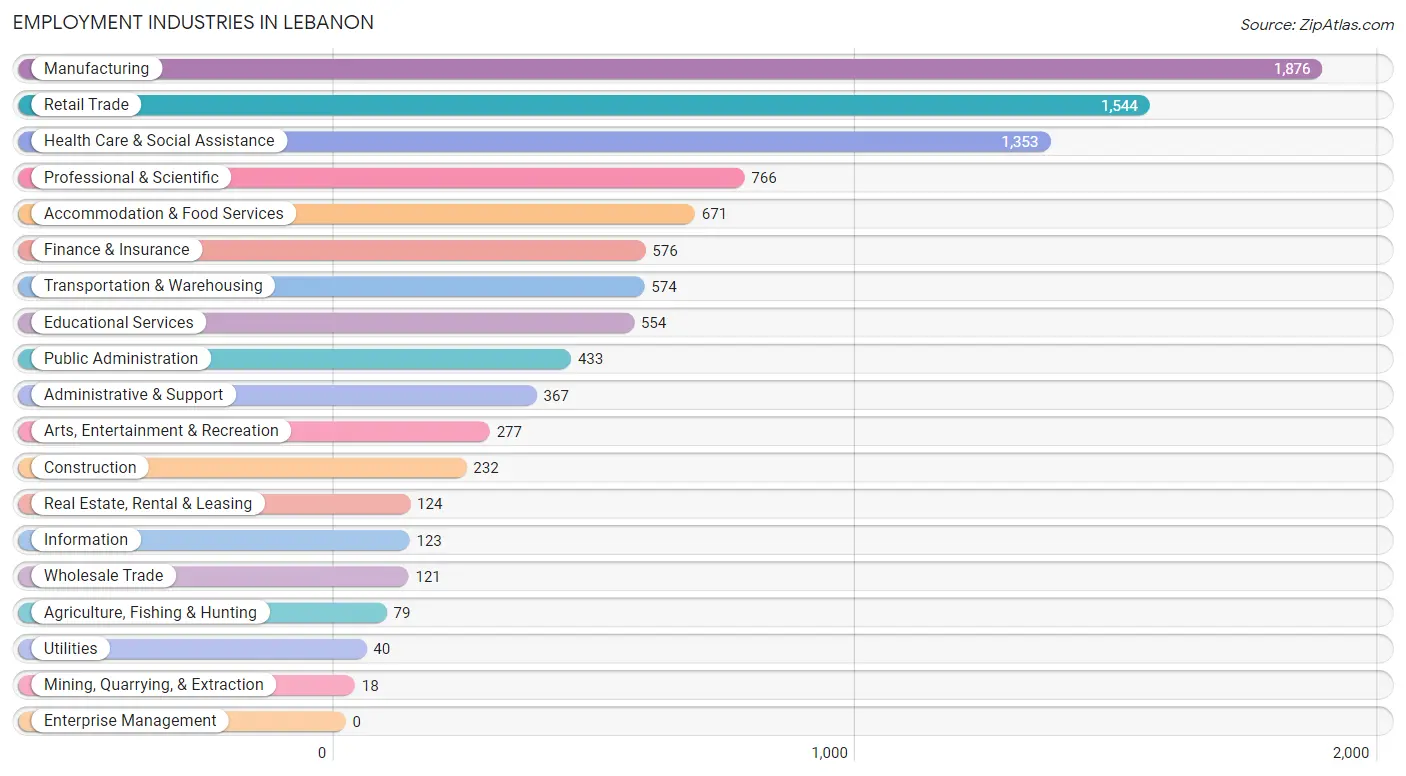
Employment Industries in Lebanon
The major employment industries in Lebanon include Manufacturing (1,876 | 18.6%), Retail Trade (1,544 | 15.3%), Health Care & Social Assistance (1,353 | 13.4%), Professional & Scientific (766 | 7.6%), and Accommodation & Food Services (671 | 6.7%).
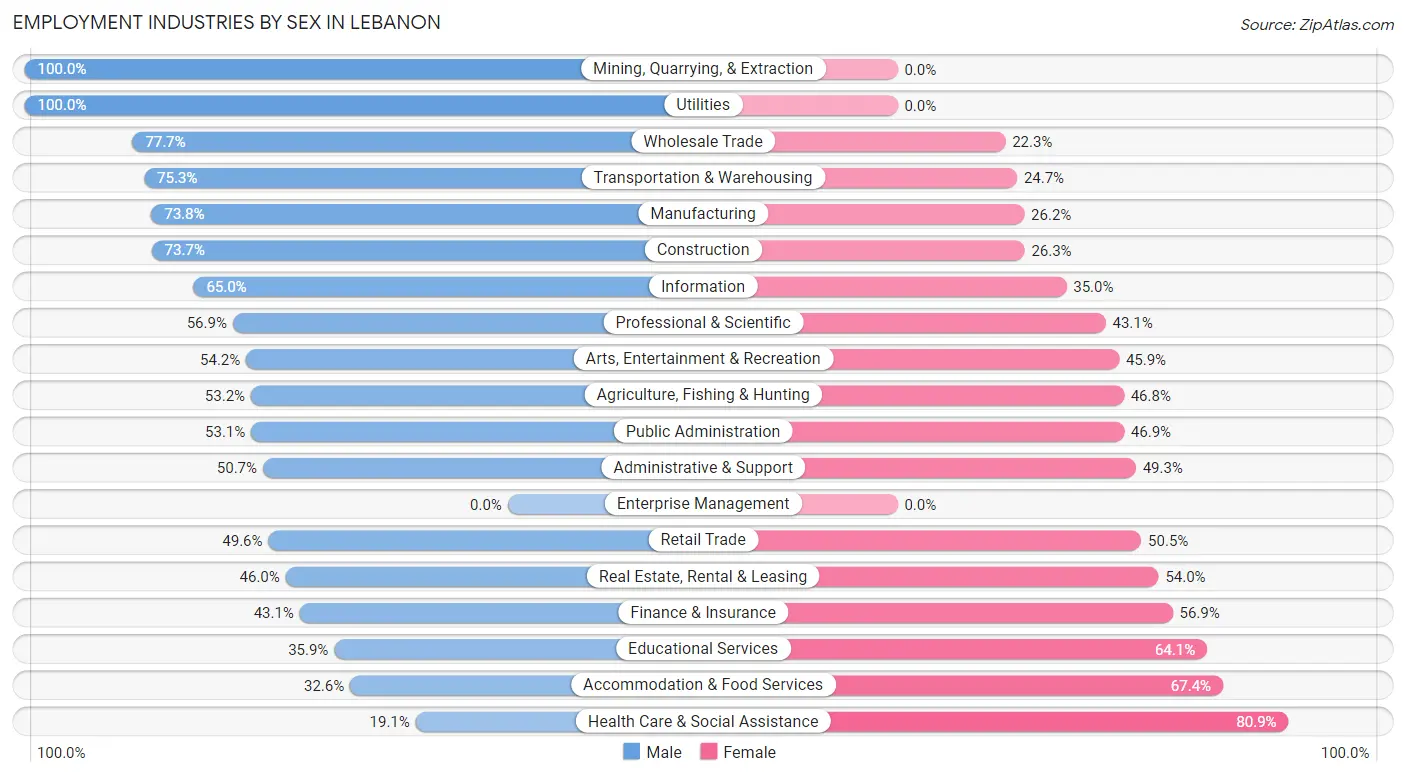
Employment Industries by Sex in Lebanon
The Lebanon industries that see more men than women are Mining, Quarrying, & Extraction (100.0%), Utilities (100.0%), and Wholesale Trade (77.7%), whereas the industries that tend to have a higher number of women are Health Care & Social Assistance (80.9%), Accommodation & Food Services (67.4%), and Educational Services (64.1%).
| Industry | Male | Female |
| Agriculture, Fishing & Hunting | 42 (53.2%) | 37 (46.8%) |
| Mining, Quarrying, & Extraction | 18 (100.0%) | 0 (0.0%) |
| Construction | 171 (73.7%) | 61 (26.3%) |
| Manufacturing | 1,384 (73.8%) | 492 (26.2%) |
| Wholesale Trade | 94 (77.7%) | 27 (22.3%) |
| Retail Trade | 765 (49.5%) | 779 (50.4%) |
| Transportation & Warehousing | 432 (75.3%) | 142 (24.7%) |
| Utilities | 40 (100.0%) | 0 (0.0%) |
| Information | 80 (65.0%) | 43 (35.0%) |
| Finance & Insurance | 248 (43.1%) | 328 (56.9%) |
| Real Estate, Rental & Leasing | 57 (46.0%) | 67 (54.0%) |
| Professional & Scientific | 436 (56.9%) | 330 (43.1%) |
| Enterprise Management | 0 (0.0%) | 0 (0.0%) |
| Administrative & Support | 186 (50.7%) | 181 (49.3%) |
| Educational Services | 199 (35.9%) | 355 (64.1%) |
| Health Care & Social Assistance | 258 (19.1%) | 1,095 (80.9%) |
| Arts, Entertainment & Recreation | 150 (54.1%) | 127 (45.9%) |
| Accommodation & Food Services | 219 (32.6%) | 452 (67.4%) |
| Public Administration | 230 (53.1%) | 203 (46.9%) |
| Total | 5,172 (51.3%) | 4,901 (48.6%) |
Education in Lebanon
School Enrollment in Lebanon
The most common levels of schooling among the 4,698 students in Lebanon are elementary school (1,356 | 28.9%), high school (1,182 | 25.2%), and middle school (1,170 | 24.9%).
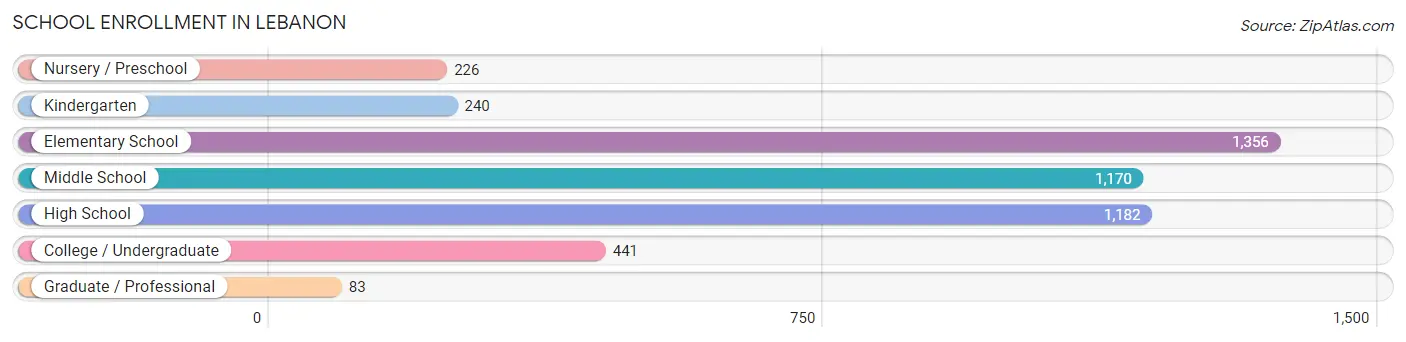
| School Level | # Students | % Students |
| Nursery / Preschool | 226 | 4.8% |
| Kindergarten | 240 | 5.1% |
| Elementary School | 1,356 | 28.9% |
| Middle School | 1,170 | 24.9% |
| High School | 1,182 | 25.2% |
| College / Undergraduate | 441 | 9.4% |
| Graduate / Professional | 83 | 1.8% |
| Total | 4,698 | 100.0% |
School Enrollment by Age by Funding Source in Lebanon
Out of a total of 4,698 students who are enrolled in schools in Lebanon, 888 (18.9%) attend a private institution, while the remaining 3,810 (81.1%) are enrolled in public schools. The age group of 3 to 4 year olds has the highest likelihood of being enrolled in private schools, with 130 (76.9% in the age bracket) enrolled. Conversely, the age group of 25 to 34 year olds has the lowest likelihood of being enrolled in a private school, with 101 (100.0% in the age bracket) attending a public institution.
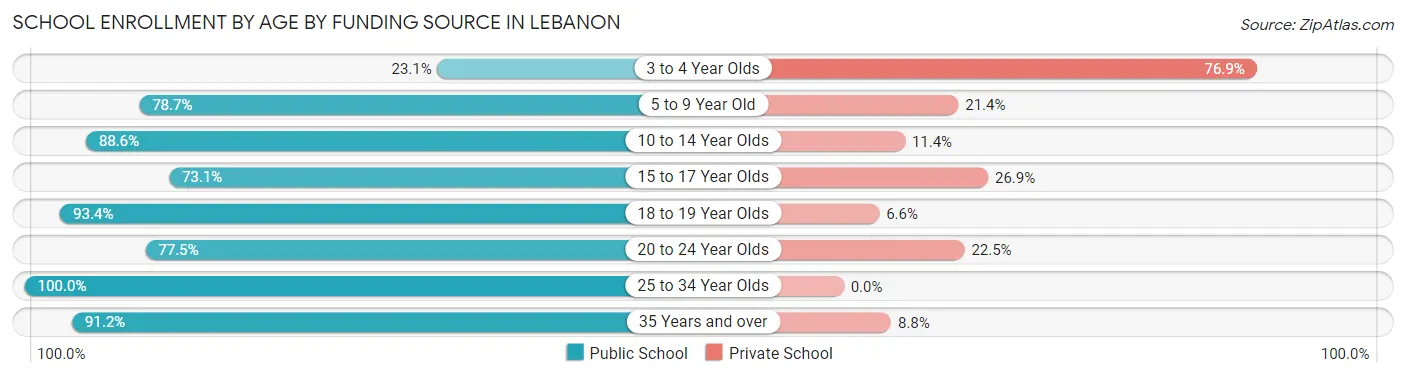
| Age Bracket | Public School | Private School |
| 3 to 4 Year Olds | 39 (23.1%) | 130 (76.9%) |
| 5 to 9 Year Old | 1,116 (78.6%) | 303 (21.3%) |
| 10 to 14 Year Olds | 1,297 (88.6%) | 167 (11.4%) |
| 15 to 17 Year Olds | 571 (73.1%) | 210 (26.9%) |
| 18 to 19 Year Olds | 437 (93.4%) | 31 (6.6%) |
| 20 to 24 Year Olds | 124 (77.5%) | 36 (22.5%) |
| 25 to 34 Year Olds | 101 (100.0%) | 0 (0.0%) |
| 35 Years and over | 124 (91.2%) | 12 (8.8%) |
| Total | 3,810 (81.1%) | 888 (18.9%) |
Educational Attainment by Field of Study in Lebanon
Business (1,013 | 23.0%), education (547 | 12.4%), engineering (485 | 11.0%), science & technology (451 | 10.2%), and arts & humanities (257 | 5.8%) are the most common fields of study among 4,414 individuals in Lebanon who have obtained a bachelor's degree or higher.
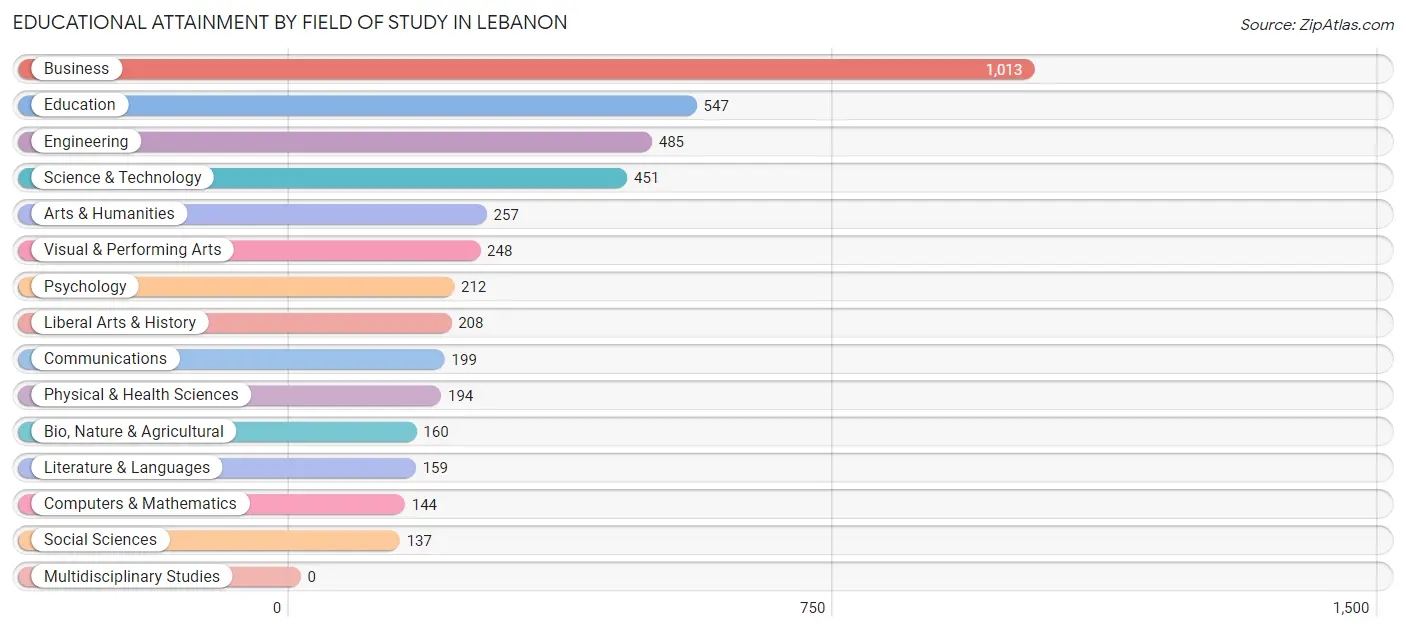
| Field of Study | # Graduates | % Graduates |
| Computers & Mathematics | 144 | 3.3% |
| Bio, Nature & Agricultural | 160 | 3.6% |
| Physical & Health Sciences | 194 | 4.4% |
| Psychology | 212 | 4.8% |
| Social Sciences | 137 | 3.1% |
| Engineering | 485 | 11.0% |
| Multidisciplinary Studies | 0 | 0.0% |
| Science & Technology | 451 | 10.2% |
| Business | 1,013 | 23.0% |
| Education | 547 | 12.4% |
| Literature & Languages | 159 | 3.6% |
| Liberal Arts & History | 208 | 4.7% |
| Visual & Performing Arts | 248 | 5.6% |
| Communications | 199 | 4.5% |
| Arts & Humanities | 257 | 5.8% |
| Total | 4,414 | 100.0% |
Transportation & Commute in Lebanon
Vehicle Availability by Sex in Lebanon
The most prevalent vehicle ownership categories in Lebanon are males with 2 vehicles (2,762, accounting for 53.9%) and females with 2 vehicles (2,406, making up 57.9%).
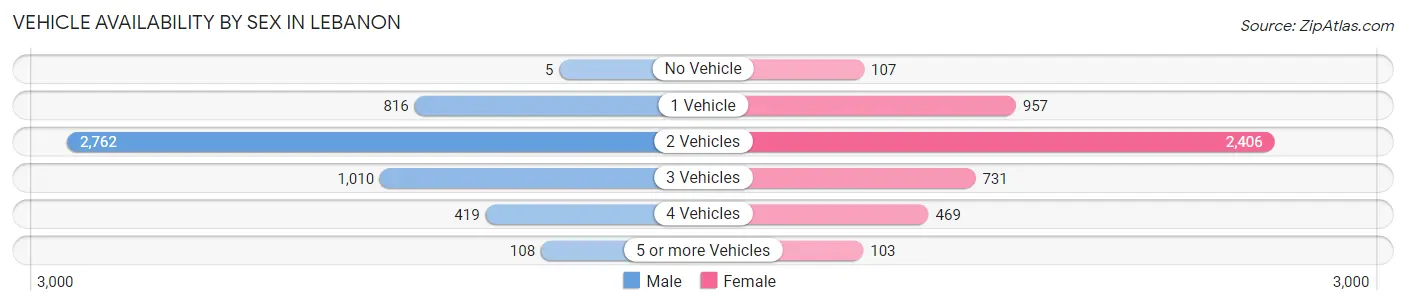
| Vehicles Available | Male | Female |
| No Vehicle | 5 (0.1%) | 107 (2.2%) |
| 1 Vehicle | 816 (15.9%) | 957 (20.1%) |
| 2 Vehicles | 2,762 (53.9%) | 2,406 (50.4%) |
| 3 Vehicles | 1,010 (19.7%) | 731 (15.3%) |
| 4 Vehicles | 419 (8.2%) | 469 (9.8%) |
| 5 or more Vehicles | 108 (2.1%) | 103 (2.2%) |
| Total | 5,120 (100.0%) | 4,773 (100.0%) |
Commute Time in Lebanon
The most frequently occuring commute durations in Lebanon are 30 to 34 minutes (1,549 commuters, 17.2%), 5 to 9 minutes (1,424 commuters, 15.8%), and 10 to 14 minutes (1,208 commuters, 13.4%).
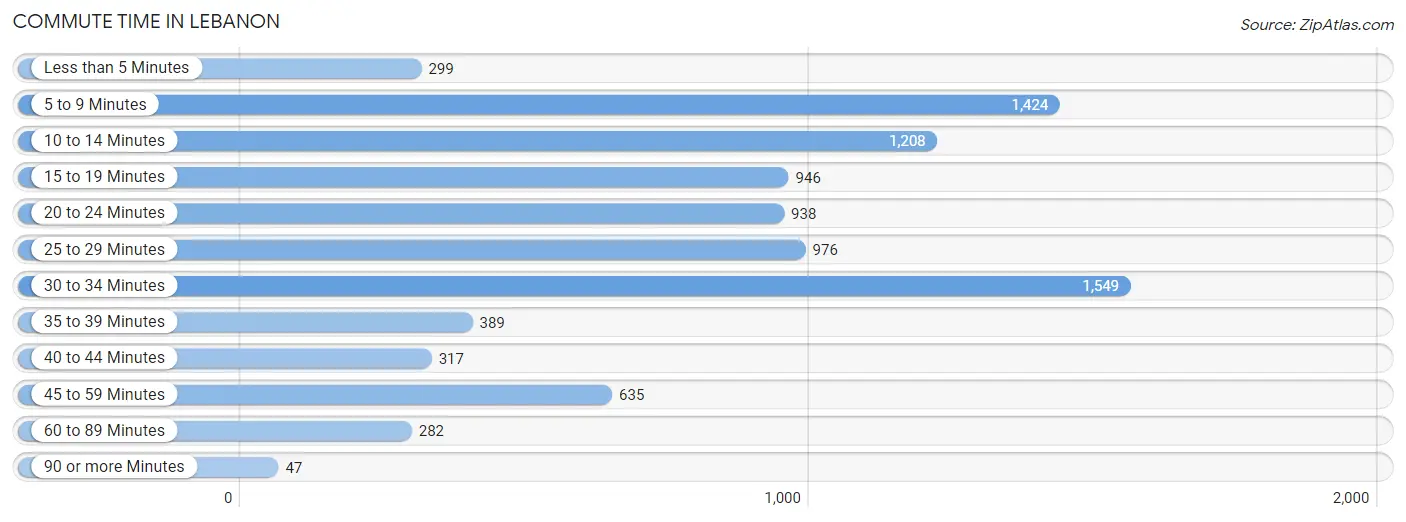
| Commute Time | # Commuters | % Commuters |
| Less than 5 Minutes | 299 | 3.3% |
| 5 to 9 Minutes | 1,424 | 15.8% |
| 10 to 14 Minutes | 1,208 | 13.4% |
| 15 to 19 Minutes | 946 | 10.5% |
| 20 to 24 Minutes | 938 | 10.4% |
| 25 to 29 Minutes | 976 | 10.8% |
| 30 to 34 Minutes | 1,549 | 17.2% |
| 35 to 39 Minutes | 389 | 4.3% |
| 40 to 44 Minutes | 317 | 3.5% |
| 45 to 59 Minutes | 635 | 7.0% |
| 60 to 89 Minutes | 282 | 3.1% |
| 90 or more Minutes | 47 | 0.5% |
Commute Time by Sex in Lebanon
The most common commute times in Lebanon are 30 to 34 minutes (820 commuters, 17.6%) for males and 10 to 14 minutes (763 commuters, 17.5%) for females.
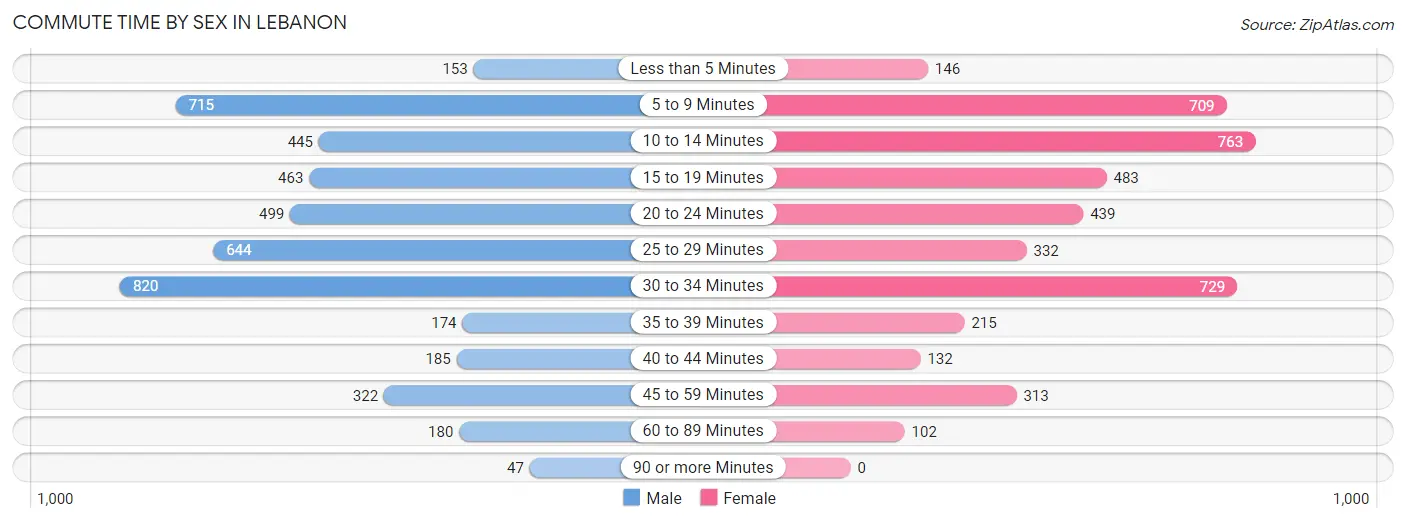
| Commute Time | Male | Female |
| Less than 5 Minutes | 153 (3.3%) | 146 (3.4%) |
| 5 to 9 Minutes | 715 (15.4%) | 709 (16.3%) |
| 10 to 14 Minutes | 445 (9.6%) | 763 (17.5%) |
| 15 to 19 Minutes | 463 (10.0%) | 483 (11.1%) |
| 20 to 24 Minutes | 499 (10.7%) | 439 (10.1%) |
| 25 to 29 Minutes | 644 (13.9%) | 332 (7.6%) |
| 30 to 34 Minutes | 820 (17.6%) | 729 (16.7%) |
| 35 to 39 Minutes | 174 (3.7%) | 215 (4.9%) |
| 40 to 44 Minutes | 185 (4.0%) | 132 (3.0%) |
| 45 to 59 Minutes | 322 (6.9%) | 313 (7.2%) |
| 60 to 89 Minutes | 180 (3.9%) | 102 (2.3%) |
| 90 or more Minutes | 47 (1.0%) | 0 (0.0%) |
Time of Departure to Work by Sex in Lebanon
The most frequent times of departure to work in Lebanon are 7:00 AM to 7:29 AM (732, 15.8%) for males and 6:30 AM to 6:59 AM (578, 13.3%) for females.
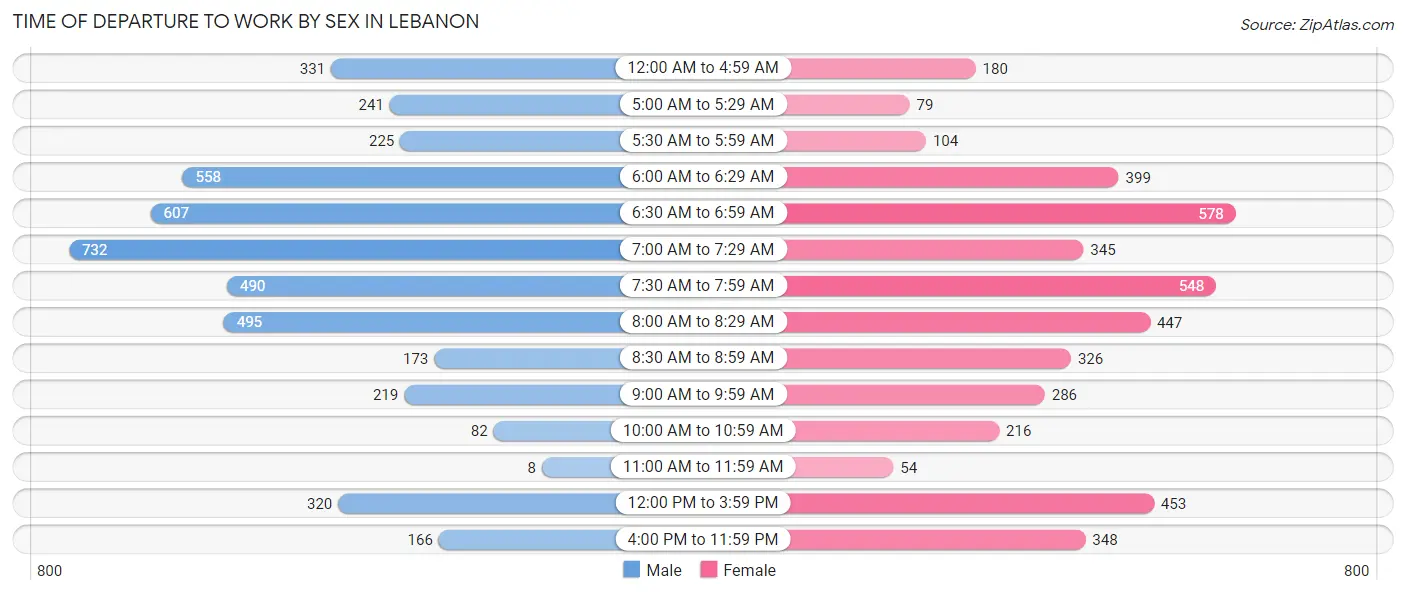
| Time of Departure | Male | Female |
| 12:00 AM to 4:59 AM | 331 (7.1%) | 180 (4.1%) |
| 5:00 AM to 5:29 AM | 241 (5.2%) | 79 (1.8%) |
| 5:30 AM to 5:59 AM | 225 (4.8%) | 104 (2.4%) |
| 6:00 AM to 6:29 AM | 558 (12.0%) | 399 (9.1%) |
| 6:30 AM to 6:59 AM | 607 (13.1%) | 578 (13.3%) |
| 7:00 AM to 7:29 AM | 732 (15.8%) | 345 (7.9%) |
| 7:30 AM to 7:59 AM | 490 (10.5%) | 548 (12.6%) |
| 8:00 AM to 8:29 AM | 495 (10.6%) | 447 (10.2%) |
| 8:30 AM to 8:59 AM | 173 (3.7%) | 326 (7.5%) |
| 9:00 AM to 9:59 AM | 219 (4.7%) | 286 (6.6%) |
| 10:00 AM to 10:59 AM | 82 (1.8%) | 216 (5.0%) |
| 11:00 AM to 11:59 AM | 8 (0.2%) | 54 (1.2%) |
| 12:00 PM to 3:59 PM | 320 (6.9%) | 453 (10.4%) |
| 4:00 PM to 11:59 PM | 166 (3.6%) | 348 (8.0%) |
| Total | 4,647 (100.0%) | 4,363 (100.0%) |
Housing Occupancy in Lebanon
Occupancy by Ownership in Lebanon
Of the total 8,054 dwellings in Lebanon, owner-occupied units account for 4,878 (60.6%), while renter-occupied units make up 3,176 (39.4%).
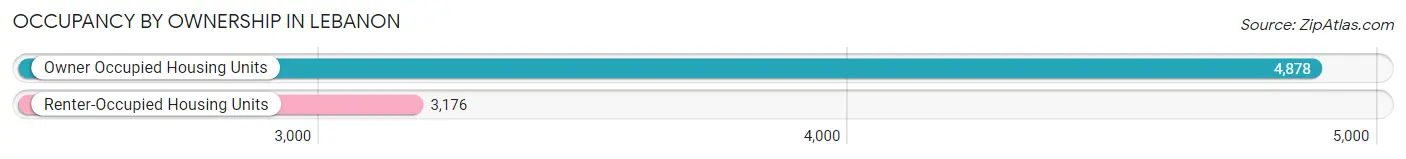
| Occupancy | # Housing Units | % Housing Units |
| Owner Occupied Housing Units | 4,878 | 60.6% |
| Renter-Occupied Housing Units | 3,176 | 39.4% |
| Total Occupied Housing Units | 8,054 | 100.0% |
Occupancy by Household Size in Lebanon
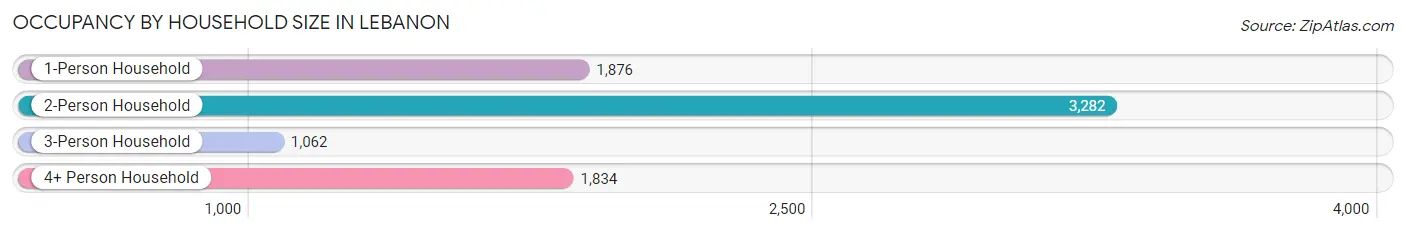
| Household Size | # Housing Units | % Housing Units |
| 1-Person Household | 1,876 | 23.3% |
| 2-Person Household | 3,282 | 40.7% |
| 3-Person Household | 1,062 | 13.2% |
| 4+ Person Household | 1,834 | 22.8% |
| Total Housing Units | 8,054 | 100.0% |
Occupancy by Ownership by Household Size in Lebanon
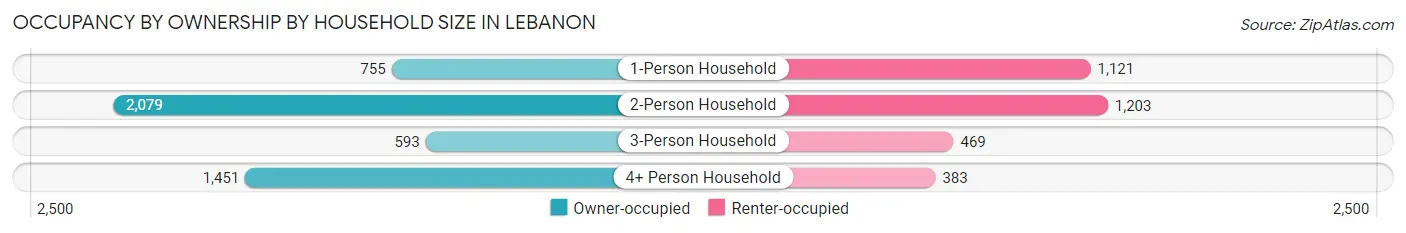
| Household Size | Owner-occupied | Renter-occupied |
| 1-Person Household | 755 (40.3%) | 1,121 (59.8%) |
| 2-Person Household | 2,079 (63.3%) | 1,203 (36.6%) |
| 3-Person Household | 593 (55.8%) | 469 (44.2%) |
| 4+ Person Household | 1,451 (79.1%) | 383 (20.9%) |
| Total Housing Units | 4,878 (60.6%) | 3,176 (39.4%) |
Occupancy by Educational Attainment in Lebanon
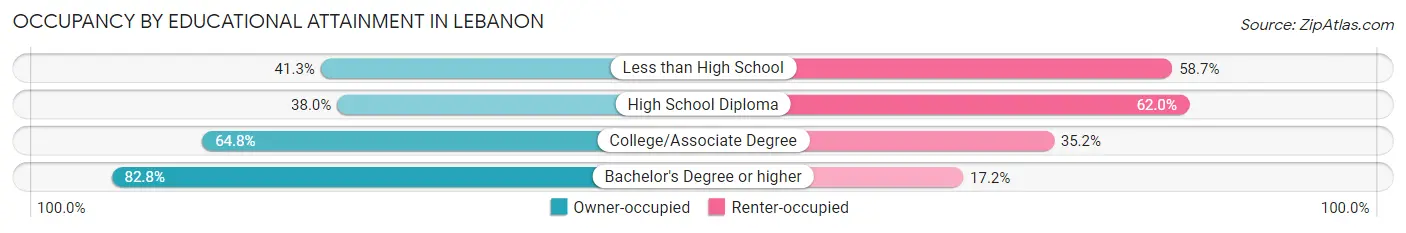
| Household Size | Owner-occupied | Renter-occupied |
| Less than High School | 121 (41.3%) | 172 (58.7%) |
| High School Diploma | 1,011 (38.0%) | 1,647 (62.0%) |
| College/Associate Degree | 1,720 (64.8%) | 935 (35.2%) |
| Bachelor's Degree or higher | 2,026 (82.8%) | 422 (17.2%) |
Occupancy by Age of Householder in Lebanon
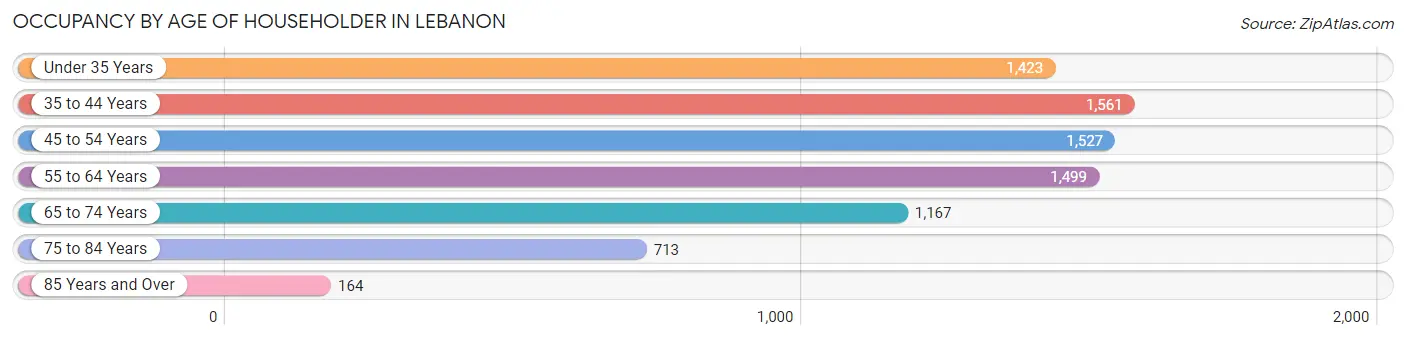
| Age Bracket | # Households | % Households |
| Under 35 Years | 1,423 | 17.7% |
| 35 to 44 Years | 1,561 | 19.4% |
| 45 to 54 Years | 1,527 | 19.0% |
| 55 to 64 Years | 1,499 | 18.6% |
| 65 to 74 Years | 1,167 | 14.5% |
| 75 to 84 Years | 713 | 8.8% |
| 85 Years and Over | 164 | 2.0% |
| Total | 8,054 | 100.0% |
Housing Finances in Lebanon
Median Income by Occupancy in Lebanon
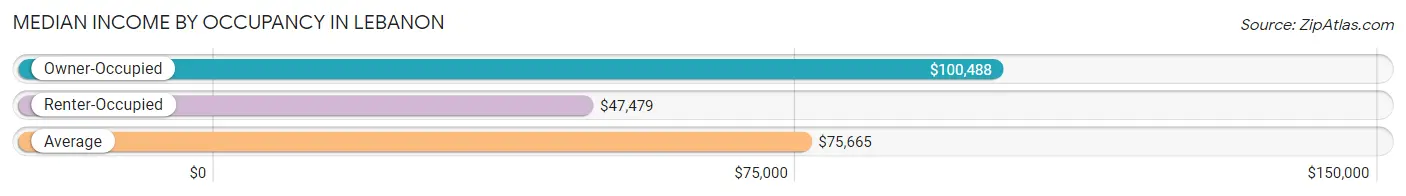
| Occupancy Type | # Households | Median Income |
| Owner-Occupied | 4,878 (60.6%) | $100,488 |
| Renter-Occupied | 3,176 (39.4%) | $47,479 |
| Average | 8,054 (100.0%) | $75,665 |
Occupancy by Householder Income Bracket in Lebanon
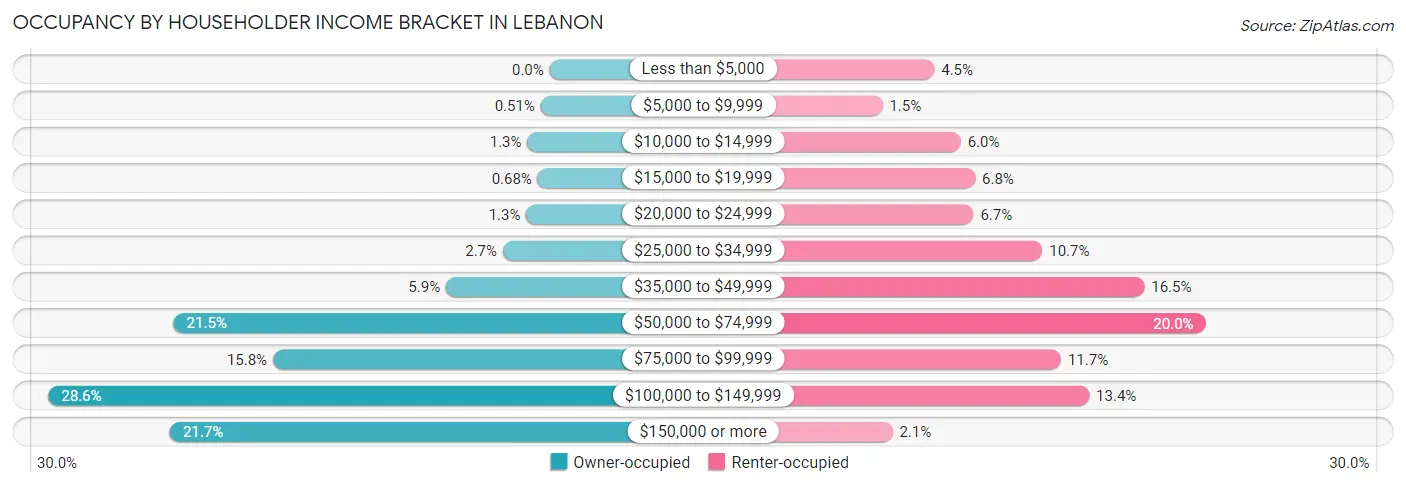
| Income Bracket | Owner-occupied | Renter-occupied |
| Less than $5,000 | 0 (0.0%) | 143 (4.5%) |
| $5,000 to $9,999 | 25 (0.5%) | 49 (1.5%) |
| $10,000 to $14,999 | 62 (1.3%) | 191 (6.0%) |
| $15,000 to $19,999 | 33 (0.7%) | 217 (6.8%) |
| $20,000 to $24,999 | 65 (1.3%) | 214 (6.7%) |
| $25,000 to $34,999 | 130 (2.7%) | 339 (10.7%) |
| $35,000 to $49,999 | 289 (5.9%) | 524 (16.5%) |
| $50,000 to $74,999 | 1,048 (21.5%) | 635 (20.0%) |
| $75,000 to $99,999 | 771 (15.8%) | 373 (11.7%) |
| $100,000 to $149,999 | 1,397 (28.6%) | 424 (13.4%) |
| $150,000 or more | 1,058 (21.7%) | 67 (2.1%) |
| Total | 4,878 (100.0%) | 3,176 (100.0%) |
Monthly Housing Cost Tiers in Lebanon
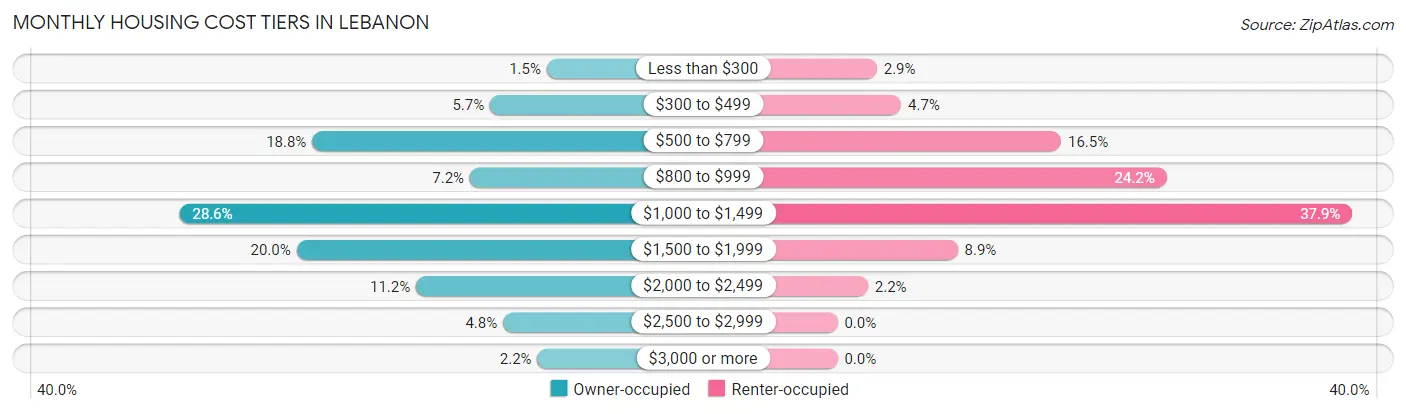
| Monthly Cost | Owner-occupied | Renter-occupied |
| Less than $300 | 75 (1.5%) | 92 (2.9%) |
| $300 to $499 | 279 (5.7%) | 149 (4.7%) |
| $500 to $799 | 918 (18.8%) | 523 (16.5%) |
| $800 to $999 | 351 (7.2%) | 770 (24.2%) |
| $1,000 to $1,499 | 1,395 (28.6%) | 1,204 (37.9%) |
| $1,500 to $1,999 | 974 (20.0%) | 281 (8.8%) |
| $2,000 to $2,499 | 545 (11.2%) | 71 (2.2%) |
| $2,500 to $2,999 | 232 (4.8%) | 0 (0.0%) |
| $3,000 or more | 109 (2.2%) | 0 (0.0%) |
| Total | 4,878 (100.0%) | 3,176 (100.0%) |
Physical Housing Characteristics in Lebanon
Housing Structures in Lebanon
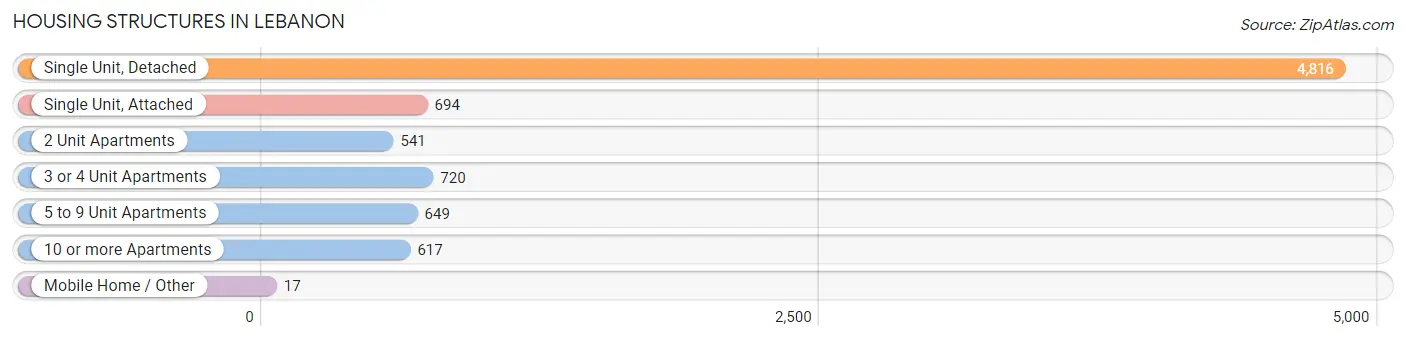
| Structure Type | # Housing Units | % Housing Units |
| Single Unit, Detached | 4,816 | 59.8% |
| Single Unit, Attached | 694 | 8.6% |
| 2 Unit Apartments | 541 | 6.7% |
| 3 or 4 Unit Apartments | 720 | 8.9% |
| 5 to 9 Unit Apartments | 649 | 8.1% |
| 10 or more Apartments | 617 | 7.7% |
| Mobile Home / Other | 17 | 0.2% |
| Total | 8,054 | 100.0% |
Housing Structures by Occupancy in Lebanon
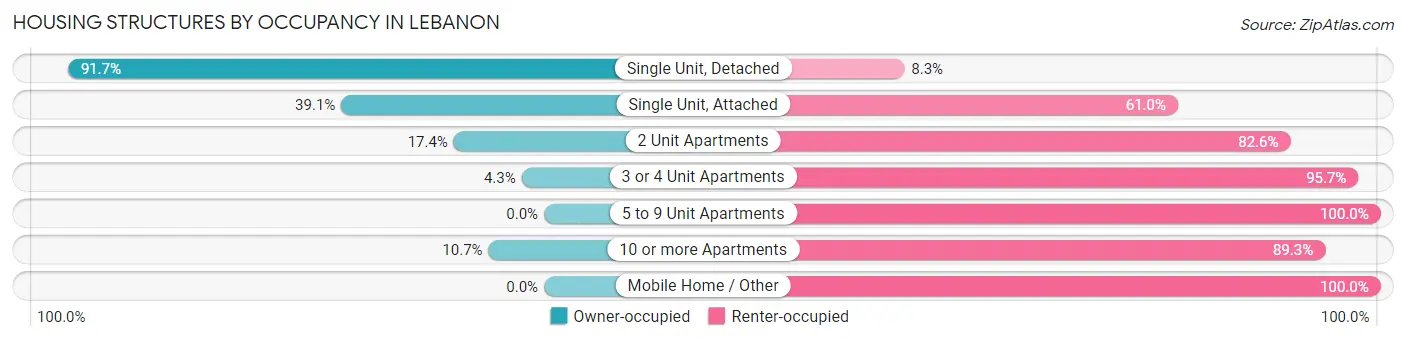
| Structure Type | Owner-occupied | Renter-occupied |
| Single Unit, Detached | 4,416 (91.7%) | 400 (8.3%) |
| Single Unit, Attached | 271 (39.1%) | 423 (61.0%) |
| 2 Unit Apartments | 94 (17.4%) | 447 (82.6%) |
| 3 or 4 Unit Apartments | 31 (4.3%) | 689 (95.7%) |
| 5 to 9 Unit Apartments | 0 (0.0%) | 649 (100.0%) |
| 10 or more Apartments | 66 (10.7%) | 551 (89.3%) |
| Mobile Home / Other | 0 (0.0%) | 17 (100.0%) |
| Total | 4,878 (60.6%) | 3,176 (39.4%) |
Housing Structures by Number of Rooms in Lebanon
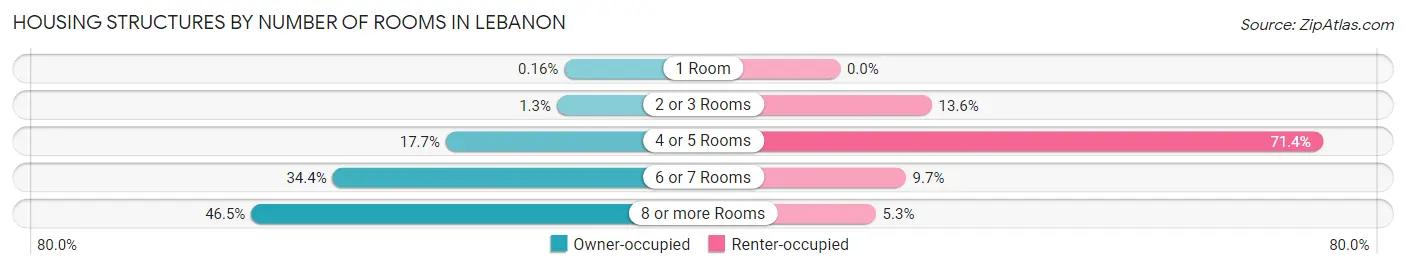
| Number of Rooms | Owner-occupied | Renter-occupied |
| 1 Room | 8 (0.2%) | 0 (0.0%) |
| 2 or 3 Rooms | 61 (1.3%) | 431 (13.6%) |
| 4 or 5 Rooms | 862 (17.7%) | 2,268 (71.4%) |
| 6 or 7 Rooms | 1,680 (34.4%) | 309 (9.7%) |
| 8 or more Rooms | 2,267 (46.5%) | 168 (5.3%) |
| Total | 4,878 (100.0%) | 3,176 (100.0%) |
Housing Structure by Heating Type in Lebanon
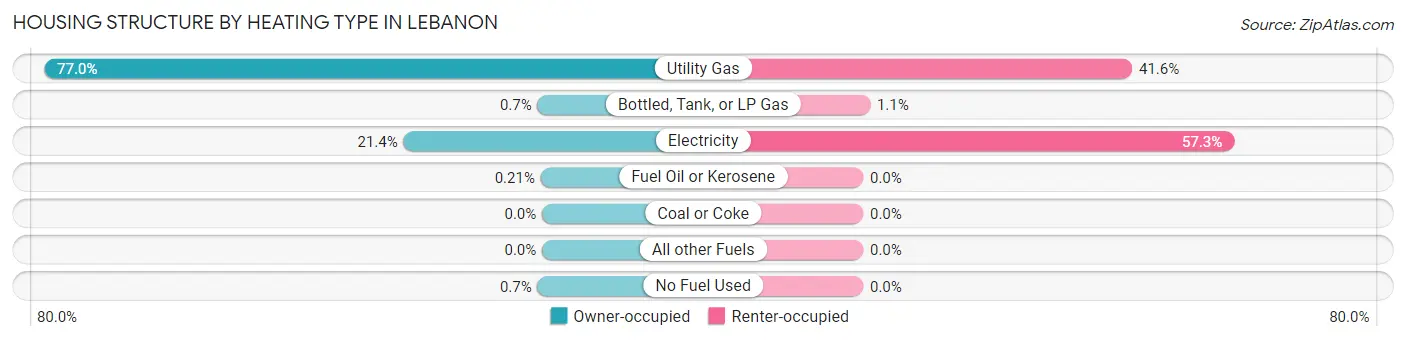
| Heating Type | Owner-occupied | Renter-occupied |
| Utility Gas | 3,755 (77.0%) | 1,321 (41.6%) |
| Bottled, Tank, or LP Gas | 34 (0.7%) | 34 (1.1%) |
| Electricity | 1,045 (21.4%) | 1,821 (57.3%) |
| Fuel Oil or Kerosene | 10 (0.2%) | 0 (0.0%) |
| Coal or Coke | 0 (0.0%) | 0 (0.0%) |
| All other Fuels | 0 (0.0%) | 0 (0.0%) |
| No Fuel Used | 34 (0.7%) | 0 (0.0%) |
| Total | 4,878 (100.0%) | 3,176 (100.0%) |
Household Vehicle Usage in Lebanon
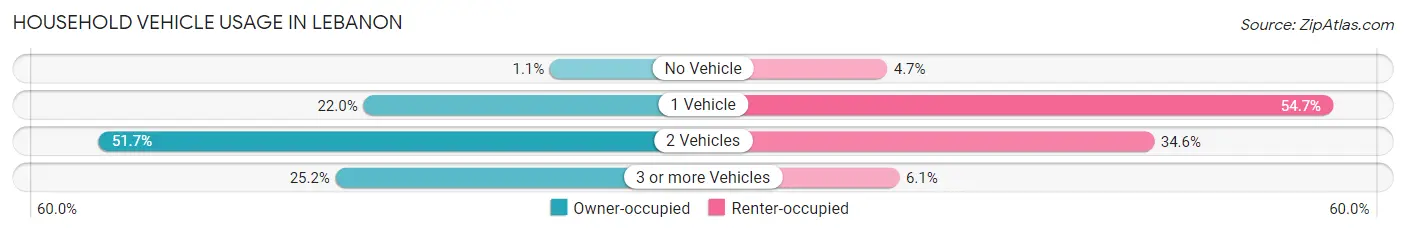
| Vehicles per Household | Owner-occupied | Renter-occupied |
| No Vehicle | 55 (1.1%) | 149 (4.7%) |
| 1 Vehicle | 1,075 (22.0%) | 1,736 (54.7%) |
| 2 Vehicles | 2,521 (51.7%) | 1,099 (34.6%) |
| 3 or more Vehicles | 1,227 (25.2%) | 192 (6.0%) |
| Total | 4,878 (100.0%) | 3,176 (100.0%) |
Real Estate & Mortgages in Lebanon
Real Estate and Mortgage Overview in Lebanon
| Characteristic | Without Mortgage | With Mortgage |
| Housing Units | 1,377 | 3,501 |
| Median Property Value | $254,700 | $244,500 |
| Median Household Income | $67,204 | $863 |
| Monthly Housing Costs | $708 | $109 |
| Real Estate Taxes | $3,328 | $31 |
Property Value by Mortgage Status in Lebanon
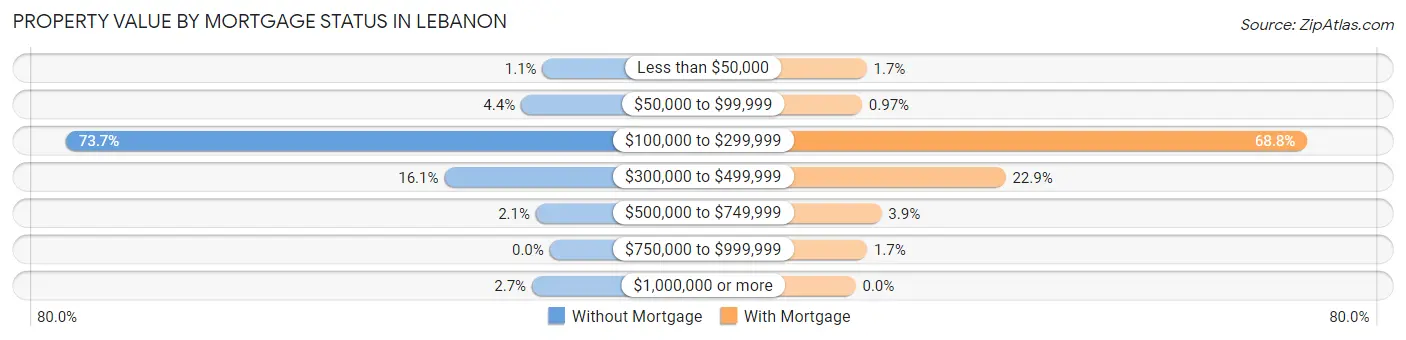
| Property Value | Without Mortgage | With Mortgage |
| Less than $50,000 | 15 (1.1%) | 59 (1.7%) |
| $50,000 to $99,999 | 60 (4.4%) | 34 (1.0%) |
| $100,000 to $299,999 | 1,015 (73.7%) | 2,409 (68.8%) |
| $300,000 to $499,999 | 221 (16.1%) | 800 (22.9%) |
| $500,000 to $749,999 | 29 (2.1%) | 138 (3.9%) |
| $750,000 to $999,999 | 0 (0.0%) | 61 (1.7%) |
| $1,000,000 or more | 37 (2.7%) | 0 (0.0%) |
| Total | 1,377 (100.0%) | 3,501 (100.0%) |
Household Income by Mortgage Status in Lebanon
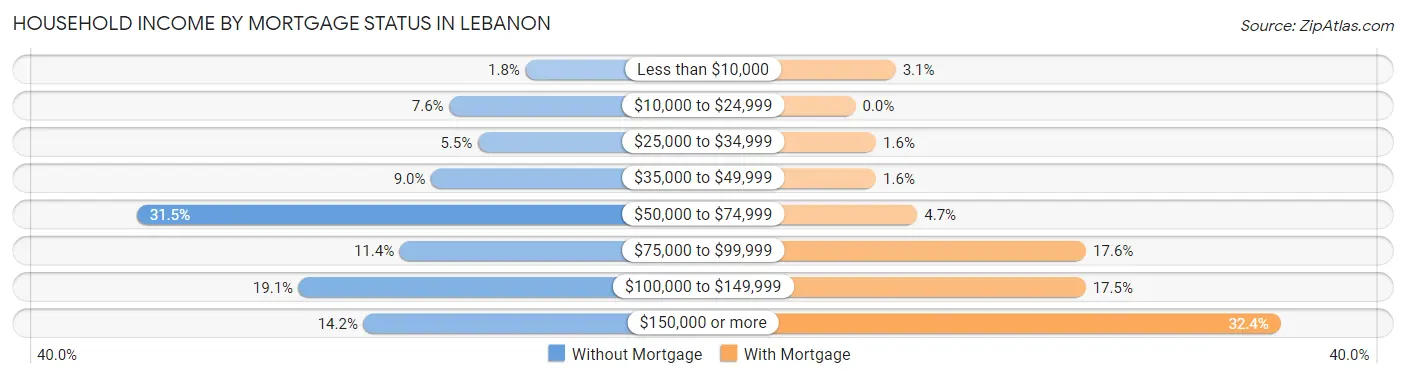
| Household Income | Without Mortgage | With Mortgage |
| Less than $10,000 | 25 (1.8%) | 107 (3.1%) |
| $10,000 to $24,999 | 105 (7.6%) | 0 (0.0%) |
| $25,000 to $34,999 | 75 (5.4%) | 55 (1.6%) |
| $35,000 to $49,999 | 124 (9.0%) | 55 (1.6%) |
| $50,000 to $74,999 | 433 (31.5%) | 165 (4.7%) |
| $75,000 to $99,999 | 157 (11.4%) | 615 (17.6%) |
| $100,000 to $149,999 | 263 (19.1%) | 614 (17.5%) |
| $150,000 or more | 195 (14.2%) | 1,134 (32.4%) |
| Total | 1,377 (100.0%) | 3,501 (100.0%) |
Property Value to Household Income Ratio in Lebanon
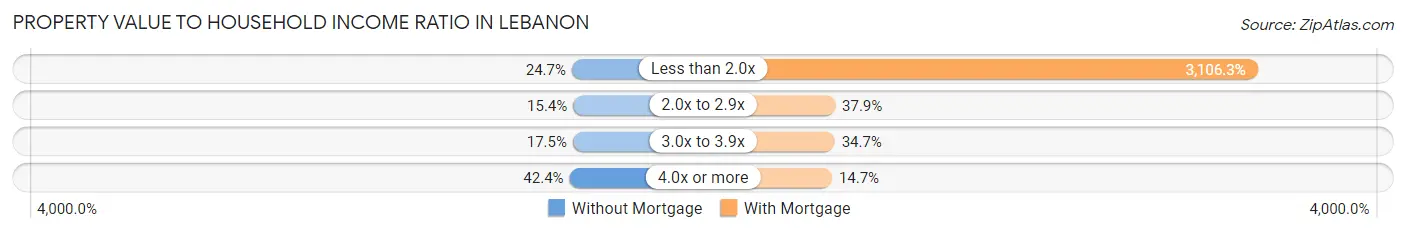
| Value-to-Income Ratio | Without Mortgage | With Mortgage |
| Less than 2.0x | 340 (24.7%) | 108,750 (3,106.3%) |
| 2.0x to 2.9x | 212 (15.4%) | 1,326 (37.9%) |
| 3.0x to 3.9x | 241 (17.5%) | 1,213 (34.6%) |
| 4.0x or more | 584 (42.4%) | 514 (14.7%) |
| Total | 1,377 (100.0%) | 3,501 (100.0%) |
Real Estate Taxes by Mortgage Status in Lebanon
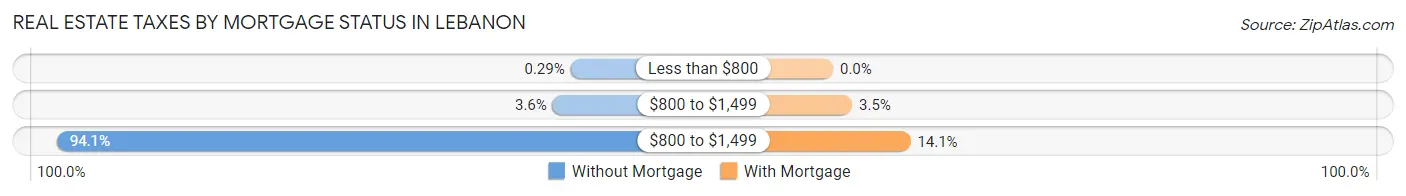
| Property Taxes | Without Mortgage | With Mortgage |
| Less than $800 | 4 (0.3%) | 0 (0.0%) |
| $800 to $1,499 | 49 (3.6%) | 122 (3.5%) |
| $800 to $1,499 | 1,296 (94.1%) | 495 (14.1%) |
| Total | 1,377 (100.0%) | 3,501 (100.0%) |
Health & Disability in Lebanon
Health Insurance Coverage by Age in Lebanon
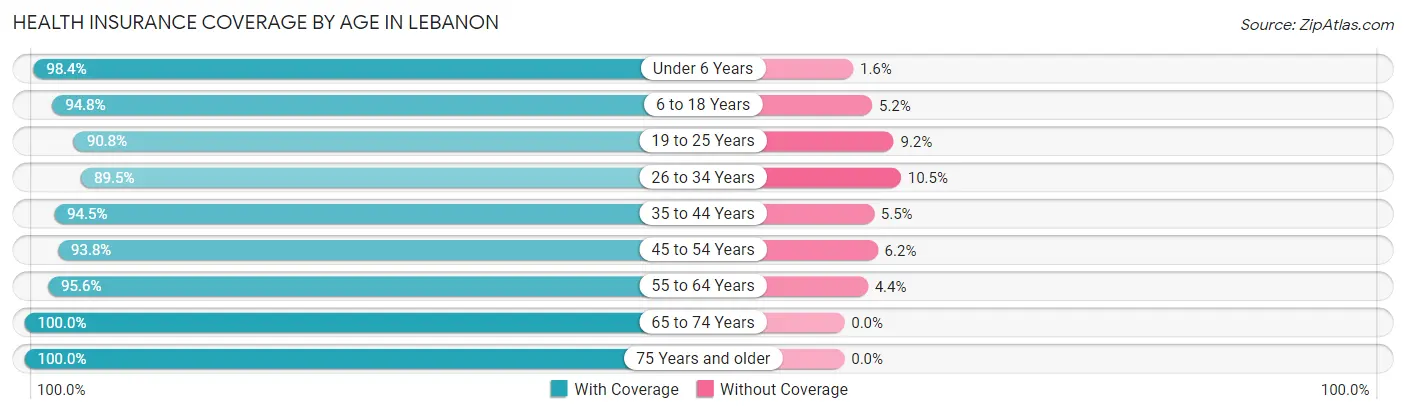
| Age Bracket | With Coverage | Without Coverage |
| Under 6 Years | 1,625 (98.4%) | 27 (1.6%) |
| 6 to 18 Years | 3,980 (94.8%) | 217 (5.2%) |
| 19 to 25 Years | 1,237 (90.8%) | 125 (9.2%) |
| 26 to 34 Years | 2,019 (89.5%) | 238 (10.5%) |
| 35 to 44 Years | 2,587 (94.5%) | 151 (5.5%) |
| 45 to 54 Years | 2,429 (93.8%) | 161 (6.2%) |
| 55 to 64 Years | 2,430 (95.6%) | 111 (4.4%) |
| 65 to 74 Years | 1,755 (100.0%) | 0 (0.0%) |
| 75 Years and older | 1,434 (100.0%) | 0 (0.0%) |
| Total | 19,496 (95.0%) | 1,030 (5.0%) |
Health Insurance Coverage by Citizenship Status in Lebanon
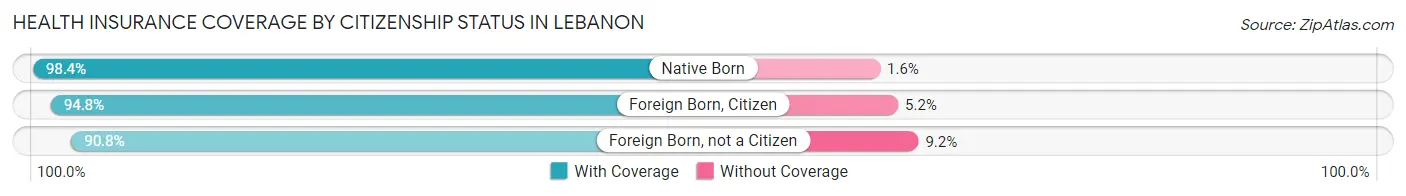
| Citizenship Status | With Coverage | Without Coverage |
| Native Born | 1,625 (98.4%) | 27 (1.6%) |
| Foreign Born, Citizen | 3,980 (94.8%) | 217 (5.2%) |
| Foreign Born, not a Citizen | 1,237 (90.8%) | 125 (9.2%) |
Health Insurance Coverage by Household Income in Lebanon
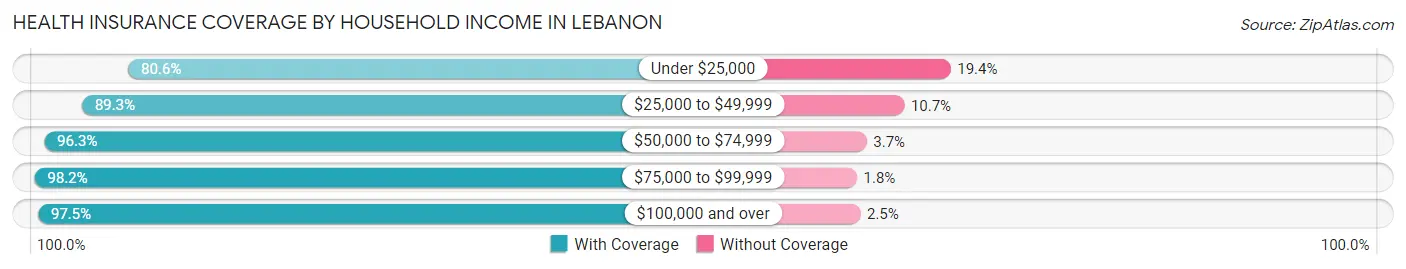
| Household Income | With Coverage | Without Coverage |
| Under $25,000 | 1,447 (80.6%) | 348 (19.4%) |
| $25,000 to $49,999 | 2,050 (89.3%) | 246 (10.7%) |
| $50,000 to $74,999 | 3,974 (96.3%) | 151 (3.7%) |
| $75,000 to $99,999 | 2,885 (98.2%) | 54 (1.8%) |
| $100,000 and over | 9,085 (97.5%) | 231 (2.5%) |
Public vs Private Health Insurance Coverage by Age in Lebanon
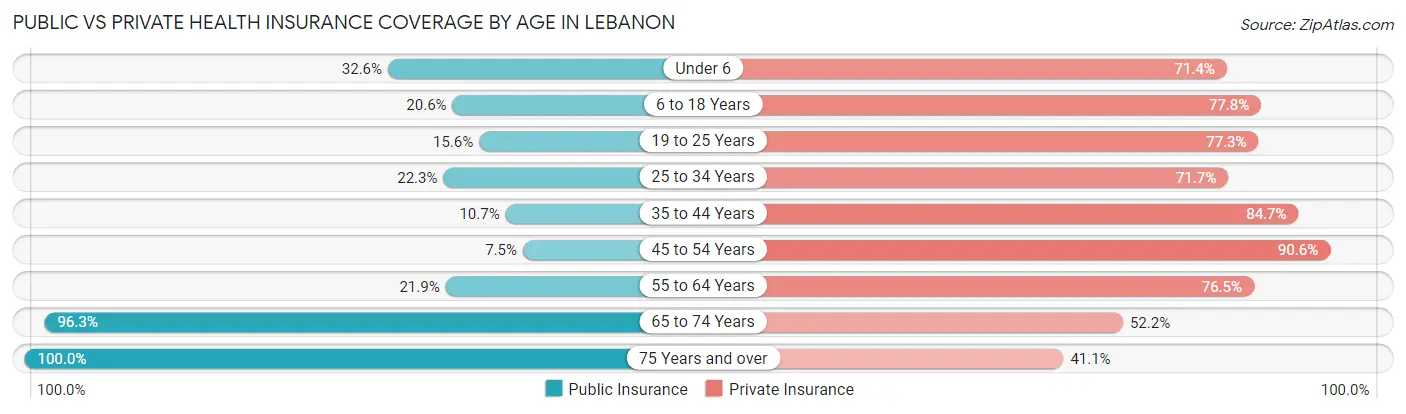
| Age Bracket | Public Insurance | Private Insurance |
| Under 6 | 538 (32.6%) | 1,180 (71.4%) |
| 6 to 18 Years | 864 (20.6%) | 3,266 (77.8%) |
| 19 to 25 Years | 213 (15.6%) | 1,053 (77.3%) |
| 25 to 34 Years | 503 (22.3%) | 1,618 (71.7%) |
| 35 to 44 Years | 294 (10.7%) | 2,320 (84.7%) |
| 45 to 54 Years | 195 (7.5%) | 2,347 (90.6%) |
| 55 to 64 Years | 556 (21.9%) | 1,943 (76.5%) |
| 65 to 74 Years | 1,690 (96.3%) | 916 (52.2%) |
| 75 Years and over | 1,434 (100.0%) | 590 (41.1%) |
| Total | 6,287 (30.6%) | 15,233 (74.2%) |
Disability Status by Sex by Age in Lebanon
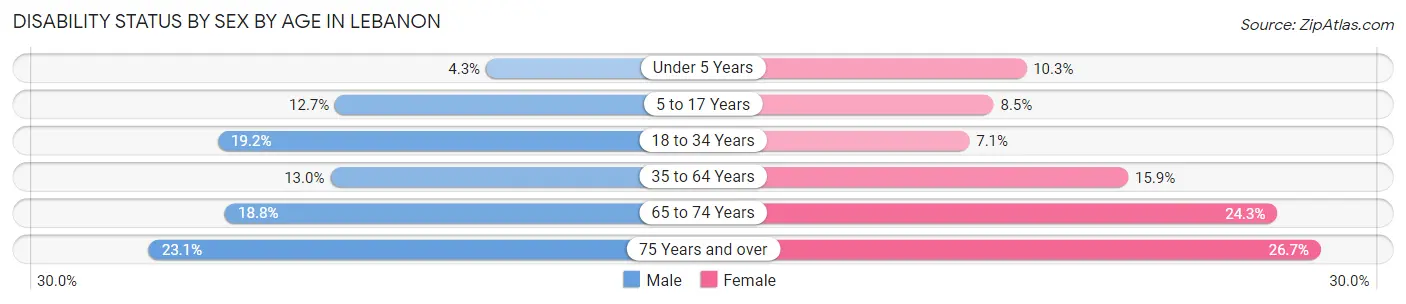
| Age Bracket | Male | Female |
| Under 5 Years | 35 (4.3%) | 64 (10.3%) |
| 5 to 17 Years | 265 (12.7%) | 165 (8.5%) |
| 18 to 34 Years | 346 (19.2%) | 156 (7.1%) |
| 35 to 64 Years | 506 (13.0%) | 633 (15.9%) |
| 65 to 74 Years | 141 (18.8%) | 244 (24.2%) |
| 75 Years and over | 138 (23.1%) | 223 (26.7%) |
Disability Class by Sex by Age in Lebanon
Disability Class: Hearing Difficulty
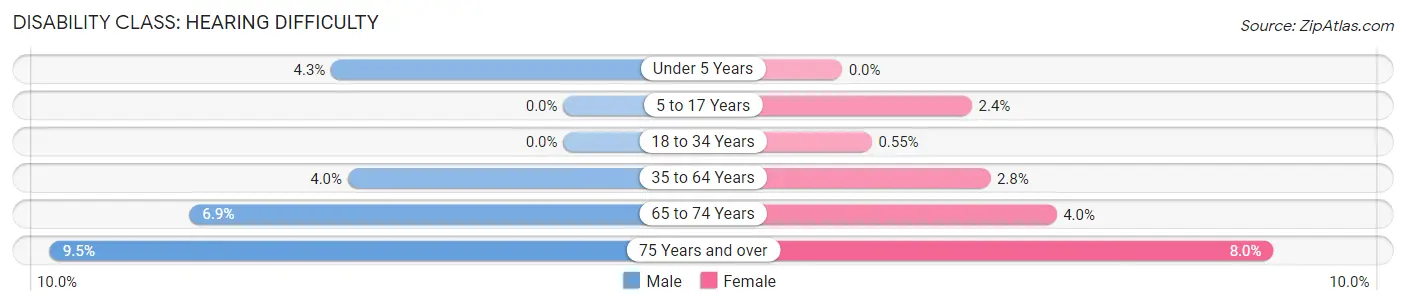
| Age Bracket | Male | Female |
| Under 5 Years | 35 (4.3%) | 0 (0.0%) |
| 5 to 17 Years | 0 (0.0%) | 47 (2.4%) |
| 18 to 34 Years | 0 (0.0%) | 12 (0.5%) |
| 35 to 64 Years | 156 (4.0%) | 109 (2.8%) |
| 65 to 74 Years | 52 (6.9%) | 40 (4.0%) |
| 75 Years and over | 57 (9.5%) | 67 (8.0%) |
Disability Class: Vision Difficulty
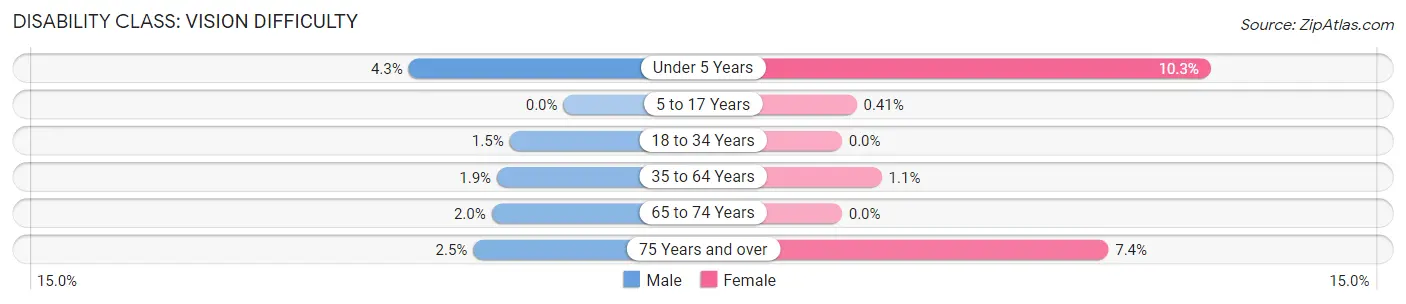
| Age Bracket | Male | Female |
| Under 5 Years | 35 (4.3%) | 64 (10.3%) |
| 5 to 17 Years | 0 (0.0%) | 8 (0.4%) |
| 18 to 34 Years | 27 (1.5%) | 0 (0.0%) |
| 35 to 64 Years | 72 (1.8%) | 44 (1.1%) |
| 65 to 74 Years | 15 (2.0%) | 0 (0.0%) |
| 75 Years and over | 15 (2.5%) | 62 (7.4%) |
Disability Class: Cognitive Difficulty
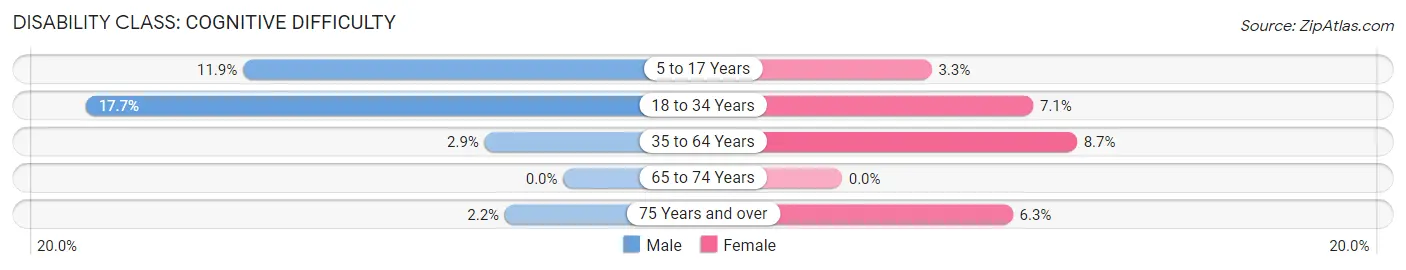
| Age Bracket | Male | Female |
| 5 to 17 Years | 248 (11.9%) | 65 (3.3%) |
| 18 to 34 Years | 319 (17.7%) | 156 (7.1%) |
| 35 to 64 Years | 114 (2.9%) | 346 (8.7%) |
| 65 to 74 Years | 0 (0.0%) | 0 (0.0%) |
| 75 Years and over | 13 (2.2%) | 53 (6.3%) |
Disability Class: Ambulatory Difficulty
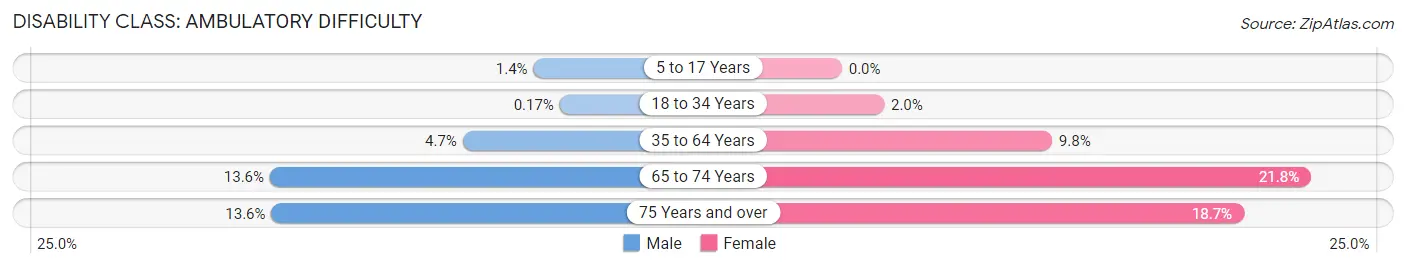
| Age Bracket | Male | Female |
| 5 to 17 Years | 29 (1.4%) | 0 (0.0%) |
| 18 to 34 Years | 3 (0.2%) | 43 (2.0%) |
| 35 to 64 Years | 182 (4.7%) | 387 (9.8%) |
| 65 to 74 Years | 102 (13.6%) | 219 (21.8%) |
| 75 Years and over | 81 (13.6%) | 156 (18.7%) |
Disability Class: Self-Care Difficulty
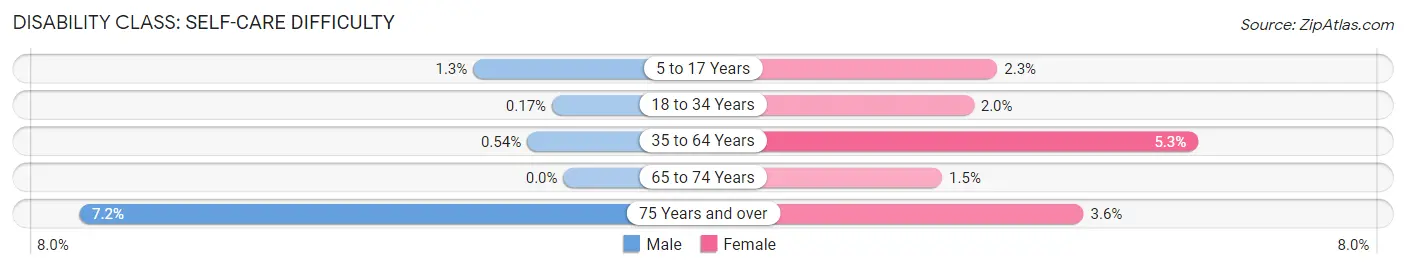
| Age Bracket | Male | Female |
| 5 to 17 Years | 28 (1.3%) | 45 (2.3%) |
| 18 to 34 Years | 3 (0.2%) | 43 (2.0%) |
| 35 to 64 Years | 21 (0.5%) | 210 (5.3%) |
| 65 to 74 Years | 0 (0.0%) | 15 (1.5%) |
| 75 Years and over | 43 (7.2%) | 30 (3.6%) |
Technology Access in Lebanon
Computing Device Access in Lebanon
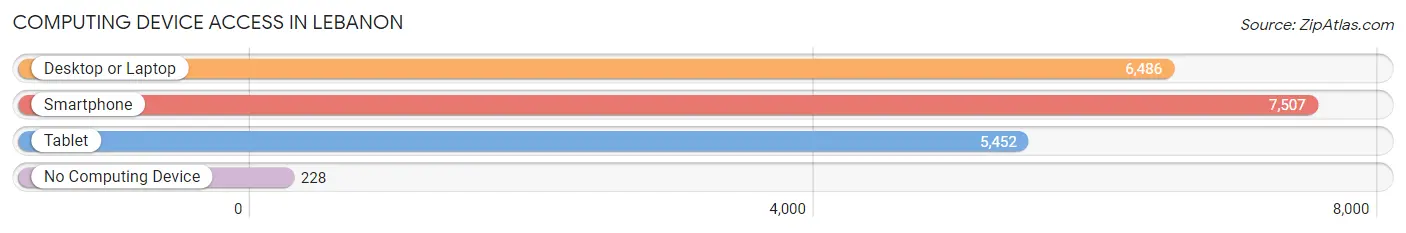
| Device Type | # Households | % Households |
| Desktop or Laptop | 6,486 | 80.5% |
| Smartphone | 7,507 | 93.2% |
| Tablet | 5,452 | 67.7% |
| No Computing Device | 228 | 2.8% |
| Total | 8,054 | 100.0% |
Internet Access in Lebanon
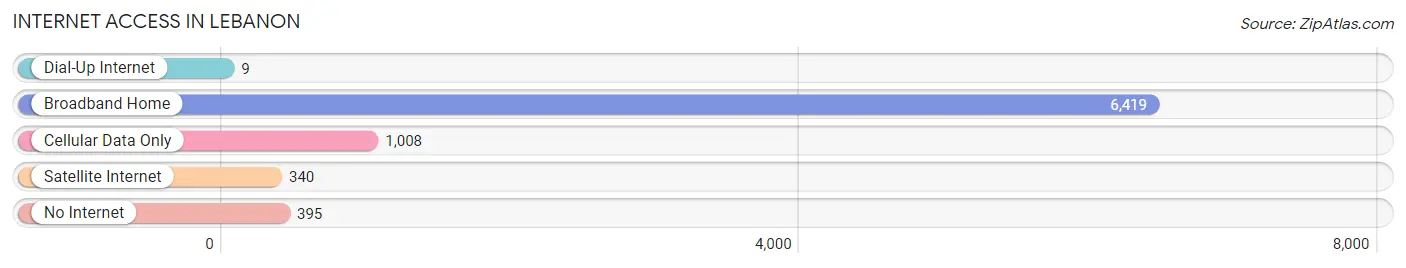
| Internet Type | # Households | % Households |
| Dial-Up Internet | 9 | 0.1% |
| Broadband Home | 6,419 | 79.7% |
| Cellular Data Only | 1,008 | 12.5% |
| Satellite Internet | 340 | 4.2% |
| No Internet | 395 | 4.9% |
| Total | 8,054 | 100.0% |
Lebanon Summary
Lebanon, Ohio is a city located in Warren County, Ohio, United States. The city is located in the southwestern part of the state, about 25 miles northeast of Cincinnati. Lebanon is the county seat of Warren County and is part of the Cincinnati metropolitan area. The population of Lebanon was estimated to be 20,033 in 2019.
History
Lebanon was founded in 1802 by a group of settlers from New Jersey. The city was named after the biblical city of Lebanon, which was located in present-day Lebanon, Ohio. The city was incorporated in 1858.
In the 19th century, Lebanon was a major center for the production of leather goods, including saddles, harnesses, and boots. The city was also home to several large manufacturing companies, including the Lebanon Carriage Works, which produced carriages and wagons.
In the early 20th century, Lebanon was a major center for the production of automobiles. The city was home to the Lebanon Motor Car Company, which produced cars from 1910 to 1915. The company was later purchased by the Reo Motor Company, which produced cars in Lebanon until 1925.
Geography
Lebanon is located in southwestern Ohio, about 25 miles northeast of Cincinnati. The city is situated in the Little Miami River Valley, which is part of the larger Ohio River Valley. The city is located at the intersection of Interstate 71 and State Route 48.
The city has a total area of 8.3 square miles, of which 8.2 square miles is land and 0.1 square miles is water. The city is located in the humid continental climate zone, with hot summers and cold winters.
Economy
Lebanon is a major center for manufacturing and distribution. The city is home to several large companies, including the Lebanon Carriage Works, which produces carriages and wagons, and the Lebanon Motor Car Company, which produces cars. The city is also home to several large distribution centers, including the Amazon Fulfillment Center and the Walmart Distribution Center.
The city is also home to several large retail stores, including Walmart, Target, and Kroger. The city is also home to several restaurants, including Applebee's, Olive Garden, and Red Lobster.
Demographics
As of the 2019 census, the population of Lebanon was estimated to be 20,033. The city has a population density of 2,400 people per square mile. The median age of the population is 38.7 years, and the median household income is $50,945.
The racial makeup of the city is 87.3% White, 8.2% African American, 0.7% Asian, 0.3% Native American, and 3.5% from other races. The city is also home to a large Hispanic population, with 8.7% of the population identifying as Hispanic or Latino.
Conclusion
Lebanon, Ohio is a city located in Warren County, Ohio, United States. The city is located in the southwestern part of the state, about 25 miles northeast of Cincinnati. Lebanon is the county seat of Warren County and is part of the Cincinnati metropolitan area. The population of Lebanon was estimated to be 20,033 in 2019. The city is a major center for manufacturing and distribution, and is home to several large companies and retail stores. The city has a population that is 87.3% White, 8.2% African American, 0.7% Asian, 0.3% Native American, and 3.5% from other races. The city is also home to a large Hispanic population, with 8.7% of the population identifying as Hispanic or Latino.
Common Questions
What is the Total Population of Lebanon?
Total Population of Lebanon is 20,999.
What is the Total Male Population of Lebanon?
Total Male Population of Lebanon is 10,221.
What is the Total Female Population of Lebanon?
Total Female Population of Lebanon is 10,778.
What is the Ratio of Males per 100 Females in Lebanon?
There are 94.83 Males per 100 Females in Lebanon.
What is the Ratio of Females per 100 Males in Lebanon?
There are 105.45 Females per 100 Males in Lebanon.
What is the Median Population Age in Lebanon?
Median Population Age in Lebanon is 37.8 Years.
What is the Average Family Size in Lebanon
Average Family Size in Lebanon is 3.0 People.
What is the Average Household Size in Lebanon
Average Household Size in Lebanon is 2.5 People.
What is Per Capita Income in Lebanon?
Per Capita income in Lebanon is $36,077.
What is the Median Family Income in Lebanon?
Median Family Income in Lebanon is $89,205.
What is the Median Household income in Lebanon?
Median Household Income in Lebanon is $75,665.
What is Income or Wage Gap in Lebanon?
Income or Wage Gap in Lebanon is 38.9%.
Women in Lebanon earn 61.1 cents for every dollar earned by a man.
What is Inequality or Gini Index in Lebanon?
Inequality or Gini Index in Lebanon is 0.39.
How Large is the Labor Force in Lebanon?
There are 10,288 People in the Labor Forcein in Lebanon.
What is the Percentage of People in the Labor Force in Lebanon?
64.7% of People are in the Labor Force in Lebanon.
What is the Unemployment Rate in Lebanon?
Unemployment Rate in Lebanon is 2.0%.