Woodmere, OH
Woodmere Map
Woodmere Overview
683
TOTAL POPULATION
290
MALE POPULATION
393
FEMALE POPULATION
73.79
MALES / 100 FEMALES
135.52
FEMALES / 100 MALES
35.5
MEDIAN AGE
3.1
AVG FAMILY SIZE
2.4
AVG HOUSEHOLD SIZE
$34,042
PER CAPITA INCOME
$73,438
AVG FAMILY INCOME
$49,609
AVG HOUSEHOLD INCOME
0.51
INEQUALITY / GINI INDEX
368
LABOR FORCE [ PEOPLE ]
71.6%
PERCENT IN LABOR FORCE
11.7%
UNEMPLOYMENT RATE
Woodmere Area Codes
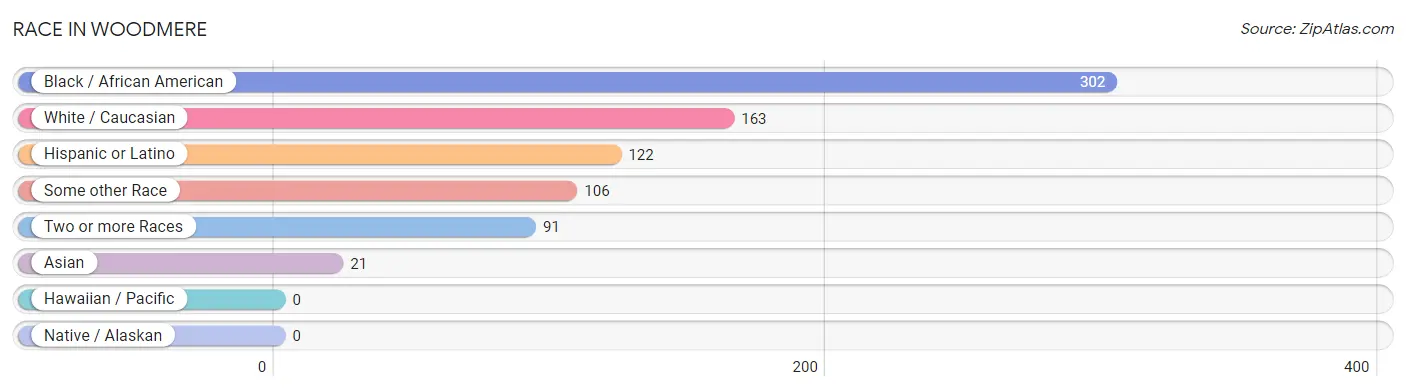
Race in Woodmere
The most populous races in Woodmere are Black / African American (302 | 44.2%), White / Caucasian (163 | 23.9%), and Hispanic or Latino (122 | 17.9%).
| Race | # Population | % Population |
| Asian | 21 | 3.1% |
| Black / African American | 302 | 44.2% |
| Hawaiian / Pacific | 0 | 0.0% |
| Hispanic or Latino | 122 | 17.9% |
| Native / Alaskan | 0 | 0.0% |
| White / Caucasian | 163 | 23.9% |
| Two or more Races | 91 | 13.3% |
| Some other Race | 106 | 15.5% |
| Total | 683 | 100.0% |
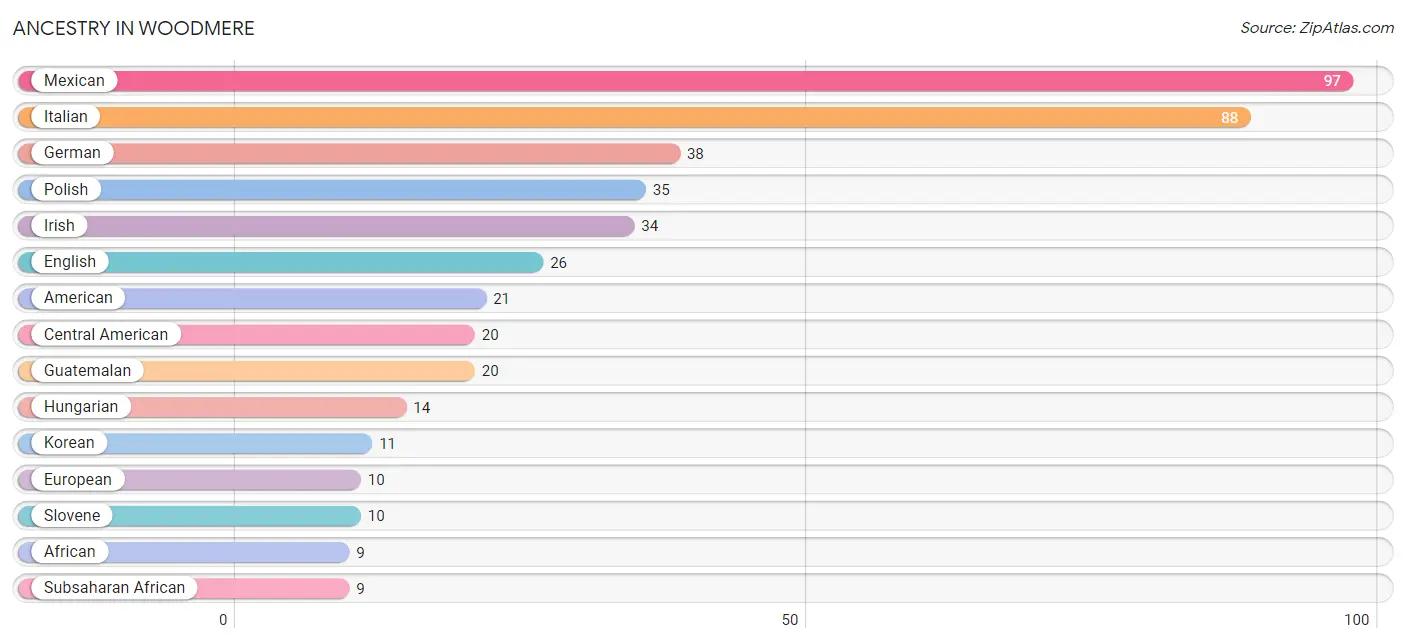
Ancestry in Woodmere
The most populous ancestries reported in Woodmere are Mexican (97 | 14.2%), Italian (88 | 12.9%), German (38 | 5.6%), Polish (35 | 5.1%), and Irish (34 | 5.0%), together accounting for 42.7% of all Woodmere residents.
| Ancestry | # Population | % Population |
| African | 9 | 1.3% |
| American | 21 | 3.1% |
| Arab | 5 | 0.7% |
| Central American | 20 | 2.9% |
| Croatian | 3 | 0.4% |
| Czech | 4 | 0.6% |
| Eastern European | 7 | 1.0% |
| English | 26 | 3.8% |
| European | 10 | 1.5% |
| German | 38 | 5.6% |
| Guatemalan | 20 | 2.9% |
| Haitian | 5 | 0.7% |
| Hungarian | 14 | 2.1% |
| Indian (Asian) | 2 | 0.3% |
| Irish | 34 | 5.0% |
| Italian | 88 | 12.9% |
| Korean | 11 | 1.6% |
| Lebanese | 5 | 0.7% |
| Lithuanian | 5 | 0.7% |
| Mexican | 97 | 14.2% |
| Norwegian | 3 | 0.4% |
| Polish | 35 | 5.1% |
| Puerto Rican | 5 | 0.7% |
| Romanian | 6 | 0.9% |
| Slovak | 6 | 0.9% |
| Slovene | 10 | 1.5% |
| Sri Lankan | 2 | 0.3% |
| Subsaharan African | 9 | 1.3% |
| Ukrainian | 5 | 0.7% | View All 29 Rows |
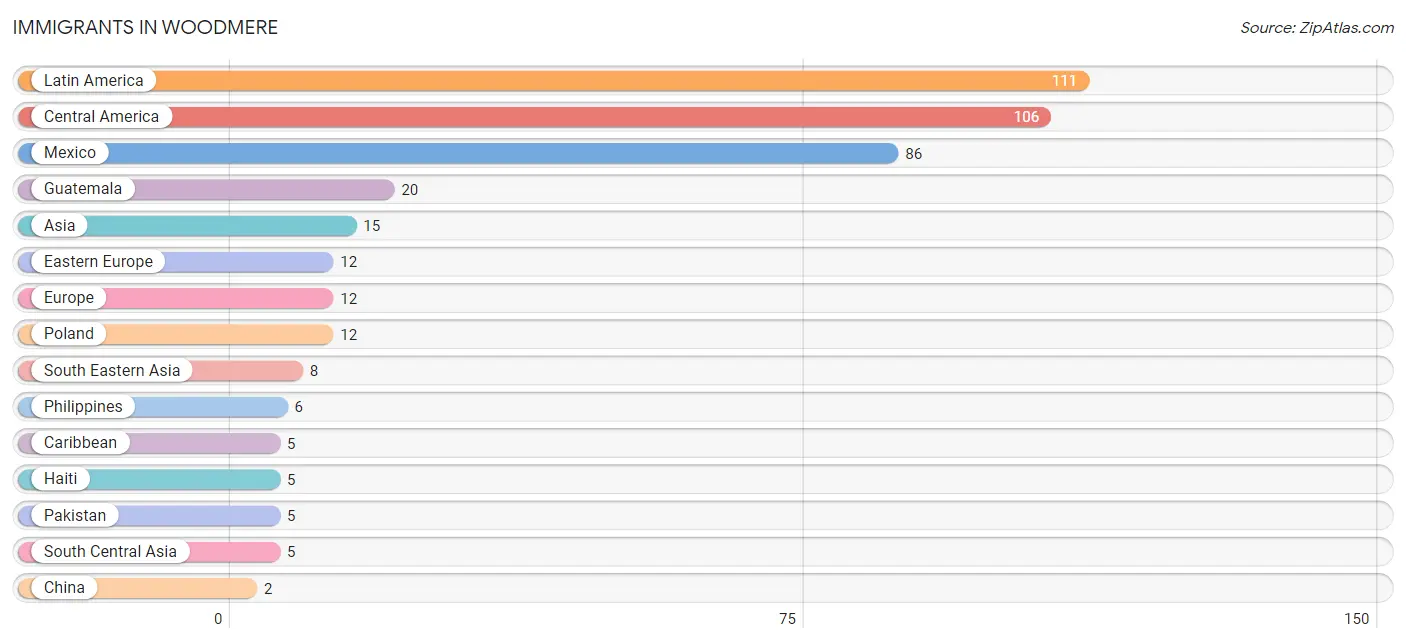
Immigrants in Woodmere
The most numerous immigrant groups reported in Woodmere came from Latin America (111 | 16.3%), Central America (106 | 15.5%), Mexico (86 | 12.6%), Guatemala (20 | 2.9%), and Asia (15 | 2.2%), together accounting for 49.5% of all Woodmere residents.
| Immigration Origin | # Population | % Population |
| Asia | 15 | 2.2% |
| Caribbean | 5 | 0.7% |
| Central America | 106 | 15.5% |
| China | 2 | 0.3% |
| Eastern Asia | 2 | 0.3% |
| Eastern Europe | 12 | 1.8% |
| Europe | 12 | 1.8% |
| Guatemala | 20 | 2.9% |
| Haiti | 5 | 0.7% |
| Latin America | 111 | 16.3% |
| Mexico | 86 | 12.6% |
| Pakistan | 5 | 0.7% |
| Philippines | 6 | 0.9% |
| Poland | 12 | 1.8% |
| South Central Asia | 5 | 0.7% |
| South Eastern Asia | 8 | 1.2% |
| Vietnam | 2 | 0.3% | View All 17 Rows |
Sex and Age in Woodmere
Sex and Age in Woodmere
The most populous age groups in Woodmere are 35 to 39 Years (64 | 22.1%) for men and Under 5 Years (61 | 15.5%) for women.
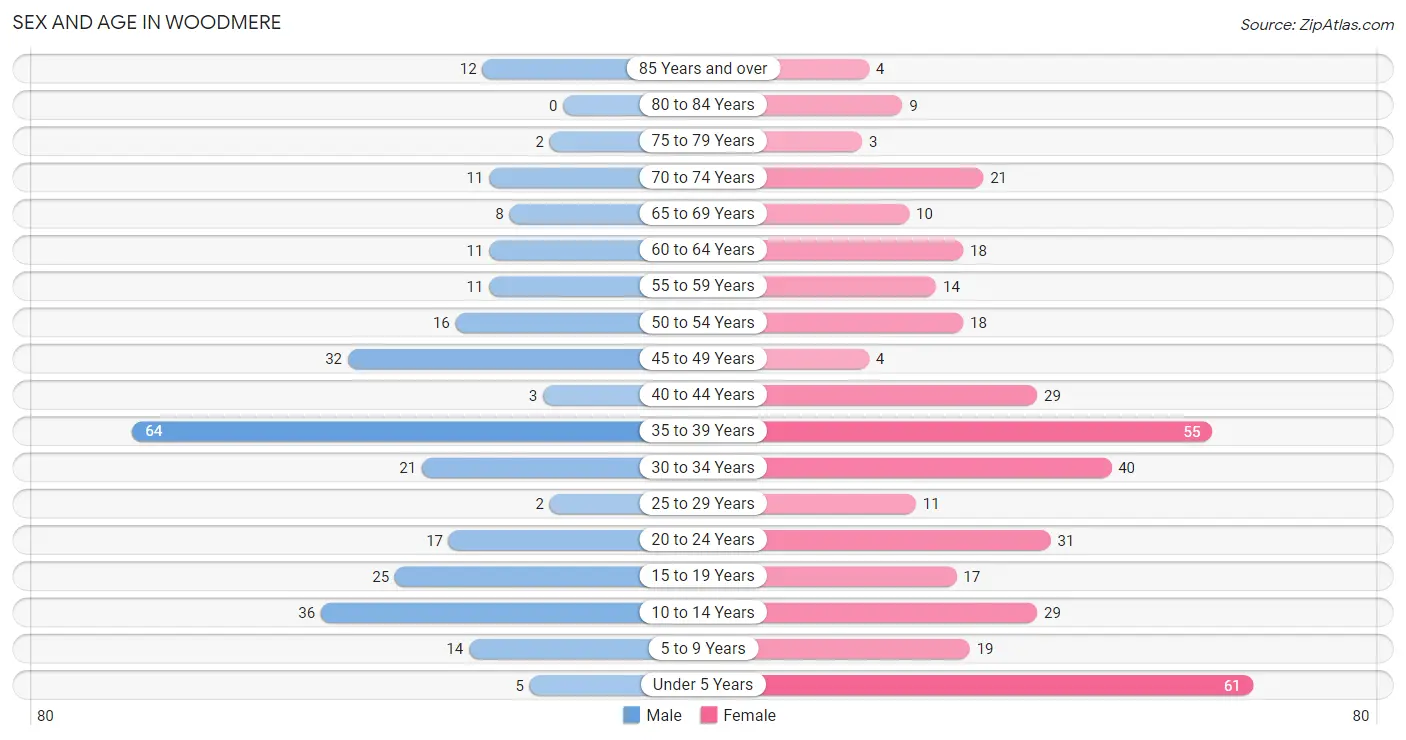
| Age Bracket | Male | Female |
| Under 5 Years | 5 (1.7%) | 61 (15.5%) |
| 5 to 9 Years | 14 (4.8%) | 19 (4.8%) |
| 10 to 14 Years | 36 (12.4%) | 29 (7.4%) |
| 15 to 19 Years | 25 (8.6%) | 17 (4.3%) |
| 20 to 24 Years | 17 (5.9%) | 31 (7.9%) |
| 25 to 29 Years | 2 (0.7%) | 11 (2.8%) |
| 30 to 34 Years | 21 (7.2%) | 40 (10.2%) |
| 35 to 39 Years | 64 (22.1%) | 55 (14.0%) |
| 40 to 44 Years | 3 (1.0%) | 29 (7.4%) |
| 45 to 49 Years | 32 (11.0%) | 4 (1.0%) |
| 50 to 54 Years | 16 (5.5%) | 18 (4.6%) |
| 55 to 59 Years | 11 (3.8%) | 14 (3.6%) |
| 60 to 64 Years | 11 (3.8%) | 18 (4.6%) |
| 65 to 69 Years | 8 (2.8%) | 10 (2.5%) |
| 70 to 74 Years | 11 (3.8%) | 21 (5.3%) |
| 75 to 79 Years | 2 (0.7%) | 3 (0.8%) |
| 80 to 84 Years | 0 (0.0%) | 9 (2.3%) |
| 85 Years and over | 12 (4.1%) | 4 (1.0%) |
| Total | 290 (100.0%) | 393 (100.0%) |
Families and Households in Woodmere
Median Family Size in Woodmere
The median family size in Woodmere is 3.10 persons per family, with married-couple families (132 | 79.0%) accounting for the largest median family size of 3.17 persons per family. On the other hand, single male/father families (15 | 9.0%) represent the smallest median family size with 2.67 persons per family.
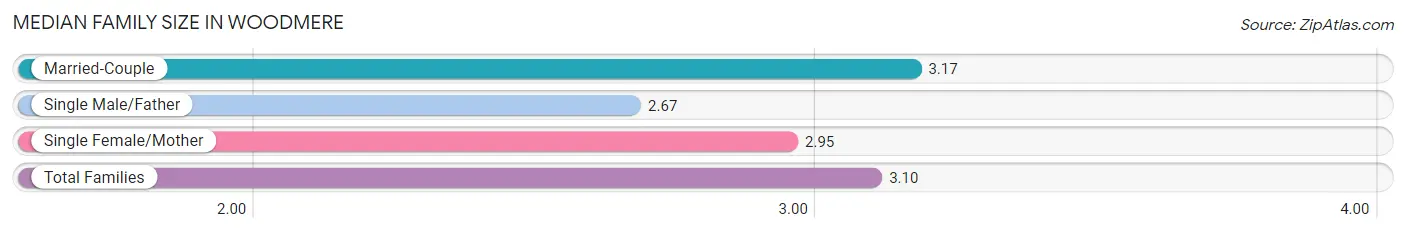
| Family Type | # Families | Family Size |
| Married-Couple | 132 (79.0%) | 3.17 |
| Single Male/Father | 15 (9.0%) | 2.67 |
| Single Female/Mother | 20 (12.0%) | 2.95 |
| Total Families | 167 (100.0%) | 3.10 |
Median Household Size in Woodmere
The median household size in Woodmere is 2.38 persons per household, with married-couple households (132 | 46.0%) accounting for the largest median household size of 3.17 persons per household. non-family households (120 | 41.8%) represent the smallest median household size with 1.38 persons per household.
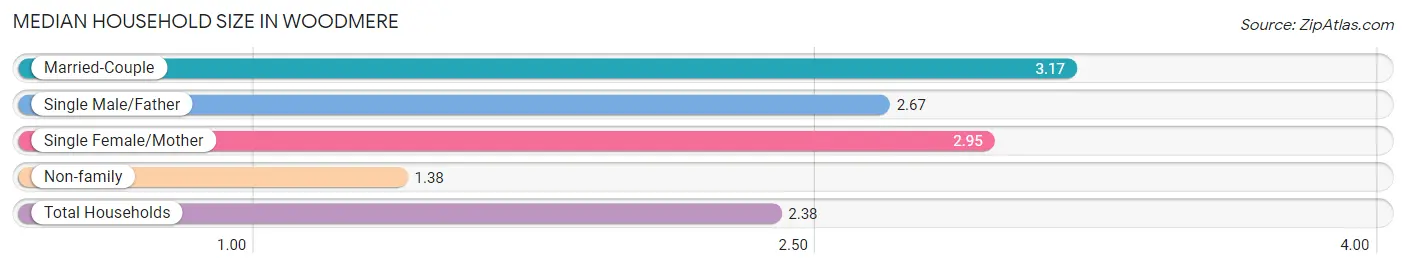
| Household Type | # Households | Household Size |
| Married-Couple | 132 (46.0%) | 3.17 |
| Single Male/Father | 15 (5.2%) | 2.67 |
| Single Female/Mother | 20 (7.0%) | 2.95 |
| Non-family | 120 (41.8%) | 1.38 |
| Total Households | 287 (100.0%) | 2.38 |
Household Size by Marriage Status in Woodmere
Out of a total of 287 households in Woodmere, 167 (58.2%) are family households, while 120 (41.8%) are nonfamily households. The most numerous type of family households are 2-person households, comprising 67, and the most common type of nonfamily households are 1-person households, comprising 94.
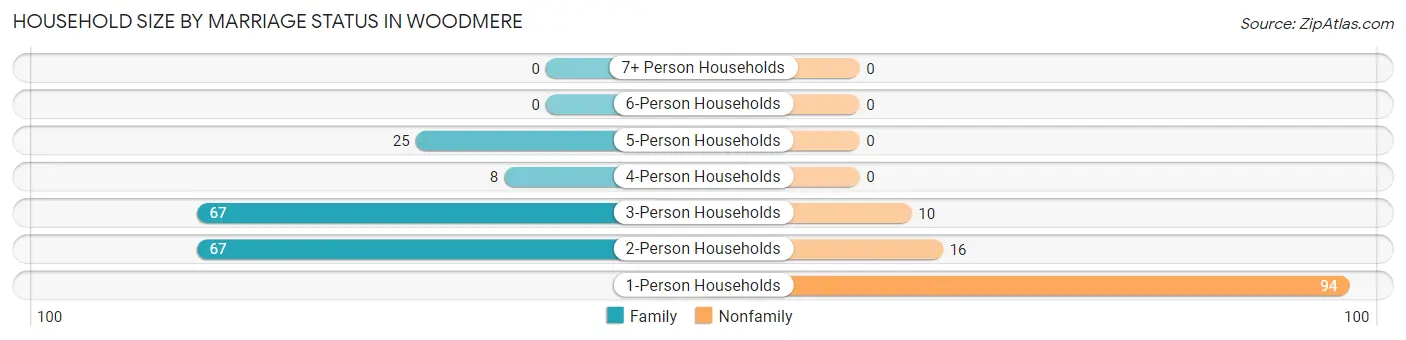
| Household Size | Family Households | Nonfamily Households |
| 1-Person Households | - | 94 (32.8%) |
| 2-Person Households | 67 (23.3%) | 16 (5.6%) |
| 3-Person Households | 67 (23.3%) | 10 (3.5%) |
| 4-Person Households | 8 (2.8%) | 0 (0.0%) |
| 5-Person Households | 25 (8.7%) | 0 (0.0%) |
| 6-Person Households | 0 (0.0%) | 0 (0.0%) |
| 7+ Person Households | 0 (0.0%) | 0 (0.0%) |
| Total | 167 (58.2%) | 120 (41.8%) |
Female Fertility in Woodmere
Fertility by Age in Woodmere
| Age Bracket | Women with Births | Births / 1,000 Women |
| 15 to 19 years | 0 (0.0%) | 0.0 |
| 20 to 34 years | 0 (0.0%) | 0.0 |
| 35 to 50 years | 0 (0.0%) | 0.0 |
| Total | 0 (0.0%) | 0.0 |
Fertility by Age by Marriage Status in Woodmere
| Age Bracket | Married | Unmarried |
| 15 to 19 years | 0 (0.0%) | 0 (0.0%) |
| 20 to 34 years | 0 (0.0%) | 0 (0.0%) |
| 35 to 50 years | 0 (0.0%) | 0 (0.0%) |
| Total | 0 (0.0%) | 0 (0.0%) |
Fertility by Education in Woodmere
| Educational Attainment | Women with Births | Births / 1,000 Women |
| Less than High School | 0 (0.0%) | 0.0 |
| High School Diploma | 0 (0.0%) | 0.0 |
| College or Associate's Degree | 0 (0.0%) | 0.0 |
| Bachelor's Degree | 0 (0.0%) | 0.0 |
| Graduate Degree | 0 (0.0%) | 0.0 |
| Total | 0 (0.0%) | 0.0 |
Fertility by Education by Marriage Status in Woodmere
| Educational Attainment | Married | Unmarried |
| Less than High School | 0 (0.0%) | 0 (0.0%) |
| High School Diploma | 0 (0.0%) | 0 (0.0%) |
| College or Associate's Degree | 0 (0.0%) | 0 (0.0%) |
| Bachelor's Degree | 0 (0.0%) | 0 (0.0%) |
| Graduate Degree | 0 (0.0%) | 0 (0.0%) |
| Total | 0 (0.0%) | 0 (0.0%) |
Income in Woodmere
Income Overview in Woodmere
Per Capita Income in Woodmere is $34,042, while median incomes of families and households are $73,438 and $49,609 respectively.
| Characteristic | Number | Measure |
| Per Capita Income | 683 | $34,042 |
| Median Family Income | 167 | $73,438 |
| Mean Family Income | 167 | $105,698 |
| Median Household Income | 287 | $49,609 |
| Mean Household Income | 287 | $79,824 |
| Income Deficit | 167 | $0 |
| Wage / Income Gap (%) | 683 | 0.00% |
| Wage / Income Gap ($) | 683 | 100.00¢ per $1 |
| Gini / Inequality Index | 683 | 0.51 |
Earnings by Sex in Woodmere
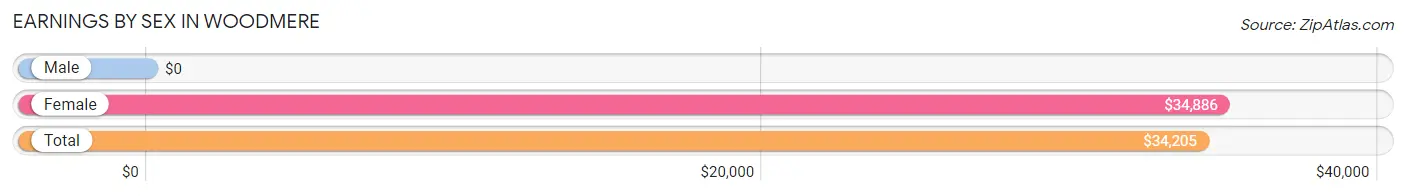
| Sex | Number | Average Earnings |
| Male | 168 (47.9%) | $0 |
| Female | 183 (52.1%) | $34,886 |
| Total | 351 (100.0%) | $34,205 |
Earnings by Sex by Income Bracket in Woodmere
The most common earnings brackets in Woodmere are $25,000 to $29,999 for men (51 | 30.4%) and $25,000 to $29,999 for women (28 | 15.3%).
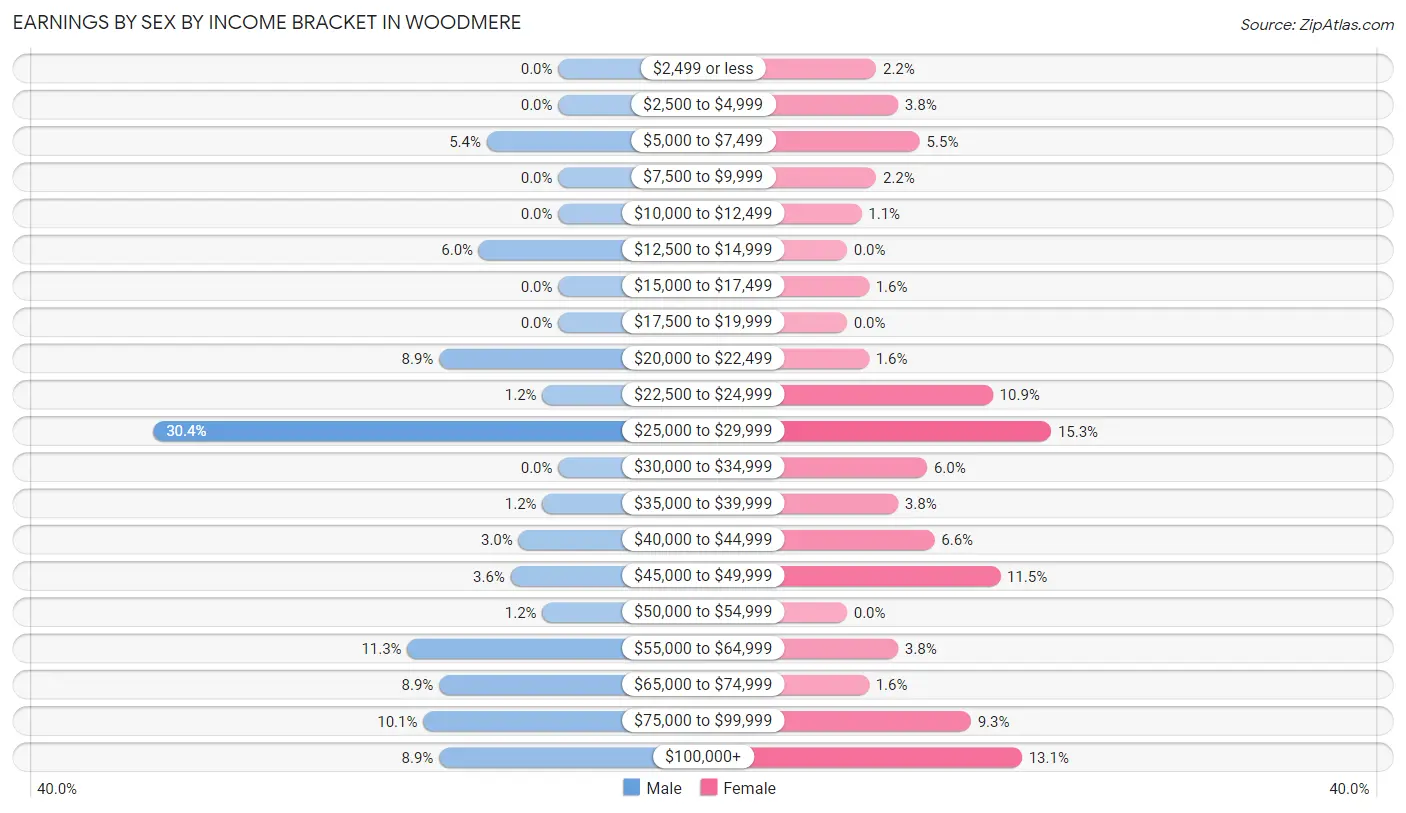
| Income | Male | Female |
| $2,499 or less | 0 (0.0%) | 4 (2.2%) |
| $2,500 to $4,999 | 0 (0.0%) | 7 (3.8%) |
| $5,000 to $7,499 | 9 (5.4%) | 10 (5.5%) |
| $7,500 to $9,999 | 0 (0.0%) | 4 (2.2%) |
| $10,000 to $12,499 | 0 (0.0%) | 2 (1.1%) |
| $12,500 to $14,999 | 10 (5.9%) | 0 (0.0%) |
| $15,000 to $17,499 | 0 (0.0%) | 3 (1.6%) |
| $17,500 to $19,999 | 0 (0.0%) | 0 (0.0%) |
| $20,000 to $22,499 | 15 (8.9%) | 3 (1.6%) |
| $22,500 to $24,999 | 2 (1.2%) | 20 (10.9%) |
| $25,000 to $29,999 | 51 (30.4%) | 28 (15.3%) |
| $30,000 to $34,999 | 0 (0.0%) | 11 (6.0%) |
| $35,000 to $39,999 | 2 (1.2%) | 7 (3.8%) |
| $40,000 to $44,999 | 5 (3.0%) | 12 (6.6%) |
| $45,000 to $49,999 | 6 (3.6%) | 21 (11.5%) |
| $50,000 to $54,999 | 2 (1.2%) | 0 (0.0%) |
| $55,000 to $64,999 | 19 (11.3%) | 7 (3.8%) |
| $65,000 to $74,999 | 15 (8.9%) | 3 (1.6%) |
| $75,000 to $99,999 | 17 (10.1%) | 17 (9.3%) |
| $100,000+ | 15 (8.9%) | 24 (13.1%) |
| Total | 168 (100.0%) | 183 (100.0%) |
Earnings by Sex by Educational Attainment in Woodmere
Average earnings in Woodmere are $36,875 for men and $33,750 for women, a difference of 8.5%. Men with an educational attainment of graduate degree enjoy the highest average annual earnings of $79,583, while those with high school diploma education earn the least with $28,393. Women with an educational attainment of graduate degree earn the most with the average annual earnings of $46,667, while those with high school diploma education have the smallest earnings of $23,482.
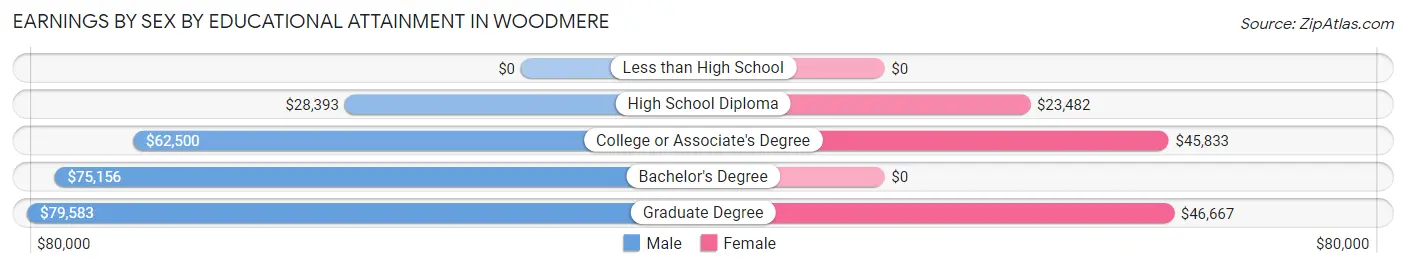
| Educational Attainment | Male Income | Female Income |
| Less than High School | - | - |
| High School Diploma | $28,393 | $23,482 |
| College or Associate's Degree | $62,500 | $45,833 |
| Bachelor's Degree | $75,156 | $0 |
| Graduate Degree | $79,583 | $46,667 |
| Total | $36,875 | $33,750 |
Family Income in Woodmere
Family Income Brackets in Woodmere
According to the Woodmere family income data, there are 45 families falling into the $25,000 to $34,999 income range, which is the most common income bracket and makes up 27.0% of all families.
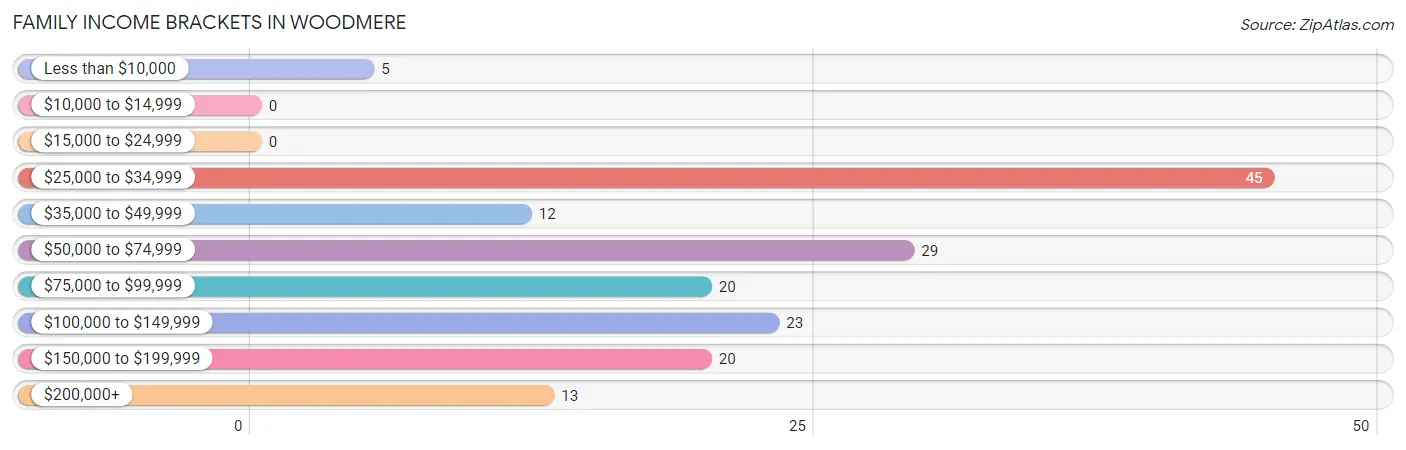
| Income Bracket | # Families | % Families |
| Less than $10,000 | 5 | 3.0% |
| $10,000 to $14,999 | 0 | 0.0% |
| $15,000 to $24,999 | 0 | 0.0% |
| $25,000 to $34,999 | 45 | 26.9% |
| $35,000 to $49,999 | 12 | 7.2% |
| $50,000 to $74,999 | 29 | 17.4% |
| $75,000 to $99,999 | 20 | 12.0% |
| $100,000 to $149,999 | 23 | 13.8% |
| $150,000 to $199,999 | 20 | 12.0% |
| $200,000+ | 13 | 7.8% |
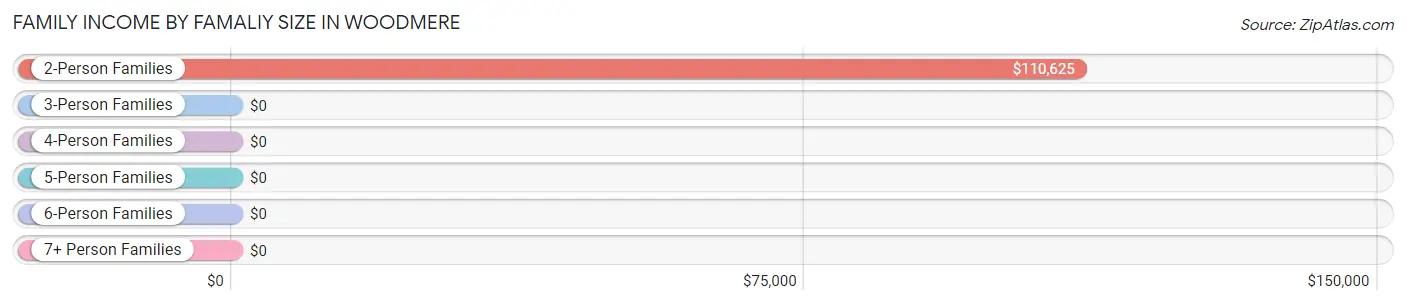
Family Income by Famaliy Size in Woodmere
2-person families (67 | 40.1%) account for the highest median family income in Woodmere with $110,625 per family, while 2-person families (67 | 40.1%) have the highest median income of $55,312 per family member.
| Income Bracket | # Families | Median Income |
| 2-Person Families | 67 (40.1%) | $110,625 |
| 3-Person Families | 67 (40.1%) | $0 |
| 4-Person Families | 8 (4.8%) | $0 |
| 5-Person Families | 25 (15.0%) | $0 |
| 6-Person Families | 0 (0.0%) | $0 |
| 7+ Person Families | 0 (0.0%) | $0 |
| Total | 167 (100.0%) | $73,438 |
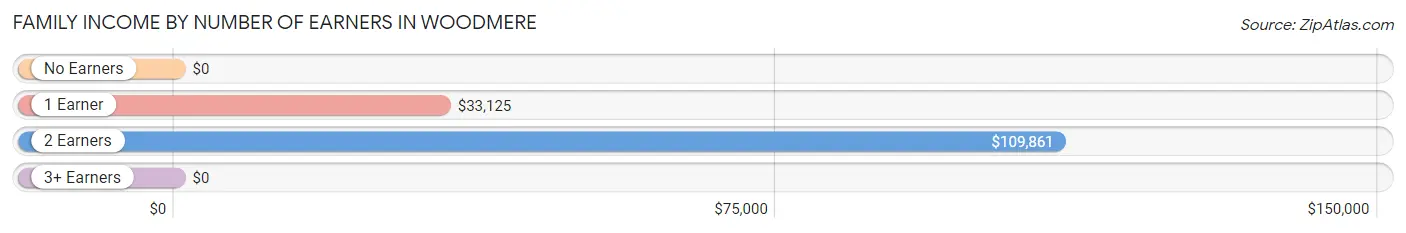
Family Income by Number of Earners in Woodmere
| Number of Earners | # Families | Median Income |
| No Earners | 10 (6.0%) | $0 |
| 1 Earner | 86 (51.5%) | $33,125 |
| 2 Earners | 69 (41.3%) | $109,861 |
| 3+ Earners | 2 (1.2%) | $0 |
| Total | 167 (100.0%) | $73,438 |
Household Income in Woodmere
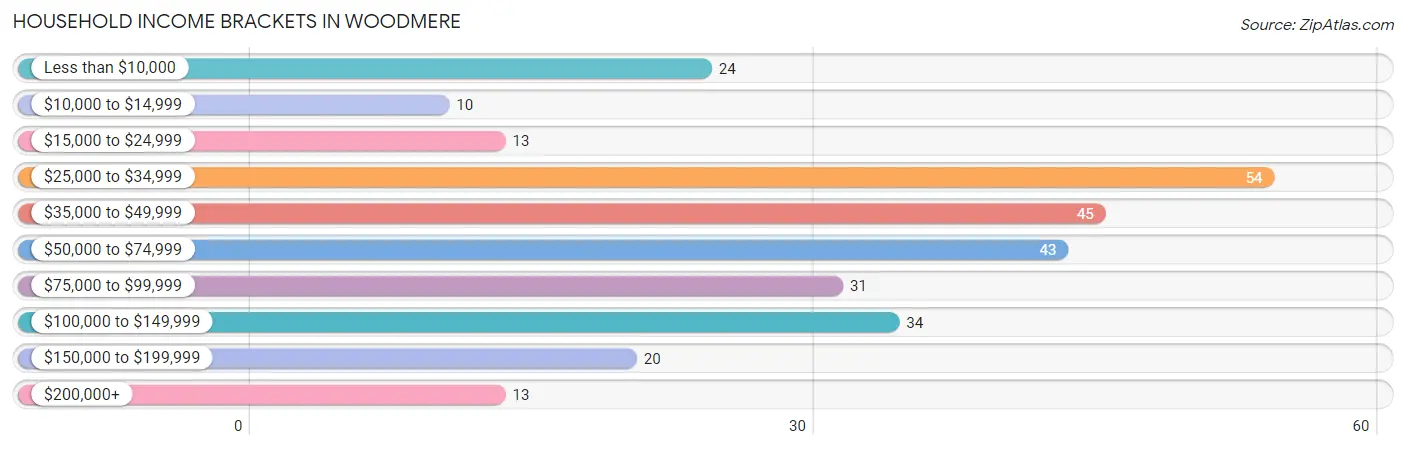
Household Income Brackets in Woodmere
With 54 households falling in the category, the $25,000 to $34,999 income range is the most frequent in Woodmere, accounting for 18.8% of all households. In contrast, only 10 households (3.5%) fall into the $10,000 to $14,999 income bracket, making it the least populous group.
| Income Bracket | # Households | % Households |
| Less than $10,000 | 24 | 8.4% |
| $10,000 to $14,999 | 10 | 3.5% |
| $15,000 to $24,999 | 13 | 4.5% |
| $25,000 to $34,999 | 54 | 18.8% |
| $35,000 to $49,999 | 45 | 15.7% |
| $50,000 to $74,999 | 43 | 15.0% |
| $75,000 to $99,999 | 31 | 10.8% |
| $100,000 to $149,999 | 34 | 11.8% |
| $150,000 to $199,999 | 20 | 7.0% |
| $200,000+ | 13 | 4.5% |
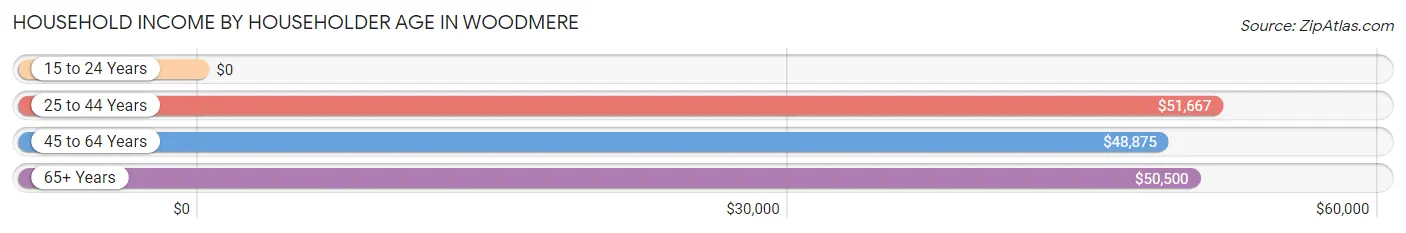
Household Income by Householder Age in Woodmere
The median household income in Woodmere is $49,609, with the highest median household income of $51,667 found in the 25 to 44 years age bracket for the primary householder. A total of 138 households (48.1%) fall into this category. Meanwhile, the 15 to 24 years age bracket for the primary householder has the lowest median household income of $0, with 32 households (11.2%) in this group.
| Income Bracket | # Households | Median Income |
| 15 to 24 Years | 32 (11.2%) | $0 |
| 25 to 44 Years | 138 (48.1%) | $51,667 |
| 45 to 64 Years | 71 (24.7%) | $48,875 |
| 65+ Years | 46 (16.0%) | $50,500 |
| Total | 287 (100.0%) | $49,609 |
Poverty in Woodmere
Income Below Poverty by Sex and Age in Woodmere
With 16.2% poverty level for males and 7.4% for females among the residents of Woodmere, 15 year old males and 75 year old and over females are the most vulnerable to poverty, with 5 males (100.0%) and 6 females (37.5%) in their respective age groups living below the poverty level.
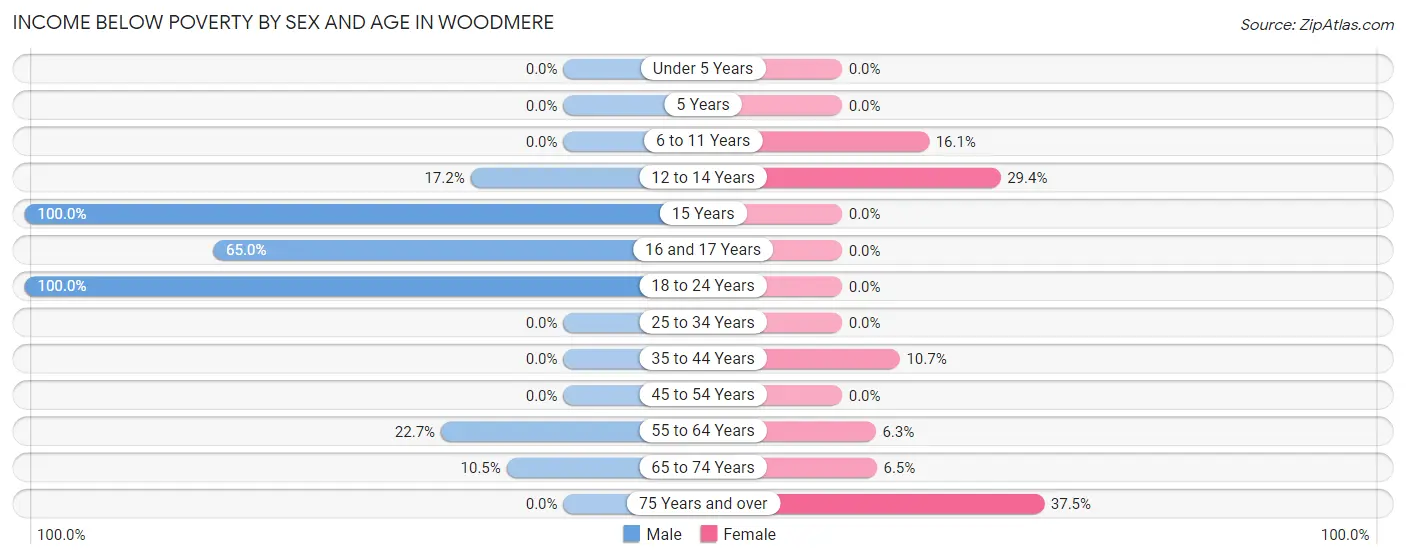
| Age Bracket | Male | Female |
| Under 5 Years | 0 (0.0%) | 0 (0.0%) |
| 5 Years | 0 (0.0%) | 0 (0.0%) |
| 6 to 11 Years | 0 (0.0%) | 5 (16.1%) |
| 12 to 14 Years | 5 (17.2%) | 5 (29.4%) |
| 15 Years | 5 (100.0%) | 0 (0.0%) |
| 16 and 17 Years | 13 (65.0%) | 0 (0.0%) |
| 18 to 24 Years | 17 (100.0%) | 0 (0.0%) |
| 25 to 34 Years | 0 (0.0%) | 0 (0.0%) |
| 35 to 44 Years | 0 (0.0%) | 9 (10.7%) |
| 45 to 54 Years | 0 (0.0%) | 0 (0.0%) |
| 55 to 64 Years | 5 (22.7%) | 2 (6.2%) |
| 65 to 74 Years | 2 (10.5%) | 2 (6.5%) |
| 75 Years and over | 0 (0.0%) | 6 (37.5%) |
| Total | 47 (16.2%) | 29 (7.4%) |
Income Above Poverty by Sex and Age in Woodmere
According to the poverty statistics in Woodmere, males aged under 5 years and females aged under 5 years are the age groups that are most secure financially, with 100.0% of males and 100.0% of females in these age groups living above the poverty line.
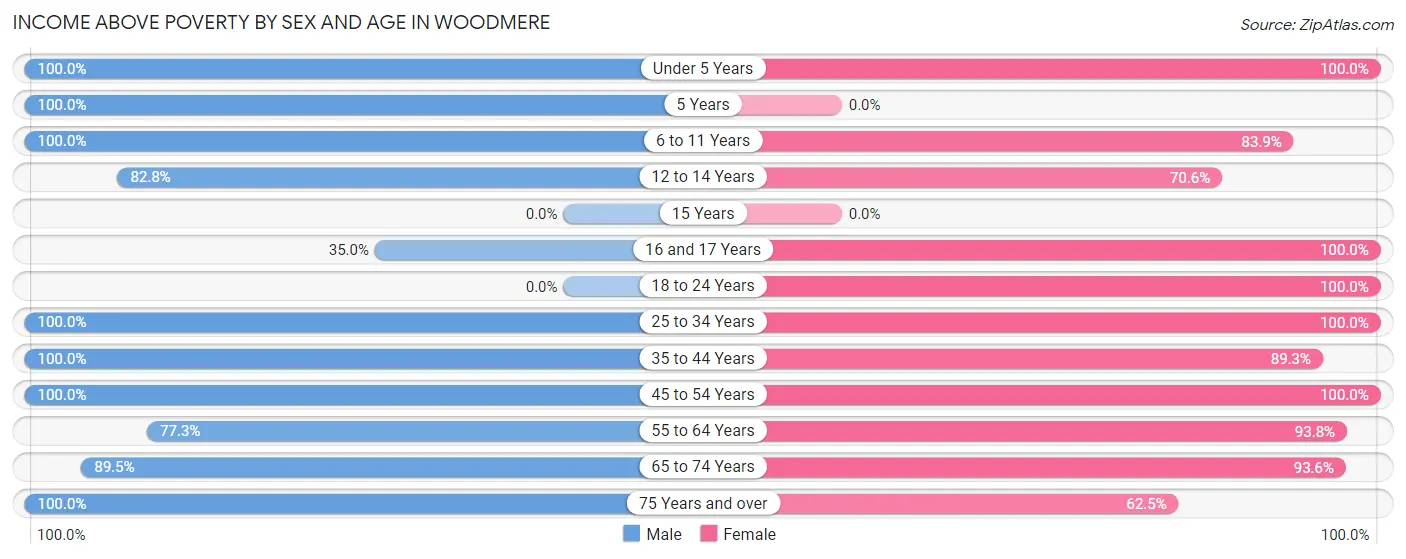
| Age Bracket | Male | Female |
| Under 5 Years | 5 (100.0%) | 61 (100.0%) |
| 5 Years | 3 (100.0%) | 0 (0.0%) |
| 6 to 11 Years | 18 (100.0%) | 26 (83.9%) |
| 12 to 14 Years | 24 (82.8%) | 12 (70.6%) |
| 15 Years | 0 (0.0%) | 0 (0.0%) |
| 16 and 17 Years | 7 (35.0%) | 17 (100.0%) |
| 18 to 24 Years | 0 (0.0%) | 31 (100.0%) |
| 25 to 34 Years | 23 (100.0%) | 51 (100.0%) |
| 35 to 44 Years | 67 (100.0%) | 75 (89.3%) |
| 45 to 54 Years | 48 (100.0%) | 22 (100.0%) |
| 55 to 64 Years | 17 (77.3%) | 30 (93.8%) |
| 65 to 74 Years | 17 (89.5%) | 29 (93.5%) |
| 75 Years and over | 14 (100.0%) | 10 (62.5%) |
| Total | 243 (83.8%) | 364 (92.6%) |
Income Below Poverty Among Married-Couple Families in Woodmere
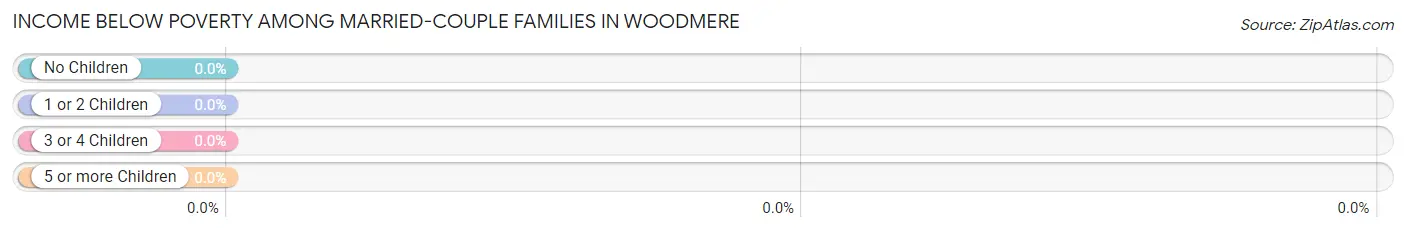
| Children | Above Poverty | Below Poverty |
| No Children | 56 (100.0%) | 0 (0.0%) |
| 1 or 2 Children | 64 (100.0%) | 0 (0.0%) |
| 3 or 4 Children | 12 (100.0%) | 0 (0.0%) |
| 5 or more Children | 0 (0.0%) | 0 (0.0%) |
| Total | 132 (100.0%) | 0 (0.0%) |
Income Below Poverty Among Single-Parent Households in Woodmere
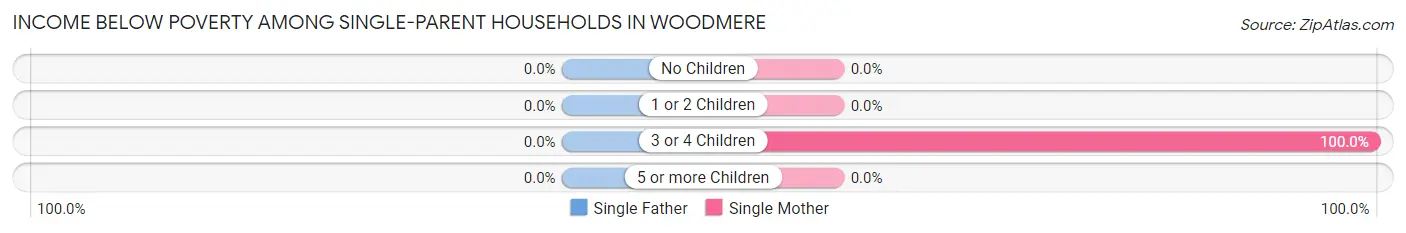
| Children | Single Father | Single Mother |
| No Children | 0 (0.0%) | 0 (0.0%) |
| 1 or 2 Children | 0 (0.0%) | 0 (0.0%) |
| 3 or 4 Children | 0 (0.0%) | 5 (100.0%) |
| 5 or more Children | 0 (0.0%) | 0 (0.0%) |
| Total | 0 (0.0%) | 5 (25.0%) |
Income Below Poverty Among Married-Couple vs Single-Parent Households in Woodmere
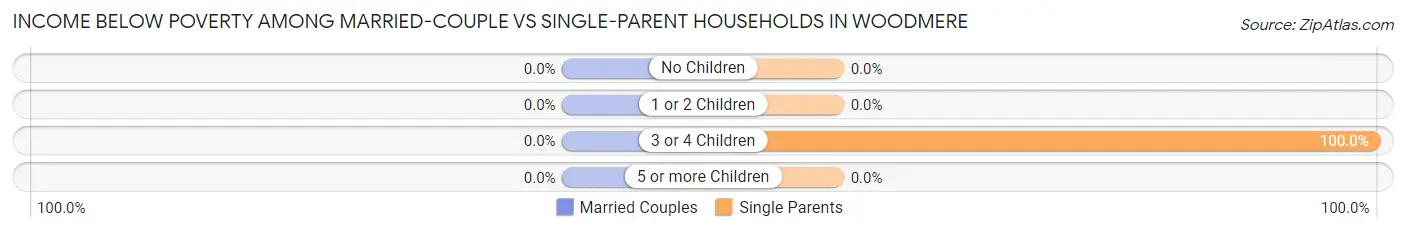
| Children | Married-Couple Families | Single-Parent Households |
| No Children | 0 (0.0%) | 0 (0.0%) |
| 1 or 2 Children | 0 (0.0%) | 0 (0.0%) |
| 3 or 4 Children | 0 (0.0%) | 5 (100.0%) |
| 5 or more Children | 0 (0.0%) | 0 (0.0%) |
| Total | 0 (0.0%) | 5 (14.3%) |
Employment Characteristics in Woodmere
Employment by Class of Employer in Woodmere
Among the 325 employed individuals in Woodmere, private company employees (213 | 65.5%), not-for-profit organizations (49 | 15.1%), and local government employees (32 | 9.9%) make up the most common classes of employment.
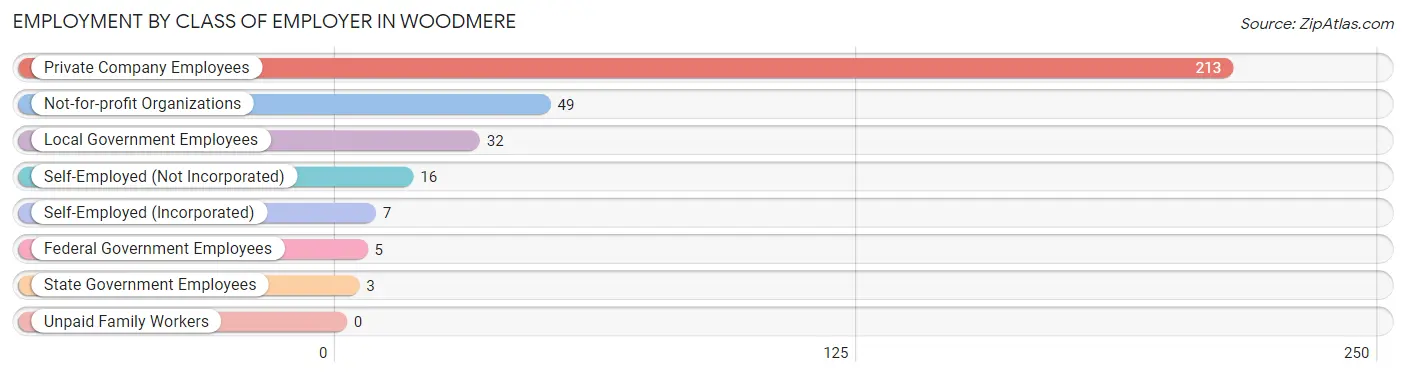
| Employer Class | # Employees | % Employees |
| Private Company Employees | 213 | 65.5% |
| Self-Employed (Incorporated) | 7 | 2.1% |
| Self-Employed (Not Incorporated) | 16 | 4.9% |
| Not-for-profit Organizations | 49 | 15.1% |
| Local Government Employees | 32 | 9.9% |
| State Government Employees | 3 | 0.9% |
| Federal Government Employees | 5 | 1.5% |
| Unpaid Family Workers | 0 | 0.0% |
| Total | 325 | 100.0% |
Employment Status by Age in Woodmere
According to the labor force statistics for Woodmere, out of the total population over 16 years of age (514), 71.6% or 368 individuals are in the labor force, with 11.7% or 43 of them unemployed. The age group with the highest labor force participation rate is 45 to 54 years, with 94.3% or 66 individuals in the labor force. Within the labor force, the 20 to 24 years age range has the highest percentage of unemployed individuals, with 31.6% or 12 of them being unemployed.
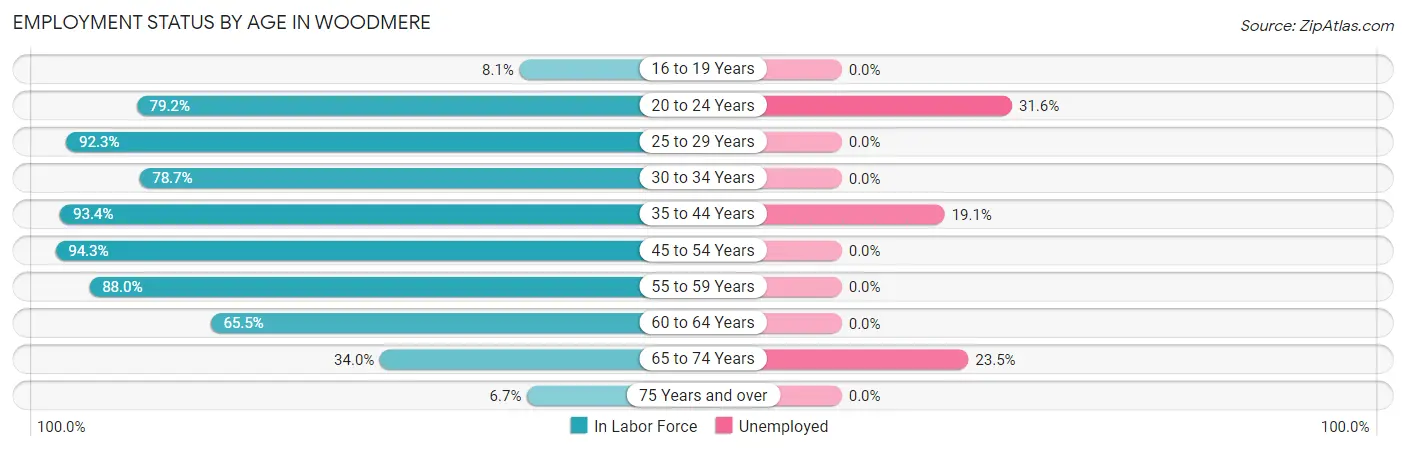
| Age Bracket | In Labor Force | Unemployed |
| 16 to 19 Years | 3 (8.1%) | 0 (0.0%) |
| 20 to 24 Years | 38 (79.2%) | 12 (31.6%) |
| 25 to 29 Years | 12 (92.3%) | 0 (0.0%) |
| 30 to 34 Years | 48 (78.7%) | 0 (0.0%) |
| 35 to 44 Years | 141 (93.4%) | 27 (19.1%) |
| 45 to 54 Years | 66 (94.3%) | 0 (0.0%) |
| 55 to 59 Years | 22 (88.0%) | 0 (0.0%) |
| 60 to 64 Years | 19 (65.5%) | 0 (0.0%) |
| 65 to 74 Years | 17 (34.0%) | 4 (23.5%) |
| 75 Years and over | 2 (6.7%) | 0 (0.0%) |
| Total | 368 (71.6%) | 43 (11.7%) |
Employment Status by Educational Attainment in Woodmere
According to labor force statistics for Woodmere, 88.3% of individuals (308) out of the total population between 25 and 64 years of age (349) are in the labor force, with 8.8% or 27 of them being unemployed. The group with the highest labor force participation rate are those with the educational attainment of high school diploma, with 93.2% or 123 individuals in the labor force. Within the labor force, individuals with high school diploma education have the highest percentage of unemployment, with 22.0% or 27 of them being unemployed.
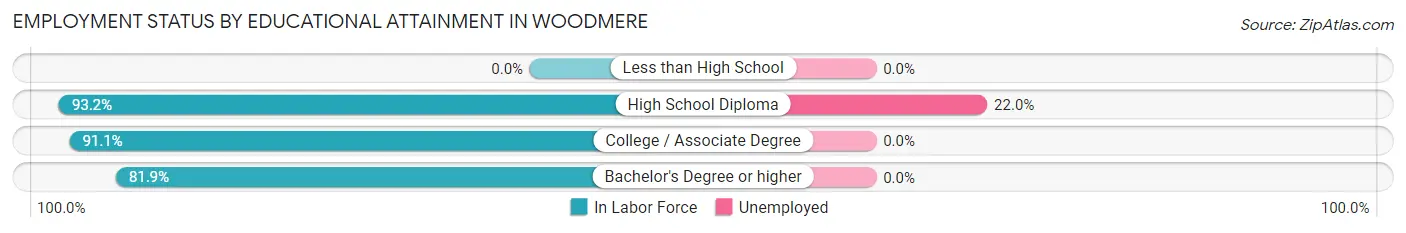
| Educational Attainment | In Labor Force | Unemployed |
| Less than High School | 0 (0.0%) | 0 (0.0%) |
| High School Diploma | 123 (93.2%) | 29 (22.0%) |
| College / Associate Degree | 72 (91.1%) | 0 (0.0%) |
| Bachelor's Degree or higher | 113 (81.9%) | 0 (0.0%) |
| Total | 308 (88.3%) | 31 (8.8%) |
Employment Occupations by Sex in Woodmere
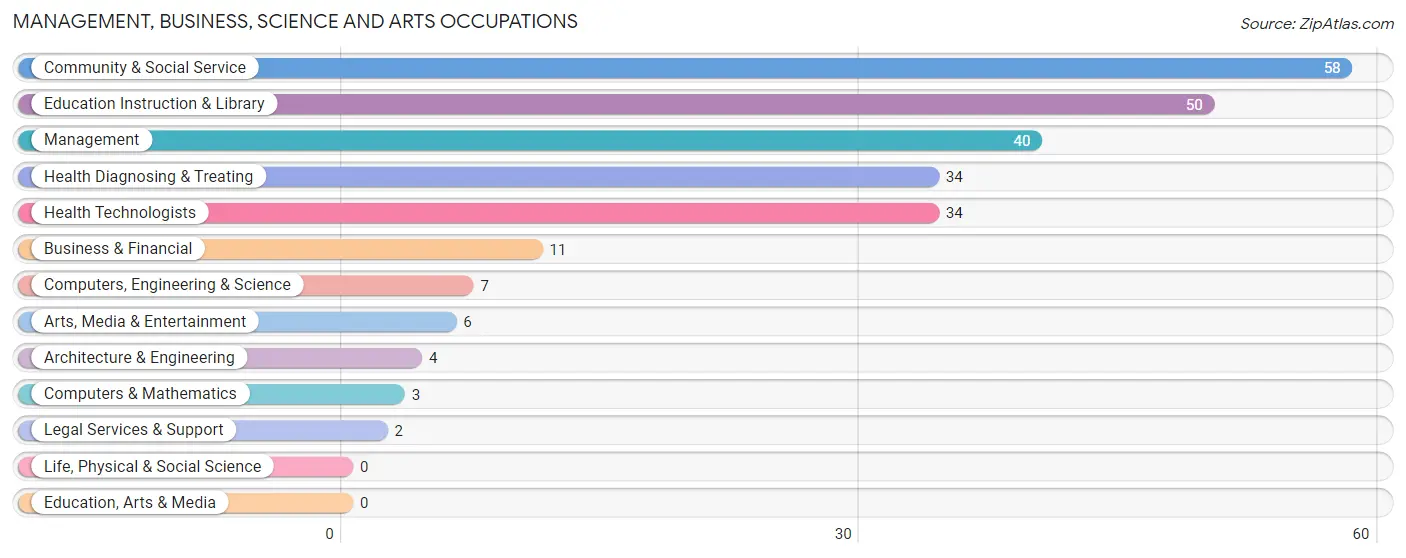
Management, Business, Science and Arts Occupations
The most common Management, Business, Science and Arts occupations in Woodmere are Community & Social Service (58 | 18.0%), Education Instruction & Library (50 | 15.5%), Management (40 | 12.4%), Health Diagnosing & Treating (34 | 10.5%), and Health Technologists (34 | 10.5%).
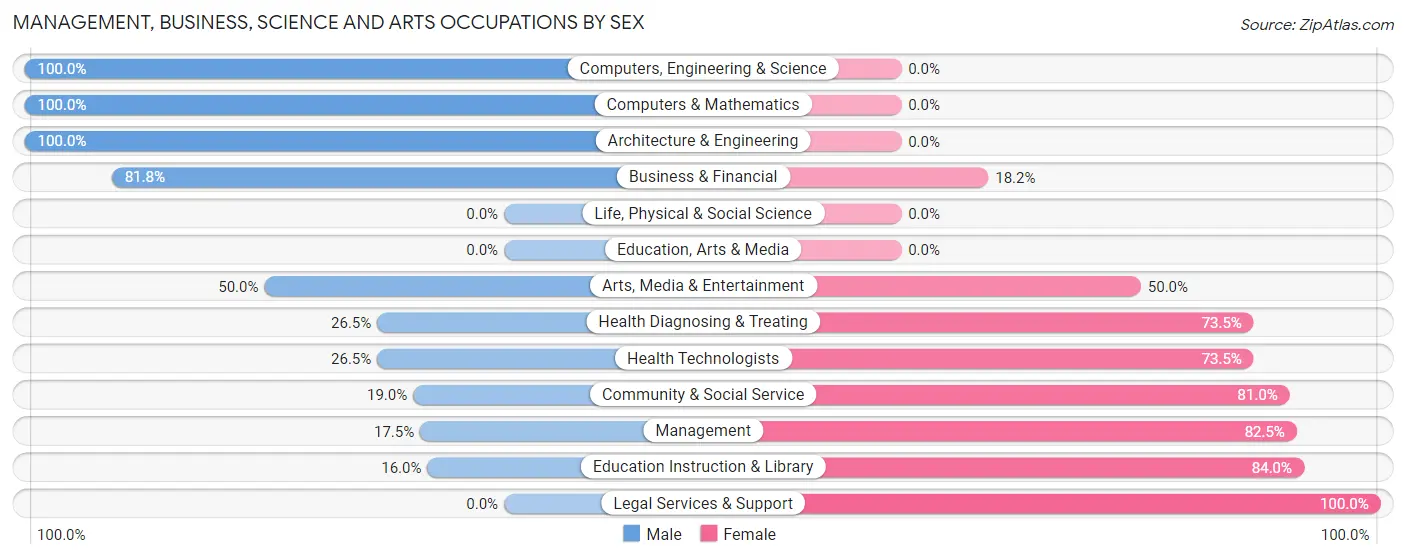
Management, Business, Science and Arts Occupations by Sex
Within the Management, Business, Science and Arts occupations in Woodmere, the most male-oriented occupations are Computers, Engineering & Science (100.0%), Computers & Mathematics (100.0%), and Architecture & Engineering (100.0%), while the most female-oriented occupations are Legal Services & Support (100.0%), Education Instruction & Library (84.0%), and Management (82.5%).
| Occupation | Male | Female |
| Management | 7 (17.5%) | 33 (82.5%) |
| Business & Financial | 9 (81.8%) | 2 (18.2%) |
| Computers, Engineering & Science | 7 (100.0%) | 0 (0.0%) |
| Computers & Mathematics | 3 (100.0%) | 0 (0.0%) |
| Architecture & Engineering | 4 (100.0%) | 0 (0.0%) |
| Life, Physical & Social Science | 0 (0.0%) | 0 (0.0%) |
| Community & Social Service | 11 (19.0%) | 47 (81.0%) |
| Education, Arts & Media | 0 (0.0%) | 0 (0.0%) |
| Legal Services & Support | 0 (0.0%) | 2 (100.0%) |
| Education Instruction & Library | 8 (16.0%) | 42 (84.0%) |
| Arts, Media & Entertainment | 3 (50.0%) | 3 (50.0%) |
| Health Diagnosing & Treating | 9 (26.5%) | 25 (73.5%) |
| Health Technologists | 9 (26.5%) | 25 (73.5%) |
| Total (Category) | 43 (28.7%) | 107 (71.3%) |
| Total (Overall) | 157 (48.6%) | 166 (51.4%) |
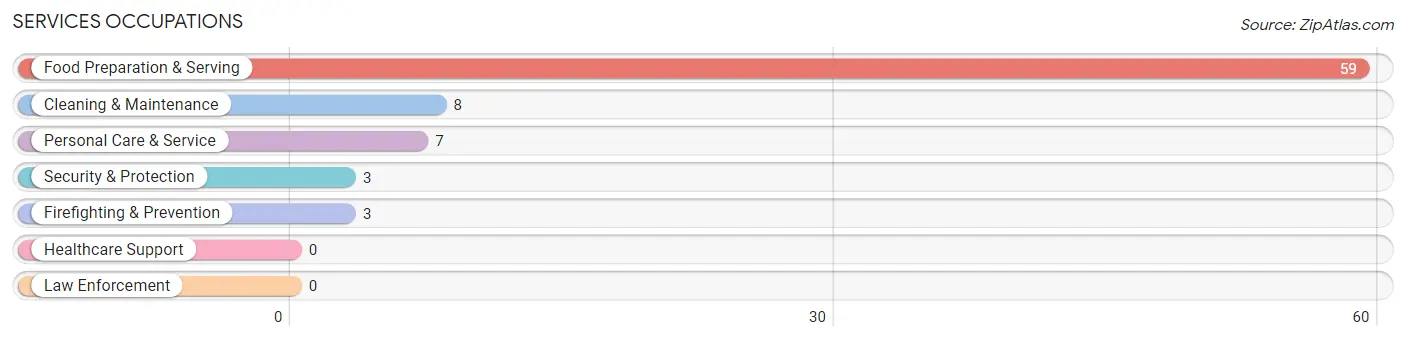
Services Occupations
The most common Services occupations in Woodmere are Food Preparation & Serving (59 | 18.3%), Cleaning & Maintenance (8 | 2.5%), Personal Care & Service (7 | 2.2%), Security & Protection (3 | 0.9%), and Firefighting & Prevention (3 | 0.9%).
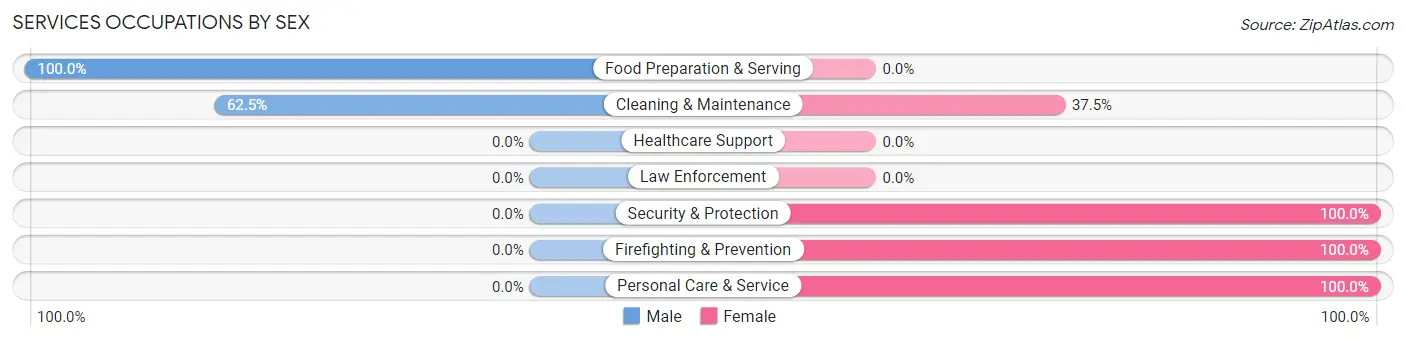
Services Occupations by Sex
Within the Services occupations in Woodmere, the most male-oriented occupations are Food Preparation & Serving (100.0%), and Cleaning & Maintenance (62.5%), while the most female-oriented occupations are Security & Protection (100.0%), Firefighting & Prevention (100.0%), and Personal Care & Service (100.0%).
| Occupation | Male | Female |
| Healthcare Support | 0 (0.0%) | 0 (0.0%) |
| Security & Protection | 0 (0.0%) | 3 (100.0%) |
| Firefighting & Prevention | 0 (0.0%) | 3 (100.0%) |
| Law Enforcement | 0 (0.0%) | 0 (0.0%) |
| Food Preparation & Serving | 59 (100.0%) | 0 (0.0%) |
| Cleaning & Maintenance | 5 (62.5%) | 3 (37.5%) |
| Personal Care & Service | 0 (0.0%) | 7 (100.0%) |
| Total (Category) | 64 (83.1%) | 13 (16.9%) |
| Total (Overall) | 157 (48.6%) | 166 (51.4%) |
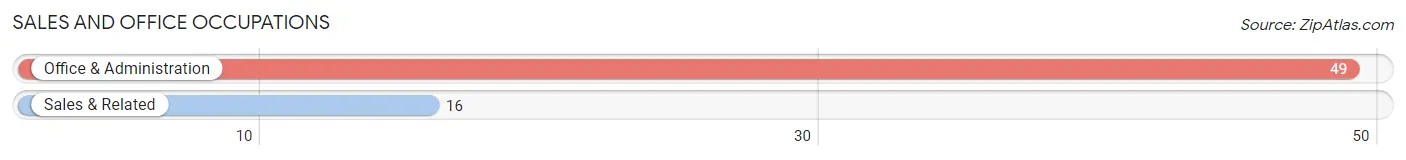
Sales and Office Occupations
The most common Sales and Office occupations in Woodmere are Office & Administration (49 | 15.2%), and Sales & Related (16 | 5.0%).
Sales and Office Occupations by Sex
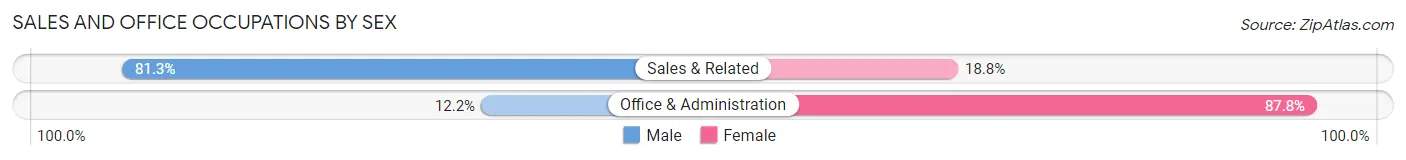
| Occupation | Male | Female |
| Sales & Related | 13 (81.2%) | 3 (18.8%) |
| Office & Administration | 6 (12.2%) | 43 (87.8%) |
| Total (Category) | 19 (29.2%) | 46 (70.8%) |
| Total (Overall) | 157 (48.6%) | 166 (51.4%) |
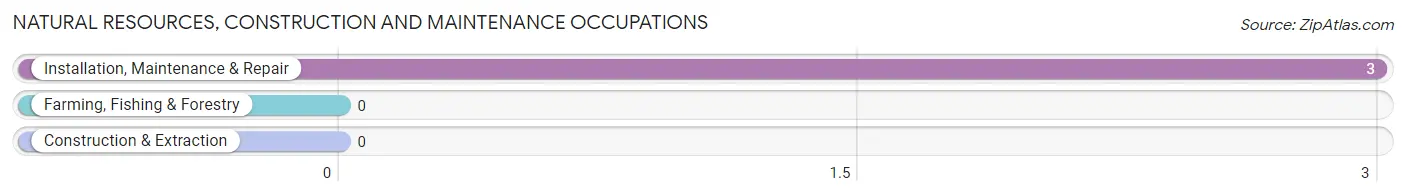
Natural Resources, Construction and Maintenance Occupations
The most common Natural Resources, Construction and Maintenance occupations in Woodmere are , and Installation, Maintenance & Repair (3 | 0.9%).
Natural Resources, Construction and Maintenance Occupations by Sex
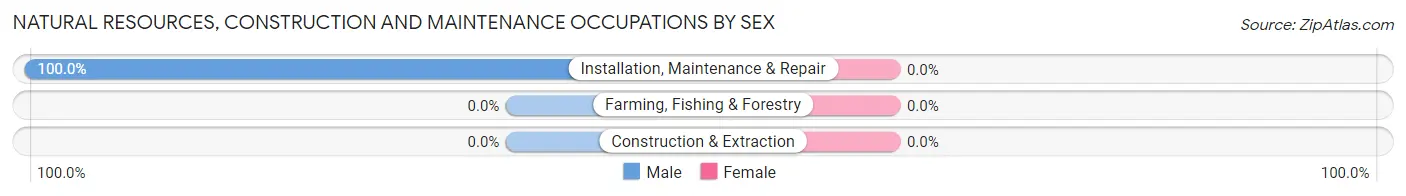
| Occupation | Male | Female |
| Farming, Fishing & Forestry | 0 (0.0%) | 0 (0.0%) |
| Construction & Extraction | 0 (0.0%) | 0 (0.0%) |
| Installation, Maintenance & Repair | 3 (100.0%) | 0 (0.0%) |
| Total (Category) | 3 (100.0%) | 0 (0.0%) |
| Total (Overall) | 157 (48.6%) | 166 (51.4%) |
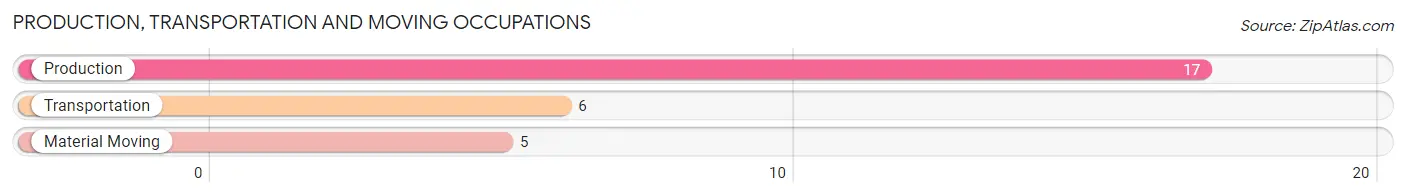
Production, Transportation and Moving Occupations
The most common Production, Transportation and Moving occupations in Woodmere are Production (17 | 5.3%), Transportation (6 | 1.9%), and Material Moving (5 | 1.5%).
Production, Transportation and Moving Occupations by Sex
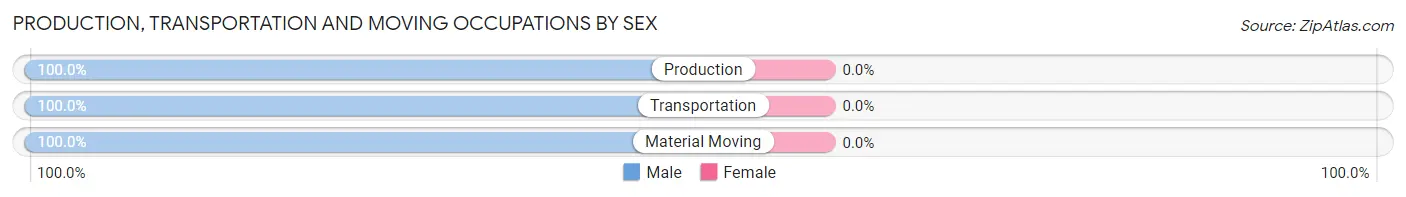
| Occupation | Male | Female |
| Production | 17 (100.0%) | 0 (0.0%) |
| Transportation | 6 (100.0%) | 0 (0.0%) |
| Material Moving | 5 (100.0%) | 0 (0.0%) |
| Total (Category) | 28 (100.0%) | 0 (0.0%) |
| Total (Overall) | 157 (48.6%) | 166 (51.4%) |
Employment Industries by Sex in Woodmere
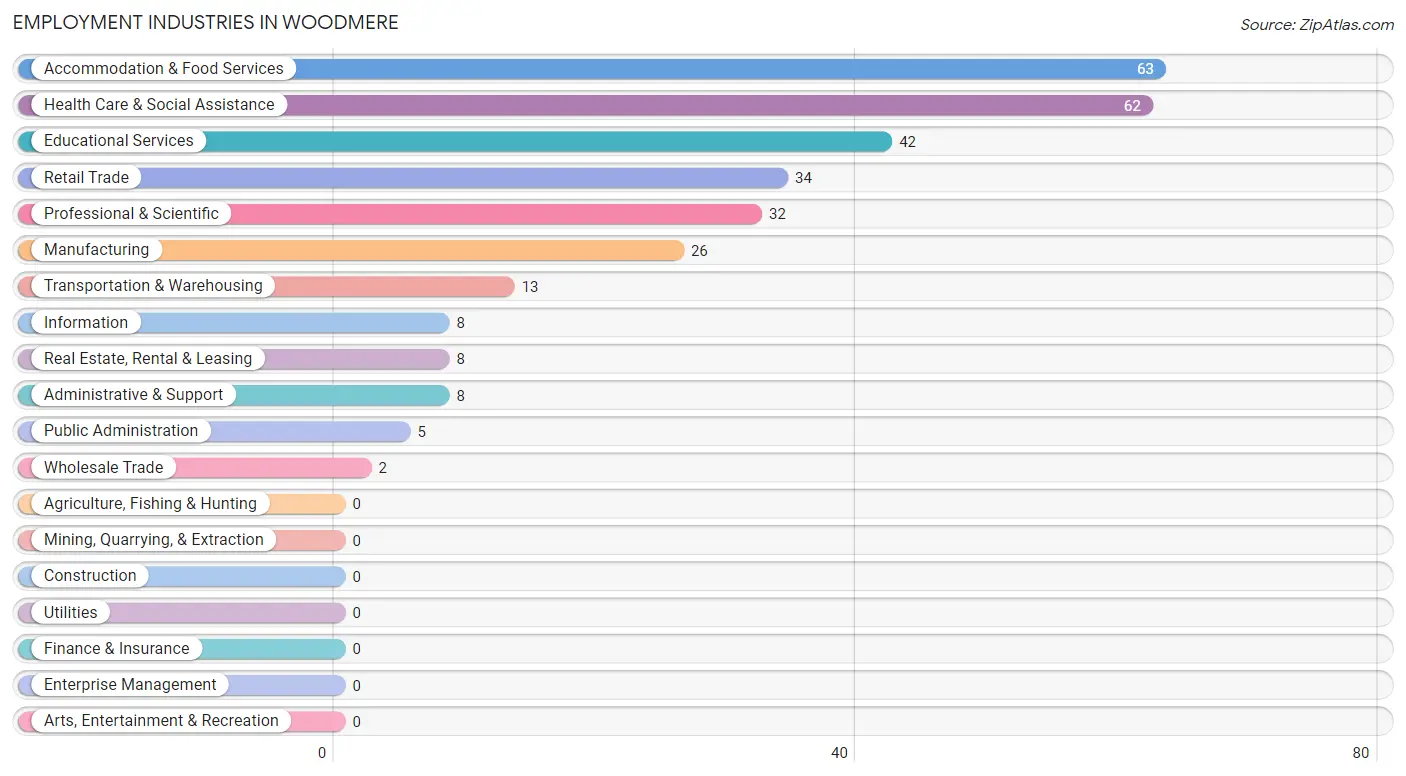
Employment Industries in Woodmere
The major employment industries in Woodmere include Accommodation & Food Services (63 | 19.5%), Health Care & Social Assistance (62 | 19.2%), Educational Services (42 | 13.0%), Retail Trade (34 | 10.5%), and Professional & Scientific (32 | 9.9%).
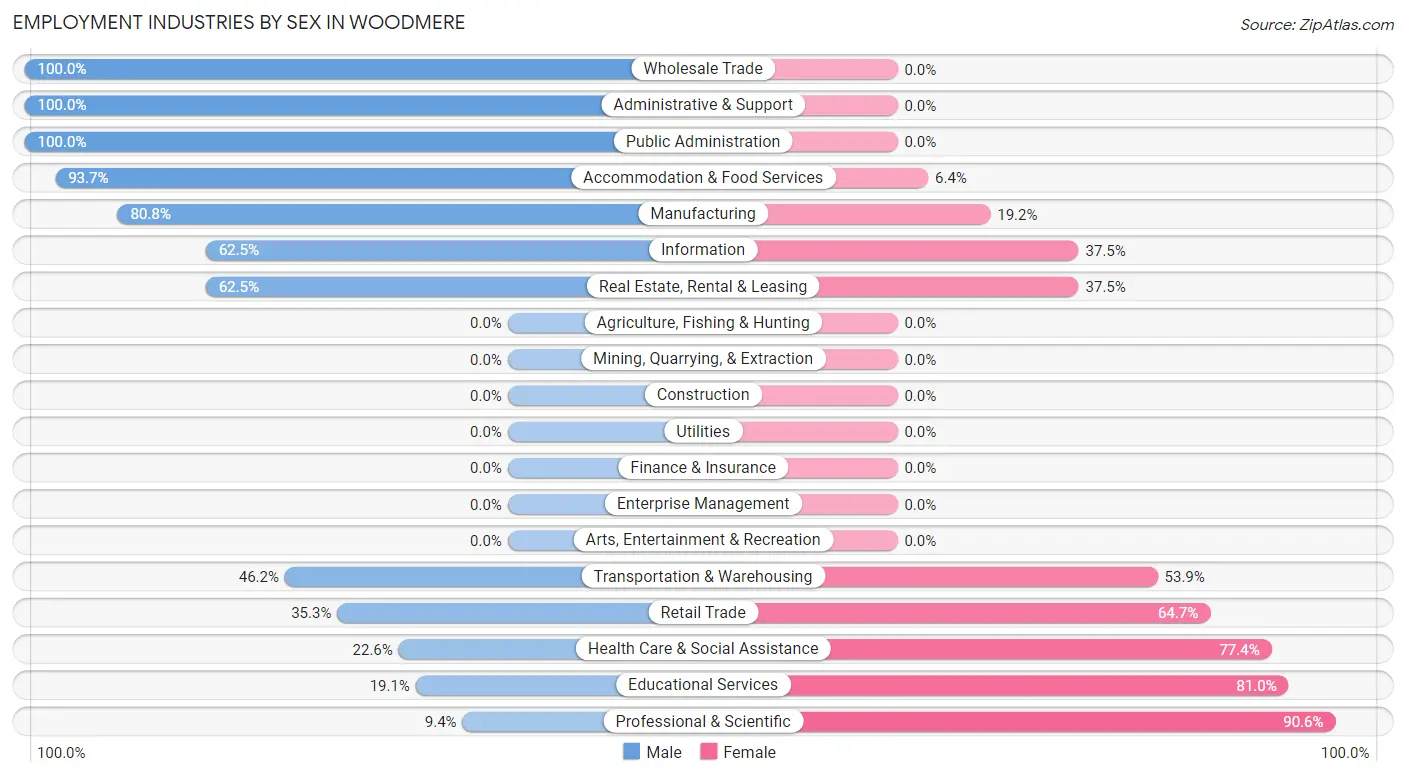
Employment Industries by Sex in Woodmere
The Woodmere industries that see more men than women are Wholesale Trade (100.0%), Administrative & Support (100.0%), and Public Administration (100.0%), whereas the industries that tend to have a higher number of women are Professional & Scientific (90.6%), Educational Services (80.9%), and Health Care & Social Assistance (77.4%).
| Industry | Male | Female |
| Agriculture, Fishing & Hunting | 0 (0.0%) | 0 (0.0%) |
| Mining, Quarrying, & Extraction | 0 (0.0%) | 0 (0.0%) |
| Construction | 0 (0.0%) | 0 (0.0%) |
| Manufacturing | 21 (80.8%) | 5 (19.2%) |
| Wholesale Trade | 2 (100.0%) | 0 (0.0%) |
| Retail Trade | 12 (35.3%) | 22 (64.7%) |
| Transportation & Warehousing | 6 (46.2%) | 7 (53.8%) |
| Utilities | 0 (0.0%) | 0 (0.0%) |
| Information | 5 (62.5%) | 3 (37.5%) |
| Finance & Insurance | 0 (0.0%) | 0 (0.0%) |
| Real Estate, Rental & Leasing | 5 (62.5%) | 3 (37.5%) |
| Professional & Scientific | 3 (9.4%) | 29 (90.6%) |
| Enterprise Management | 0 (0.0%) | 0 (0.0%) |
| Administrative & Support | 8 (100.0%) | 0 (0.0%) |
| Educational Services | 8 (19.1%) | 34 (80.9%) |
| Health Care & Social Assistance | 14 (22.6%) | 48 (77.4%) |
| Arts, Entertainment & Recreation | 0 (0.0%) | 0 (0.0%) |
| Accommodation & Food Services | 59 (93.6%) | 4 (6.4%) |
| Public Administration | 5 (100.0%) | 0 (0.0%) |
| Total | 157 (48.6%) | 166 (51.4%) |
Education in Woodmere
School Enrollment in Woodmere
The most common levels of schooling among the 191 students in Woodmere are middle school (57 | 29.8%), high school (47 | 24.6%), and elementary school (30 | 15.7%).
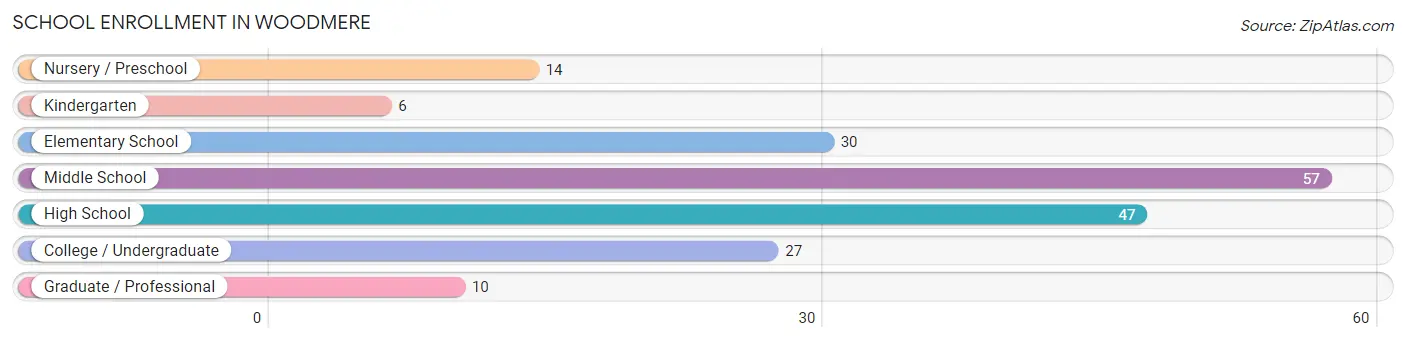
| School Level | # Students | % Students |
| Nursery / Preschool | 14 | 7.3% |
| Kindergarten | 6 | 3.1% |
| Elementary School | 30 | 15.7% |
| Middle School | 57 | 29.8% |
| High School | 47 | 24.6% |
| College / Undergraduate | 27 | 14.1% |
| Graduate / Professional | 10 | 5.2% |
| Total | 191 | 100.0% |
School Enrollment by Age by Funding Source in Woodmere
Out of a total of 191 students who are enrolled in schools in Woodmere, 48 (25.1%) attend a private institution, while the remaining 143 (74.9%) are enrolled in public schools. The age group of 25 to 34 year olds has the highest likelihood of being enrolled in private schools, with 12 (54.5% in the age bracket) enrolled. Conversely, the age group of 15 to 17 year olds has the lowest likelihood of being enrolled in a private school, with 42 (100.0% in the age bracket) attending a public institution.
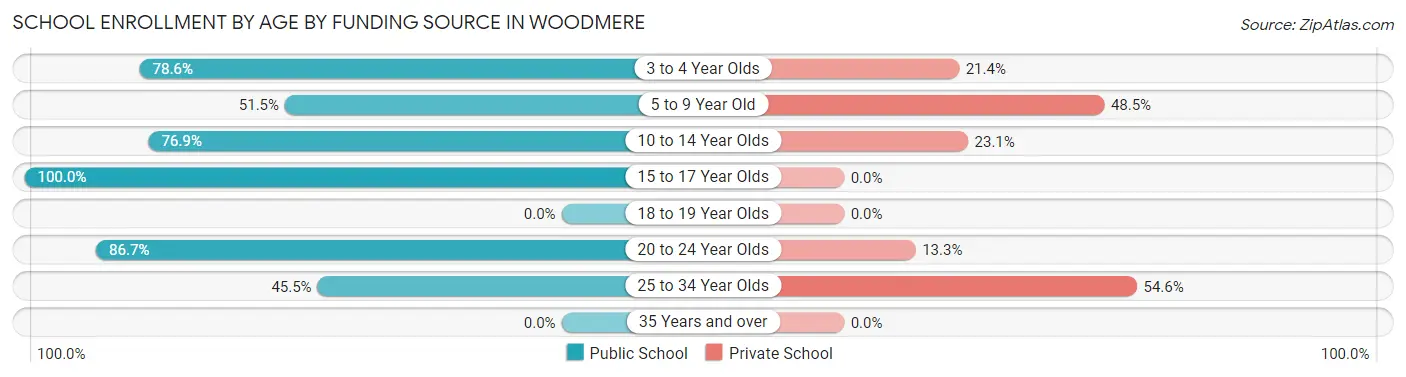
| Age Bracket | Public School | Private School |
| 3 to 4 Year Olds | 11 (78.6%) | 3 (21.4%) |
| 5 to 9 Year Old | 17 (51.5%) | 16 (48.5%) |
| 10 to 14 Year Olds | 50 (76.9%) | 15 (23.1%) |
| 15 to 17 Year Olds | 42 (100.0%) | 0 (0.0%) |
| 18 to 19 Year Olds | 0 (0.0%) | 0 (0.0%) |
| 20 to 24 Year Olds | 13 (86.7%) | 2 (13.3%) |
| 25 to 34 Year Olds | 10 (45.5%) | 12 (54.5%) |
| 35 Years and over | 0 (0.0%) | 0 (0.0%) |
| Total | 143 (74.9%) | 48 (25.1%) |
Educational Attainment by Field of Study in Woodmere
Social sciences (32 | 19.6%), engineering (27 | 16.6%), business (24 | 14.7%), science & technology (21 | 12.9%), and visual & performing arts (18 | 11.0%) are the most common fields of study among 163 individuals in Woodmere who have obtained a bachelor's degree or higher.
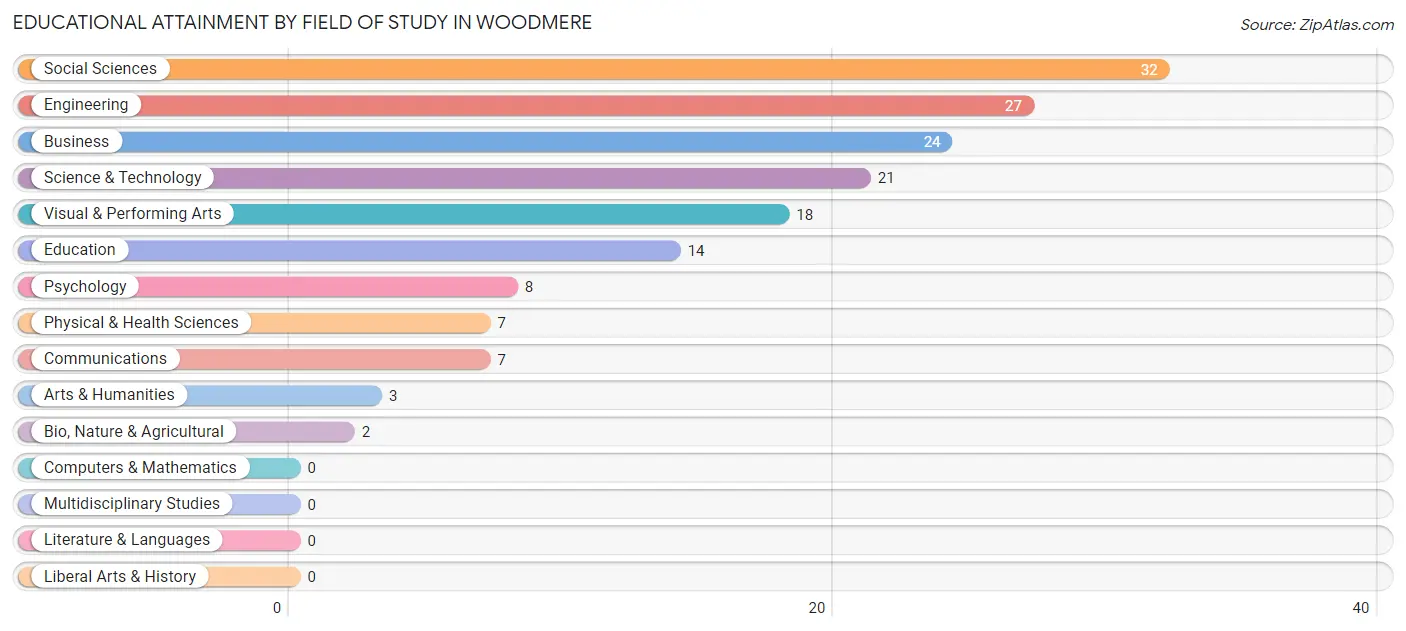
| Field of Study | # Graduates | % Graduates |
| Computers & Mathematics | 0 | 0.0% |
| Bio, Nature & Agricultural | 2 | 1.2% |
| Physical & Health Sciences | 7 | 4.3% |
| Psychology | 8 | 4.9% |
| Social Sciences | 32 | 19.6% |
| Engineering | 27 | 16.6% |
| Multidisciplinary Studies | 0 | 0.0% |
| Science & Technology | 21 | 12.9% |
| Business | 24 | 14.7% |
| Education | 14 | 8.6% |
| Literature & Languages | 0 | 0.0% |
| Liberal Arts & History | 0 | 0.0% |
| Visual & Performing Arts | 18 | 11.0% |
| Communications | 7 | 4.3% |
| Arts & Humanities | 3 | 1.8% |
| Total | 163 | 100.0% |
Transportation & Commute in Woodmere
Vehicle Availability by Sex in Woodmere
The most prevalent vehicle ownership categories in Woodmere are males with 1 vehicle (47, accounting for 29.6%) and females with 1 vehicle (73, making up 28.3%).
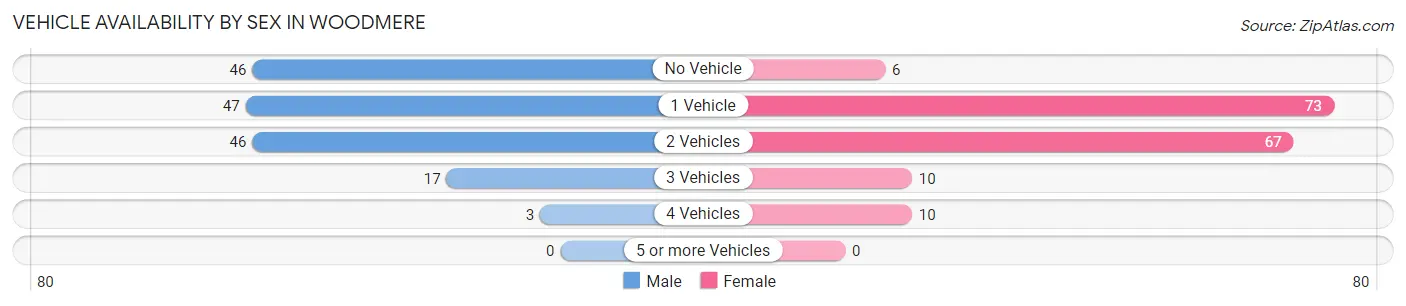
| Vehicles Available | Male | Female |
| No Vehicle | 46 (28.9%) | 6 (3.6%) |
| 1 Vehicle | 47 (29.6%) | 73 (44.0%) |
| 2 Vehicles | 46 (28.9%) | 67 (40.4%) |
| 3 Vehicles | 17 (10.7%) | 10 (6.0%) |
| 4 Vehicles | 3 (1.9%) | 10 (6.0%) |
| 5 or more Vehicles | 0 (0.0%) | 0 (0.0%) |
| Total | 159 (100.0%) | 166 (100.0%) |
Commute Time in Woodmere
The most frequently occuring commute durations in Woodmere are 10 to 14 minutes (60 commuters, 20.9%), 15 to 19 minutes (58 commuters, 20.2%), and 30 to 34 minutes (52 commuters, 18.1%).
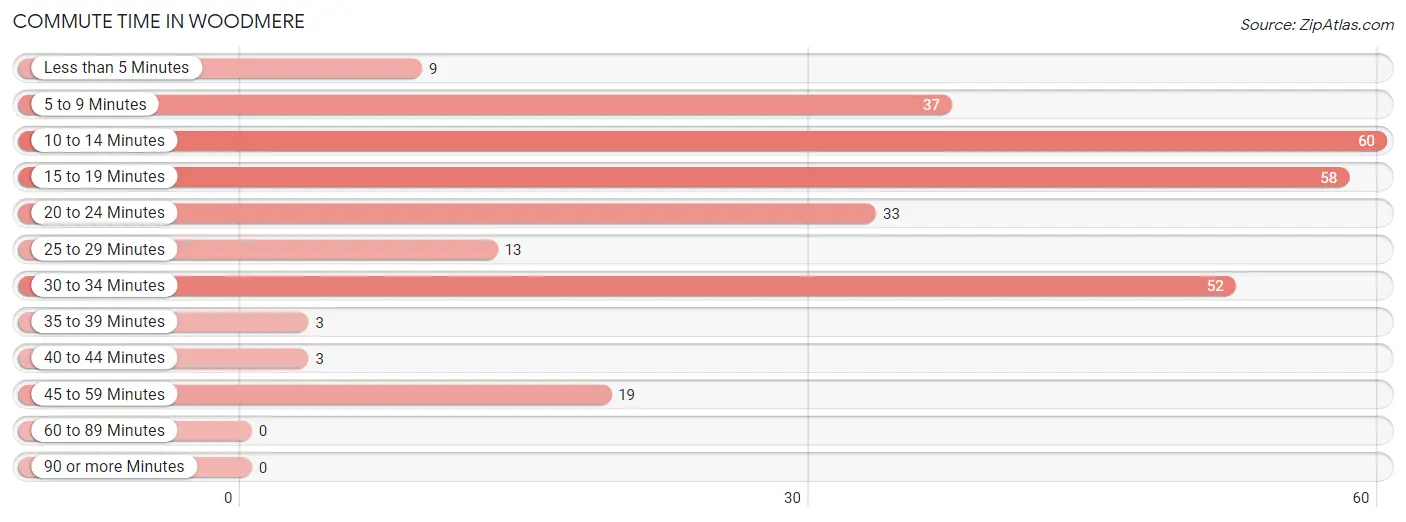
| Commute Time | # Commuters | % Commuters |
| Less than 5 Minutes | 9 | 3.1% |
| 5 to 9 Minutes | 37 | 12.9% |
| 10 to 14 Minutes | 60 | 20.9% |
| 15 to 19 Minutes | 58 | 20.2% |
| 20 to 24 Minutes | 33 | 11.5% |
| 25 to 29 Minutes | 13 | 4.5% |
| 30 to 34 Minutes | 52 | 18.1% |
| 35 to 39 Minutes | 3 | 1.1% |
| 40 to 44 Minutes | 3 | 1.1% |
| 45 to 59 Minutes | 19 | 6.6% |
| 60 to 89 Minutes | 0 | 0.0% |
| 90 or more Minutes | 0 | 0.0% |
Commute Time by Sex in Woodmere
The most common commute times in Woodmere are 15 to 19 minutes (40 commuters, 28.6%) for males and 10 to 14 minutes (35 commuters, 23.8%) for females.
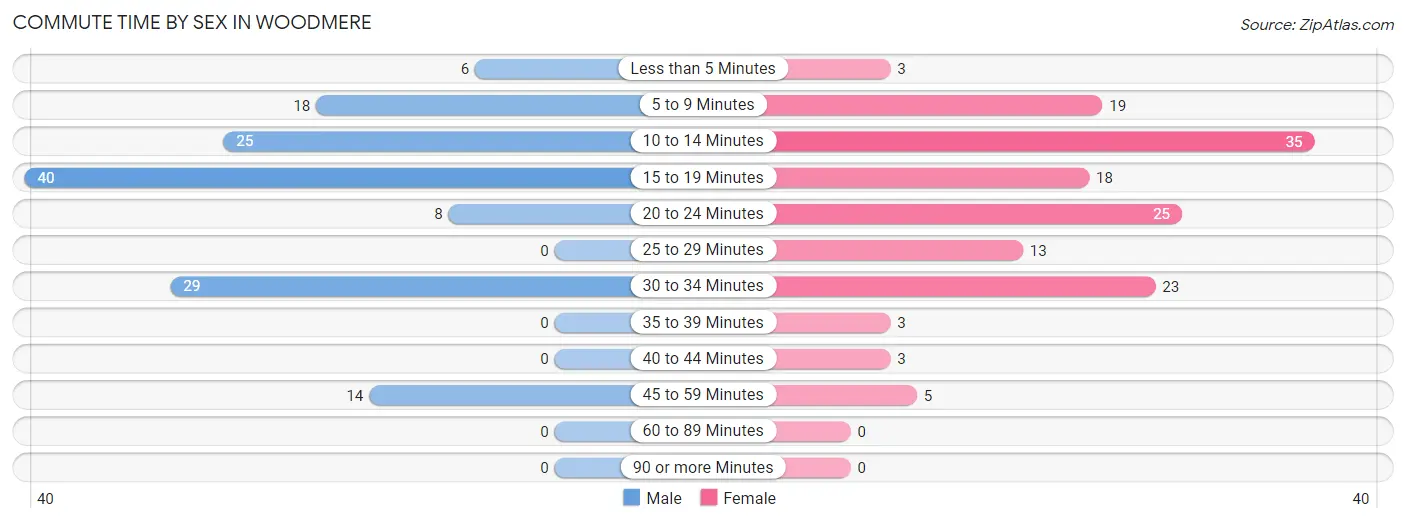
| Commute Time | Male | Female |
| Less than 5 Minutes | 6 (4.3%) | 3 (2.0%) |
| 5 to 9 Minutes | 18 (12.9%) | 19 (12.9%) |
| 10 to 14 Minutes | 25 (17.9%) | 35 (23.8%) |
| 15 to 19 Minutes | 40 (28.6%) | 18 (12.2%) |
| 20 to 24 Minutes | 8 (5.7%) | 25 (17.0%) |
| 25 to 29 Minutes | 0 (0.0%) | 13 (8.8%) |
| 30 to 34 Minutes | 29 (20.7%) | 23 (15.7%) |
| 35 to 39 Minutes | 0 (0.0%) | 3 (2.0%) |
| 40 to 44 Minutes | 0 (0.0%) | 3 (2.0%) |
| 45 to 59 Minutes | 14 (10.0%) | 5 (3.4%) |
| 60 to 89 Minutes | 0 (0.0%) | 0 (0.0%) |
| 90 or more Minutes | 0 (0.0%) | 0 (0.0%) |
Time of Departure to Work by Sex in Woodmere
The most frequent times of departure to work in Woodmere are 5:30 AM to 5:59 AM (42, 30.0%) for males and 7:00 AM to 7:29 AM (36, 24.5%) for females.
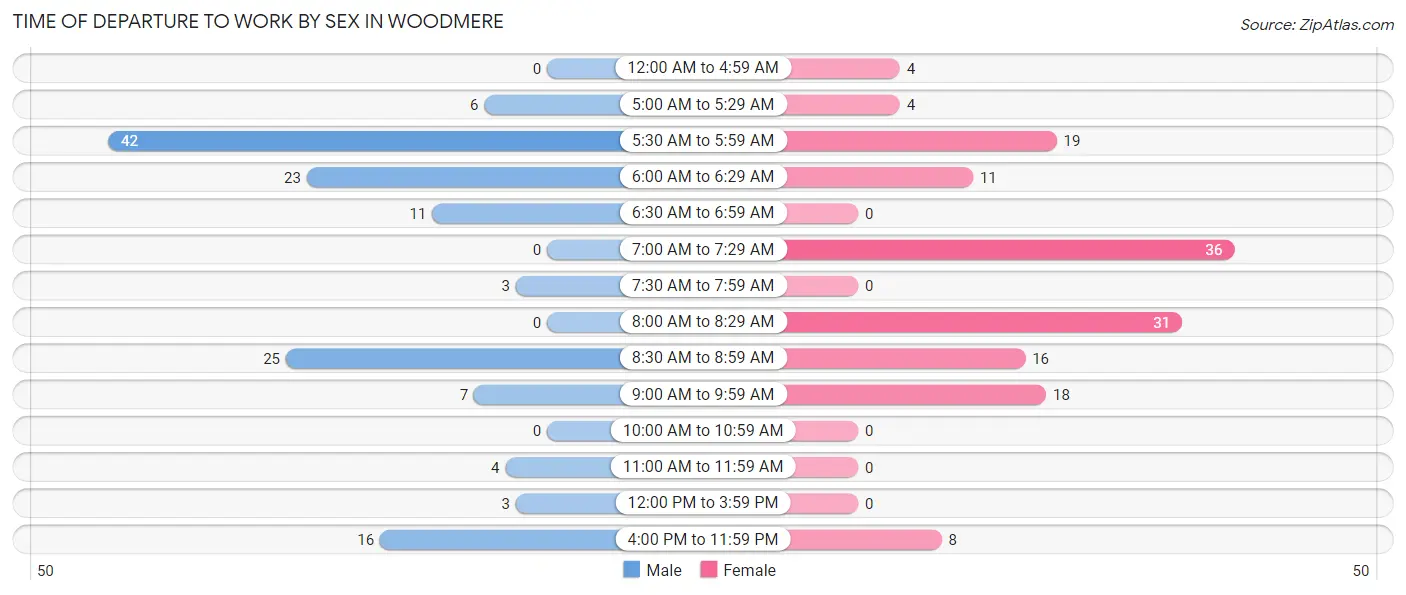
| Time of Departure | Male | Female |
| 12:00 AM to 4:59 AM | 0 (0.0%) | 4 (2.7%) |
| 5:00 AM to 5:29 AM | 6 (4.3%) | 4 (2.7%) |
| 5:30 AM to 5:59 AM | 42 (30.0%) | 19 (12.9%) |
| 6:00 AM to 6:29 AM | 23 (16.4%) | 11 (7.5%) |
| 6:30 AM to 6:59 AM | 11 (7.9%) | 0 (0.0%) |
| 7:00 AM to 7:29 AM | 0 (0.0%) | 36 (24.5%) |
| 7:30 AM to 7:59 AM | 3 (2.1%) | 0 (0.0%) |
| 8:00 AM to 8:29 AM | 0 (0.0%) | 31 (21.1%) |
| 8:30 AM to 8:59 AM | 25 (17.9%) | 16 (10.9%) |
| 9:00 AM to 9:59 AM | 7 (5.0%) | 18 (12.2%) |
| 10:00 AM to 10:59 AM | 0 (0.0%) | 0 (0.0%) |
| 11:00 AM to 11:59 AM | 4 (2.9%) | 0 (0.0%) |
| 12:00 PM to 3:59 PM | 3 (2.1%) | 0 (0.0%) |
| 4:00 PM to 11:59 PM | 16 (11.4%) | 8 (5.4%) |
| Total | 140 (100.0%) | 147 (100.0%) |
Housing Occupancy in Woodmere
Occupancy by Ownership in Woodmere
Of the total 287 dwellings in Woodmere, owner-occupied units account for 77 (26.8%), while renter-occupied units make up 210 (73.2%).
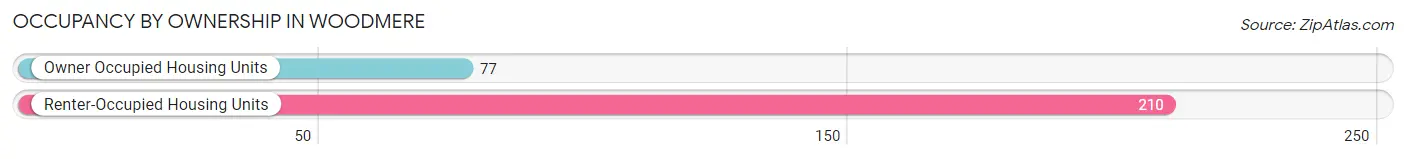
| Occupancy | # Housing Units | % Housing Units |
| Owner Occupied Housing Units | 77 | 26.8% |
| Renter-Occupied Housing Units | 210 | 73.2% |
| Total Occupied Housing Units | 287 | 100.0% |
Occupancy by Household Size in Woodmere
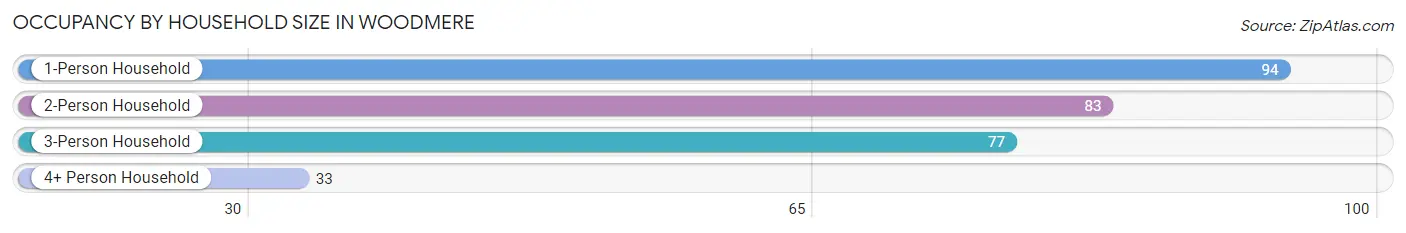
| Household Size | # Housing Units | % Housing Units |
| 1-Person Household | 94 | 32.8% |
| 2-Person Household | 83 | 28.9% |
| 3-Person Household | 77 | 26.8% |
| 4+ Person Household | 33 | 11.5% |
| Total Housing Units | 287 | 100.0% |
Occupancy by Ownership by Household Size in Woodmere
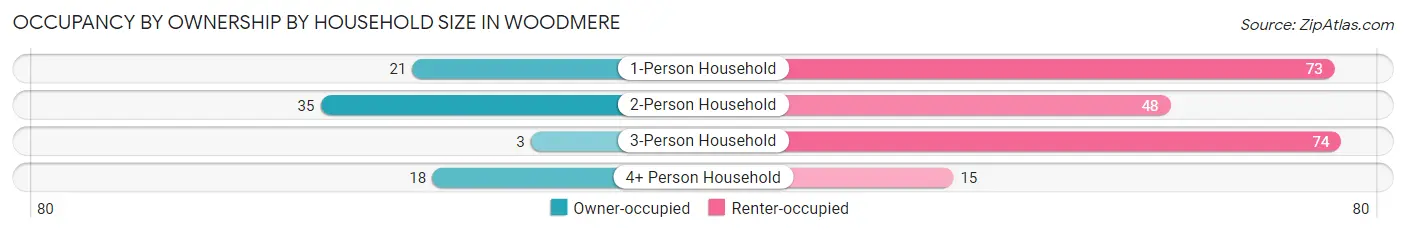
| Household Size | Owner-occupied | Renter-occupied |
| 1-Person Household | 21 (22.3%) | 73 (77.7%) |
| 2-Person Household | 35 (42.2%) | 48 (57.8%) |
| 3-Person Household | 3 (3.9%) | 74 (96.1%) |
| 4+ Person Household | 18 (54.5%) | 15 (45.5%) |
| Total Housing Units | 77 (26.8%) | 210 (73.2%) |
Occupancy by Educational Attainment in Woodmere
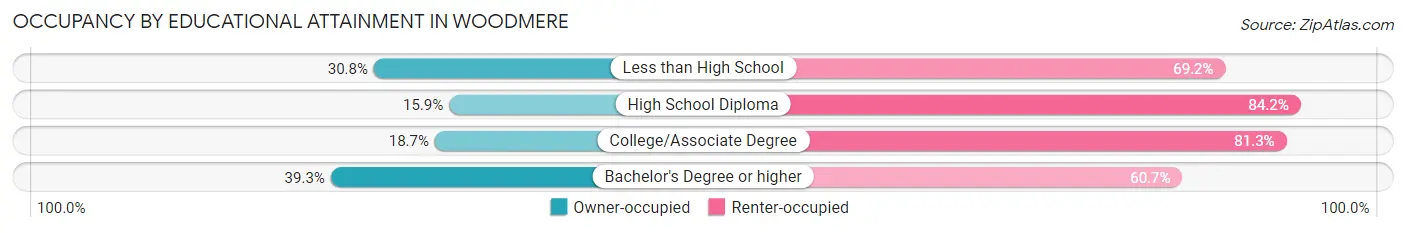
| Household Size | Owner-occupied | Renter-occupied |
| Less than High School | 4 (30.8%) | 9 (69.2%) |
| High School Diploma | 13 (15.9%) | 69 (84.2%) |
| College/Associate Degree | 14 (18.7%) | 61 (81.3%) |
| Bachelor's Degree or higher | 46 (39.3%) | 71 (60.7%) |
Occupancy by Age of Householder in Woodmere
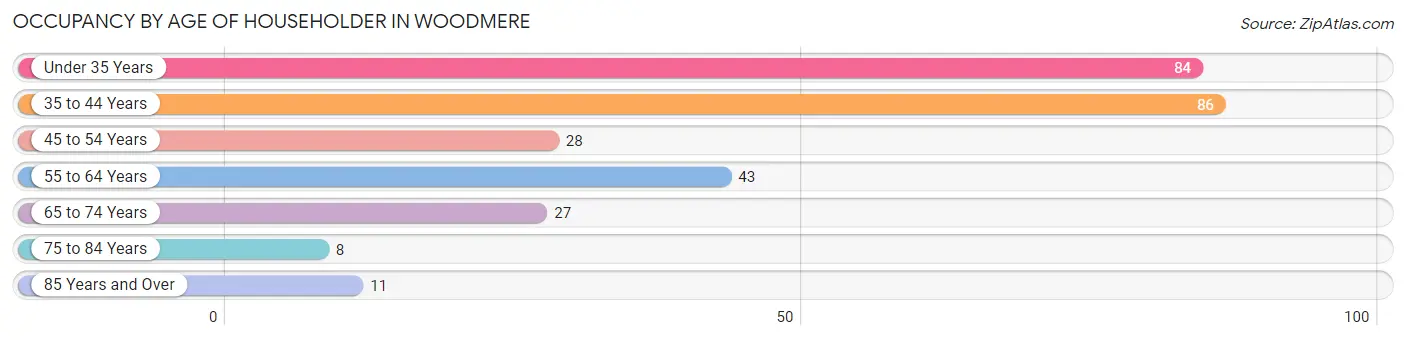
| Age Bracket | # Households | % Households |
| Under 35 Years | 84 | 29.3% |
| 35 to 44 Years | 86 | 30.0% |
| 45 to 54 Years | 28 | 9.8% |
| 55 to 64 Years | 43 | 15.0% |
| 65 to 74 Years | 27 | 9.4% |
| 75 to 84 Years | 8 | 2.8% |
| 85 Years and Over | 11 | 3.8% |
| Total | 287 | 100.0% |
Housing Finances in Woodmere
Median Income by Occupancy in Woodmere
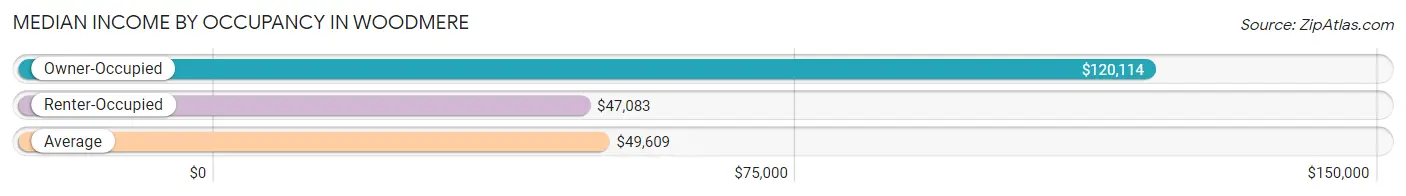
| Occupancy Type | # Households | Median Income |
| Owner-Occupied | 77 (26.8%) | $120,114 |
| Renter-Occupied | 210 (73.2%) | $47,083 |
| Average | 287 (100.0%) | $49,609 |
Occupancy by Householder Income Bracket in Woodmere
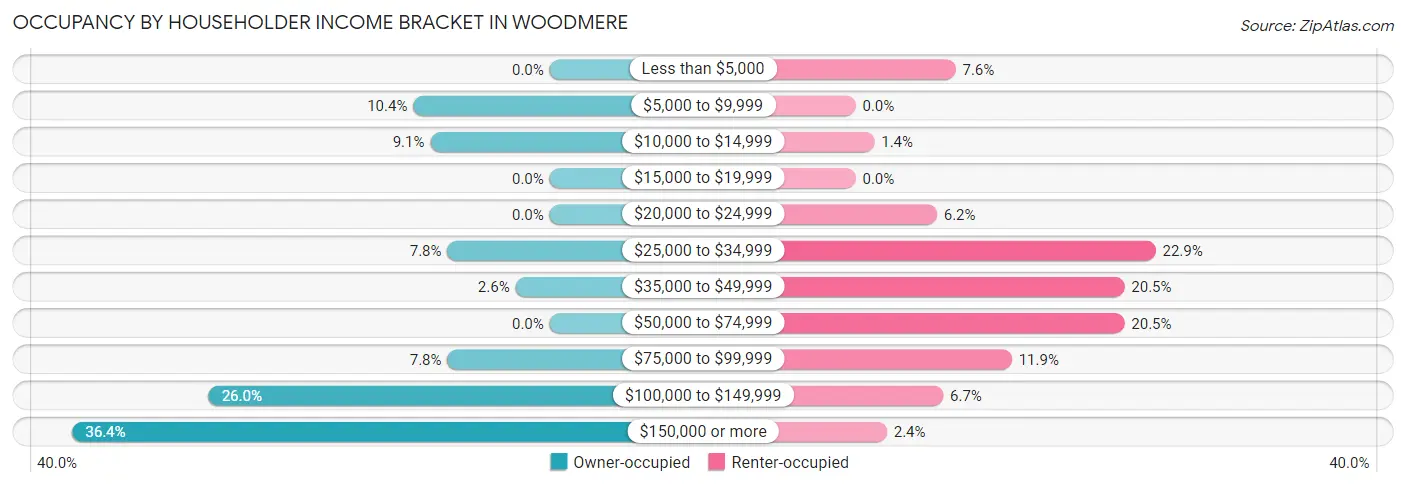
| Income Bracket | Owner-occupied | Renter-occupied |
| Less than $5,000 | 0 (0.0%) | 16 (7.6%) |
| $5,000 to $9,999 | 8 (10.4%) | 0 (0.0%) |
| $10,000 to $14,999 | 7 (9.1%) | 3 (1.4%) |
| $15,000 to $19,999 | 0 (0.0%) | 0 (0.0%) |
| $20,000 to $24,999 | 0 (0.0%) | 13 (6.2%) |
| $25,000 to $34,999 | 6 (7.8%) | 48 (22.9%) |
| $35,000 to $49,999 | 2 (2.6%) | 43 (20.5%) |
| $50,000 to $74,999 | 0 (0.0%) | 43 (20.5%) |
| $75,000 to $99,999 | 6 (7.8%) | 25 (11.9%) |
| $100,000 to $149,999 | 20 (26.0%) | 14 (6.7%) |
| $150,000 or more | 28 (36.4%) | 5 (2.4%) |
| Total | 77 (100.0%) | 210 (100.0%) |
Monthly Housing Cost Tiers in Woodmere
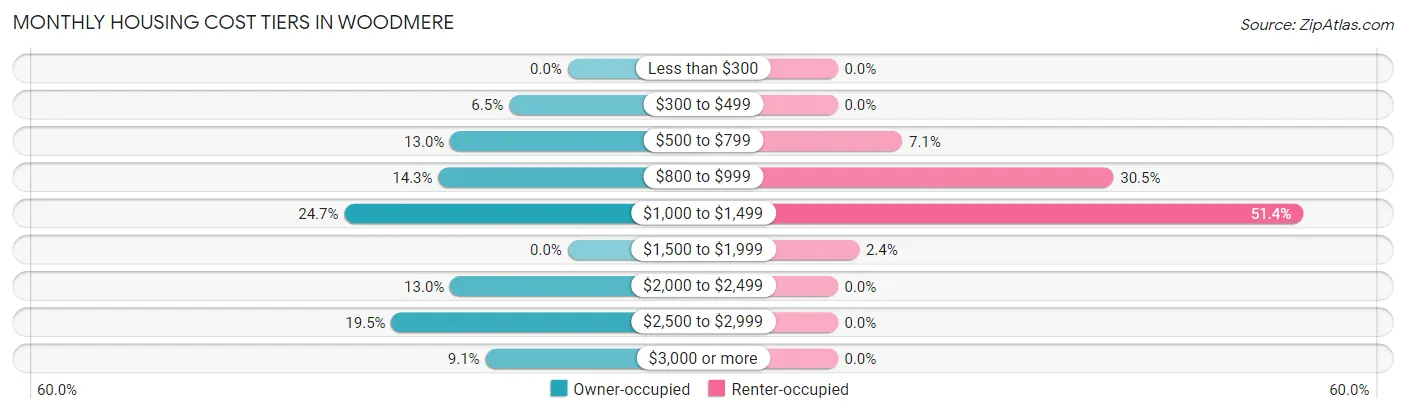
| Monthly Cost | Owner-occupied | Renter-occupied |
| Less than $300 | 0 (0.0%) | 0 (0.0%) |
| $300 to $499 | 5 (6.5%) | 0 (0.0%) |
| $500 to $799 | 10 (13.0%) | 15 (7.1%) |
| $800 to $999 | 11 (14.3%) | 64 (30.5%) |
| $1,000 to $1,499 | 19 (24.7%) | 108 (51.4%) |
| $1,500 to $1,999 | 0 (0.0%) | 5 (2.4%) |
| $2,000 to $2,499 | 10 (13.0%) | 0 (0.0%) |
| $2,500 to $2,999 | 15 (19.5%) | 0 (0.0%) |
| $3,000 or more | 7 (9.1%) | 0 (0.0%) |
| Total | 77 (100.0%) | 210 (100.0%) |
Physical Housing Characteristics in Woodmere
Housing Structures in Woodmere
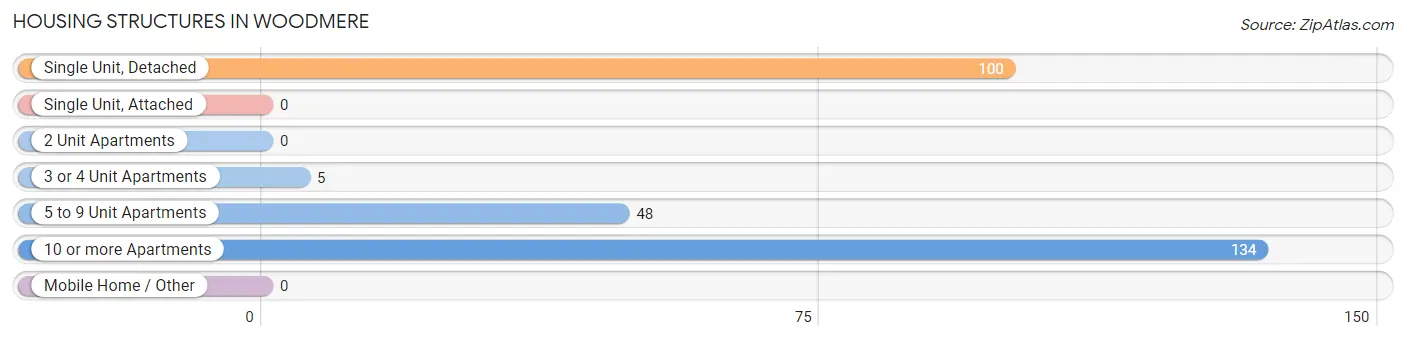
| Structure Type | # Housing Units | % Housing Units |
| Single Unit, Detached | 100 | 34.8% |
| Single Unit, Attached | 0 | 0.0% |
| 2 Unit Apartments | 0 | 0.0% |
| 3 or 4 Unit Apartments | 5 | 1.7% |
| 5 to 9 Unit Apartments | 48 | 16.7% |
| 10 or more Apartments | 134 | 46.7% |
| Mobile Home / Other | 0 | 0.0% |
| Total | 287 | 100.0% |
Housing Structures by Occupancy in Woodmere
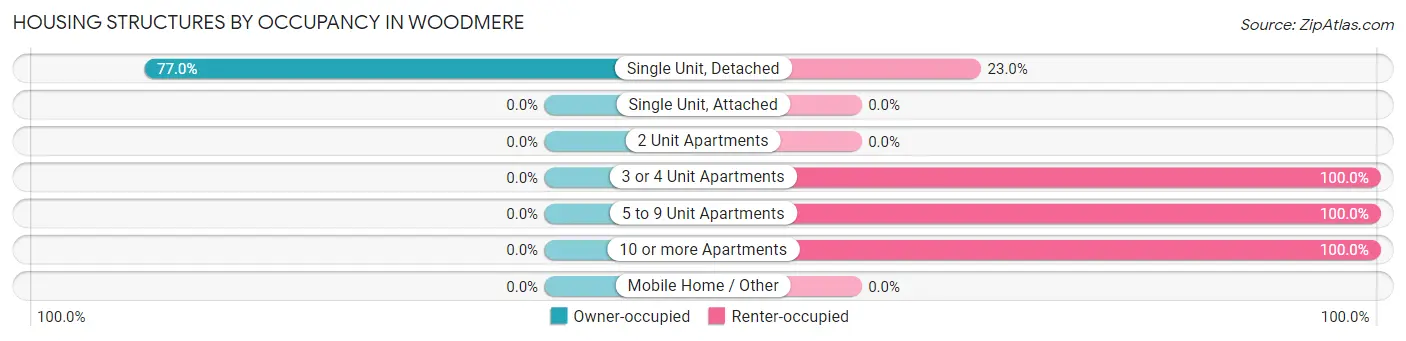
| Structure Type | Owner-occupied | Renter-occupied |
| Single Unit, Detached | 77 (77.0%) | 23 (23.0%) |
| Single Unit, Attached | 0 (0.0%) | 0 (0.0%) |
| 2 Unit Apartments | 0 (0.0%) | 0 (0.0%) |
| 3 or 4 Unit Apartments | 0 (0.0%) | 5 (100.0%) |
| 5 to 9 Unit Apartments | 0 (0.0%) | 48 (100.0%) |
| 10 or more Apartments | 0 (0.0%) | 134 (100.0%) |
| Mobile Home / Other | 0 (0.0%) | 0 (0.0%) |
| Total | 77 (26.8%) | 210 (73.2%) |
Housing Structures by Number of Rooms in Woodmere
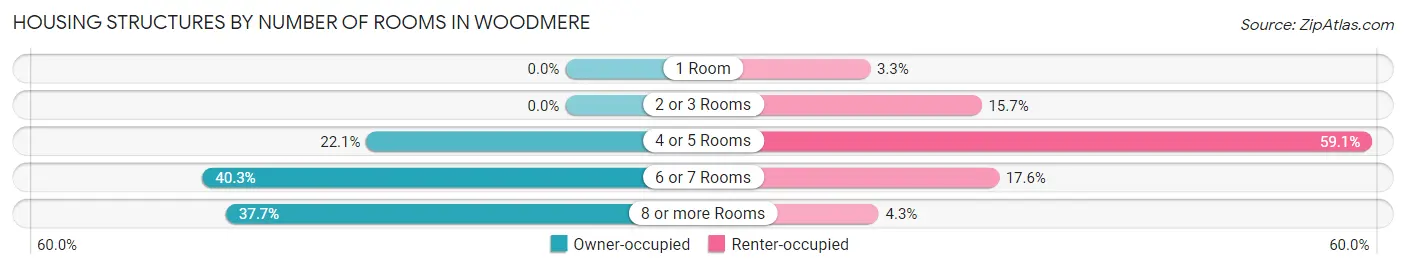
| Number of Rooms | Owner-occupied | Renter-occupied |
| 1 Room | 0 (0.0%) | 7 (3.3%) |
| 2 or 3 Rooms | 0 (0.0%) | 33 (15.7%) |
| 4 or 5 Rooms | 17 (22.1%) | 124 (59.1%) |
| 6 or 7 Rooms | 31 (40.3%) | 37 (17.6%) |
| 8 or more Rooms | 29 (37.7%) | 9 (4.3%) |
| Total | 77 (100.0%) | 210 (100.0%) |
Housing Structure by Heating Type in Woodmere
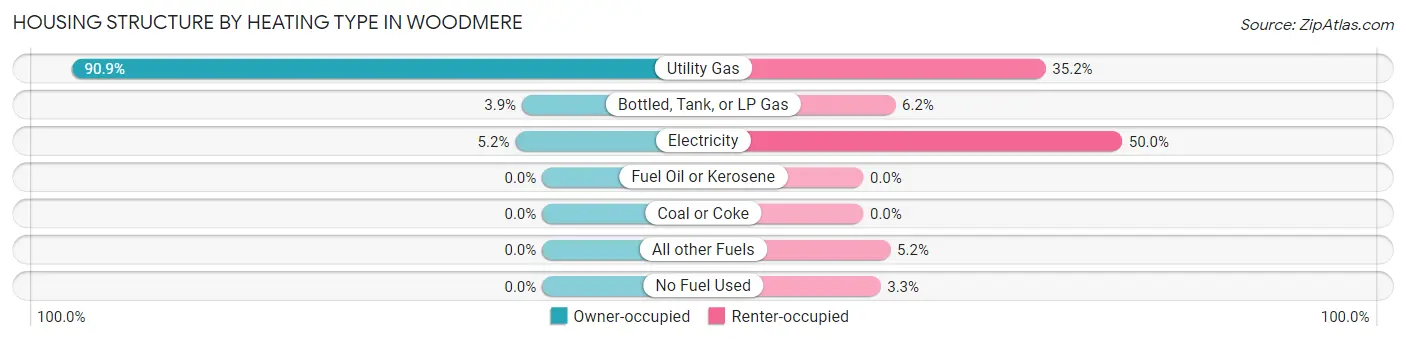
| Heating Type | Owner-occupied | Renter-occupied |
| Utility Gas | 70 (90.9%) | 74 (35.2%) |
| Bottled, Tank, or LP Gas | 3 (3.9%) | 13 (6.2%) |
| Electricity | 4 (5.2%) | 105 (50.0%) |
| Fuel Oil or Kerosene | 0 (0.0%) | 0 (0.0%) |
| Coal or Coke | 0 (0.0%) | 0 (0.0%) |
| All other Fuels | 0 (0.0%) | 11 (5.2%) |
| No Fuel Used | 0 (0.0%) | 7 (3.3%) |
| Total | 77 (100.0%) | 210 (100.0%) |
Household Vehicle Usage in Woodmere
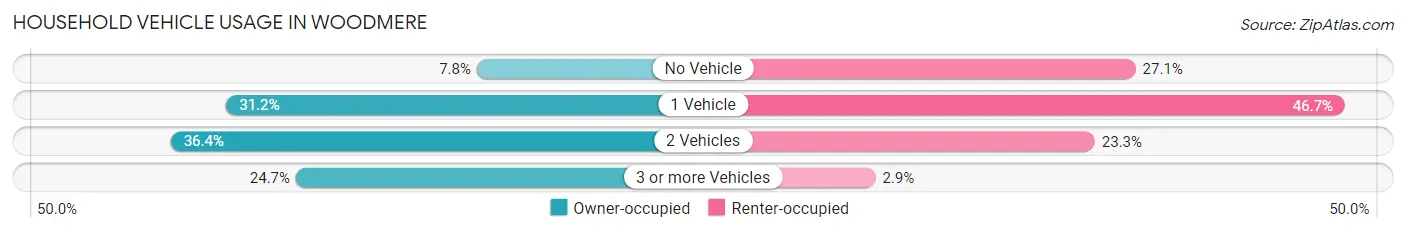
| Vehicles per Household | Owner-occupied | Renter-occupied |
| No Vehicle | 6 (7.8%) | 57 (27.1%) |
| 1 Vehicle | 24 (31.2%) | 98 (46.7%) |
| 2 Vehicles | 28 (36.4%) | 49 (23.3%) |
| 3 or more Vehicles | 19 (24.7%) | 6 (2.9%) |
| Total | 77 (100.0%) | 210 (100.0%) |
Real Estate & Mortgages in Woodmere
Real Estate and Mortgage Overview in Woodmere
| Characteristic | Without Mortgage | With Mortgage |
| Housing Units | 22 | 55 |
| Median Property Value | $185,700 | $294,800 |
| Median Household Income | - | - |
| Monthly Housing Costs | $675 | $7 |
| Real Estate Taxes | $3,667 | $0 |
Property Value by Mortgage Status in Woodmere
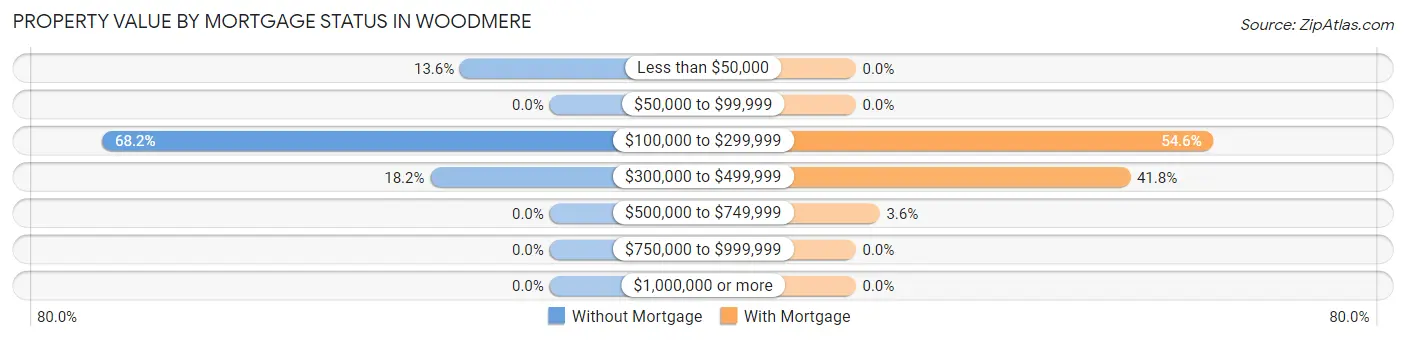
| Property Value | Without Mortgage | With Mortgage |
| Less than $50,000 | 3 (13.6%) | 0 (0.0%) |
| $50,000 to $99,999 | 0 (0.0%) | 0 (0.0%) |
| $100,000 to $299,999 | 15 (68.2%) | 30 (54.5%) |
| $300,000 to $499,999 | 4 (18.2%) | 23 (41.8%) |
| $500,000 to $749,999 | 0 (0.0%) | 2 (3.6%) |
| $750,000 to $999,999 | 0 (0.0%) | 0 (0.0%) |
| $1,000,000 or more | 0 (0.0%) | 0 (0.0%) |
| Total | 22 (100.0%) | 55 (100.0%) |
Household Income by Mortgage Status in Woodmere
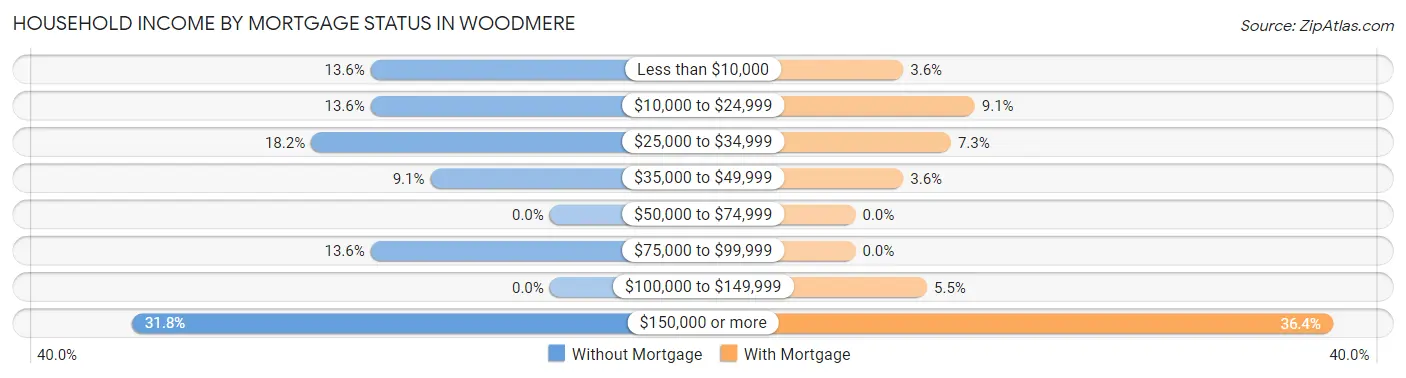
| Household Income | Without Mortgage | With Mortgage |
| Less than $10,000 | 3 (13.6%) | 2 (3.6%) |
| $10,000 to $24,999 | 3 (13.6%) | 5 (9.1%) |
| $25,000 to $34,999 | 4 (18.2%) | 4 (7.3%) |
| $35,000 to $49,999 | 2 (9.1%) | 2 (3.6%) |
| $50,000 to $74,999 | 0 (0.0%) | 0 (0.0%) |
| $75,000 to $99,999 | 3 (13.6%) | 0 (0.0%) |
| $100,000 to $149,999 | 0 (0.0%) | 3 (5.4%) |
| $150,000 or more | 7 (31.8%) | 20 (36.4%) |
| Total | 22 (100.0%) | 55 (100.0%) |
Property Value to Household Income Ratio in Woodmere
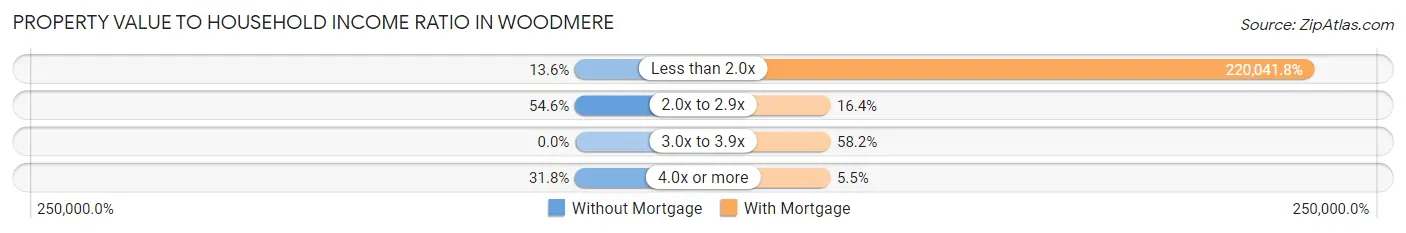
| Value-to-Income Ratio | Without Mortgage | With Mortgage |
| Less than 2.0x | 3 (13.6%) | 121,023 (220,041.8%) |
| 2.0x to 2.9x | 12 (54.5%) | 9 (16.4%) |
| 3.0x to 3.9x | 0 (0.0%) | 32 (58.2%) |
| 4.0x or more | 7 (31.8%) | 3 (5.4%) |
| Total | 22 (100.0%) | 55 (100.0%) |
Real Estate Taxes by Mortgage Status in Woodmere
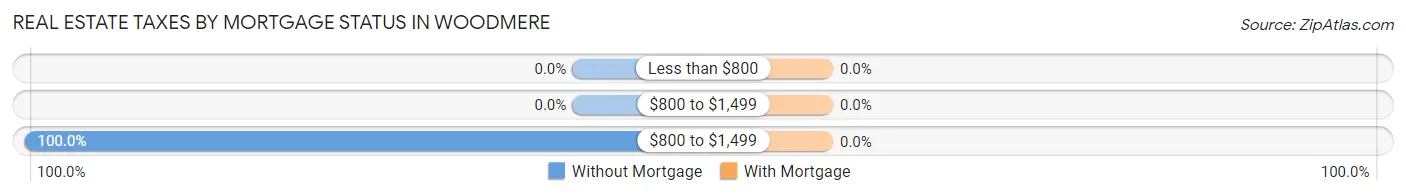
| Property Taxes | Without Mortgage | With Mortgage |
| Less than $800 | 0 (0.0%) | 0 (0.0%) |
| $800 to $1,499 | 0 (0.0%) | 0 (0.0%) |
| $800 to $1,499 | 22 (100.0%) | 0 (0.0%) |
| Total | 22 (100.0%) | 55 (100.0%) |
Health & Disability in Woodmere
Health Insurance Coverage by Age in Woodmere
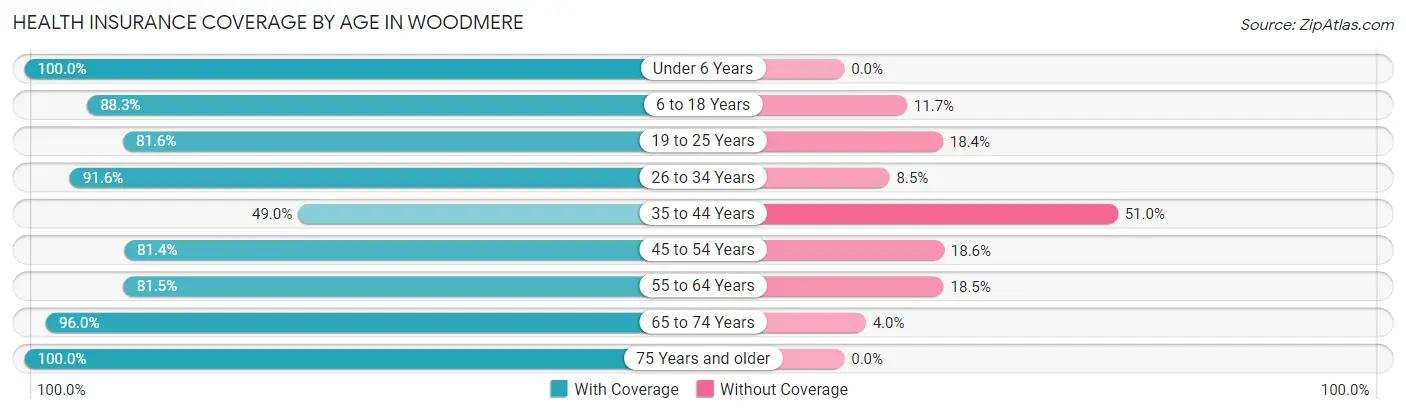
| Age Bracket | With Coverage | Without Coverage |
| Under 6 Years | 69 (100.0%) | 0 (0.0%) |
| 6 to 18 Years | 121 (88.3%) | 16 (11.7%) |
| 19 to 25 Years | 40 (81.6%) | 9 (18.4%) |
| 26 to 34 Years | 65 (91.5%) | 6 (8.5%) |
| 35 to 44 Years | 74 (49.0%) | 77 (51.0%) |
| 45 to 54 Years | 57 (81.4%) | 13 (18.6%) |
| 55 to 64 Years | 44 (81.5%) | 10 (18.5%) |
| 65 to 74 Years | 48 (96.0%) | 2 (4.0%) |
| 75 Years and older | 30 (100.0%) | 0 (0.0%) |
| Total | 548 (80.5%) | 133 (19.5%) |
Health Insurance Coverage by Citizenship Status in Woodmere
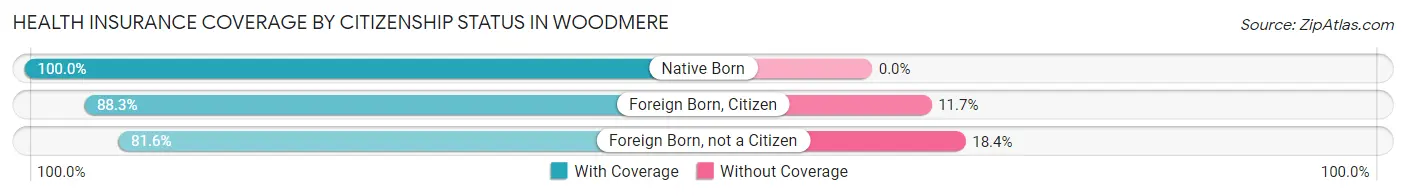
| Citizenship Status | With Coverage | Without Coverage |
| Native Born | 69 (100.0%) | 0 (0.0%) |
| Foreign Born, Citizen | 121 (88.3%) | 16 (11.7%) |
| Foreign Born, not a Citizen | 40 (81.6%) | 9 (18.4%) |
Health Insurance Coverage by Household Income in Woodmere
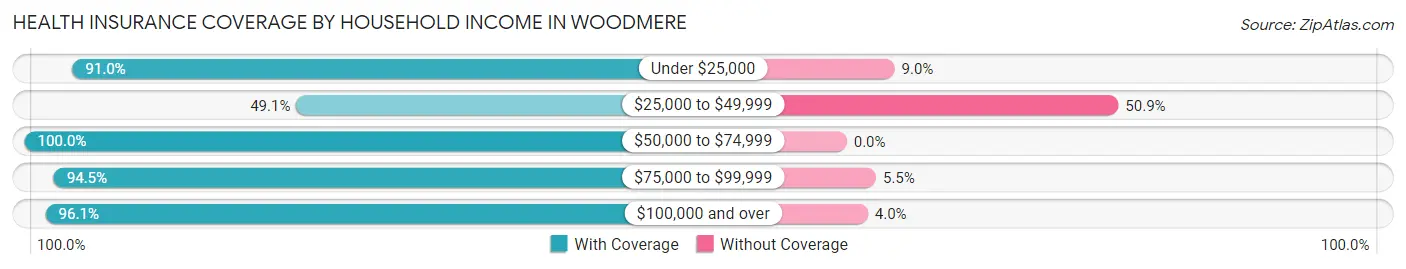
| Household Income | With Coverage | Without Coverage |
| Under $25,000 | 61 (91.0%) | 6 (9.0%) |
| $25,000 to $49,999 | 110 (49.1%) | 114 (50.9%) |
| $50,000 to $74,999 | 89 (100.0%) | 0 (0.0%) |
| $75,000 to $99,999 | 69 (94.5%) | 4 (5.5%) |
| $100,000 and over | 219 (96.1%) | 9 (4.0%) |
Public vs Private Health Insurance Coverage by Age in Woodmere
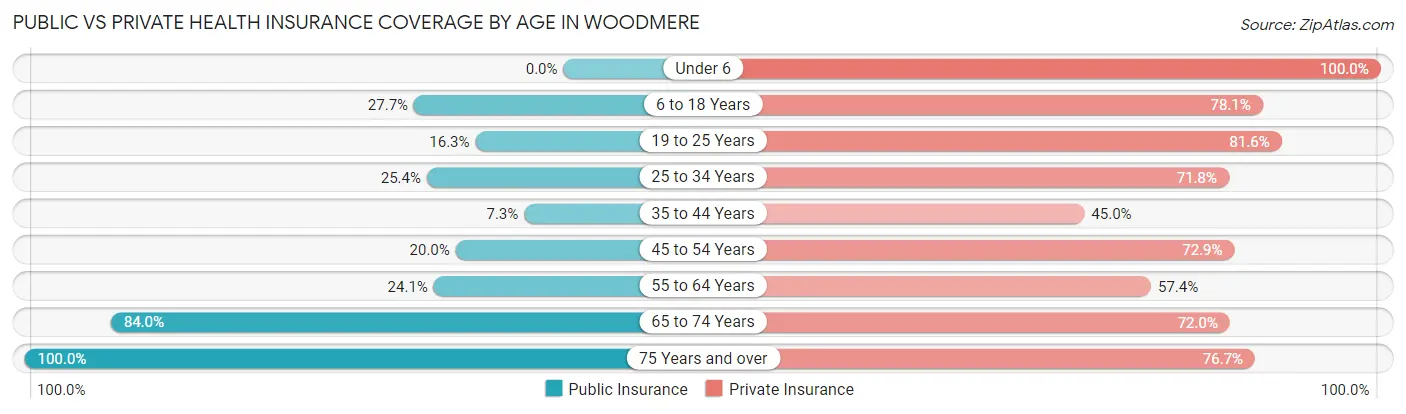
| Age Bracket | Public Insurance | Private Insurance |
| Under 6 | 0 (0.0%) | 69 (100.0%) |
| 6 to 18 Years | 38 (27.7%) | 107 (78.1%) |
| 19 to 25 Years | 8 (16.3%) | 40 (81.6%) |
| 25 to 34 Years | 18 (25.4%) | 51 (71.8%) |
| 35 to 44 Years | 11 (7.3%) | 68 (45.0%) |
| 45 to 54 Years | 14 (20.0%) | 51 (72.9%) |
| 55 to 64 Years | 13 (24.1%) | 31 (57.4%) |
| 65 to 74 Years | 42 (84.0%) | 36 (72.0%) |
| 75 Years and over | 30 (100.0%) | 23 (76.7%) |
| Total | 174 (25.6%) | 476 (69.9%) |
Disability Status by Sex by Age in Woodmere
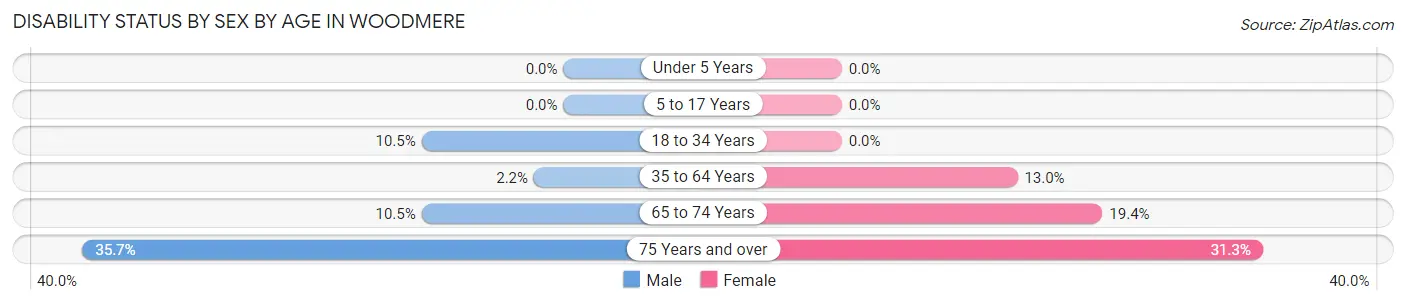
| Age Bracket | Male | Female |
| Under 5 Years | 0 (0.0%) | 0 (0.0%) |
| 5 to 17 Years | 0 (0.0%) | 0 (0.0%) |
| 18 to 34 Years | 4 (10.5%) | 0 (0.0%) |
| 35 to 64 Years | 3 (2.2%) | 18 (13.0%) |
| 65 to 74 Years | 2 (10.5%) | 6 (19.4%) |
| 75 Years and over | 5 (35.7%) | 5 (31.2%) |
Disability Class by Sex by Age in Woodmere
Disability Class: Hearing Difficulty
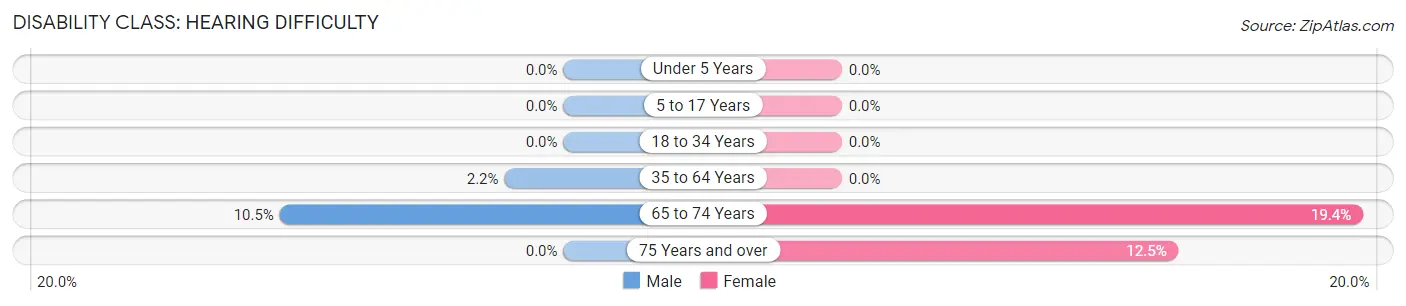
| Age Bracket | Male | Female |
| Under 5 Years | 0 (0.0%) | 0 (0.0%) |
| 5 to 17 Years | 0 (0.0%) | 0 (0.0%) |
| 18 to 34 Years | 0 (0.0%) | 0 (0.0%) |
| 35 to 64 Years | 3 (2.2%) | 0 (0.0%) |
| 65 to 74 Years | 2 (10.5%) | 6 (19.4%) |
| 75 Years and over | 0 (0.0%) | 2 (12.5%) |
Disability Class: Vision Difficulty
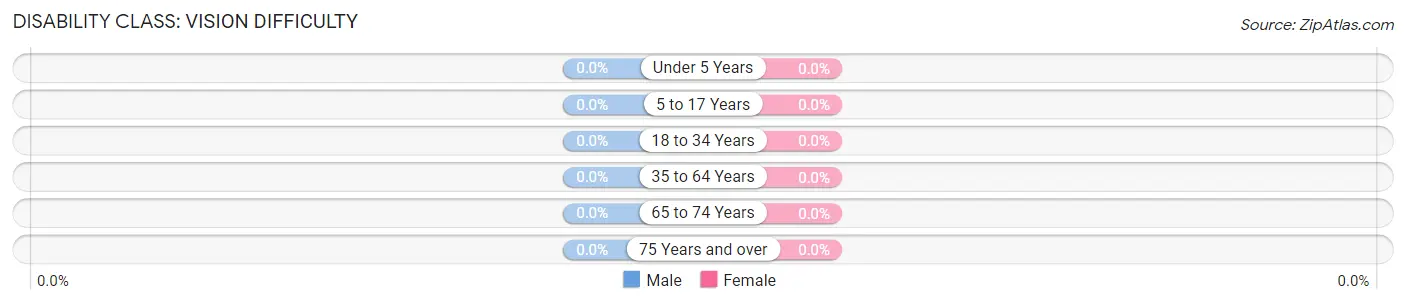
| Age Bracket | Male | Female |
| Under 5 Years | 0 (0.0%) | 0 (0.0%) |
| 5 to 17 Years | 0 (0.0%) | 0 (0.0%) |
| 18 to 34 Years | 0 (0.0%) | 0 (0.0%) |
| 35 to 64 Years | 0 (0.0%) | 0 (0.0%) |
| 65 to 74 Years | 0 (0.0%) | 0 (0.0%) |
| 75 Years and over | 0 (0.0%) | 0 (0.0%) |
Disability Class: Cognitive Difficulty
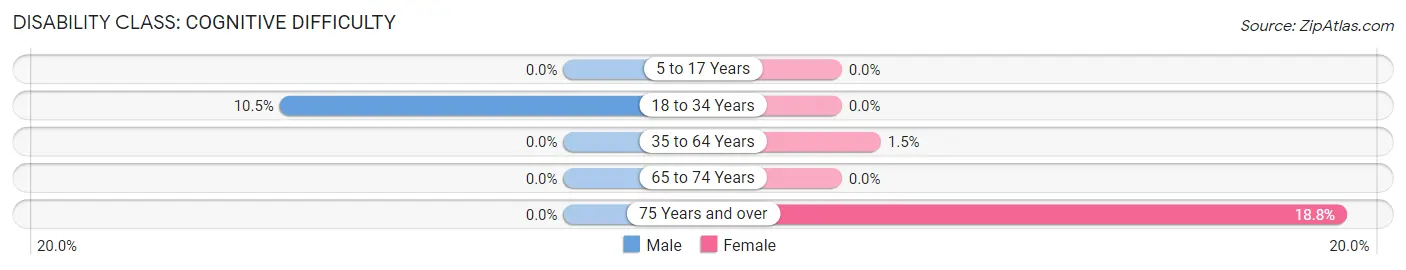
| Age Bracket | Male | Female |
| 5 to 17 Years | 0 (0.0%) | 0 (0.0%) |
| 18 to 34 Years | 4 (10.5%) | 0 (0.0%) |
| 35 to 64 Years | 0 (0.0%) | 2 (1.5%) |
| 65 to 74 Years | 0 (0.0%) | 0 (0.0%) |
| 75 Years and over | 0 (0.0%) | 3 (18.8%) |
Disability Class: Ambulatory Difficulty
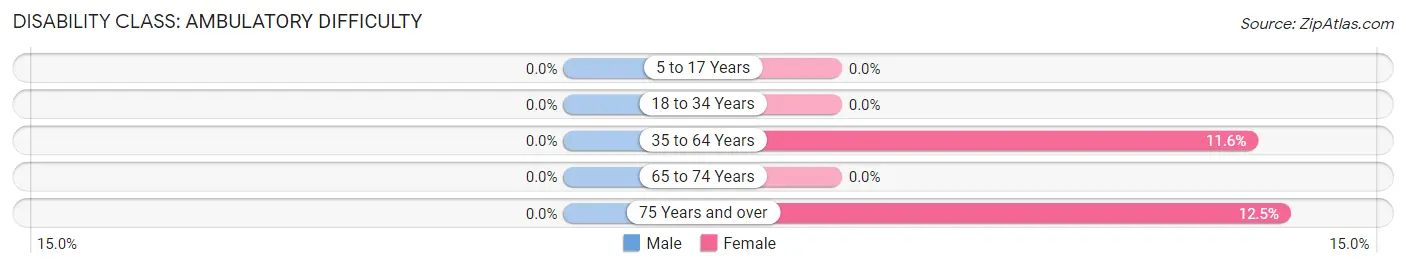
| Age Bracket | Male | Female |
| 5 to 17 Years | 0 (0.0%) | 0 (0.0%) |
| 18 to 34 Years | 0 (0.0%) | 0 (0.0%) |
| 35 to 64 Years | 0 (0.0%) | 16 (11.6%) |
| 65 to 74 Years | 0 (0.0%) | 0 (0.0%) |
| 75 Years and over | 0 (0.0%) | 2 (12.5%) |
Disability Class: Self-Care Difficulty
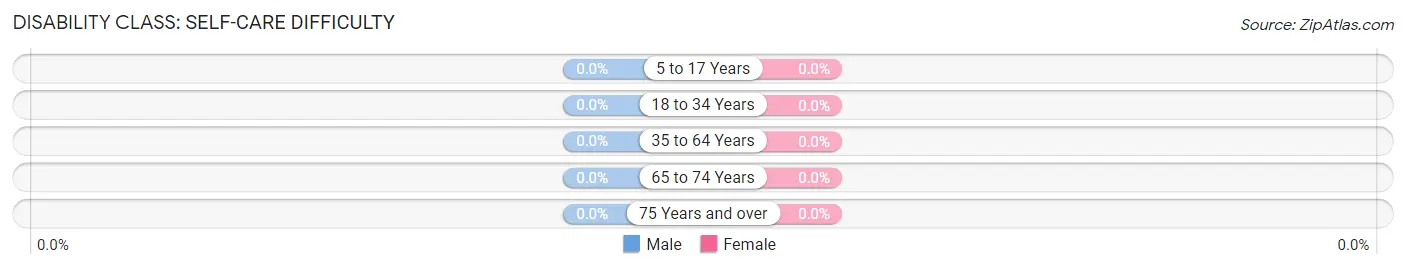
| Age Bracket | Male | Female |
| 5 to 17 Years | 0 (0.0%) | 0 (0.0%) |
| 18 to 34 Years | 0 (0.0%) | 0 (0.0%) |
| 35 to 64 Years | 0 (0.0%) | 0 (0.0%) |
| 65 to 74 Years | 0 (0.0%) | 0 (0.0%) |
| 75 Years and over | 0 (0.0%) | 0 (0.0%) |
Technology Access in Woodmere
Computing Device Access in Woodmere
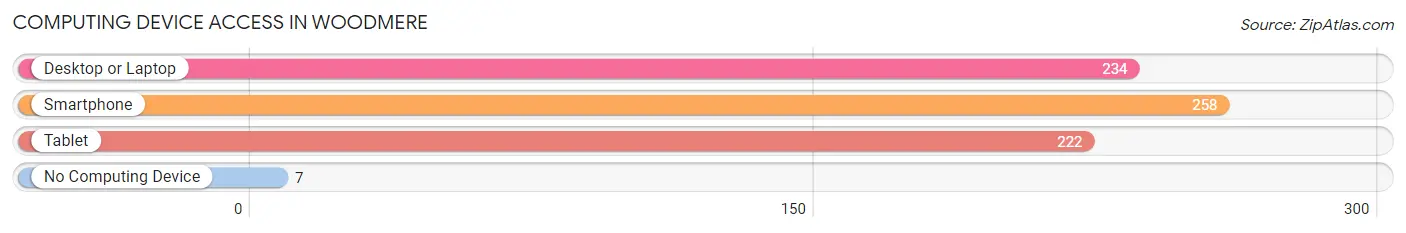
| Device Type | # Households | % Households |
| Desktop or Laptop | 234 | 81.5% |
| Smartphone | 258 | 89.9% |
| Tablet | 222 | 77.3% |
| No Computing Device | 7 | 2.4% |
| Total | 287 | 100.0% |
Internet Access in Woodmere
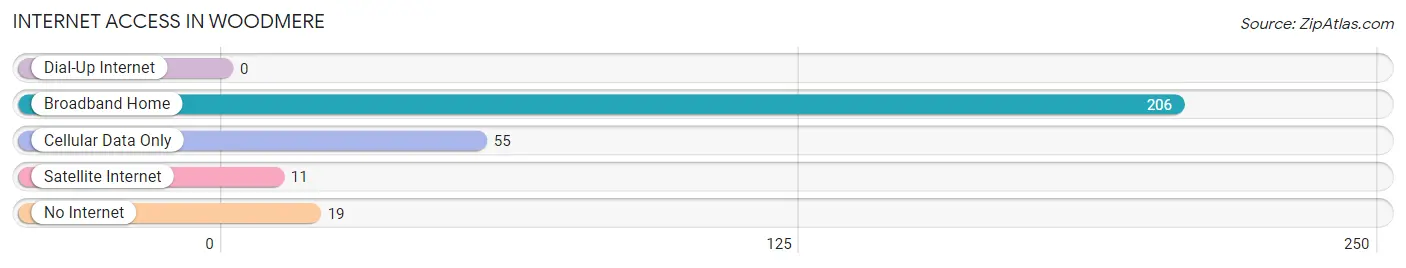
| Internet Type | # Households | % Households |
| Dial-Up Internet | 0 | 0.0% |
| Broadband Home | 206 | 71.8% |
| Cellular Data Only | 55 | 19.2% |
| Satellite Internet | 11 | 3.8% |
| No Internet | 19 | 6.6% |
| Total | 287 | 100.0% |
Woodmere Summary
Woodmere, Ohio is a small village located in Cuyahoga County, Ohio. It is situated on the eastern shore of Lake Erie, just south of Cleveland. The village has a population of approximately 5,000 people and is part of the Greater Cleveland metropolitan area.
History
Woodmere was founded in 1815 by a group of settlers from Connecticut. The village was originally known as “Woodsfield” and was named after the nearby woods. The village was incorporated in 1868 and was renamed “Woodmere” in 1871.
The village was originally a farming community, but it soon developed into a resort town. The village was home to several resorts, including the Woodmere Beach Hotel, which was built in 1887. The hotel was a popular destination for vacationers from Cleveland and other nearby cities.
In the early 20th century, Woodmere began to develop into a residential community. The village was home to several large estates, including the estate of John D. Rockefeller. The village also became home to several large businesses, including the Cleveland Trust Company and the Cleveland Electric Illuminating Company.
Geography
Woodmere is located in Cuyahoga County, Ohio. It is situated on the eastern shore of Lake Erie, just south of Cleveland. The village is bordered by the cities of Beachwood, Cleveland Heights, and Shaker Heights. The village is located in the Cleveland Metropolitan Statistical Area.
The village has a total area of 2.2 square miles, all of which is land. The village is located in a hilly area and is surrounded by wooded areas. The village is located near several parks, including the Cleveland Metroparks and the Cleveland Lakefront State Park.
Economy
The economy of Woodmere is largely based on the service industry. The village is home to several businesses, including restaurants, retail stores, and professional services. The village is also home to several large employers, including the Cleveland Clinic and the Cleveland Electric Illuminating Company.
The village is also home to several educational institutions, including the University of Cleveland and Case Western Reserve University. The village is also home to several cultural institutions, including the Cleveland Museum of Art and the Cleveland Orchestra.
Demographics
As of the 2010 census, the population of Woodmere was 5,000. The racial makeup of the village was 87.3% White, 8.2% African American, 0.3% Native American, 1.2% Asian, and 2.9% from other races. The median household income was $50,000.
The village is home to several religious institutions, including the Woodmere United Methodist Church and the Woodmere Jewish Center. The village is also home to several private schools, including the Woodmere Academy and the Hathaway Brown School.
Woodmere is a small village with a rich history and a diverse population. The village is home to several businesses, educational institutions, and cultural institutions. The village is also home to several parks and recreational areas. The village is a great place to live and work, and it is a great place to visit.
Common Questions
What is the Total Population of Woodmere?
Total Population of Woodmere is 683.
What is the Total Male Population of Woodmere?
Total Male Population of Woodmere is 290.
What is the Total Female Population of Woodmere?
Total Female Population of Woodmere is 393.
What is the Ratio of Males per 100 Females in Woodmere?
There are 73.79 Males per 100 Females in Woodmere.
What is the Ratio of Females per 100 Males in Woodmere?
There are 135.52 Females per 100 Males in Woodmere.
What is the Median Population Age in Woodmere?
Median Population Age in Woodmere is 35.5 Years.
What is the Average Family Size in Woodmere
Average Family Size in Woodmere is 3.1 People.
What is the Average Household Size in Woodmere
Average Household Size in Woodmere is 2.4 People.
What is Per Capita Income in Woodmere?
Per Capita income in Woodmere is $34,042.
What is the Median Family Income in Woodmere?
Median Family Income in Woodmere is $73,438.
What is the Median Household income in Woodmere?
Median Household Income in Woodmere is $49,609.
What is Inequality or Gini Index in Woodmere?
Inequality or Gini Index in Woodmere is 0.51.
How Large is the Labor Force in Woodmere?
There are 368 People in the Labor Forcein in Woodmere.
What is the Percentage of People in the Labor Force in Woodmere?
71.6% of People are in the Labor Force in Woodmere.
What is the Unemployment Rate in Woodmere?
Unemployment Rate in Woodmere is 11.7%.