Summerside, OH
Summerside Map
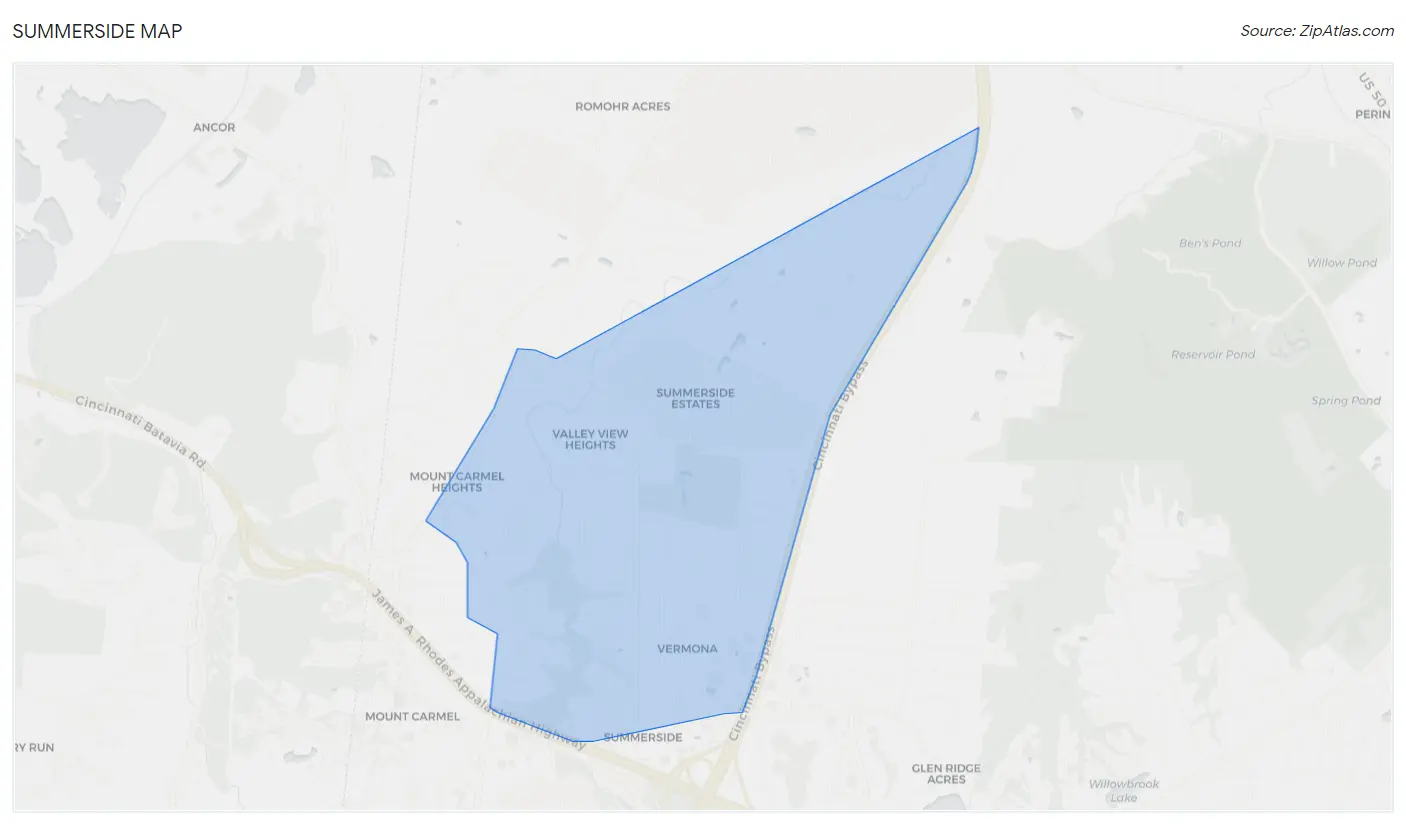
Summerside Overview
4,515
TOTAL POPULATION
2,308
MALE POPULATION
2,207
FEMALE POPULATION
104.58
MALES / 100 FEMALES
95.62
FEMALES / 100 MALES
30.7
MEDIAN AGE
3.0
AVG FAMILY SIZE
2.2
AVG HOUSEHOLD SIZE
$33,762
PER CAPITA INCOME
$77,386
AVG FAMILY INCOME
$57,976
AVG HOUSEHOLD INCOME
37.4%
WAGE / INCOME GAP [ % ]
62.6¢/ $1
WAGE / INCOME GAP [ $ ]
0.47
INEQUALITY / GINI INDEX
2,242
LABOR FORCE [ PEOPLE ]
66.8%
PERCENT IN LABOR FORCE
6.9%
UNEMPLOYMENT RATE
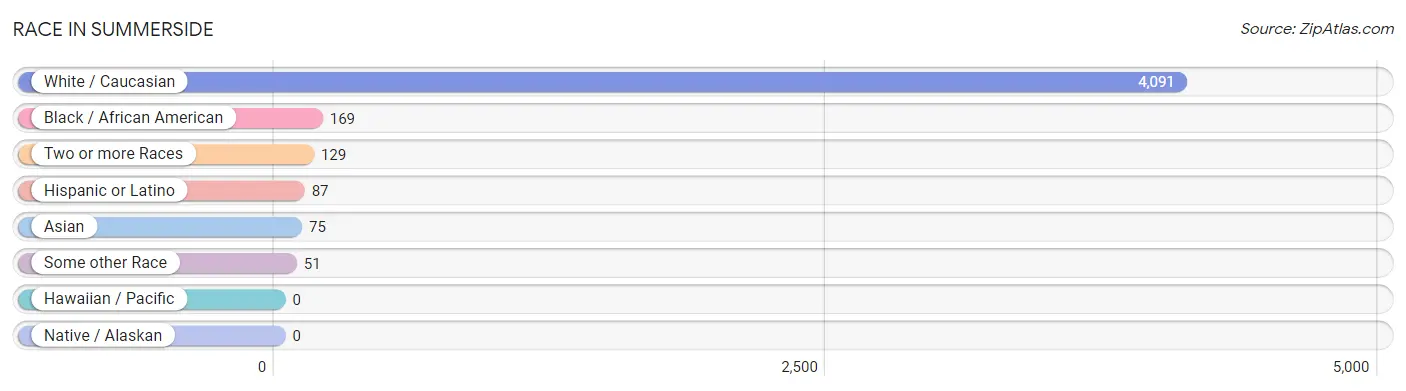
Race in Summerside
The most populous races in Summerside are White / Caucasian (4,091 | 90.6%), Black / African American (169 | 3.7%), and Two or more Races (129 | 2.9%).
| Race | # Population | % Population |
| Asian | 75 | 1.7% |
| Black / African American | 169 | 3.7% |
| Hawaiian / Pacific | 0 | 0.0% |
| Hispanic or Latino | 87 | 1.9% |
| Native / Alaskan | 0 | 0.0% |
| White / Caucasian | 4,091 | 90.6% |
| Two or more Races | 129 | 2.9% |
| Some other Race | 51 | 1.1% |
| Total | 4,515 | 100.0% |
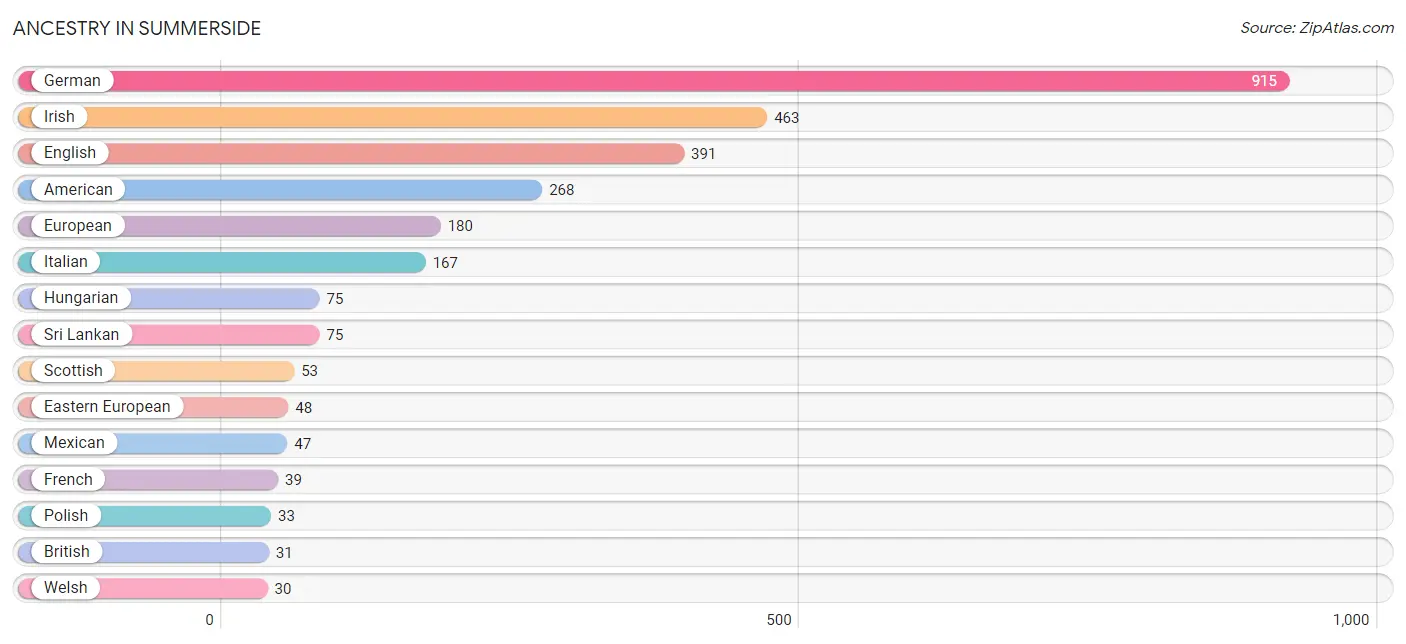
Ancestry in Summerside
The most populous ancestries reported in Summerside are German (915 | 20.3%), Irish (463 | 10.2%), English (391 | 8.7%), American (268 | 5.9%), and European (180 | 4.0%), together accounting for 49.1% of all Summerside residents.
| Ancestry | # Population | % Population |
| American | 268 | 5.9% |
| Austrian | 28 | 0.6% |
| Belgian | 12 | 0.3% |
| British | 31 | 0.7% |
| Central American | 26 | 0.6% |
| Czech | 28 | 0.6% |
| Dutch | 15 | 0.3% |
| Eastern European | 48 | 1.1% |
| English | 391 | 8.7% |
| European | 180 | 4.0% |
| French | 39 | 0.9% |
| German | 915 | 20.3% |
| Guatemalan | 26 | 0.6% |
| Haitian | 15 | 0.3% |
| Hungarian | 75 | 1.7% |
| Irish | 463 | 10.2% |
| Italian | 167 | 3.7% |
| Mexican | 47 | 1.0% |
| Polish | 33 | 0.7% |
| Scotch-Irish | 13 | 0.3% |
| Scottish | 53 | 1.2% |
| Slovak | 28 | 0.6% |
| South American | 14 | 0.3% |
| Sri Lankan | 75 | 1.7% |
| Venezuelan | 14 | 0.3% |
| Welsh | 30 | 0.7% | View All 26 Rows |
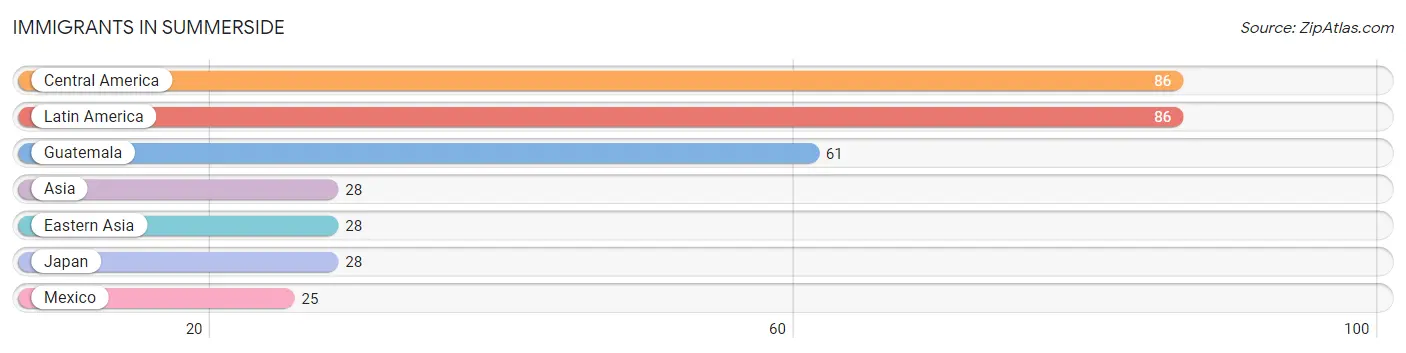
Immigrants in Summerside
The most numerous immigrant groups reported in Summerside came from Central America (86 | 1.9%), Latin America (86 | 1.9%), Guatemala (61 | 1.3%), Asia (28 | 0.6%), and Eastern Asia (28 | 0.6%), together accounting for 6.4% of all Summerside residents.
| Immigration Origin | # Population | % Population |
| Asia | 28 | 0.6% |
| Central America | 86 | 1.9% |
| Eastern Asia | 28 | 0.6% |
| Guatemala | 61 | 1.3% |
| Japan | 28 | 0.6% |
| Latin America | 86 | 1.9% |
| Mexico | 25 | 0.5% | View All 7 Rows |
Sex and Age in Summerside
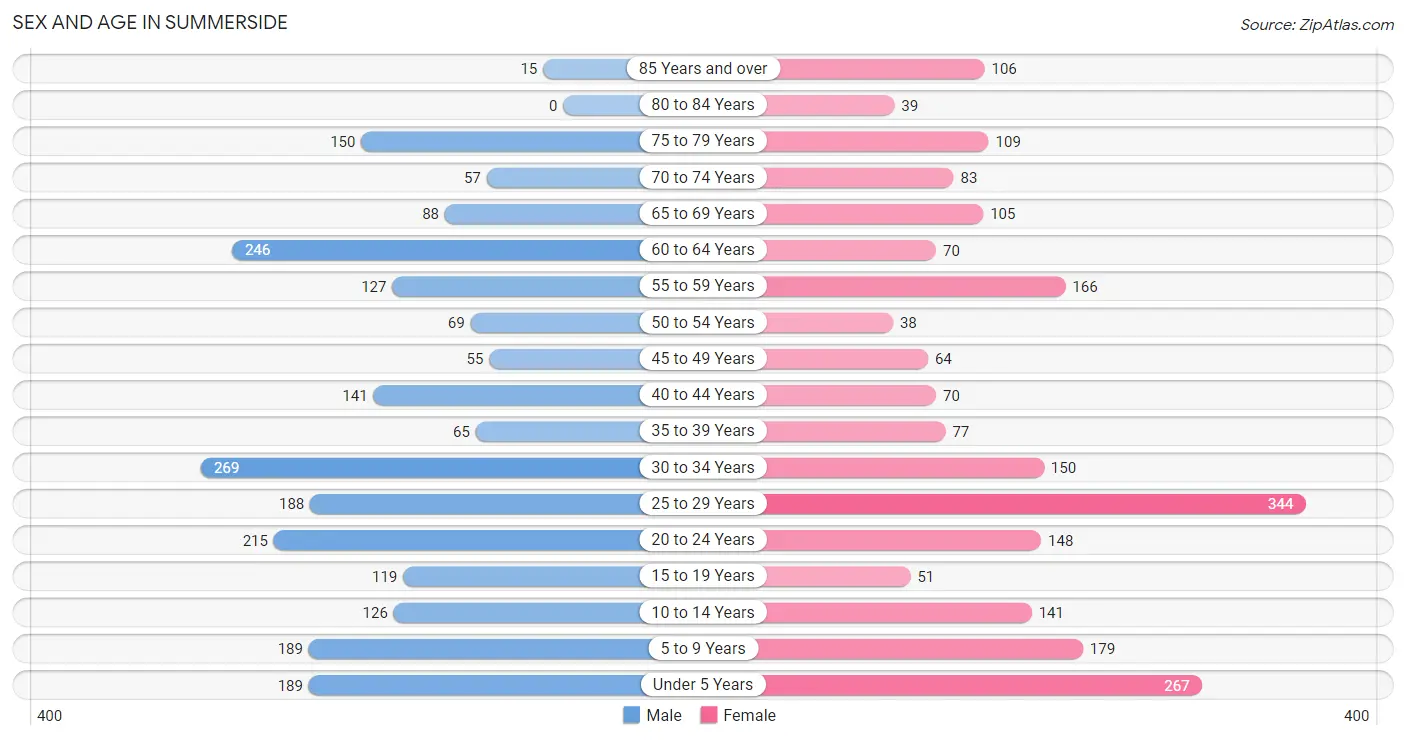
Sex and Age in Summerside
The most populous age groups in Summerside are 30 to 34 Years (269 | 11.7%) for men and 25 to 29 Years (344 | 15.6%) for women.
| Age Bracket | Male | Female |
| Under 5 Years | 189 (8.2%) | 267 (12.1%) |
| 5 to 9 Years | 189 (8.2%) | 179 (8.1%) |
| 10 to 14 Years | 126 (5.5%) | 141 (6.4%) |
| 15 to 19 Years | 119 (5.2%) | 51 (2.3%) |
| 20 to 24 Years | 215 (9.3%) | 148 (6.7%) |
| 25 to 29 Years | 188 (8.2%) | 344 (15.6%) |
| 30 to 34 Years | 269 (11.7%) | 150 (6.8%) |
| 35 to 39 Years | 65 (2.8%) | 77 (3.5%) |
| 40 to 44 Years | 141 (6.1%) | 70 (3.2%) |
| 45 to 49 Years | 55 (2.4%) | 64 (2.9%) |
| 50 to 54 Years | 69 (3.0%) | 38 (1.7%) |
| 55 to 59 Years | 127 (5.5%) | 166 (7.5%) |
| 60 to 64 Years | 246 (10.7%) | 70 (3.2%) |
| 65 to 69 Years | 88 (3.8%) | 105 (4.8%) |
| 70 to 74 Years | 57 (2.5%) | 83 (3.8%) |
| 75 to 79 Years | 150 (6.5%) | 109 (4.9%) |
| 80 to 84 Years | 0 (0.0%) | 39 (1.8%) |
| 85 Years and over | 15 (0.6%) | 106 (4.8%) |
| Total | 2,308 (100.0%) | 2,207 (100.0%) |
Families and Households in Summerside
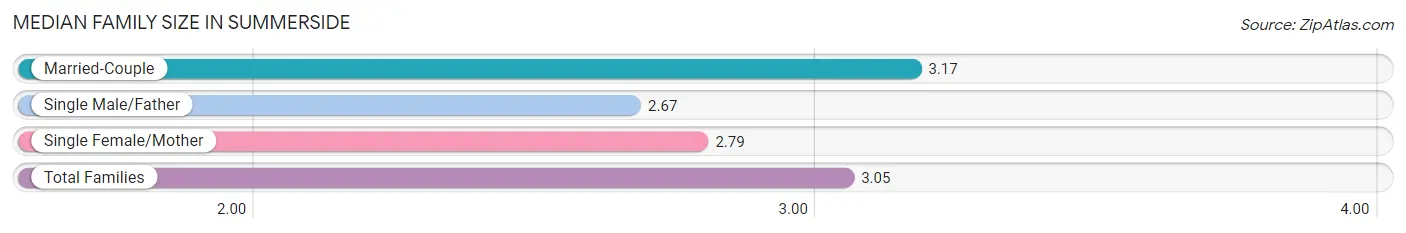
Median Family Size in Summerside
The median family size in Summerside is 3.05 persons per family, with married-couple families (766 | 70.4%) accounting for the largest median family size of 3.17 persons per family. On the other hand, single male/father families (69 | 6.3%) represent the smallest median family size with 2.67 persons per family.
| Family Type | # Families | Family Size |
| Married-Couple | 766 (70.4%) | 3.17 |
| Single Male/Father | 69 (6.3%) | 2.67 |
| Single Female/Mother | 253 (23.3%) | 2.79 |
| Total Families | 1,088 (100.0%) | 3.05 |
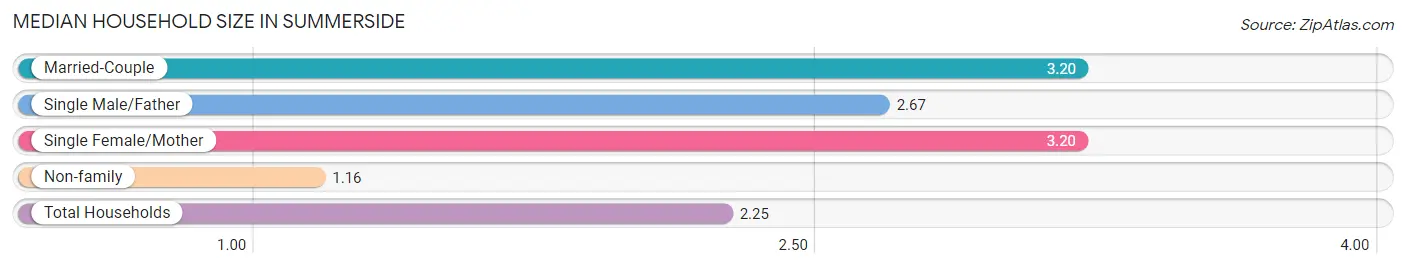
Median Household Size in Summerside
The median household size in Summerside is 2.25 persons per household, with married-couple households (766 | 38.3%) accounting for the largest median household size of 3.2 persons per household. non-family households (912 | 45.6%) represent the smallest median household size with 1.16 persons per household.
| Household Type | # Households | Household Size |
| Married-Couple | 766 (38.3%) | 3.20 |
| Single Male/Father | 69 (3.5%) | 2.67 |
| Single Female/Mother | 253 (12.7%) | 3.20 |
| Non-family | 912 (45.6%) | 1.16 |
| Total Households | 2,000 (100.0%) | 2.25 |
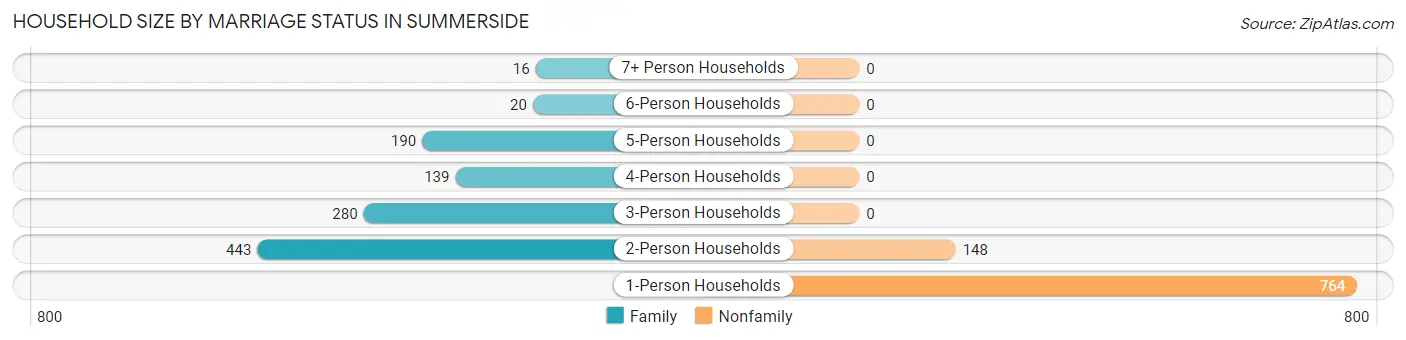
Household Size by Marriage Status in Summerside
Out of a total of 2,000 households in Summerside, 1,088 (54.4%) are family households, while 912 (45.6%) are nonfamily households. The most numerous type of family households are 2-person households, comprising 443, and the most common type of nonfamily households are 1-person households, comprising 764.
| Household Size | Family Households | Nonfamily Households |
| 1-Person Households | - | 764 (38.2%) |
| 2-Person Households | 443 (22.2%) | 148 (7.4%) |
| 3-Person Households | 280 (14.0%) | 0 (0.0%) |
| 4-Person Households | 139 (7.0%) | 0 (0.0%) |
| 5-Person Households | 190 (9.5%) | 0 (0.0%) |
| 6-Person Households | 20 (1.0%) | 0 (0.0%) |
| 7+ Person Households | 16 (0.8%) | 0 (0.0%) |
| Total | 1,088 (54.4%) | 912 (45.6%) |
Female Fertility in Summerside
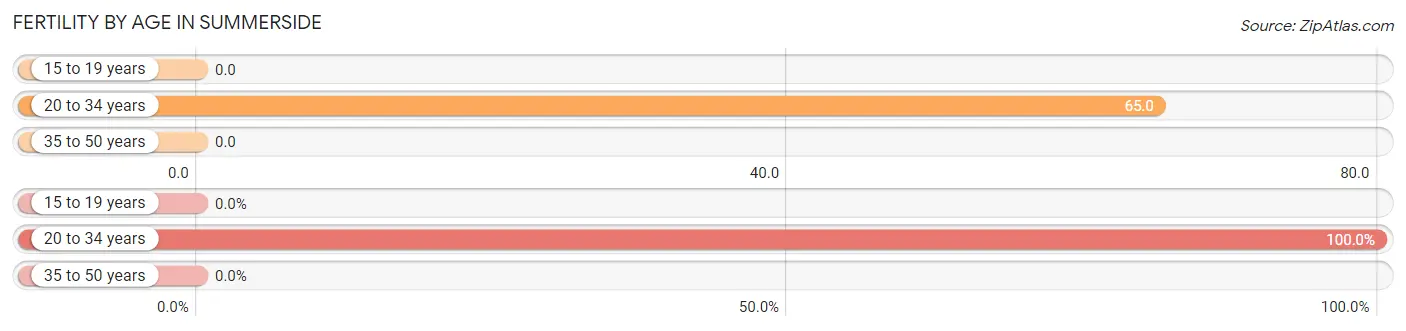
Fertility by Age in Summerside
Average fertility rate in Summerside is 46.0 births per 1,000 women. Women in the age bracket of 20 to 34 years have the highest fertility rate with 65.0 births per 1,000 women. Women in the age bracket of 20 to 34 years acount for 100.0% of all women with births.
| Age Bracket | Women with Births | Births / 1,000 Women |
| 15 to 19 years | 0 (0.0%) | 0.0 |
| 20 to 34 years | 42 (100.0%) | 65.0 |
| 35 to 50 years | 0 (0.0%) | 0.0 |
| Total | 42 (100.0%) | 46.0 |
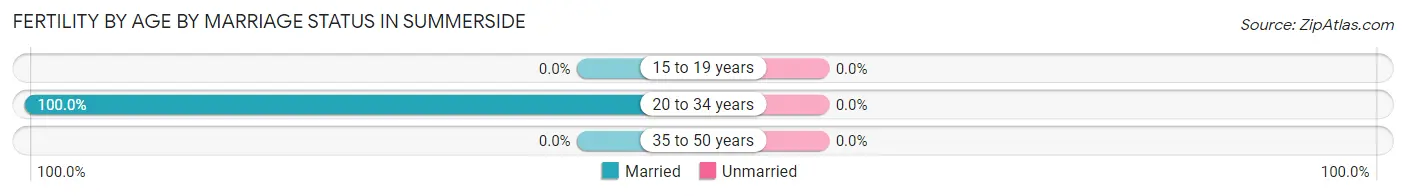
Fertility by Age by Marriage Status in Summerside
| Age Bracket | Married | Unmarried |
| 15 to 19 years | 0 (0.0%) | 0 (0.0%) |
| 20 to 34 years | 42 (100.0%) | 0 (0.0%) |
| 35 to 50 years | 0 (0.0%) | 0 (0.0%) |
| Total | 42 (100.0%) | 0 (0.0%) |
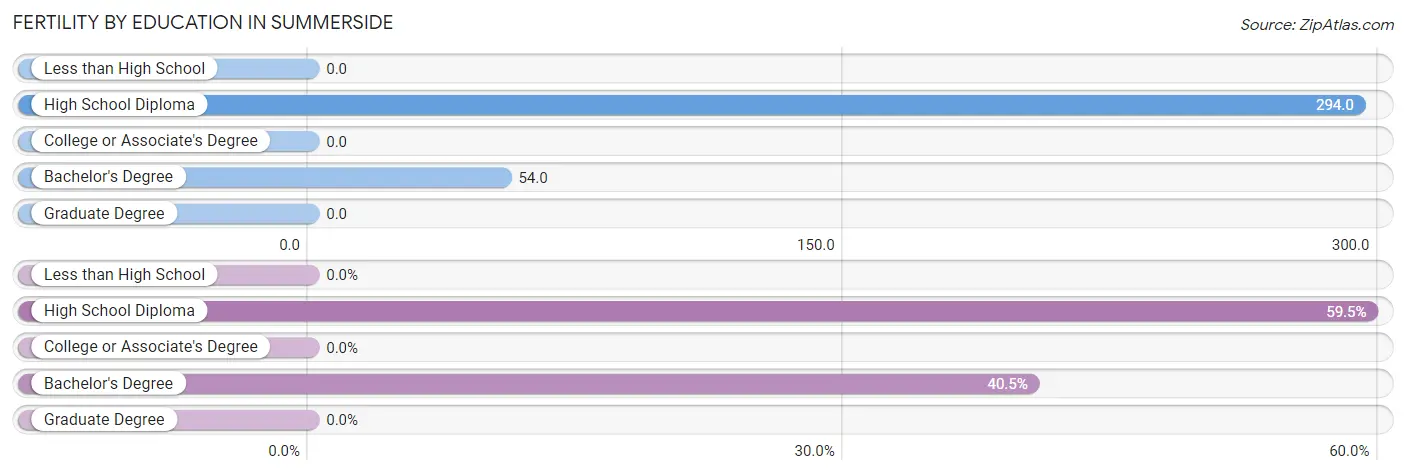
Fertility by Education in Summerside
| Educational Attainment | Women with Births | Births / 1,000 Women |
| Less than High School | 0 (0.0%) | 0.0 |
| High School Diploma | 25 (59.5%) | 294.0 |
| College or Associate's Degree | 0 (0.0%) | 0.0 |
| Bachelor's Degree | 17 (40.5%) | 54.0 |
| Graduate Degree | 0 (0.0%) | 0.0 |
| Total | 42 (100.0%) | 46.0 |
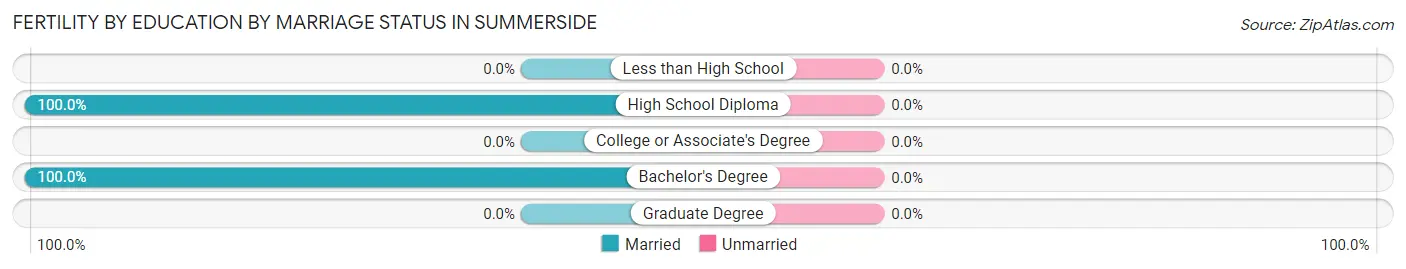
Fertility by Education by Marriage Status in Summerside
| Educational Attainment | Married | Unmarried |
| Less than High School | 0 (0.0%) | 0 (0.0%) |
| High School Diploma | 25 (100.0%) | 0 (0.0%) |
| College or Associate's Degree | 0 (0.0%) | 0 (0.0%) |
| Bachelor's Degree | 17 (100.0%) | 0 (0.0%) |
| Graduate Degree | 0 (0.0%) | 0 (0.0%) |
| Total | 42 (100.0%) | 0 (0.0%) |
Income in Summerside
Income Overview in Summerside
Per Capita Income in Summerside is $33,762, while median incomes of families and households are $77,386 and $57,976 respectively.
| Characteristic | Number | Measure |
| Per Capita Income | 4,515 | $33,762 |
| Median Family Income | 1,088 | $77,386 |
| Mean Family Income | 1,088 | $104,196 |
| Median Household Income | 2,000 | $57,976 |
| Mean Household Income | 2,000 | $76,612 |
| Income Deficit | 1,088 | $0 |
| Wage / Income Gap (%) | 4,515 | 37.35% |
| Wage / Income Gap ($) | 4,515 | 62.65¢ per $1 |
| Gini / Inequality Index | 4,515 | 0.47 |
Earnings by Sex in Summerside
Average Earnings in Summerside are $38,288, $44,297 for men and $27,750 for women, a difference of 37.3%.
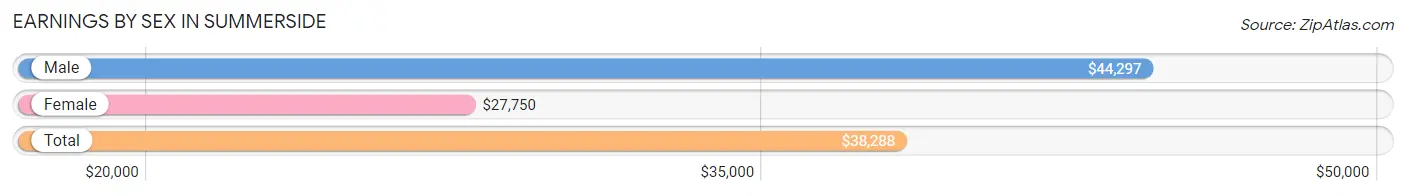
| Sex | Number | Average Earnings |
| Male | 1,349 (59.1%) | $44,297 |
| Female | 932 (40.9%) | $27,750 |
| Total | 2,281 (100.0%) | $38,288 |
Earnings by Sex by Income Bracket in Summerside
The most common earnings brackets in Summerside are $75,000 to $99,999 for men (170 | 12.6%) and $7,500 to $9,999 for women (153 | 16.4%).
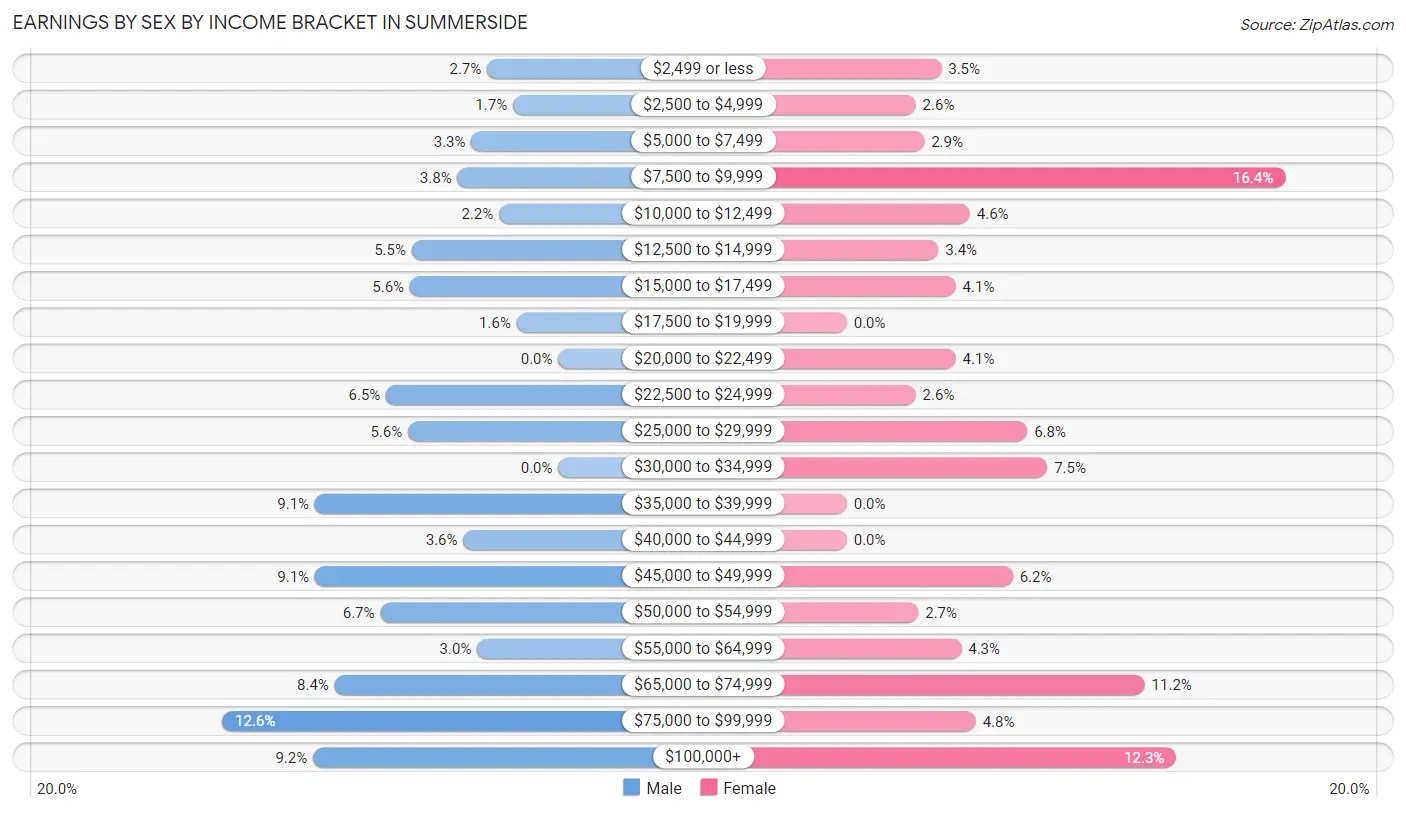
| Income | Male | Female |
| $2,499 or less | 36 (2.7%) | 33 (3.5%) |
| $2,500 to $4,999 | 23 (1.7%) | 24 (2.6%) |
| $5,000 to $7,499 | 44 (3.3%) | 27 (2.9%) |
| $7,500 to $9,999 | 51 (3.8%) | 153 (16.4%) |
| $10,000 to $12,499 | 30 (2.2%) | 43 (4.6%) |
| $12,500 to $14,999 | 74 (5.5%) | 32 (3.4%) |
| $15,000 to $17,499 | 75 (5.6%) | 38 (4.1%) |
| $17,500 to $19,999 | 21 (1.6%) | 0 (0.0%) |
| $20,000 to $22,499 | 0 (0.0%) | 38 (4.1%) |
| $22,500 to $24,999 | 87 (6.5%) | 24 (2.6%) |
| $25,000 to $29,999 | 76 (5.6%) | 63 (6.8%) |
| $30,000 to $34,999 | 0 (0.0%) | 70 (7.5%) |
| $35,000 to $39,999 | 123 (9.1%) | 0 (0.0%) |
| $40,000 to $44,999 | 48 (3.6%) | 0 (0.0%) |
| $45,000 to $49,999 | 123 (9.1%) | 58 (6.2%) |
| $50,000 to $54,999 | 90 (6.7%) | 25 (2.7%) |
| $55,000 to $64,999 | 41 (3.0%) | 40 (4.3%) |
| $65,000 to $74,999 | 113 (8.4%) | 104 (11.2%) |
| $75,000 to $99,999 | 170 (12.6%) | 45 (4.8%) |
| $100,000+ | 124 (9.2%) | 115 (12.3%) |
| Total | 1,349 (100.0%) | 932 (100.0%) |
Earnings by Sex by Educational Attainment in Summerside
Average earnings in Summerside are $47,512 for men and $34,528 for women, a difference of 27.3%. Men with an educational attainment of graduate degree enjoy the highest average annual earnings of $48,604, while those with high school diploma education earn the least with $44,830. Women with an educational attainment of bachelor's degree earn the most with the average annual earnings of $64,545, while those with college or associate's degree education have the smallest earnings of $26,722.
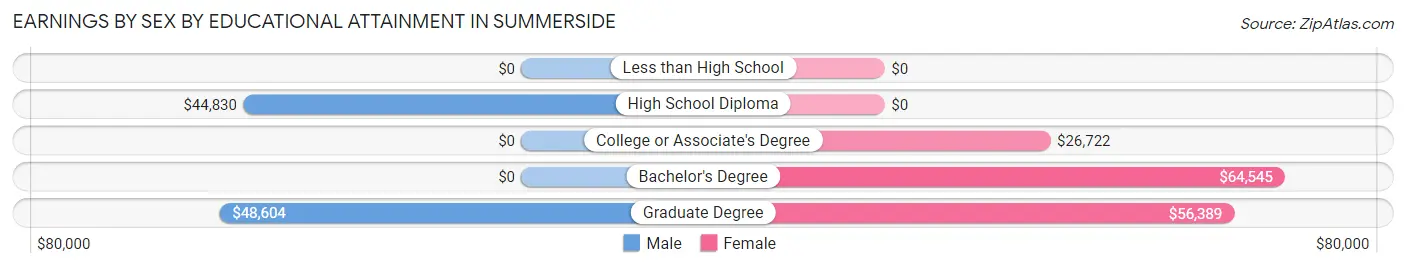
| Educational Attainment | Male Income | Female Income |
| Less than High School | - | - |
| High School Diploma | $44,830 | $0 |
| College or Associate's Degree | - | - |
| Bachelor's Degree | - | - |
| Graduate Degree | $48,604 | $56,389 |
| Total | $47,512 | $34,528 |
Family Income in Summerside
Family Income Brackets in Summerside
According to the Summerside family income data, there are 197 families falling into the $100,000 to $149,999 income range, which is the most common income bracket and makes up 18.1% of all families.
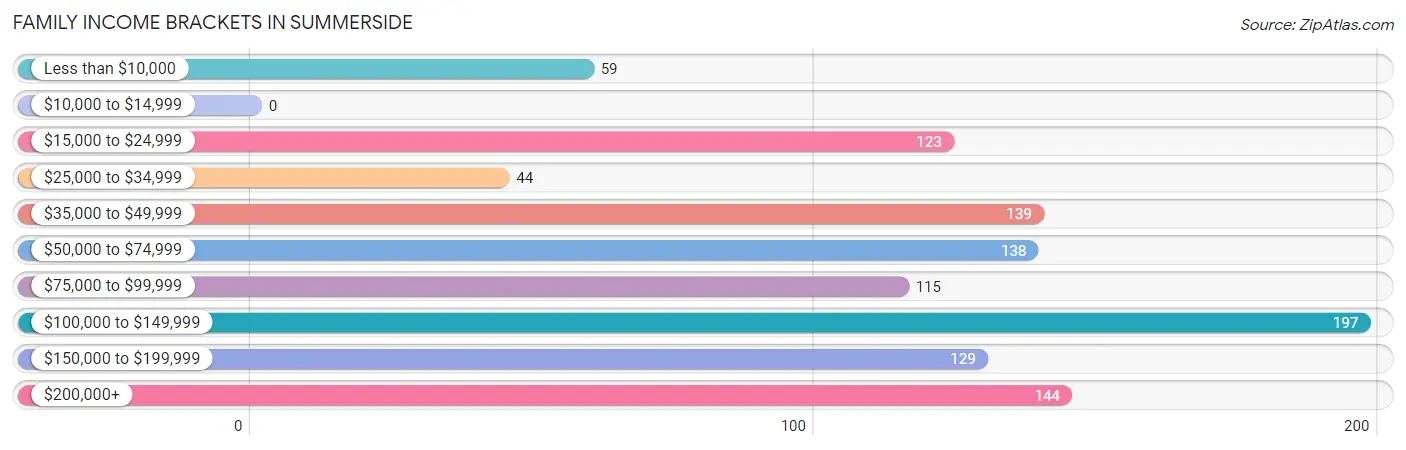
| Income Bracket | # Families | % Families |
| Less than $10,000 | 59 | 5.4% |
| $10,000 to $14,999 | 0 | 0.0% |
| $15,000 to $24,999 | 123 | 11.3% |
| $25,000 to $34,999 | 44 | 4.0% |
| $35,000 to $49,999 | 139 | 12.8% |
| $50,000 to $74,999 | 138 | 12.7% |
| $75,000 to $99,999 | 115 | 10.6% |
| $100,000 to $149,999 | 197 | 18.1% |
| $150,000 to $199,999 | 129 | 11.9% |
| $200,000+ | 144 | 13.2% |
Family Income by Famaliy Size in Summerside
3-person families (193 | 17.7%) account for the highest median family income in Summerside with $163,631 per family, while 3-person families (193 | 17.7%) have the highest median income of $54,544 per family member.
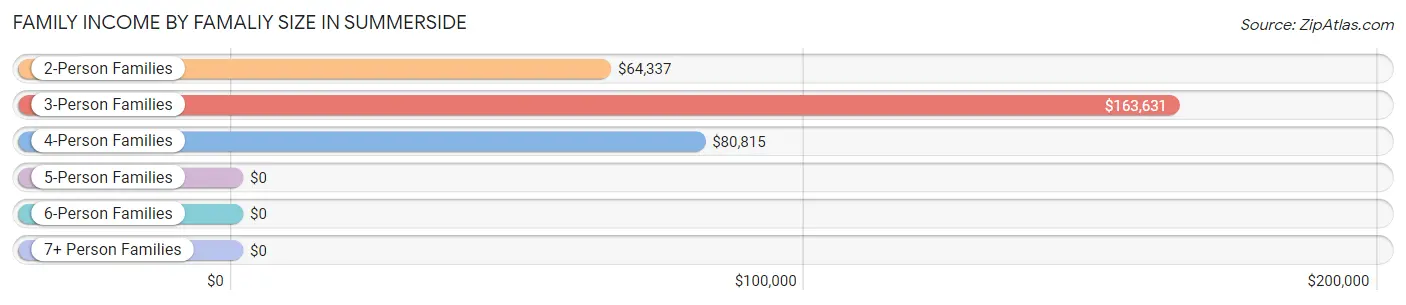
| Income Bracket | # Families | Median Income |
| 2-Person Families | 530 (48.7%) | $64,337 |
| 3-Person Families | 193 (17.7%) | $163,631 |
| 4-Person Families | 153 (14.1%) | $80,815 |
| 5-Person Families | 176 (16.2%) | $0 |
| 6-Person Families | 36 (3.3%) | $0 |
| 7+ Person Families | 0 (0.0%) | $0 |
| Total | 1,088 (100.0%) | $77,386 |
Family Income by Number of Earners in Summerside
The median family income in Summerside is $77,386, with families comprising 3+ earners (108) having the highest median family income of $122,286, while families with no earners (183) have the lowest median family income of $34,063, accounting for 9.9% and 16.8% of families, respectively.
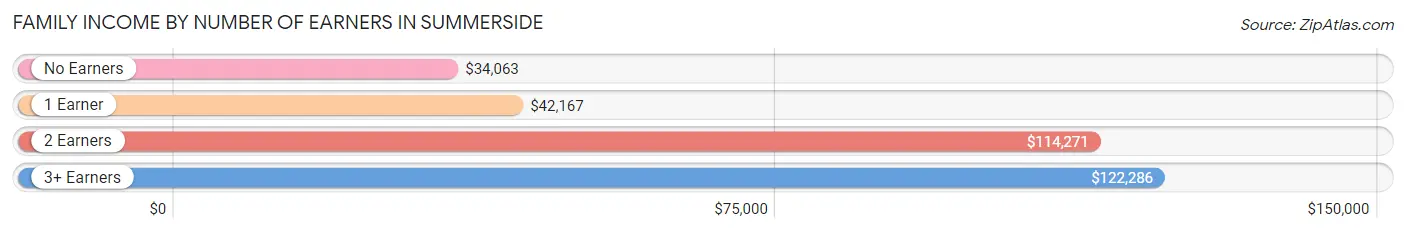
| Number of Earners | # Families | Median Income |
| No Earners | 183 (16.8%) | $34,063 |
| 1 Earner | 332 (30.5%) | $42,167 |
| 2 Earners | 465 (42.7%) | $114,271 |
| 3+ Earners | 108 (9.9%) | $122,286 |
| Total | 1,088 (100.0%) | $77,386 |
Household Income in Summerside
Household Income Brackets in Summerside
With 446 households falling in the category, the $35,000 to $49,999 income range is the most frequent in Summerside, accounting for 22.3% of all households. In contrast, only 108 households (5.4%) fall into the $10,000 to $14,999 income bracket, making it the least populous group.
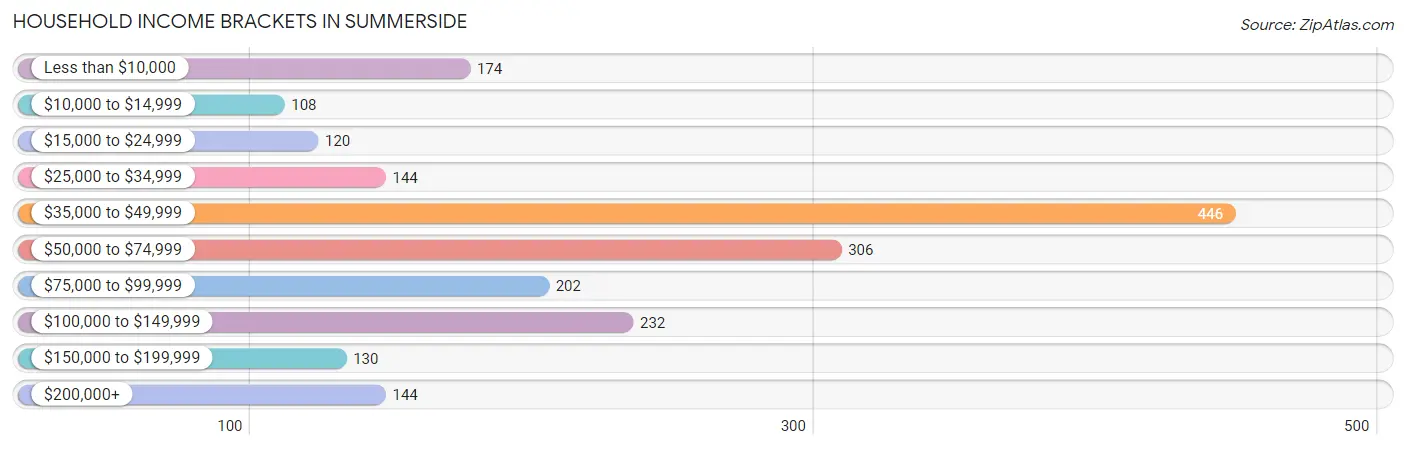
| Income Bracket | # Households | % Households |
| Less than $10,000 | 174 | 8.7% |
| $10,000 to $14,999 | 108 | 5.4% |
| $15,000 to $24,999 | 120 | 6.0% |
| $25,000 to $34,999 | 144 | 7.2% |
| $35,000 to $49,999 | 446 | 22.3% |
| $50,000 to $74,999 | 306 | 15.3% |
| $75,000 to $99,999 | 202 | 10.1% |
| $100,000 to $149,999 | 232 | 11.6% |
| $150,000 to $199,999 | 130 | 6.5% |
| $200,000+ | 144 | 7.2% |
Household Income by Householder Age in Summerside
The median household income in Summerside is $57,976, with the highest median household income of $77,358 found in the 25 to 44 years age bracket for the primary householder. A total of 735 households (36.7%) fall into this category. Meanwhile, the 65+ years age bracket for the primary householder has the lowest median household income of $34,896, with 523 households (26.2%) in this group.
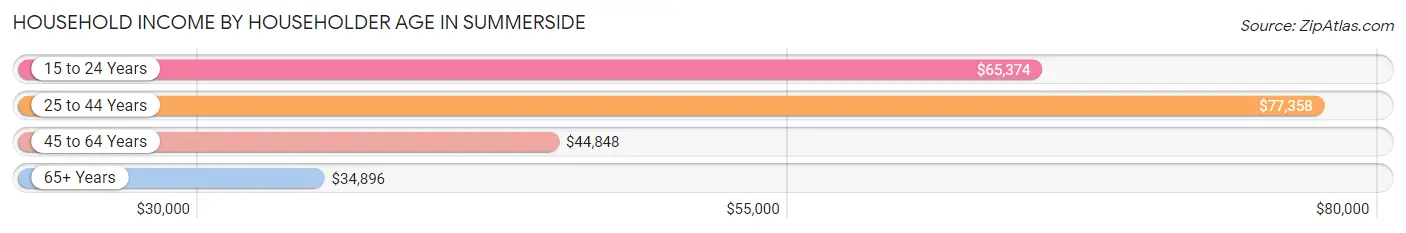
| Income Bracket | # Households | Median Income |
| 15 to 24 Years | 148 (7.4%) | $65,374 |
| 25 to 44 Years | 735 (36.7%) | $77,358 |
| 45 to 64 Years | 594 (29.7%) | $44,848 |
| 65+ Years | 523 (26.2%) | $34,896 |
| Total | 2,000 (100.0%) | $57,976 |
Poverty in Summerside
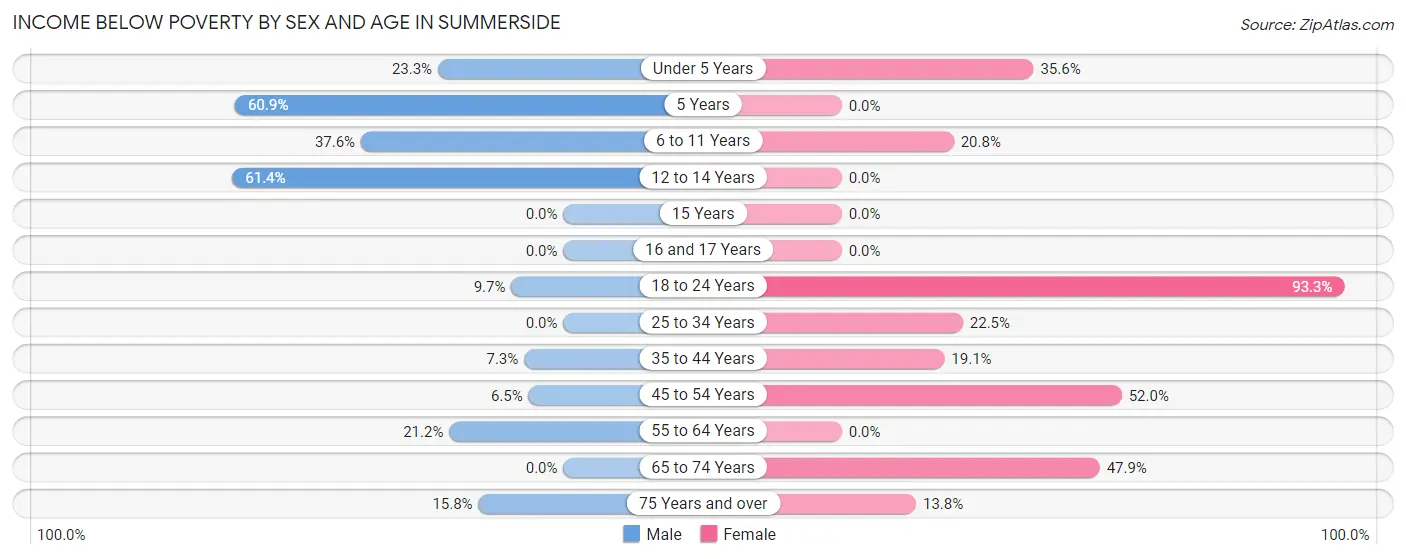
Income Below Poverty by Sex and Age in Summerside
With 14.9% poverty level for males and 28.4% for females among the residents of Summerside, 12 to 14 year old males and 18 to 24 year old females are the most vulnerable to poverty, with 43 males (61.4%) and 166 females (93.3%) in their respective age groups living below the poverty level.
| Age Bracket | Male | Female |
| Under 5 Years | 44 (23.3%) | 95 (35.6%) |
| 5 Years | 39 (60.9%) | 0 (0.0%) |
| 6 to 11 Years | 68 (37.6%) | 48 (20.8%) |
| 12 to 14 Years | 43 (61.4%) | 0 (0.0%) |
| 15 Years | 0 (0.0%) | 0 (0.0%) |
| 16 and 17 Years | 0 (0.0%) | 0 (0.0%) |
| 18 to 24 Years | 23 (9.7%) | 166 (93.3%) |
| 25 to 34 Years | 0 (0.0%) | 111 (22.5%) |
| 35 to 44 Years | 15 (7.3%) | 28 (19.1%) |
| 45 to 54 Years | 8 (6.5%) | 53 (52.0%) |
| 55 to 64 Years | 79 (21.2%) | 0 (0.0%) |
| 65 to 74 Years | 0 (0.0%) | 90 (47.9%) |
| 75 Years and over | 26 (15.8%) | 35 (13.8%) |
| Total | 345 (14.9%) | 626 (28.4%) |
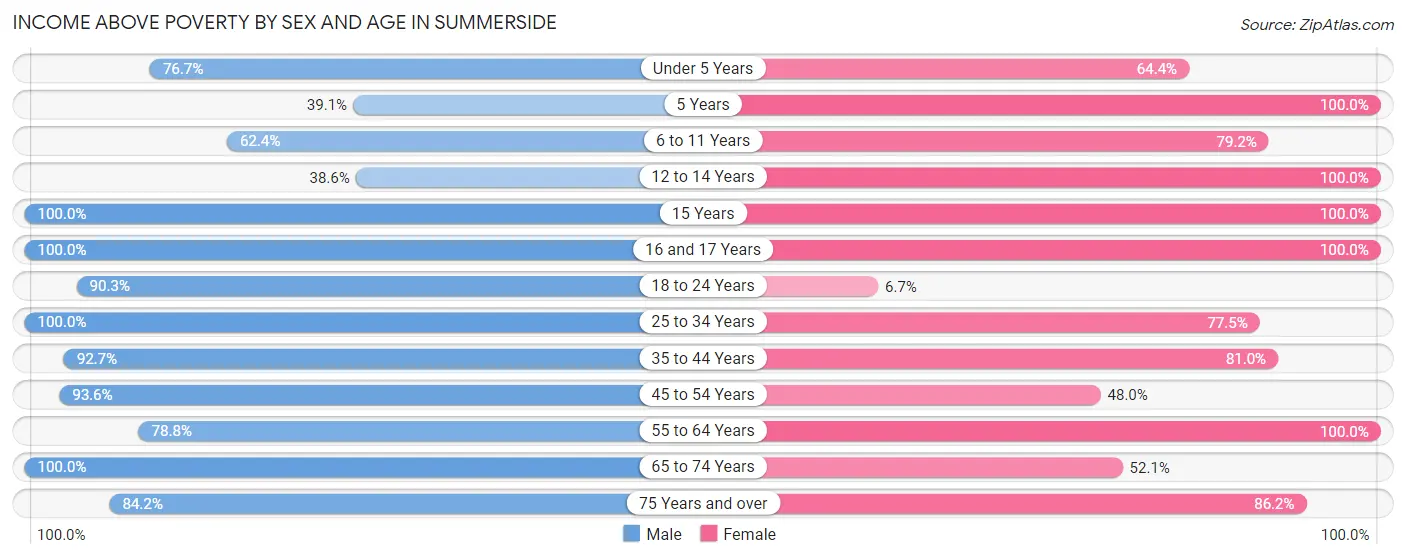
Income Above Poverty by Sex and Age in Summerside
According to the poverty statistics in Summerside, males aged 15 years and females aged 5 years are the age groups that are most secure financially, with 100.0% of males and 100.0% of females in these age groups living above the poverty line.
| Age Bracket | Male | Female |
| Under 5 Years | 145 (76.7%) | 172 (64.4%) |
| 5 Years | 25 (39.1%) | 39 (100.0%) |
| 6 to 11 Years | 113 (62.4%) | 183 (79.2%) |
| 12 to 14 Years | 27 (38.6%) | 50 (100.0%) |
| 15 Years | 64 (100.0%) | 3 (100.0%) |
| 16 and 17 Years | 32 (100.0%) | 18 (100.0%) |
| 18 to 24 Years | 215 (90.3%) | 12 (6.7%) |
| 25 to 34 Years | 457 (100.0%) | 383 (77.5%) |
| 35 to 44 Years | 191 (92.7%) | 119 (80.9%) |
| 45 to 54 Years | 116 (93.5%) | 49 (48.0%) |
| 55 to 64 Years | 294 (78.8%) | 236 (100.0%) |
| 65 to 74 Years | 145 (100.0%) | 98 (52.1%) |
| 75 Years and over | 139 (84.2%) | 219 (86.2%) |
| Total | 1,963 (85.1%) | 1,581 (71.6%) |
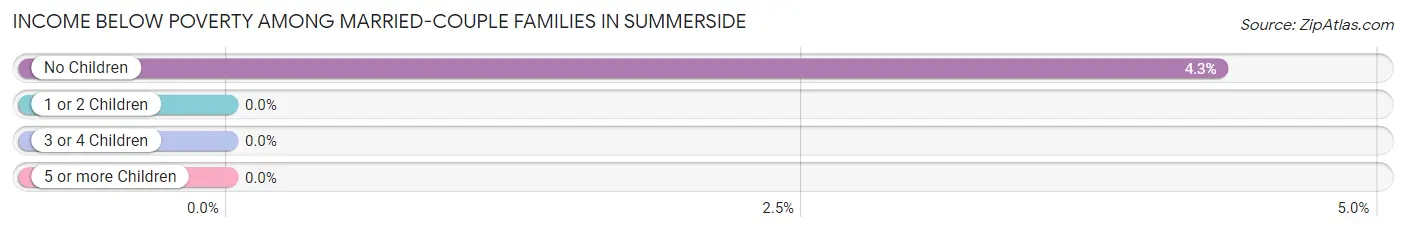
Income Below Poverty Among Married-Couple Families in Summerside
The poverty statistics for married-couple families in Summerside show that 2.2% or 17 of the total 766 families live below the poverty line. Families with no children have the highest poverty rate of 4.3%, comprising of 17 families. On the other hand, families with 1 or 2 children have the lowest poverty rate of 0.0%, which includes 0 families.
| Children | Above Poverty | Below Poverty |
| No Children | 377 (95.7%) | 17 (4.3%) |
| 1 or 2 Children | 232 (100.0%) | 0 (0.0%) |
| 3 or 4 Children | 140 (100.0%) | 0 (0.0%) |
| 5 or more Children | 0 (0.0%) | 0 (0.0%) |
| Total | 749 (97.8%) | 17 (2.2%) |
Income Below Poverty Among Single-Parent Households in Summerside
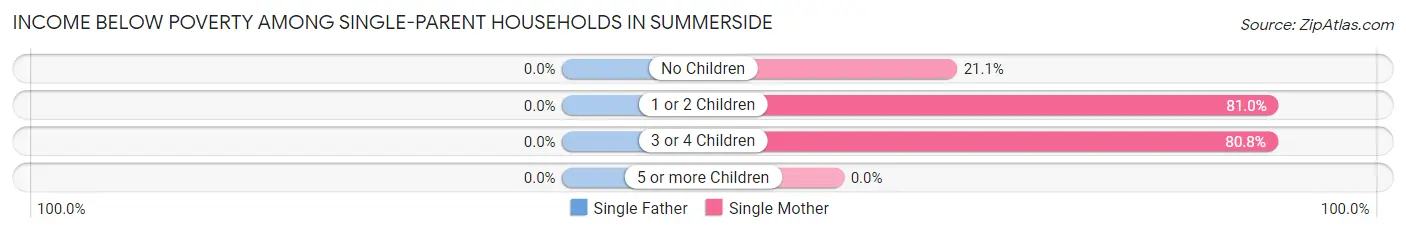
| Children | Single Father | Single Mother |
| No Children | 0 (0.0%) | 8 (21.0%) |
| 1 or 2 Children | 0 (0.0%) | 115 (81.0%) |
| 3 or 4 Children | 0 (0.0%) | 59 (80.8%) |
| 5 or more Children | 0 (0.0%) | 0 (0.0%) |
| Total | 0 (0.0%) | 182 (71.9%) |
Income Below Poverty Among Married-Couple vs Single-Parent Households in Summerside
The poverty data for Summerside shows that 17 of the married-couple family households (2.2%) and 182 of the single-parent households (56.5%) are living below the poverty level. Within the married-couple family households, those with no children have the highest poverty rate, with 17 households (4.3%) falling below the poverty line. Among the single-parent households, those with 1 or 2 children have the highest poverty rate, with 115 household (72.3%) living below poverty.
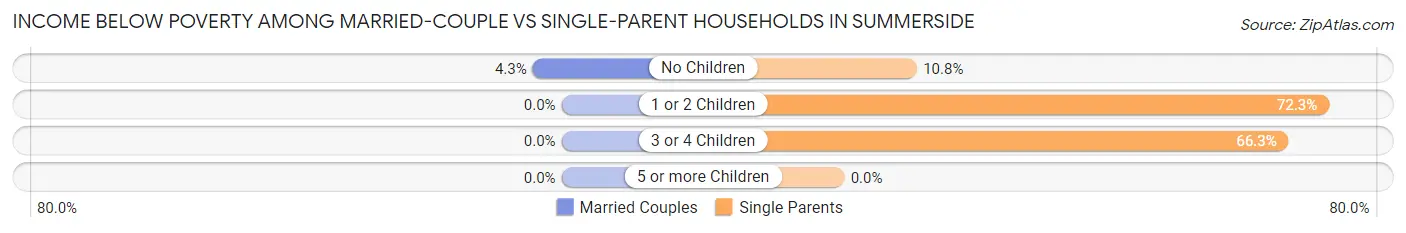
| Children | Married-Couple Families | Single-Parent Households |
| No Children | 17 (4.3%) | 8 (10.8%) |
| 1 or 2 Children | 0 (0.0%) | 115 (72.3%) |
| 3 or 4 Children | 0 (0.0%) | 59 (66.3%) |
| 5 or more Children | 0 (0.0%) | 0 (0.0%) |
| Total | 17 (2.2%) | 182 (56.5%) |
Employment Characteristics in Summerside
Employment by Class of Employer in Summerside
Among the 2,088 employed individuals in Summerside, private company employees (1,516 | 72.6%), not-for-profit organizations (226 | 10.8%), and self-employed (not incorporated) (119 | 5.7%) make up the most common classes of employment.
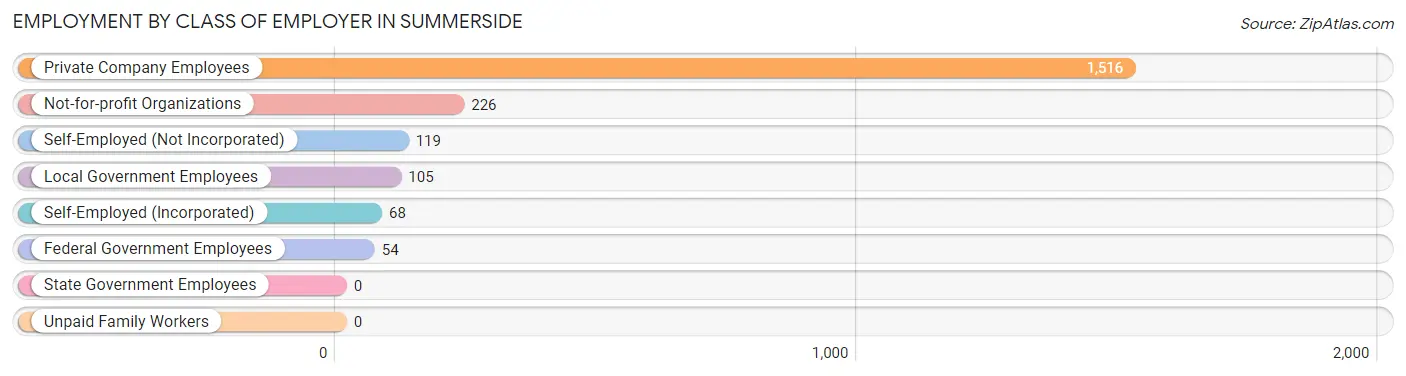
| Employer Class | # Employees | % Employees |
| Private Company Employees | 1,516 | 72.6% |
| Self-Employed (Incorporated) | 68 | 3.3% |
| Self-Employed (Not Incorporated) | 119 | 5.7% |
| Not-for-profit Organizations | 226 | 10.8% |
| Local Government Employees | 105 | 5.0% |
| State Government Employees | 0 | 0.0% |
| Federal Government Employees | 54 | 2.6% |
| Unpaid Family Workers | 0 | 0.0% |
| Total | 2,088 | 100.0% |
Employment Status by Age in Summerside
According to the labor force statistics for Summerside, out of the total population over 16 years of age (3,357), 66.8% or 2,242 individuals are in the labor force, with 6.9% or 155 of them unemployed. The age group with the highest labor force participation rate is 30 to 34 years, with 100.0% or 419 individuals in the labor force. Within the labor force, the 45 to 54 years age range has the highest percentage of unemployed individuals, with 22.4% or 37 of them being unemployed.
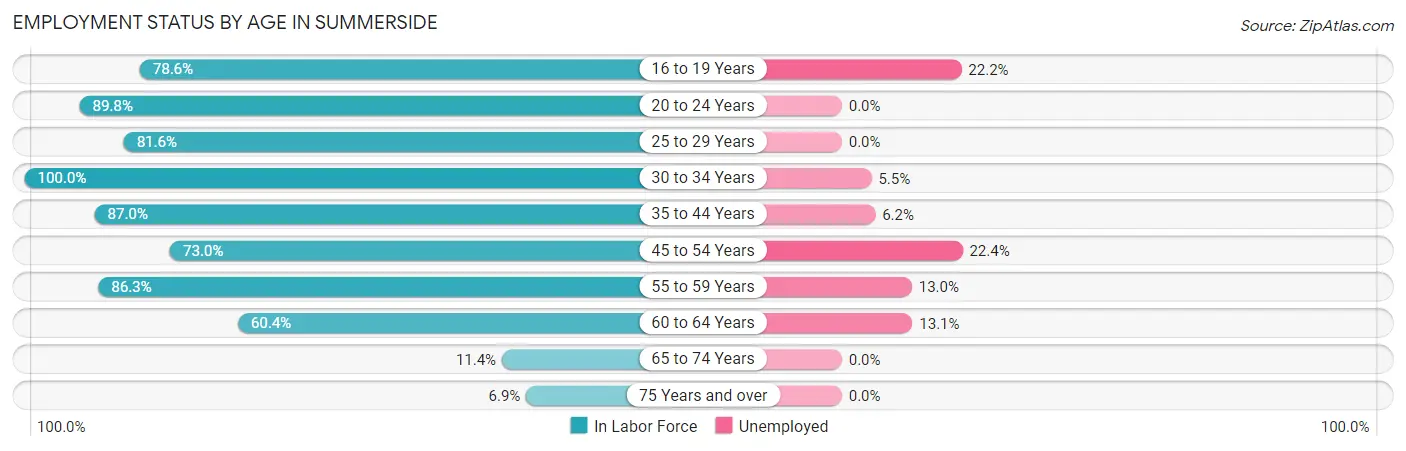
| Age Bracket | In Labor Force | Unemployed |
| 16 to 19 Years | 81 (78.6%) | 18 (22.2%) |
| 20 to 24 Years | 326 (89.8%) | 0 (0.0%) |
| 25 to 29 Years | 434 (81.6%) | 0 (0.0%) |
| 30 to 34 Years | 419 (100.0%) | 23 (5.5%) |
| 35 to 44 Years | 307 (87.0%) | 19 (6.2%) |
| 45 to 54 Years | 165 (73.0%) | 37 (22.4%) |
| 55 to 59 Years | 253 (86.3%) | 33 (13.0%) |
| 60 to 64 Years | 191 (60.4%) | 25 (13.1%) |
| 65 to 74 Years | 38 (11.4%) | 0 (0.0%) |
| 75 Years and over | 29 (6.9%) | 0 (0.0%) |
| Total | 2,242 (66.8%) | 155 (6.9%) |
Employment Status by Educational Attainment in Summerside
According to labor force statistics for Summerside, 82.7% of individuals (1,769) out of the total population between 25 and 64 years of age (2,139) are in the labor force, with 7.7% or 136 of them being unemployed. The group with the highest labor force participation rate are those with the educational attainment of less than high school, with 100.0% or 79 individuals in the labor force. Within the labor force, individuals with high school diploma education have the highest percentage of unemployment, with 19.7% or 79 of them being unemployed.
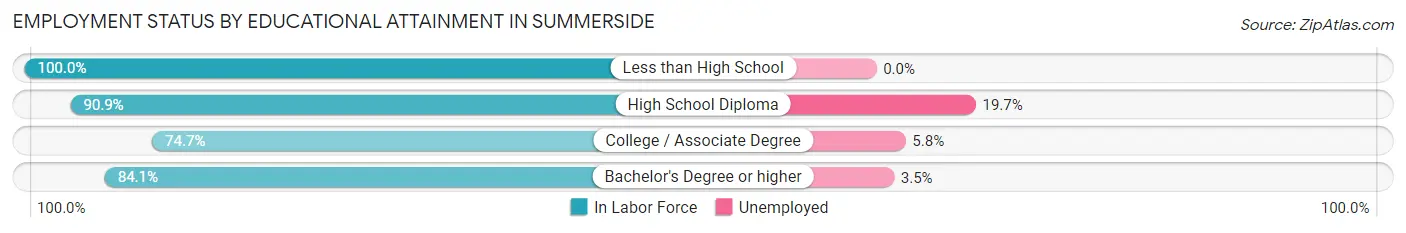
| Educational Attainment | In Labor Force | Unemployed |
| Less than High School | 79 (100.0%) | 0 (0.0%) |
| High School Diploma | 401 (90.9%) | 87 (19.7%) |
| College / Associate Degree | 572 (74.7%) | 44 (5.8%) |
| Bachelor's Degree or higher | 717 (84.1%) | 30 (3.5%) |
| Total | 1,769 (82.7%) | 165 (7.7%) |
Employment Occupations by Sex in Summerside
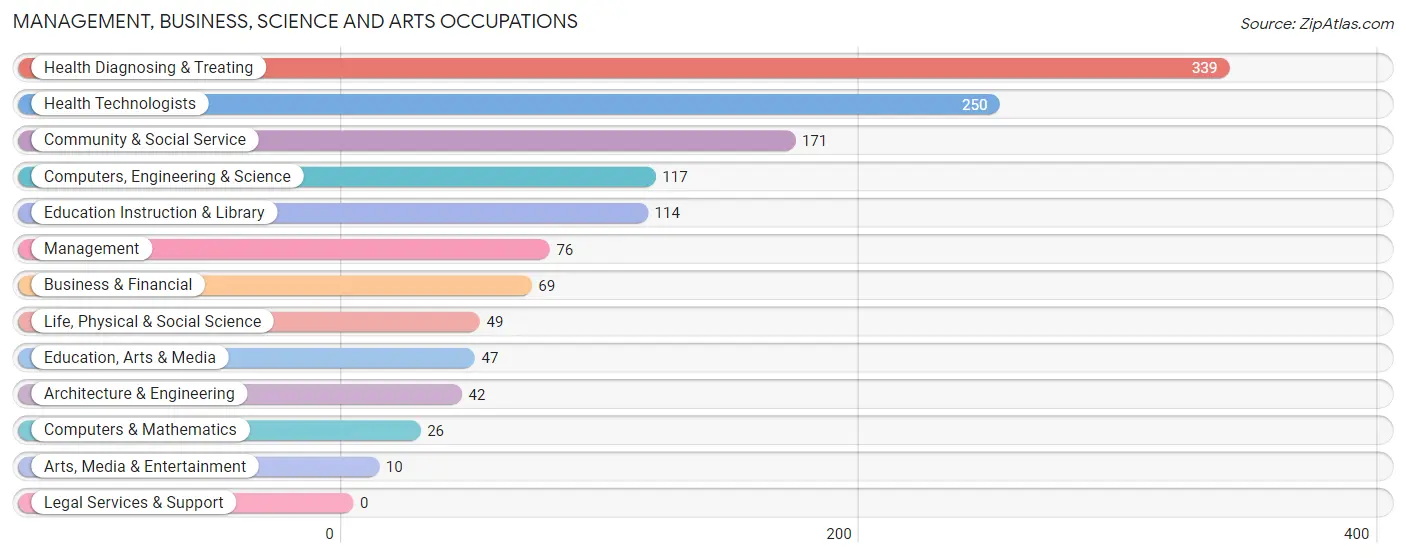
Management, Business, Science and Arts Occupations
The most common Management, Business, Science and Arts occupations in Summerside are Health Diagnosing & Treating (339 | 16.2%), Health Technologists (250 | 12.0%), Community & Social Service (171 | 8.2%), Computers, Engineering & Science (117 | 5.6%), and Education Instruction & Library (114 | 5.5%).
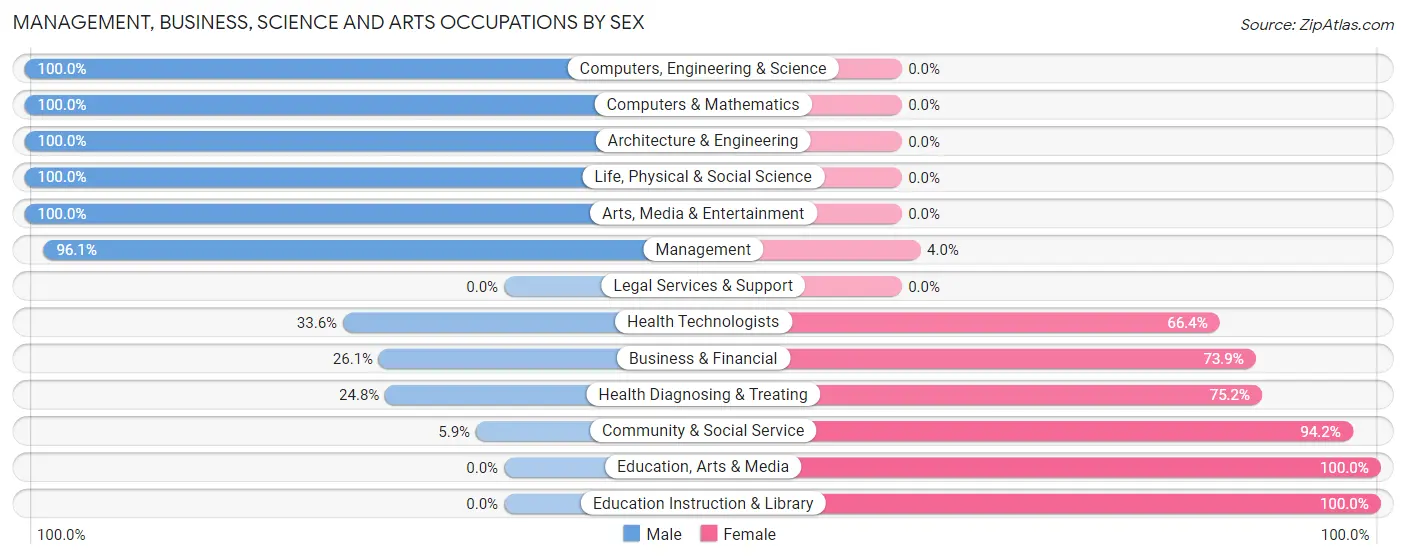
Management, Business, Science and Arts Occupations by Sex
Within the Management, Business, Science and Arts occupations in Summerside, the most male-oriented occupations are Computers, Engineering & Science (100.0%), Computers & Mathematics (100.0%), and Architecture & Engineering (100.0%), while the most female-oriented occupations are Education, Arts & Media (100.0%), Education Instruction & Library (100.0%), and Community & Social Service (94.2%).
| Occupation | Male | Female |
| Management | 73 (96.1%) | 3 (4.0%) |
| Business & Financial | 18 (26.1%) | 51 (73.9%) |
| Computers, Engineering & Science | 117 (100.0%) | 0 (0.0%) |
| Computers & Mathematics | 26 (100.0%) | 0 (0.0%) |
| Architecture & Engineering | 42 (100.0%) | 0 (0.0%) |
| Life, Physical & Social Science | 49 (100.0%) | 0 (0.0%) |
| Community & Social Service | 10 (5.9%) | 161 (94.2%) |
| Education, Arts & Media | 0 (0.0%) | 47 (100.0%) |
| Legal Services & Support | 0 (0.0%) | 0 (0.0%) |
| Education Instruction & Library | 0 (0.0%) | 114 (100.0%) |
| Arts, Media & Entertainment | 10 (100.0%) | 0 (0.0%) |
| Health Diagnosing & Treating | 84 (24.8%) | 255 (75.2%) |
| Health Technologists | 84 (33.6%) | 166 (66.4%) |
| Total (Category) | 302 (39.1%) | 470 (60.9%) |
| Total (Overall) | 1,252 (60.0%) | 836 (40.0%) |
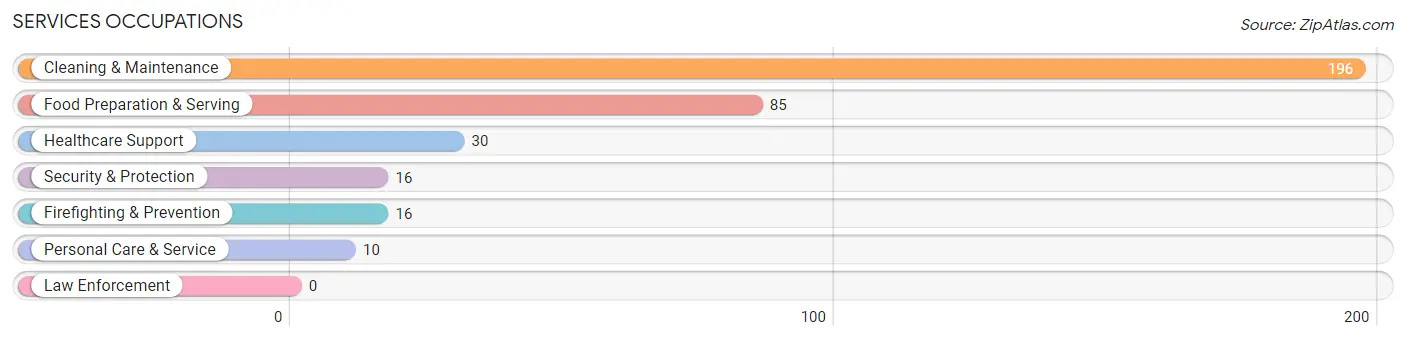
Services Occupations
The most common Services occupations in Summerside are Cleaning & Maintenance (196 | 9.4%), Food Preparation & Serving (85 | 4.1%), Healthcare Support (30 | 1.4%), Security & Protection (16 | 0.8%), and Firefighting & Prevention (16 | 0.8%).
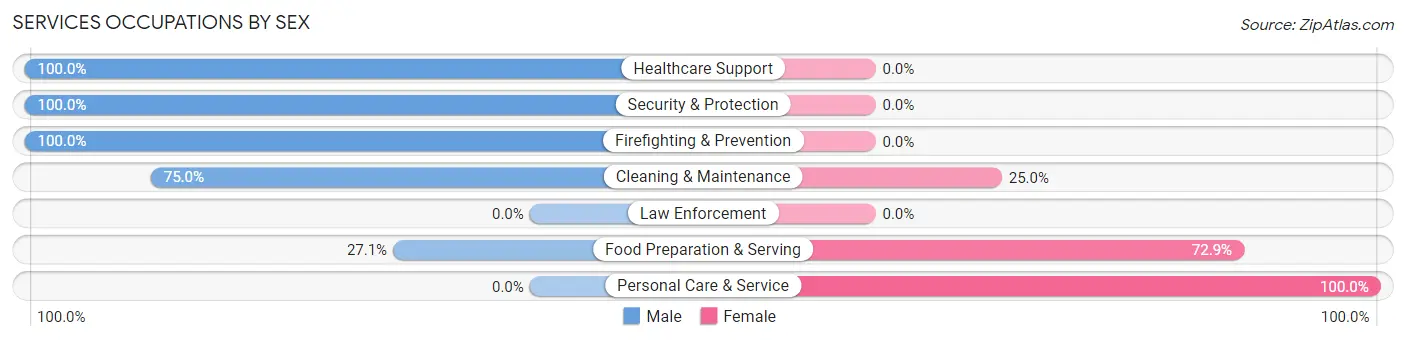
Services Occupations by Sex
Within the Services occupations in Summerside, the most male-oriented occupations are Healthcare Support (100.0%), Security & Protection (100.0%), and Firefighting & Prevention (100.0%), while the most female-oriented occupations are Personal Care & Service (100.0%), Food Preparation & Serving (72.9%), and Cleaning & Maintenance (25.0%).
| Occupation | Male | Female |
| Healthcare Support | 30 (100.0%) | 0 (0.0%) |
| Security & Protection | 16 (100.0%) | 0 (0.0%) |
| Firefighting & Prevention | 16 (100.0%) | 0 (0.0%) |
| Law Enforcement | 0 (0.0%) | 0 (0.0%) |
| Food Preparation & Serving | 23 (27.1%) | 62 (72.9%) |
| Cleaning & Maintenance | 147 (75.0%) | 49 (25.0%) |
| Personal Care & Service | 0 (0.0%) | 10 (100.0%) |
| Total (Category) | 216 (64.1%) | 121 (35.9%) |
| Total (Overall) | 1,252 (60.0%) | 836 (40.0%) |
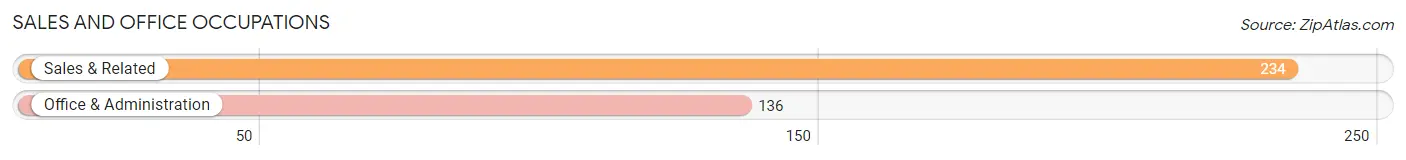
Sales and Office Occupations
The most common Sales and Office occupations in Summerside are Sales & Related (234 | 11.2%), and Office & Administration (136 | 6.5%).
Sales and Office Occupations by Sex
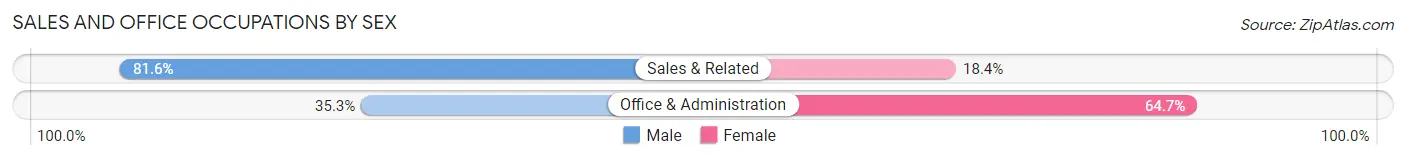
| Occupation | Male | Female |
| Sales & Related | 191 (81.6%) | 43 (18.4%) |
| Office & Administration | 48 (35.3%) | 88 (64.7%) |
| Total (Category) | 239 (64.6%) | 131 (35.4%) |
| Total (Overall) | 1,252 (60.0%) | 836 (40.0%) |
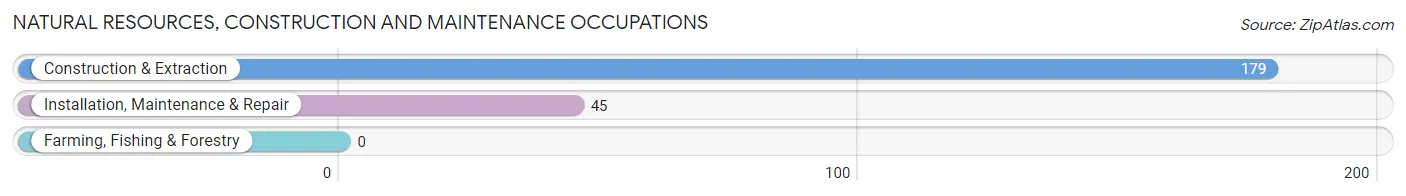
Natural Resources, Construction and Maintenance Occupations
The most common Natural Resources, Construction and Maintenance occupations in Summerside are Construction & Extraction (179 | 8.6%), and Installation, Maintenance & Repair (45 | 2.2%).
Natural Resources, Construction and Maintenance Occupations by Sex
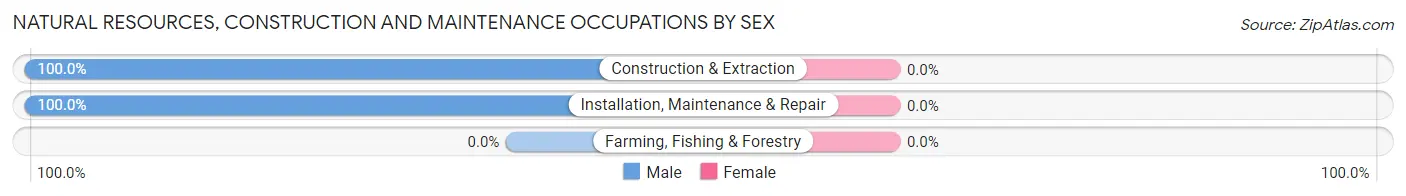
| Occupation | Male | Female |
| Farming, Fishing & Forestry | 0 (0.0%) | 0 (0.0%) |
| Construction & Extraction | 179 (100.0%) | 0 (0.0%) |
| Installation, Maintenance & Repair | 45 (100.0%) | 0 (0.0%) |
| Total (Category) | 224 (100.0%) | 0 (0.0%) |
| Total (Overall) | 1,252 (60.0%) | 836 (40.0%) |
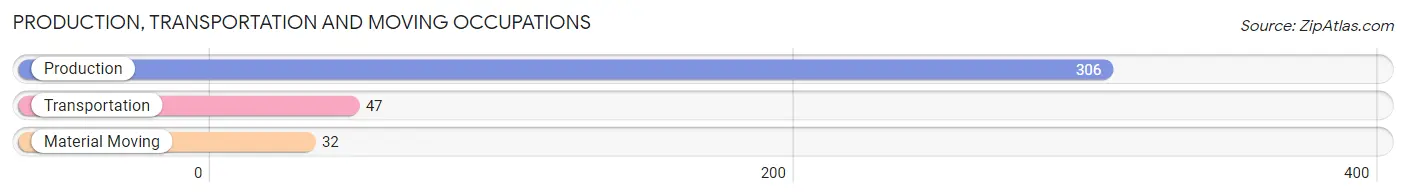
Production, Transportation and Moving Occupations
The most common Production, Transportation and Moving occupations in Summerside are Production (306 | 14.7%), Transportation (47 | 2.2%), and Material Moving (32 | 1.5%).
Production, Transportation and Moving Occupations by Sex
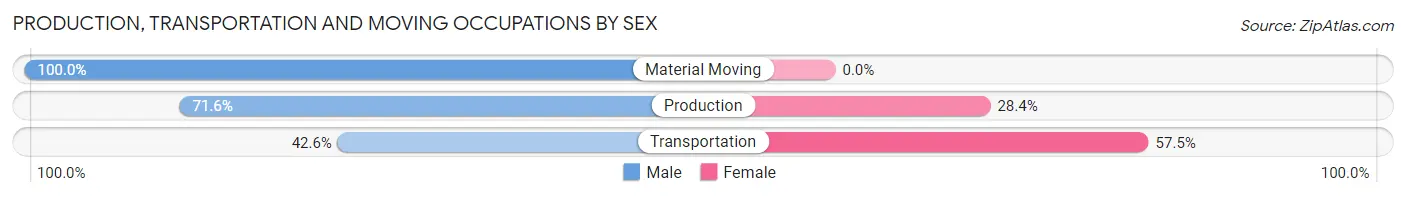
| Occupation | Male | Female |
| Production | 219 (71.6%) | 87 (28.4%) |
| Transportation | 20 (42.5%) | 27 (57.5%) |
| Material Moving | 32 (100.0%) | 0 (0.0%) |
| Total (Category) | 271 (70.4%) | 114 (29.6%) |
| Total (Overall) | 1,252 (60.0%) | 836 (40.0%) |
Employment Industries by Sex in Summerside
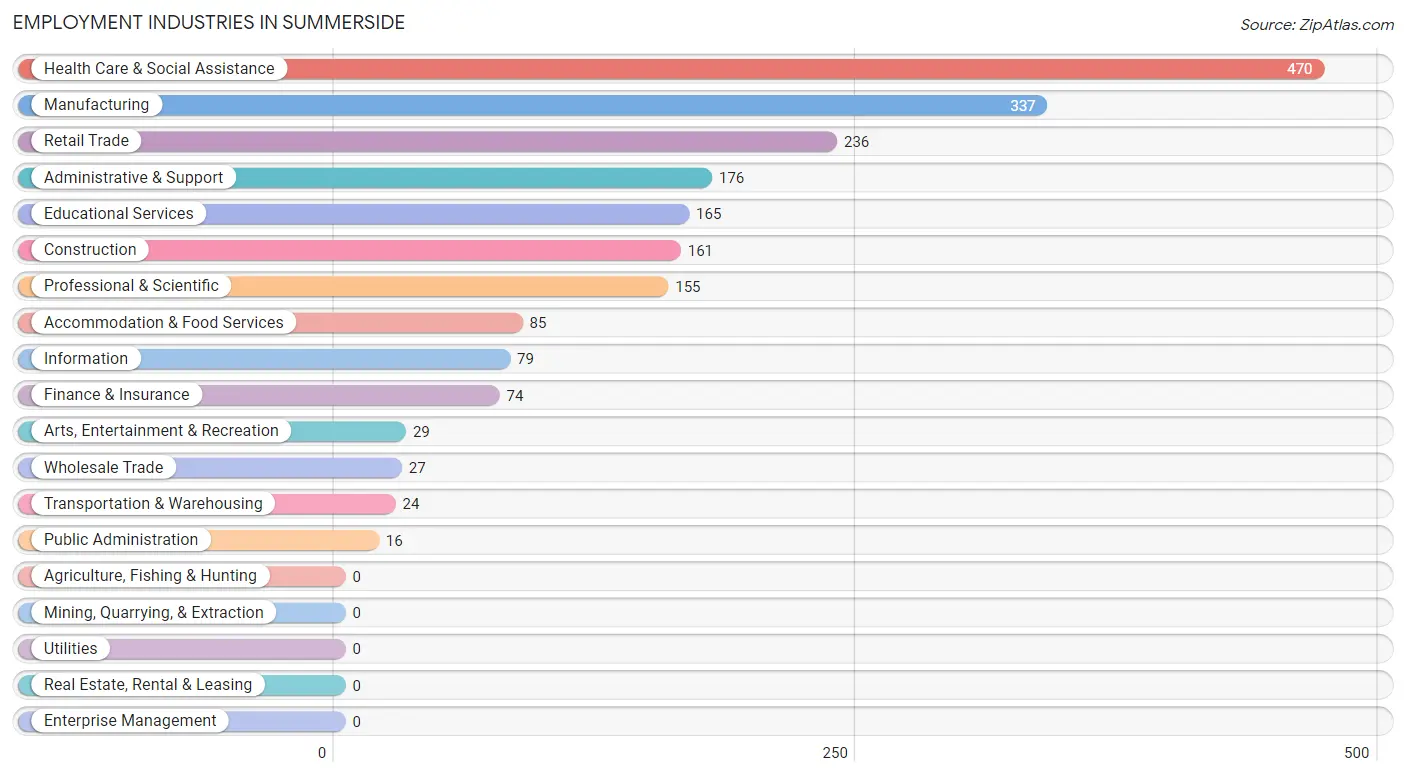
Employment Industries in Summerside
The major employment industries in Summerside include Health Care & Social Assistance (470 | 22.5%), Manufacturing (337 | 16.1%), Retail Trade (236 | 11.3%), Administrative & Support (176 | 8.4%), and Educational Services (165 | 7.9%).
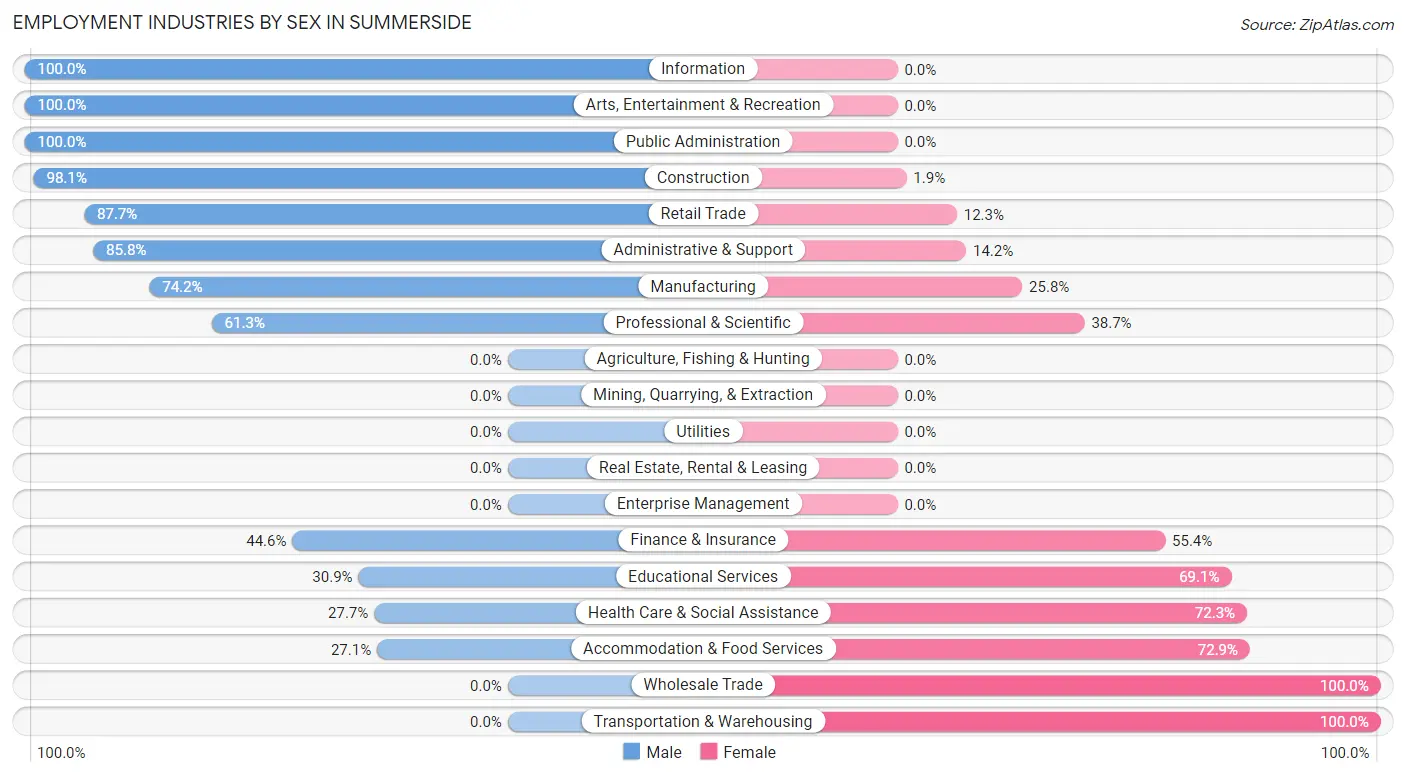
Employment Industries by Sex in Summerside
The Summerside industries that see more men than women are Information (100.0%), Arts, Entertainment & Recreation (100.0%), and Public Administration (100.0%), whereas the industries that tend to have a higher number of women are Wholesale Trade (100.0%), Transportation & Warehousing (100.0%), and Accommodation & Food Services (72.9%).
| Industry | Male | Female |
| Agriculture, Fishing & Hunting | 0 (0.0%) | 0 (0.0%) |
| Mining, Quarrying, & Extraction | 0 (0.0%) | 0 (0.0%) |
| Construction | 158 (98.1%) | 3 (1.9%) |
| Manufacturing | 250 (74.2%) | 87 (25.8%) |
| Wholesale Trade | 0 (0.0%) | 27 (100.0%) |
| Retail Trade | 207 (87.7%) | 29 (12.3%) |
| Transportation & Warehousing | 0 (0.0%) | 24 (100.0%) |
| Utilities | 0 (0.0%) | 0 (0.0%) |
| Information | 79 (100.0%) | 0 (0.0%) |
| Finance & Insurance | 33 (44.6%) | 41 (55.4%) |
| Real Estate, Rental & Leasing | 0 (0.0%) | 0 (0.0%) |
| Professional & Scientific | 95 (61.3%) | 60 (38.7%) |
| Enterprise Management | 0 (0.0%) | 0 (0.0%) |
| Administrative & Support | 151 (85.8%) | 25 (14.2%) |
| Educational Services | 51 (30.9%) | 114 (69.1%) |
| Health Care & Social Assistance | 130 (27.7%) | 340 (72.3%) |
| Arts, Entertainment & Recreation | 29 (100.0%) | 0 (0.0%) |
| Accommodation & Food Services | 23 (27.1%) | 62 (72.9%) |
| Public Administration | 16 (100.0%) | 0 (0.0%) |
| Total | 1,252 (60.0%) | 836 (40.0%) |
Education in Summerside
School Enrollment in Summerside
The most common levels of schooling among the 887 students in Summerside are elementary school (301 | 33.9%), middle school (235 | 26.5%), and high school (140 | 15.8%).
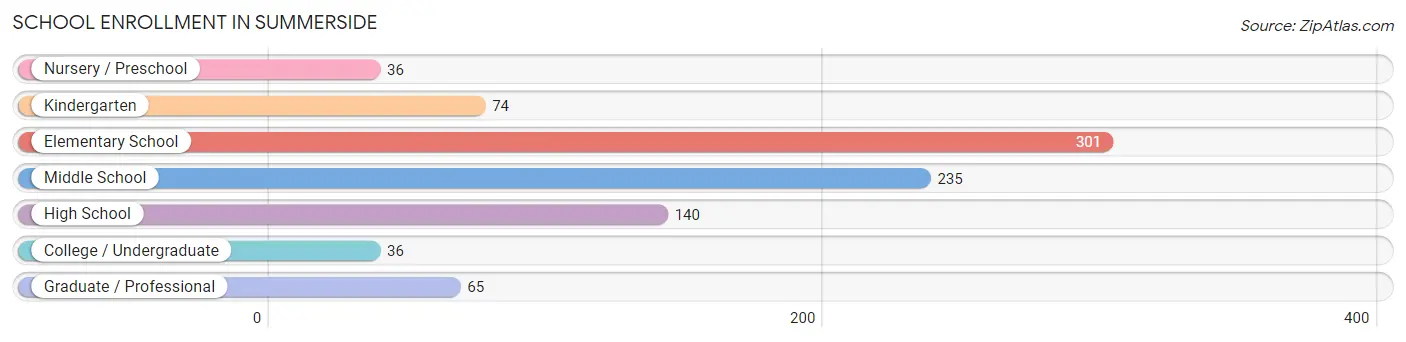
| School Level | # Students | % Students |
| Nursery / Preschool | 36 | 4.1% |
| Kindergarten | 74 | 8.3% |
| Elementary School | 301 | 33.9% |
| Middle School | 235 | 26.5% |
| High School | 140 | 15.8% |
| College / Undergraduate | 36 | 4.1% |
| Graduate / Professional | 65 | 7.3% |
| Total | 887 | 100.0% |
School Enrollment by Age by Funding Source in Summerside
Out of a total of 887 students who are enrolled in schools in Summerside, 209 (23.6%) attend a private institution, while the remaining 678 (76.4%) are enrolled in public schools. The age group of 25 to 34 year olds has the highest likelihood of being enrolled in private schools, with 15 (100.0% in the age bracket) enrolled. Conversely, the age group of 3 to 4 year olds has the lowest likelihood of being enrolled in a private school, with 36 (100.0% in the age bracket) attending a public institution.
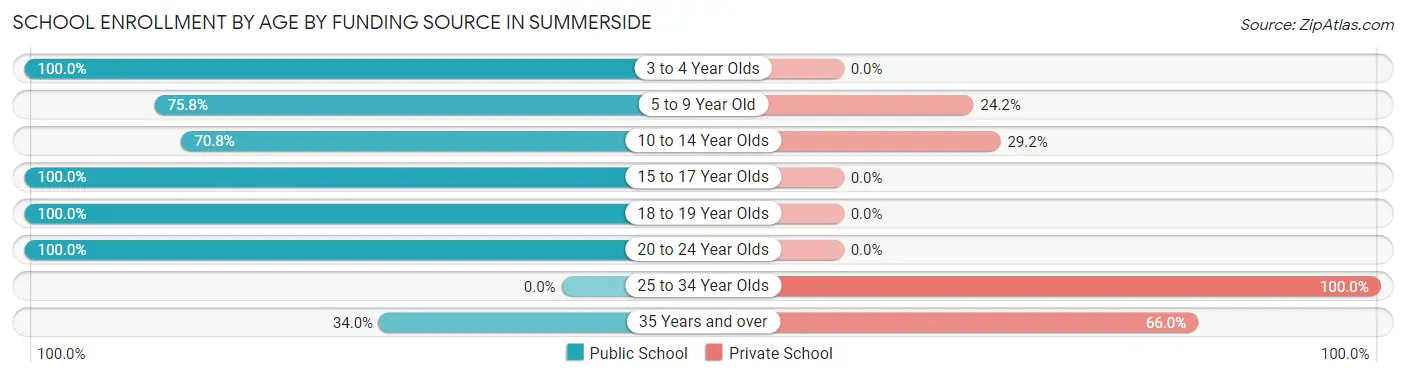
| Age Bracket | Public School | Private School |
| 3 to 4 Year Olds | 36 (100.0%) | 0 (0.0%) |
| 5 to 9 Year Old | 260 (75.8%) | 83 (24.2%) |
| 10 to 14 Year Olds | 189 (70.8%) | 78 (29.2%) |
| 15 to 17 Year Olds | 117 (100.0%) | 0 (0.0%) |
| 18 to 19 Year Olds | 35 (100.0%) | 0 (0.0%) |
| 20 to 24 Year Olds | 24 (100.0%) | 0 (0.0%) |
| 25 to 34 Year Olds | 0 (0.0%) | 15 (100.0%) |
| 35 Years and over | 17 (34.0%) | 33 (66.0%) |
| Total | 678 (76.4%) | 209 (23.6%) |
Educational Attainment by Field of Study in Summerside
Science & technology (193 | 18.6%), education (166 | 16.0%), business (143 | 13.8%), bio, nature & agricultural (116 | 11.2%), and social sciences (109 | 10.5%) are the most common fields of study among 1,040 individuals in Summerside who have obtained a bachelor's degree or higher.
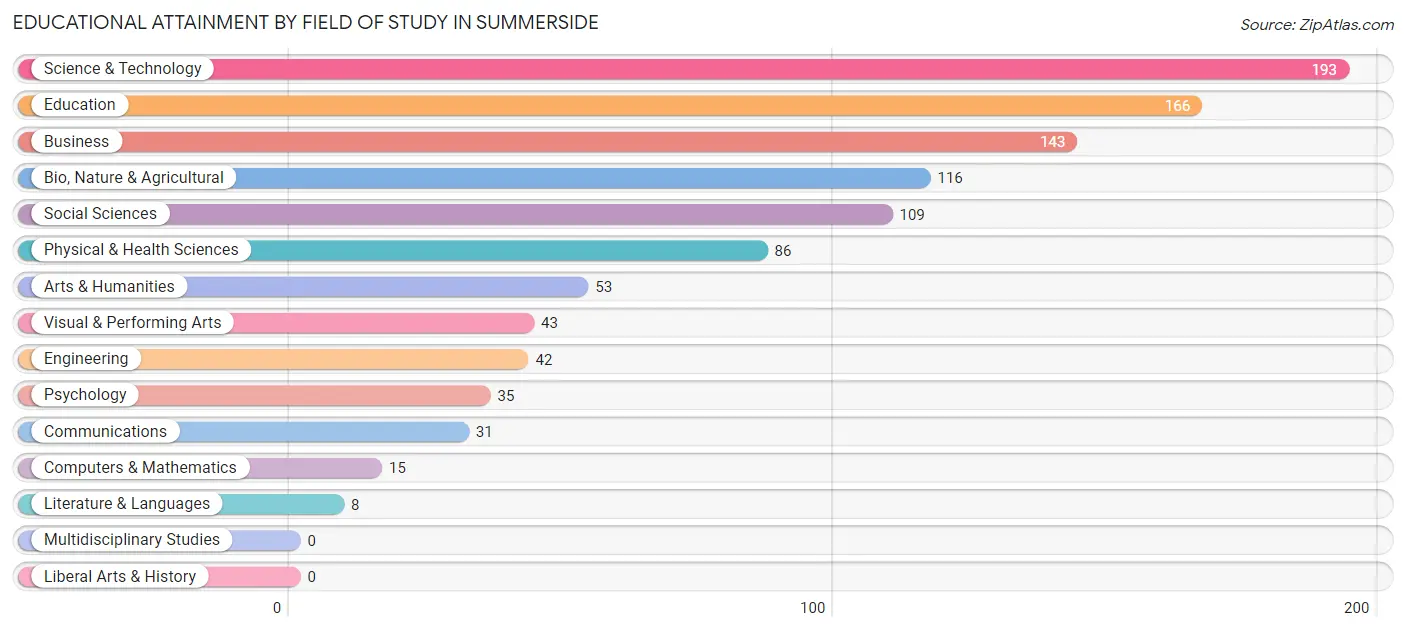
| Field of Study | # Graduates | % Graduates |
| Computers & Mathematics | 15 | 1.4% |
| Bio, Nature & Agricultural | 116 | 11.2% |
| Physical & Health Sciences | 86 | 8.3% |
| Psychology | 35 | 3.4% |
| Social Sciences | 109 | 10.5% |
| Engineering | 42 | 4.0% |
| Multidisciplinary Studies | 0 | 0.0% |
| Science & Technology | 193 | 18.6% |
| Business | 143 | 13.8% |
| Education | 166 | 16.0% |
| Literature & Languages | 8 | 0.8% |
| Liberal Arts & History | 0 | 0.0% |
| Visual & Performing Arts | 43 | 4.1% |
| Communications | 31 | 3.0% |
| Arts & Humanities | 53 | 5.1% |
| Total | 1,040 | 100.0% |
Transportation & Commute in Summerside
Vehicle Availability by Sex in Summerside
The most prevalent vehicle ownership categories in Summerside are males with 2 vehicles (652, accounting for 52.1%) and females with 2 vehicles (479, making up 78.0%).
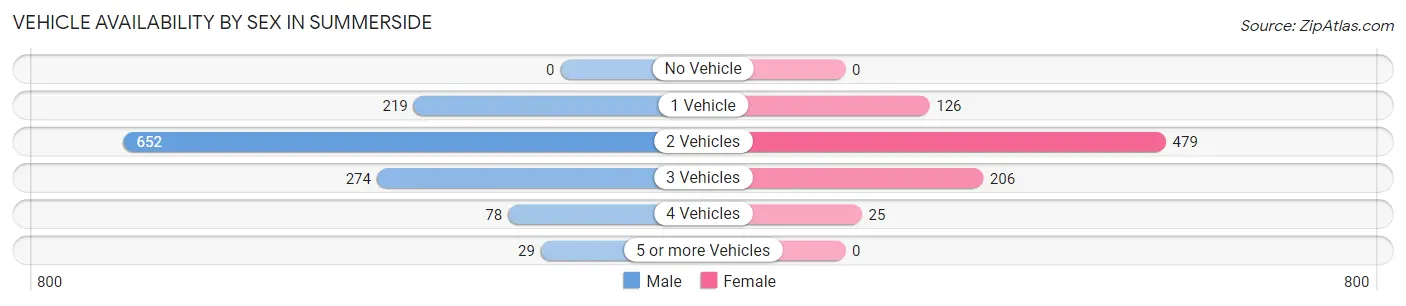
| Vehicles Available | Male | Female |
| No Vehicle | 0 (0.0%) | 0 (0.0%) |
| 1 Vehicle | 219 (17.5%) | 126 (15.1%) |
| 2 Vehicles | 652 (52.1%) | 479 (57.3%) |
| 3 Vehicles | 274 (21.9%) | 206 (24.6%) |
| 4 Vehicles | 78 (6.2%) | 25 (3.0%) |
| 5 or more Vehicles | 29 (2.3%) | 0 (0.0%) |
| Total | 1,252 (100.0%) | 836 (100.0%) |
Commute Time in Summerside
The most frequently occuring commute durations in Summerside are 20 to 24 minutes (347 commuters, 18.4%), 30 to 34 minutes (286 commuters, 15.2%), and 15 to 19 minutes (274 commuters, 14.5%).
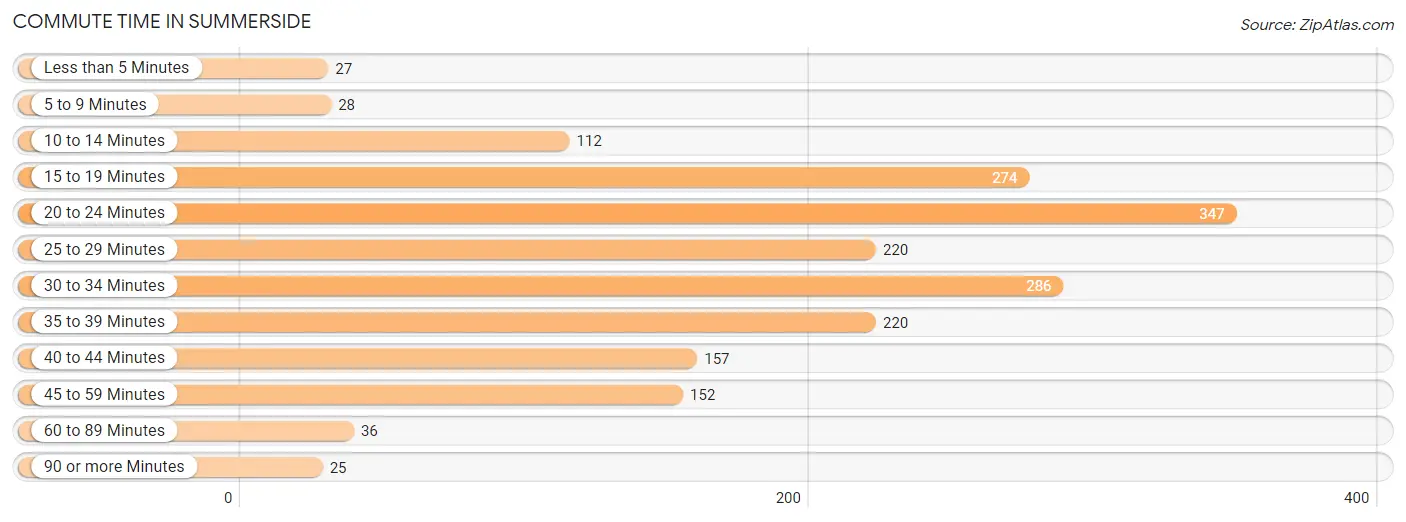
| Commute Time | # Commuters | % Commuters |
| Less than 5 Minutes | 27 | 1.4% |
| 5 to 9 Minutes | 28 | 1.5% |
| 10 to 14 Minutes | 112 | 5.9% |
| 15 to 19 Minutes | 274 | 14.5% |
| 20 to 24 Minutes | 347 | 18.4% |
| 25 to 29 Minutes | 220 | 11.7% |
| 30 to 34 Minutes | 286 | 15.2% |
| 35 to 39 Minutes | 220 | 11.7% |
| 40 to 44 Minutes | 157 | 8.3% |
| 45 to 59 Minutes | 152 | 8.1% |
| 60 to 89 Minutes | 36 | 1.9% |
| 90 or more Minutes | 25 | 1.3% |
Commute Time by Sex in Summerside
The most common commute times in Summerside are 20 to 24 minutes (299 commuters, 25.4%) for males and 30 to 34 minutes (167 commuters, 23.6%) for females.
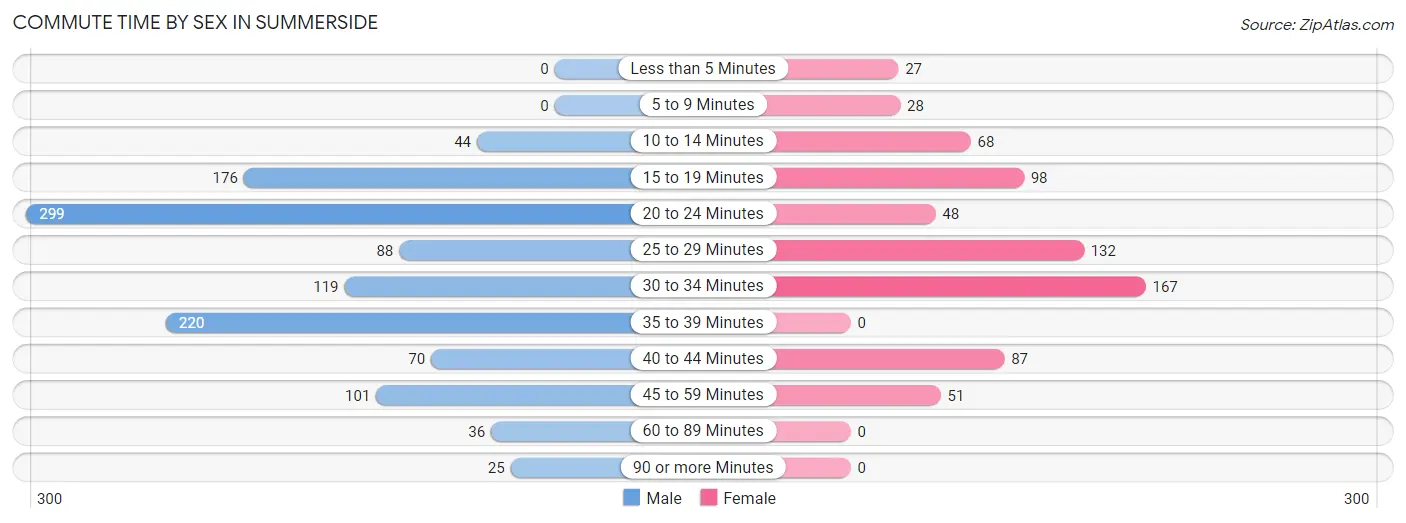
| Commute Time | Male | Female |
| Less than 5 Minutes | 0 (0.0%) | 27 (3.8%) |
| 5 to 9 Minutes | 0 (0.0%) | 28 (4.0%) |
| 10 to 14 Minutes | 44 (3.7%) | 68 (9.6%) |
| 15 to 19 Minutes | 176 (14.9%) | 98 (13.9%) |
| 20 to 24 Minutes | 299 (25.4%) | 48 (6.8%) |
| 25 to 29 Minutes | 88 (7.5%) | 132 (18.7%) |
| 30 to 34 Minutes | 119 (10.1%) | 167 (23.6%) |
| 35 to 39 Minutes | 220 (18.7%) | 0 (0.0%) |
| 40 to 44 Minutes | 70 (5.9%) | 87 (12.3%) |
| 45 to 59 Minutes | 101 (8.6%) | 51 (7.2%) |
| 60 to 89 Minutes | 36 (3.1%) | 0 (0.0%) |
| 90 or more Minutes | 25 (2.1%) | 0 (0.0%) |
Time of Departure to Work by Sex in Summerside
The most frequent times of departure to work in Summerside are 7:00 AM to 7:29 AM (162, 13.8%) for males and 10:00 AM to 10:59 AM (114, 16.2%) for females.
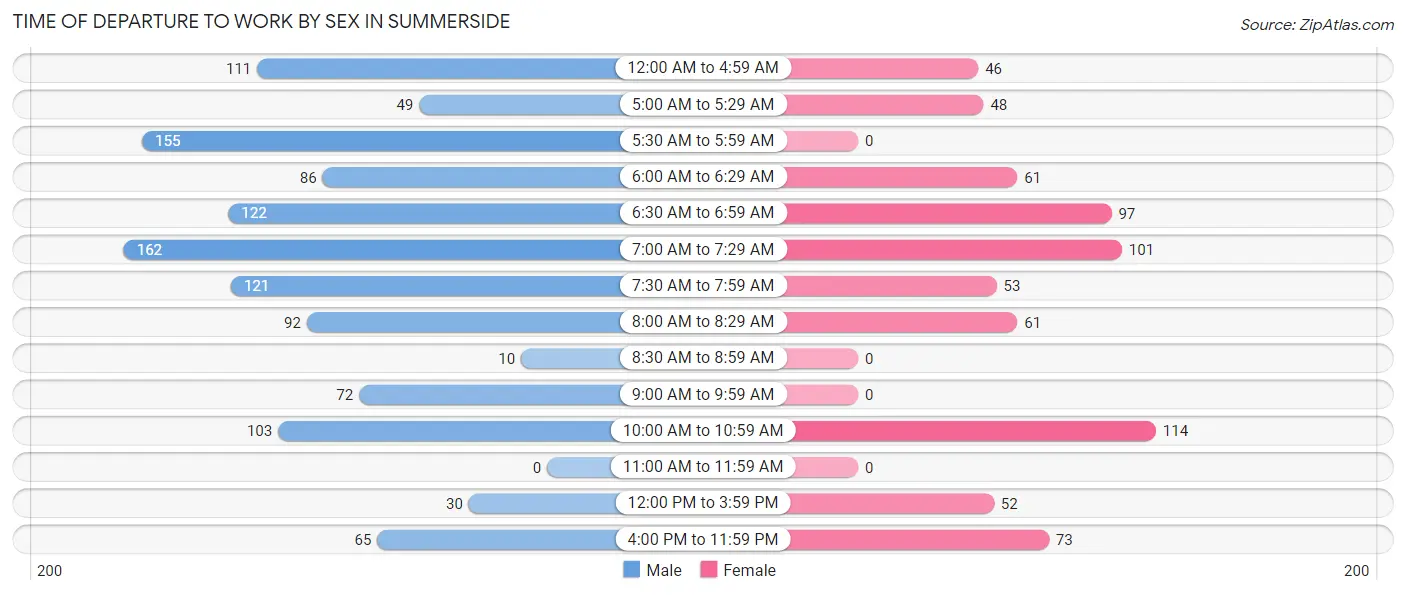
| Time of Departure | Male | Female |
| 12:00 AM to 4:59 AM | 111 (9.4%) | 46 (6.5%) |
| 5:00 AM to 5:29 AM | 49 (4.2%) | 48 (6.8%) |
| 5:30 AM to 5:59 AM | 155 (13.2%) | 0 (0.0%) |
| 6:00 AM to 6:29 AM | 86 (7.3%) | 61 (8.6%) |
| 6:30 AM to 6:59 AM | 122 (10.4%) | 97 (13.7%) |
| 7:00 AM to 7:29 AM | 162 (13.8%) | 101 (14.3%) |
| 7:30 AM to 7:59 AM | 121 (10.3%) | 53 (7.5%) |
| 8:00 AM to 8:29 AM | 92 (7.8%) | 61 (8.6%) |
| 8:30 AM to 8:59 AM | 10 (0.9%) | 0 (0.0%) |
| 9:00 AM to 9:59 AM | 72 (6.1%) | 0 (0.0%) |
| 10:00 AM to 10:59 AM | 103 (8.7%) | 114 (16.2%) |
| 11:00 AM to 11:59 AM | 0 (0.0%) | 0 (0.0%) |
| 12:00 PM to 3:59 PM | 30 (2.5%) | 52 (7.4%) |
| 4:00 PM to 11:59 PM | 65 (5.5%) | 73 (10.3%) |
| Total | 1,178 (100.0%) | 706 (100.0%) |
Housing Occupancy in Summerside
Occupancy by Ownership in Summerside
Of the total 2,000 dwellings in Summerside, owner-occupied units account for 1,421 (71.1%), while renter-occupied units make up 579 (28.9%).
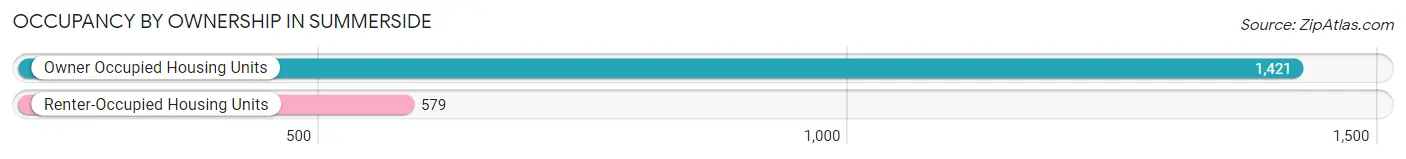
| Occupancy | # Housing Units | % Housing Units |
| Owner Occupied Housing Units | 1,421 | 71.1% |
| Renter-Occupied Housing Units | 579 | 28.9% |
| Total Occupied Housing Units | 2,000 | 100.0% |
Occupancy by Household Size in Summerside
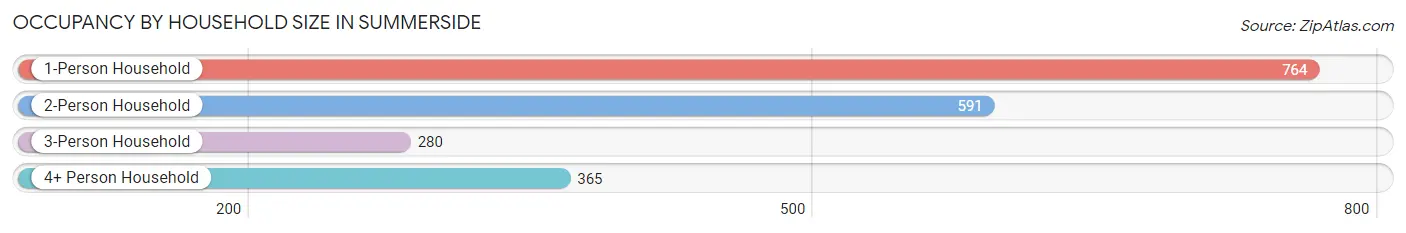
| Household Size | # Housing Units | % Housing Units |
| 1-Person Household | 764 | 38.2% |
| 2-Person Household | 591 | 29.5% |
| 3-Person Household | 280 | 14.0% |
| 4+ Person Household | 365 | 18.2% |
| Total Housing Units | 2,000 | 100.0% |
Occupancy by Ownership by Household Size in Summerside
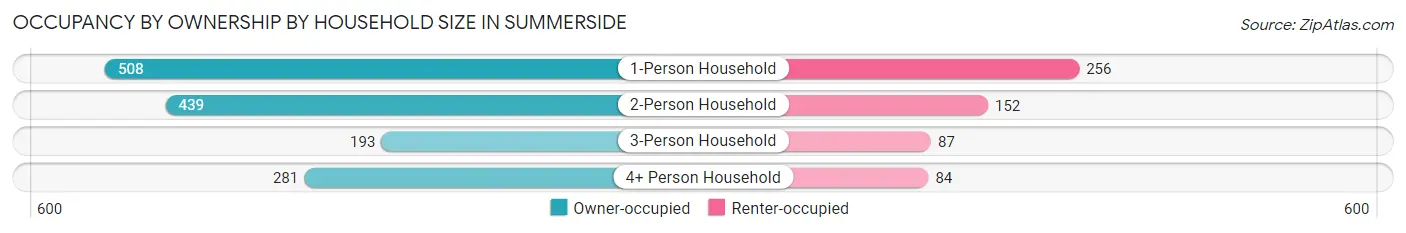
| Household Size | Owner-occupied | Renter-occupied |
| 1-Person Household | 508 (66.5%) | 256 (33.5%) |
| 2-Person Household | 439 (74.3%) | 152 (25.7%) |
| 3-Person Household | 193 (68.9%) | 87 (31.1%) |
| 4+ Person Household | 281 (77.0%) | 84 (23.0%) |
| Total Housing Units | 1,421 (71.1%) | 579 (28.9%) |
Occupancy by Educational Attainment in Summerside
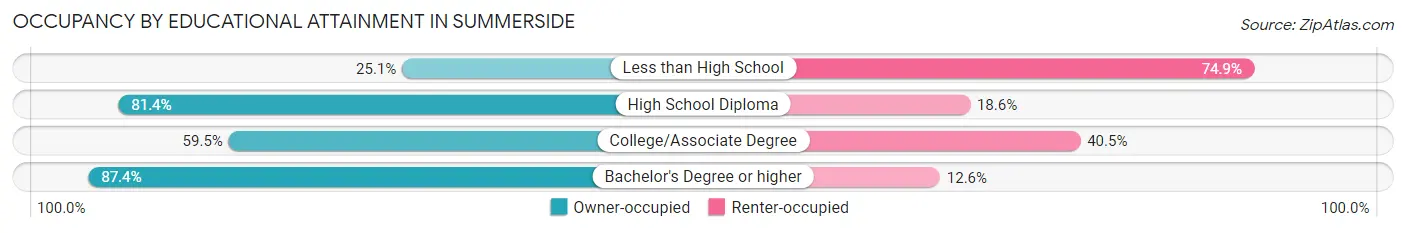
| Household Size | Owner-occupied | Renter-occupied |
| Less than High School | 44 (25.1%) | 131 (74.9%) |
| High School Diploma | 499 (81.4%) | 114 (18.6%) |
| College/Associate Degree | 387 (59.5%) | 263 (40.5%) |
| Bachelor's Degree or higher | 491 (87.4%) | 71 (12.6%) |
Occupancy by Age of Householder in Summerside
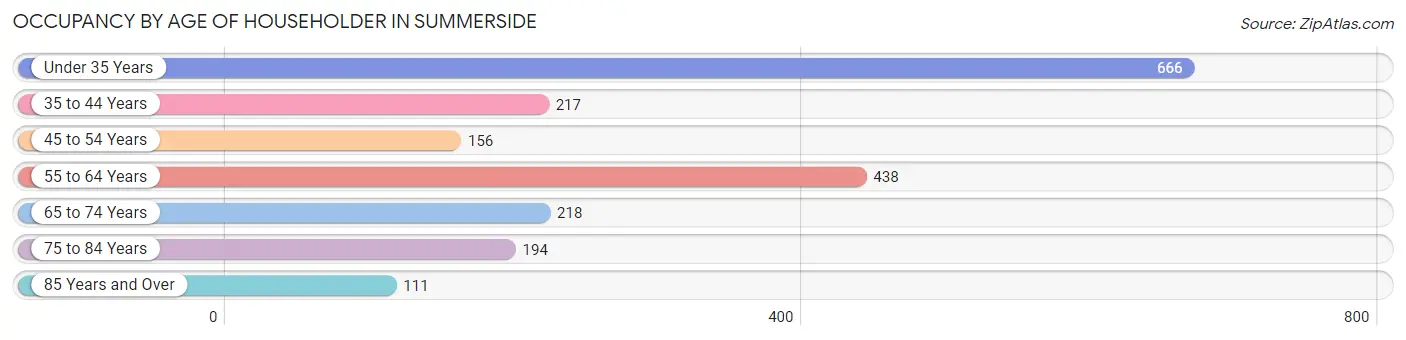
| Age Bracket | # Households | % Households |
| Under 35 Years | 666 | 33.3% |
| 35 to 44 Years | 217 | 10.8% |
| 45 to 54 Years | 156 | 7.8% |
| 55 to 64 Years | 438 | 21.9% |
| 65 to 74 Years | 218 | 10.9% |
| 75 to 84 Years | 194 | 9.7% |
| 85 Years and Over | 111 | 5.6% |
| Total | 2,000 | 100.0% |
Housing Finances in Summerside
Median Income by Occupancy in Summerside
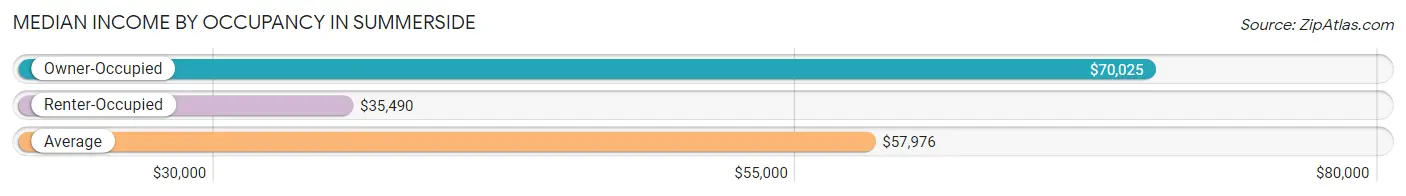
| Occupancy Type | # Households | Median Income |
| Owner-Occupied | 1,421 (71.1%) | $70,025 |
| Renter-Occupied | 579 (28.9%) | $35,490 |
| Average | 2,000 (100.0%) | $57,976 |
Occupancy by Householder Income Bracket in Summerside
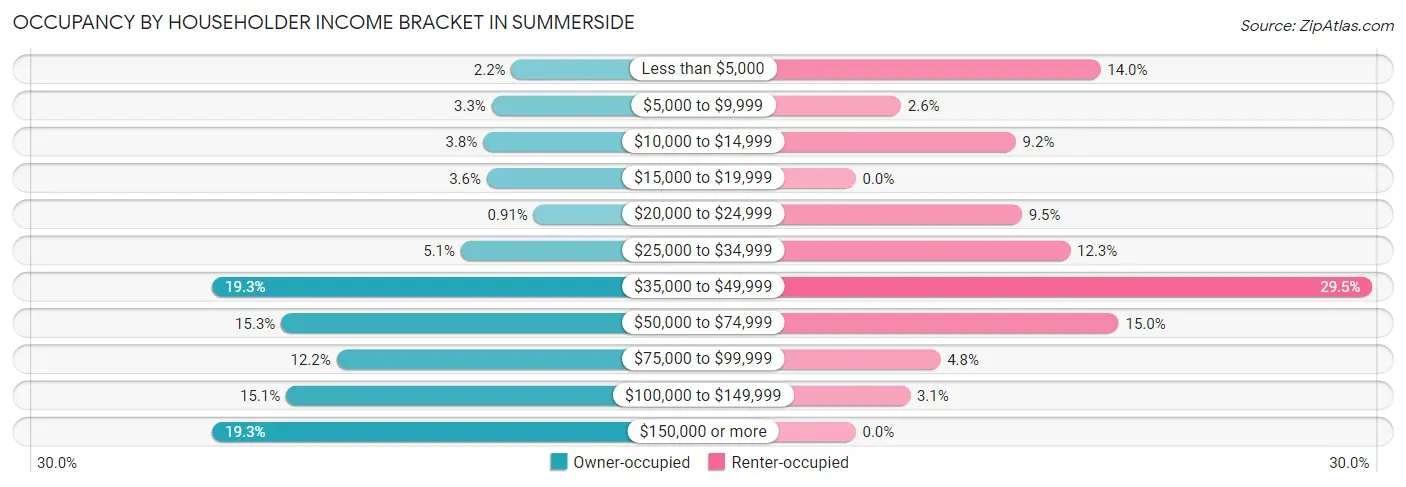
| Income Bracket | Owner-occupied | Renter-occupied |
| Less than $5,000 | 31 (2.2%) | 81 (14.0%) |
| $5,000 to $9,999 | 47 (3.3%) | 15 (2.6%) |
| $10,000 to $14,999 | 54 (3.8%) | 53 (9.1%) |
| $15,000 to $19,999 | 51 (3.6%) | 0 (0.0%) |
| $20,000 to $24,999 | 13 (0.9%) | 55 (9.5%) |
| $25,000 to $34,999 | 72 (5.1%) | 71 (12.3%) |
| $35,000 to $49,999 | 274 (19.3%) | 171 (29.5%) |
| $50,000 to $74,999 | 218 (15.3%) | 87 (15.0%) |
| $75,000 to $99,999 | 173 (12.2%) | 28 (4.8%) |
| $100,000 to $149,999 | 214 (15.1%) | 18 (3.1%) |
| $150,000 or more | 274 (19.3%) | 0 (0.0%) |
| Total | 1,421 (100.0%) | 579 (100.0%) |
Monthly Housing Cost Tiers in Summerside
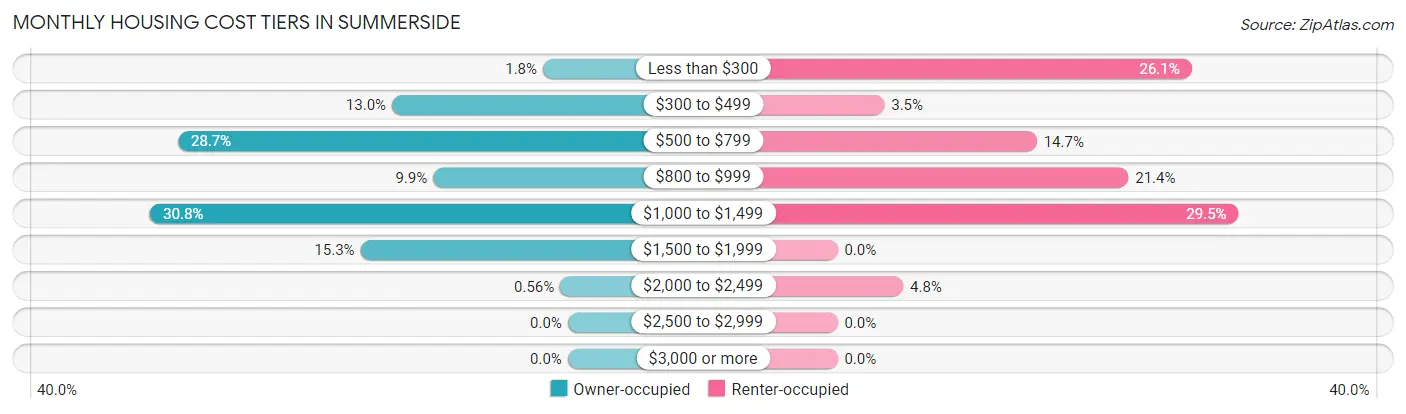
| Monthly Cost | Owner-occupied | Renter-occupied |
| Less than $300 | 26 (1.8%) | 151 (26.1%) |
| $300 to $499 | 184 (13.0%) | 20 (3.5%) |
| $500 to $799 | 408 (28.7%) | 85 (14.7%) |
| $800 to $999 | 141 (9.9%) | 124 (21.4%) |
| $1,000 to $1,499 | 437 (30.7%) | 171 (29.5%) |
| $1,500 to $1,999 | 217 (15.3%) | 0 (0.0%) |
| $2,000 to $2,499 | 8 (0.6%) | 28 (4.8%) |
| $2,500 to $2,999 | 0 (0.0%) | 0 (0.0%) |
| $3,000 or more | 0 (0.0%) | 0 (0.0%) |
| Total | 1,421 (100.0%) | 579 (100.0%) |
Physical Housing Characteristics in Summerside
Housing Structures in Summerside
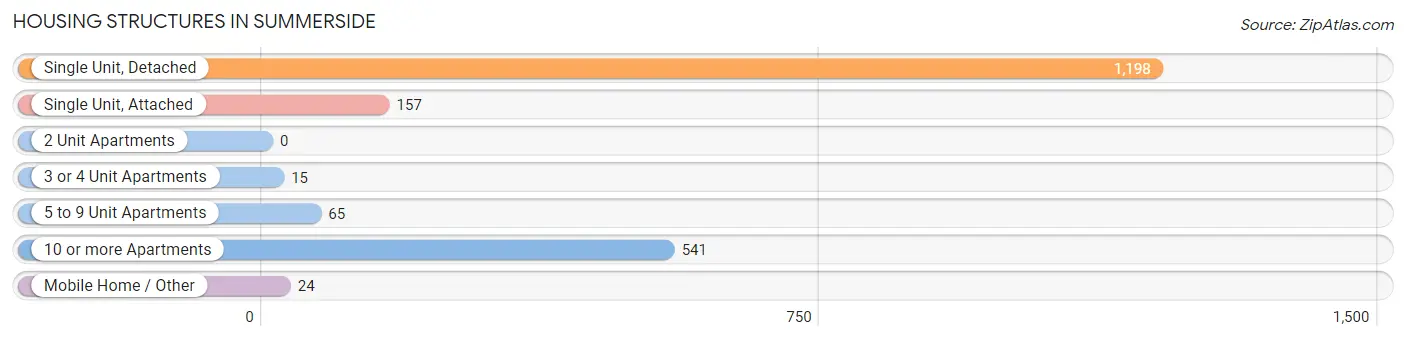
| Structure Type | # Housing Units | % Housing Units |
| Single Unit, Detached | 1,198 | 59.9% |
| Single Unit, Attached | 157 | 7.9% |
| 2 Unit Apartments | 0 | 0.0% |
| 3 or 4 Unit Apartments | 15 | 0.7% |
| 5 to 9 Unit Apartments | 65 | 3.3% |
| 10 or more Apartments | 541 | 27.1% |
| Mobile Home / Other | 24 | 1.2% |
| Total | 2,000 | 100.0% |
Housing Structures by Occupancy in Summerside
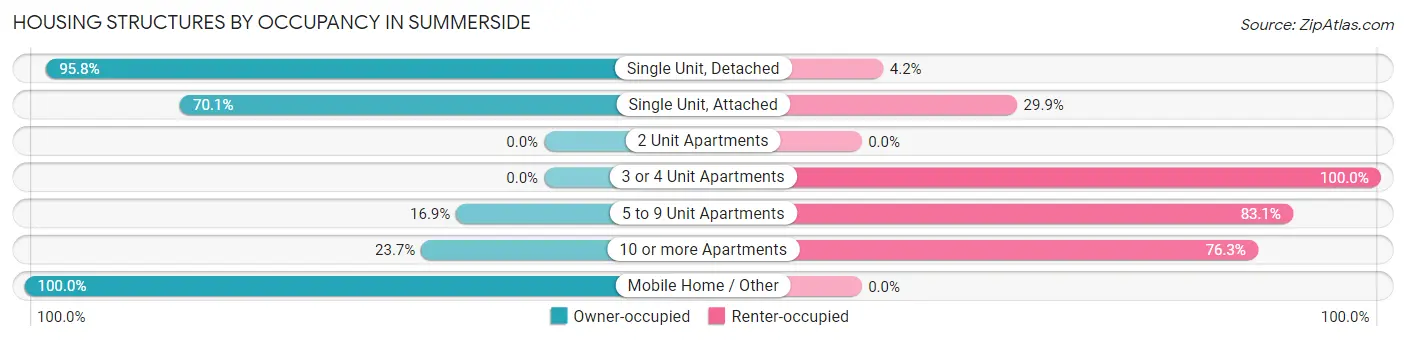
| Structure Type | Owner-occupied | Renter-occupied |
| Single Unit, Detached | 1,148 (95.8%) | 50 (4.2%) |
| Single Unit, Attached | 110 (70.1%) | 47 (29.9%) |
| 2 Unit Apartments | 0 (0.0%) | 0 (0.0%) |
| 3 or 4 Unit Apartments | 0 (0.0%) | 15 (100.0%) |
| 5 to 9 Unit Apartments | 11 (16.9%) | 54 (83.1%) |
| 10 or more Apartments | 128 (23.7%) | 413 (76.3%) |
| Mobile Home / Other | 24 (100.0%) | 0 (0.0%) |
| Total | 1,421 (71.1%) | 579 (28.9%) |
Housing Structures by Number of Rooms in Summerside
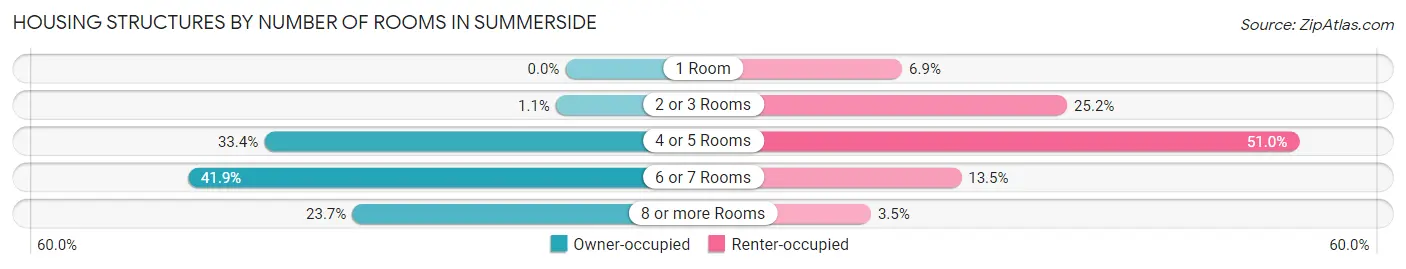
| Number of Rooms | Owner-occupied | Renter-occupied |
| 1 Room | 0 (0.0%) | 40 (6.9%) |
| 2 or 3 Rooms | 15 (1.1%) | 146 (25.2%) |
| 4 or 5 Rooms | 475 (33.4%) | 295 (50.9%) |
| 6 or 7 Rooms | 595 (41.9%) | 78 (13.5%) |
| 8 or more Rooms | 336 (23.6%) | 20 (3.5%) |
| Total | 1,421 (100.0%) | 579 (100.0%) |
Housing Structure by Heating Type in Summerside
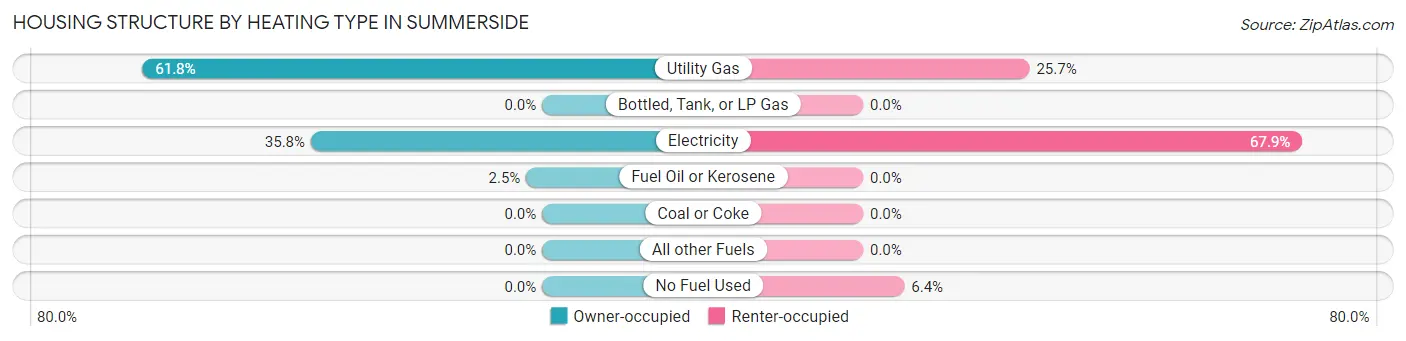
| Heating Type | Owner-occupied | Renter-occupied |
| Utility Gas | 878 (61.8%) | 149 (25.7%) |
| Bottled, Tank, or LP Gas | 0 (0.0%) | 0 (0.0%) |
| Electricity | 508 (35.7%) | 393 (67.9%) |
| Fuel Oil or Kerosene | 35 (2.5%) | 0 (0.0%) |
| Coal or Coke | 0 (0.0%) | 0 (0.0%) |
| All other Fuels | 0 (0.0%) | 0 (0.0%) |
| No Fuel Used | 0 (0.0%) | 37 (6.4%) |
| Total | 1,421 (100.0%) | 579 (100.0%) |
Household Vehicle Usage in Summerside
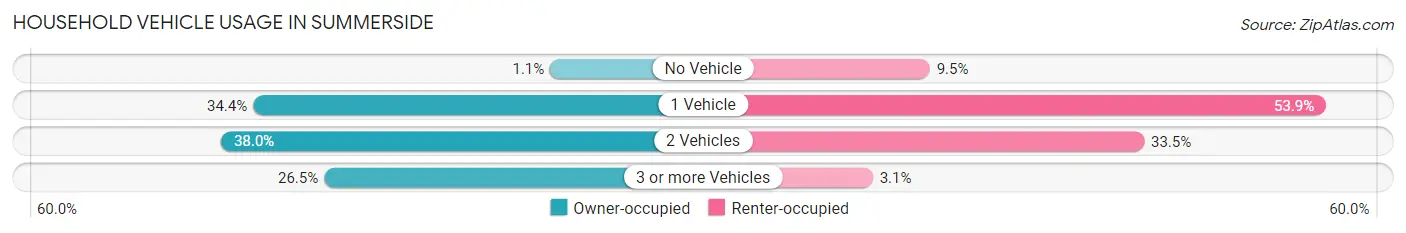
| Vehicles per Household | Owner-occupied | Renter-occupied |
| No Vehicle | 16 (1.1%) | 55 (9.5%) |
| 1 Vehicle | 489 (34.4%) | 312 (53.9%) |
| 2 Vehicles | 540 (38.0%) | 194 (33.5%) |
| 3 or more Vehicles | 376 (26.5%) | 18 (3.1%) |
| Total | 1,421 (100.0%) | 579 (100.0%) |
Real Estate & Mortgages in Summerside
Real Estate and Mortgage Overview in Summerside
| Characteristic | Without Mortgage | With Mortgage |
| Housing Units | 566 | 855 |
| Median Property Value | $167,700 | $183,100 |
| Median Household Income | $48,567 | $154 |
| Monthly Housing Costs | $550 | $0 |
| Real Estate Taxes | $2,259 | $30 |
Property Value by Mortgage Status in Summerside
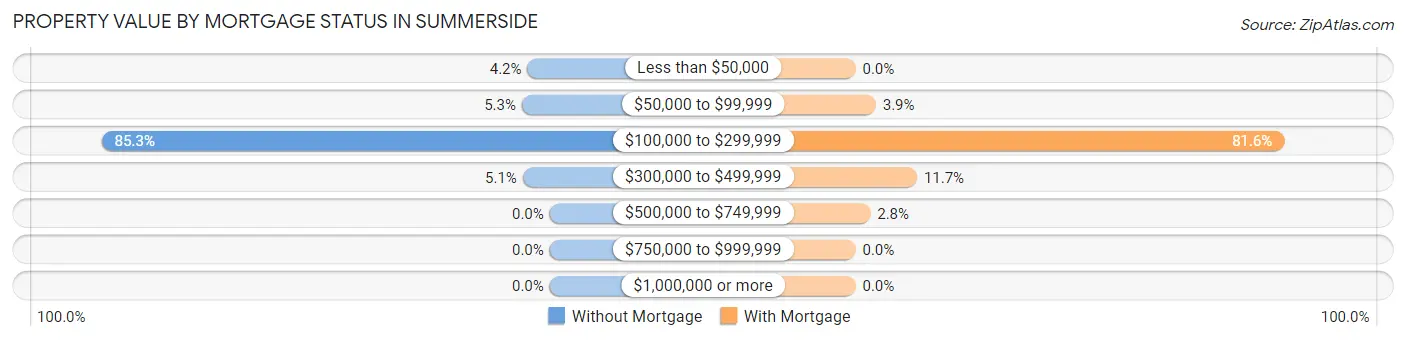
| Property Value | Without Mortgage | With Mortgage |
| Less than $50,000 | 24 (4.2%) | 0 (0.0%) |
| $50,000 to $99,999 | 30 (5.3%) | 33 (3.9%) |
| $100,000 to $299,999 | 483 (85.3%) | 698 (81.6%) |
| $300,000 to $499,999 | 29 (5.1%) | 100 (11.7%) |
| $500,000 to $749,999 | 0 (0.0%) | 24 (2.8%) |
| $750,000 to $999,999 | 0 (0.0%) | 0 (0.0%) |
| $1,000,000 or more | 0 (0.0%) | 0 (0.0%) |
| Total | 566 (100.0%) | 855 (100.0%) |
Household Income by Mortgage Status in Summerside
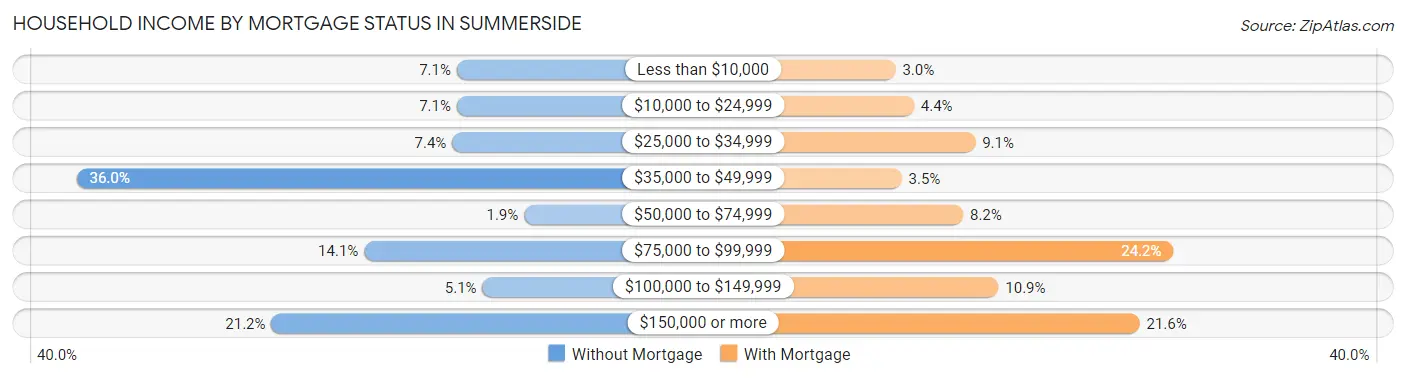
| Household Income | Without Mortgage | With Mortgage |
| Less than $10,000 | 40 (7.1%) | 26 (3.0%) |
| $10,000 to $24,999 | 40 (7.1%) | 38 (4.4%) |
| $25,000 to $34,999 | 42 (7.4%) | 78 (9.1%) |
| $35,000 to $49,999 | 204 (36.0%) | 30 (3.5%) |
| $50,000 to $74,999 | 11 (1.9%) | 70 (8.2%) |
| $75,000 to $99,999 | 80 (14.1%) | 207 (24.2%) |
| $100,000 to $149,999 | 29 (5.1%) | 93 (10.9%) |
| $150,000 or more | 120 (21.2%) | 185 (21.6%) |
| Total | 566 (100.0%) | 855 (100.0%) |
Property Value to Household Income Ratio in Summerside
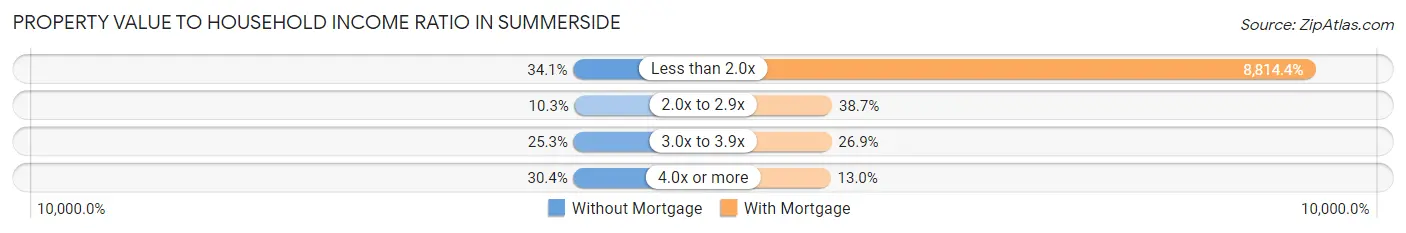
| Value-to-Income Ratio | Without Mortgage | With Mortgage |
| Less than 2.0x | 193 (34.1%) | 75,363 (8,814.4%) |
| 2.0x to 2.9x | 58 (10.2%) | 331 (38.7%) |
| 3.0x to 3.9x | 143 (25.3%) | 230 (26.9%) |
| 4.0x or more | 172 (30.4%) | 111 (13.0%) |
| Total | 566 (100.0%) | 855 (100.0%) |
Real Estate Taxes by Mortgage Status in Summerside
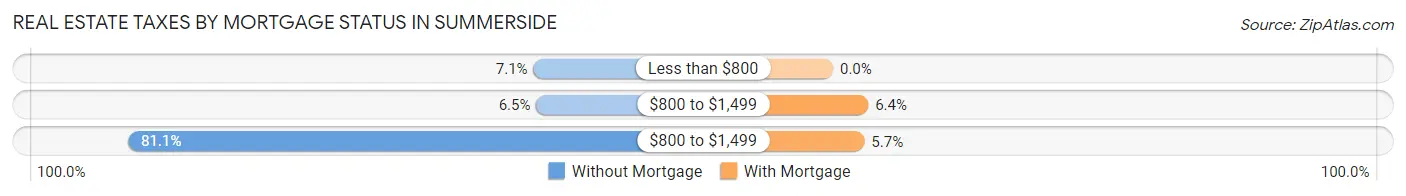
| Property Taxes | Without Mortgage | With Mortgage |
| Less than $800 | 40 (7.1%) | 0 (0.0%) |
| $800 to $1,499 | 37 (6.5%) | 55 (6.4%) |
| $800 to $1,499 | 459 (81.1%) | 49 (5.7%) |
| Total | 566 (100.0%) | 855 (100.0%) |
Health & Disability in Summerside
Health Insurance Coverage by Age in Summerside
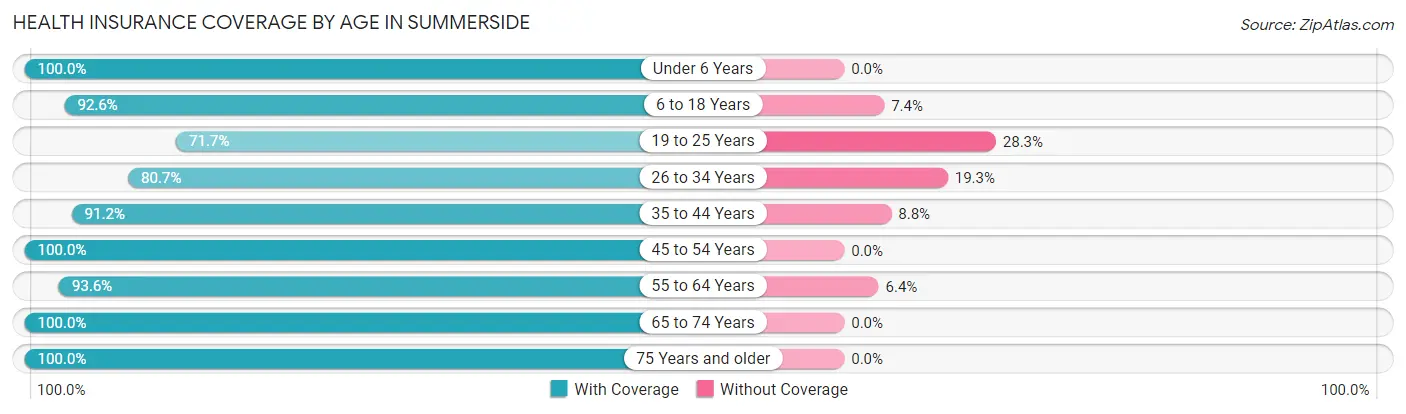
| Age Bracket | With Coverage | Without Coverage |
| Under 6 Years | 559 (100.0%) | 0 (0.0%) |
| 6 to 18 Years | 622 (92.6%) | 50 (7.4%) |
| 19 to 25 Years | 325 (71.7%) | 128 (28.3%) |
| 26 to 34 Years | 719 (80.7%) | 172 (19.3%) |
| 35 to 44 Years | 322 (91.2%) | 31 (8.8%) |
| 45 to 54 Years | 226 (100.0%) | 0 (0.0%) |
| 55 to 64 Years | 570 (93.6%) | 39 (6.4%) |
| 65 to 74 Years | 333 (100.0%) | 0 (0.0%) |
| 75 Years and older | 419 (100.0%) | 0 (0.0%) |
| Total | 4,095 (90.7%) | 420 (9.3%) |
Health Insurance Coverage by Citizenship Status in Summerside
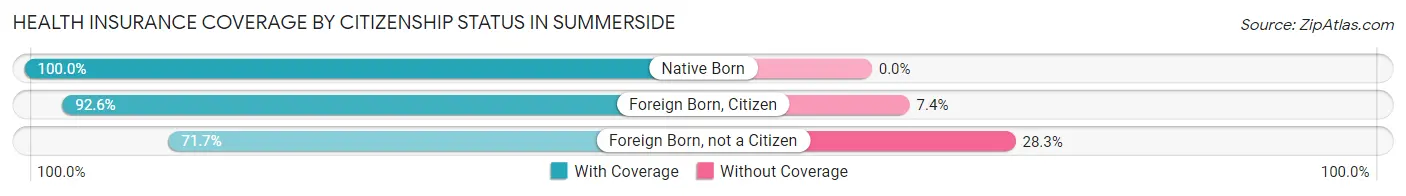
| Citizenship Status | With Coverage | Without Coverage |
| Native Born | 559 (100.0%) | 0 (0.0%) |
| Foreign Born, Citizen | 622 (92.6%) | 50 (7.4%) |
| Foreign Born, not a Citizen | 325 (71.7%) | 128 (28.3%) |
Health Insurance Coverage by Household Income in Summerside
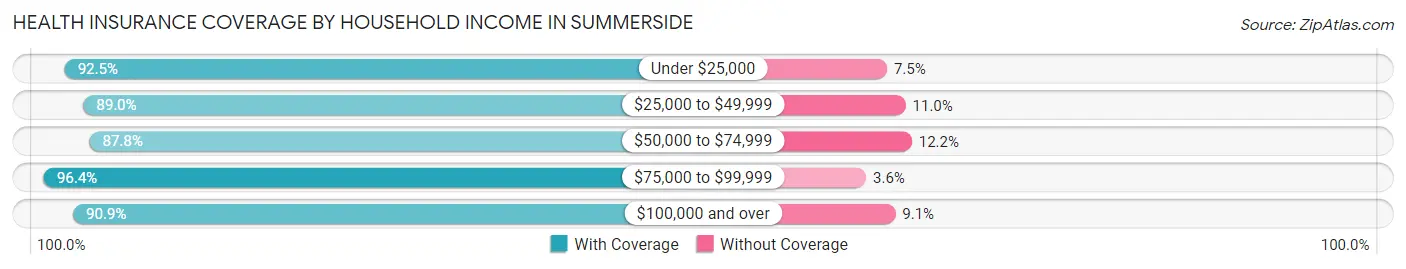
| Household Income | With Coverage | Without Coverage |
| Under $25,000 | 603 (92.5%) | 49 (7.5%) |
| $25,000 to $49,999 | 945 (89.0%) | 117 (11.0%) |
| $50,000 to $74,999 | 649 (87.8%) | 90 (12.2%) |
| $75,000 to $99,999 | 399 (96.4%) | 15 (3.6%) |
| $100,000 and over | 1,491 (90.9%) | 149 (9.1%) |
Public vs Private Health Insurance Coverage by Age in Summerside
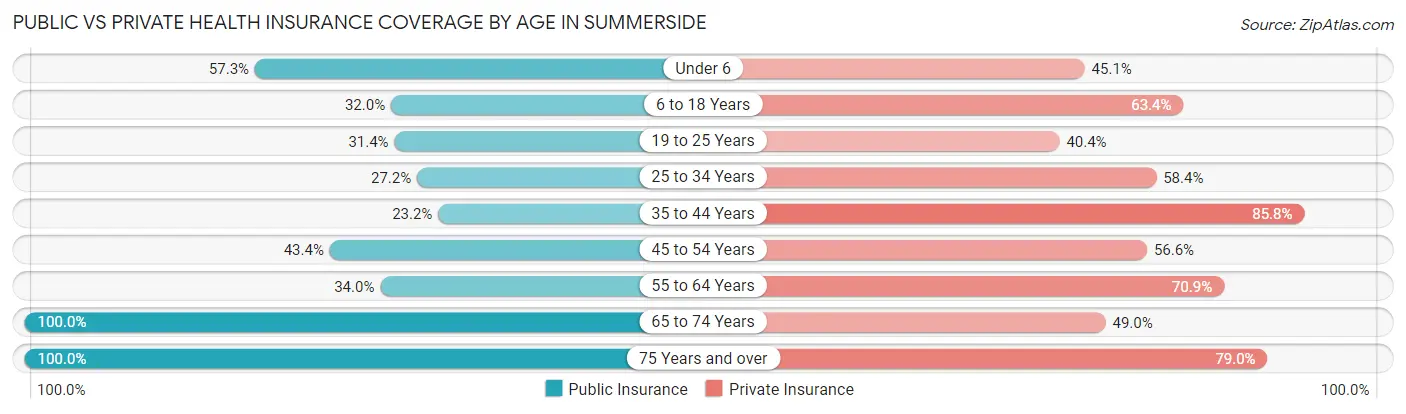
| Age Bracket | Public Insurance | Private Insurance |
| Under 6 | 320 (57.3%) | 252 (45.1%) |
| 6 to 18 Years | 215 (32.0%) | 426 (63.4%) |
| 19 to 25 Years | 142 (31.4%) | 183 (40.4%) |
| 25 to 34 Years | 242 (27.2%) | 520 (58.4%) |
| 35 to 44 Years | 82 (23.2%) | 303 (85.8%) |
| 45 to 54 Years | 98 (43.4%) | 128 (56.6%) |
| 55 to 64 Years | 207 (34.0%) | 432 (70.9%) |
| 65 to 74 Years | 333 (100.0%) | 163 (48.9%) |
| 75 Years and over | 419 (100.0%) | 331 (79.0%) |
| Total | 2,058 (45.6%) | 2,738 (60.6%) |
Disability Status by Sex by Age in Summerside
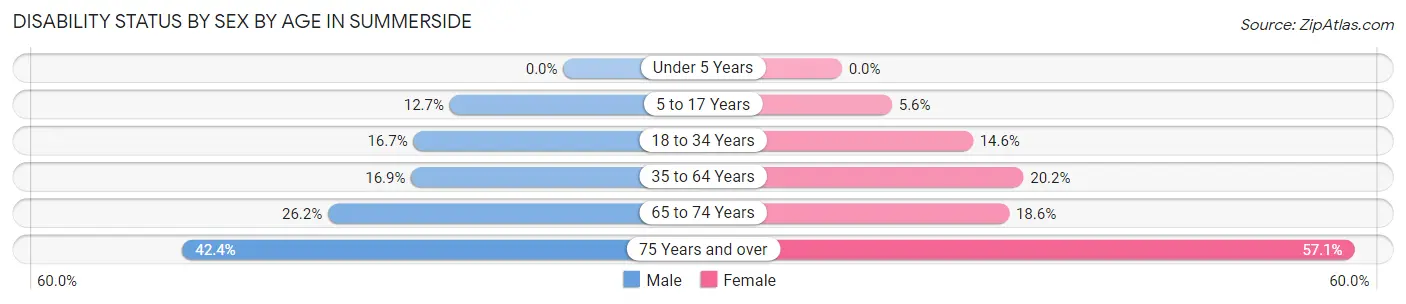
| Age Bracket | Male | Female |
| Under 5 Years | 0 (0.0%) | 0 (0.0%) |
| 5 to 17 Years | 52 (12.7%) | 19 (5.6%) |
| 18 to 34 Years | 116 (16.7%) | 98 (14.6%) |
| 35 to 64 Years | 119 (16.9%) | 98 (20.2%) |
| 65 to 74 Years | 38 (26.2%) | 35 (18.6%) |
| 75 Years and over | 70 (42.4%) | 145 (57.1%) |
Disability Class by Sex by Age in Summerside
Disability Class: Hearing Difficulty
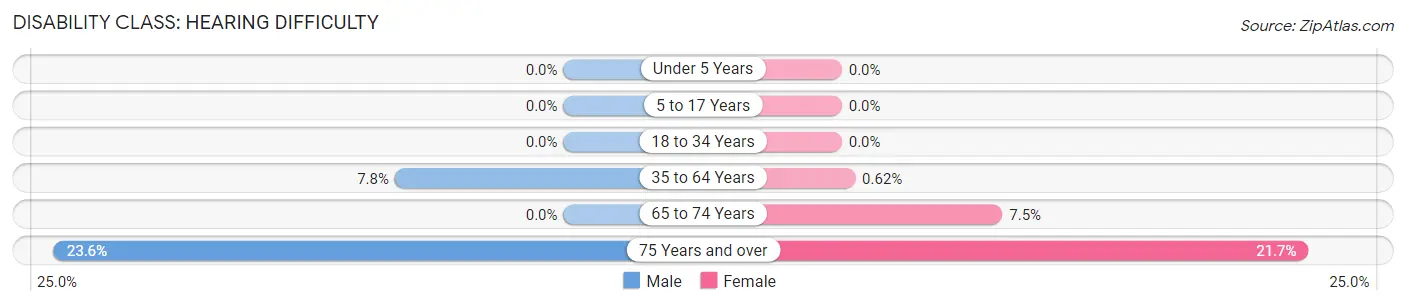
| Age Bracket | Male | Female |
| Under 5 Years | 0 (0.0%) | 0 (0.0%) |
| 5 to 17 Years | 0 (0.0%) | 0 (0.0%) |
| 18 to 34 Years | 0 (0.0%) | 0 (0.0%) |
| 35 to 64 Years | 55 (7.8%) | 3 (0.6%) |
| 65 to 74 Years | 0 (0.0%) | 14 (7.4%) |
| 75 Years and over | 39 (23.6%) | 55 (21.6%) |
Disability Class: Vision Difficulty
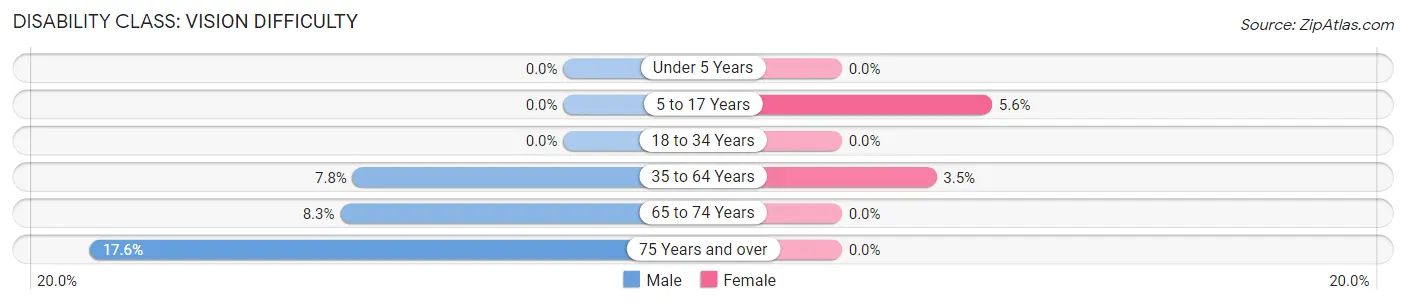
| Age Bracket | Male | Female |
| Under 5 Years | 0 (0.0%) | 0 (0.0%) |
| 5 to 17 Years | 0 (0.0%) | 19 (5.6%) |
| 18 to 34 Years | 0 (0.0%) | 0 (0.0%) |
| 35 to 64 Years | 55 (7.8%) | 17 (3.5%) |
| 65 to 74 Years | 12 (8.3%) | 0 (0.0%) |
| 75 Years and over | 29 (17.6%) | 0 (0.0%) |
Disability Class: Cognitive Difficulty
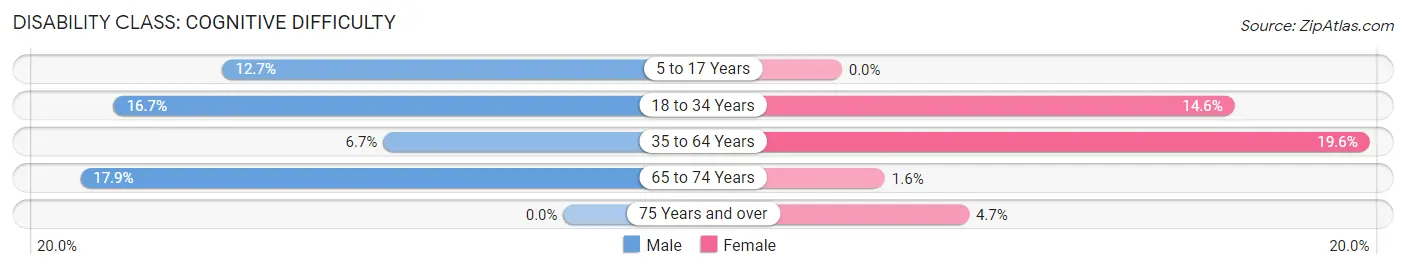
| Age Bracket | Male | Female |
| 5 to 17 Years | 52 (12.7%) | 0 (0.0%) |
| 18 to 34 Years | 116 (16.7%) | 98 (14.6%) |
| 35 to 64 Years | 47 (6.7%) | 95 (19.6%) |
| 65 to 74 Years | 26 (17.9%) | 3 (1.6%) |
| 75 Years and over | 0 (0.0%) | 12 (4.7%) |
Disability Class: Ambulatory Difficulty
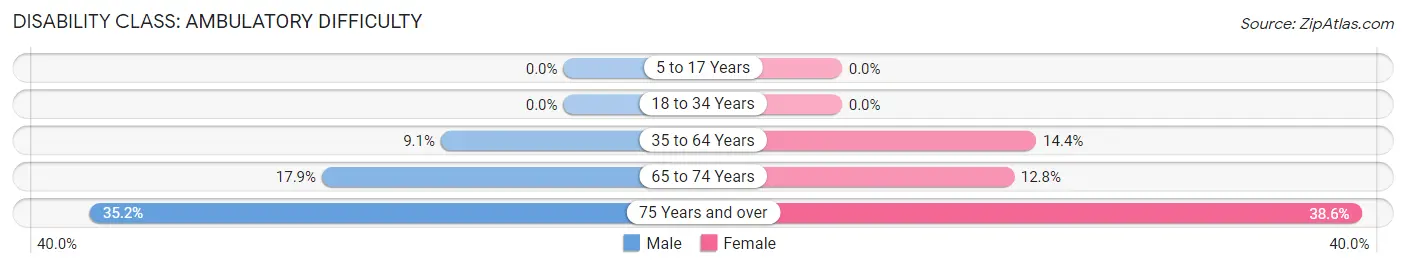
| Age Bracket | Male | Female |
| 5 to 17 Years | 0 (0.0%) | 0 (0.0%) |
| 18 to 34 Years | 0 (0.0%) | 0 (0.0%) |
| 35 to 64 Years | 64 (9.1%) | 70 (14.4%) |
| 65 to 74 Years | 26 (17.9%) | 24 (12.8%) |
| 75 Years and over | 58 (35.1%) | 98 (38.6%) |
Disability Class: Self-Care Difficulty
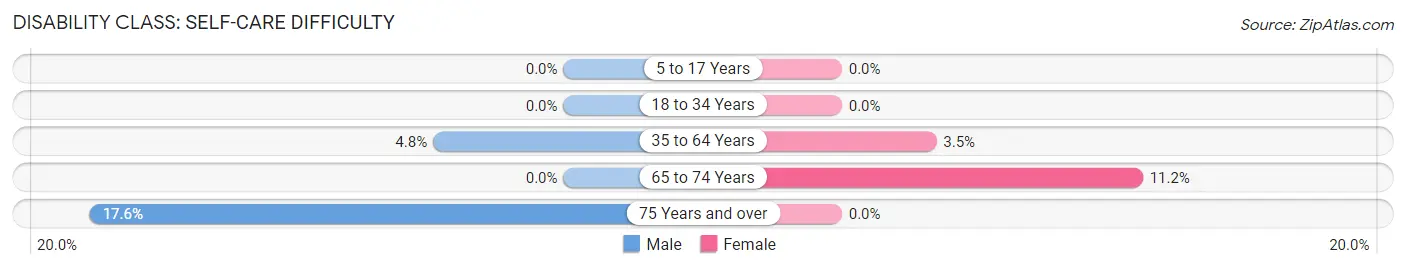
| Age Bracket | Male | Female |
| 5 to 17 Years | 0 (0.0%) | 0 (0.0%) |
| 18 to 34 Years | 0 (0.0%) | 0 (0.0%) |
| 35 to 64 Years | 34 (4.8%) | 17 (3.5%) |
| 65 to 74 Years | 0 (0.0%) | 21 (11.2%) |
| 75 Years and over | 29 (17.6%) | 0 (0.0%) |
Technology Access in Summerside
Computing Device Access in Summerside
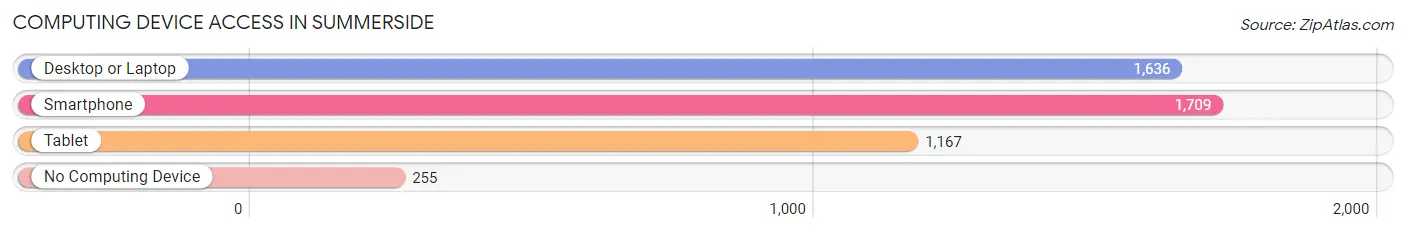
| Device Type | # Households | % Households |
| Desktop or Laptop | 1,636 | 81.8% |
| Smartphone | 1,709 | 85.5% |
| Tablet | 1,167 | 58.4% |
| No Computing Device | 255 | 12.8% |
| Total | 2,000 | 100.0% |
Internet Access in Summerside
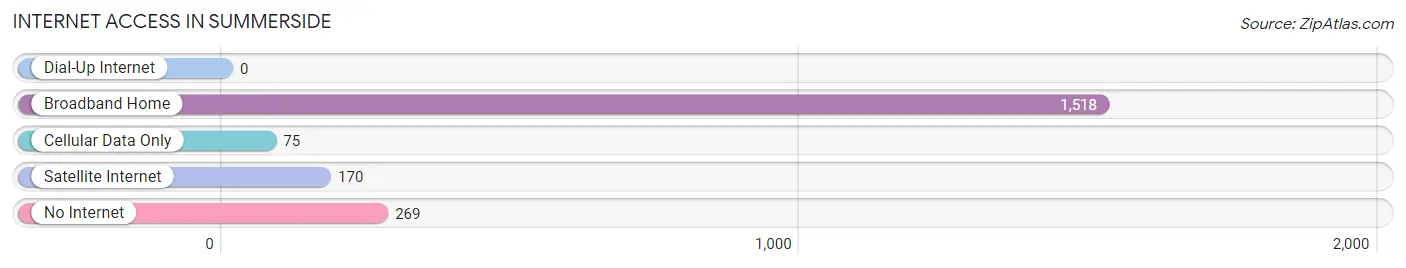
| Internet Type | # Households | % Households |
| Dial-Up Internet | 0 | 0.0% |
| Broadband Home | 1,518 | 75.9% |
| Cellular Data Only | 75 | 3.7% |
| Satellite Internet | 170 | 8.5% |
| No Internet | 269 | 13.5% |
| Total | 2,000 | 100.0% |
Summerside Summary
Summerside is a small village located in the state of Ohio, United States. It is situated in the southeastern corner of the state, in the county of Cuyahoga. The village is located on the banks of the Cuyahoga River, and is part of the Greater Cleveland metropolitan area. The population of Summerside was 1,845 at the 2010 census.
History
The area that is now Summerside was first settled in the early 1800s by a group of German immigrants. The village was originally known as “Summerside”, after the nearby lake of the same name. The village was officially incorporated in 1837, and the first post office was established in 1845.
In the late 19th century, Summerside was a popular summer resort destination for wealthy Clevelanders. The village was home to several large hotels, and the area was known for its beautiful scenery and recreational activities.
In the early 20th century, Summerside began to decline in popularity as a resort destination. The village was hit hard by the Great Depression, and many of the hotels and businesses closed. The village was also affected by the decline of the steel industry in the area.
Geography
Summerside is located at 41°25'17" North, 81°41'45" West (41.4214, -81.6958). The village is situated on the banks of the Cuyahoga River, and is part of the Greater Cleveland metropolitan area.
The village has a total area of 0.7 square miles, all of which is land. Summerside is bordered by the cities of Cleveland and Parma to the north, and the village of Brooklyn Heights to the south.
Economy
The economy of Summerside is largely based on manufacturing and retail. The village is home to several small businesses, including a grocery store, a hardware store, and a few restaurants.
The village is also home to several large manufacturing companies, including a steel mill and a plastics factory. These companies provide employment for many of the residents of Summerside.
Demographics
As of the 2010 census, the population of Summerside was 1,845. The racial makeup of the village was 94.3% White, 2.2% African American, 0.3% Native American, 0.7% Asian, 0.1% Pacific Islander, 0.7% from other races, and 1.7% from two or more races. Hispanic or Latino of any race were 2.2% of the population.
The median income for a household in Summerside was $45,938, and the median income for a family was $51,250. The per capita income for the village was $20,945. About 8.3% of families and 10.2% of the population were below the poverty line, including 14.2% of those under age 18 and 5.2% of those age 65 or over.
Common Questions
What is the Total Population of Summerside?
Total Population of Summerside is 4,515.
What is the Total Male Population of Summerside?
Total Male Population of Summerside is 2,308.
What is the Total Female Population of Summerside?
Total Female Population of Summerside is 2,207.
What is the Ratio of Males per 100 Females in Summerside?
There are 104.58 Males per 100 Females in Summerside.
What is the Ratio of Females per 100 Males in Summerside?
There are 95.62 Females per 100 Males in Summerside.
What is the Median Population Age in Summerside?
Median Population Age in Summerside is 30.7 Years.
What is the Average Family Size in Summerside
Average Family Size in Summerside is 3.0 People.
What is the Average Household Size in Summerside
Average Household Size in Summerside is 2.2 People.
What is Per Capita Income in Summerside?
Per Capita income in Summerside is $33,762.
What is the Median Family Income in Summerside?
Median Family Income in Summerside is $77,386.
What is the Median Household income in Summerside?
Median Household Income in Summerside is $57,976.
What is Income or Wage Gap in Summerside?
Income or Wage Gap in Summerside is 37.4%.
Women in Summerside earn 62.6 cents for every dollar earned by a man.
What is Inequality or Gini Index in Summerside?
Inequality or Gini Index in Summerside is 0.47.
How Large is the Labor Force in Summerside?
There are 2,242 People in the Labor Forcein in Summerside.
What is the Percentage of People in the Labor Force in Summerside?
66.8% of People are in the Labor Force in Summerside.
What is the Unemployment Rate in Summerside?
Unemployment Rate in Summerside is 6.9%.