Loveland, OH
Loveland Map
Loveland Overview
13,247
TOTAL POPULATION
6,283
MALE POPULATION
6,964
FEMALE POPULATION
90.22
MALES / 100 FEMALES
110.84
FEMALES / 100 MALES
39.0
MEDIAN AGE
3.0
AVG FAMILY SIZE
2.6
AVG HOUSEHOLD SIZE
$39,971
PER CAPITA INCOME
$95,466
AVG FAMILY INCOME
$81,706
AVG HOUSEHOLD INCOME
29.1%
WAGE / INCOME GAP [ % ]
70.9¢/ $1
WAGE / INCOME GAP [ $ ]
$13,728
FAMILY INCOME DEFICIT
0.42
INEQUALITY / GINI INDEX
6,986
LABOR FORCE [ PEOPLE ]
67.6%
PERCENT IN LABOR FORCE
3.9%
UNEMPLOYMENT RATE
Loveland Zip Codes
Loveland Area Codes
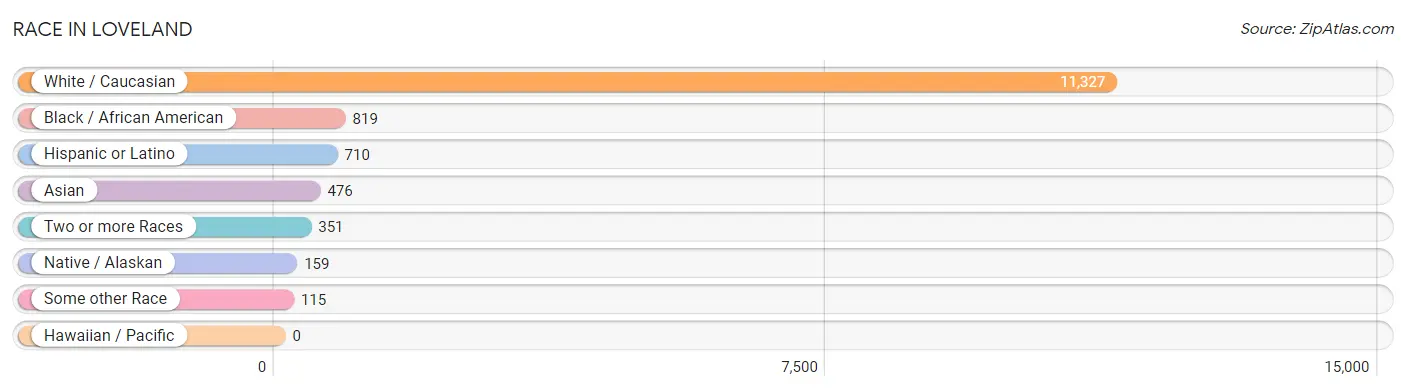
Race in Loveland
The most populous races in Loveland are White / Caucasian (11,327 | 85.5%), Black / African American (819 | 6.2%), and Hispanic or Latino (710 | 5.4%).
| Race | # Population | % Population |
| Asian | 476 | 3.6% |
| Black / African American | 819 | 6.2% |
| Hawaiian / Pacific | 0 | 0.0% |
| Hispanic or Latino | 710 | 5.4% |
| Native / Alaskan | 159 | 1.2% |
| White / Caucasian | 11,327 | 85.5% |
| Two or more Races | 351 | 2.6% |
| Some other Race | 115 | 0.9% |
| Total | 13,247 | 100.0% |
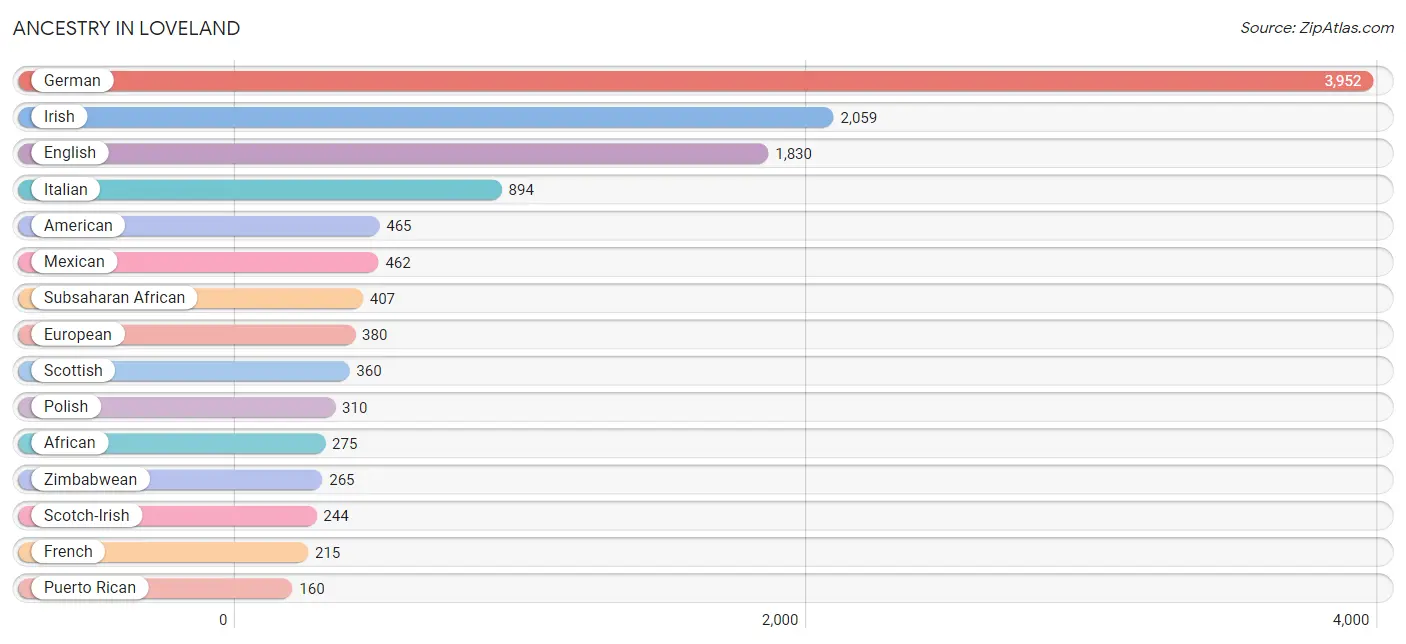
Ancestry in Loveland
The most populous ancestries reported in Loveland are German (3,952 | 29.8%), Irish (2,059 | 15.5%), English (1,830 | 13.8%), Italian (894 | 6.8%), and American (465 | 3.5%), together accounting for 69.4% of all Loveland residents.
| Ancestry | # Population | % Population |
| African | 275 | 2.1% |
| American | 465 | 3.5% |
| Arab | 63 | 0.5% |
| Austrian | 23 | 0.2% |
| Belgian | 13 | 0.1% |
| Bolivian | 21 | 0.2% |
| British | 73 | 0.5% |
| Burmese | 52 | 0.4% |
| Canadian | 128 | 1.0% |
| Central American | 51 | 0.4% |
| Cherokee | 32 | 0.2% |
| Croatian | 18 | 0.1% |
| Czech | 14 | 0.1% |
| Danish | 32 | 0.2% |
| Dutch | 56 | 0.4% |
| Eastern European | 80 | 0.6% |
| English | 1,830 | 13.8% |
| European | 380 | 2.9% |
| Finnish | 20 | 0.2% |
| French | 215 | 1.6% |
| French Canadian | 22 | 0.2% |
| German | 3,952 | 29.8% |
| Greek | 60 | 0.4% |
| Guatemalan | 1 | 0.0% |
| Hungarian | 73 | 0.5% |
| Indian (Asian) | 90 | 0.7% |
| Irish | 2,059 | 15.5% |
| Italian | 894 | 6.8% |
| Korean | 61 | 0.5% |
| Laotian | 43 | 0.3% |
| Lebanese | 12 | 0.1% |
| Lithuanian | 26 | 0.2% |
| Mexican | 462 | 3.5% |
| Mexican American Indian | 138 | 1.0% |
| Northern European | 18 | 0.1% |
| Norwegian | 105 | 0.8% |
| Panamanian | 44 | 0.3% |
| Pennsylvania German | 12 | 0.1% |
| Polish | 310 | 2.3% |
| Puerto Rican | 160 | 1.2% |
| Russian | 38 | 0.3% |
| Salvadoran | 6 | 0.1% |
| Scandinavian | 24 | 0.2% |
| Scotch-Irish | 244 | 1.8% |
| Scottish | 360 | 2.7% |
| Slovak | 49 | 0.4% |
| South American | 21 | 0.2% |
| Subsaharan African | 407 | 3.1% |
| Swedish | 142 | 1.1% |
| Swiss | 131 | 1.0% |
| Syrian | 30 | 0.2% |
| Thai | 29 | 0.2% |
| Turkish | 63 | 0.5% |
| Ukrainian | 34 | 0.3% |
| Welsh | 45 | 0.3% |
| Zimbabwean | 265 | 2.0% | View All 56 Rows |
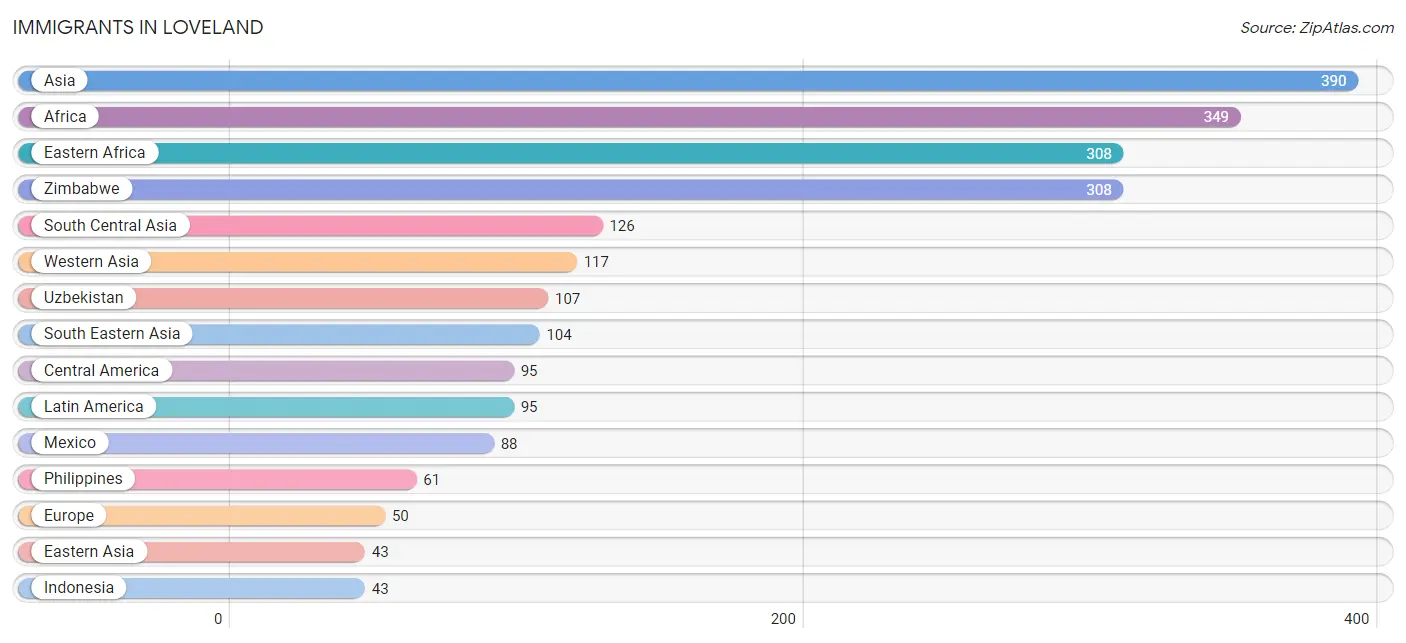
Immigrants in Loveland
The most numerous immigrant groups reported in Loveland came from Asia (390 | 2.9%), Africa (349 | 2.6%), Eastern Africa (308 | 2.3%), Zimbabwe (308 | 2.3%), and South Central Asia (126 | 0.9%), together accounting for 11.2% of all Loveland residents.
| Immigration Origin | # Population | % Population |
| Africa | 349 | 2.6% |
| Asia | 390 | 2.9% |
| Canada | 37 | 0.3% |
| Central America | 95 | 0.7% |
| China | 8 | 0.1% |
| Eastern Africa | 308 | 2.3% |
| Eastern Asia | 43 | 0.3% |
| Eastern Europe | 29 | 0.2% |
| England | 6 | 0.1% |
| Europe | 50 | 0.4% |
| Greece | 15 | 0.1% |
| Guatemala | 7 | 0.1% |
| India | 10 | 0.1% |
| Indonesia | 43 | 0.3% |
| Jordan | 21 | 0.2% |
| Kazakhstan | 9 | 0.1% |
| Korea | 35 | 0.3% |
| Latin America | 95 | 0.7% |
| Latvia | 5 | 0.0% |
| Liberia | 27 | 0.2% |
| Mexico | 88 | 0.7% |
| Morocco | 14 | 0.1% |
| Northern Africa | 14 | 0.1% |
| Northern Europe | 6 | 0.1% |
| Philippines | 61 | 0.5% |
| Russia | 18 | 0.1% |
| South Central Asia | 126 | 0.9% |
| South Eastern Asia | 104 | 0.8% |
| Southern Europe | 15 | 0.1% |
| Turkey | 24 | 0.2% |
| Ukraine | 6 | 0.1% |
| Uzbekistan | 107 | 0.8% |
| Western Africa | 27 | 0.2% |
| Western Asia | 117 | 0.9% |
| Zimbabwe | 308 | 2.3% | View All 35 Rows |
Sex and Age in Loveland
Sex and Age in Loveland
The most populous age groups in Loveland are 5 to 9 Years (629 | 10.0%) for men and 15 to 19 Years (712 | 10.2%) for women.
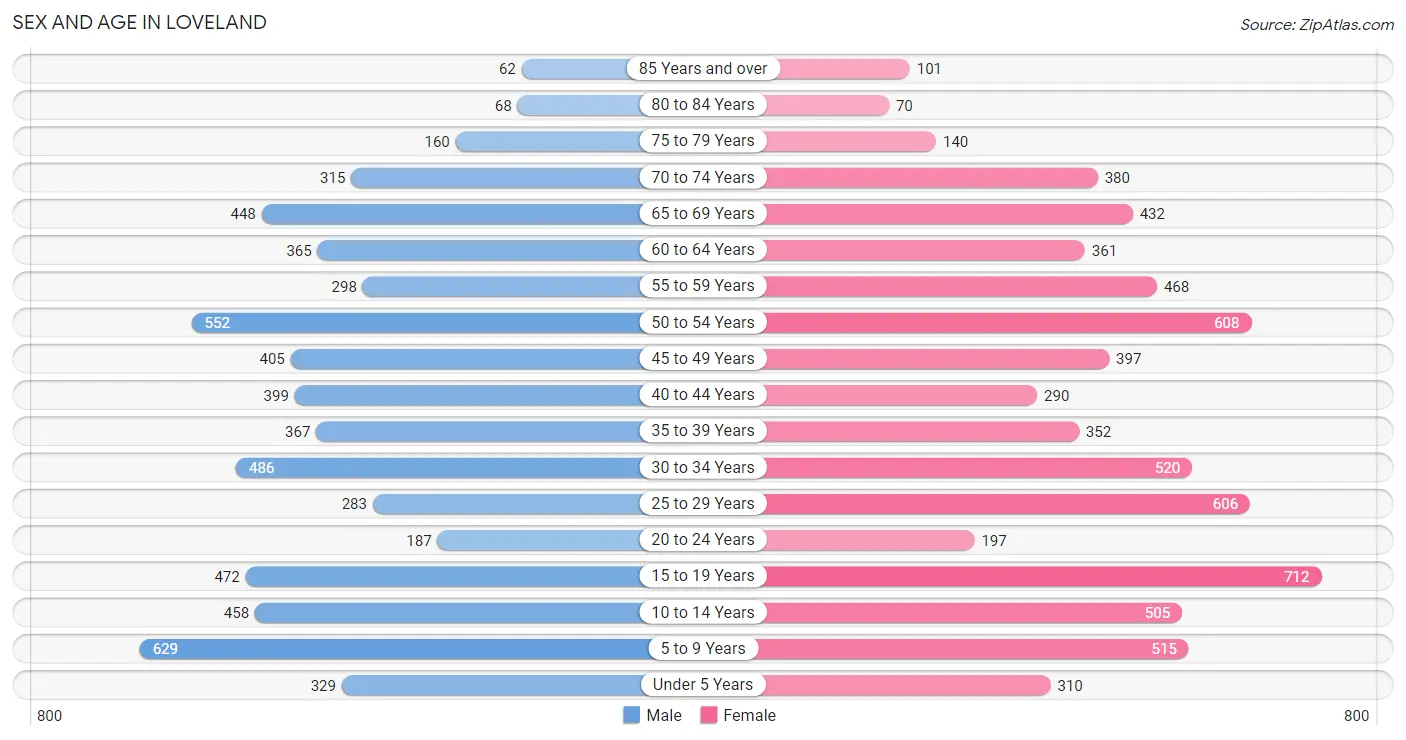
| Age Bracket | Male | Female |
| Under 5 Years | 329 (5.2%) | 310 (4.4%) |
| 5 to 9 Years | 629 (10.0%) | 515 (7.4%) |
| 10 to 14 Years | 458 (7.3%) | 505 (7.2%) |
| 15 to 19 Years | 472 (7.5%) | 712 (10.2%) |
| 20 to 24 Years | 187 (3.0%) | 197 (2.8%) |
| 25 to 29 Years | 283 (4.5%) | 606 (8.7%) |
| 30 to 34 Years | 486 (7.7%) | 520 (7.5%) |
| 35 to 39 Years | 367 (5.8%) | 352 (5.1%) |
| 40 to 44 Years | 399 (6.4%) | 290 (4.2%) |
| 45 to 49 Years | 405 (6.5%) | 397 (5.7%) |
| 50 to 54 Years | 552 (8.8%) | 608 (8.7%) |
| 55 to 59 Years | 298 (4.7%) | 468 (6.7%) |
| 60 to 64 Years | 365 (5.8%) | 361 (5.2%) |
| 65 to 69 Years | 448 (7.1%) | 432 (6.2%) |
| 70 to 74 Years | 315 (5.0%) | 380 (5.5%) |
| 75 to 79 Years | 160 (2.5%) | 140 (2.0%) |
| 80 to 84 Years | 68 (1.1%) | 70 (1.0%) |
| 85 Years and over | 62 (1.0%) | 101 (1.5%) |
| Total | 6,283 (100.0%) | 6,964 (100.0%) |
Families and Households in Loveland
Median Family Size in Loveland
The median family size in Loveland is 3.05 persons per family, with married-couple families (2,880 | 77.1%) accounting for the largest median family size of 3.22 persons per family. On the other hand, single male/father families (303 | 8.1%) represent the smallest median family size with 2.45 persons per family.
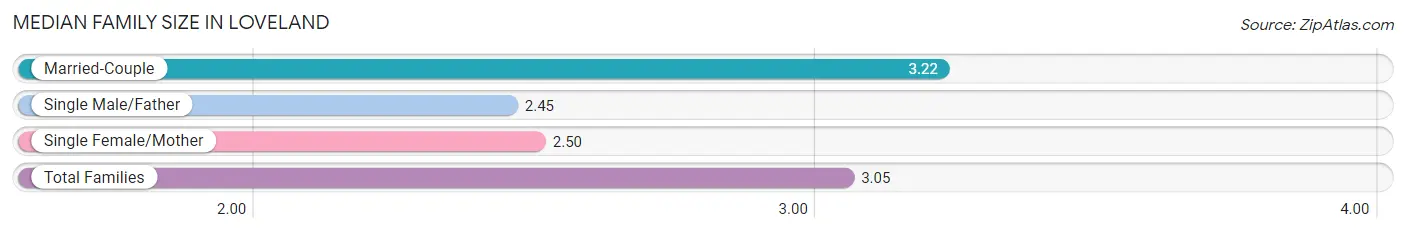
| Family Type | # Families | Family Size |
| Married-Couple | 2,880 (77.1%) | 3.22 |
| Single Male/Father | 303 (8.1%) | 2.45 |
| Single Female/Mother | 551 (14.8%) | 2.50 |
| Total Families | 3,734 (100.0%) | 3.05 |
Median Household Size in Loveland
The median household size in Loveland is 2.58 persons per household, with married-couple households (2,880 | 56.5%) accounting for the largest median household size of 3.23 persons per household. non-family households (1,360 | 26.7%) represent the smallest median household size with 1.13 persons per household.
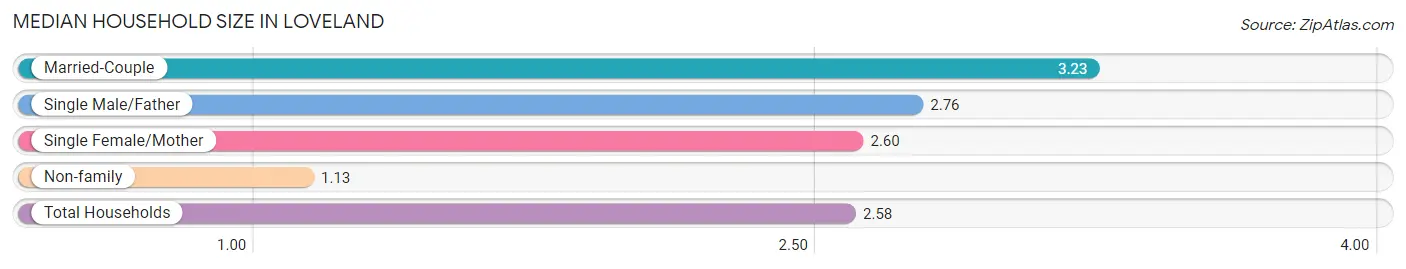
| Household Type | # Households | Household Size |
| Married-Couple | 2,880 (56.5%) | 3.23 |
| Single Male/Father | 303 (5.9%) | 2.76 |
| Single Female/Mother | 551 (10.8%) | 2.60 |
| Non-family | 1,360 (26.7%) | 1.13 |
| Total Households | 5,094 (100.0%) | 2.58 |
Household Size by Marriage Status in Loveland
Out of a total of 5,094 households in Loveland, 3,734 (73.3%) are family households, while 1,360 (26.7%) are nonfamily households. The most numerous type of family households are 2-person households, comprising 1,781, and the most common type of nonfamily households are 1-person households, comprising 1,206.
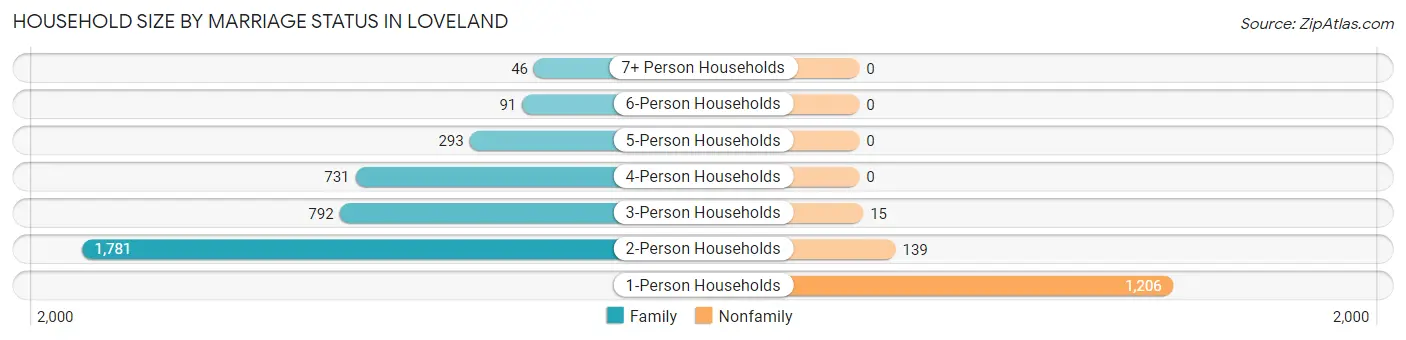
| Household Size | Family Households | Nonfamily Households |
| 1-Person Households | - | 1,206 (23.7%) |
| 2-Person Households | 1,781 (35.0%) | 139 (2.7%) |
| 3-Person Households | 792 (15.5%) | 15 (0.3%) |
| 4-Person Households | 731 (14.3%) | 0 (0.0%) |
| 5-Person Households | 293 (5.8%) | 0 (0.0%) |
| 6-Person Households | 91 (1.8%) | 0 (0.0%) |
| 7+ Person Households | 46 (0.9%) | 0 (0.0%) |
| Total | 3,734 (73.3%) | 1,360 (26.7%) |
Female Fertility in Loveland
Fertility by Age in Loveland
Average fertility rate in Loveland is 34.0 births per 1,000 women. Women in the age bracket of 20 to 34 years have the highest fertility rate with 79.0 births per 1,000 women. Women in the age bracket of 20 to 34 years acount for 100.0% of all women with births.
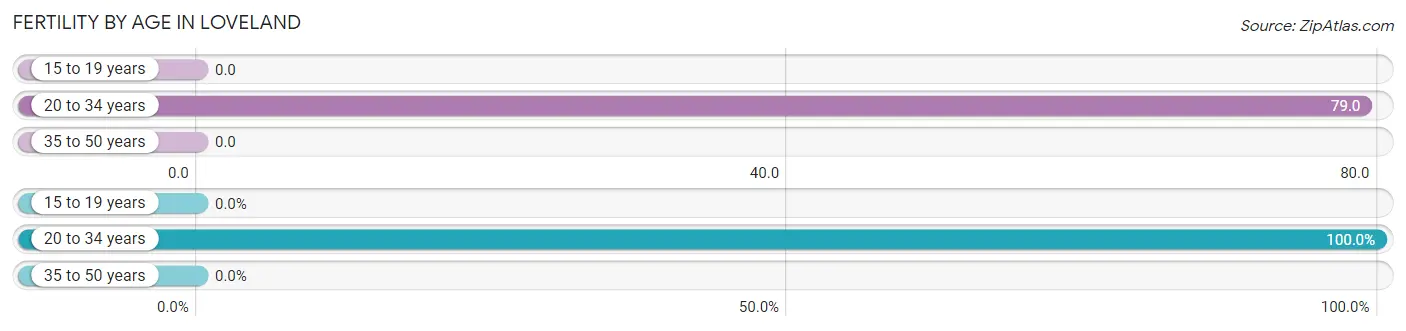
| Age Bracket | Women with Births | Births / 1,000 Women |
| 15 to 19 years | 0 (0.0%) | 0.0 |
| 20 to 34 years | 105 (100.0%) | 79.0 |
| 35 to 50 years | 0 (0.0%) | 0.0 |
| Total | 105 (100.0%) | 34.0 |
Fertility by Age by Marriage Status in Loveland
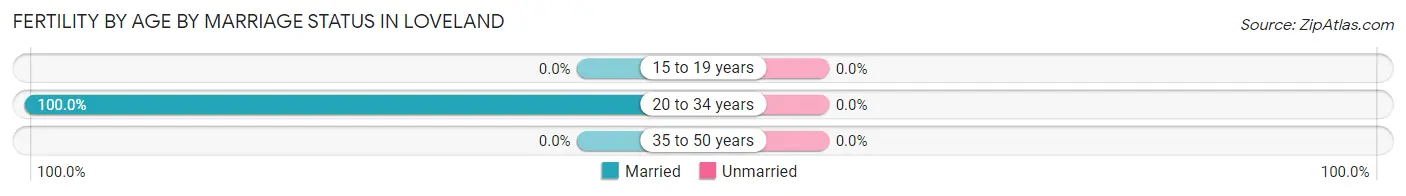
| Age Bracket | Married | Unmarried |
| 15 to 19 years | 0 (0.0%) | 0 (0.0%) |
| 20 to 34 years | 105 (100.0%) | 0 (0.0%) |
| 35 to 50 years | 0 (0.0%) | 0 (0.0%) |
| Total | 105 (100.0%) | 0 (0.0%) |
Fertility by Education in Loveland
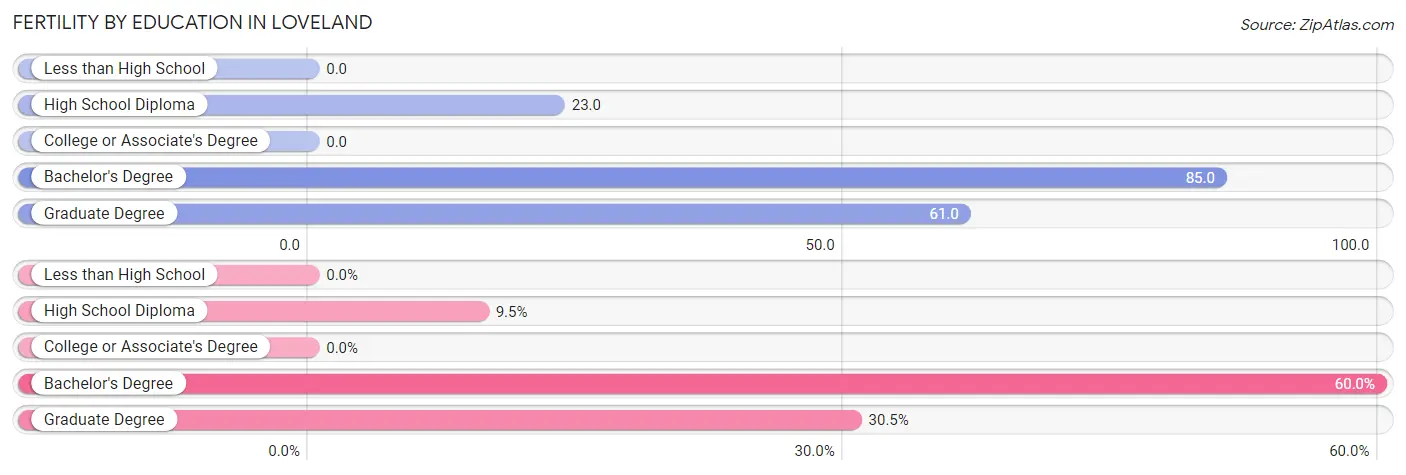
| Educational Attainment | Women with Births | Births / 1,000 Women |
| Less than High School | 0 (0.0%) | 0.0 |
| High School Diploma | 10 (9.5%) | 23.0 |
| College or Associate's Degree | 0 (0.0%) | 0.0 |
| Bachelor's Degree | 63 (60.0%) | 85.0 |
| Graduate Degree | 32 (30.5%) | 61.0 |
| Total | 105 (100.0%) | 34.0 |
Fertility by Education by Marriage Status in Loveland
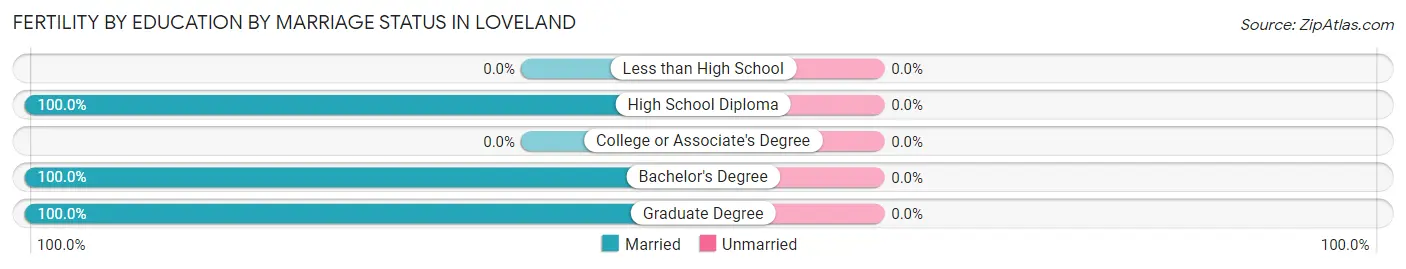
| Educational Attainment | Married | Unmarried |
| Less than High School | 0 (0.0%) | 0 (0.0%) |
| High School Diploma | 10 (100.0%) | 0 (0.0%) |
| College or Associate's Degree | 0 (0.0%) | 0 (0.0%) |
| Bachelor's Degree | 63 (100.0%) | 0 (0.0%) |
| Graduate Degree | 32 (100.0%) | 0 (0.0%) |
| Total | 105 (100.0%) | 0 (0.0%) |
Income in Loveland
Income Overview in Loveland
Per Capita Income in Loveland is $39,971, while median incomes of families and households are $95,466 and $81,706 respectively.
| Characteristic | Number | Measure |
| Per Capita Income | 13,247 | $39,971 |
| Median Family Income | 3,734 | $95,466 |
| Mean Family Income | 3,734 | $113,346 |
| Median Household Income | 5,094 | $81,706 |
| Mean Household Income | 5,094 | $102,973 |
| Income Deficit | 3,734 | $13,728 |
| Wage / Income Gap (%) | 13,247 | 29.06% |
| Wage / Income Gap ($) | 13,247 | 70.94¢ per $1 |
| Gini / Inequality Index | 13,247 | 0.42 |
Earnings by Sex in Loveland
Average Earnings in Loveland are $43,676, $54,821 for men and $38,889 for women, a difference of 29.1%.
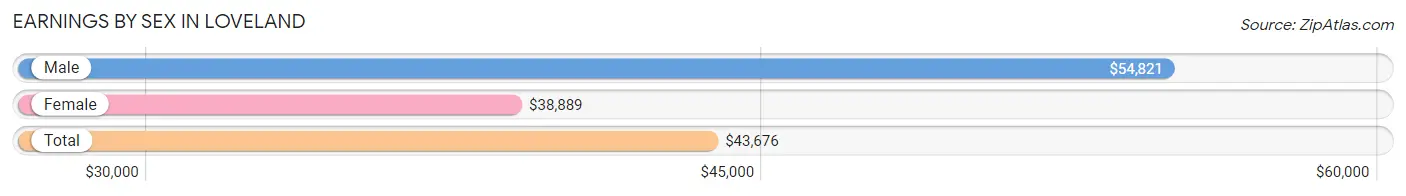
| Sex | Number | Average Earnings |
| Male | 3,693 (49.3%) | $54,821 |
| Female | 3,796 (50.7%) | $38,889 |
| Total | 7,489 (100.0%) | $43,676 |
Earnings by Sex by Income Bracket in Loveland
The most common earnings brackets in Loveland are $100,000+ for men (801 | 21.7%) and $55,000 to $64,999 for women (406 | 10.7%).
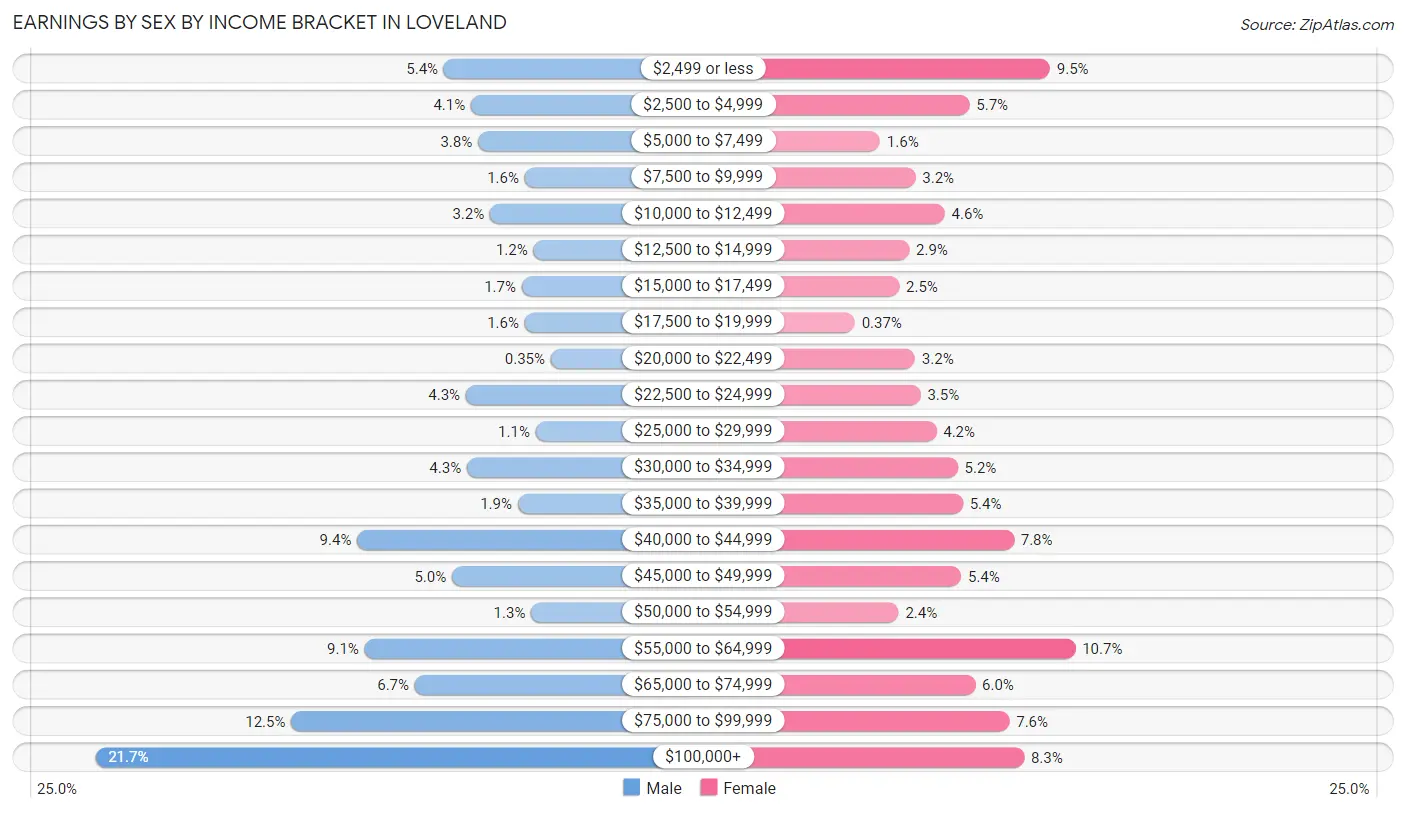
| Income | Male | Female |
| $2,499 or less | 198 (5.4%) | 361 (9.5%) |
| $2,500 to $4,999 | 151 (4.1%) | 218 (5.7%) |
| $5,000 to $7,499 | 139 (3.8%) | 59 (1.5%) |
| $7,500 to $9,999 | 58 (1.6%) | 122 (3.2%) |
| $10,000 to $12,499 | 118 (3.2%) | 174 (4.6%) |
| $12,500 to $14,999 | 43 (1.2%) | 111 (2.9%) |
| $15,000 to $17,499 | 63 (1.7%) | 93 (2.5%) |
| $17,500 to $19,999 | 58 (1.6%) | 14 (0.4%) |
| $20,000 to $22,499 | 13 (0.4%) | 121 (3.2%) |
| $22,500 to $24,999 | 160 (4.3%) | 131 (3.5%) |
| $25,000 to $29,999 | 39 (1.1%) | 159 (4.2%) |
| $30,000 to $34,999 | 158 (4.3%) | 197 (5.2%) |
| $35,000 to $39,999 | 70 (1.9%) | 206 (5.4%) |
| $40,000 to $44,999 | 348 (9.4%) | 297 (7.8%) |
| $45,000 to $49,999 | 184 (5.0%) | 203 (5.3%) |
| $50,000 to $54,999 | 47 (1.3%) | 92 (2.4%) |
| $55,000 to $64,999 | 335 (9.1%) | 406 (10.7%) |
| $65,000 to $74,999 | 248 (6.7%) | 228 (6.0%) |
| $75,000 to $99,999 | 462 (12.5%) | 289 (7.6%) |
| $100,000+ | 801 (21.7%) | 315 (8.3%) |
| Total | 3,693 (100.0%) | 3,796 (100.0%) |
Earnings by Sex by Educational Attainment in Loveland
Average earnings in Loveland are $59,151 for men and $42,855 for women, a difference of 27.6%. Men with an educational attainment of graduate degree enjoy the highest average annual earnings of $107,431, while those with college or associate's degree education earn the least with $46,103. Women with an educational attainment of bachelor's degree earn the most with the average annual earnings of $58,239, while those with high school diploma education have the smallest earnings of $22,963.
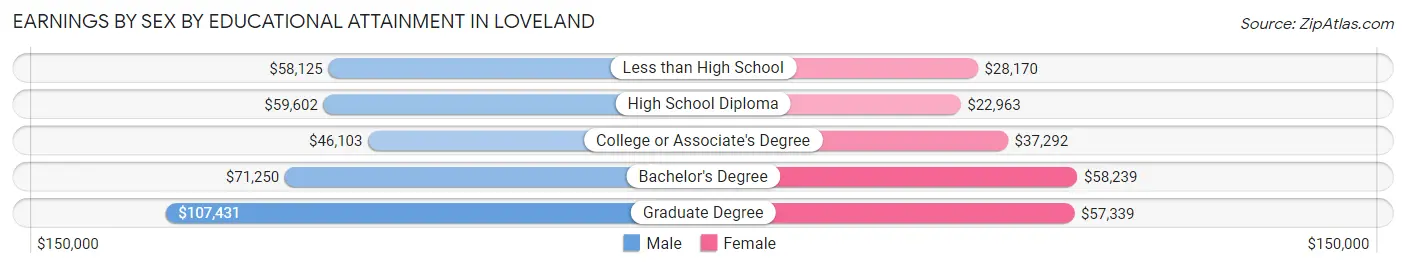
| Educational Attainment | Male Income | Female Income |
| Less than High School | $58,125 | $28,170 |
| High School Diploma | $59,602 | $22,963 |
| College or Associate's Degree | $46,103 | $37,292 |
| Bachelor's Degree | $71,250 | $58,239 |
| Graduate Degree | $107,431 | $57,339 |
| Total | $59,151 | $42,855 |
Family Income in Loveland
Family Income Brackets in Loveland
According to the Loveland family income data, there are 709 families falling into the $75,000 to $99,999 income range, which is the most common income bracket and makes up 19.0% of all families. Conversely, the $15,000 to $24,999 income bracket is the least frequent group with only 60 families (1.6%) belonging to this category.
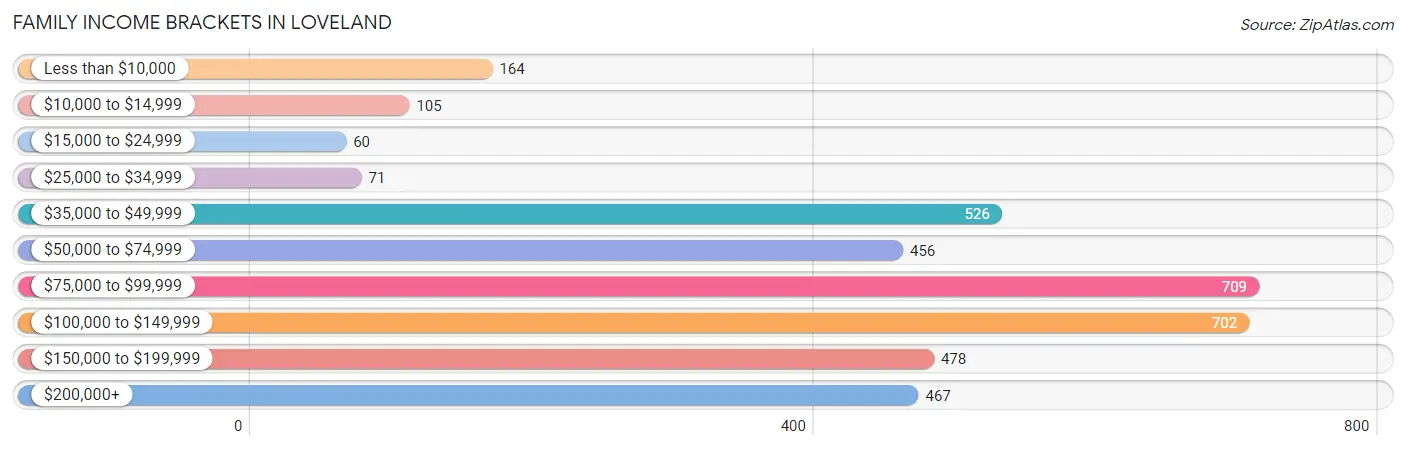
| Income Bracket | # Families | % Families |
| Less than $10,000 | 164 | 4.4% |
| $10,000 to $14,999 | 105 | 2.8% |
| $15,000 to $24,999 | 60 | 1.6% |
| $25,000 to $34,999 | 71 | 1.9% |
| $35,000 to $49,999 | 526 | 14.1% |
| $50,000 to $74,999 | 456 | 12.2% |
| $75,000 to $99,999 | 709 | 19.0% |
| $100,000 to $149,999 | 702 | 18.8% |
| $150,000 to $199,999 | 478 | 12.8% |
| $200,000+ | 467 | 12.5% |
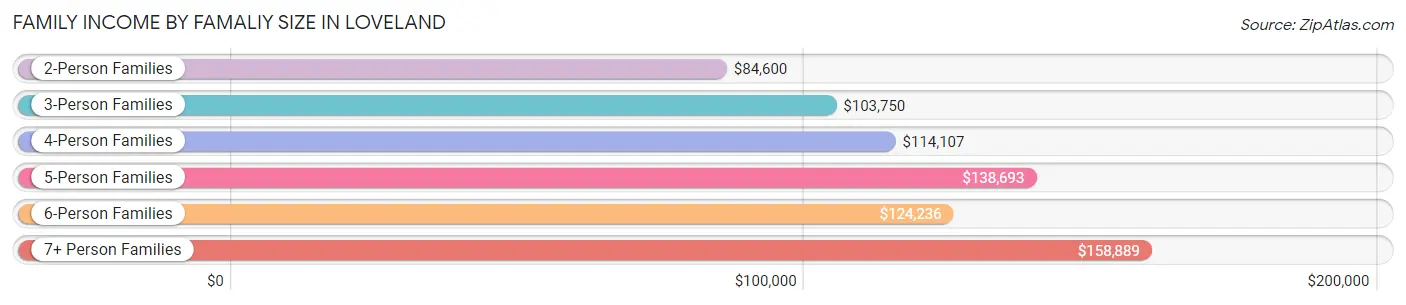
Family Income by Famaliy Size in Loveland
7+ person families (46 | 1.2%) account for the highest median family income in Loveland with $158,889 per family, while 2-person families (1,874 | 50.2%) have the highest median income of $42,300 per family member.
| Income Bracket | # Families | Median Income |
| 2-Person Families | 1,874 (50.2%) | $84,600 |
| 3-Person Families | 738 (19.8%) | $103,750 |
| 4-Person Families | 727 (19.5%) | $114,107 |
| 5-Person Families | 258 (6.9%) | $138,693 |
| 6-Person Families | 91 (2.4%) | $124,236 |
| 7+ Person Families | 46 (1.2%) | $158,889 |
| Total | 3,734 (100.0%) | $95,466 |
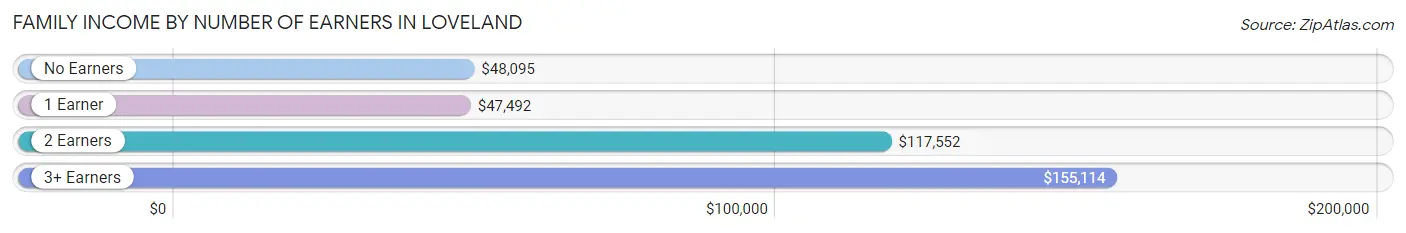
Family Income by Number of Earners in Loveland
The median family income in Loveland is $95,466, with families comprising 3+ earners (464) having the highest median family income of $155,114, while families with 1 earner (897) have the lowest median family income of $47,492, accounting for 12.4% and 24.0% of families, respectively.
| Number of Earners | # Families | Median Income |
| No Earners | 488 (13.1%) | $48,095 |
| 1 Earner | 897 (24.0%) | $47,492 |
| 2 Earners | 1,885 (50.5%) | $117,552 |
| 3+ Earners | 464 (12.4%) | $155,114 |
| Total | 3,734 (100.0%) | $95,466 |
Household Income in Loveland
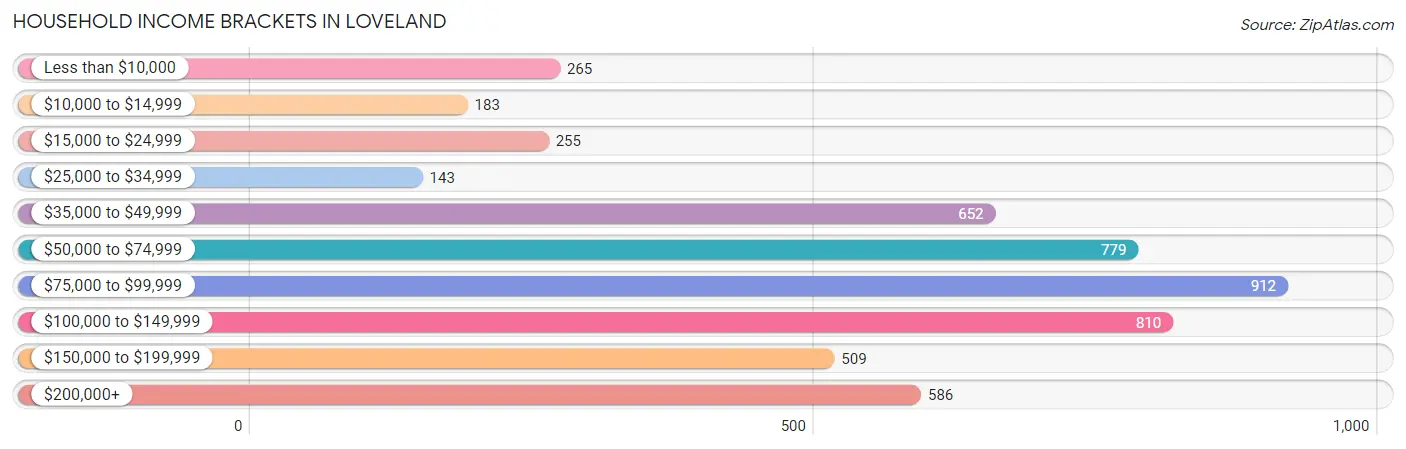
Household Income Brackets in Loveland
With 912 households falling in the category, the $75,000 to $99,999 income range is the most frequent in Loveland, accounting for 17.9% of all households. In contrast, only 143 households (2.8%) fall into the $25,000 to $34,999 income bracket, making it the least populous group.
| Income Bracket | # Households | % Households |
| Less than $10,000 | 265 | 5.2% |
| $10,000 to $14,999 | 183 | 3.6% |
| $15,000 to $24,999 | 255 | 5.0% |
| $25,000 to $34,999 | 143 | 2.8% |
| $35,000 to $49,999 | 652 | 12.8% |
| $50,000 to $74,999 | 779 | 15.3% |
| $75,000 to $99,999 | 912 | 17.9% |
| $100,000 to $149,999 | 810 | 15.9% |
| $150,000 to $199,999 | 509 | 10.0% |
| $200,000+ | 586 | 11.5% |
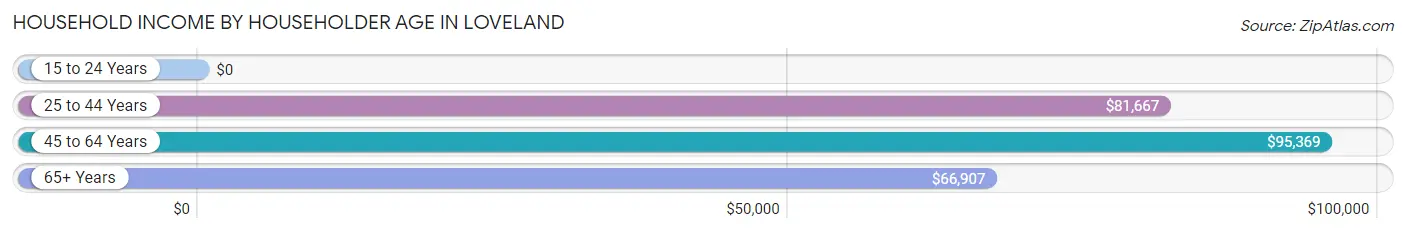
Household Income by Householder Age in Loveland
The median household income in Loveland is $81,706, with the highest median household income of $95,369 found in the 45 to 64 years age bracket for the primary householder. A total of 1,919 households (37.7%) fall into this category. Meanwhile, the 15 to 24 years age bracket for the primary householder has the lowest median household income of $0, with 56 households (1.1%) in this group.
| Income Bracket | # Households | Median Income |
| 15 to 24 Years | 56 (1.1%) | $0 |
| 25 to 44 Years | 1,718 (33.7%) | $81,667 |
| 45 to 64 Years | 1,919 (37.7%) | $95,369 |
| 65+ Years | 1,401 (27.5%) | $66,907 |
| Total | 5,094 (100.0%) | $81,706 |
Poverty in Loveland
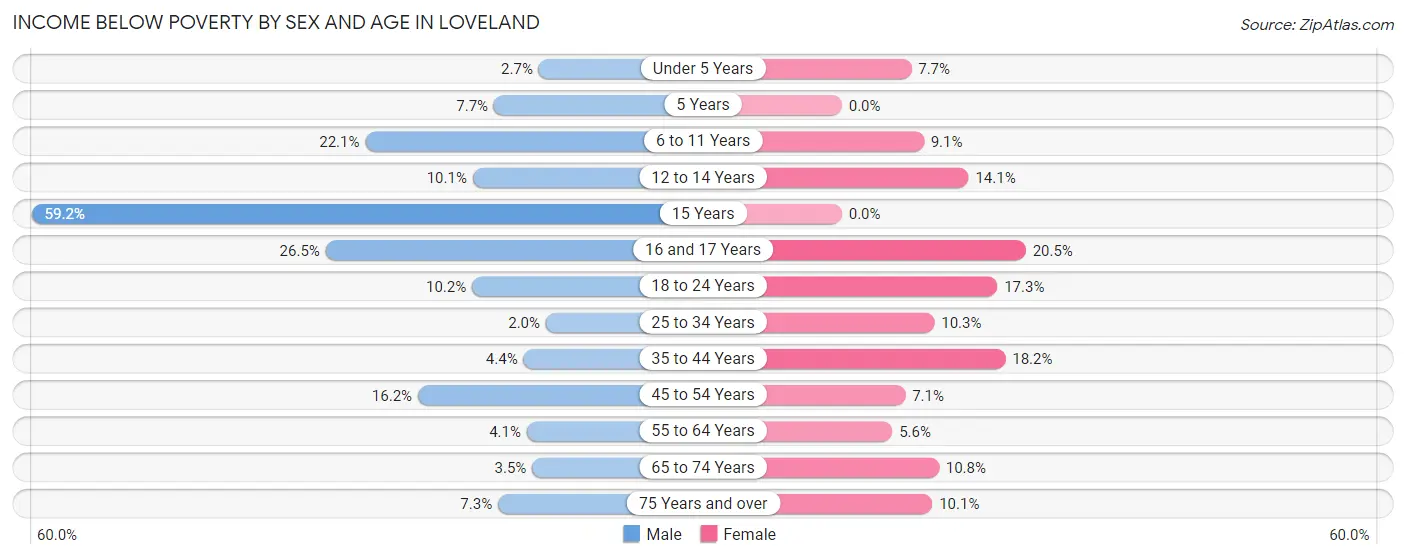
Income Below Poverty by Sex and Age in Loveland
With 9.4% poverty level for males and 10.8% for females among the residents of Loveland, 15 year old males and 16 and 17 year old females are the most vulnerable to poverty, with 45 males (59.2%) and 93 females (20.5%) in their respective age groups living below the poverty level.
| Age Bracket | Male | Female |
| Under 5 Years | 9 (2.7%) | 24 (7.7%) |
| 5 Years | 16 (7.7%) | 0 (0.0%) |
| 6 to 11 Years | 122 (22.1%) | 56 (9.1%) |
| 12 to 14 Years | 33 (10.1%) | 47 (14.1%) |
| 15 Years | 45 (59.2%) | 0 (0.0%) |
| 16 and 17 Years | 45 (26.5%) | 93 (20.5%) |
| 18 to 24 Years | 42 (10.2%) | 63 (17.3%) |
| 25 to 34 Years | 15 (1.9%) | 116 (10.3%) |
| 35 to 44 Years | 34 (4.4%) | 116 (18.2%) |
| 45 to 54 Years | 155 (16.2%) | 71 (7.1%) |
| 55 to 64 Years | 27 (4.1%) | 46 (5.6%) |
| 65 to 74 Years | 26 (3.5%) | 84 (10.8%) |
| 75 Years and over | 19 (7.3%) | 28 (10.1%) |
| Total | 588 (9.4%) | 744 (10.8%) |
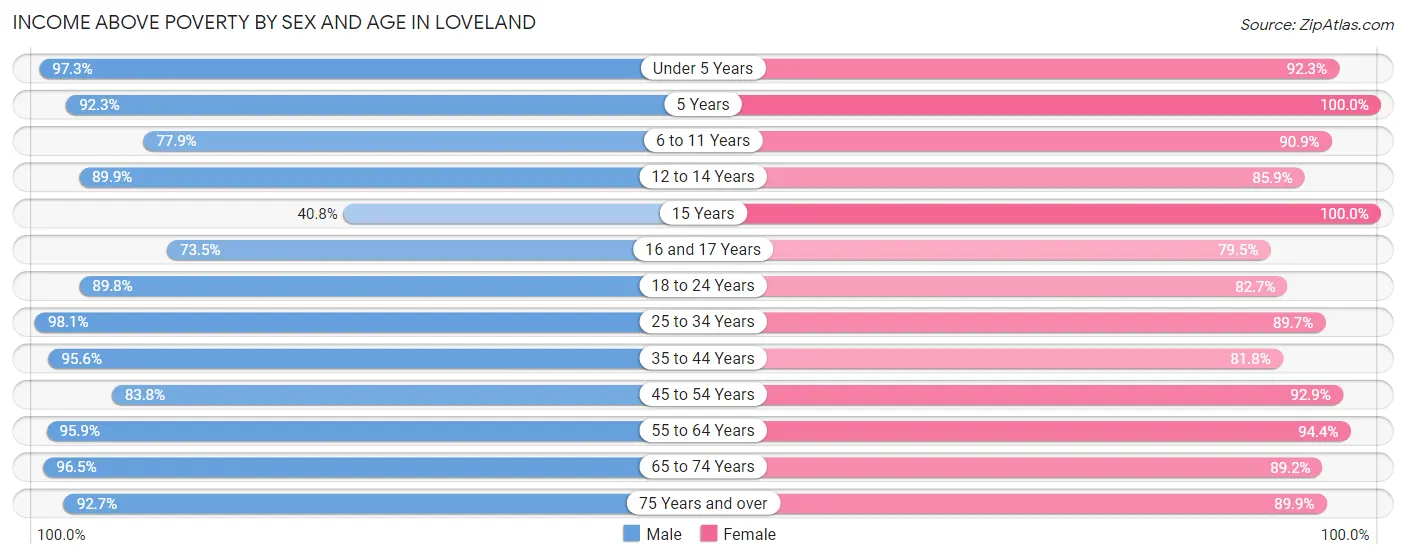
Income Above Poverty by Sex and Age in Loveland
According to the poverty statistics in Loveland, males aged 25 to 34 years and females aged 5 years are the age groups that are most secure financially, with 98.1% of males and 100.0% of females in these age groups living above the poverty line.
| Age Bracket | Male | Female |
| Under 5 Years | 320 (97.3%) | 286 (92.3%) |
| 5 Years | 191 (92.3%) | 72 (100.0%) |
| 6 to 11 Years | 431 (77.9%) | 558 (90.9%) |
| 12 to 14 Years | 294 (89.9%) | 286 (85.9%) |
| 15 Years | 31 (40.8%) | 91 (100.0%) |
| 16 and 17 Years | 125 (73.5%) | 361 (79.5%) |
| 18 to 24 Years | 371 (89.8%) | 301 (82.7%) |
| 25 to 34 Years | 754 (98.1%) | 1,010 (89.7%) |
| 35 to 44 Years | 732 (95.6%) | 521 (81.8%) |
| 45 to 54 Years | 802 (83.8%) | 934 (92.9%) |
| 55 to 64 Years | 636 (95.9%) | 773 (94.4%) |
| 65 to 74 Years | 724 (96.5%) | 694 (89.2%) |
| 75 Years and over | 242 (92.7%) | 250 (89.9%) |
| Total | 5,653 (90.6%) | 6,137 (89.2%) |
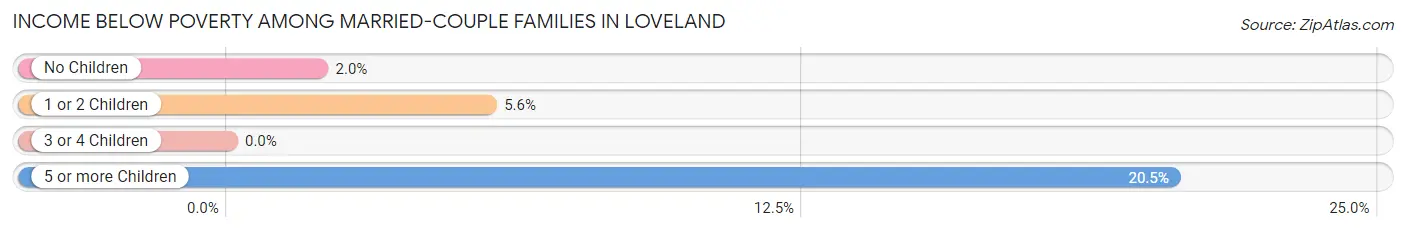
Income Below Poverty Among Married-Couple Families in Loveland
The poverty statistics for married-couple families in Loveland show that 3.4% or 99 of the total 2,880 families live below the poverty line. Families with 5 or more children have the highest poverty rate of 20.5%, comprising of 8 families. On the other hand, families with 3 or 4 children have the lowest poverty rate of 0.0%, which includes 0 families.
| Children | Above Poverty | Below Poverty |
| No Children | 1,539 (98.0%) | 31 (2.0%) |
| 1 or 2 Children | 1,003 (94.4%) | 60 (5.6%) |
| 3 or 4 Children | 208 (100.0%) | 0 (0.0%) |
| 5 or more Children | 31 (79.5%) | 8 (20.5%) |
| Total | 2,781 (96.6%) | 99 (3.4%) |
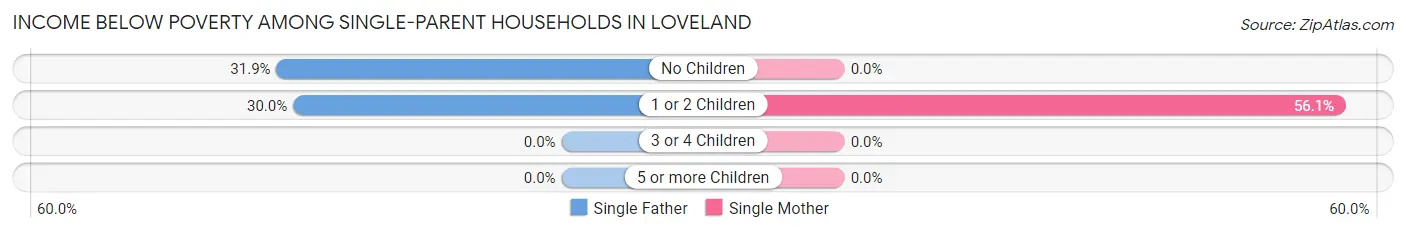
Income Below Poverty Among Single-Parent Households in Loveland
According to the poverty data in Loveland, 30.7% or 93 single-father households and 27.4% or 151 single-mother households are living below the poverty line. Among single-father households, those with no children have the highest poverty rate, with 36 households (31.9%) experiencing poverty. Likewise, among single-mother households, those with 1 or 2 children have the highest poverty rate, with 151 households (56.1%) falling below the poverty line.
| Children | Single Father | Single Mother |
| No Children | 36 (31.9%) | 0 (0.0%) |
| 1 or 2 Children | 57 (30.0%) | 151 (56.1%) |
| 3 or 4 Children | 0 (0.0%) | 0 (0.0%) |
| 5 or more Children | 0 (0.0%) | 0 (0.0%) |
| Total | 93 (30.7%) | 151 (27.4%) |
Income Below Poverty Among Married-Couple vs Single-Parent Households in Loveland
The poverty data for Loveland shows that 99 of the married-couple family households (3.4%) and 244 of the single-parent households (28.6%) are living below the poverty level. Within the married-couple family households, those with 5 or more children have the highest poverty rate, with 8 households (20.5%) falling below the poverty line. Among the single-parent households, those with 1 or 2 children have the highest poverty rate, with 208 household (45.3%) living below poverty.
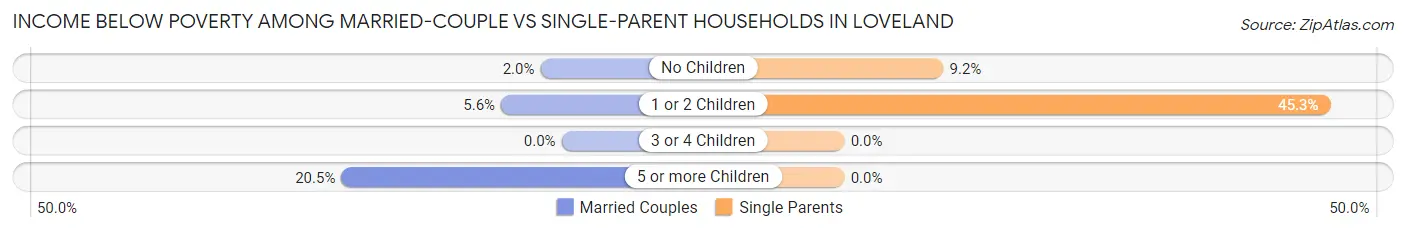
| Children | Married-Couple Families | Single-Parent Households |
| No Children | 31 (2.0%) | 36 (9.2%) |
| 1 or 2 Children | 60 (5.6%) | 208 (45.3%) |
| 3 or 4 Children | 0 (0.0%) | 0 (0.0%) |
| 5 or more Children | 8 (20.5%) | 0 (0.0%) |
| Total | 99 (3.4%) | 244 (28.6%) |
Employment Characteristics in Loveland
Employment by Class of Employer in Loveland
Among the 6,449 employed individuals in Loveland, private company employees (4,708 | 73.0%), not-for-profit organizations (514 | 8.0%), and local government employees (463 | 7.2%) make up the most common classes of employment.
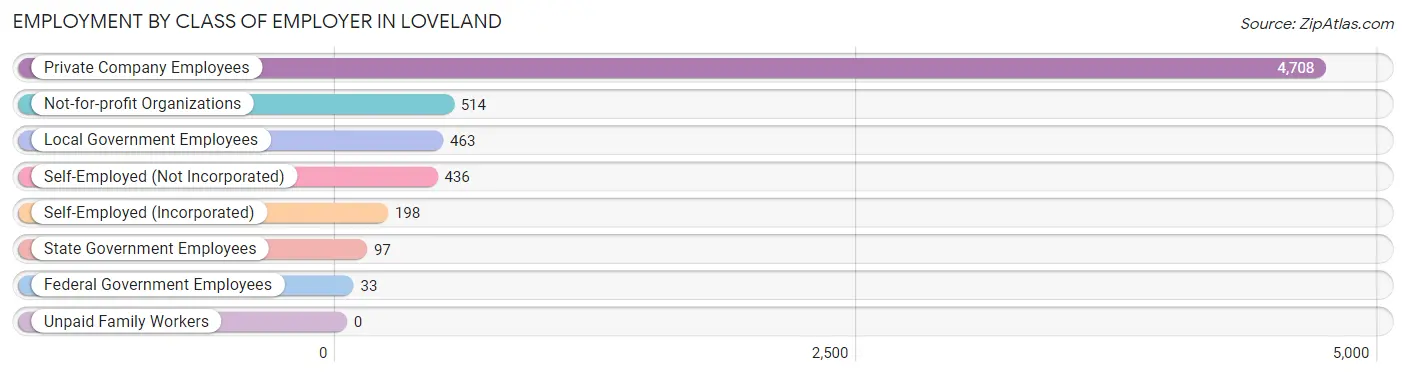
| Employer Class | # Employees | % Employees |
| Private Company Employees | 4,708 | 73.0% |
| Self-Employed (Incorporated) | 198 | 3.1% |
| Self-Employed (Not Incorporated) | 436 | 6.8% |
| Not-for-profit Organizations | 514 | 8.0% |
| Local Government Employees | 463 | 7.2% |
| State Government Employees | 97 | 1.5% |
| Federal Government Employees | 33 | 0.5% |
| Unpaid Family Workers | 0 | 0.0% |
| Total | 6,449 | 100.0% |
Employment Status by Age in Loveland
According to the labor force statistics for Loveland, out of the total population over 16 years of age (10,334), 67.6% or 6,986 individuals are in the labor force, with 3.9% or 272 of them unemployed. The age group with the highest labor force participation rate is 30 to 34 years, with 93.8% or 944 individuals in the labor force. Within the labor force, the 60 to 64 years age range has the highest percentage of unemployed individuals, with 15.9% or 89 of them being unemployed.
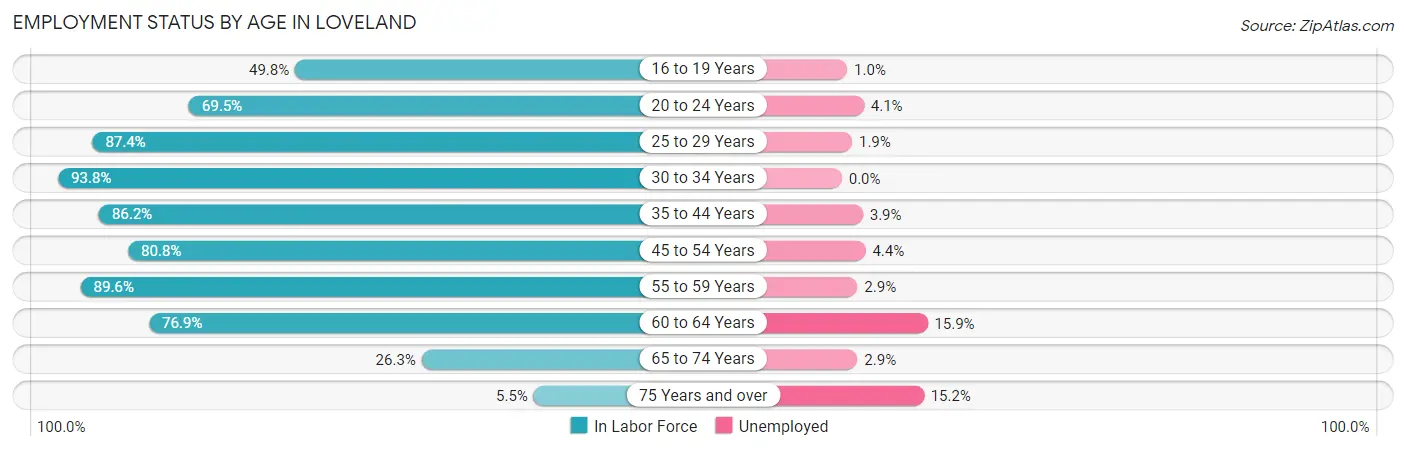
| Age Bracket | In Labor Force | Unemployed |
| 16 to 19 Years | 506 (49.8%) | 5 (1.0%) |
| 20 to 24 Years | 267 (69.5%) | 11 (4.1%) |
| 25 to 29 Years | 777 (87.4%) | 15 (1.9%) |
| 30 to 34 Years | 944 (93.8%) | 0 (0.0%) |
| 35 to 44 Years | 1,214 (86.2%) | 47 (3.9%) |
| 45 to 54 Years | 1,585 (80.8%) | 70 (4.4%) |
| 55 to 59 Years | 686 (89.6%) | 20 (2.9%) |
| 60 to 64 Years | 558 (76.9%) | 89 (15.9%) |
| 65 to 74 Years | 414 (26.3%) | 12 (2.9%) |
| 75 Years and over | 33 (5.5%) | 5 (15.2%) |
| Total | 6,986 (67.6%) | 272 (3.9%) |
Employment Status by Educational Attainment in Loveland
According to labor force statistics for Loveland, 85.3% of individuals (5,764) out of the total population between 25 and 64 years of age (6,757) are in the labor force, with 4.2% or 242 of them being unemployed. The group with the highest labor force participation rate are those with the educational attainment of bachelor's degree or higher, with 91.4% or 3,231 individuals in the labor force. Within the labor force, individuals with college / associate degree education have the highest percentage of unemployment, with 5.7% or 100 of them being unemployed.
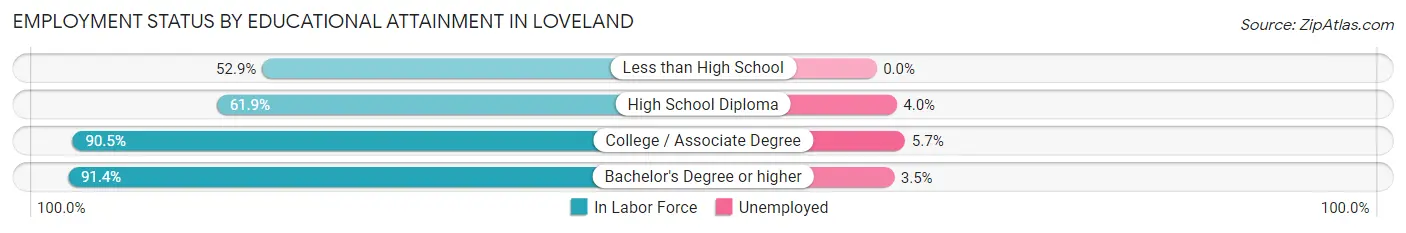
| Educational Attainment | In Labor Force | Unemployed |
| Less than High School | 83 (52.9%) | 0 (0.0%) |
| High School Diploma | 699 (61.9%) | 45 (4.0%) |
| College / Associate Degree | 1,751 (90.5%) | 110 (5.7%) |
| Bachelor's Degree or higher | 3,231 (91.4%) | 124 (3.5%) |
| Total | 5,764 (85.3%) | 284 (4.2%) |
Employment Occupations by Sex in Loveland
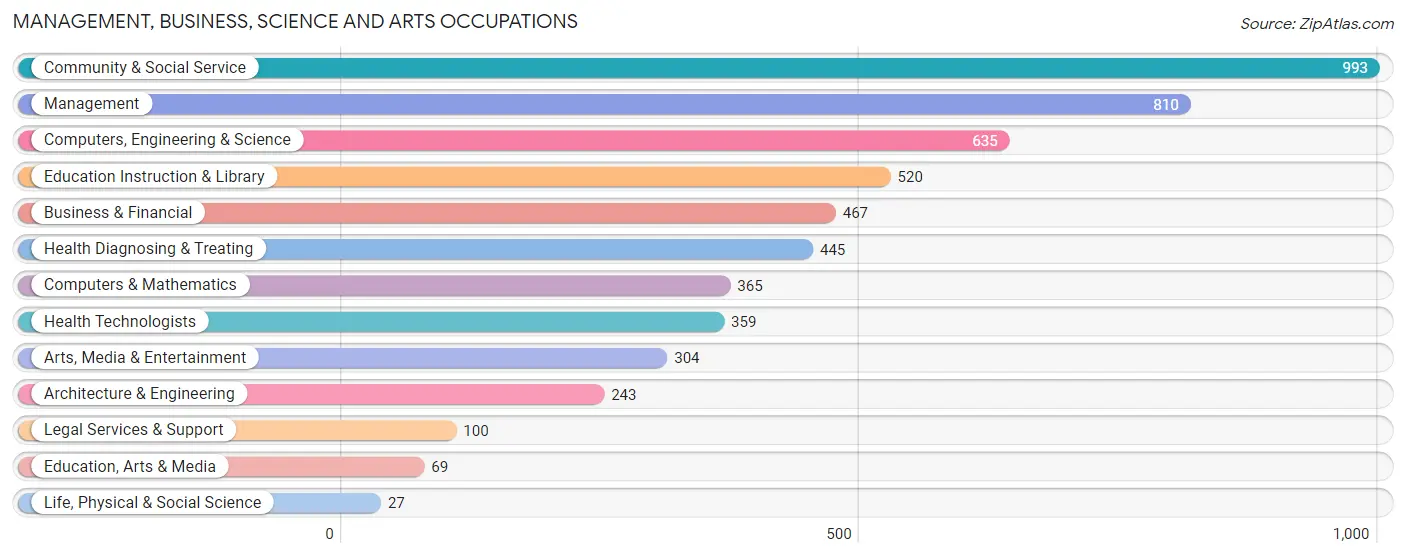
Management, Business, Science and Arts Occupations
The most common Management, Business, Science and Arts occupations in Loveland are Community & Social Service (993 | 14.8%), Management (810 | 12.1%), Computers, Engineering & Science (635 | 9.5%), Education Instruction & Library (520 | 7.7%), and Business & Financial (467 | 7.0%).
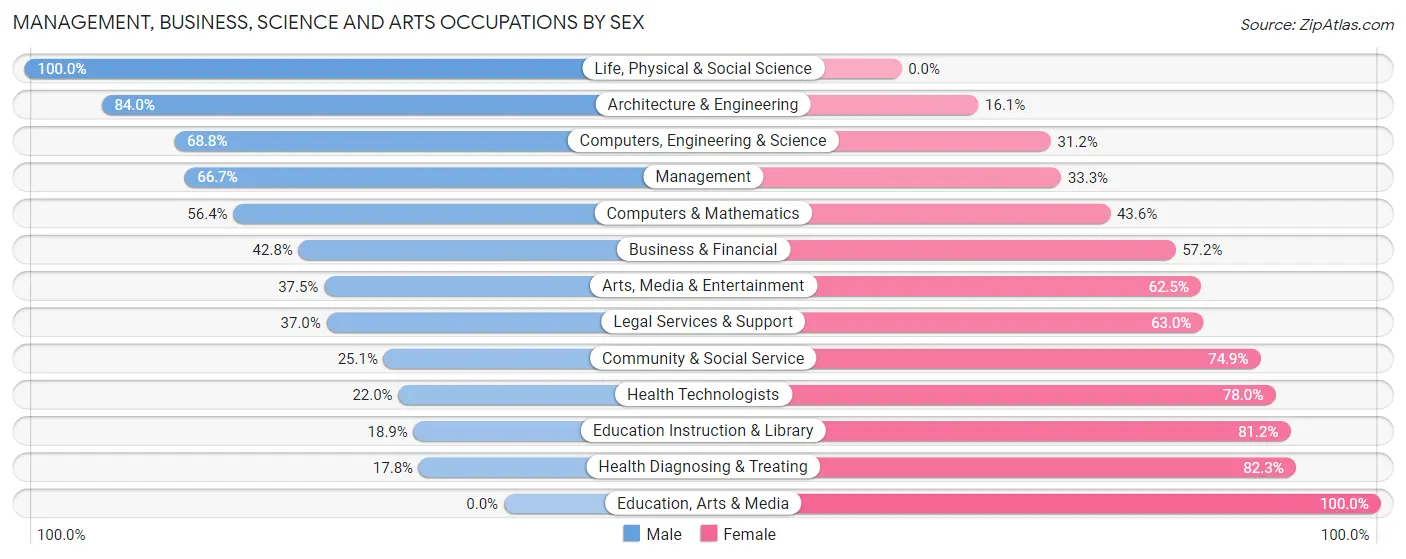
Management, Business, Science and Arts Occupations by Sex
Within the Management, Business, Science and Arts occupations in Loveland, the most male-oriented occupations are Life, Physical & Social Science (100.0%), Architecture & Engineering (84.0%), and Computers, Engineering & Science (68.8%), while the most female-oriented occupations are Education, Arts & Media (100.0%), Health Diagnosing & Treating (82.3%), and Education Instruction & Library (81.1%).
| Occupation | Male | Female |
| Management | 540 (66.7%) | 270 (33.3%) |
| Business & Financial | 200 (42.8%) | 267 (57.2%) |
| Computers, Engineering & Science | 437 (68.8%) | 198 (31.2%) |
| Computers & Mathematics | 206 (56.4%) | 159 (43.6%) |
| Architecture & Engineering | 204 (84.0%) | 39 (16.1%) |
| Life, Physical & Social Science | 27 (100.0%) | 0 (0.0%) |
| Community & Social Service | 249 (25.1%) | 744 (74.9%) |
| Education, Arts & Media | 0 (0.0%) | 69 (100.0%) |
| Legal Services & Support | 37 (37.0%) | 63 (63.0%) |
| Education Instruction & Library | 98 (18.9%) | 422 (81.1%) |
| Arts, Media & Entertainment | 114 (37.5%) | 190 (62.5%) |
| Health Diagnosing & Treating | 79 (17.7%) | 366 (82.3%) |
| Health Technologists | 79 (22.0%) | 280 (78.0%) |
| Total (Category) | 1,505 (44.9%) | 1,845 (55.1%) |
| Total (Overall) | 3,333 (49.7%) | 3,378 (50.3%) |
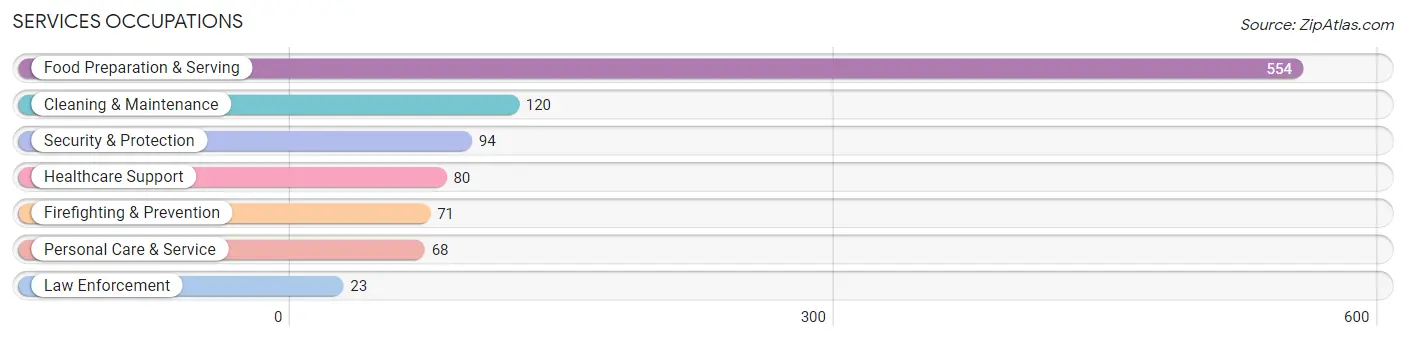
Services Occupations
The most common Services occupations in Loveland are Food Preparation & Serving (554 | 8.3%), Cleaning & Maintenance (120 | 1.8%), Security & Protection (94 | 1.4%), Healthcare Support (80 | 1.2%), and Firefighting & Prevention (71 | 1.1%).
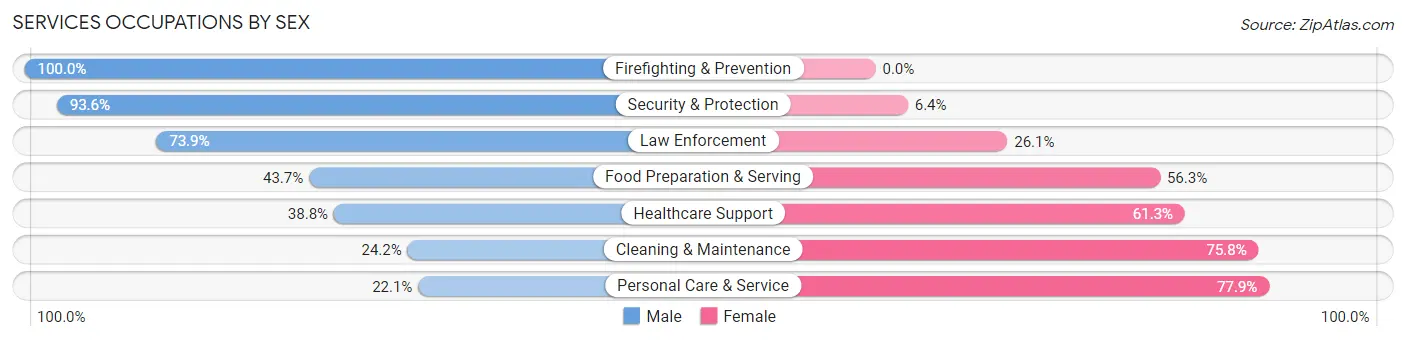
Services Occupations by Sex
Within the Services occupations in Loveland, the most male-oriented occupations are Firefighting & Prevention (100.0%), Security & Protection (93.6%), and Law Enforcement (73.9%), while the most female-oriented occupations are Personal Care & Service (77.9%), Cleaning & Maintenance (75.8%), and Healthcare Support (61.3%).
| Occupation | Male | Female |
| Healthcare Support | 31 (38.8%) | 49 (61.3%) |
| Security & Protection | 88 (93.6%) | 6 (6.4%) |
| Firefighting & Prevention | 71 (100.0%) | 0 (0.0%) |
| Law Enforcement | 17 (73.9%) | 6 (26.1%) |
| Food Preparation & Serving | 242 (43.7%) | 312 (56.3%) |
| Cleaning & Maintenance | 29 (24.2%) | 91 (75.8%) |
| Personal Care & Service | 15 (22.1%) | 53 (77.9%) |
| Total (Category) | 405 (44.2%) | 511 (55.8%) |
| Total (Overall) | 3,333 (49.7%) | 3,378 (50.3%) |
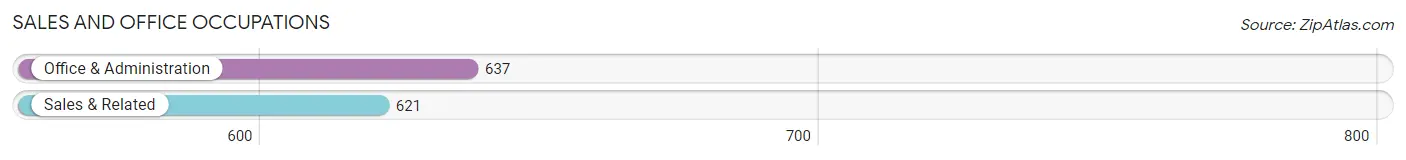
Sales and Office Occupations
The most common Sales and Office occupations in Loveland are Office & Administration (637 | 9.5%), and Sales & Related (621 | 9.2%).
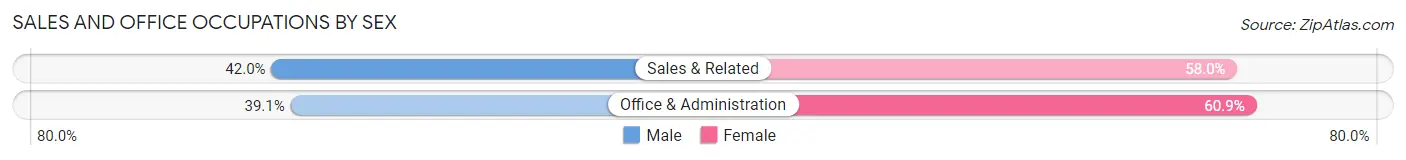
Sales and Office Occupations by Sex
| Occupation | Male | Female |
| Sales & Related | 261 (42.0%) | 360 (58.0%) |
| Office & Administration | 249 (39.1%) | 388 (60.9%) |
| Total (Category) | 510 (40.5%) | 748 (59.5%) |
| Total (Overall) | 3,333 (49.7%) | 3,378 (50.3%) |
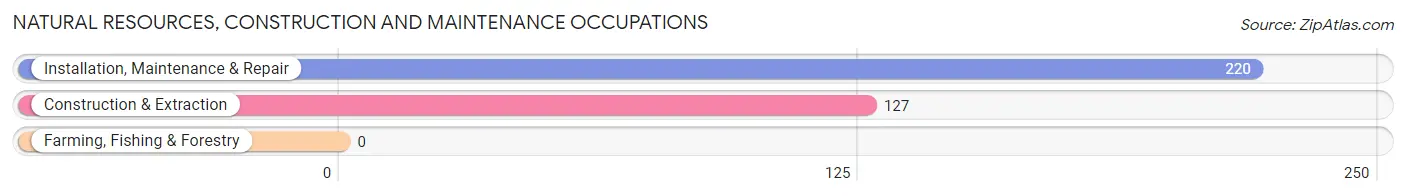
Natural Resources, Construction and Maintenance Occupations
The most common Natural Resources, Construction and Maintenance occupations in Loveland are Installation, Maintenance & Repair (220 | 3.3%), and Construction & Extraction (127 | 1.9%).
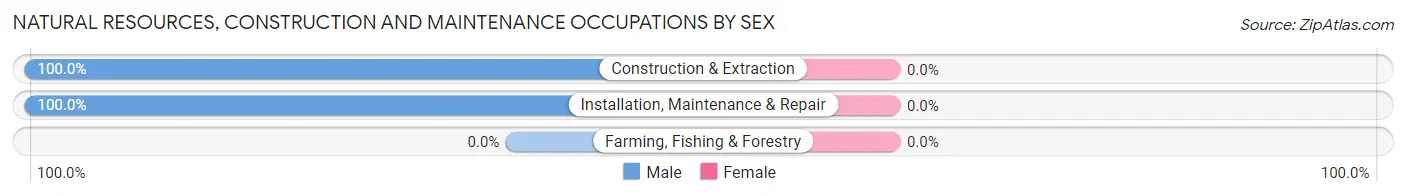
Natural Resources, Construction and Maintenance Occupations by Sex
| Occupation | Male | Female |
| Farming, Fishing & Forestry | 0 (0.0%) | 0 (0.0%) |
| Construction & Extraction | 127 (100.0%) | 0 (0.0%) |
| Installation, Maintenance & Repair | 220 (100.0%) | 0 (0.0%) |
| Total (Category) | 347 (100.0%) | 0 (0.0%) |
| Total (Overall) | 3,333 (49.7%) | 3,378 (50.3%) |
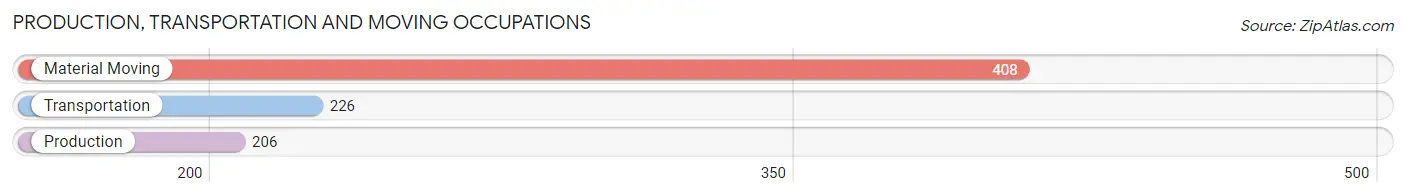
Production, Transportation and Moving Occupations
The most common Production, Transportation and Moving occupations in Loveland are Material Moving (408 | 6.1%), Transportation (226 | 3.4%), and Production (206 | 3.1%).
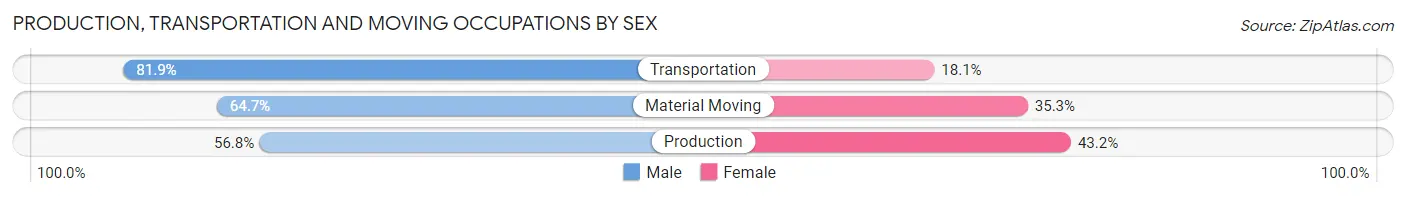
Production, Transportation and Moving Occupations by Sex
| Occupation | Male | Female |
| Production | 117 (56.8%) | 89 (43.2%) |
| Transportation | 185 (81.9%) | 41 (18.1%) |
| Material Moving | 264 (64.7%) | 144 (35.3%) |
| Total (Category) | 566 (67.4%) | 274 (32.6%) |
| Total (Overall) | 3,333 (49.7%) | 3,378 (50.3%) |
Employment Industries by Sex in Loveland
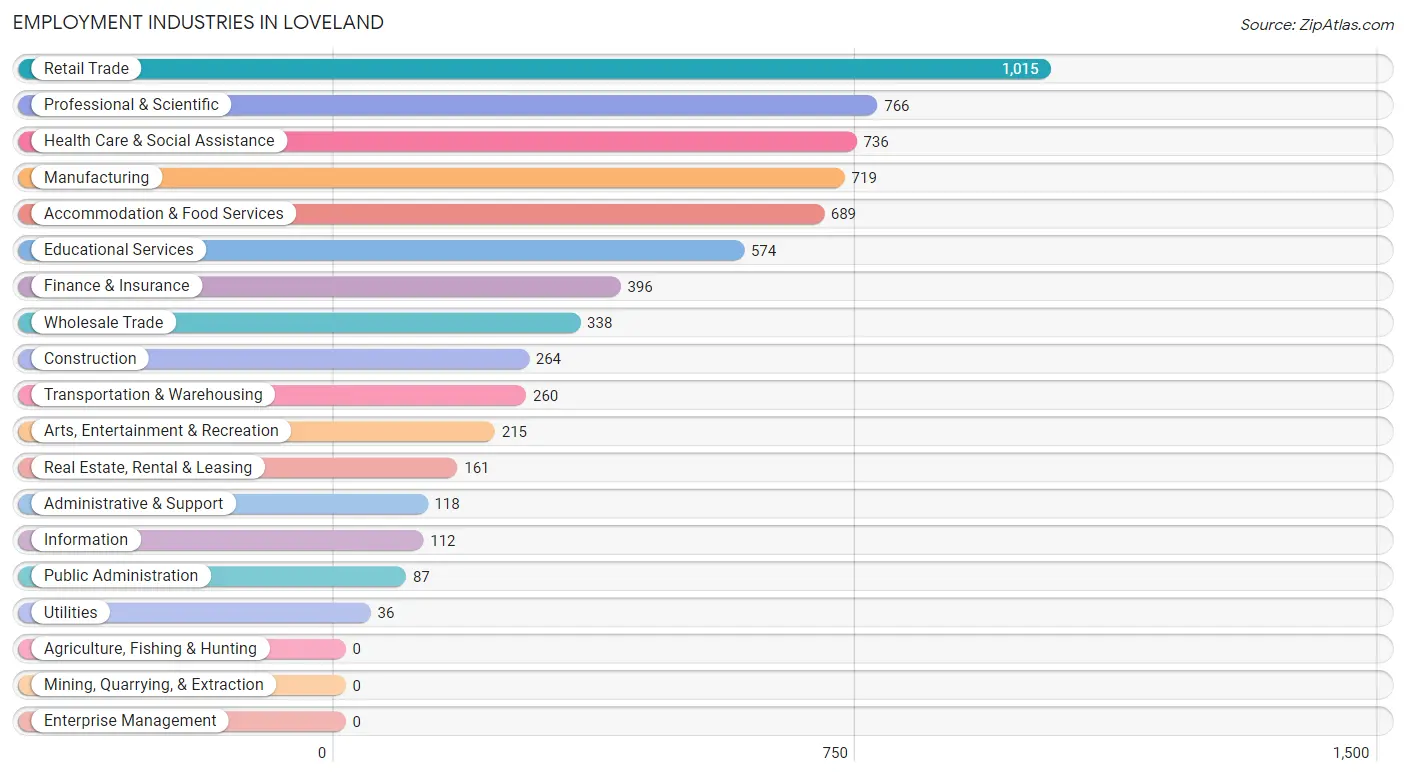
Employment Industries in Loveland
The major employment industries in Loveland include Retail Trade (1,015 | 15.1%), Professional & Scientific (766 | 11.4%), Health Care & Social Assistance (736 | 11.0%), Manufacturing (719 | 10.7%), and Accommodation & Food Services (689 | 10.3%).
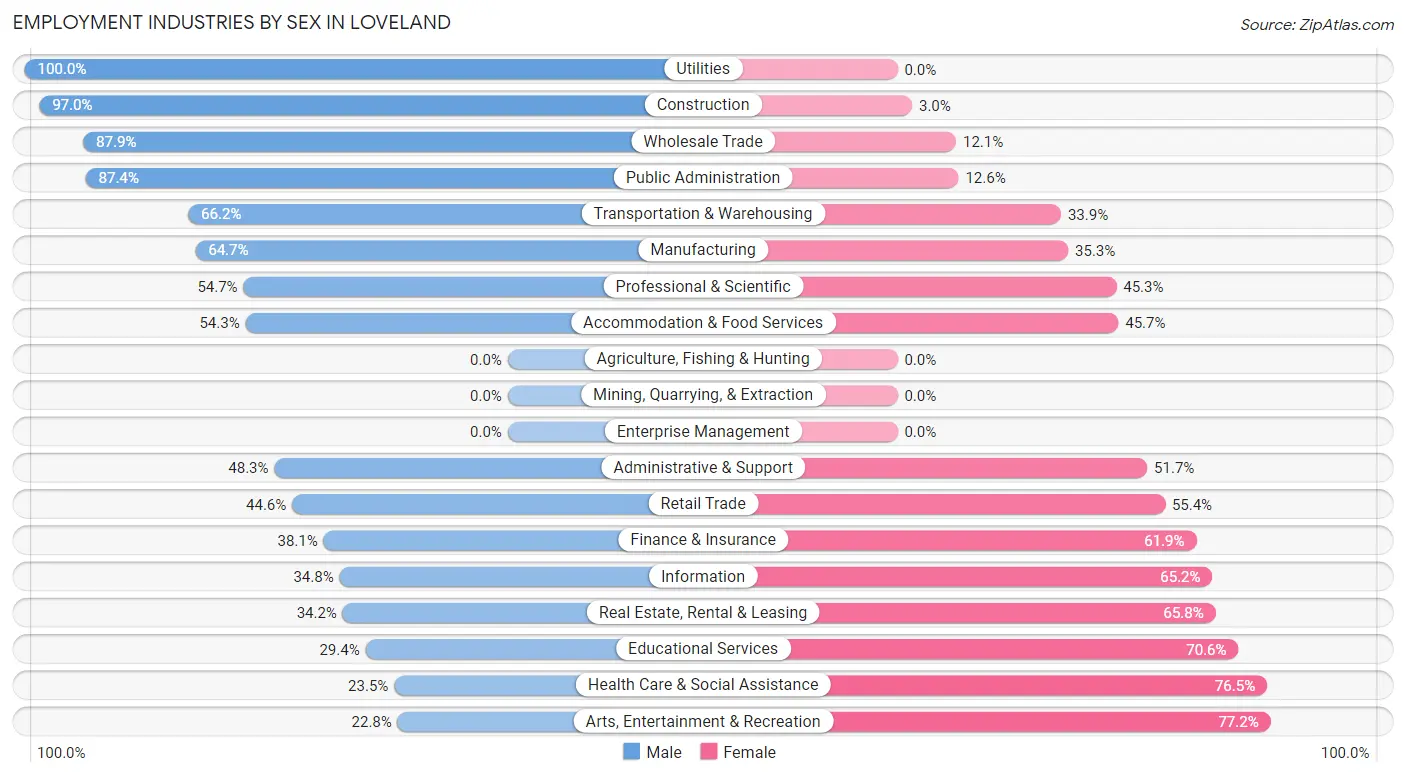
Employment Industries by Sex in Loveland
The Loveland industries that see more men than women are Utilities (100.0%), Construction (97.0%), and Wholesale Trade (87.9%), whereas the industries that tend to have a higher number of women are Arts, Entertainment & Recreation (77.2%), Health Care & Social Assistance (76.5%), and Educational Services (70.6%).
| Industry | Male | Female |
| Agriculture, Fishing & Hunting | 0 (0.0%) | 0 (0.0%) |
| Mining, Quarrying, & Extraction | 0 (0.0%) | 0 (0.0%) |
| Construction | 256 (97.0%) | 8 (3.0%) |
| Manufacturing | 465 (64.7%) | 254 (35.3%) |
| Wholesale Trade | 297 (87.9%) | 41 (12.1%) |
| Retail Trade | 453 (44.6%) | 562 (55.4%) |
| Transportation & Warehousing | 172 (66.1%) | 88 (33.9%) |
| Utilities | 36 (100.0%) | 0 (0.0%) |
| Information | 39 (34.8%) | 73 (65.2%) |
| Finance & Insurance | 151 (38.1%) | 245 (61.9%) |
| Real Estate, Rental & Leasing | 55 (34.2%) | 106 (65.8%) |
| Professional & Scientific | 419 (54.7%) | 347 (45.3%) |
| Enterprise Management | 0 (0.0%) | 0 (0.0%) |
| Administrative & Support | 57 (48.3%) | 61 (51.7%) |
| Educational Services | 169 (29.4%) | 405 (70.6%) |
| Health Care & Social Assistance | 173 (23.5%) | 563 (76.5%) |
| Arts, Entertainment & Recreation | 49 (22.8%) | 166 (77.2%) |
| Accommodation & Food Services | 374 (54.3%) | 315 (45.7%) |
| Public Administration | 76 (87.4%) | 11 (12.6%) |
| Total | 3,333 (49.7%) | 3,378 (50.3%) |
Education in Loveland
School Enrollment in Loveland
The most common levels of schooling among the 3,924 students in Loveland are high school (1,203 | 30.7%), elementary school (886 | 22.6%), and college / undergraduate (593 | 15.1%).
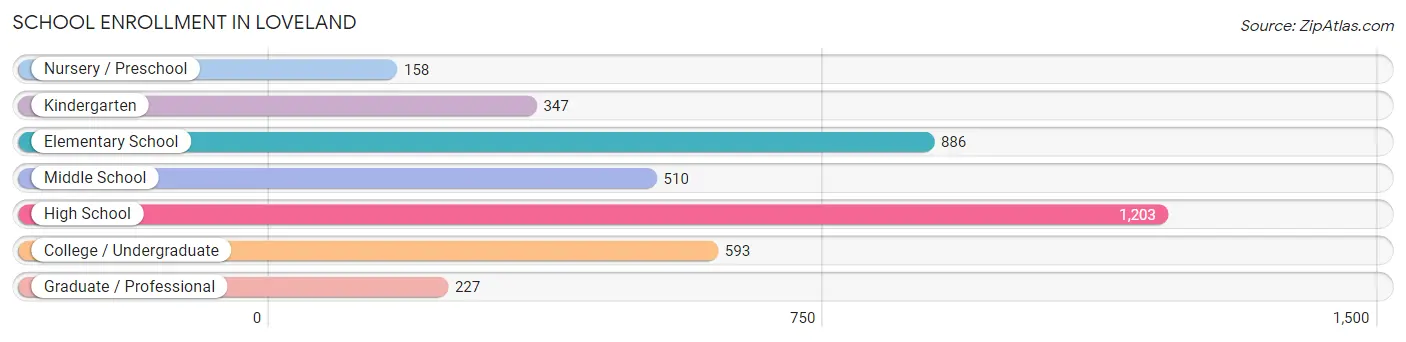
| School Level | # Students | % Students |
| Nursery / Preschool | 158 | 4.0% |
| Kindergarten | 347 | 8.8% |
| Elementary School | 886 | 22.6% |
| Middle School | 510 | 13.0% |
| High School | 1,203 | 30.7% |
| College / Undergraduate | 593 | 15.1% |
| Graduate / Professional | 227 | 5.8% |
| Total | 3,924 | 100.0% |
School Enrollment by Age by Funding Source in Loveland
Out of a total of 3,924 students who are enrolled in schools in Loveland, 789 (20.1%) attend a private institution, while the remaining 3,135 (79.9%) are enrolled in public schools. The age group of 3 to 4 year olds has the highest likelihood of being enrolled in private schools, with 72 (67.3% in the age bracket) enrolled. Conversely, the age group of 5 to 9 year old has the lowest likelihood of being enrolled in a private school, with 1,038 (91.5% in the age bracket) attending a public institution.
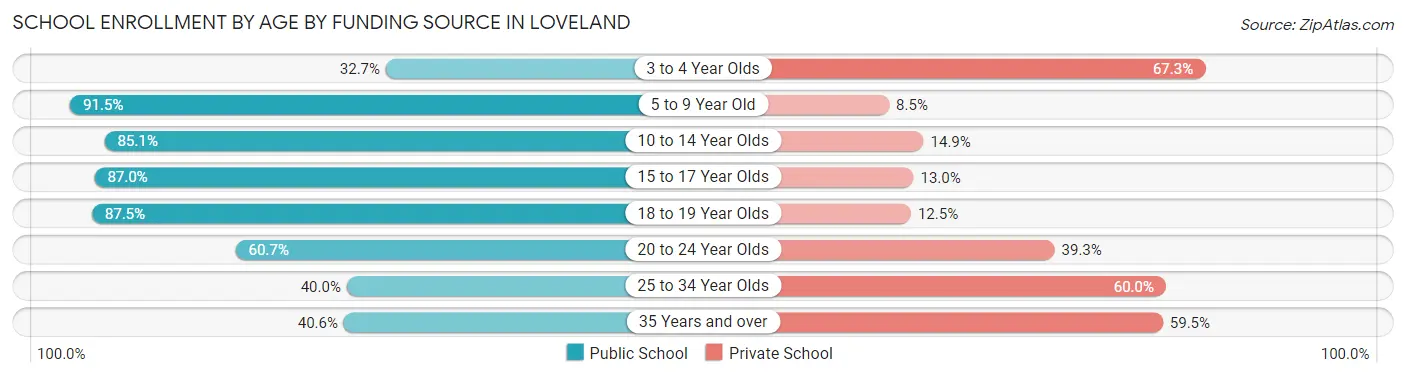
| Age Bracket | Public School | Private School |
| 3 to 4 Year Olds | 35 (32.7%) | 72 (67.3%) |
| 5 to 9 Year Old | 1,038 (91.5%) | 96 (8.5%) |
| 10 to 14 Year Olds | 783 (85.1%) | 137 (14.9%) |
| 15 to 17 Year Olds | 688 (87.0%) | 103 (13.0%) |
| 18 to 19 Year Olds | 286 (87.5%) | 41 (12.5%) |
| 20 to 24 Year Olds | 136 (60.7%) | 88 (39.3%) |
| 25 to 34 Year Olds | 52 (40.0%) | 78 (60.0%) |
| 35 Years and over | 118 (40.6%) | 173 (59.5%) |
| Total | 3,135 (79.9%) | 789 (20.1%) |
Educational Attainment by Field of Study in Loveland
Business (1,069 | 23.7%), education (554 | 12.3%), engineering (472 | 10.5%), science & technology (434 | 9.6%), and visual & performing arts (295 | 6.5%) are the most common fields of study among 4,513 individuals in Loveland who have obtained a bachelor's degree or higher.
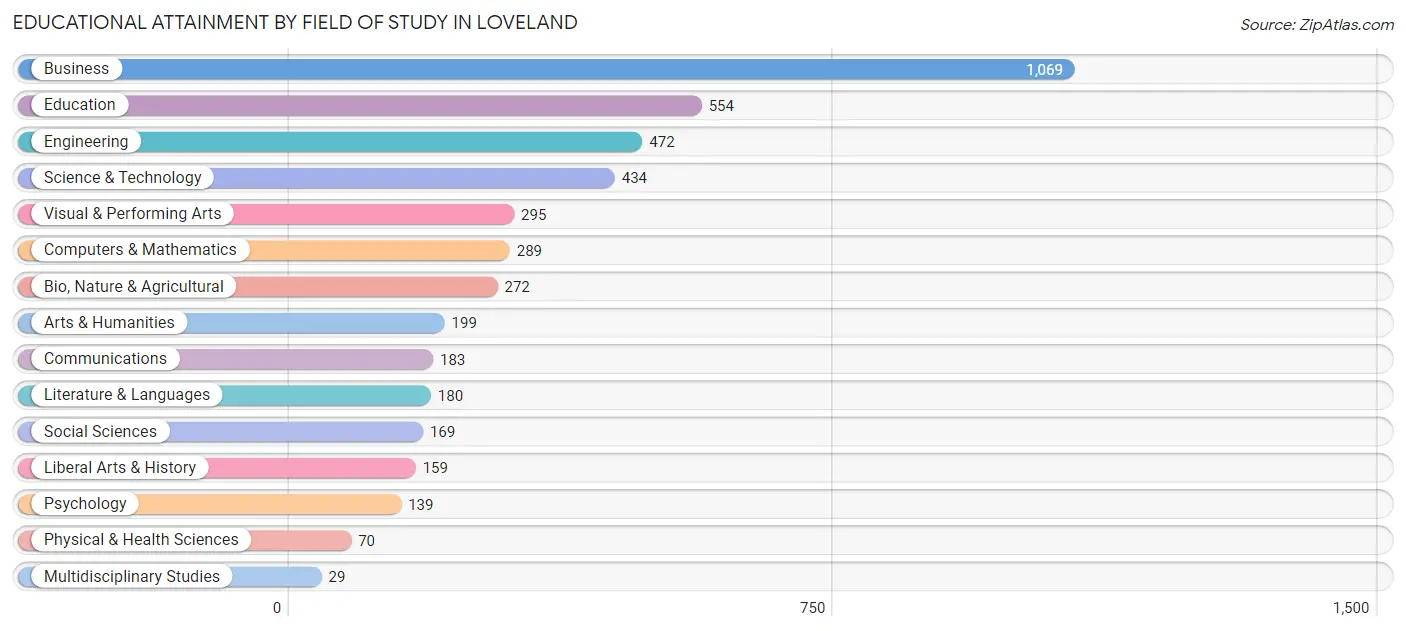
| Field of Study | # Graduates | % Graduates |
| Computers & Mathematics | 289 | 6.4% |
| Bio, Nature & Agricultural | 272 | 6.0% |
| Physical & Health Sciences | 70 | 1.5% |
| Psychology | 139 | 3.1% |
| Social Sciences | 169 | 3.7% |
| Engineering | 472 | 10.5% |
| Multidisciplinary Studies | 29 | 0.6% |
| Science & Technology | 434 | 9.6% |
| Business | 1,069 | 23.7% |
| Education | 554 | 12.3% |
| Literature & Languages | 180 | 4.0% |
| Liberal Arts & History | 159 | 3.5% |
| Visual & Performing Arts | 295 | 6.5% |
| Communications | 183 | 4.1% |
| Arts & Humanities | 199 | 4.4% |
| Total | 4,513 | 100.0% |
Transportation & Commute in Loveland
Vehicle Availability by Sex in Loveland
The most prevalent vehicle ownership categories in Loveland are males with 2 vehicles (1,788, accounting for 54.3%) and females with 2 vehicles (1,570, making up 56.7%).
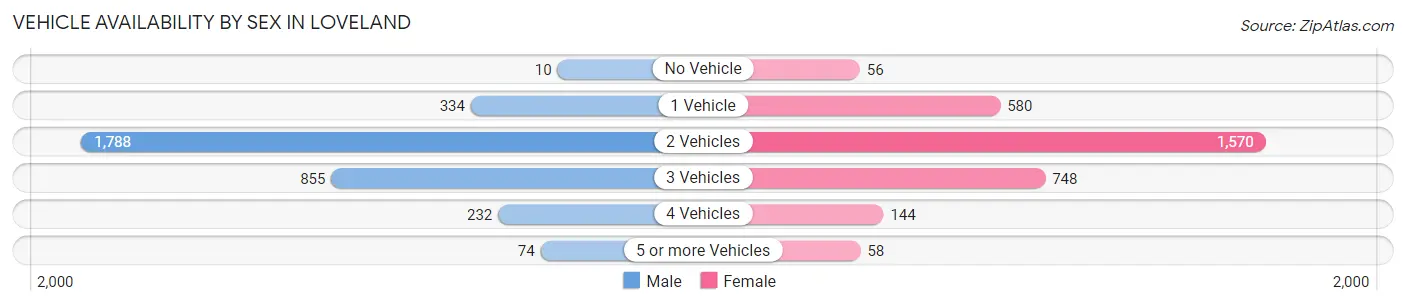
| Vehicles Available | Male | Female |
| No Vehicle | 10 (0.3%) | 56 (1.8%) |
| 1 Vehicle | 334 (10.1%) | 580 (18.4%) |
| 2 Vehicles | 1,788 (54.3%) | 1,570 (49.7%) |
| 3 Vehicles | 855 (26.0%) | 748 (23.7%) |
| 4 Vehicles | 232 (7.0%) | 144 (4.6%) |
| 5 or more Vehicles | 74 (2.2%) | 58 (1.8%) |
| Total | 3,293 (100.0%) | 3,156 (100.0%) |
Commute Time in Loveland
The most frequently occuring commute durations in Loveland are 15 to 19 minutes (1,098 commuters, 19.5%), 20 to 24 minutes (817 commuters, 14.5%), and 10 to 14 minutes (752 commuters, 13.4%).
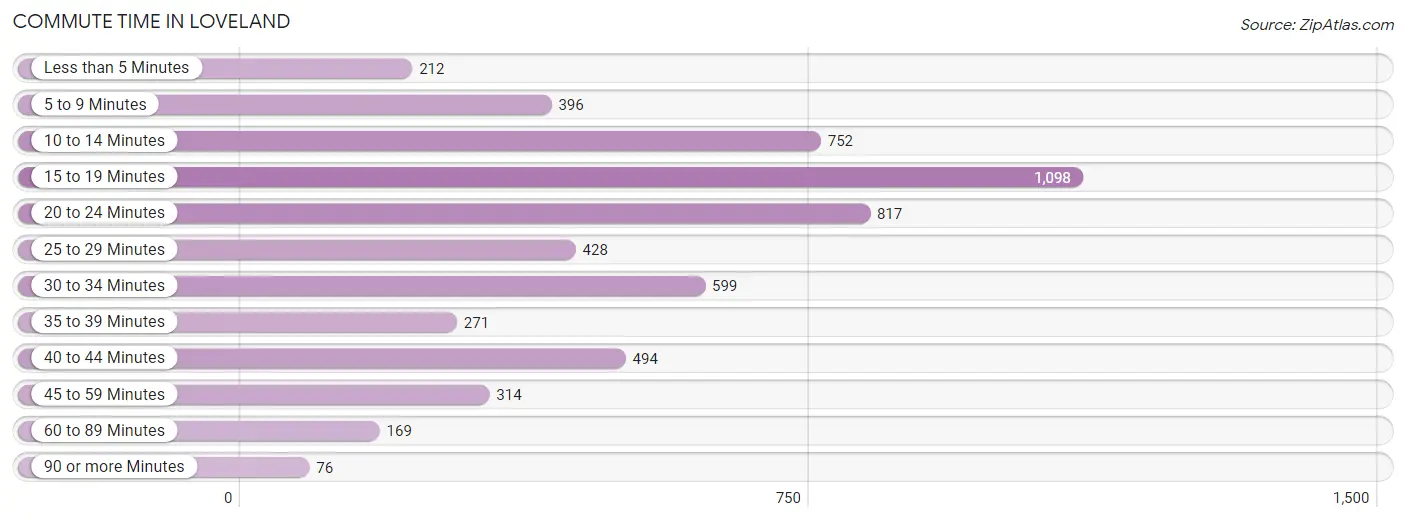
| Commute Time | # Commuters | % Commuters |
| Less than 5 Minutes | 212 | 3.8% |
| 5 to 9 Minutes | 396 | 7.0% |
| 10 to 14 Minutes | 752 | 13.4% |
| 15 to 19 Minutes | 1,098 | 19.5% |
| 20 to 24 Minutes | 817 | 14.5% |
| 25 to 29 Minutes | 428 | 7.6% |
| 30 to 34 Minutes | 599 | 10.6% |
| 35 to 39 Minutes | 271 | 4.8% |
| 40 to 44 Minutes | 494 | 8.8% |
| 45 to 59 Minutes | 314 | 5.6% |
| 60 to 89 Minutes | 169 | 3.0% |
| 90 or more Minutes | 76 | 1.3% |
Commute Time by Sex in Loveland
The most common commute times in Loveland are 20 to 24 minutes (500 commuters, 17.0%) for males and 15 to 19 minutes (627 commuters, 23.3%) for females.
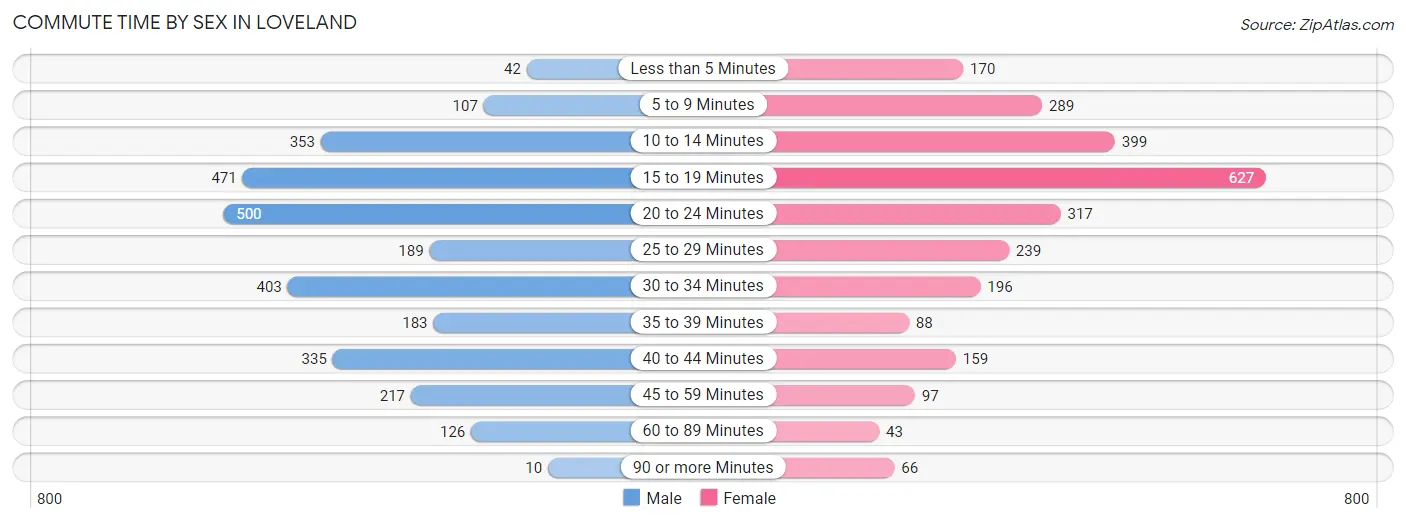
| Commute Time | Male | Female |
| Less than 5 Minutes | 42 (1.4%) | 170 (6.3%) |
| 5 to 9 Minutes | 107 (3.6%) | 289 (10.7%) |
| 10 to 14 Minutes | 353 (12.0%) | 399 (14.8%) |
| 15 to 19 Minutes | 471 (16.0%) | 627 (23.3%) |
| 20 to 24 Minutes | 500 (17.0%) | 317 (11.8%) |
| 25 to 29 Minutes | 189 (6.4%) | 239 (8.9%) |
| 30 to 34 Minutes | 403 (13.7%) | 196 (7.3%) |
| 35 to 39 Minutes | 183 (6.2%) | 88 (3.3%) |
| 40 to 44 Minutes | 335 (11.4%) | 159 (5.9%) |
| 45 to 59 Minutes | 217 (7.4%) | 97 (3.6%) |
| 60 to 89 Minutes | 126 (4.3%) | 43 (1.6%) |
| 90 or more Minutes | 10 (0.3%) | 66 (2.5%) |
Time of Departure to Work by Sex in Loveland
The most frequent times of departure to work in Loveland are 7:30 AM to 7:59 AM (481, 16.4%) for males and 6:30 AM to 6:59 AM (407, 15.1%) for females.
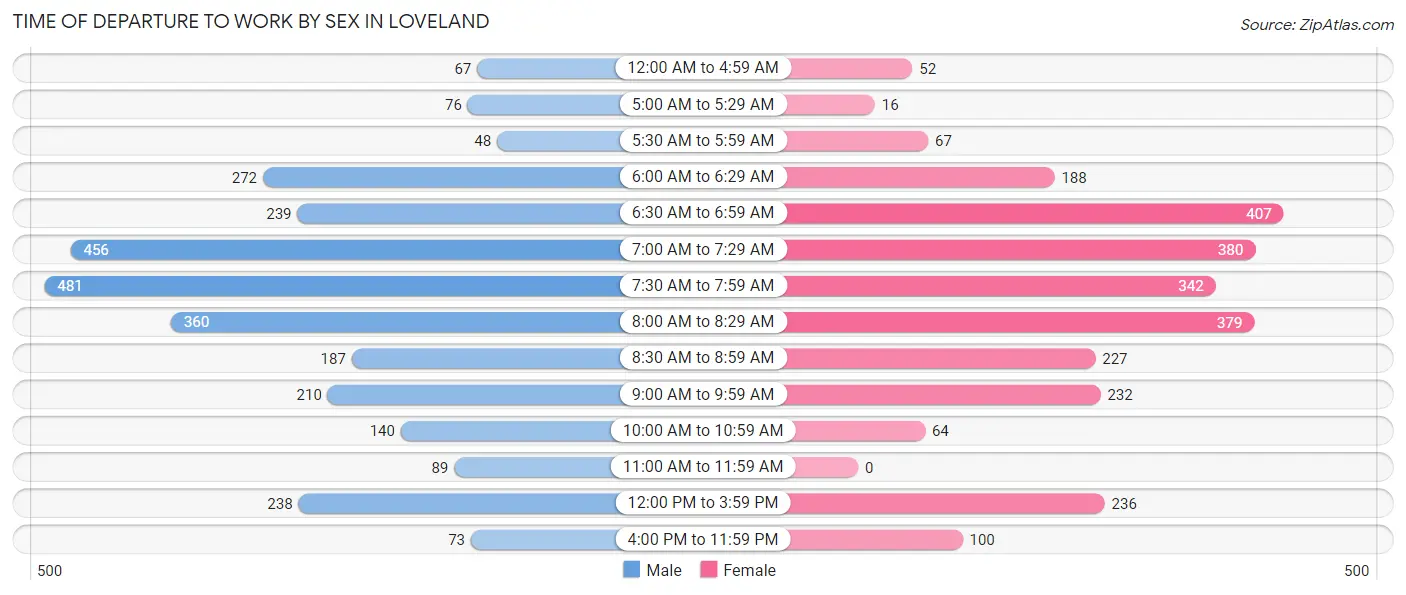
| Time of Departure | Male | Female |
| 12:00 AM to 4:59 AM | 67 (2.3%) | 52 (1.9%) |
| 5:00 AM to 5:29 AM | 76 (2.6%) | 16 (0.6%) |
| 5:30 AM to 5:59 AM | 48 (1.6%) | 67 (2.5%) |
| 6:00 AM to 6:29 AM | 272 (9.3%) | 188 (7.0%) |
| 6:30 AM to 6:59 AM | 239 (8.1%) | 407 (15.1%) |
| 7:00 AM to 7:29 AM | 456 (15.5%) | 380 (14.1%) |
| 7:30 AM to 7:59 AM | 481 (16.4%) | 342 (12.7%) |
| 8:00 AM to 8:29 AM | 360 (12.3%) | 379 (14.1%) |
| 8:30 AM to 8:59 AM | 187 (6.4%) | 227 (8.4%) |
| 9:00 AM to 9:59 AM | 210 (7.1%) | 232 (8.6%) |
| 10:00 AM to 10:59 AM | 140 (4.8%) | 64 (2.4%) |
| 11:00 AM to 11:59 AM | 89 (3.0%) | 0 (0.0%) |
| 12:00 PM to 3:59 PM | 238 (8.1%) | 236 (8.8%) |
| 4:00 PM to 11:59 PM | 73 (2.5%) | 100 (3.7%) |
| Total | 2,936 (100.0%) | 2,690 (100.0%) |
Housing Occupancy in Loveland
Occupancy by Ownership in Loveland
Of the total 5,094 dwellings in Loveland, owner-occupied units account for 3,628 (71.2%), while renter-occupied units make up 1,466 (28.8%).
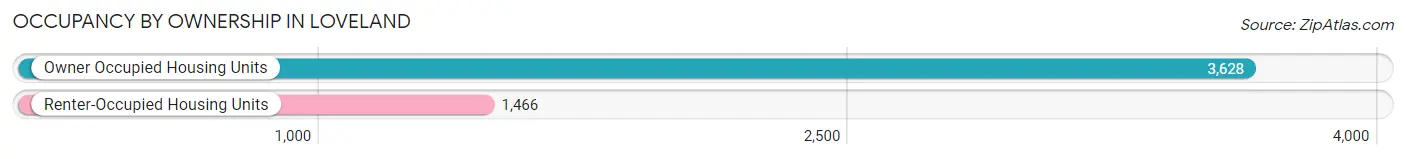
| Occupancy | # Housing Units | % Housing Units |
| Owner Occupied Housing Units | 3,628 | 71.2% |
| Renter-Occupied Housing Units | 1,466 | 28.8% |
| Total Occupied Housing Units | 5,094 | 100.0% |
Occupancy by Household Size in Loveland
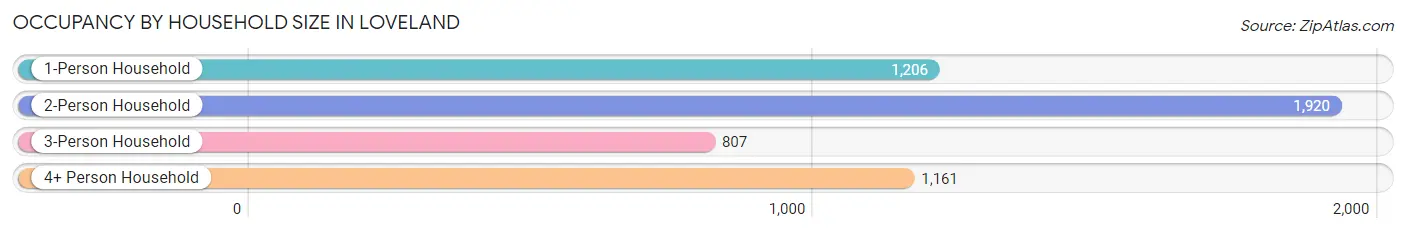
| Household Size | # Housing Units | % Housing Units |
| 1-Person Household | 1,206 | 23.7% |
| 2-Person Household | 1,920 | 37.7% |
| 3-Person Household | 807 | 15.8% |
| 4+ Person Household | 1,161 | 22.8% |
| Total Housing Units | 5,094 | 100.0% |
Occupancy by Ownership by Household Size in Loveland
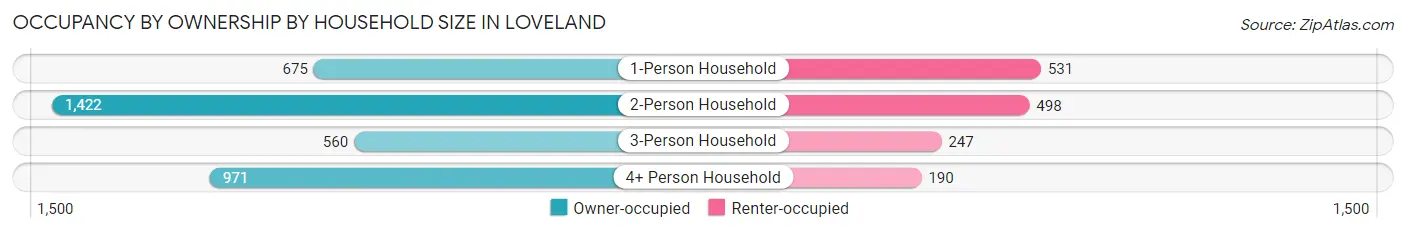
| Household Size | Owner-occupied | Renter-occupied |
| 1-Person Household | 675 (56.0%) | 531 (44.0%) |
| 2-Person Household | 1,422 (74.1%) | 498 (25.9%) |
| 3-Person Household | 560 (69.4%) | 247 (30.6%) |
| 4+ Person Household | 971 (83.6%) | 190 (16.4%) |
| Total Housing Units | 3,628 (71.2%) | 1,466 (28.8%) |
Occupancy by Educational Attainment in Loveland
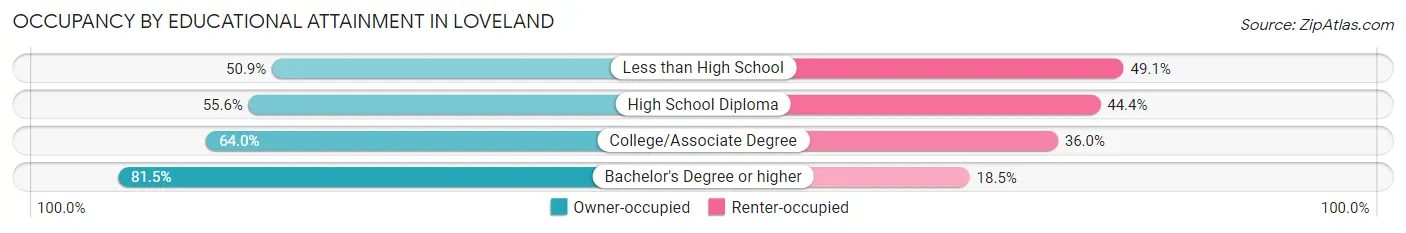
| Household Size | Owner-occupied | Renter-occupied |
| Less than High School | 110 (50.9%) | 106 (49.1%) |
| High School Diploma | 454 (55.6%) | 363 (44.4%) |
| College/Associate Degree | 894 (64.0%) | 503 (36.0%) |
| Bachelor's Degree or higher | 2,170 (81.5%) | 494 (18.5%) |
Occupancy by Age of Householder in Loveland
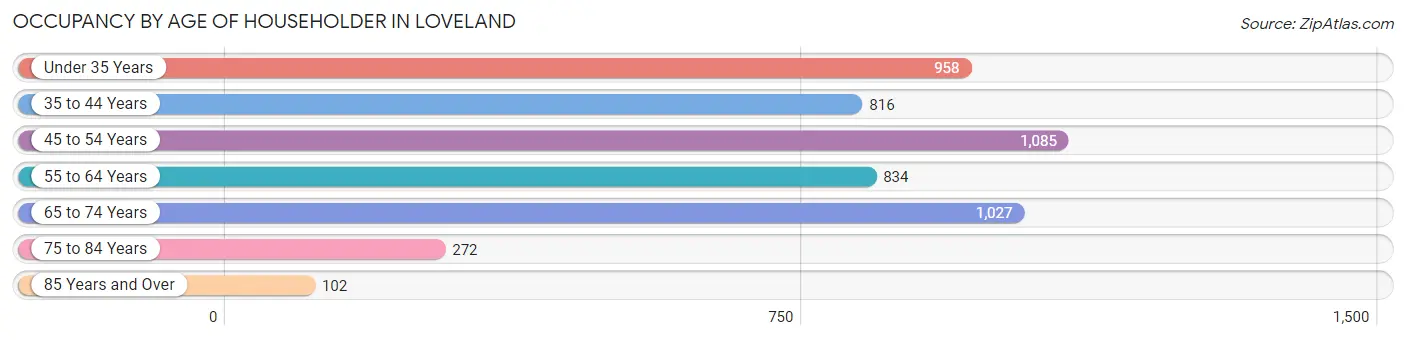
| Age Bracket | # Households | % Households |
| Under 35 Years | 958 | 18.8% |
| 35 to 44 Years | 816 | 16.0% |
| 45 to 54 Years | 1,085 | 21.3% |
| 55 to 64 Years | 834 | 16.4% |
| 65 to 74 Years | 1,027 | 20.2% |
| 75 to 84 Years | 272 | 5.3% |
| 85 Years and Over | 102 | 2.0% |
| Total | 5,094 | 100.0% |
Housing Finances in Loveland
Median Income by Occupancy in Loveland
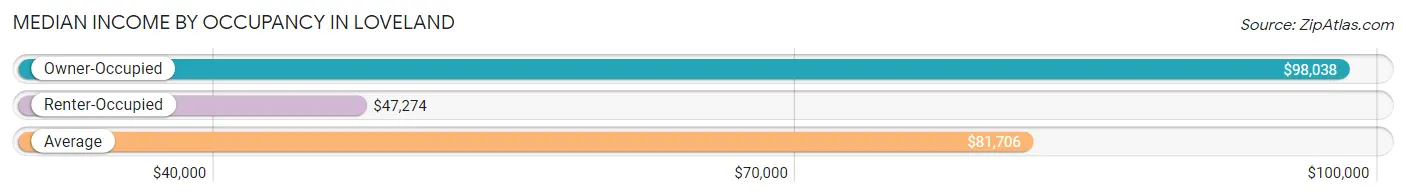
| Occupancy Type | # Households | Median Income |
| Owner-Occupied | 3,628 (71.2%) | $98,038 |
| Renter-Occupied | 1,466 (28.8%) | $47,274 |
| Average | 5,094 (100.0%) | $81,706 |
Occupancy by Householder Income Bracket in Loveland
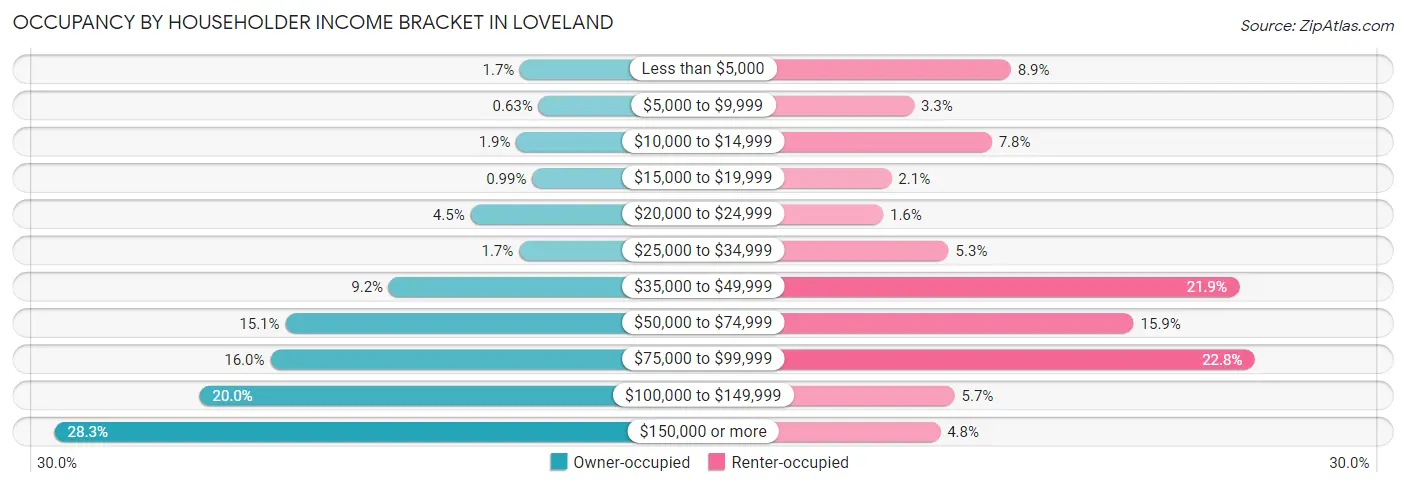
| Income Bracket | Owner-occupied | Renter-occupied |
| Less than $5,000 | 61 (1.7%) | 130 (8.9%) |
| $5,000 to $9,999 | 23 (0.6%) | 49 (3.3%) |
| $10,000 to $14,999 | 69 (1.9%) | 114 (7.8%) |
| $15,000 to $19,999 | 36 (1.0%) | 30 (2.1%) |
| $20,000 to $24,999 | 164 (4.5%) | 23 (1.6%) |
| $25,000 to $34,999 | 63 (1.7%) | 78 (5.3%) |
| $35,000 to $49,999 | 333 (9.2%) | 321 (21.9%) |
| $50,000 to $74,999 | 548 (15.1%) | 233 (15.9%) |
| $75,000 to $99,999 | 579 (16.0%) | 334 (22.8%) |
| $100,000 to $149,999 | 726 (20.0%) | 83 (5.7%) |
| $150,000 or more | 1,026 (28.3%) | 71 (4.8%) |
| Total | 3,628 (100.0%) | 1,466 (100.0%) |
Monthly Housing Cost Tiers in Loveland
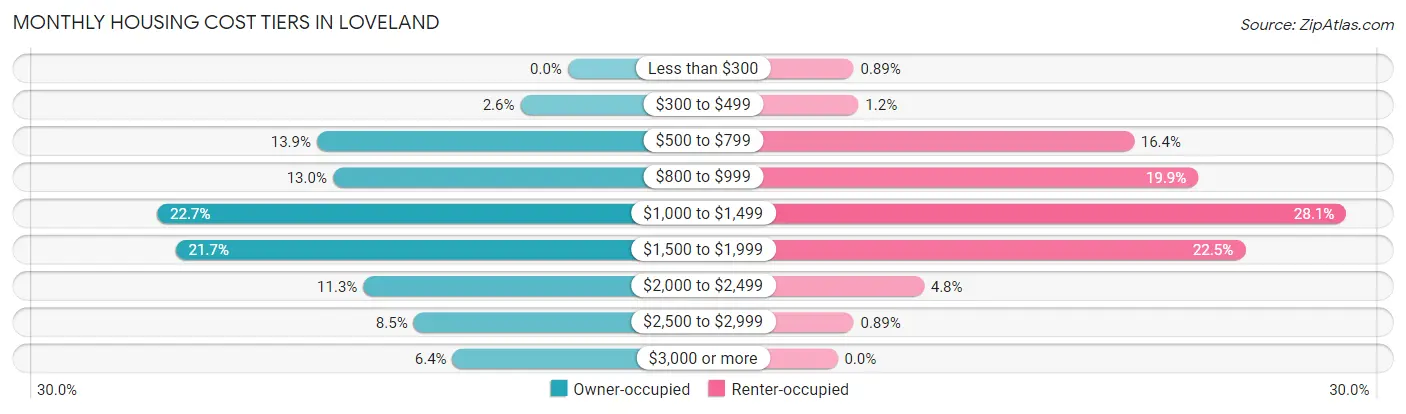
| Monthly Cost | Owner-occupied | Renter-occupied |
| Less than $300 | 0 (0.0%) | 13 (0.9%) |
| $300 to $499 | 95 (2.6%) | 17 (1.2%) |
| $500 to $799 | 503 (13.9%) | 240 (16.4%) |
| $800 to $999 | 471 (13.0%) | 292 (19.9%) |
| $1,000 to $1,499 | 823 (22.7%) | 412 (28.1%) |
| $1,500 to $1,999 | 786 (21.7%) | 330 (22.5%) |
| $2,000 to $2,499 | 410 (11.3%) | 70 (4.8%) |
| $2,500 to $2,999 | 309 (8.5%) | 13 (0.9%) |
| $3,000 or more | 231 (6.4%) | 0 (0.0%) |
| Total | 3,628 (100.0%) | 1,466 (100.0%) |
Physical Housing Characteristics in Loveland
Housing Structures in Loveland
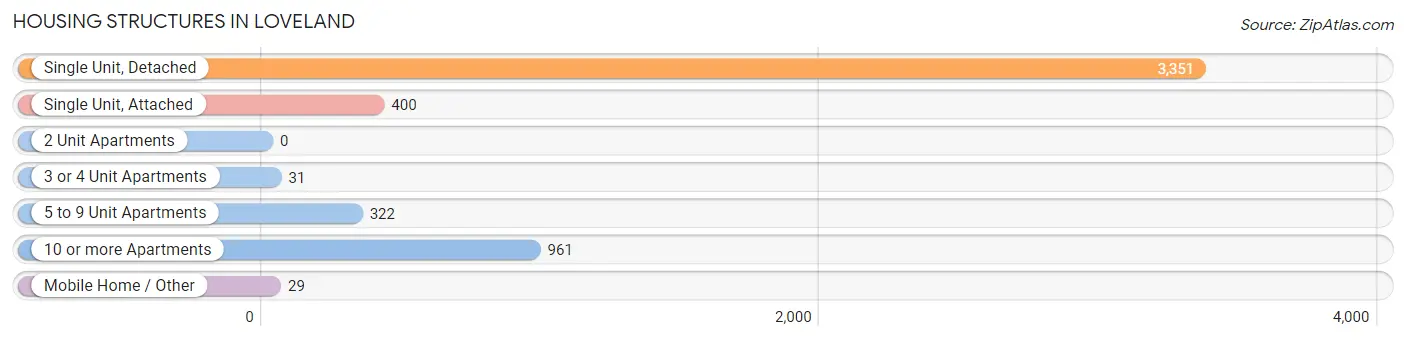
| Structure Type | # Housing Units | % Housing Units |
| Single Unit, Detached | 3,351 | 65.8% |
| Single Unit, Attached | 400 | 7.9% |
| 2 Unit Apartments | 0 | 0.0% |
| 3 or 4 Unit Apartments | 31 | 0.6% |
| 5 to 9 Unit Apartments | 322 | 6.3% |
| 10 or more Apartments | 961 | 18.9% |
| Mobile Home / Other | 29 | 0.6% |
| Total | 5,094 | 100.0% |
Housing Structures by Occupancy in Loveland
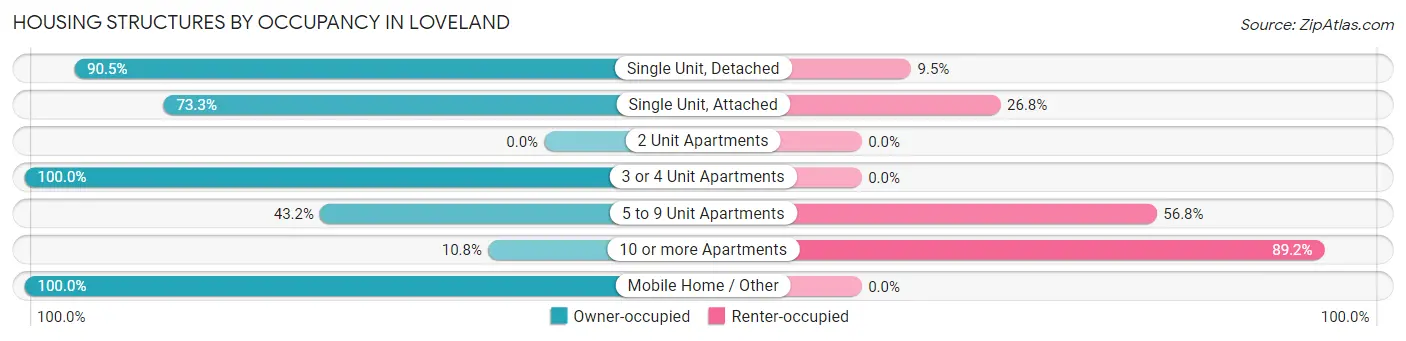
| Structure Type | Owner-occupied | Renter-occupied |
| Single Unit, Detached | 3,032 (90.5%) | 319 (9.5%) |
| Single Unit, Attached | 293 (73.3%) | 107 (26.8%) |
| 2 Unit Apartments | 0 (0.0%) | 0 (0.0%) |
| 3 or 4 Unit Apartments | 31 (100.0%) | 0 (0.0%) |
| 5 to 9 Unit Apartments | 139 (43.2%) | 183 (56.8%) |
| 10 or more Apartments | 104 (10.8%) | 857 (89.2%) |
| Mobile Home / Other | 29 (100.0%) | 0 (0.0%) |
| Total | 3,628 (71.2%) | 1,466 (28.8%) |
Housing Structures by Number of Rooms in Loveland
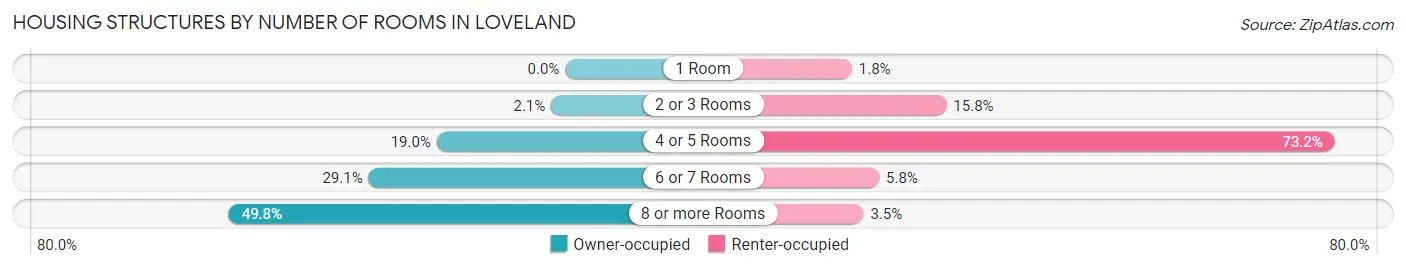
| Number of Rooms | Owner-occupied | Renter-occupied |
| 1 Room | 0 (0.0%) | 26 (1.8%) |
| 2 or 3 Rooms | 76 (2.1%) | 231 (15.8%) |
| 4 or 5 Rooms | 690 (19.0%) | 1,073 (73.2%) |
| 6 or 7 Rooms | 1,056 (29.1%) | 85 (5.8%) |
| 8 or more Rooms | 1,806 (49.8%) | 51 (3.5%) |
| Total | 3,628 (100.0%) | 1,466 (100.0%) |
Housing Structure by Heating Type in Loveland
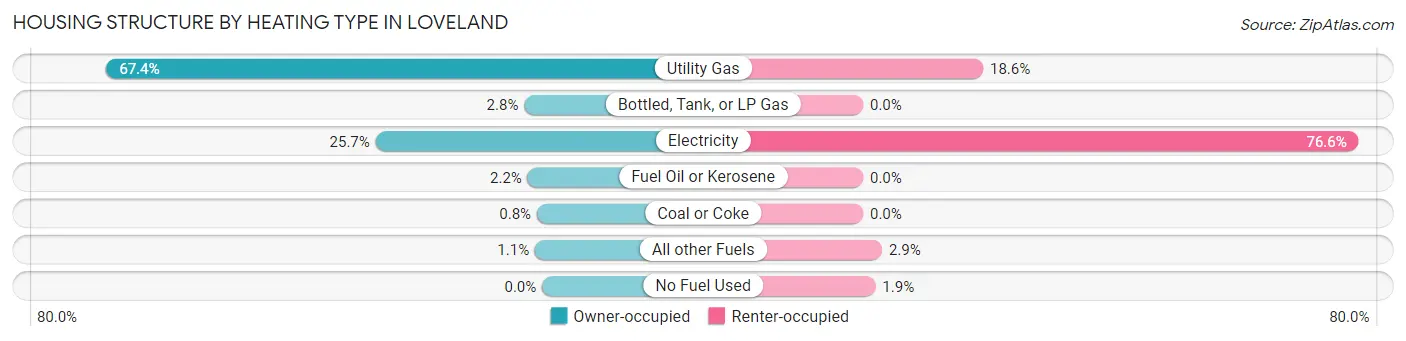
| Heating Type | Owner-occupied | Renter-occupied |
| Utility Gas | 2,444 (67.4%) | 272 (18.5%) |
| Bottled, Tank, or LP Gas | 100 (2.8%) | 0 (0.0%) |
| Electricity | 934 (25.7%) | 1,123 (76.6%) |
| Fuel Oil or Kerosene | 81 (2.2%) | 0 (0.0%) |
| Coal or Coke | 29 (0.8%) | 0 (0.0%) |
| All other Fuels | 40 (1.1%) | 43 (2.9%) |
| No Fuel Used | 0 (0.0%) | 28 (1.9%) |
| Total | 3,628 (100.0%) | 1,466 (100.0%) |
Household Vehicle Usage in Loveland
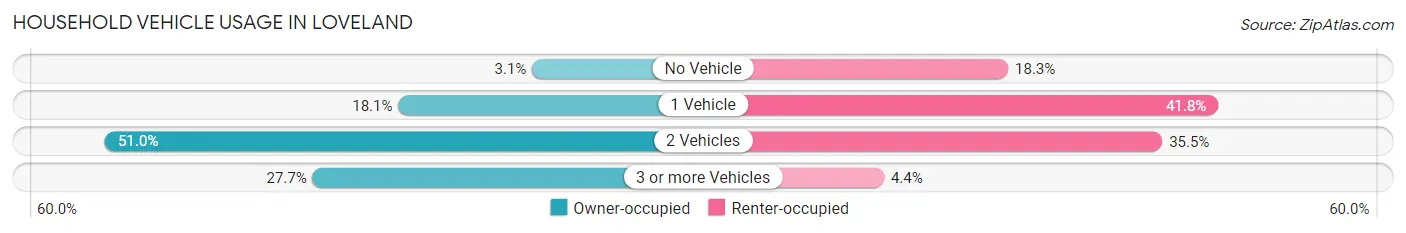
| Vehicles per Household | Owner-occupied | Renter-occupied |
| No Vehicle | 114 (3.1%) | 268 (18.3%) |
| 1 Vehicle | 658 (18.1%) | 613 (41.8%) |
| 2 Vehicles | 1,850 (51.0%) | 521 (35.5%) |
| 3 or more Vehicles | 1,006 (27.7%) | 64 (4.4%) |
| Total | 3,628 (100.0%) | 1,466 (100.0%) |
Real Estate & Mortgages in Loveland
Real Estate and Mortgage Overview in Loveland
| Characteristic | Without Mortgage | With Mortgage |
| Housing Units | 1,087 | 2,541 |
| Median Property Value | $279,000 | $271,200 |
| Median Household Income | $69,063 | $857 |
| Monthly Housing Costs | $788 | $231 |
| Real Estate Taxes | $4,386 | $31 |
Property Value by Mortgage Status in Loveland
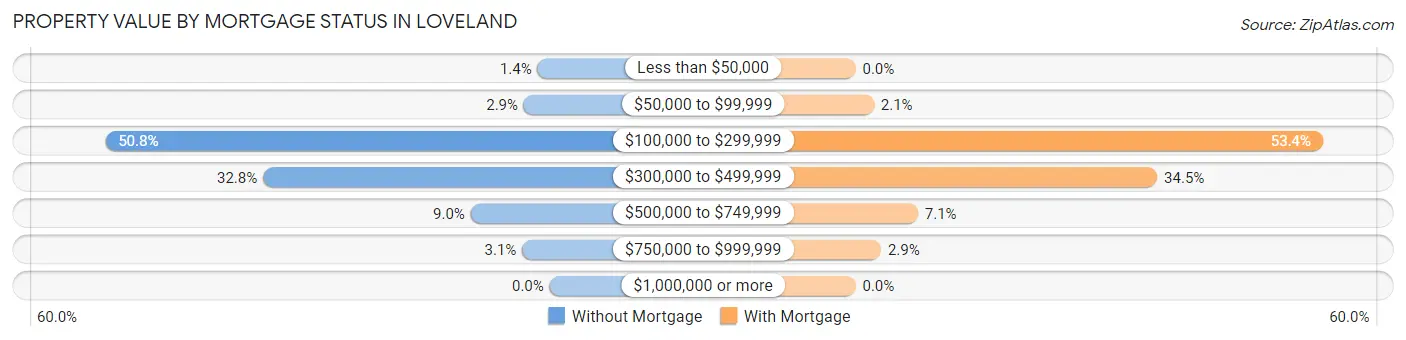
| Property Value | Without Mortgage | With Mortgage |
| Less than $50,000 | 15 (1.4%) | 0 (0.0%) |
| $50,000 to $99,999 | 32 (2.9%) | 53 (2.1%) |
| $100,000 to $299,999 | 552 (50.8%) | 1,357 (53.4%) |
| $300,000 to $499,999 | 356 (32.8%) | 876 (34.5%) |
| $500,000 to $749,999 | 98 (9.0%) | 181 (7.1%) |
| $750,000 to $999,999 | 34 (3.1%) | 74 (2.9%) |
| $1,000,000 or more | 0 (0.0%) | 0 (0.0%) |
| Total | 1,087 (100.0%) | 2,541 (100.0%) |
Household Income by Mortgage Status in Loveland
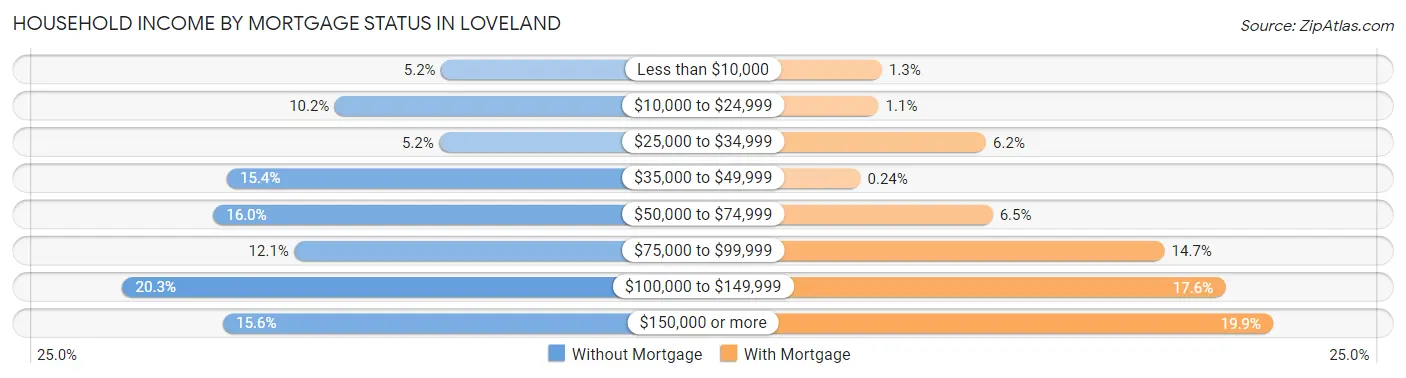
| Household Income | Without Mortgage | With Mortgage |
| Less than $10,000 | 56 (5.1%) | 32 (1.3%) |
| $10,000 to $24,999 | 111 (10.2%) | 28 (1.1%) |
| $25,000 to $34,999 | 57 (5.2%) | 158 (6.2%) |
| $35,000 to $49,999 | 167 (15.4%) | 6 (0.2%) |
| $50,000 to $74,999 | 174 (16.0%) | 166 (6.5%) |
| $75,000 to $99,999 | 132 (12.1%) | 374 (14.7%) |
| $100,000 to $149,999 | 221 (20.3%) | 447 (17.6%) |
| $150,000 or more | 169 (15.5%) | 505 (19.9%) |
| Total | 1,087 (100.0%) | 2,541 (100.0%) |
Property Value to Household Income Ratio in Loveland
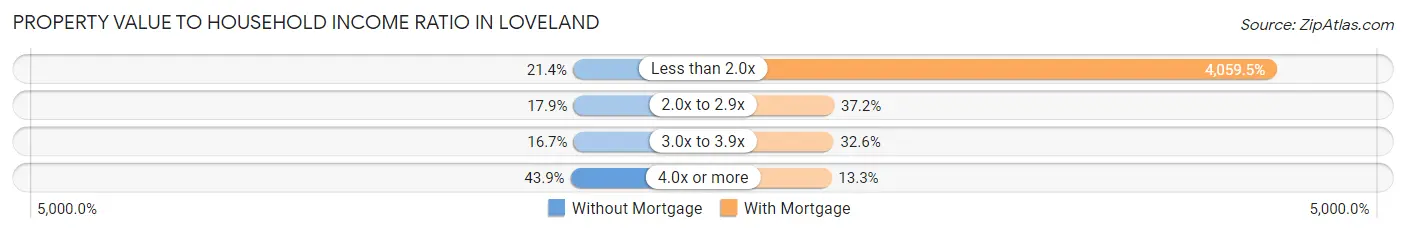
| Value-to-Income Ratio | Without Mortgage | With Mortgage |
| Less than 2.0x | 233 (21.4%) | 103,153 (4,059.5%) |
| 2.0x to 2.9x | 195 (17.9%) | 944 (37.1%) |
| 3.0x to 3.9x | 182 (16.7%) | 827 (32.6%) |
| 4.0x or more | 477 (43.9%) | 339 (13.3%) |
| Total | 1,087 (100.0%) | 2,541 (100.0%) |
Real Estate Taxes by Mortgage Status in Loveland
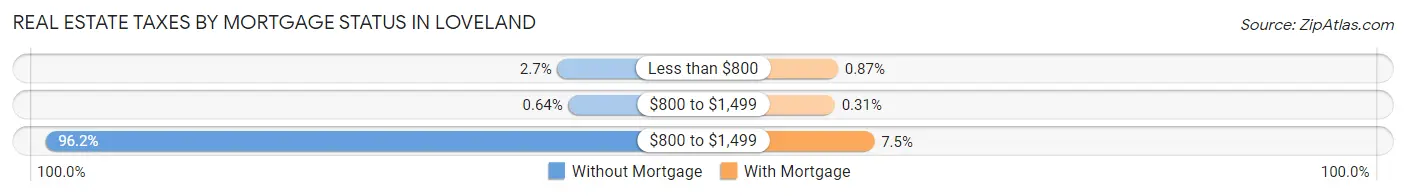
| Property Taxes | Without Mortgage | With Mortgage |
| Less than $800 | 29 (2.7%) | 22 (0.9%) |
| $800 to $1,499 | 7 (0.6%) | 8 (0.3%) |
| $800 to $1,499 | 1,046 (96.2%) | 191 (7.5%) |
| Total | 1,087 (100.0%) | 2,541 (100.0%) |
Health & Disability in Loveland
Health Insurance Coverage by Age in Loveland
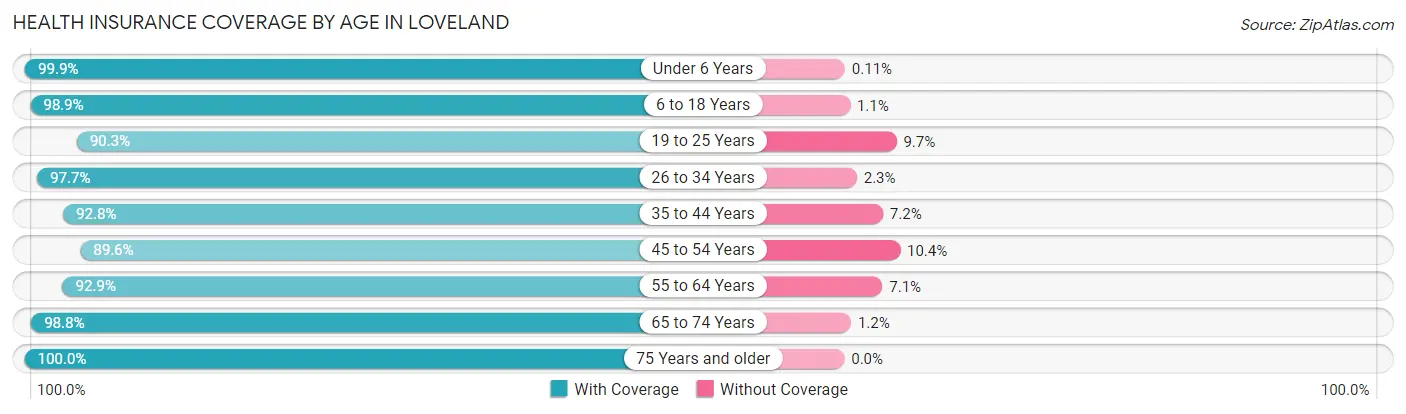
| Age Bracket | With Coverage | Without Coverage |
| Under 6 Years | 918 (99.9%) | 1 (0.1%) |
| 6 to 18 Years | 2,787 (98.9%) | 30 (1.1%) |
| 19 to 25 Years | 566 (90.3%) | 61 (9.7%) |
| 26 to 34 Years | 1,803 (97.7%) | 43 (2.3%) |
| 35 to 44 Years | 1,302 (92.8%) | 101 (7.2%) |
| 45 to 54 Years | 1,758 (89.6%) | 204 (10.4%) |
| 55 to 64 Years | 1,377 (92.9%) | 105 (7.1%) |
| 65 to 74 Years | 1,509 (98.8%) | 19 (1.2%) |
| 75 Years and older | 539 (100.0%) | 0 (0.0%) |
| Total | 12,559 (95.7%) | 564 (4.3%) |
Health Insurance Coverage by Citizenship Status in Loveland
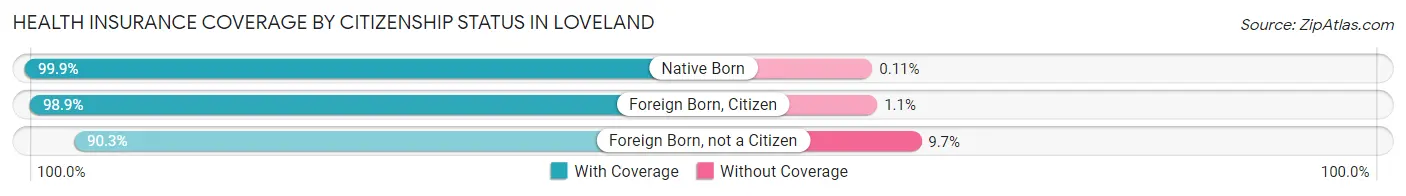
| Citizenship Status | With Coverage | Without Coverage |
| Native Born | 918 (99.9%) | 1 (0.1%) |
| Foreign Born, Citizen | 2,787 (98.9%) | 30 (1.1%) |
| Foreign Born, not a Citizen | 566 (90.3%) | 61 (9.7%) |
Health Insurance Coverage by Household Income in Loveland
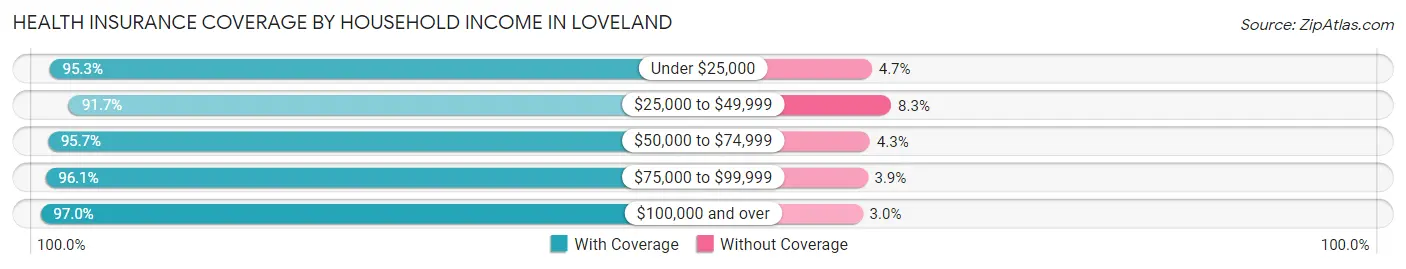
| Household Income | With Coverage | Without Coverage |
| Under $25,000 | 1,264 (95.3%) | 62 (4.7%) |
| $25,000 to $49,999 | 1,864 (91.7%) | 169 (8.3%) |
| $50,000 to $74,999 | 1,702 (95.7%) | 77 (4.3%) |
| $75,000 to $99,999 | 1,909 (96.1%) | 77 (3.9%) |
| $100,000 and over | 5,817 (97.0%) | 178 (3.0%) |
Public vs Private Health Insurance Coverage by Age in Loveland
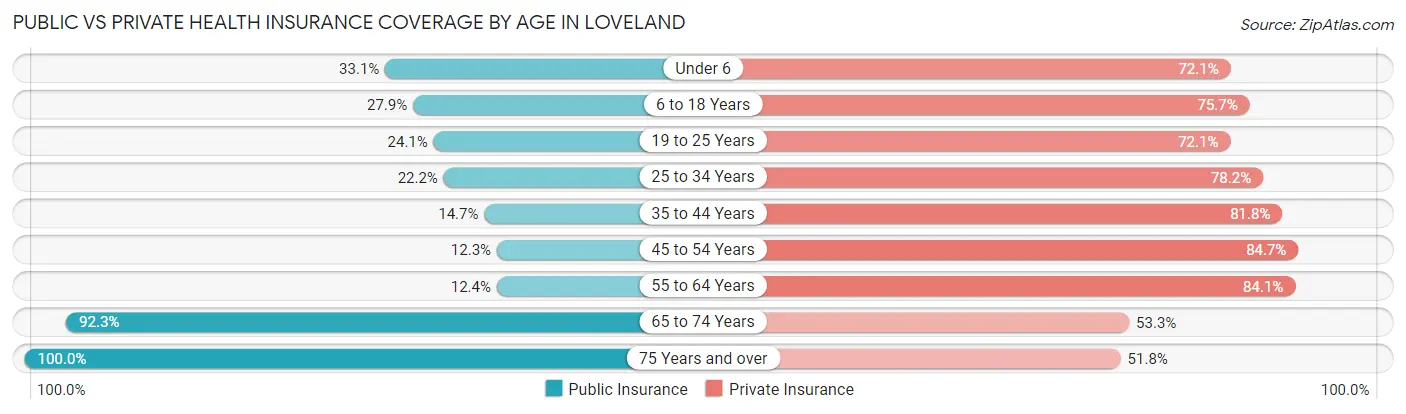
| Age Bracket | Public Insurance | Private Insurance |
| Under 6 | 304 (33.1%) | 663 (72.1%) |
| 6 to 18 Years | 786 (27.9%) | 2,132 (75.7%) |
| 19 to 25 Years | 151 (24.1%) | 452 (72.1%) |
| 25 to 34 Years | 410 (22.2%) | 1,443 (78.2%) |
| 35 to 44 Years | 206 (14.7%) | 1,147 (81.8%) |
| 45 to 54 Years | 242 (12.3%) | 1,662 (84.7%) |
| 55 to 64 Years | 183 (12.3%) | 1,247 (84.1%) |
| 65 to 74 Years | 1,410 (92.3%) | 815 (53.3%) |
| 75 Years and over | 539 (100.0%) | 279 (51.8%) |
| Total | 4,231 (32.2%) | 9,840 (75.0%) |
Disability Status by Sex by Age in Loveland
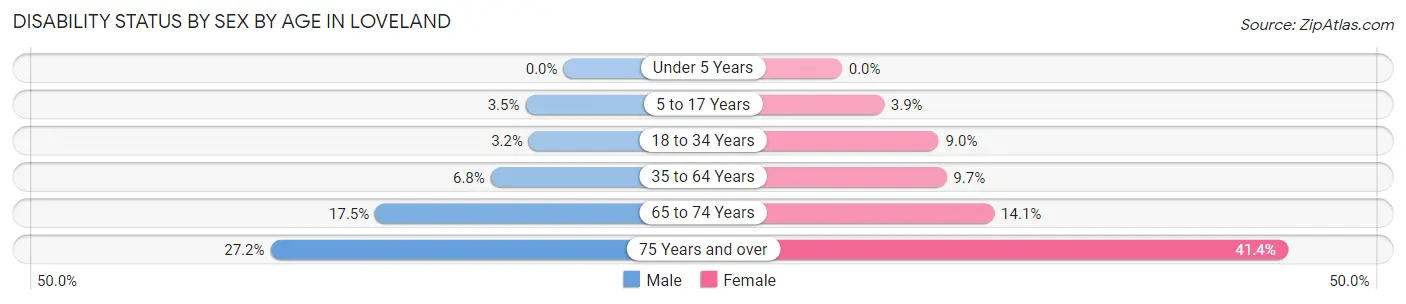
| Age Bracket | Male | Female |
| Under 5 Years | 0 (0.0%) | 0 (0.0%) |
| 5 to 17 Years | 47 (3.5%) | 61 (3.9%) |
| 18 to 34 Years | 38 (3.2%) | 134 (9.0%) |
| 35 to 64 Years | 161 (6.8%) | 239 (9.7%) |
| 65 to 74 Years | 131 (17.5%) | 110 (14.1%) |
| 75 Years and over | 71 (27.2%) | 115 (41.4%) |
Disability Class by Sex by Age in Loveland
Disability Class: Hearing Difficulty
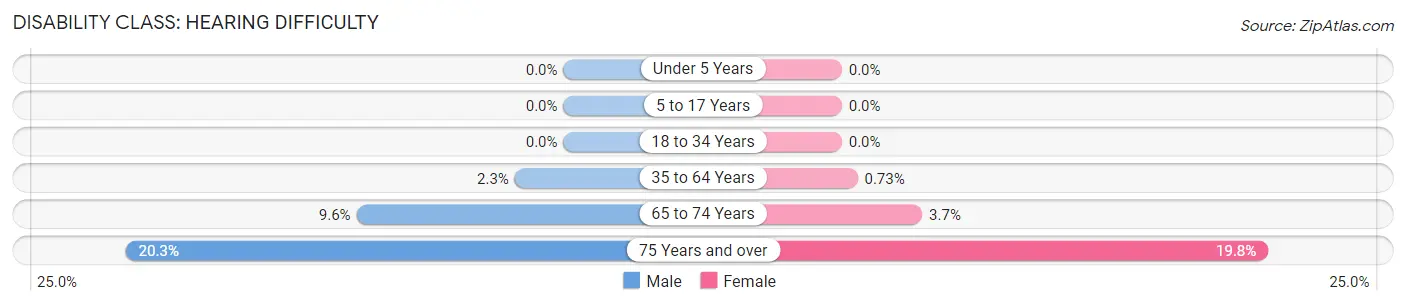
| Age Bracket | Male | Female |
| Under 5 Years | 0 (0.0%) | 0 (0.0%) |
| 5 to 17 Years | 0 (0.0%) | 0 (0.0%) |
| 18 to 34 Years | 0 (0.0%) | 0 (0.0%) |
| 35 to 64 Years | 54 (2.3%) | 18 (0.7%) |
| 65 to 74 Years | 72 (9.6%) | 29 (3.7%) |
| 75 Years and over | 53 (20.3%) | 55 (19.8%) |
Disability Class: Vision Difficulty
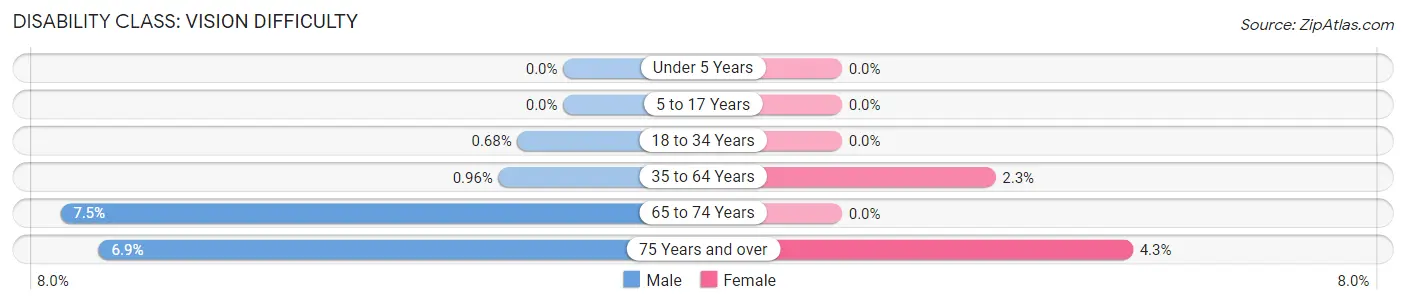
| Age Bracket | Male | Female |
| Under 5 Years | 0 (0.0%) | 0 (0.0%) |
| 5 to 17 Years | 0 (0.0%) | 0 (0.0%) |
| 18 to 34 Years | 8 (0.7%) | 0 (0.0%) |
| 35 to 64 Years | 23 (1.0%) | 56 (2.3%) |
| 65 to 74 Years | 56 (7.5%) | 0 (0.0%) |
| 75 Years and over | 18 (6.9%) | 12 (4.3%) |
Disability Class: Cognitive Difficulty
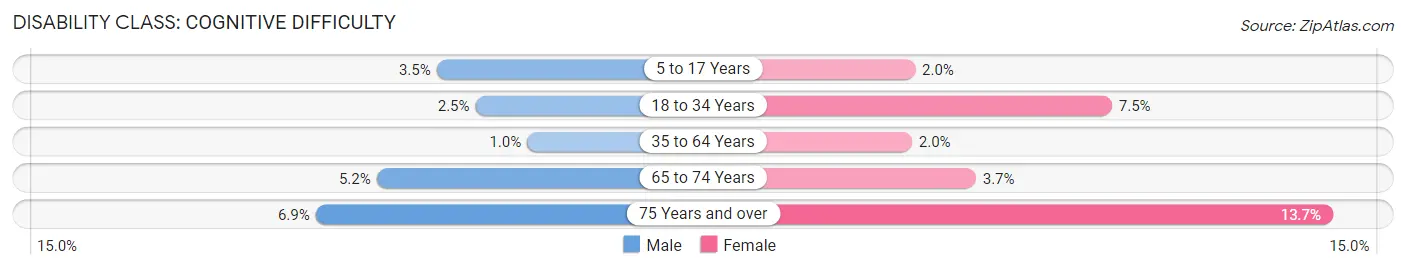
| Age Bracket | Male | Female |
| 5 to 17 Years | 47 (3.5%) | 32 (2.0%) |
| 18 to 34 Years | 29 (2.5%) | 112 (7.5%) |
| 35 to 64 Years | 24 (1.0%) | 48 (1.9%) |
| 65 to 74 Years | 39 (5.2%) | 29 (3.7%) |
| 75 Years and over | 18 (6.9%) | 38 (13.7%) |
Disability Class: Ambulatory Difficulty
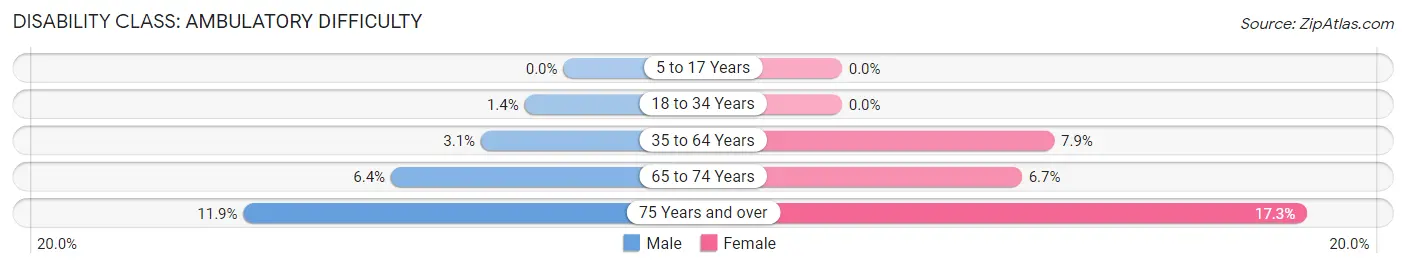
| Age Bracket | Male | Female |
| 5 to 17 Years | 0 (0.0%) | 0 (0.0%) |
| 18 to 34 Years | 17 (1.4%) | 0 (0.0%) |
| 35 to 64 Years | 73 (3.1%) | 194 (7.9%) |
| 65 to 74 Years | 48 (6.4%) | 52 (6.7%) |
| 75 Years and over | 31 (11.9%) | 48 (17.3%) |
Disability Class: Self-Care Difficulty
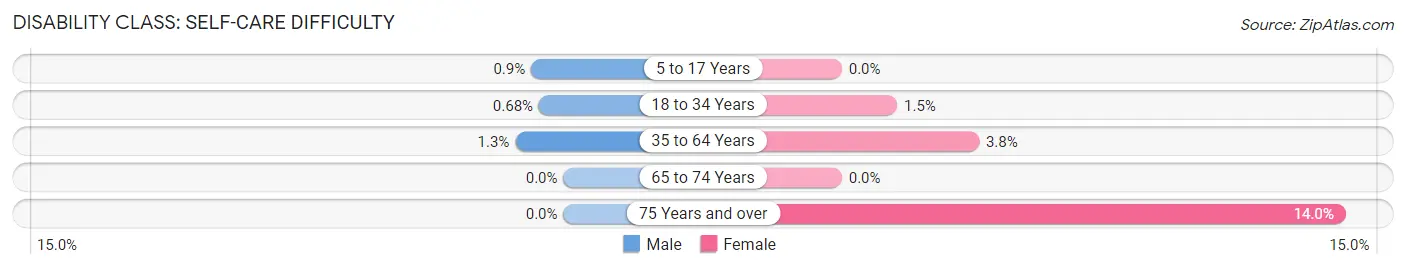
| Age Bracket | Male | Female |
| 5 to 17 Years | 12 (0.9%) | 0 (0.0%) |
| 18 to 34 Years | 8 (0.7%) | 23 (1.5%) |
| 35 to 64 Years | 32 (1.3%) | 94 (3.8%) |
| 65 to 74 Years | 0 (0.0%) | 0 (0.0%) |
| 75 Years and over | 0 (0.0%) | 39 (14.0%) |
Technology Access in Loveland
Computing Device Access in Loveland
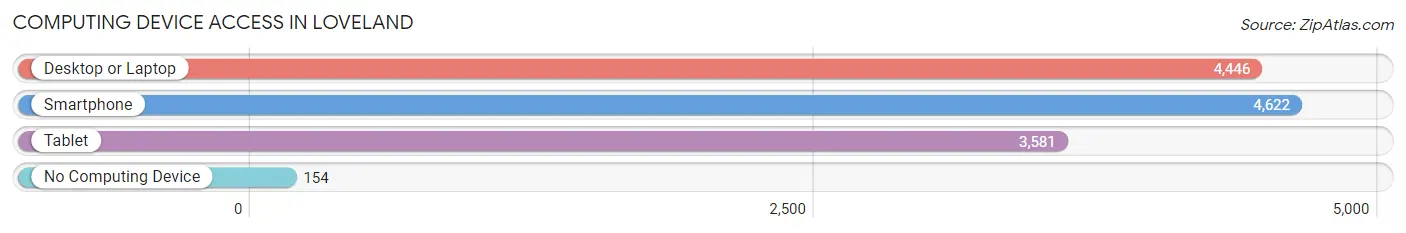
| Device Type | # Households | % Households |
| Desktop or Laptop | 4,446 | 87.3% |
| Smartphone | 4,622 | 90.7% |
| Tablet | 3,581 | 70.3% |
| No Computing Device | 154 | 3.0% |
| Total | 5,094 | 100.0% |
Internet Access in Loveland
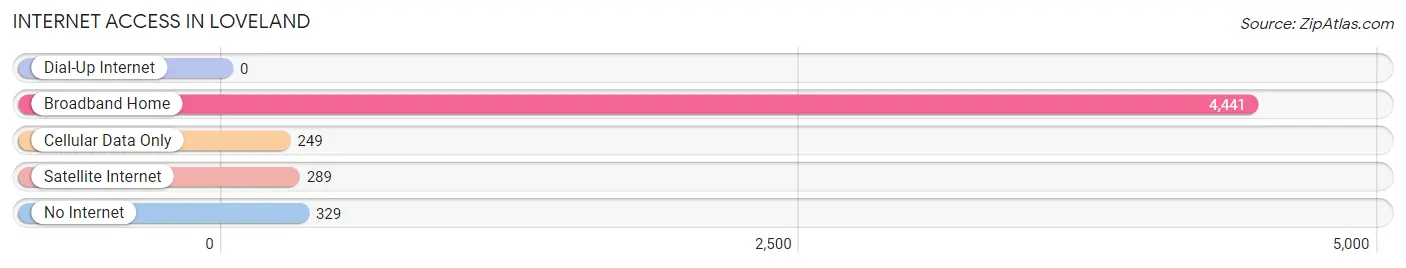
| Internet Type | # Households | % Households |
| Dial-Up Internet | 0 | 0.0% |
| Broadband Home | 4,441 | 87.2% |
| Cellular Data Only | 249 | 4.9% |
| Satellite Internet | 289 | 5.7% |
| No Internet | 329 | 6.5% |
| Total | 5,094 | 100.0% |
Loveland Summary
Loveland, Ohio is a city located in Hamilton and Clermont counties in the southwestern part of the state. It is part of the Cincinnati metropolitan area and is located about 20 miles northeast of downtown Cincinnati. The city has a population of 12,081 as of the 2010 census.
History
Loveland was founded in 1876 by William Loveland, a former Union Army officer. He purchased the land from the Symmes Purchase and named the town after himself. The town was incorporated in 1876 and was originally a farming community. In the late 19th century, the town began to grow as a result of the railroad and the development of the Miami and Erie Canal. The town was also home to a number of factories, including a paper mill, a flour mill, and a brickyard.
Geography
Loveland is located at 39°17'N 84°14'W (39.28, -84.23). According to the United States Census Bureau, the city has a total area of 4.3 square miles, all of it land. The city is located in the Little Miami River Valley and is surrounded by hills and valleys.
Economy
Loveland's economy is largely based on manufacturing and retail. The city is home to several large employers, including the Loveland-based Procter & Gamble, which employs over 1,000 people. Other major employers include the Loveland-based Cintas Corporation, which employs over 500 people, and the Loveland-based Kroger Company, which employs over 400 people. The city is also home to several smaller businesses, including restaurants, shops, and professional services.
Demographics
As of the 2010 census, there were 12,081 people, 4,845 households, and 3,092 families residing in the city. The population density was 2,811.3 people per square mile. The racial makeup of the city was 92.2% White, 3.2% African American, 0.3% Native American, 1.7% Asian, 0.1% Pacific Islander, 0.9% from other races, and 1.7% from two or more races. Hispanic or Latino of any race were 2.7% of the population.
The median income for a household in the city was $60,945, and the median income for a family was $71,945. The per capita income for the city was $30,945. About 4.2% of families and 5.7% of the population were below the poverty line, including 7.2% of those under age 18 and 4.2% of those age 65 or over.
Loveland is a diverse city with a strong sense of community. The city is home to a variety of businesses, restaurants, and shops, and is a popular destination for visitors. The city is also home to a number of parks and recreational areas, making it a great place to live and visit.
Common Questions
What is the Total Population of Loveland?
Total Population of Loveland is 13,247.
What is the Total Male Population of Loveland?
Total Male Population of Loveland is 6,283.
What is the Total Female Population of Loveland?
Total Female Population of Loveland is 6,964.
What is the Ratio of Males per 100 Females in Loveland?
There are 90.22 Males per 100 Females in Loveland.
What is the Ratio of Females per 100 Males in Loveland?
There are 110.84 Females per 100 Males in Loveland.
What is the Median Population Age in Loveland?
Median Population Age in Loveland is 39.0 Years.
What is the Average Family Size in Loveland
Average Family Size in Loveland is 3.0 People.
What is the Average Household Size in Loveland
Average Household Size in Loveland is 2.6 People.
What is Per Capita Income in Loveland?
Per Capita income in Loveland is $39,971.
What is the Median Family Income in Loveland?
Median Family Income in Loveland is $95,466.
What is the Median Household income in Loveland?
Median Household Income in Loveland is $81,706.
What is Income or Wage Gap in Loveland?
Income or Wage Gap in Loveland is 29.1%.
Women in Loveland earn 70.9 cents for every dollar earned by a man.
What is Family Income Deficit in Loveland?
Family Income Deficit in Loveland is $13,728.
Families that are below poverty line in Loveland earn $13,728 less on average than the poverty threshold level.
What is Inequality or Gini Index in Loveland?
Inequality or Gini Index in Loveland is 0.42.
How Large is the Labor Force in Loveland?
There are 6,986 People in the Labor Forcein in Loveland.
What is the Percentage of People in the Labor Force in Loveland?
67.6% of People are in the Labor Force in Loveland.
What is the Unemployment Rate in Loveland?
Unemployment Rate in Loveland is 3.9%.