East Cleveland, OH
East Cleveland Map
East Cleveland Overview
13,926
TOTAL POPULATION
6,035
MALE POPULATION
7,891
FEMALE POPULATION
76.48
MALES / 100 FEMALES
130.75
FEMALES / 100 MALES
39.6
MEDIAN AGE
3.1
AVG FAMILY SIZE
2.1
AVG HOUSEHOLD SIZE
$19,526
PER CAPITA INCOME
$37,625
AVG FAMILY INCOME
$23,004
AVG HOUSEHOLD INCOME
2.0%
WAGE / INCOME GAP [ % ]
98.0¢/ $1
WAGE / INCOME GAP [ $ ]
$10,831
FAMILY INCOME DEFICIT
0.55
INEQUALITY / GINI INDEX
5,814
LABOR FORCE [ PEOPLE ]
53.7%
PERCENT IN LABOR FORCE
19.3%
UNEMPLOYMENT RATE
East Cleveland Area Codes
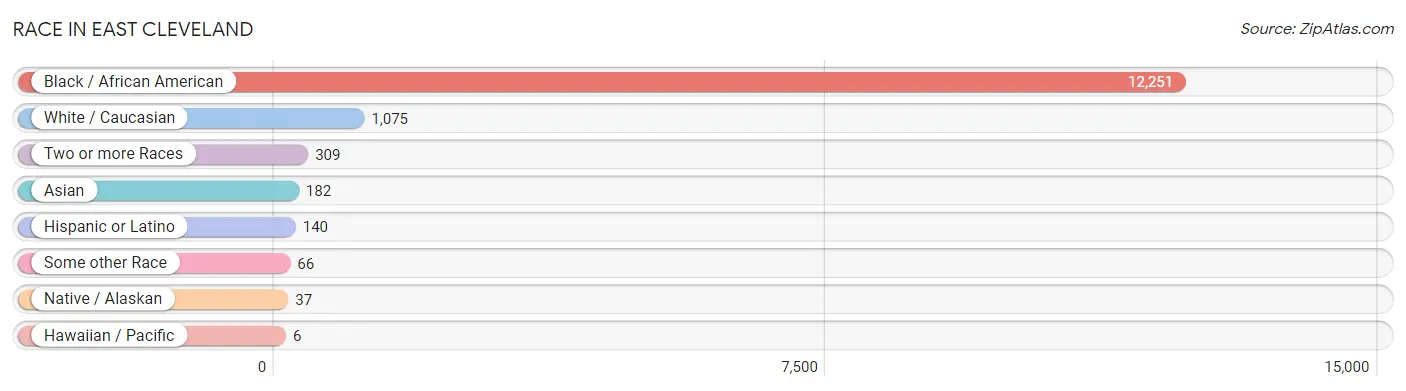
Race in East Cleveland
The most populous races in East Cleveland are Black / African American (12,251 | 88.0%), White / Caucasian (1,075 | 7.7%), and Two or more Races (309 | 2.2%).
| Race | # Population | % Population |
| Asian | 182 | 1.3% |
| Black / African American | 12,251 | 88.0% |
| Hawaiian / Pacific | 6 | 0.0% |
| Hispanic or Latino | 140 | 1.0% |
| Native / Alaskan | 37 | 0.3% |
| White / Caucasian | 1,075 | 7.7% |
| Two or more Races | 309 | 2.2% |
| Some other Race | 66 | 0.5% |
| Total | 13,926 | 100.0% |
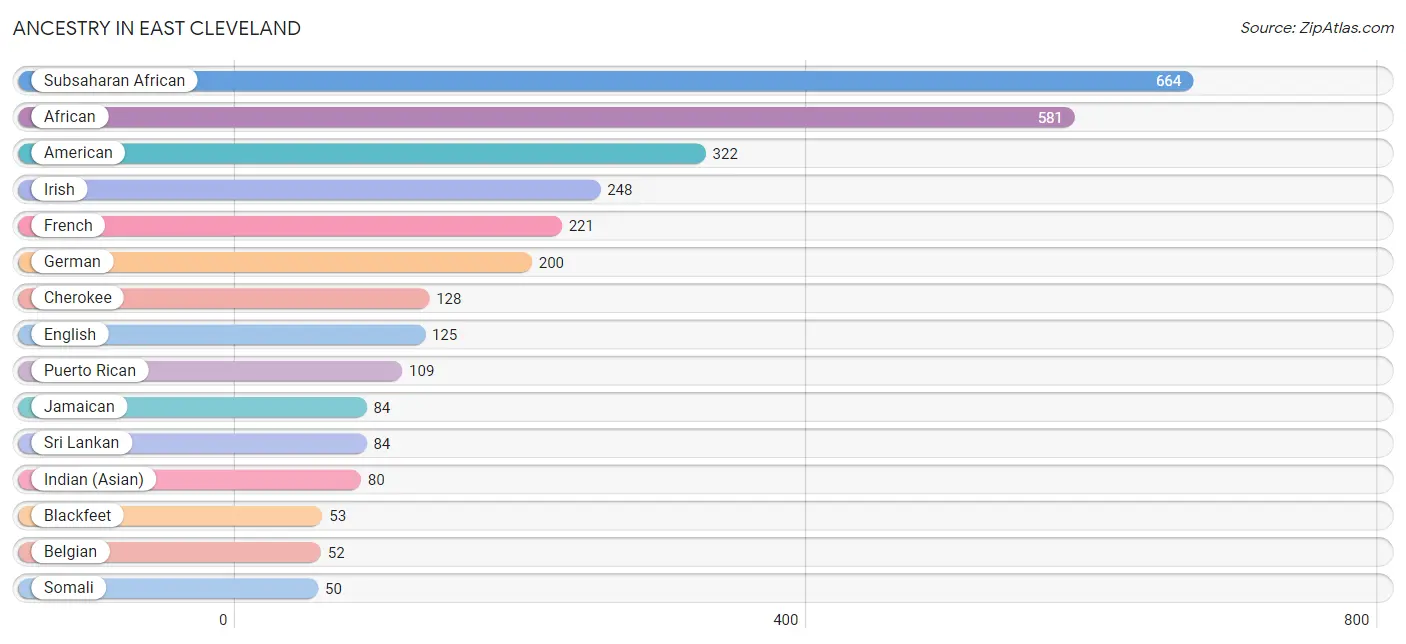
Ancestry in East Cleveland
The most populous ancestries reported in East Cleveland are Subsaharan African (664 | 4.8%), African (581 | 4.2%), American (322 | 2.3%), Irish (248 | 1.8%), and French (221 | 1.6%), together accounting for 14.6% of all East Cleveland residents.
| Ancestry | # Population | % Population |
| African | 581 | 4.2% |
| American | 322 | 2.3% |
| Arab | 22 | 0.2% |
| Armenian | 40 | 0.3% |
| Belgian | 52 | 0.4% |
| Blackfeet | 53 | 0.4% |
| British | 10 | 0.1% |
| Cambodian | 19 | 0.1% |
| Central American Indian | 4 | 0.0% |
| Cherokee | 128 | 0.9% |
| Danish | 7 | 0.1% |
| Dutch | 3 | 0.0% |
| English | 125 | 0.9% |
| Ethiopian | 7 | 0.1% |
| European | 9 | 0.1% |
| French | 221 | 1.6% |
| German | 200 | 1.4% |
| Greek | 11 | 0.1% |
| Guamanian / Chamorro | 6 | 0.0% |
| Hungarian | 7 | 0.1% |
| Indian (Asian) | 80 | 0.6% |
| Irish | 248 | 1.8% |
| Italian | 38 | 0.3% |
| Jamaican | 84 | 0.6% |
| Liberian | 16 | 0.1% |
| Mexican | 11 | 0.1% |
| Native Hawaiian | 19 | 0.1% |
| Navajo | 8 | 0.1% |
| Nigerian | 10 | 0.1% |
| Norwegian | 12 | 0.1% |
| Polish | 43 | 0.3% |
| Puerto Rican | 109 | 0.8% |
| Russian | 32 | 0.2% |
| Scotch-Irish | 4 | 0.0% |
| Scottish | 11 | 0.1% |
| Sioux | 9 | 0.1% |
| Slovene | 13 | 0.1% |
| Somali | 50 | 0.4% |
| Soviet Union | 11 | 0.1% |
| Spaniard | 11 | 0.1% |
| Sri Lankan | 84 | 0.6% |
| Subsaharan African | 664 | 4.8% |
| Swedish | 25 | 0.2% |
| Thai | 10 | 0.1% |
| Trinidadian and Tobagonian | 20 | 0.1% | View All 45 Rows |
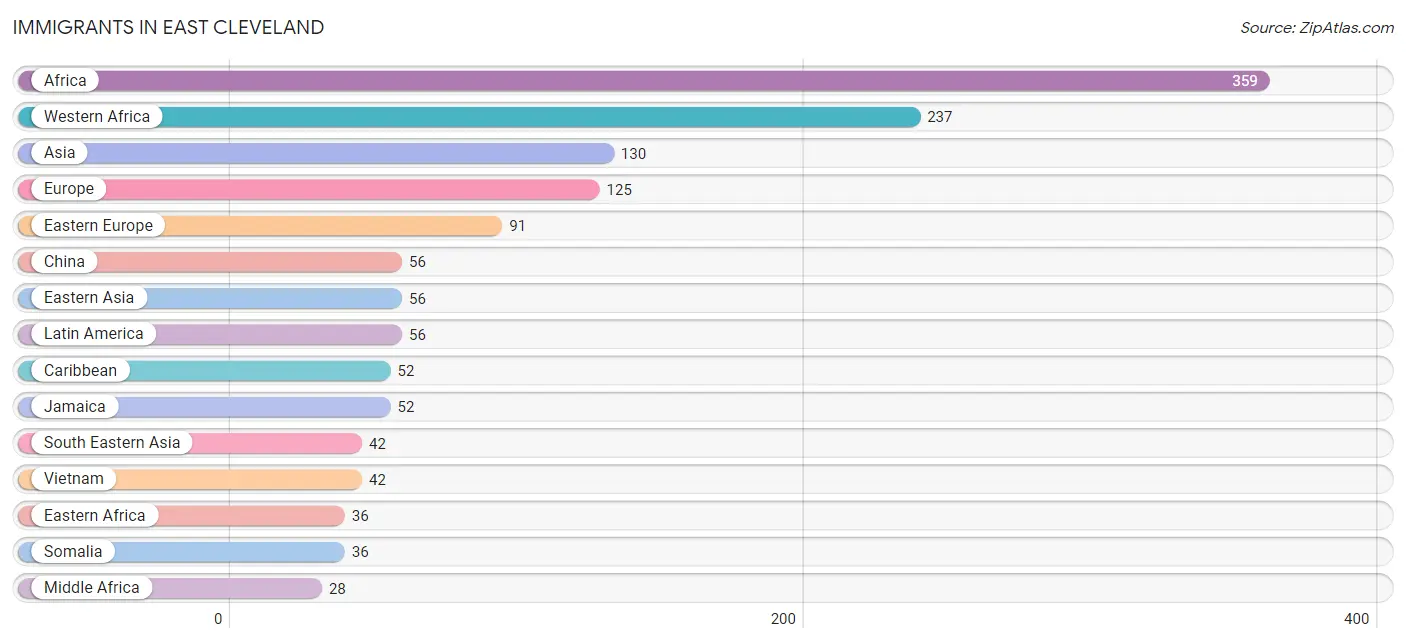
Immigrants in East Cleveland
The most numerous immigrant groups reported in East Cleveland came from Africa (359 | 2.6%), Western Africa (237 | 1.7%), Asia (130 | 0.9%), Europe (125 | 0.9%), and Eastern Europe (91 | 0.6%), together accounting for 6.8% of all East Cleveland residents.
| Immigration Origin | # Population | % Population |
| Afghanistan | 6 | 0.0% |
| Africa | 359 | 2.6% |
| Asia | 130 | 0.9% |
| Caribbean | 52 | 0.4% |
| Central America | 4 | 0.0% |
| China | 56 | 0.4% |
| Eastern Africa | 36 | 0.3% |
| Eastern Asia | 56 | 0.4% |
| Eastern Europe | 91 | 0.6% |
| Europe | 125 | 0.9% |
| France | 9 | 0.1% |
| Germany | 14 | 0.1% |
| Guatemala | 4 | 0.0% |
| Hong Kong | 9 | 0.1% |
| India | 10 | 0.1% |
| Italy | 11 | 0.1% |
| Jamaica | 52 | 0.4% |
| Latin America | 56 | 0.4% |
| Latvia | 10 | 0.1% |
| Liberia | 16 | 0.1% |
| Middle Africa | 28 | 0.2% |
| Nigeria | 9 | 0.1% |
| Romania | 10 | 0.1% |
| Russia | 12 | 0.1% |
| Saudi Arabia | 16 | 0.1% |
| Somalia | 36 | 0.3% |
| South Central Asia | 16 | 0.1% |
| South Eastern Asia | 42 | 0.3% |
| Southern Europe | 11 | 0.1% |
| Vietnam | 42 | 0.3% |
| Western Africa | 237 | 1.7% |
| Western Asia | 16 | 0.1% |
| Western Europe | 23 | 0.2% |
| Zaire | 28 | 0.2% | View All 34 Rows |
Sex and Age in East Cleveland
Sex and Age in East Cleveland
The most populous age groups in East Cleveland are Under 5 Years (581 | 9.6%) for men and Under 5 Years (717 | 9.1%) for women.
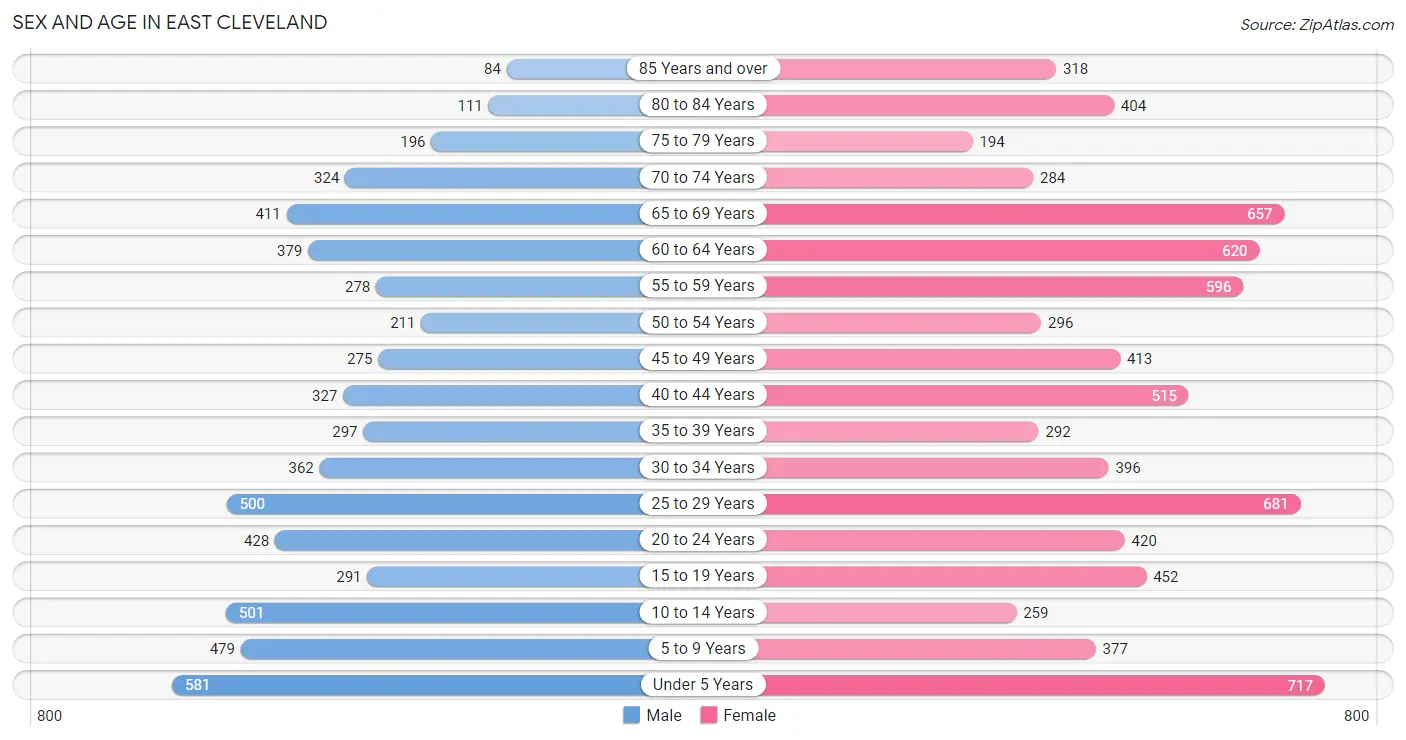
| Age Bracket | Male | Female |
| Under 5 Years | 581 (9.6%) | 717 (9.1%) |
| 5 to 9 Years | 479 (7.9%) | 377 (4.8%) |
| 10 to 14 Years | 501 (8.3%) | 259 (3.3%) |
| 15 to 19 Years | 291 (4.8%) | 452 (5.7%) |
| 20 to 24 Years | 428 (7.1%) | 420 (5.3%) |
| 25 to 29 Years | 500 (8.3%) | 681 (8.6%) |
| 30 to 34 Years | 362 (6.0%) | 396 (5.0%) |
| 35 to 39 Years | 297 (4.9%) | 292 (3.7%) |
| 40 to 44 Years | 327 (5.4%) | 515 (6.5%) |
| 45 to 49 Years | 275 (4.6%) | 413 (5.2%) |
| 50 to 54 Years | 211 (3.5%) | 296 (3.7%) |
| 55 to 59 Years | 278 (4.6%) | 596 (7.5%) |
| 60 to 64 Years | 379 (6.3%) | 620 (7.9%) |
| 65 to 69 Years | 411 (6.8%) | 657 (8.3%) |
| 70 to 74 Years | 324 (5.4%) | 284 (3.6%) |
| 75 to 79 Years | 196 (3.3%) | 194 (2.5%) |
| 80 to 84 Years | 111 (1.8%) | 404 (5.1%) |
| 85 Years and over | 84 (1.4%) | 318 (4.0%) |
| Total | 6,035 (100.0%) | 7,891 (100.0%) |
Families and Households in East Cleveland
Median Family Size in East Cleveland
The median family size in East Cleveland is 3.13 persons per family, with single female/mother families (1,559 | 54.5%) accounting for the largest median family size of 3.28 persons per family. On the other hand, single male/father families (621 | 21.7%) represent the smallest median family size with 2.82 persons per family.
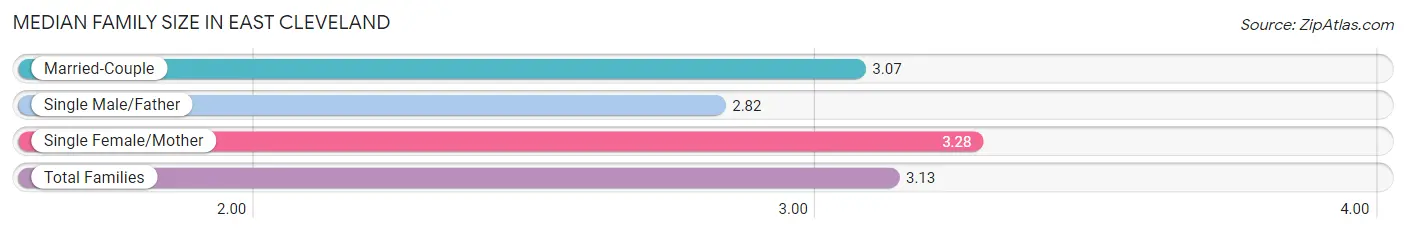
| Family Type | # Families | Family Size |
| Married-Couple | 678 (23.7%) | 3.07 |
| Single Male/Father | 621 (21.7%) | 2.82 |
| Single Female/Mother | 1,559 (54.5%) | 3.28 |
| Total Families | 2,858 (100.0%) | 3.13 |
Median Household Size in East Cleveland
The median household size in East Cleveland is 2.06 persons per household, with single female/mother households (1,559 | 23.7%) accounting for the largest median household size of 3.52 persons per household. non-family households (3,718 | 56.5%) represent the smallest median household size with 1.06 persons per household.
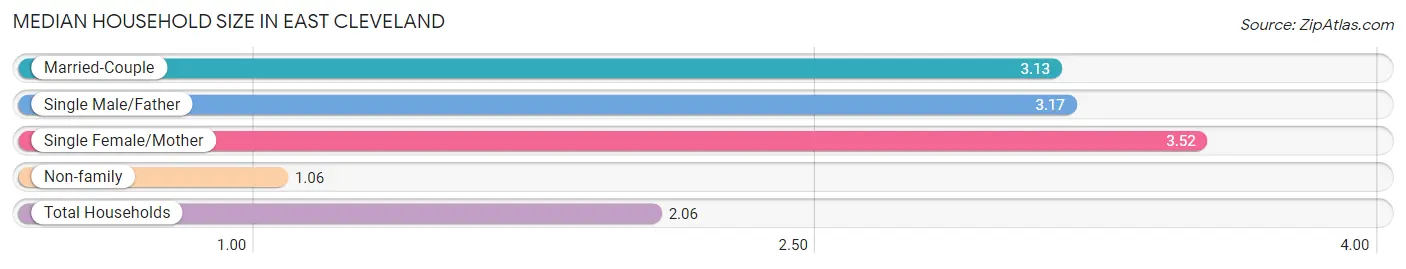
| Household Type | # Households | Household Size |
| Married-Couple | 678 (10.3%) | 3.13 |
| Single Male/Father | 621 (9.4%) | 3.17 |
| Single Female/Mother | 1,559 (23.7%) | 3.52 |
| Non-family | 3,718 (56.5%) | 1.06 |
| Total Households | 6,576 (100.0%) | 2.06 |
Household Size by Marriage Status in East Cleveland
Out of a total of 6,576 households in East Cleveland, 2,858 (43.5%) are family households, while 3,718 (56.5%) are nonfamily households. The most numerous type of family households are 2-person households, comprising 1,168, and the most common type of nonfamily households are 1-person households, comprising 3,517.
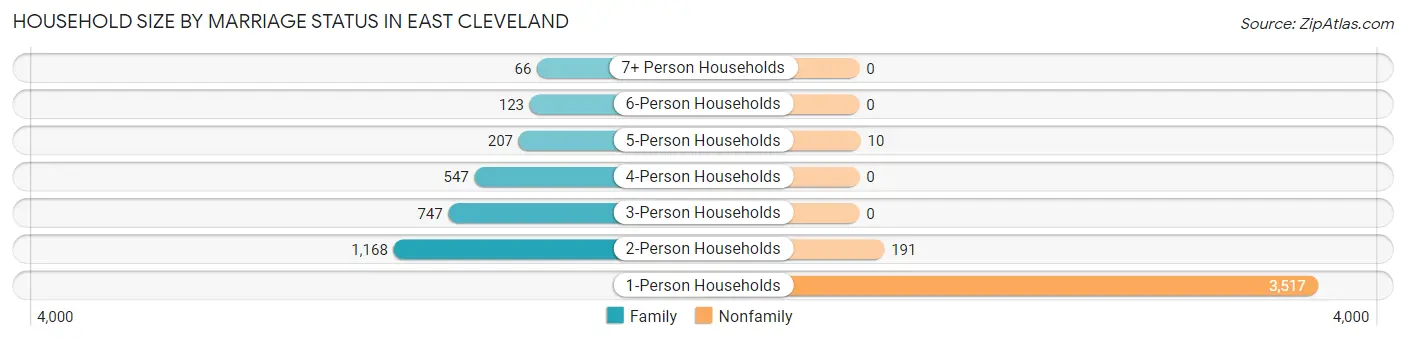
| Household Size | Family Households | Nonfamily Households |
| 1-Person Households | - | 3,517 (53.5%) |
| 2-Person Households | 1,168 (17.8%) | 191 (2.9%) |
| 3-Person Households | 747 (11.4%) | 0 (0.0%) |
| 4-Person Households | 547 (8.3%) | 0 (0.0%) |
| 5-Person Households | 207 (3.2%) | 10 (0.2%) |
| 6-Person Households | 123 (1.9%) | 0 (0.0%) |
| 7+ Person Households | 66 (1.0%) | 0 (0.0%) |
| Total | 2,858 (43.5%) | 3,718 (56.5%) |
Female Fertility in East Cleveland
Fertility by Age in East Cleveland
Average fertility rate in East Cleveland is 70.0 births per 1,000 women. Women in the age bracket of 20 to 34 years have the highest fertility rate with 129.0 births per 1,000 women. Women in the age bracket of 20 to 34 years acount for 86.6% of all women with births.
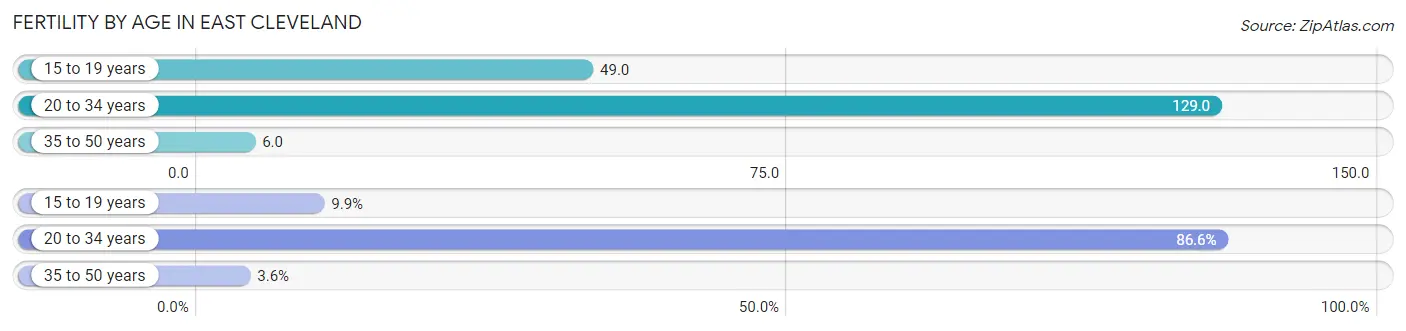
| Age Bracket | Women with Births | Births / 1,000 Women |
| 15 to 19 years | 22 (9.9%) | 49.0 |
| 20 to 34 years | 193 (86.6%) | 129.0 |
| 35 to 50 years | 8 (3.6%) | 6.0 |
| Total | 223 (100.0%) | 70.0 |
Fertility by Age by Marriage Status in East Cleveland
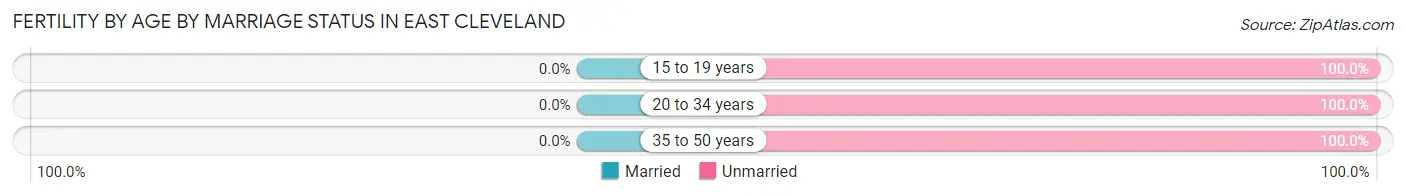
| Age Bracket | Married | Unmarried |
| 15 to 19 years | 0 (0.0%) | 22 (100.0%) |
| 20 to 34 years | 0 (0.0%) | 193 (100.0%) |
| 35 to 50 years | 0 (0.0%) | 8 (100.0%) |
| Total | 0 (0.0%) | 223 (100.0%) |
Fertility by Education in East Cleveland
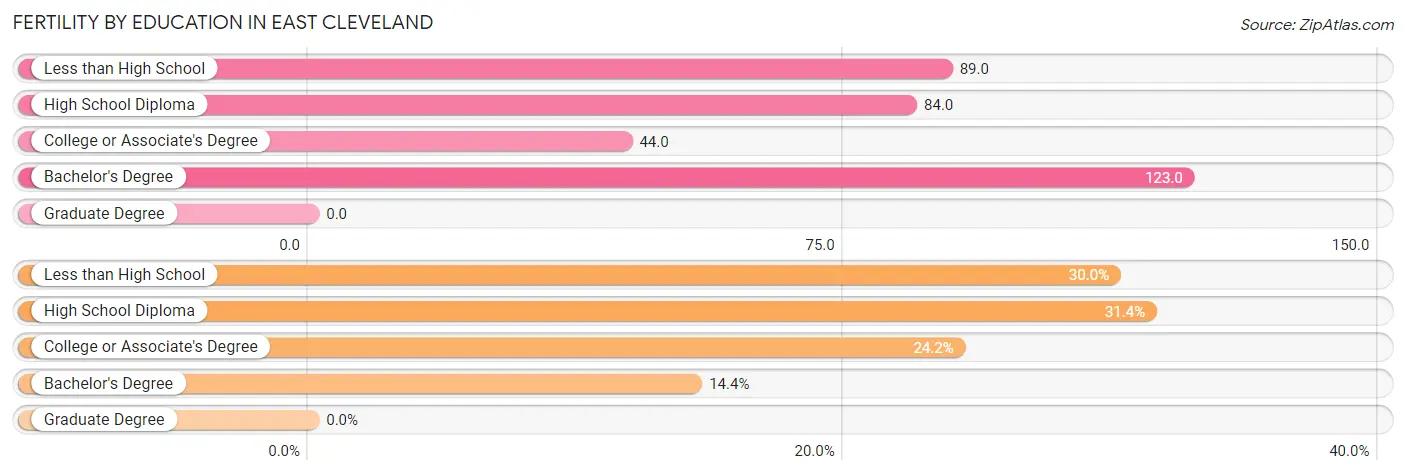
| Educational Attainment | Women with Births | Births / 1,000 Women |
| Less than High School | 67 (30.0%) | 89.0 |
| High School Diploma | 70 (31.4%) | 84.0 |
| College or Associate's Degree | 54 (24.2%) | 44.0 |
| Bachelor's Degree | 32 (14.3%) | 123.0 |
| Graduate Degree | 0 (0.0%) | 0.0 |
| Total | 223 (100.0%) | 70.0 |
Fertility by Education by Marriage Status in East Cleveland
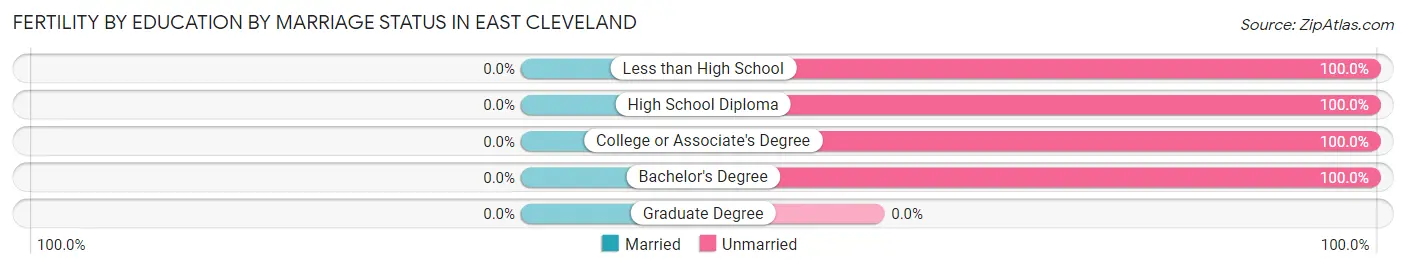
| Educational Attainment | Married | Unmarried |
| Less than High School | 0 (0.0%) | 67 (100.0%) |
| High School Diploma | 0 (0.0%) | 70 (100.0%) |
| College or Associate's Degree | 0 (0.0%) | 54 (100.0%) |
| Bachelor's Degree | 0 (0.0%) | 32 (100.0%) |
| Graduate Degree | 0 (0.0%) | 0 (0.0%) |
| Total | 0 (0.0%) | 223 (100.0%) |
Income in East Cleveland
Income Overview in East Cleveland
Per Capita Income in East Cleveland is $19,526, while median incomes of families and households are $37,625 and $23,004 respectively.
| Characteristic | Number | Measure |
| Per Capita Income | 13,926 | $19,526 |
| Median Family Income | 2,858 | $37,625 |
| Mean Family Income | 2,858 | $56,541 |
| Median Household Income | 6,576 | $23,004 |
| Mean Household Income | 6,576 | $39,755 |
| Income Deficit | 2,858 | $10,831 |
| Wage / Income Gap (%) | 13,926 | 2.04% |
| Wage / Income Gap ($) | 13,926 | 97.96¢ per $1 |
| Gini / Inequality Index | 13,926 | 0.55 |
Earnings by Sex in East Cleveland
Average Earnings in East Cleveland are $24,312, $24,682 for men and $24,178 for women, a difference of 2.0%.
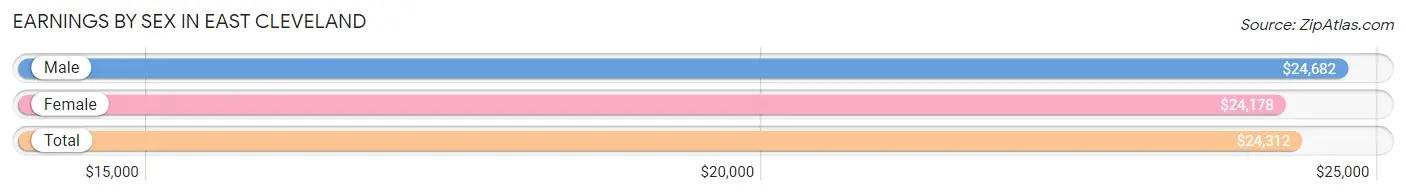
| Sex | Number | Average Earnings |
| Male | 2,434 (41.6%) | $24,682 |
| Female | 3,420 (58.4%) | $24,178 |
| Total | 5,854 (100.0%) | $24,312 |
Earnings by Sex by Income Bracket in East Cleveland
The most common earnings brackets in East Cleveland are $25,000 to $29,999 for men (330 | 13.6%) and $2,499 or less for women (468 | 13.7%).
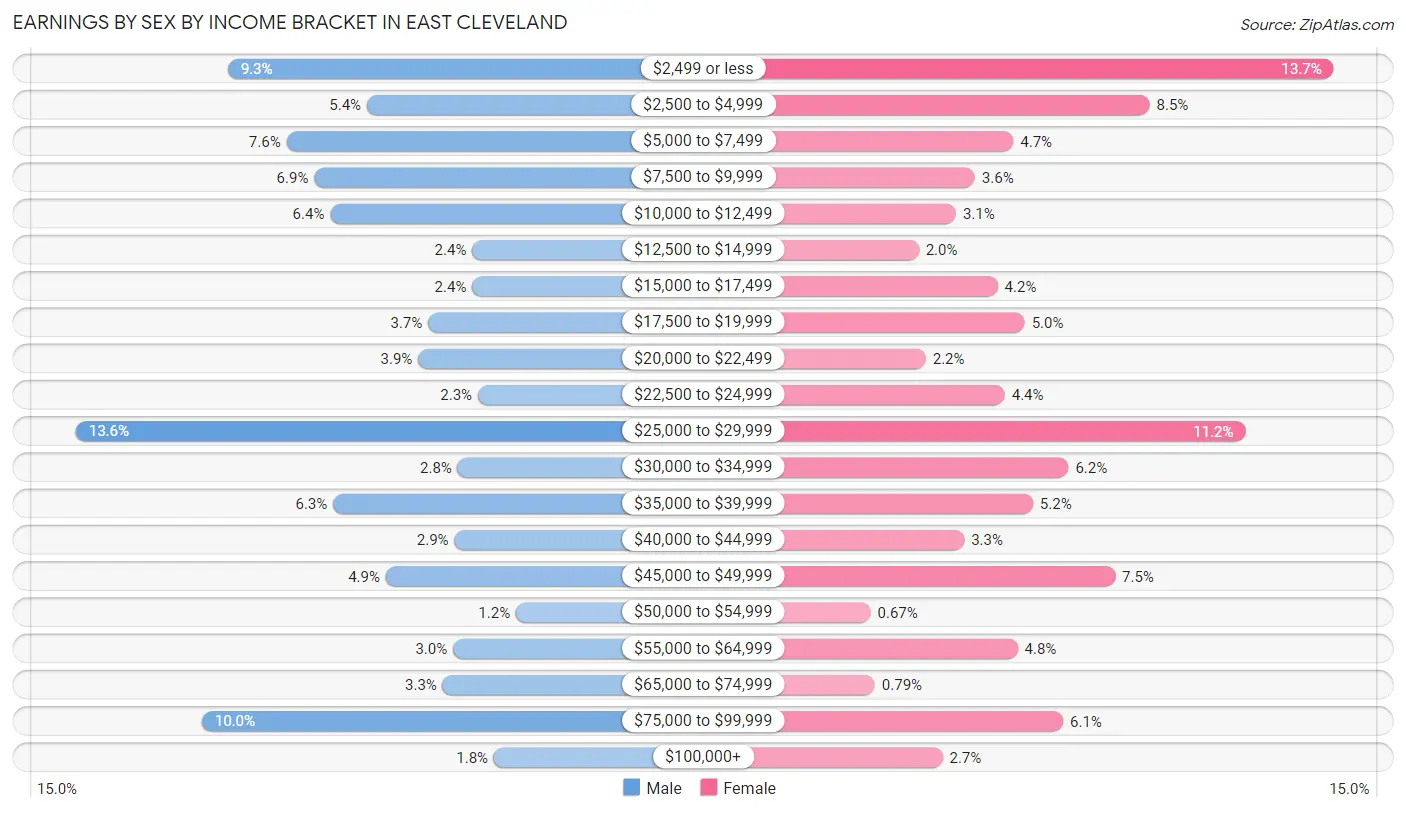
| Income | Male | Female |
| $2,499 or less | 226 (9.3%) | 468 (13.7%) |
| $2,500 to $4,999 | 131 (5.4%) | 291 (8.5%) |
| $5,000 to $7,499 | 186 (7.6%) | 160 (4.7%) |
| $7,500 to $9,999 | 167 (6.9%) | 123 (3.6%) |
| $10,000 to $12,499 | 156 (6.4%) | 105 (3.1%) |
| $12,500 to $14,999 | 59 (2.4%) | 69 (2.0%) |
| $15,000 to $17,499 | 59 (2.4%) | 145 (4.2%) |
| $17,500 to $19,999 | 89 (3.7%) | 171 (5.0%) |
| $20,000 to $22,499 | 96 (3.9%) | 76 (2.2%) |
| $22,500 to $24,999 | 55 (2.3%) | 152 (4.4%) |
| $25,000 to $29,999 | 330 (13.6%) | 383 (11.2%) |
| $30,000 to $34,999 | 69 (2.8%) | 213 (6.2%) |
| $35,000 to $39,999 | 154 (6.3%) | 179 (5.2%) |
| $40,000 to $44,999 | 71 (2.9%) | 113 (3.3%) |
| $45,000 to $49,999 | 118 (4.9%) | 258 (7.5%) |
| $50,000 to $54,999 | 29 (1.2%) | 23 (0.7%) |
| $55,000 to $64,999 | 72 (3.0%) | 164 (4.8%) |
| $65,000 to $74,999 | 79 (3.3%) | 27 (0.8%) |
| $75,000 to $99,999 | 244 (10.0%) | 208 (6.1%) |
| $100,000+ | 44 (1.8%) | 92 (2.7%) |
| Total | 2,434 (100.0%) | 3,420 (100.0%) |
Earnings by Sex by Educational Attainment in East Cleveland
Average earnings in East Cleveland are $27,857 for men and $28,137 for women, a difference of 1.0%. Men with an educational attainment of graduate degree enjoy the highest average annual earnings of $78,090, while those with less than high school education earn the least with $20,208. Women with an educational attainment of graduate degree earn the most with the average annual earnings of $46,618, while those with high school diploma education have the smallest earnings of $20,625.
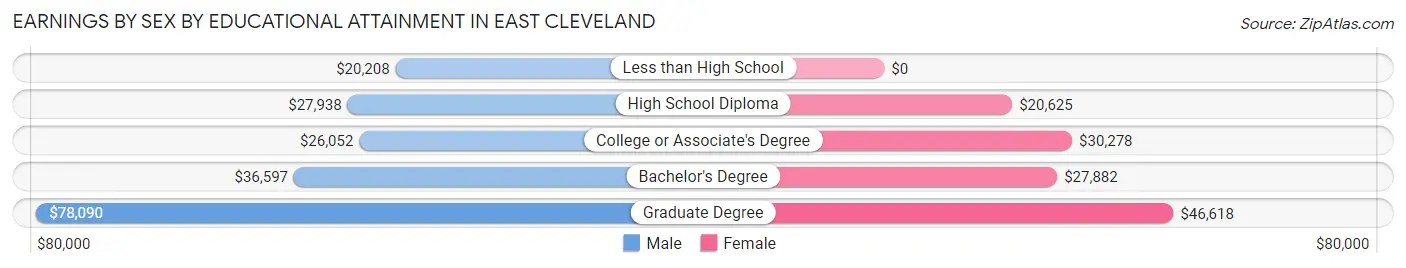
| Educational Attainment | Male Income | Female Income |
| Less than High School | $20,208 | $0 |
| High School Diploma | $27,938 | $20,625 |
| College or Associate's Degree | $26,052 | $30,278 |
| Bachelor's Degree | $36,597 | $27,882 |
| Graduate Degree | $78,090 | $46,618 |
| Total | $27,857 | $28,137 |
Family Income in East Cleveland
Family Income Brackets in East Cleveland
According to the East Cleveland family income data, there are 540 families falling into the $35,000 to $49,999 income range, which is the most common income bracket and makes up 18.9% of all families. Conversely, the $200,000+ income bracket is the least frequent group with only 83 families (2.9%) belonging to this category.
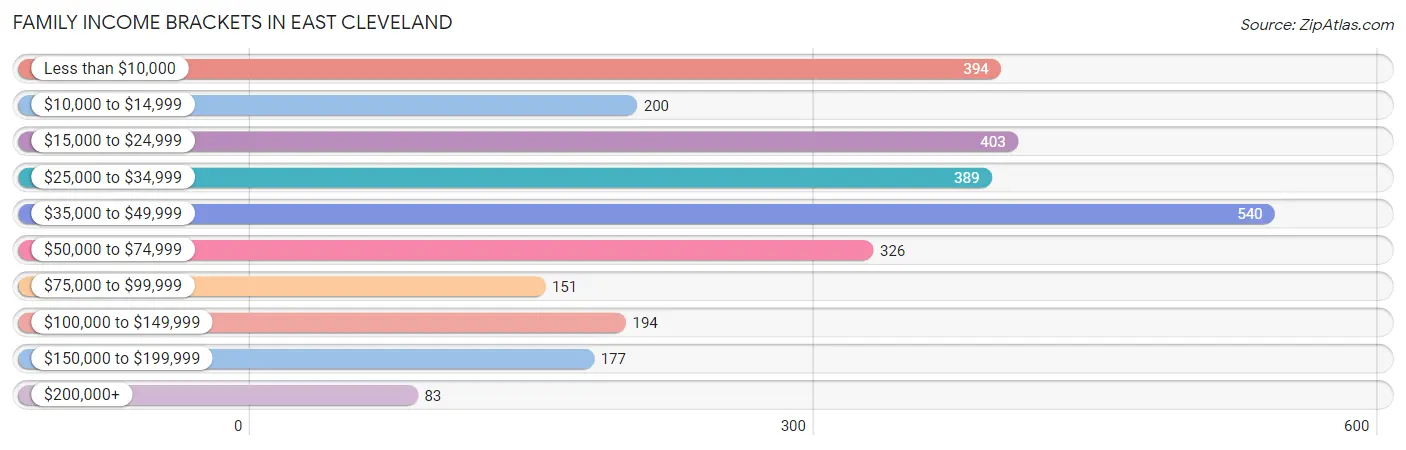
| Income Bracket | # Families | % Families |
| Less than $10,000 | 394 | 13.8% |
| $10,000 to $14,999 | 200 | 7.0% |
| $15,000 to $24,999 | 403 | 14.1% |
| $25,000 to $34,999 | 389 | 13.6% |
| $35,000 to $49,999 | 540 | 18.9% |
| $50,000 to $74,999 | 326 | 11.4% |
| $75,000 to $99,999 | 151 | 5.3% |
| $100,000 to $149,999 | 194 | 6.8% |
| $150,000 to $199,999 | 177 | 6.2% |
| $200,000+ | 83 | 2.9% |
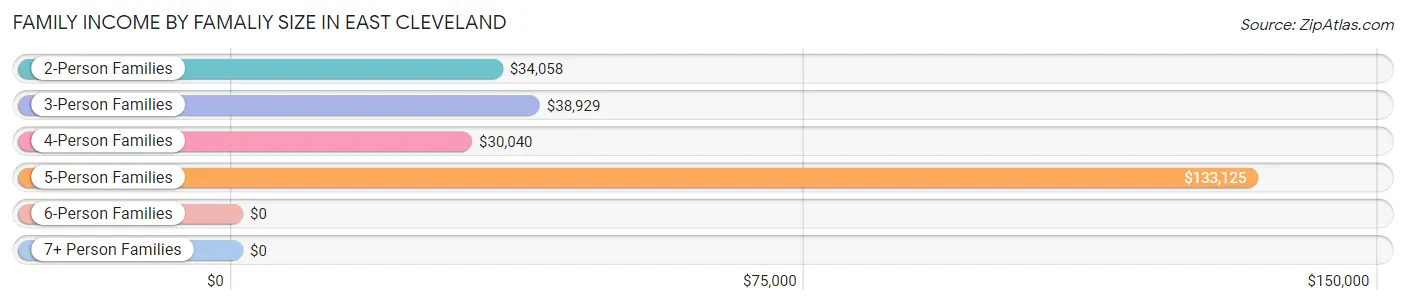
Family Income by Famaliy Size in East Cleveland
5-person families (100 | 3.5%) account for the highest median family income in East Cleveland with $133,125 per family, while 5-person families (100 | 3.5%) have the highest median income of $26,625 per family member.
| Income Bracket | # Families | Median Income |
| 2-Person Families | 1,388 (48.6%) | $34,058 |
| 3-Person Families | 730 (25.5%) | $38,929 |
| 4-Person Families | 461 (16.1%) | $30,040 |
| 5-Person Families | 100 (3.5%) | $133,125 |
| 6-Person Families | 124 (4.3%) | $0 |
| 7+ Person Families | 55 (1.9%) | $0 |
| Total | 2,858 (100.0%) | $37,625 |
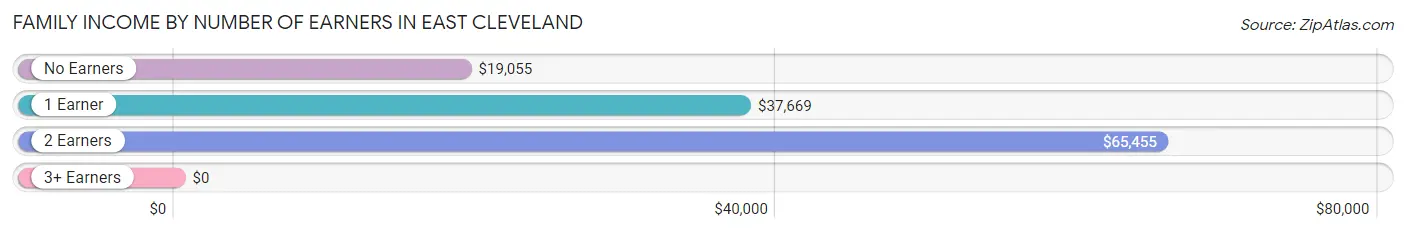
Family Income by Number of Earners in East Cleveland
| Number of Earners | # Families | Median Income |
| No Earners | 593 (20.7%) | $19,055 |
| 1 Earner | 1,315 (46.0%) | $37,669 |
| 2 Earners | 754 (26.4%) | $65,455 |
| 3+ Earners | 196 (6.9%) | $0 |
| Total | 2,858 (100.0%) | $37,625 |
Household Income in East Cleveland
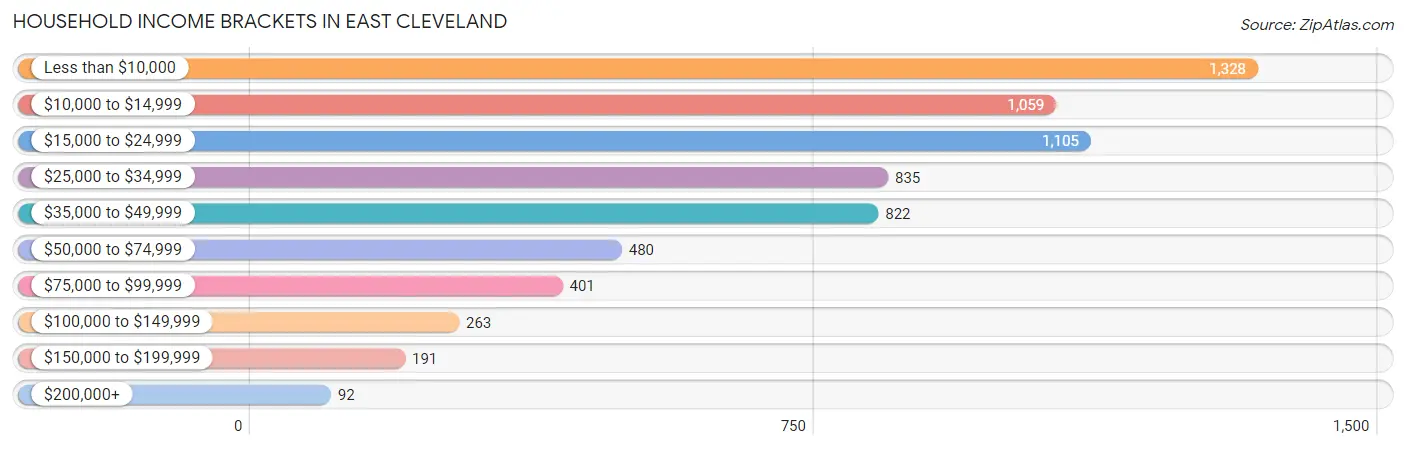
Household Income Brackets in East Cleveland
With 1,328 households falling in the category, the less than $10,000 income range is the most frequent in East Cleveland, accounting for 20.2% of all households. In contrast, only 92 households (1.4%) fall into the $200,000+ income bracket, making it the least populous group.
| Income Bracket | # Households | % Households |
| Less than $10,000 | 1,328 | 20.2% |
| $10,000 to $14,999 | 1,059 | 16.1% |
| $15,000 to $24,999 | 1,105 | 16.8% |
| $25,000 to $34,999 | 835 | 12.7% |
| $35,000 to $49,999 | 822 | 12.5% |
| $50,000 to $74,999 | 480 | 7.3% |
| $75,000 to $99,999 | 401 | 6.1% |
| $100,000 to $149,999 | 263 | 4.0% |
| $150,000 to $199,999 | 191 | 2.9% |
| $200,000+ | 92 | 1.4% |
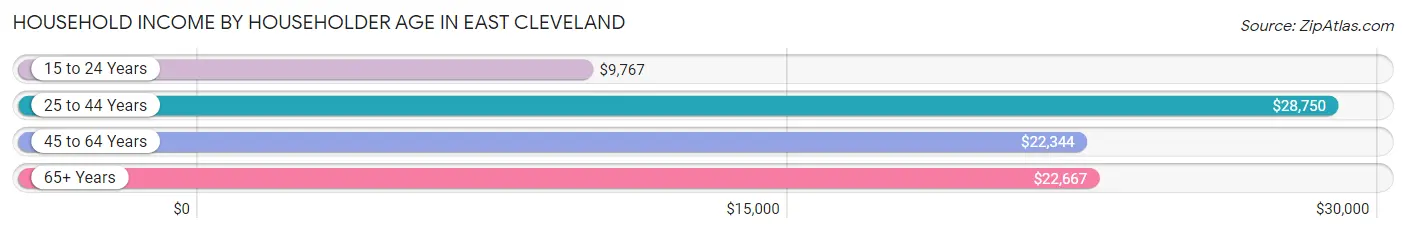
Household Income by Householder Age in East Cleveland
The median household income in East Cleveland is $23,004, with the highest median household income of $28,750 found in the 25 to 44 years age bracket for the primary householder. A total of 1,939 households (29.5%) fall into this category. Meanwhile, the 15 to 24 years age bracket for the primary householder has the lowest median household income of $9,767, with 456 households (6.9%) in this group.
| Income Bracket | # Households | Median Income |
| 15 to 24 Years | 456 (6.9%) | $9,767 |
| 25 to 44 Years | 1,939 (29.5%) | $28,750 |
| 45 to 64 Years | 1,953 (29.7%) | $22,344 |
| 65+ Years | 2,228 (33.9%) | $22,667 |
| Total | 6,576 (100.0%) | $23,004 |
Poverty in East Cleveland
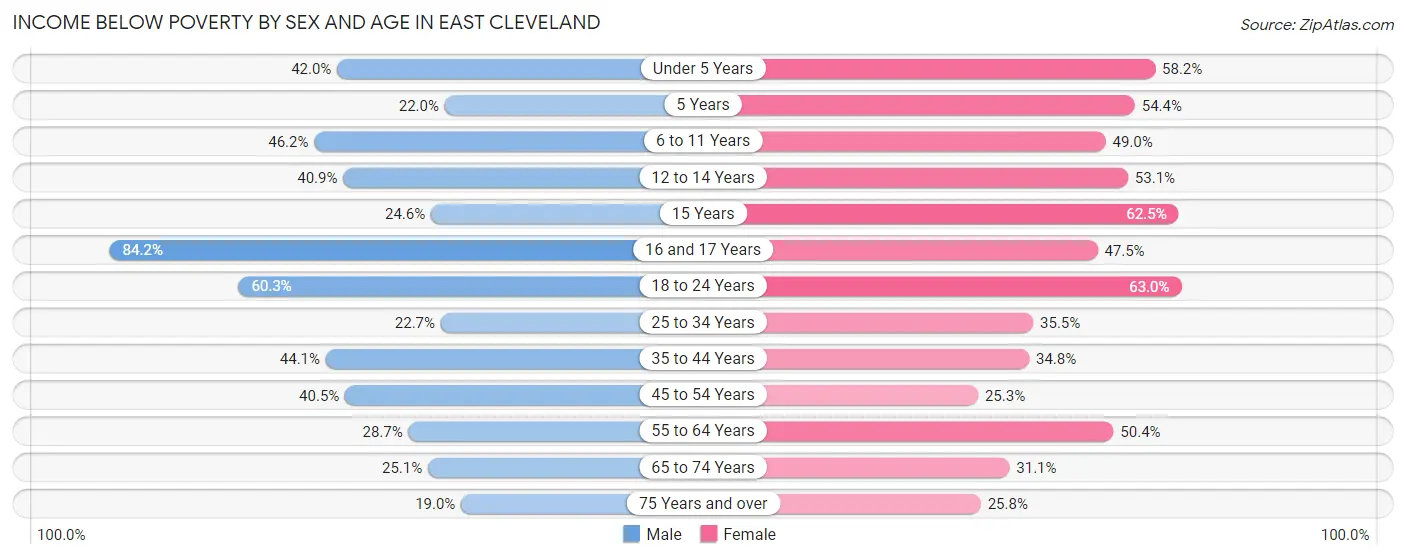
Income Below Poverty by Sex and Age in East Cleveland
With 37.0% poverty level for males and 41.4% for females among the residents of East Cleveland, 16 and 17 year old males and 18 to 24 year old females are the most vulnerable to poverty, with 96 males (84.2%) and 380 females (63.0%) in their respective age groups living below the poverty level.
| Age Bracket | Male | Female |
| Under 5 Years | 238 (42.0%) | 417 (58.2%) |
| 5 Years | 11 (22.0%) | 31 (54.4%) |
| 6 to 11 Years | 313 (46.2%) | 187 (48.9%) |
| 12 to 14 Years | 87 (40.8%) | 94 (53.1%) |
| 15 Years | 14 (24.6%) | 80 (62.5%) |
| 16 and 17 Years | 96 (84.2%) | 65 (47.4%) |
| 18 to 24 Years | 319 (60.3%) | 380 (63.0%) |
| 25 to 34 Years | 196 (22.7%) | 376 (35.5%) |
| 35 to 44 Years | 272 (44.1%) | 277 (34.8%) |
| 45 to 54 Years | 194 (40.5%) | 178 (25.3%) |
| 55 to 64 Years | 177 (28.7%) | 611 (50.4%) |
| 65 to 74 Years | 173 (25.1%) | 279 (31.1%) |
| 75 Years and over | 69 (19.0%) | 211 (25.8%) |
| Total | 2,159 (37.0%) | 3,186 (41.4%) |
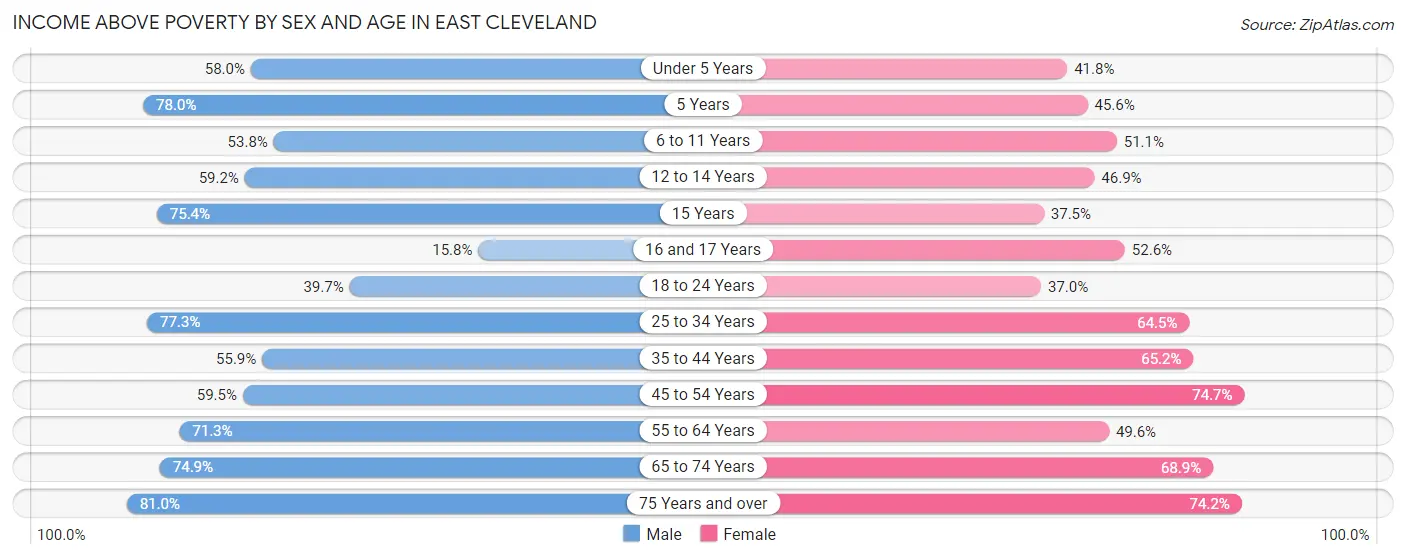
Income Above Poverty by Sex and Age in East Cleveland
According to the poverty statistics in East Cleveland, males aged 75 years and over and females aged 45 to 54 years are the age groups that are most secure financially, with 81.0% of males and 74.7% of females in these age groups living above the poverty line.
| Age Bracket | Male | Female |
| Under 5 Years | 329 (58.0%) | 300 (41.8%) |
| 5 Years | 39 (78.0%) | 26 (45.6%) |
| 6 to 11 Years | 364 (53.8%) | 195 (51.0%) |
| 12 to 14 Years | 126 (59.2%) | 83 (46.9%) |
| 15 Years | 43 (75.4%) | 48 (37.5%) |
| 16 and 17 Years | 18 (15.8%) | 72 (52.5%) |
| 18 to 24 Years | 210 (39.7%) | 223 (37.0%) |
| 25 to 34 Years | 666 (77.3%) | 683 (64.5%) |
| 35 to 44 Years | 345 (55.9%) | 520 (65.2%) |
| 45 to 54 Years | 285 (59.5%) | 526 (74.7%) |
| 55 to 64 Years | 439 (71.3%) | 601 (49.6%) |
| 65 to 74 Years | 516 (74.9%) | 618 (68.9%) |
| 75 Years and over | 295 (81.0%) | 607 (74.2%) |
| Total | 3,675 (63.0%) | 4,502 (58.6%) |
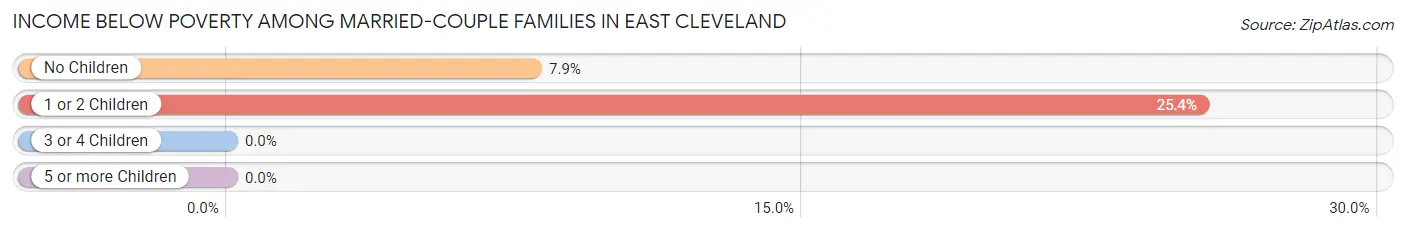
Income Below Poverty Among Married-Couple Families in East Cleveland
The poverty statistics for married-couple families in East Cleveland show that 12.8% or 87 of the total 678 families live below the poverty line. Families with 1 or 2 children have the highest poverty rate of 25.4%, comprising of 55 families. On the other hand, families with 3 or 4 children have the lowest poverty rate of 0.0%, which includes 0 families.
| Children | Above Poverty | Below Poverty |
| No Children | 371 (92.1%) | 32 (7.9%) |
| 1 or 2 Children | 162 (74.7%) | 55 (25.4%) |
| 3 or 4 Children | 58 (100.0%) | 0 (0.0%) |
| 5 or more Children | 0 (0.0%) | 0 (0.0%) |
| Total | 591 (87.2%) | 87 (12.8%) |
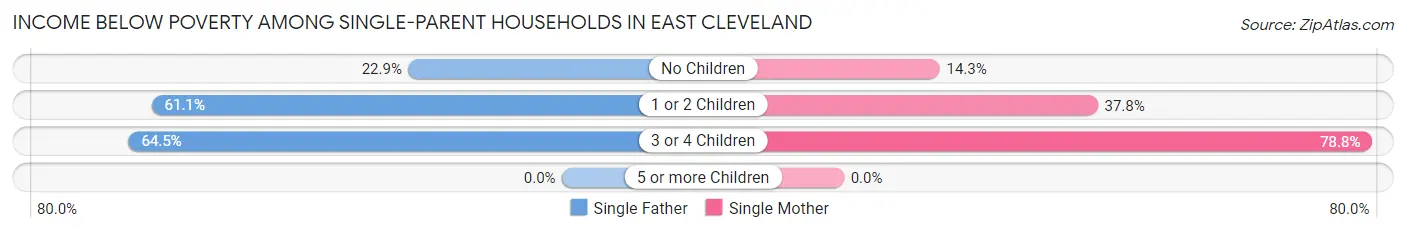
Income Below Poverty Among Single-Parent Households in East Cleveland
According to the poverty data in East Cleveland, 50.2% or 312 single-father households and 34.5% or 538 single-mother households are living below the poverty line. Among single-father households, those with 3 or 4 children have the highest poverty rate, with 20 households (64.5%) experiencing poverty. Likewise, among single-mother households, those with 3 or 4 children have the highest poverty rate, with 178 households (78.8%) falling below the poverty line.
| Children | Single Father | Single Mother |
| No Children | 41 (22.9%) | 77 (14.3%) |
| 1 or 2 Children | 251 (61.1%) | 283 (37.8%) |
| 3 or 4 Children | 20 (64.5%) | 178 (78.8%) |
| 5 or more Children | 0 (0.0%) | 0 (0.0%) |
| Total | 312 (50.2%) | 538 (34.5%) |
Income Below Poverty Among Married-Couple vs Single-Parent Households in East Cleveland
The poverty data for East Cleveland shows that 87 of the married-couple family households (12.8%) and 850 of the single-parent households (39.0%) are living below the poverty level. Within the married-couple family households, those with 1 or 2 children have the highest poverty rate, with 55 households (25.4%) falling below the poverty line. Among the single-parent households, those with 3 or 4 children have the highest poverty rate, with 198 household (77.0%) living below poverty.
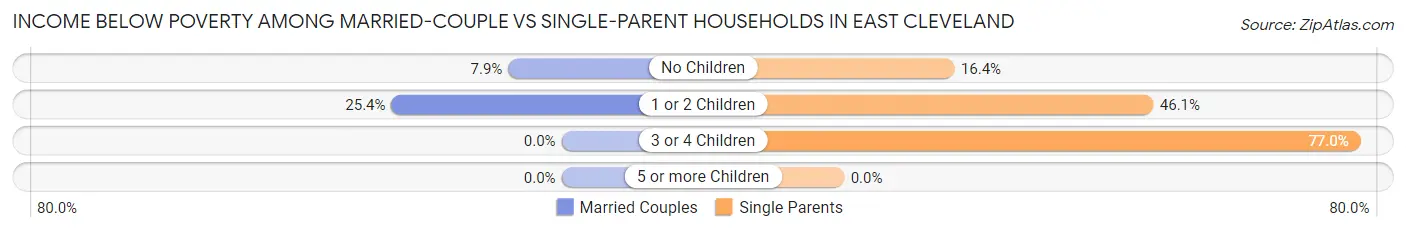
| Children | Married-Couple Families | Single-Parent Households |
| No Children | 32 (7.9%) | 118 (16.4%) |
| 1 or 2 Children | 55 (25.4%) | 534 (46.1%) |
| 3 or 4 Children | 0 (0.0%) | 198 (77.0%) |
| 5 or more Children | 0 (0.0%) | 0 (0.0%) |
| Total | 87 (12.8%) | 850 (39.0%) |
Employment Characteristics in East Cleveland
Employment by Class of Employer in East Cleveland
Among the 4,493 employed individuals in East Cleveland, private company employees (2,953 | 65.7%), not-for-profit organizations (734 | 16.3%), and local government employees (216 | 4.8%) make up the most common classes of employment.
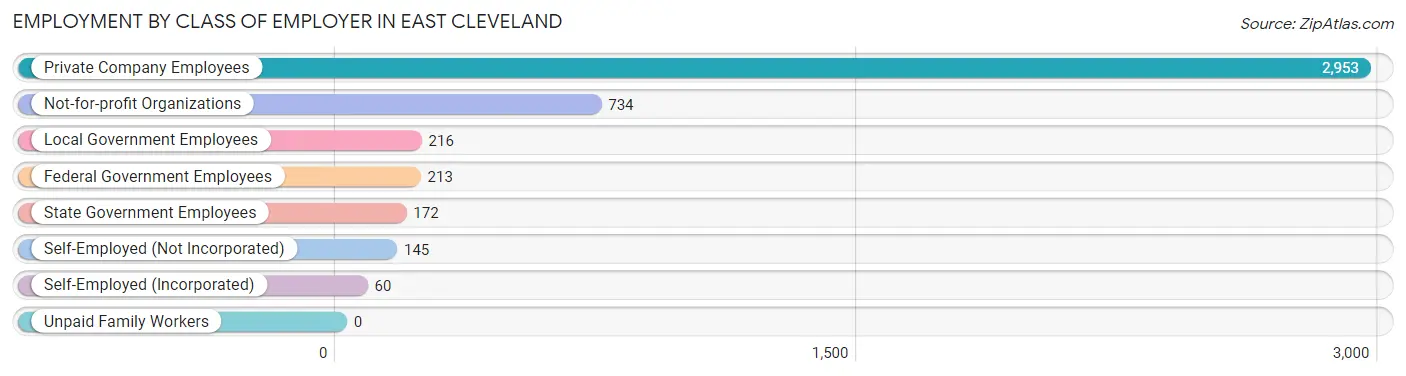
| Employer Class | # Employees | % Employees |
| Private Company Employees | 2,953 | 65.7% |
| Self-Employed (Incorporated) | 60 | 1.3% |
| Self-Employed (Not Incorporated) | 145 | 3.2% |
| Not-for-profit Organizations | 734 | 16.3% |
| Local Government Employees | 216 | 4.8% |
| State Government Employees | 172 | 3.8% |
| Federal Government Employees | 213 | 4.7% |
| Unpaid Family Workers | 0 | 0.0% |
| Total | 4,493 | 100.0% |
Employment Status by Age in East Cleveland
According to the labor force statistics for East Cleveland, out of the total population over 16 years of age (10,827), 53.7% or 5,814 individuals are in the labor force, with 19.3% or 1,122 of them unemployed. The age group with the highest labor force participation rate is 25 to 29 years, with 89.7% or 1,059 individuals in the labor force. Within the labor force, the 20 to 24 years age range has the highest percentage of unemployed individuals, with 47.0% or 309 of them being unemployed.
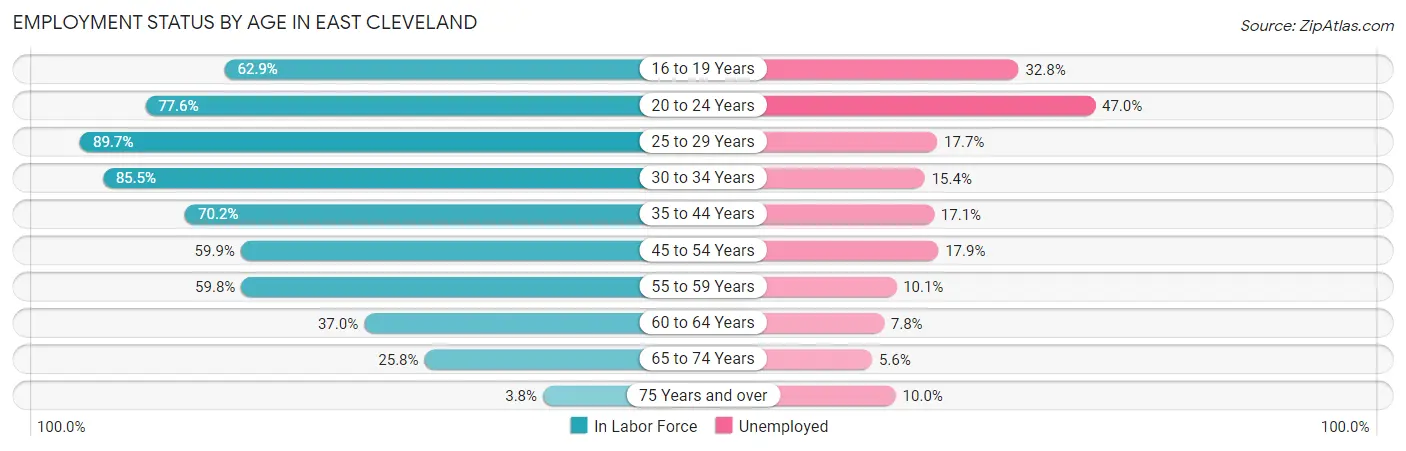
| Age Bracket | In Labor Force | Unemployed |
| 16 to 19 Years | 351 (62.9%) | 115 (32.8%) |
| 20 to 24 Years | 658 (77.6%) | 309 (47.0%) |
| 25 to 29 Years | 1,059 (89.7%) | 187 (17.7%) |
| 30 to 34 Years | 648 (85.5%) | 100 (15.4%) |
| 35 to 44 Years | 1,005 (70.2%) | 172 (17.1%) |
| 45 to 54 Years | 716 (59.9%) | 128 (17.9%) |
| 55 to 59 Years | 523 (59.8%) | 53 (10.1%) |
| 60 to 64 Years | 370 (37.0%) | 29 (7.8%) |
| 65 to 74 Years | 432 (25.8%) | 24 (5.6%) |
| 75 Years and over | 50 (3.8%) | 5 (10.0%) |
| Total | 5,814 (53.7%) | 1,122 (19.3%) |
Employment Status by Educational Attainment in East Cleveland
According to labor force statistics for East Cleveland, 67.1% of individuals (4,320) out of the total population between 25 and 64 years of age (6,438) are in the labor force, with 15.5% or 670 of them being unemployed. The group with the highest labor force participation rate are those with the educational attainment of college / associate degree, with 81.4% or 1,961 individuals in the labor force. Within the labor force, individuals with less than high school education have the highest percentage of unemployment, with 27.4% or 127 of them being unemployed.
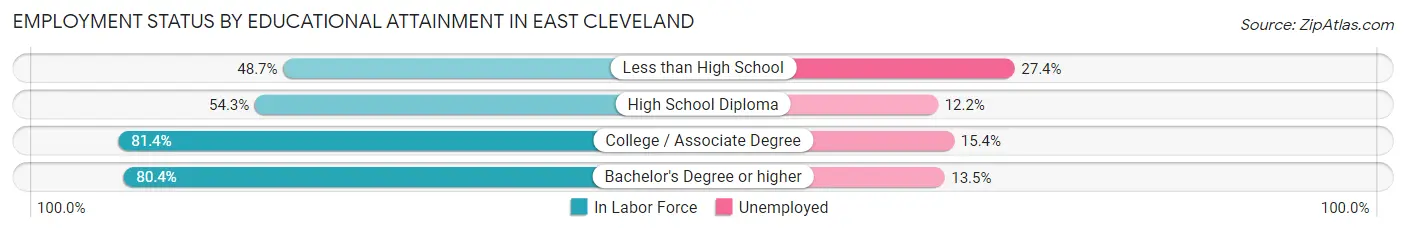
| Educational Attainment | In Labor Force | Unemployed |
| Less than High School | 463 (48.7%) | 260 (27.4%) |
| High School Diploma | 1,205 (54.3%) | 271 (12.2%) |
| College / Associate Degree | 1,961 (81.4%) | 371 (15.4%) |
| Bachelor's Degree or higher | 691 (80.4%) | 116 (13.5%) |
| Total | 4,320 (67.1%) | 998 (15.5%) |
Employment Occupations by Sex in East Cleveland
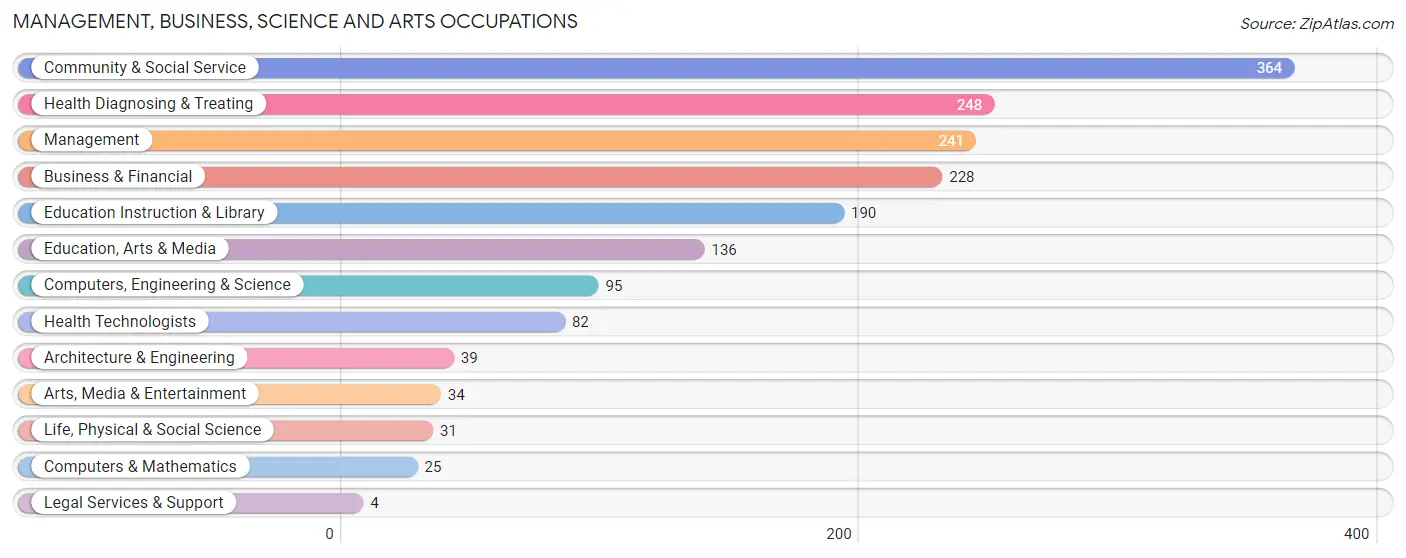
Management, Business, Science and Arts Occupations
The most common Management, Business, Science and Arts occupations in East Cleveland are Community & Social Service (364 | 7.8%), Health Diagnosing & Treating (248 | 5.3%), Management (241 | 5.1%), Business & Financial (228 | 4.9%), and Education Instruction & Library (190 | 4.1%).
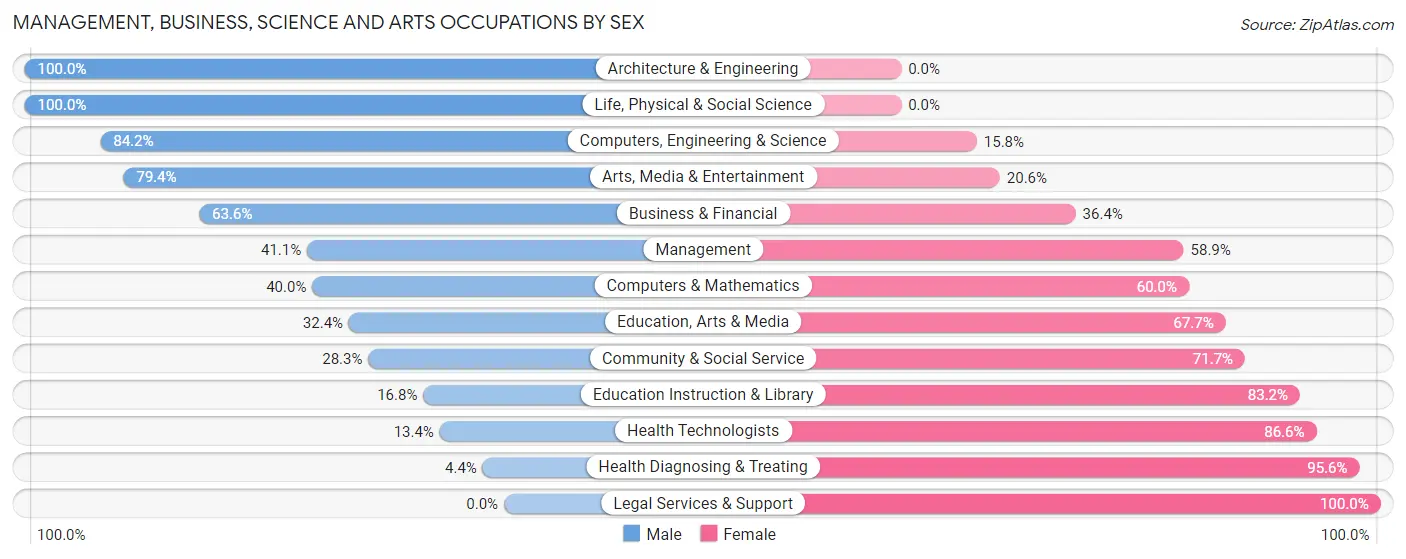
Management, Business, Science and Arts Occupations by Sex
Within the Management, Business, Science and Arts occupations in East Cleveland, the most male-oriented occupations are Architecture & Engineering (100.0%), Life, Physical & Social Science (100.0%), and Computers, Engineering & Science (84.2%), while the most female-oriented occupations are Legal Services & Support (100.0%), Health Diagnosing & Treating (95.6%), and Health Technologists (86.6%).
| Occupation | Male | Female |
| Management | 99 (41.1%) | 142 (58.9%) |
| Business & Financial | 145 (63.6%) | 83 (36.4%) |
| Computers, Engineering & Science | 80 (84.2%) | 15 (15.8%) |
| Computers & Mathematics | 10 (40.0%) | 15 (60.0%) |
| Architecture & Engineering | 39 (100.0%) | 0 (0.0%) |
| Life, Physical & Social Science | 31 (100.0%) | 0 (0.0%) |
| Community & Social Service | 103 (28.3%) | 261 (71.7%) |
| Education, Arts & Media | 44 (32.4%) | 92 (67.6%) |
| Legal Services & Support | 0 (0.0%) | 4 (100.0%) |
| Education Instruction & Library | 32 (16.8%) | 158 (83.2%) |
| Arts, Media & Entertainment | 27 (79.4%) | 7 (20.6%) |
| Health Diagnosing & Treating | 11 (4.4%) | 237 (95.6%) |
| Health Technologists | 11 (13.4%) | 71 (86.6%) |
| Total (Category) | 438 (37.2%) | 738 (62.8%) |
| Total (Overall) | 1,953 (41.6%) | 2,737 (58.4%) |
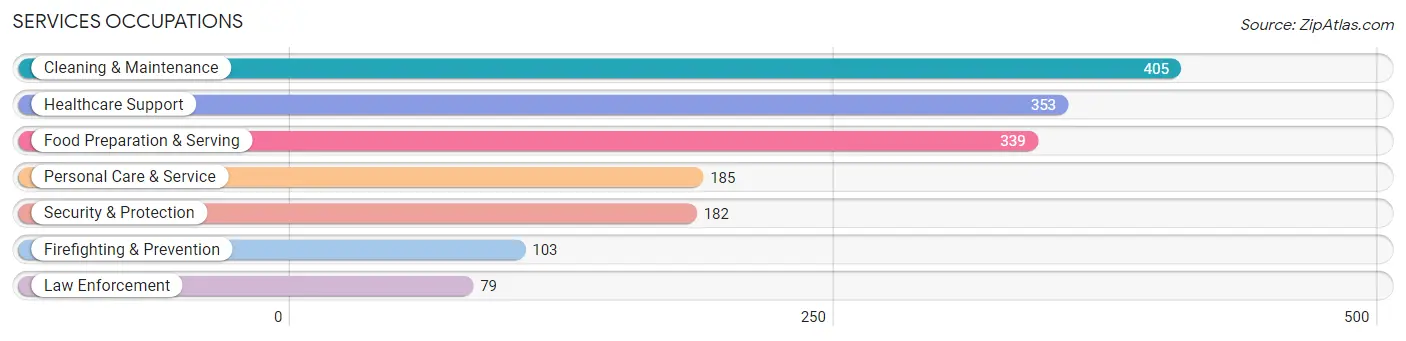
Services Occupations
The most common Services occupations in East Cleveland are Cleaning & Maintenance (405 | 8.6%), Healthcare Support (353 | 7.5%), Food Preparation & Serving (339 | 7.2%), Personal Care & Service (185 | 3.9%), and Security & Protection (182 | 3.9%).
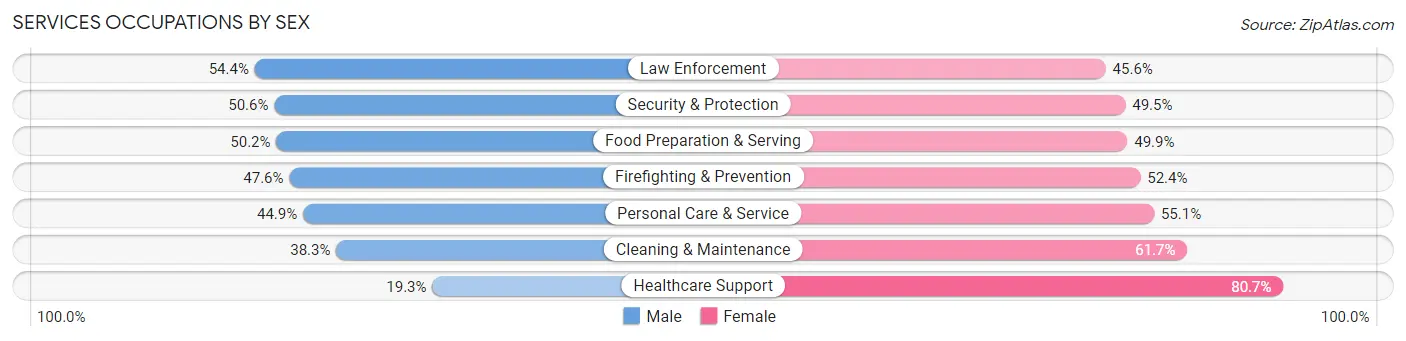
Services Occupations by Sex
Within the Services occupations in East Cleveland, the most male-oriented occupations are Law Enforcement (54.4%), Security & Protection (50.5%), and Food Preparation & Serving (50.1%), while the most female-oriented occupations are Healthcare Support (80.7%), Cleaning & Maintenance (61.7%), and Personal Care & Service (55.1%).
| Occupation | Male | Female |
| Healthcare Support | 68 (19.3%) | 285 (80.7%) |
| Security & Protection | 92 (50.5%) | 90 (49.4%) |
| Firefighting & Prevention | 49 (47.6%) | 54 (52.4%) |
| Law Enforcement | 43 (54.4%) | 36 (45.6%) |
| Food Preparation & Serving | 170 (50.1%) | 169 (49.8%) |
| Cleaning & Maintenance | 155 (38.3%) | 250 (61.7%) |
| Personal Care & Service | 83 (44.9%) | 102 (55.1%) |
| Total (Category) | 568 (38.8%) | 896 (61.2%) |
| Total (Overall) | 1,953 (41.6%) | 2,737 (58.4%) |
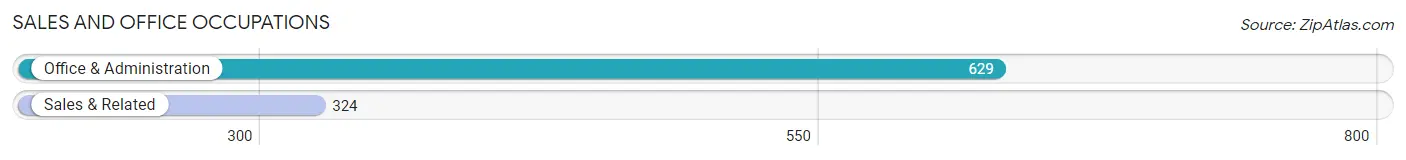
Sales and Office Occupations
The most common Sales and Office occupations in East Cleveland are Office & Administration (629 | 13.4%), and Sales & Related (324 | 6.9%).
Sales and Office Occupations by Sex
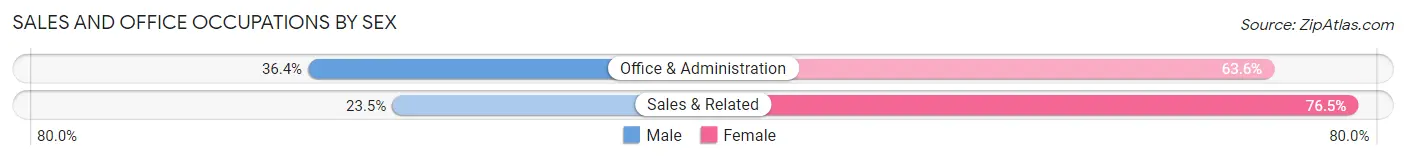
| Occupation | Male | Female |
| Sales & Related | 76 (23.5%) | 248 (76.5%) |
| Office & Administration | 229 (36.4%) | 400 (63.6%) |
| Total (Category) | 305 (32.0%) | 648 (68.0%) |
| Total (Overall) | 1,953 (41.6%) | 2,737 (58.4%) |
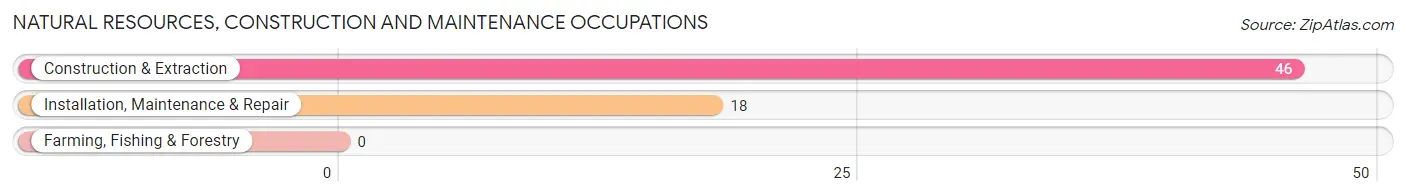
Natural Resources, Construction and Maintenance Occupations
The most common Natural Resources, Construction and Maintenance occupations in East Cleveland are Construction & Extraction (46 | 1.0%), and Installation, Maintenance & Repair (18 | 0.4%).
Natural Resources, Construction and Maintenance Occupations by Sex
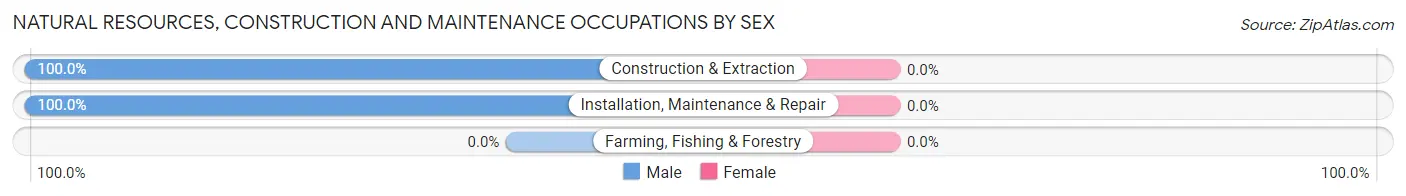
| Occupation | Male | Female |
| Farming, Fishing & Forestry | 0 (0.0%) | 0 (0.0%) |
| Construction & Extraction | 46 (100.0%) | 0 (0.0%) |
| Installation, Maintenance & Repair | 18 (100.0%) | 0 (0.0%) |
| Total (Category) | 64 (100.0%) | 0 (0.0%) |
| Total (Overall) | 1,953 (41.6%) | 2,737 (58.4%) |
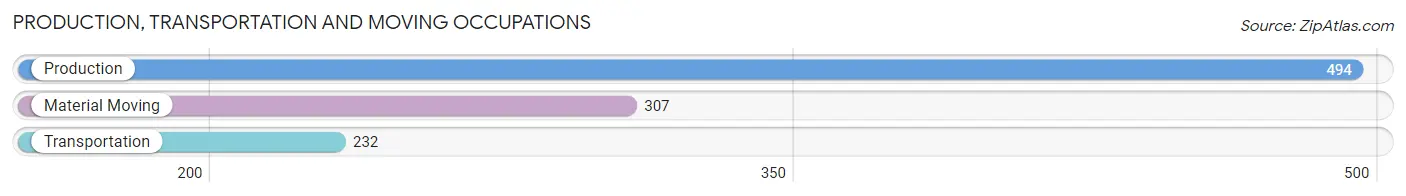
Production, Transportation and Moving Occupations
The most common Production, Transportation and Moving occupations in East Cleveland are Production (494 | 10.5%), Material Moving (307 | 6.6%), and Transportation (232 | 5.0%).
Production, Transportation and Moving Occupations by Sex
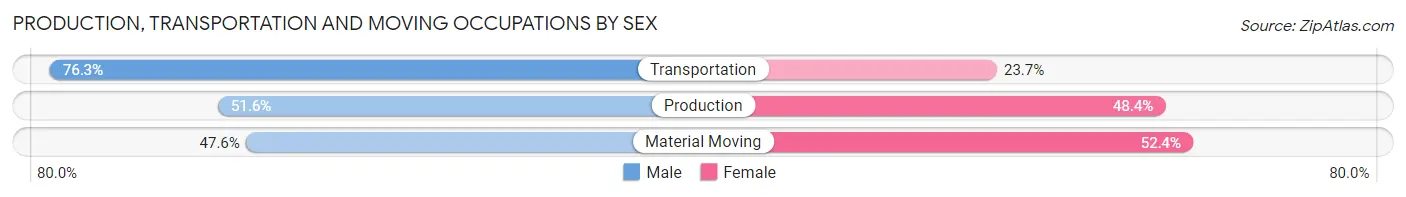
| Occupation | Male | Female |
| Production | 255 (51.6%) | 239 (48.4%) |
| Transportation | 177 (76.3%) | 55 (23.7%) |
| Material Moving | 146 (47.6%) | 161 (52.4%) |
| Total (Category) | 578 (55.9%) | 455 (44.1%) |
| Total (Overall) | 1,953 (41.6%) | 2,737 (58.4%) |
Employment Industries by Sex in East Cleveland
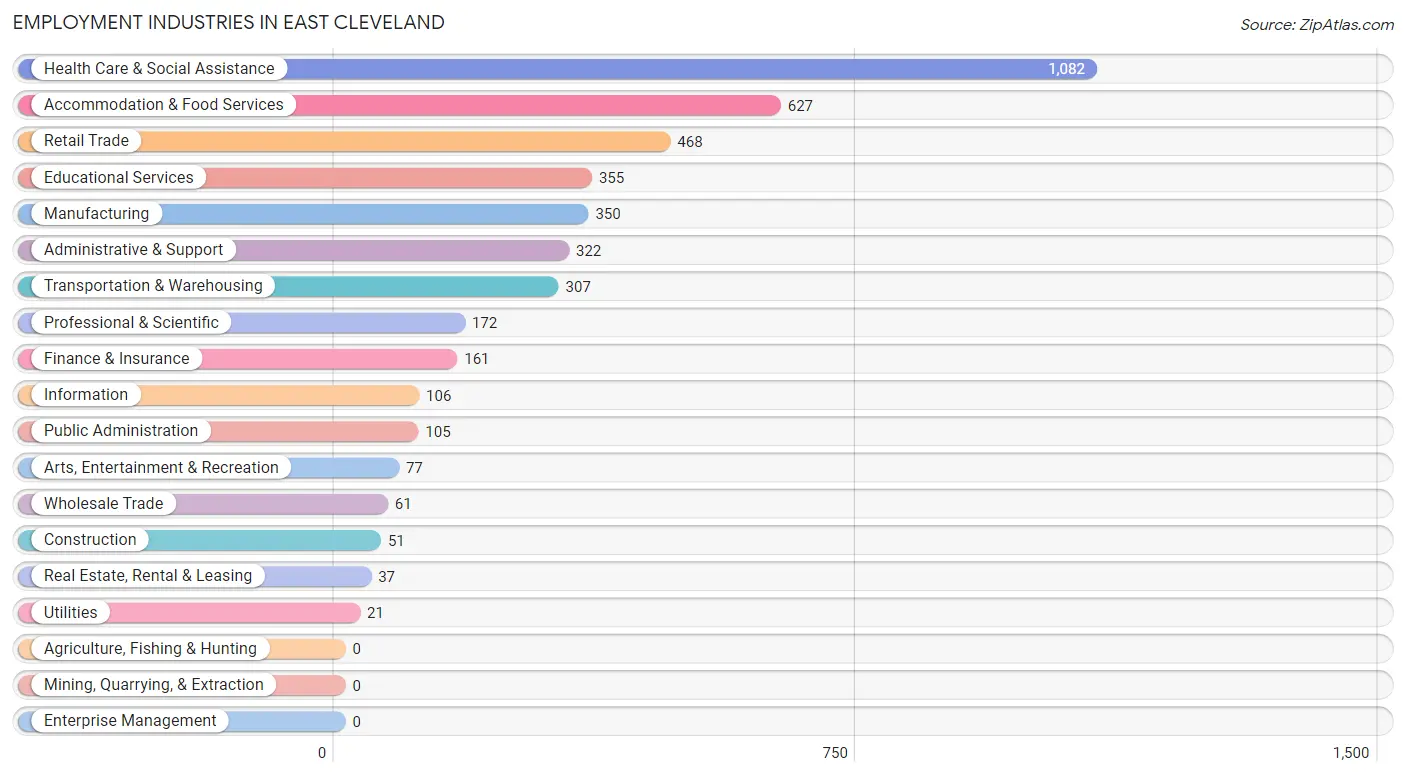
Employment Industries in East Cleveland
The major employment industries in East Cleveland include Health Care & Social Assistance (1,082 | 23.1%), Accommodation & Food Services (627 | 13.4%), Retail Trade (468 | 10.0%), Educational Services (355 | 7.6%), and Manufacturing (350 | 7.5%).
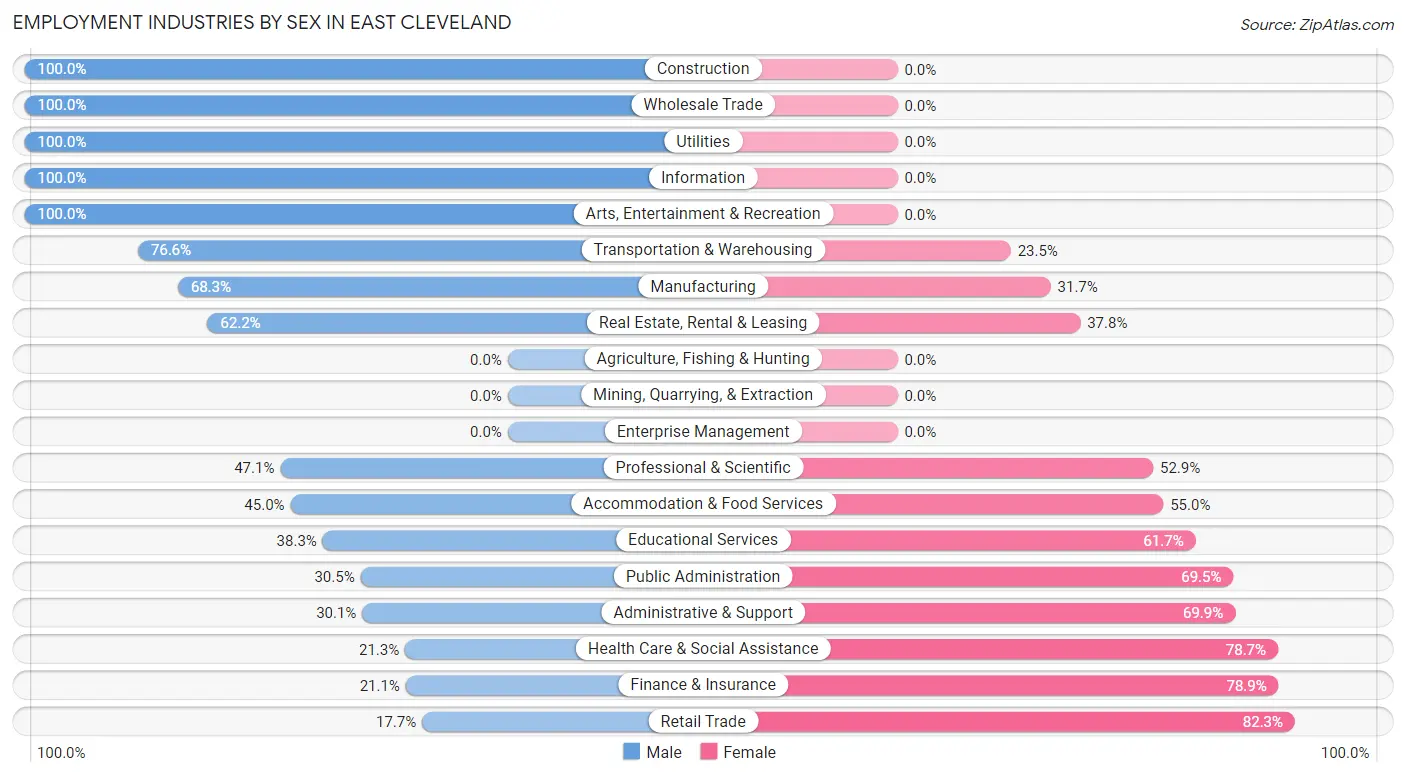
Employment Industries by Sex in East Cleveland
The East Cleveland industries that see more men than women are Construction (100.0%), Wholesale Trade (100.0%), and Utilities (100.0%), whereas the industries that tend to have a higher number of women are Retail Trade (82.3%), Finance & Insurance (78.9%), and Health Care & Social Assistance (78.7%).
| Industry | Male | Female |
| Agriculture, Fishing & Hunting | 0 (0.0%) | 0 (0.0%) |
| Mining, Quarrying, & Extraction | 0 (0.0%) | 0 (0.0%) |
| Construction | 51 (100.0%) | 0 (0.0%) |
| Manufacturing | 239 (68.3%) | 111 (31.7%) |
| Wholesale Trade | 61 (100.0%) | 0 (0.0%) |
| Retail Trade | 83 (17.7%) | 385 (82.3%) |
| Transportation & Warehousing | 235 (76.5%) | 72 (23.4%) |
| Utilities | 21 (100.0%) | 0 (0.0%) |
| Information | 106 (100.0%) | 0 (0.0%) |
| Finance & Insurance | 34 (21.1%) | 127 (78.9%) |
| Real Estate, Rental & Leasing | 23 (62.2%) | 14 (37.8%) |
| Professional & Scientific | 81 (47.1%) | 91 (52.9%) |
| Enterprise Management | 0 (0.0%) | 0 (0.0%) |
| Administrative & Support | 97 (30.1%) | 225 (69.9%) |
| Educational Services | 136 (38.3%) | 219 (61.7%) |
| Health Care & Social Assistance | 230 (21.3%) | 852 (78.7%) |
| Arts, Entertainment & Recreation | 77 (100.0%) | 0 (0.0%) |
| Accommodation & Food Services | 282 (45.0%) | 345 (55.0%) |
| Public Administration | 32 (30.5%) | 73 (69.5%) |
| Total | 1,953 (41.6%) | 2,737 (58.4%) |
Education in East Cleveland
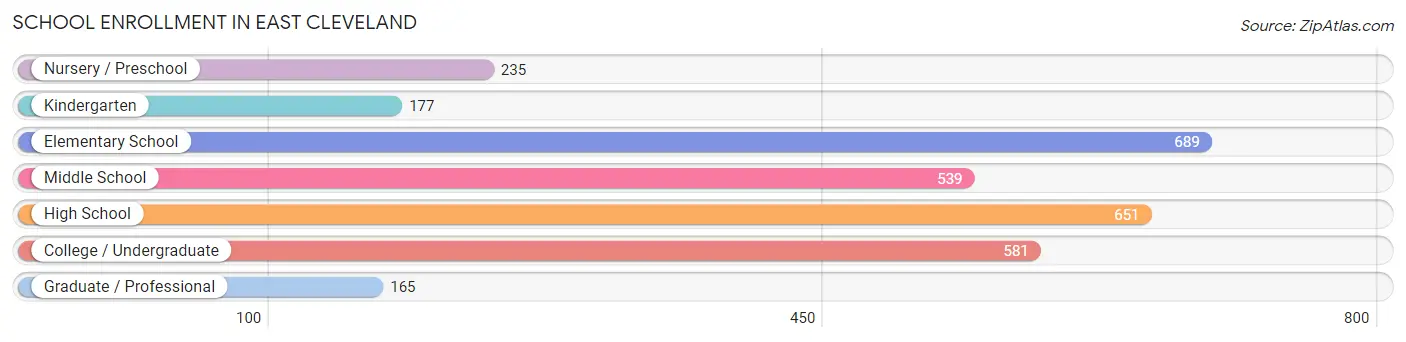
School Enrollment in East Cleveland
The most common levels of schooling among the 3,037 students in East Cleveland are elementary school (689 | 22.7%), high school (651 | 21.4%), and college / undergraduate (581 | 19.1%).
| School Level | # Students | % Students |
| Nursery / Preschool | 235 | 7.7% |
| Kindergarten | 177 | 5.8% |
| Elementary School | 689 | 22.7% |
| Middle School | 539 | 17.7% |
| High School | 651 | 21.4% |
| College / Undergraduate | 581 | 19.1% |
| Graduate / Professional | 165 | 5.4% |
| Total | 3,037 | 100.0% |
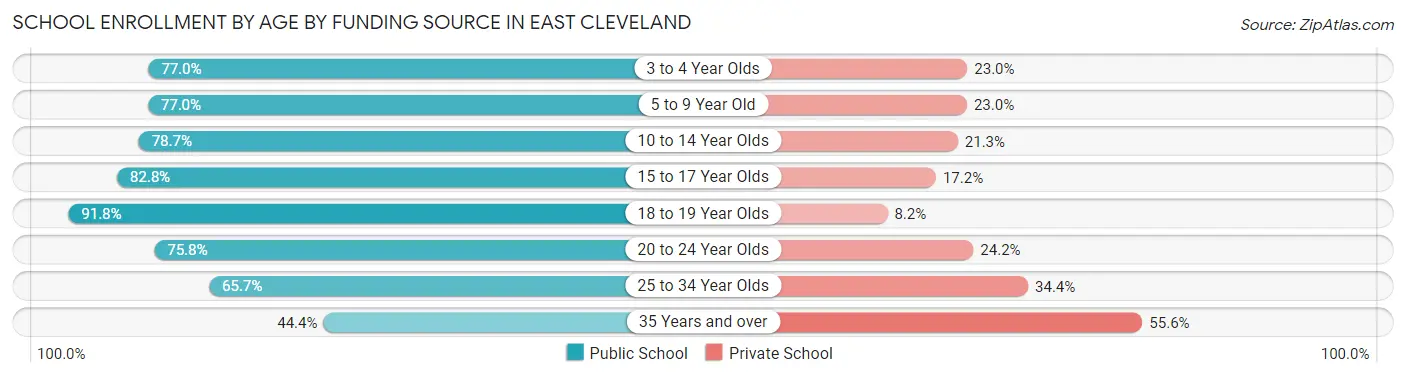
School Enrollment by Age by Funding Source in East Cleveland
Out of a total of 3,037 students who are enrolled in schools in East Cleveland, 765 (25.2%) attend a private institution, while the remaining 2,272 (74.8%) are enrolled in public schools. The age group of 35 years and over has the highest likelihood of being enrolled in private schools, with 148 (55.6% in the age bracket) enrolled. Conversely, the age group of 18 to 19 year olds has the lowest likelihood of being enrolled in a private school, with 135 (91.8% in the age bracket) attending a public institution.
| Age Bracket | Public School | Private School |
| 3 to 4 Year Olds | 167 (77.0%) | 50 (23.0%) |
| 5 to 9 Year Old | 617 (77.0%) | 184 (23.0%) |
| 10 to 14 Year Olds | 522 (78.7%) | 141 (21.3%) |
| 15 to 17 Year Olds | 361 (82.8%) | 75 (17.2%) |
| 18 to 19 Year Olds | 135 (91.8%) | 12 (8.2%) |
| 20 to 24 Year Olds | 135 (75.8%) | 43 (24.2%) |
| 25 to 34 Year Olds | 216 (65.6%) | 113 (34.4%) |
| 35 Years and over | 118 (44.4%) | 148 (55.6%) |
| Total | 2,272 (74.8%) | 765 (25.2%) |
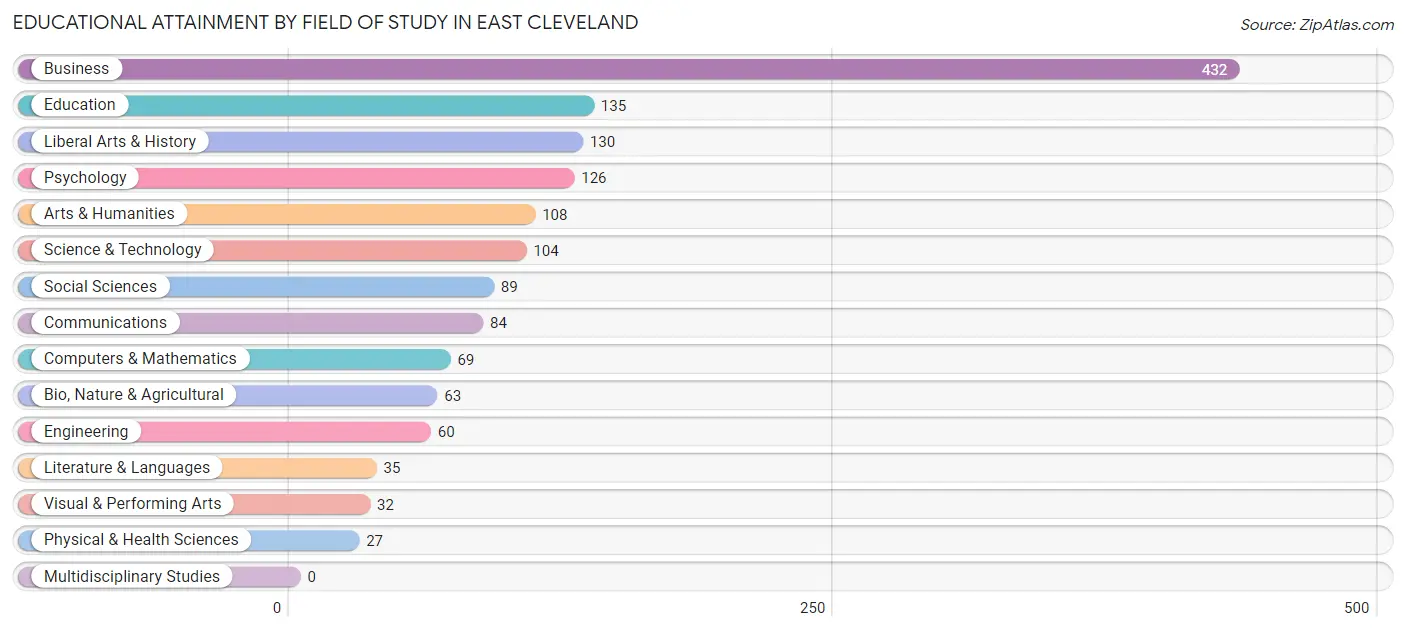
Educational Attainment by Field of Study in East Cleveland
Business (432 | 28.9%), education (135 | 9.0%), liberal arts & history (130 | 8.7%), psychology (126 | 8.4%), and arts & humanities (108 | 7.2%) are the most common fields of study among 1,494 individuals in East Cleveland who have obtained a bachelor's degree or higher.
| Field of Study | # Graduates | % Graduates |
| Computers & Mathematics | 69 | 4.6% |
| Bio, Nature & Agricultural | 63 | 4.2% |
| Physical & Health Sciences | 27 | 1.8% |
| Psychology | 126 | 8.4% |
| Social Sciences | 89 | 6.0% |
| Engineering | 60 | 4.0% |
| Multidisciplinary Studies | 0 | 0.0% |
| Science & Technology | 104 | 7.0% |
| Business | 432 | 28.9% |
| Education | 135 | 9.0% |
| Literature & Languages | 35 | 2.3% |
| Liberal Arts & History | 130 | 8.7% |
| Visual & Performing Arts | 32 | 2.1% |
| Communications | 84 | 5.6% |
| Arts & Humanities | 108 | 7.2% |
| Total | 1,494 | 100.0% |
Transportation & Commute in East Cleveland
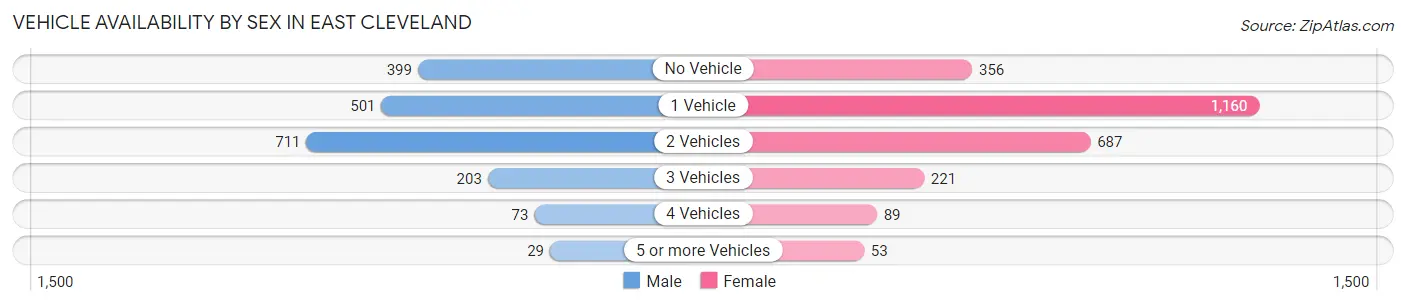
Vehicle Availability by Sex in East Cleveland
The most prevalent vehicle ownership categories in East Cleveland are males with 2 vehicles (711, accounting for 37.1%) and females with 2 vehicles (687, making up 27.7%).
| Vehicles Available | Male | Female |
| No Vehicle | 399 (20.8%) | 356 (13.9%) |
| 1 Vehicle | 501 (26.2%) | 1,160 (45.2%) |
| 2 Vehicles | 711 (37.1%) | 687 (26.8%) |
| 3 Vehicles | 203 (10.6%) | 221 (8.6%) |
| 4 Vehicles | 73 (3.8%) | 89 (3.5%) |
| 5 or more Vehicles | 29 (1.5%) | 53 (2.1%) |
| Total | 1,916 (100.0%) | 2,566 (100.0%) |
Commute Time in East Cleveland
The most frequently occuring commute durations in East Cleveland are 20 to 24 minutes (990 commuters, 23.3%), 30 to 34 minutes (667 commuters, 15.7%), and 15 to 19 minutes (480 commuters, 11.3%).
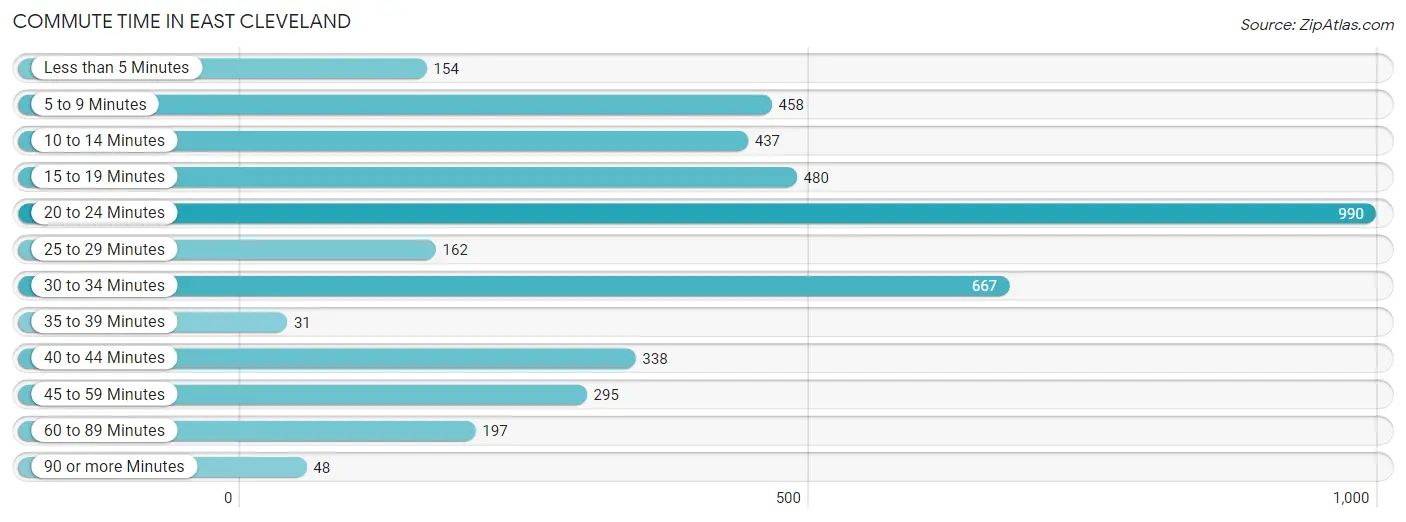
| Commute Time | # Commuters | % Commuters |
| Less than 5 Minutes | 154 | 3.6% |
| 5 to 9 Minutes | 458 | 10.8% |
| 10 to 14 Minutes | 437 | 10.3% |
| 15 to 19 Minutes | 480 | 11.3% |
| 20 to 24 Minutes | 990 | 23.3% |
| 25 to 29 Minutes | 162 | 3.8% |
| 30 to 34 Minutes | 667 | 15.7% |
| 35 to 39 Minutes | 31 | 0.7% |
| 40 to 44 Minutes | 338 | 7.9% |
| 45 to 59 Minutes | 295 | 6.9% |
| 60 to 89 Minutes | 197 | 4.6% |
| 90 or more Minutes | 48 | 1.1% |
Commute Time by Sex in East Cleveland
The most common commute times in East Cleveland are 30 to 34 minutes (345 commuters, 18.3%) for males and 20 to 24 minutes (774 commuters, 32.6%) for females.
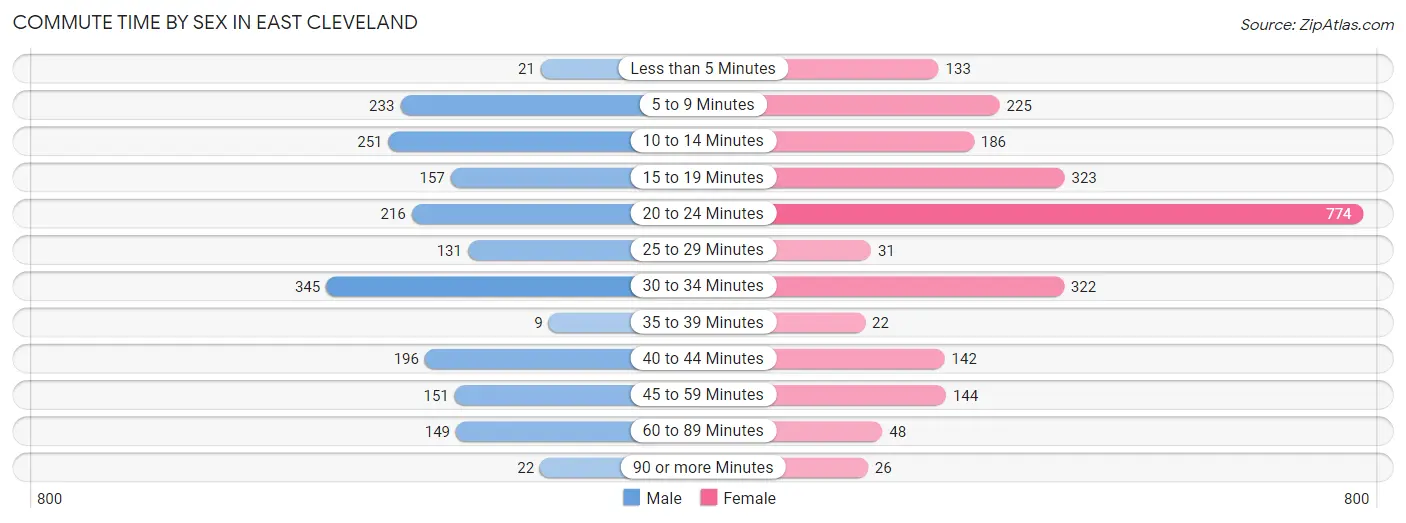
| Commute Time | Male | Female |
| Less than 5 Minutes | 21 (1.1%) | 133 (5.6%) |
| 5 to 9 Minutes | 233 (12.4%) | 225 (9.5%) |
| 10 to 14 Minutes | 251 (13.3%) | 186 (7.8%) |
| 15 to 19 Minutes | 157 (8.4%) | 323 (13.6%) |
| 20 to 24 Minutes | 216 (11.5%) | 774 (32.6%) |
| 25 to 29 Minutes | 131 (7.0%) | 31 (1.3%) |
| 30 to 34 Minutes | 345 (18.3%) | 322 (13.6%) |
| 35 to 39 Minutes | 9 (0.5%) | 22 (0.9%) |
| 40 to 44 Minutes | 196 (10.4%) | 142 (6.0%) |
| 45 to 59 Minutes | 151 (8.0%) | 144 (6.1%) |
| 60 to 89 Minutes | 149 (7.9%) | 48 (2.0%) |
| 90 or more Minutes | 22 (1.2%) | 26 (1.1%) |
Time of Departure to Work by Sex in East Cleveland
The most frequent times of departure to work in East Cleveland are 8:00 AM to 8:29 AM (296, 15.7%) for males and 4:00 PM to 11:59 PM (478, 20.1%) for females.
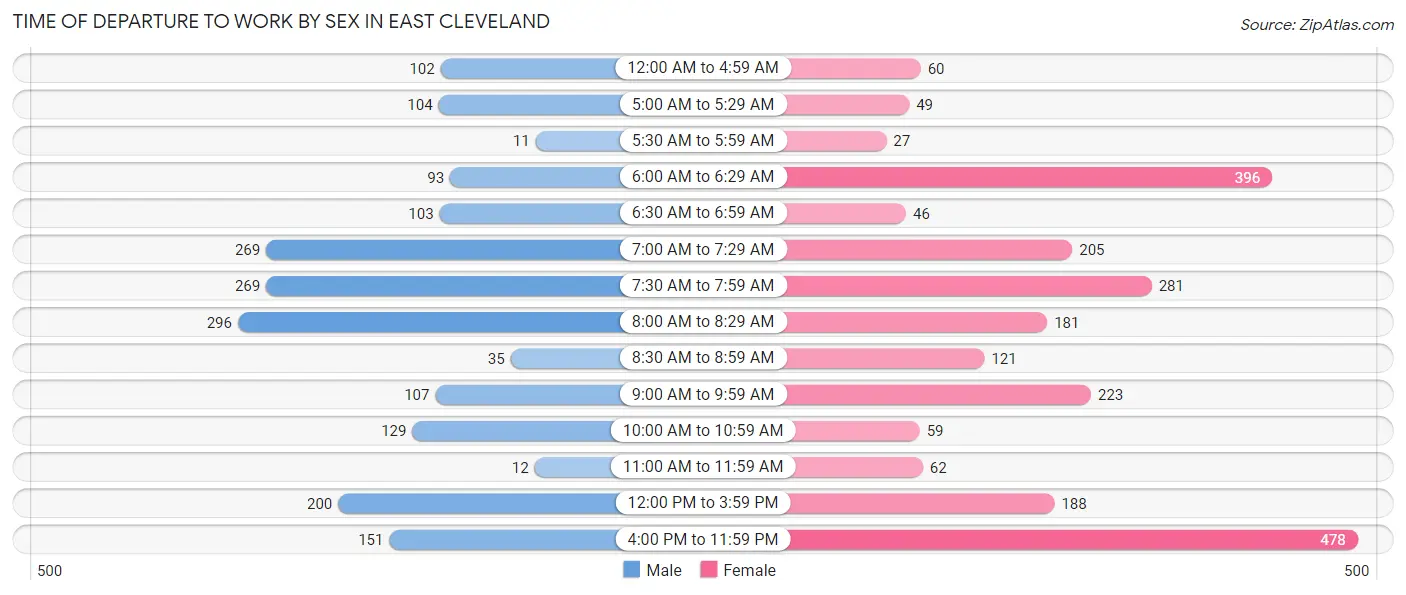
| Time of Departure | Male | Female |
| 12:00 AM to 4:59 AM | 102 (5.4%) | 60 (2.5%) |
| 5:00 AM to 5:29 AM | 104 (5.5%) | 49 (2.1%) |
| 5:30 AM to 5:59 AM | 11 (0.6%) | 27 (1.1%) |
| 6:00 AM to 6:29 AM | 93 (4.9%) | 396 (16.7%) |
| 6:30 AM to 6:59 AM | 103 (5.5%) | 46 (1.9%) |
| 7:00 AM to 7:29 AM | 269 (14.3%) | 205 (8.6%) |
| 7:30 AM to 7:59 AM | 269 (14.3%) | 281 (11.8%) |
| 8:00 AM to 8:29 AM | 296 (15.7%) | 181 (7.6%) |
| 8:30 AM to 8:59 AM | 35 (1.9%) | 121 (5.1%) |
| 9:00 AM to 9:59 AM | 107 (5.7%) | 223 (9.4%) |
| 10:00 AM to 10:59 AM | 129 (6.9%) | 59 (2.5%) |
| 11:00 AM to 11:59 AM | 12 (0.6%) | 62 (2.6%) |
| 12:00 PM to 3:59 PM | 200 (10.6%) | 188 (7.9%) |
| 4:00 PM to 11:59 PM | 151 (8.0%) | 478 (20.1%) |
| Total | 1,881 (100.0%) | 2,376 (100.0%) |
Housing Occupancy in East Cleveland
Occupancy by Ownership in East Cleveland
Of the total 6,576 dwellings in East Cleveland, owner-occupied units account for 2,031 (30.9%), while renter-occupied units make up 4,545 (69.1%).
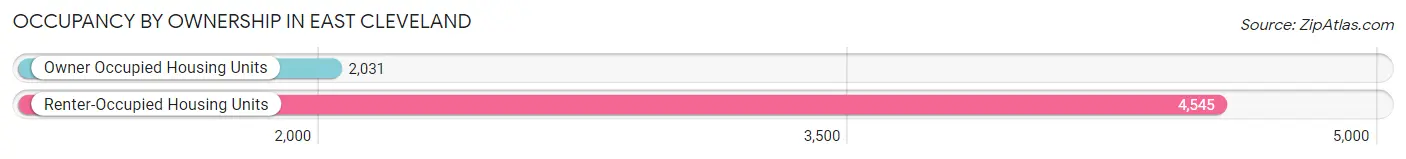
| Occupancy | # Housing Units | % Housing Units |
| Owner Occupied Housing Units | 2,031 | 30.9% |
| Renter-Occupied Housing Units | 4,545 | 69.1% |
| Total Occupied Housing Units | 6,576 | 100.0% |
Occupancy by Household Size in East Cleveland
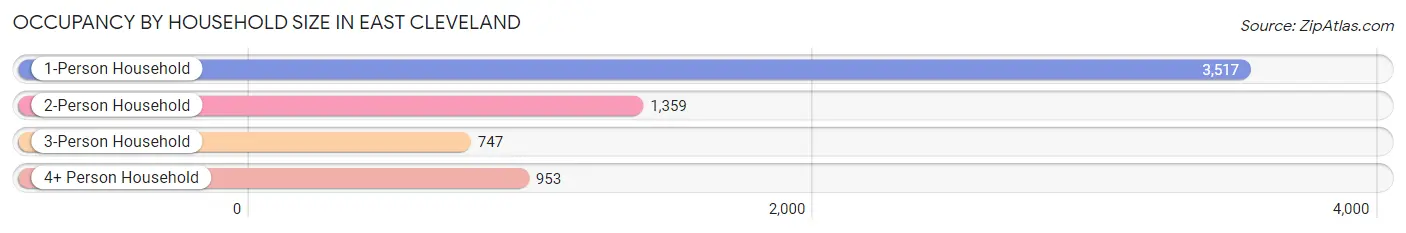
| Household Size | # Housing Units | % Housing Units |
| 1-Person Household | 3,517 | 53.5% |
| 2-Person Household | 1,359 | 20.7% |
| 3-Person Household | 747 | 11.4% |
| 4+ Person Household | 953 | 14.5% |
| Total Housing Units | 6,576 | 100.0% |
Occupancy by Ownership by Household Size in East Cleveland
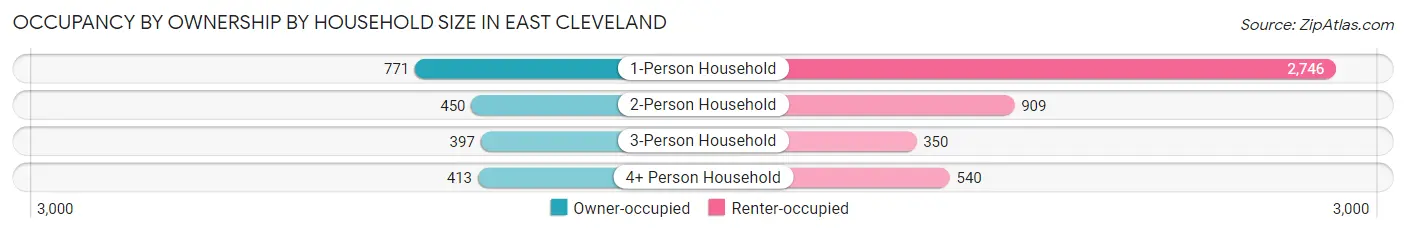
| Household Size | Owner-occupied | Renter-occupied |
| 1-Person Household | 771 (21.9%) | 2,746 (78.1%) |
| 2-Person Household | 450 (33.1%) | 909 (66.9%) |
| 3-Person Household | 397 (53.1%) | 350 (46.9%) |
| 4+ Person Household | 413 (43.3%) | 540 (56.7%) |
| Total Housing Units | 2,031 (30.9%) | 4,545 (69.1%) |
Occupancy by Educational Attainment in East Cleveland
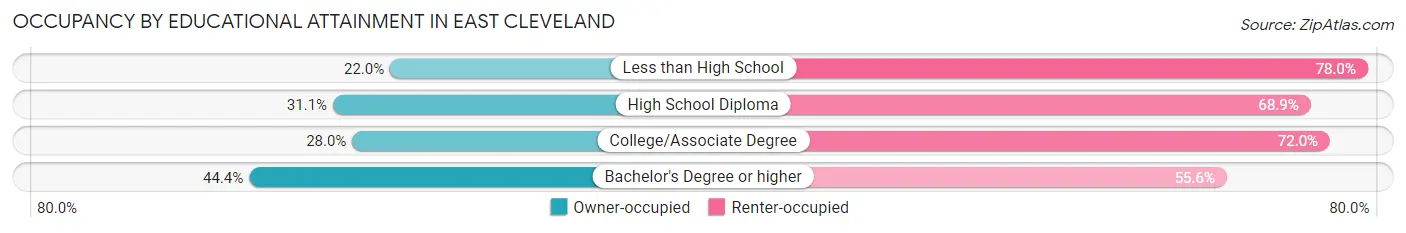
| Household Size | Owner-occupied | Renter-occupied |
| Less than High School | 236 (22.0%) | 835 (78.0%) |
| High School Diploma | 612 (31.1%) | 1,356 (68.9%) |
| College/Associate Degree | 664 (28.0%) | 1,704 (72.0%) |
| Bachelor's Degree or higher | 519 (44.4%) | 650 (55.6%) |
Occupancy by Age of Householder in East Cleveland
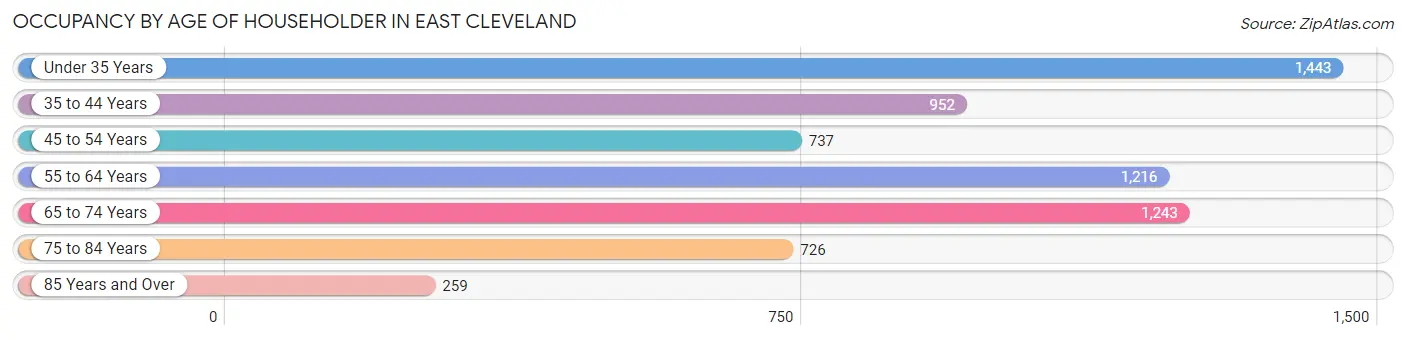
| Age Bracket | # Households | % Households |
| Under 35 Years | 1,443 | 21.9% |
| 35 to 44 Years | 952 | 14.5% |
| 45 to 54 Years | 737 | 11.2% |
| 55 to 64 Years | 1,216 | 18.5% |
| 65 to 74 Years | 1,243 | 18.9% |
| 75 to 84 Years | 726 | 11.0% |
| 85 Years and Over | 259 | 3.9% |
| Total | 6,576 | 100.0% |
Housing Finances in East Cleveland
Median Income by Occupancy in East Cleveland
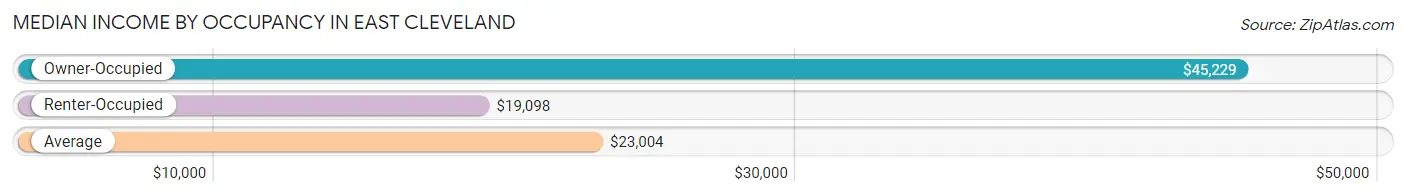
| Occupancy Type | # Households | Median Income |
| Owner-Occupied | 2,031 (30.9%) | $45,229 |
| Renter-Occupied | 4,545 (69.1%) | $19,098 |
| Average | 6,576 (100.0%) | $23,004 |
Occupancy by Householder Income Bracket in East Cleveland
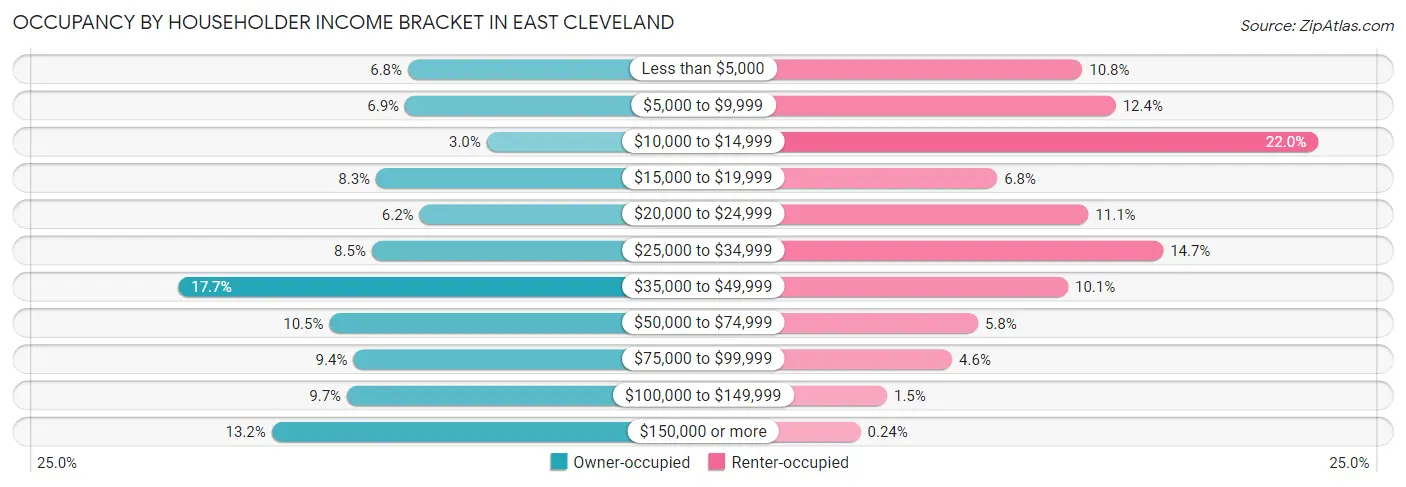
| Income Bracket | Owner-occupied | Renter-occupied |
| Less than $5,000 | 137 (6.8%) | 491 (10.8%) |
| $5,000 to $9,999 | 140 (6.9%) | 563 (12.4%) |
| $10,000 to $14,999 | 61 (3.0%) | 1,001 (22.0%) |
| $15,000 to $19,999 | 168 (8.3%) | 307 (6.8%) |
| $20,000 to $24,999 | 126 (6.2%) | 504 (11.1%) |
| $25,000 to $34,999 | 172 (8.5%) | 666 (14.6%) |
| $35,000 to $49,999 | 359 (17.7%) | 460 (10.1%) |
| $50,000 to $74,999 | 213 (10.5%) | 265 (5.8%) |
| $75,000 to $99,999 | 190 (9.3%) | 209 (4.6%) |
| $100,000 to $149,999 | 196 (9.7%) | 68 (1.5%) |
| $150,000 or more | 269 (13.2%) | 11 (0.2%) |
| Total | 2,031 (100.0%) | 4,545 (100.0%) |
Monthly Housing Cost Tiers in East Cleveland
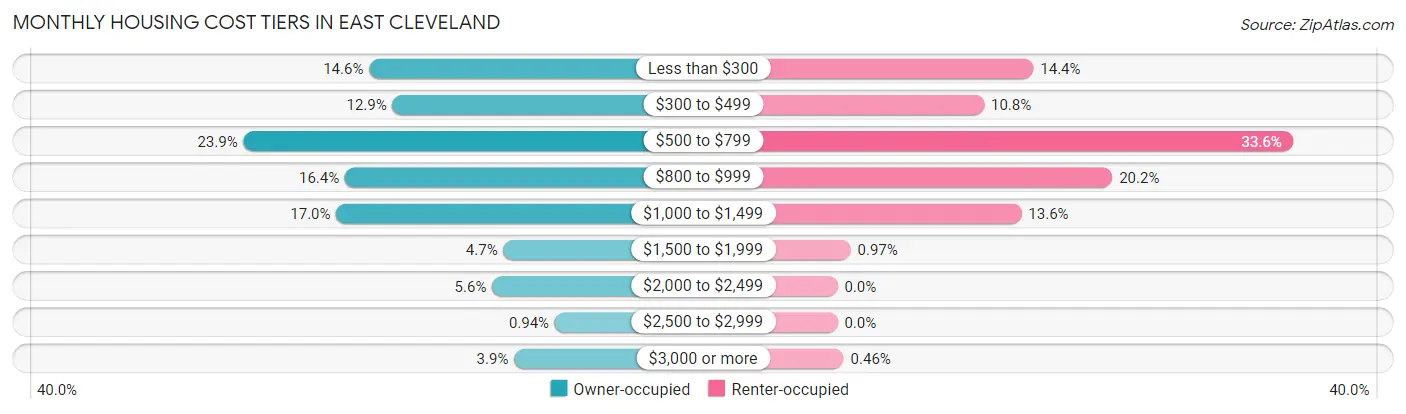
| Monthly Cost | Owner-occupied | Renter-occupied |
| Less than $300 | 297 (14.6%) | 656 (14.4%) |
| $300 to $499 | 262 (12.9%) | 491 (10.8%) |
| $500 to $799 | 485 (23.9%) | 1,527 (33.6%) |
| $800 to $999 | 333 (16.4%) | 920 (20.2%) |
| $1,000 to $1,499 | 346 (17.0%) | 616 (13.6%) |
| $1,500 to $1,999 | 96 (4.7%) | 44 (1.0%) |
| $2,000 to $2,499 | 113 (5.6%) | 0 (0.0%) |
| $2,500 to $2,999 | 19 (0.9%) | 0 (0.0%) |
| $3,000 or more | 80 (3.9%) | 21 (0.5%) |
| Total | 2,031 (100.0%) | 4,545 (100.0%) |
Physical Housing Characteristics in East Cleveland
Housing Structures in East Cleveland
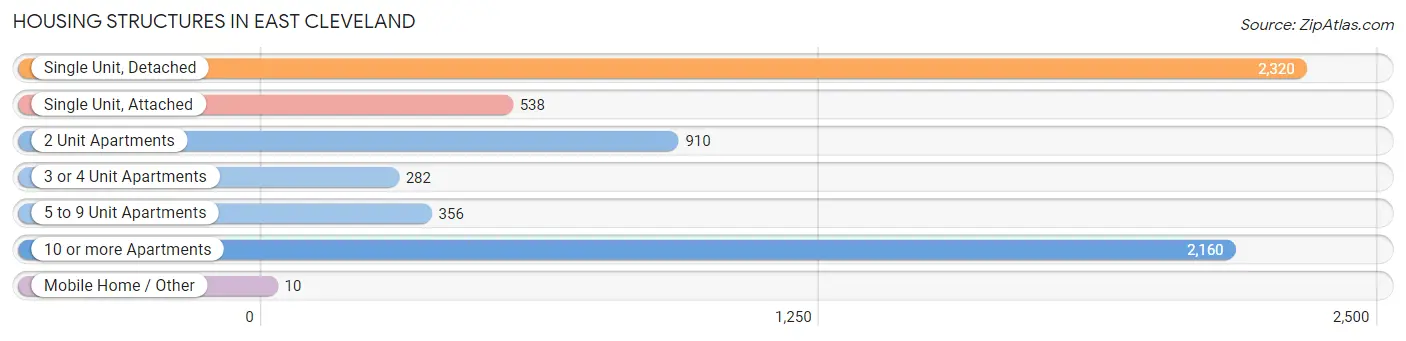
| Structure Type | # Housing Units | % Housing Units |
| Single Unit, Detached | 2,320 | 35.3% |
| Single Unit, Attached | 538 | 8.2% |
| 2 Unit Apartments | 910 | 13.8% |
| 3 or 4 Unit Apartments | 282 | 4.3% |
| 5 to 9 Unit Apartments | 356 | 5.4% |
| 10 or more Apartments | 2,160 | 32.9% |
| Mobile Home / Other | 10 | 0.2% |
| Total | 6,576 | 100.0% |
Housing Structures by Occupancy in East Cleveland
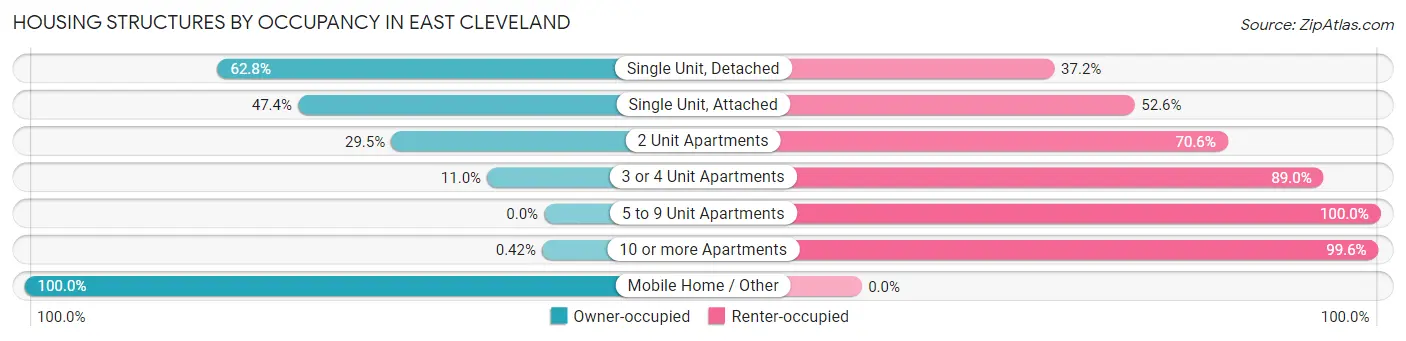
| Structure Type | Owner-occupied | Renter-occupied |
| Single Unit, Detached | 1,458 (62.8%) | 862 (37.2%) |
| Single Unit, Attached | 255 (47.4%) | 283 (52.6%) |
| 2 Unit Apartments | 268 (29.4%) | 642 (70.6%) |
| 3 or 4 Unit Apartments | 31 (11.0%) | 251 (89.0%) |
| 5 to 9 Unit Apartments | 0 (0.0%) | 356 (100.0%) |
| 10 or more Apartments | 9 (0.4%) | 2,151 (99.6%) |
| Mobile Home / Other | 10 (100.0%) | 0 (0.0%) |
| Total | 2,031 (30.9%) | 4,545 (69.1%) |
Housing Structures by Number of Rooms in East Cleveland
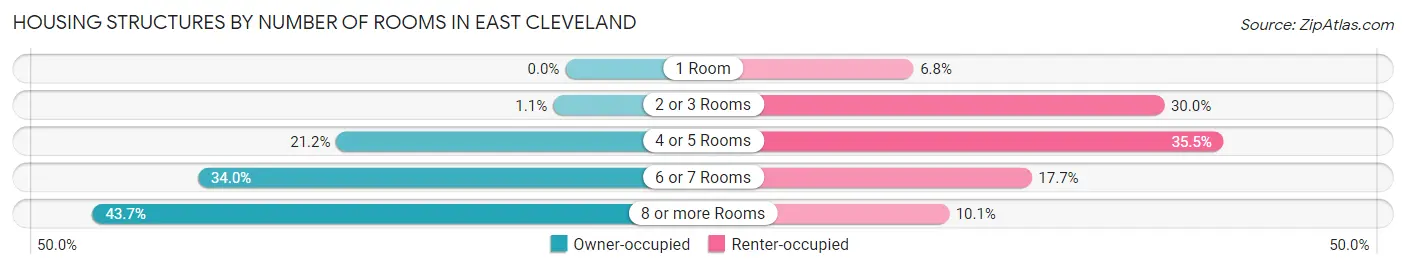
| Number of Rooms | Owner-occupied | Renter-occupied |
| 1 Room | 0 (0.0%) | 308 (6.8%) |
| 2 or 3 Rooms | 23 (1.1%) | 1,362 (30.0%) |
| 4 or 5 Rooms | 430 (21.2%) | 1,613 (35.5%) |
| 6 or 7 Rooms | 690 (34.0%) | 805 (17.7%) |
| 8 or more Rooms | 888 (43.7%) | 457 (10.1%) |
| Total | 2,031 (100.0%) | 4,545 (100.0%) |
Housing Structure by Heating Type in East Cleveland
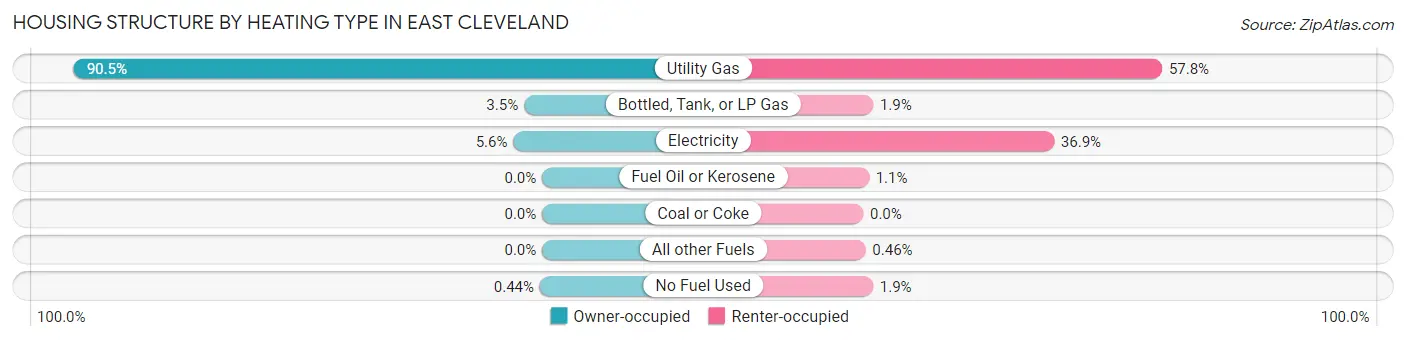
| Heating Type | Owner-occupied | Renter-occupied |
| Utility Gas | 1,838 (90.5%) | 2,625 (57.8%) |
| Bottled, Tank, or LP Gas | 71 (3.5%) | 87 (1.9%) |
| Electricity | 113 (5.6%) | 1,676 (36.9%) |
| Fuel Oil or Kerosene | 0 (0.0%) | 50 (1.1%) |
| Coal or Coke | 0 (0.0%) | 0 (0.0%) |
| All other Fuels | 0 (0.0%) | 21 (0.5%) |
| No Fuel Used | 9 (0.4%) | 86 (1.9%) |
| Total | 2,031 (100.0%) | 4,545 (100.0%) |
Household Vehicle Usage in East Cleveland
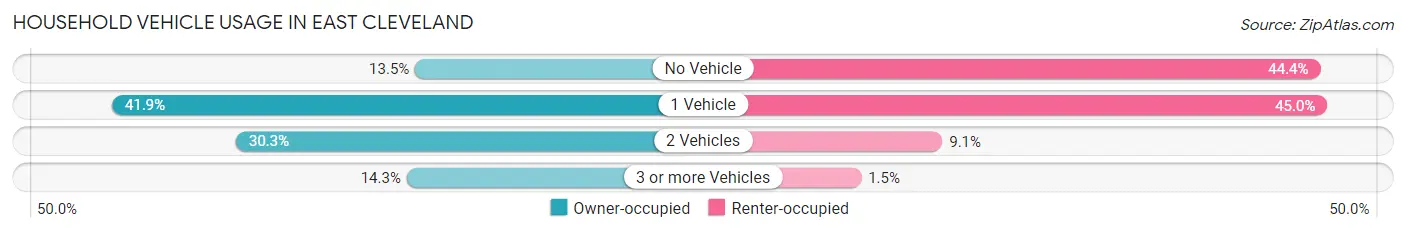
| Vehicles per Household | Owner-occupied | Renter-occupied |
| No Vehicle | 275 (13.5%) | 2,017 (44.4%) |
| 1 Vehicle | 850 (41.8%) | 2,046 (45.0%) |
| 2 Vehicles | 615 (30.3%) | 413 (9.1%) |
| 3 or more Vehicles | 291 (14.3%) | 69 (1.5%) |
| Total | 2,031 (100.0%) | 4,545 (100.0%) |
Real Estate & Mortgages in East Cleveland
Real Estate and Mortgage Overview in East Cleveland
| Characteristic | Without Mortgage | With Mortgage |
| Housing Units | 1,205 | 826 |
| Median Property Value | $56,700 | $96,000 |
| Median Household Income | $40,274 | $63 |
| Monthly Housing Costs | $524 | $10 |
| Real Estate Taxes | $1,331 | $28 |
Property Value by Mortgage Status in East Cleveland
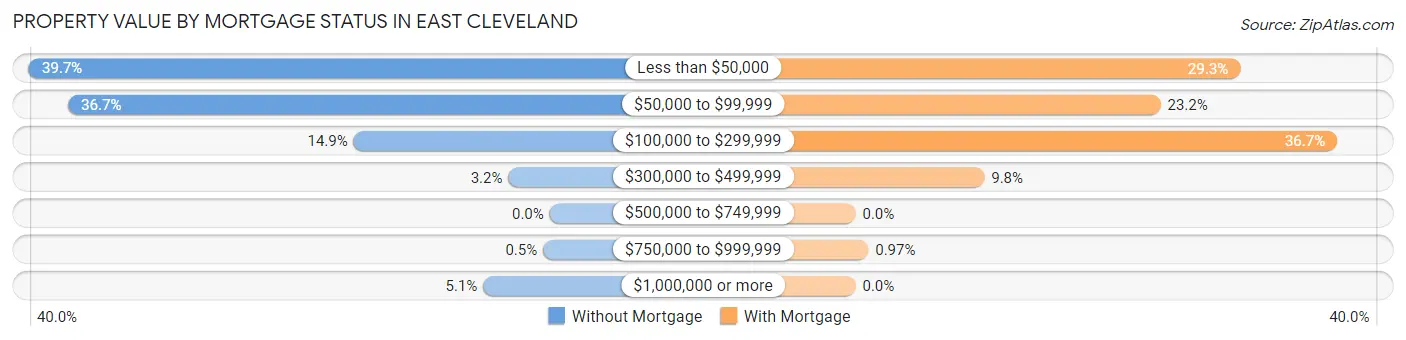
| Property Value | Without Mortgage | With Mortgage |
| Less than $50,000 | 478 (39.7%) | 242 (29.3%) |
| $50,000 to $99,999 | 442 (36.7%) | 192 (23.2%) |
| $100,000 to $299,999 | 180 (14.9%) | 303 (36.7%) |
| $300,000 to $499,999 | 38 (3.2%) | 81 (9.8%) |
| $500,000 to $749,999 | 0 (0.0%) | 0 (0.0%) |
| $750,000 to $999,999 | 6 (0.5%) | 8 (1.0%) |
| $1,000,000 or more | 61 (5.1%) | 0 (0.0%) |
| Total | 1,205 (100.0%) | 826 (100.0%) |
Household Income by Mortgage Status in East Cleveland
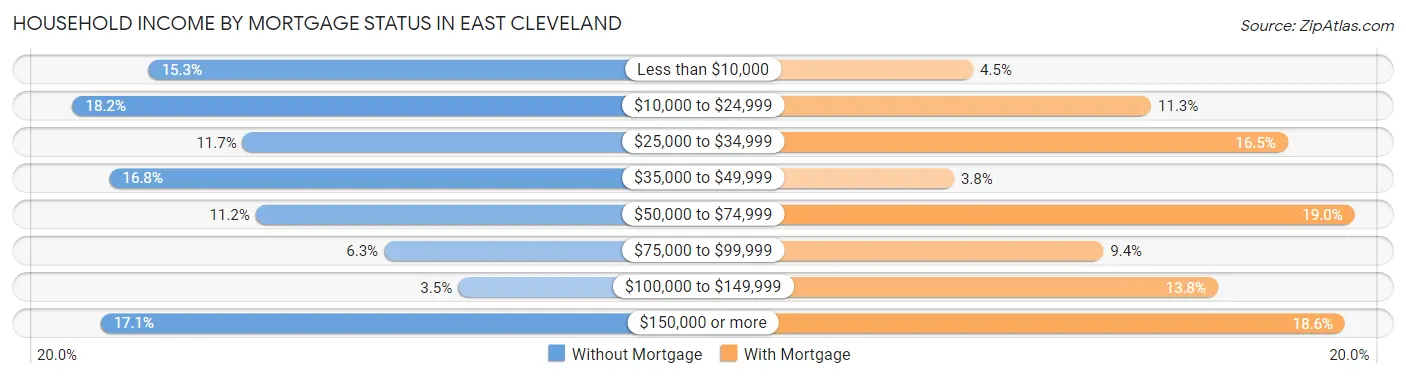
| Household Income | Without Mortgage | With Mortgage |
| Less than $10,000 | 184 (15.3%) | 37 (4.5%) |
| $10,000 to $24,999 | 219 (18.2%) | 93 (11.3%) |
| $25,000 to $34,999 | 141 (11.7%) | 136 (16.5%) |
| $35,000 to $49,999 | 202 (16.8%) | 31 (3.7%) |
| $50,000 to $74,999 | 135 (11.2%) | 157 (19.0%) |
| $75,000 to $99,999 | 76 (6.3%) | 78 (9.4%) |
| $100,000 to $149,999 | 42 (3.5%) | 114 (13.8%) |
| $150,000 or more | 206 (17.1%) | 154 (18.6%) |
| Total | 1,205 (100.0%) | 826 (100.0%) |
Property Value to Household Income Ratio in East Cleveland
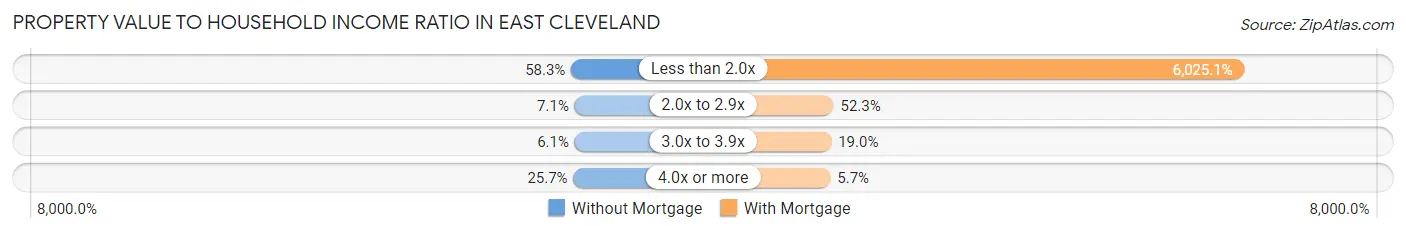
| Value-to-Income Ratio | Without Mortgage | With Mortgage |
| Less than 2.0x | 702 (58.3%) | 49,767 (6,025.1%) |
| 2.0x to 2.9x | 86 (7.1%) | 432 (52.3%) |
| 3.0x to 3.9x | 74 (6.1%) | 157 (19.0%) |
| 4.0x or more | 310 (25.7%) | 47 (5.7%) |
| Total | 1,205 (100.0%) | 826 (100.0%) |
Real Estate Taxes by Mortgage Status in East Cleveland
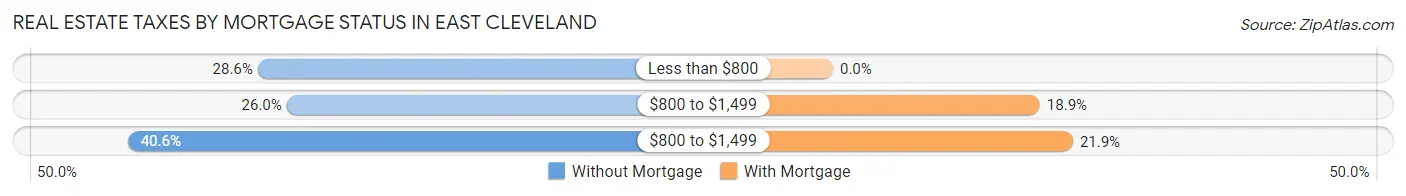
| Property Taxes | Without Mortgage | With Mortgage |
| Less than $800 | 345 (28.6%) | 0 (0.0%) |
| $800 to $1,499 | 313 (26.0%) | 156 (18.9%) |
| $800 to $1,499 | 489 (40.6%) | 181 (21.9%) |
| Total | 1,205 (100.0%) | 826 (100.0%) |
Health & Disability in East Cleveland
Health Insurance Coverage by Age in East Cleveland
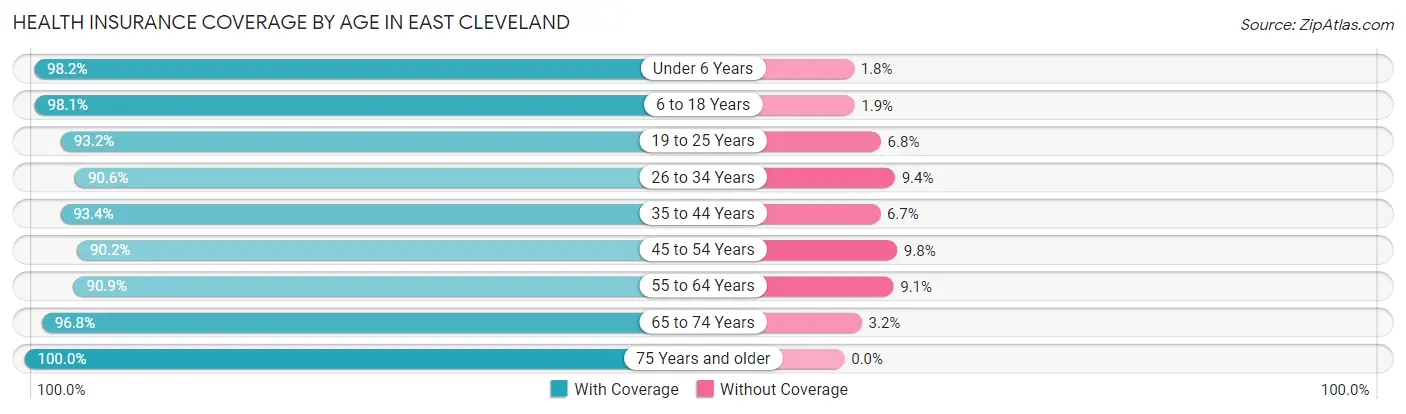
| Age Bracket | With Coverage | Without Coverage |
| Under 6 Years | 1,389 (98.2%) | 25 (1.8%) |
| 6 to 18 Years | 2,085 (98.1%) | 40 (1.9%) |
| 19 to 25 Years | 1,073 (93.2%) | 78 (6.8%) |
| 26 to 34 Years | 1,542 (90.6%) | 160 (9.4%) |
| 35 to 44 Years | 1,320 (93.3%) | 94 (6.7%) |
| 45 to 54 Years | 1,067 (90.2%) | 116 (9.8%) |
| 55 to 64 Years | 1,661 (90.9%) | 167 (9.1%) |
| 65 to 74 Years | 1,535 (96.8%) | 51 (3.2%) |
| 75 Years and older | 1,182 (100.0%) | 0 (0.0%) |
| Total | 12,854 (94.6%) | 731 (5.4%) |
Health Insurance Coverage by Citizenship Status in East Cleveland
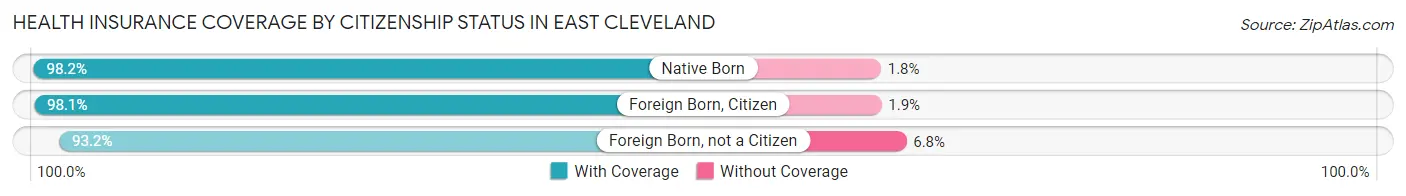
| Citizenship Status | With Coverage | Without Coverage |
| Native Born | 1,389 (98.2%) | 25 (1.8%) |
| Foreign Born, Citizen | 2,085 (98.1%) | 40 (1.9%) |
| Foreign Born, not a Citizen | 1,073 (93.2%) | 78 (6.8%) |
Health Insurance Coverage by Household Income in East Cleveland
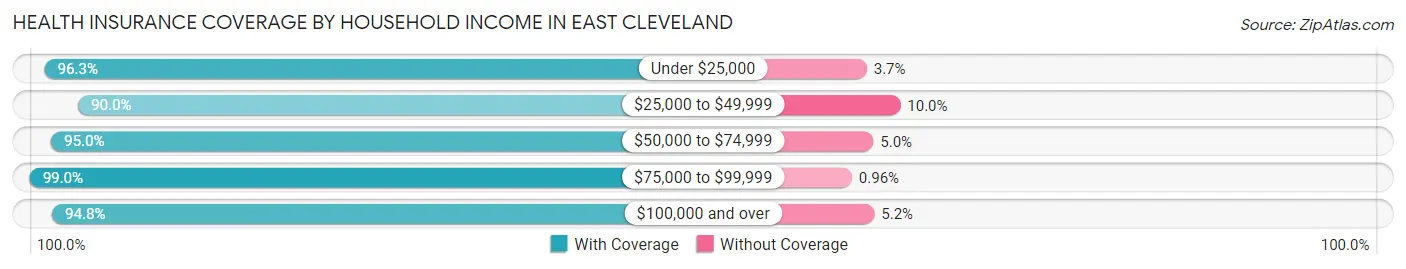
| Household Income | With Coverage | Without Coverage |
| Under $25,000 | 5,514 (96.3%) | 214 (3.7%) |
| $25,000 to $49,999 | 3,065 (90.0%) | 342 (10.0%) |
| $50,000 to $74,999 | 1,240 (95.0%) | 65 (5.0%) |
| $75,000 to $99,999 | 1,234 (99.0%) | 12 (1.0%) |
| $100,000 and over | 1,743 (94.8%) | 95 (5.2%) |
Public vs Private Health Insurance Coverage by Age in East Cleveland
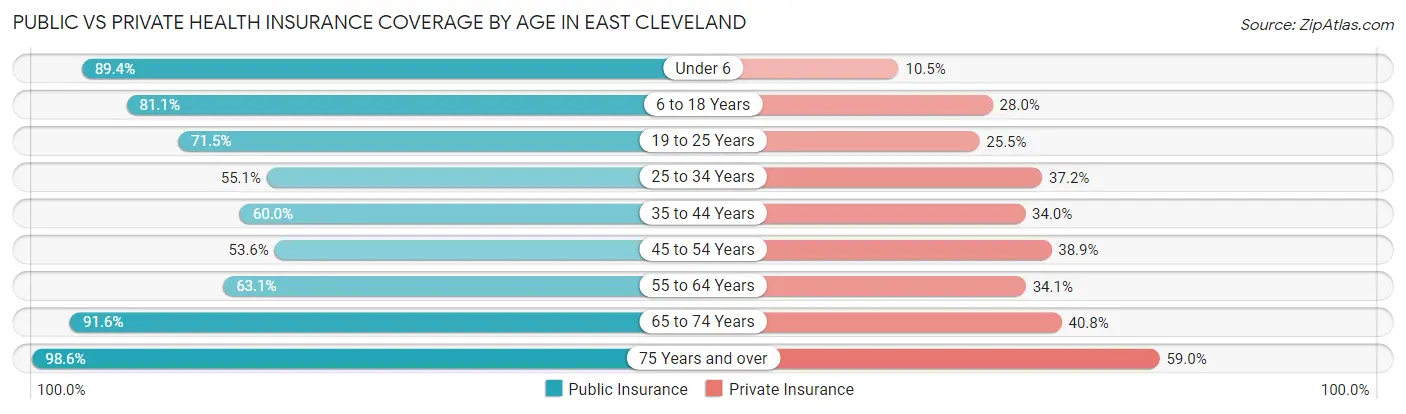
| Age Bracket | Public Insurance | Private Insurance |
| Under 6 | 1,264 (89.4%) | 149 (10.5%) |
| 6 to 18 Years | 1,723 (81.1%) | 595 (28.0%) |
| 19 to 25 Years | 823 (71.5%) | 294 (25.5%) |
| 25 to 34 Years | 937 (55.0%) | 633 (37.2%) |
| 35 to 44 Years | 849 (60.0%) | 481 (34.0%) |
| 45 to 54 Years | 634 (53.6%) | 460 (38.9%) |
| 55 to 64 Years | 1,154 (63.1%) | 624 (34.1%) |
| 65 to 74 Years | 1,452 (91.5%) | 647 (40.8%) |
| 75 Years and over | 1,165 (98.6%) | 697 (59.0%) |
| Total | 10,001 (73.6%) | 4,580 (33.7%) |
Disability Status by Sex by Age in East Cleveland
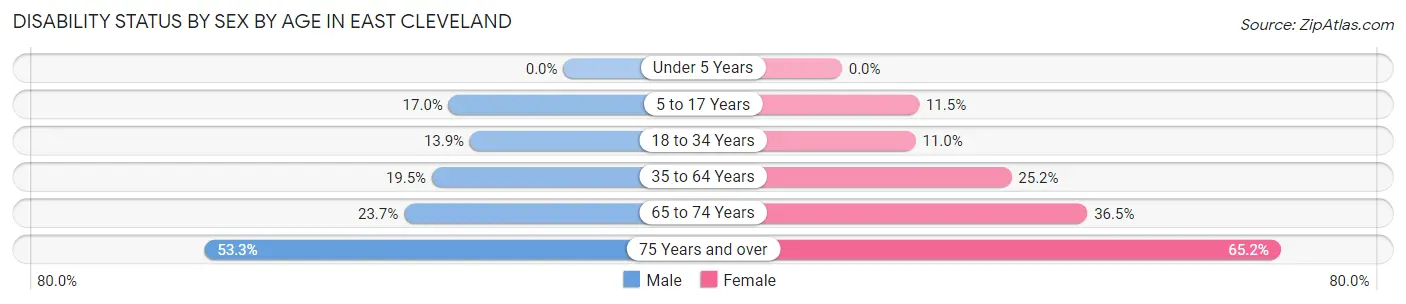
| Age Bracket | Male | Female |
| Under 5 Years | 0 (0.0%) | 0 (0.0%) |
| 5 to 17 Years | 196 (17.0%) | 102 (11.5%) |
| 18 to 34 Years | 193 (13.9%) | 182 (11.0%) |
| 35 to 64 Years | 334 (19.5%) | 683 (25.2%) |
| 65 to 74 Years | 163 (23.7%) | 327 (36.4%) |
| 75 Years and over | 194 (53.3%) | 533 (65.2%) |
Disability Class by Sex by Age in East Cleveland
Disability Class: Hearing Difficulty
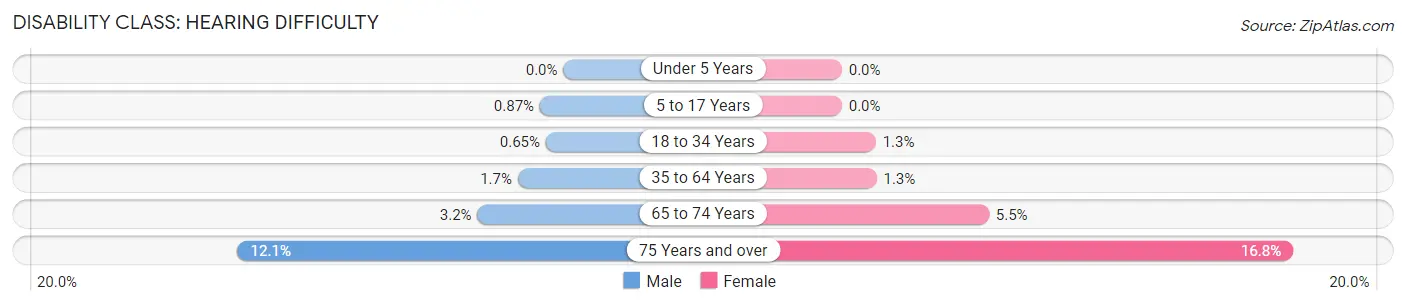
| Age Bracket | Male | Female |
| Under 5 Years | 0 (0.0%) | 0 (0.0%) |
| 5 to 17 Years | 10 (0.9%) | 0 (0.0%) |
| 18 to 34 Years | 9 (0.6%) | 21 (1.3%) |
| 35 to 64 Years | 29 (1.7%) | 35 (1.3%) |
| 65 to 74 Years | 22 (3.2%) | 49 (5.5%) |
| 75 Years and over | 44 (12.1%) | 137 (16.8%) |
Disability Class: Vision Difficulty
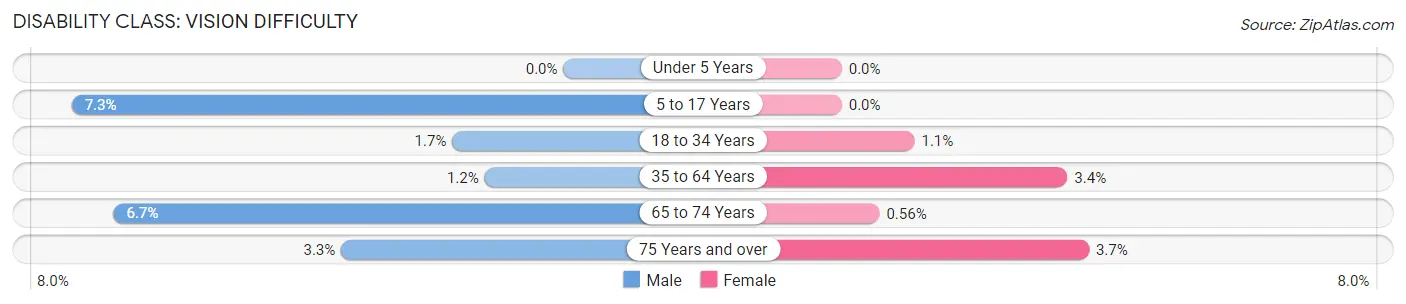
| Age Bracket | Male | Female |
| Under 5 Years | 0 (0.0%) | 0 (0.0%) |
| 5 to 17 Years | 84 (7.3%) | 0 (0.0%) |
| 18 to 34 Years | 23 (1.7%) | 18 (1.1%) |
| 35 to 64 Years | 20 (1.2%) | 91 (3.4%) |
| 65 to 74 Years | 46 (6.7%) | 5 (0.6%) |
| 75 Years and over | 12 (3.3%) | 30 (3.7%) |
Disability Class: Cognitive Difficulty
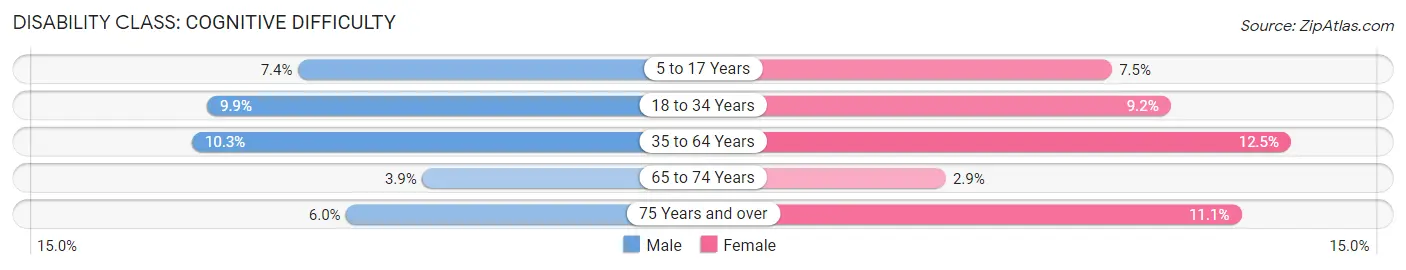
| Age Bracket | Male | Female |
| 5 to 17 Years | 85 (7.4%) | 67 (7.5%) |
| 18 to 34 Years | 138 (9.9%) | 152 (9.1%) |
| 35 to 64 Years | 177 (10.3%) | 339 (12.5%) |
| 65 to 74 Years | 27 (3.9%) | 26 (2.9%) |
| 75 Years and over | 22 (6.0%) | 91 (11.1%) |
Disability Class: Ambulatory Difficulty
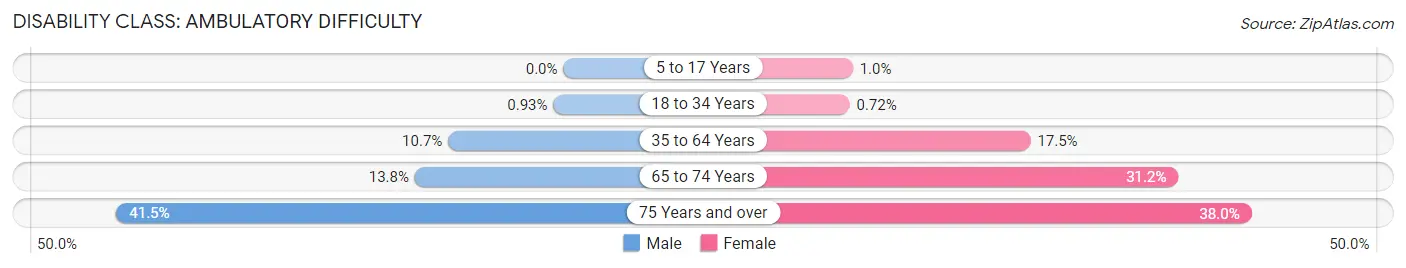
| Age Bracket | Male | Female |
| 5 to 17 Years | 0 (0.0%) | 9 (1.0%) |
| 18 to 34 Years | 13 (0.9%) | 12 (0.7%) |
| 35 to 64 Years | 183 (10.7%) | 475 (17.5%) |
| 65 to 74 Years | 95 (13.8%) | 280 (31.2%) |
| 75 Years and over | 151 (41.5%) | 311 (38.0%) |
Disability Class: Self-Care Difficulty
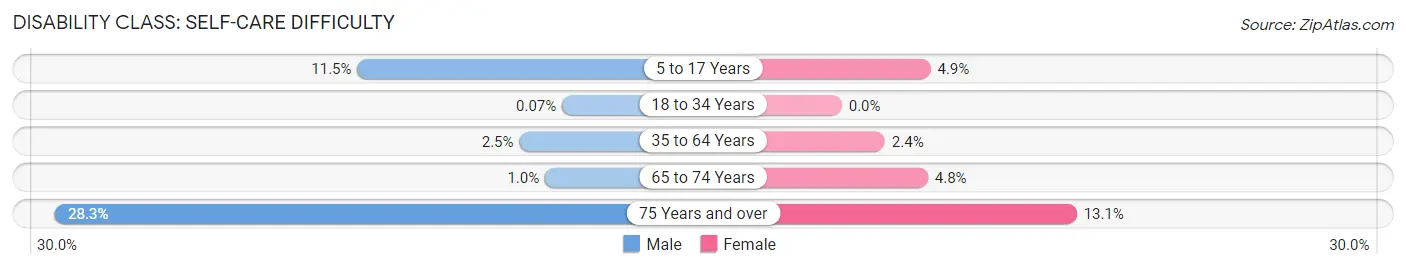
| Age Bracket | Male | Female |
| 5 to 17 Years | 132 (11.5%) | 44 (4.9%) |
| 18 to 34 Years | 1 (0.1%) | 0 (0.0%) |
| 35 to 64 Years | 42 (2.5%) | 65 (2.4%) |
| 65 to 74 Years | 7 (1.0%) | 43 (4.8%) |
| 75 Years and over | 103 (28.3%) | 107 (13.1%) |
Technology Access in East Cleveland
Computing Device Access in East Cleveland
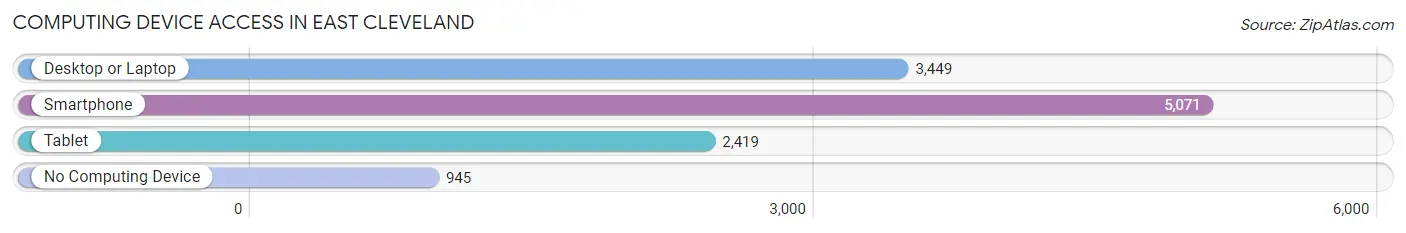
| Device Type | # Households | % Households |
| Desktop or Laptop | 3,449 | 52.4% |
| Smartphone | 5,071 | 77.1% |
| Tablet | 2,419 | 36.8% |
| No Computing Device | 945 | 14.4% |
| Total | 6,576 | 100.0% |
Internet Access in East Cleveland
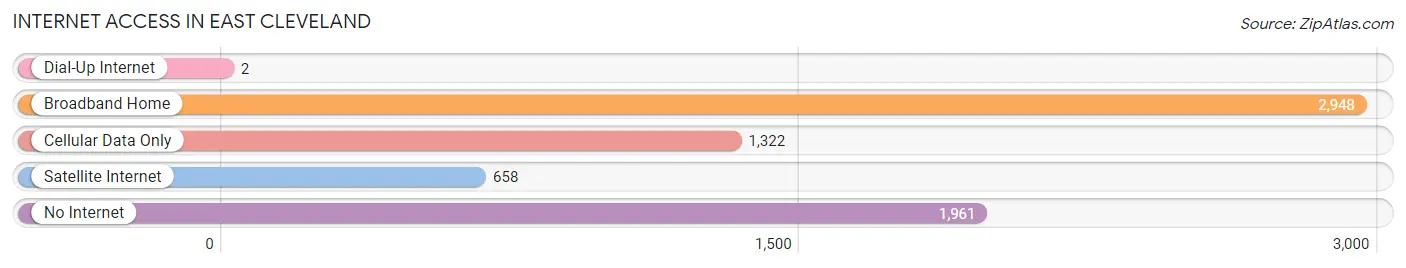
| Internet Type | # Households | % Households |
| Dial-Up Internet | 2 | 0.0% |
| Broadband Home | 2,948 | 44.8% |
| Cellular Data Only | 1,322 | 20.1% |
| Satellite Internet | 658 | 10.0% |
| No Internet | 1,961 | 29.8% |
| Total | 6,576 | 100.0% |
East Cleveland Summary
History
East Cleveland, Ohio is a city located in Cuyahoga County, Ohio, United States. It is a suburb of Cleveland and is located east of the city. The city was founded in 1872 and incorporated in 1895. It is the only city in the United States to be completely surrounded by another city.
East Cleveland was originally part of the Connecticut Western Reserve, which was a tract of land given to the state of Connecticut by the federal government in 1786. The land was divided into townships and East Cleveland was part of Euclid Township. In 1872, the township was divided into two parts, East Cleveland and Euclid. East Cleveland was incorporated as a village in 1895 and as a city in 1910.
East Cleveland has a long and rich history. It was home to the first African-American mayor in the United States, Carl B. Stokes, who was elected in 1967. The city was also home to the first African-American police chief in the United States, Robert L. Moore, who was appointed in 1968.
East Cleveland has a diverse population. It is home to a large African-American population, as well as a growing Hispanic population. The city is also home to a large number of immigrants from around the world.
Geography
East Cleveland is located in Cuyahoga County, Ohio, United States. It is a suburb of Cleveland and is located east of the city. The city is bordered by Cleveland to the west, Euclid to the north, South Euclid to the east, and Warrensville Heights to the south.
The city has a total area of 4.2 square miles, all of which is land. The city is located on the shores of Lake Erie and is part of the Cleveland-Elyria-Mentor metropolitan area.
Economy
East Cleveland has a diverse economy. The city is home to a number of small businesses, including restaurants, retail stores, and professional services. The city is also home to a number of large employers, including the Cleveland Clinic, University Hospitals, and the Cleveland Metropolitan School District.
The city is also home to a number of industrial and manufacturing companies, including the East Cleveland Foundry, the East Cleveland Tool and Die Company, and the East Cleveland Machine Company.
Demographics
As of the 2010 census, the population of East Cleveland was 17,843. The city has a population density of 4,269 people per square mile. The racial makeup of the city is 57.3% African American, 33.2% White, 4.2% Hispanic or Latino, 2.2% Asian, and 0.3% Native American.
The median household income in East Cleveland is $25,945, and the median family income is $30,917. The per capita income in East Cleveland is $14,945. The poverty rate in East Cleveland is 37.2%.
Conclusion
East Cleveland, Ohio is a city located in Cuyahoga County, Ohio, United States. It is a suburb of Cleveland and is located east of the city. The city was founded in 1872 and incorporated in 1895. It is the only city in the United States to be completely surrounded by another city. East Cleveland has a long and rich history and is home to a diverse population. The city has a diverse economy and is home to a number of small businesses, large employers, and industrial and manufacturing companies. The population of East Cleveland is 17,843, and the median household income is $25,945. The poverty rate in East Cleveland is 37.2%.
Common Questions
What is the Total Population of East Cleveland?
Total Population of East Cleveland is 13,926.
What is the Total Male Population of East Cleveland?
Total Male Population of East Cleveland is 6,035.
What is the Total Female Population of East Cleveland?
Total Female Population of East Cleveland is 7,891.
What is the Ratio of Males per 100 Females in East Cleveland?
There are 76.48 Males per 100 Females in East Cleveland.
What is the Ratio of Females per 100 Males in East Cleveland?
There are 130.75 Females per 100 Males in East Cleveland.
What is the Median Population Age in East Cleveland?
Median Population Age in East Cleveland is 39.6 Years.
What is the Average Family Size in East Cleveland
Average Family Size in East Cleveland is 3.1 People.
What is the Average Household Size in East Cleveland
Average Household Size in East Cleveland is 2.1 People.
What is Per Capita Income in East Cleveland?
Per Capita income in East Cleveland is $19,526.
What is the Median Family Income in East Cleveland?
Median Family Income in East Cleveland is $37,625.
What is the Median Household income in East Cleveland?
Median Household Income in East Cleveland is $23,004.
What is Income or Wage Gap in East Cleveland?
Income or Wage Gap in East Cleveland is 2.0%.
Women in East Cleveland earn 98.0 cents for every dollar earned by a man.
What is Family Income Deficit in East Cleveland?
Family Income Deficit in East Cleveland is $10,831.
Families that are below poverty line in East Cleveland earn $10,831 less on average than the poverty threshold level.
What is Inequality or Gini Index in East Cleveland?
Inequality or Gini Index in East Cleveland is 0.55.
How Large is the Labor Force in East Cleveland?
There are 5,814 People in the Labor Forcein in East Cleveland.
What is the Percentage of People in the Labor Force in East Cleveland?
53.7% of People are in the Labor Force in East Cleveland.
What is the Unemployment Rate in East Cleveland?
Unemployment Rate in East Cleveland is 19.3%.