Lincoln Village, OH
Lincoln Village Map
Lincoln Village Overview
9,553
TOTAL POPULATION
4,690
MALE POPULATION
4,863
FEMALE POPULATION
96.44
MALES / 100 FEMALES
103.69
FEMALES / 100 MALES
39.0
MEDIAN AGE
3.1
AVG FAMILY SIZE
2.4
AVG HOUSEHOLD SIZE
$30,720
PER CAPITA INCOME
$70,789
AVG FAMILY INCOME
$59,151
AVG HOUSEHOLD INCOME
13.7%
WAGE / INCOME GAP [ % ]
86.3¢/ $1
WAGE / INCOME GAP [ $ ]
0.39
INEQUALITY / GINI INDEX
5,263
LABOR FORCE [ PEOPLE ]
67.2%
PERCENT IN LABOR FORCE
2.5%
UNEMPLOYMENT RATE
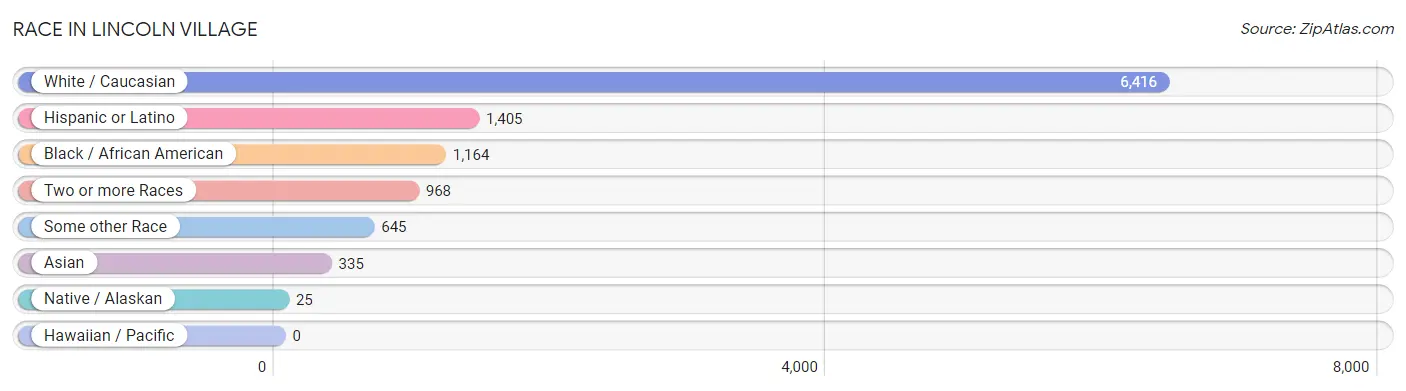
Race in Lincoln Village
The most populous races in Lincoln Village are White / Caucasian (6,416 | 67.2%), Hispanic or Latino (1,405 | 14.7%), and Black / African American (1,164 | 12.2%).
| Race | # Population | % Population |
| Asian | 335 | 3.5% |
| Black / African American | 1,164 | 12.2% |
| Hawaiian / Pacific | 0 | 0.0% |
| Hispanic or Latino | 1,405 | 14.7% |
| Native / Alaskan | 25 | 0.3% |
| White / Caucasian | 6,416 | 67.2% |
| Two or more Races | 968 | 10.1% |
| Some other Race | 645 | 6.8% |
| Total | 9,553 | 100.0% |
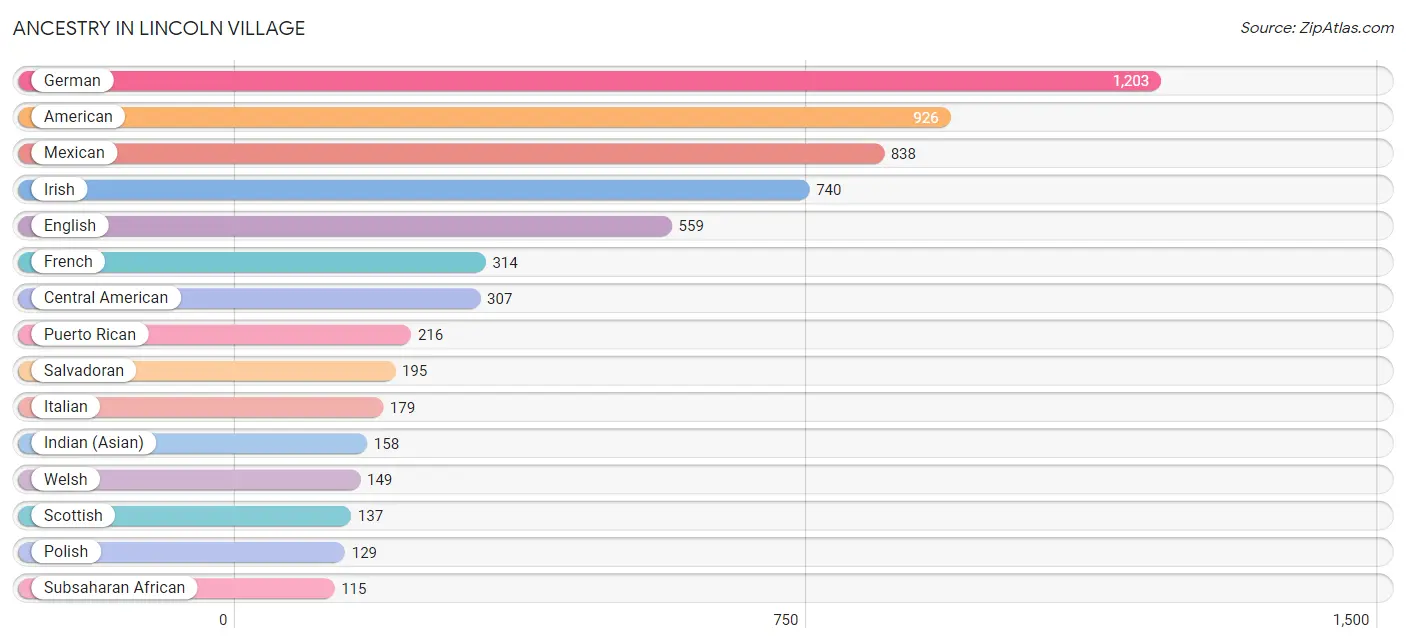
Ancestry in Lincoln Village
The most populous ancestries reported in Lincoln Village are German (1,203 | 12.6%), American (926 | 9.7%), Mexican (838 | 8.8%), Irish (740 | 7.7%), and English (559 | 5.9%), together accounting for 44.7% of all Lincoln Village residents.
| Ancestry | # Population | % Population |
| African | 33 | 0.4% |
| American | 926 | 9.7% |
| Arab | 6 | 0.1% |
| Bhutanese | 70 | 0.7% |
| Blackfeet | 35 | 0.4% |
| Brazilian | 6 | 0.1% |
| British | 17 | 0.2% |
| Burmese | 34 | 0.4% |
| Cape Verdean | 20 | 0.2% |
| Central American | 307 | 3.2% |
| Cherokee | 18 | 0.2% |
| Chippewa | 6 | 0.1% |
| Croatian | 23 | 0.2% |
| Dutch | 84 | 0.9% |
| English | 559 | 5.9% |
| Ethiopian | 6 | 0.1% |
| European | 92 | 1.0% |
| Finnish | 11 | 0.1% |
| French | 314 | 3.3% |
| German | 1,203 | 12.6% |
| Greek | 26 | 0.3% |
| Guatemalan | 52 | 0.5% |
| Haitian | 106 | 1.1% |
| Honduran | 49 | 0.5% |
| Hungarian | 67 | 0.7% |
| Indian (Asian) | 158 | 1.7% |
| Indonesian | 66 | 0.7% |
| Irish | 740 | 7.7% |
| Iroquois | 6 | 0.1% |
| Italian | 179 | 1.9% |
| Japanese | 22 | 0.2% |
| Korean | 14 | 0.2% |
| Lumbee | 4 | 0.0% |
| Malaysian | 12 | 0.1% |
| Mexican | 838 | 8.8% |
| Mexican American Indian | 25 | 0.3% |
| Nigerian | 17 | 0.2% |
| Northern European | 21 | 0.2% |
| Norwegian | 36 | 0.4% |
| Panamanian | 11 | 0.1% |
| Polish | 129 | 1.3% |
| Portuguese | 6 | 0.1% |
| Puerto Rican | 216 | 2.3% |
| Romanian | 7 | 0.1% |
| Russian | 37 | 0.4% |
| Salvadoran | 195 | 2.0% |
| Scandinavian | 38 | 0.4% |
| Scotch-Irish | 15 | 0.2% |
| Scottish | 137 | 1.4% |
| Slovak | 21 | 0.2% |
| Somali | 16 | 0.2% |
| Spaniard | 13 | 0.1% |
| Subsaharan African | 115 | 1.2% |
| Swedish | 19 | 0.2% |
| Thai | 44 | 0.5% |
| Ukrainian | 25 | 0.3% |
| Welsh | 149 | 1.6% | View All 57 Rows |
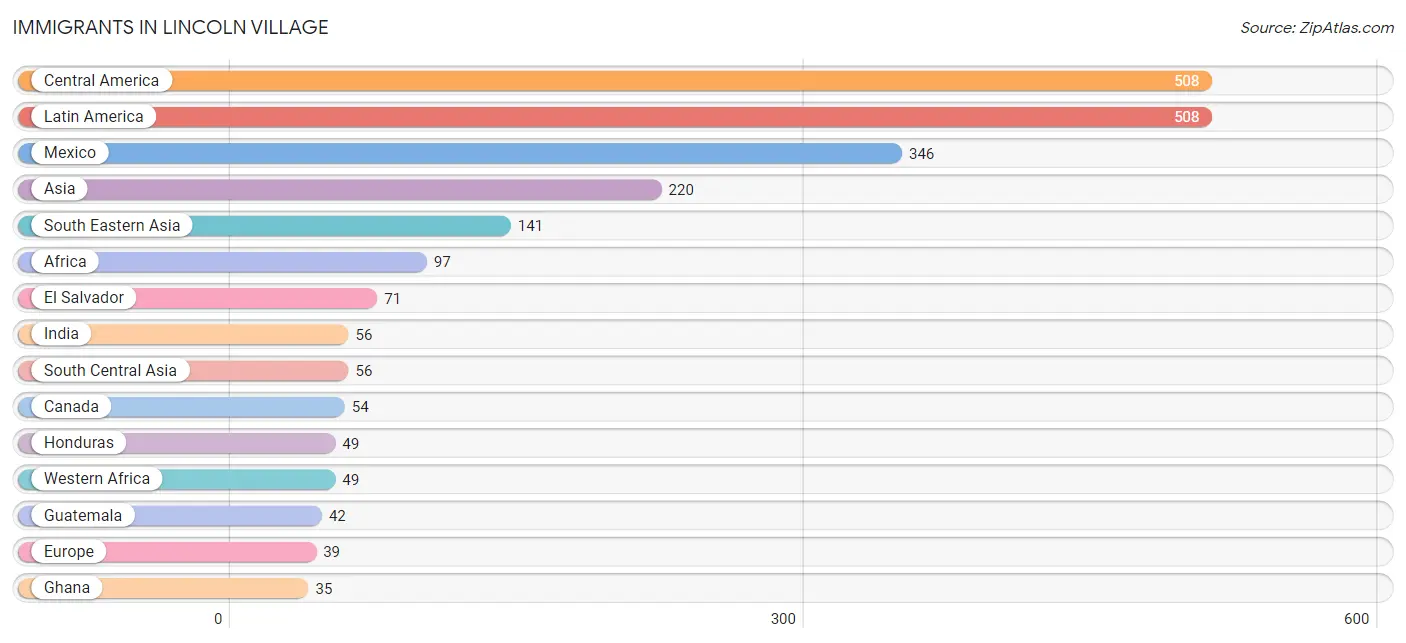
Immigrants in Lincoln Village
The most numerous immigrant groups reported in Lincoln Village came from Central America (508 | 5.3%), Latin America (508 | 5.3%), Mexico (346 | 3.6%), Asia (220 | 2.3%), and South Eastern Asia (141 | 1.5%), together accounting for 18.0% of all Lincoln Village residents.
| Immigration Origin | # Population | % Population |
| Africa | 97 | 1.0% |
| Asia | 220 | 2.3% |
| Cambodia | 7 | 0.1% |
| Canada | 54 | 0.6% |
| Central America | 508 | 5.3% |
| Eastern Africa | 6 | 0.1% |
| Eastern Asia | 23 | 0.2% |
| Eastern Europe | 24 | 0.3% |
| El Salvador | 71 | 0.7% |
| England | 7 | 0.1% |
| Ethiopia | 6 | 0.1% |
| Europe | 39 | 0.4% |
| Germany | 8 | 0.1% |
| Ghana | 35 | 0.4% |
| Guatemala | 42 | 0.4% |
| Honduras | 49 | 0.5% |
| India | 56 | 0.6% |
| Korea | 23 | 0.2% |
| Latin America | 508 | 5.3% |
| Mexico | 346 | 3.6% |
| Middle Africa | 23 | 0.2% |
| Northern Africa | 19 | 0.2% |
| Northern Europe | 7 | 0.1% |
| Philippines | 10 | 0.1% |
| Russia | 14 | 0.2% |
| South Central Asia | 56 | 0.6% |
| South Eastern Asia | 141 | 1.5% |
| Thailand | 15 | 0.2% |
| Ukraine | 10 | 0.1% |
| Western Africa | 49 | 0.5% |
| Western Europe | 8 | 0.1% | View All 31 Rows |
Sex and Age in Lincoln Village
Sex and Age in Lincoln Village
The most populous age groups in Lincoln Village are 35 to 39 Years (461 | 9.8%) for men and 45 to 49 Years (475 | 9.8%) for women.
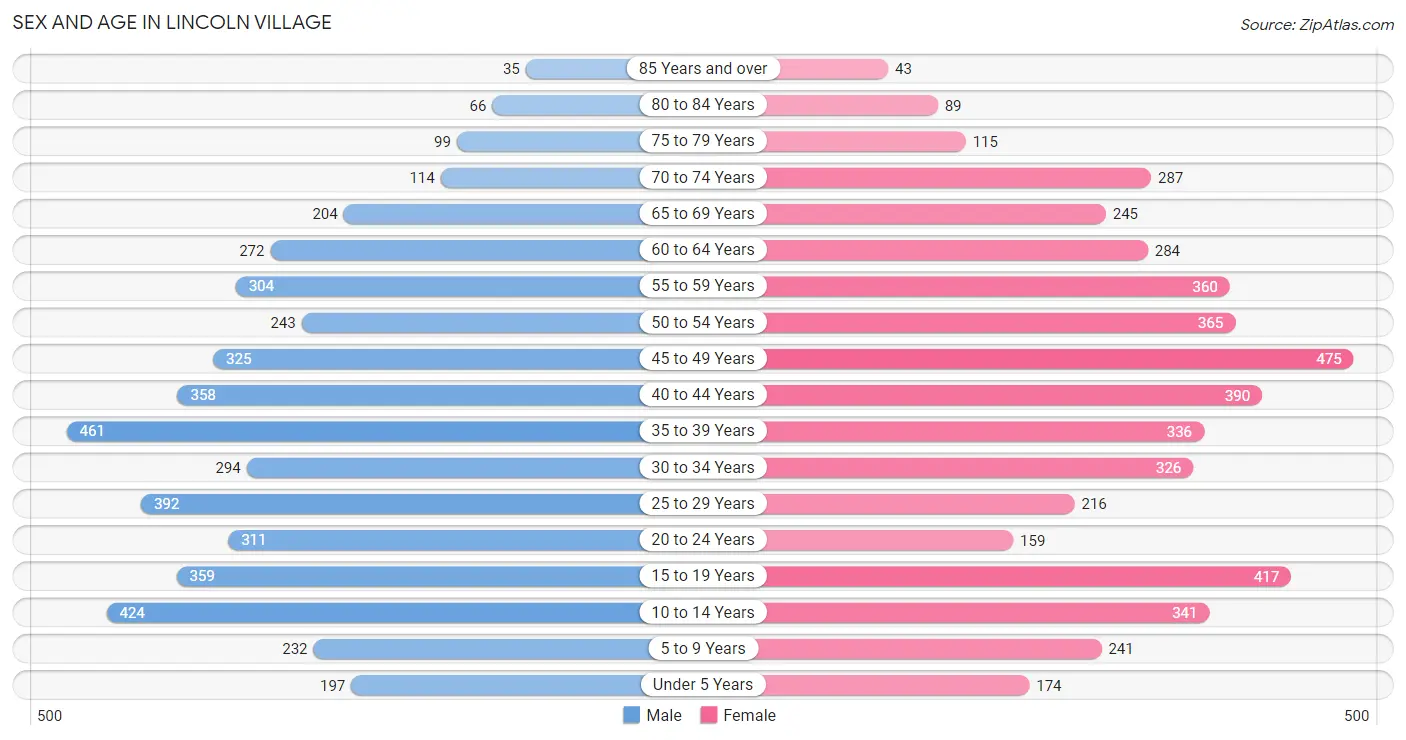
| Age Bracket | Male | Female |
| Under 5 Years | 197 (4.2%) | 174 (3.6%) |
| 5 to 9 Years | 232 (5.0%) | 241 (5.0%) |
| 10 to 14 Years | 424 (9.0%) | 341 (7.0%) |
| 15 to 19 Years | 359 (7.6%) | 417 (8.6%) |
| 20 to 24 Years | 311 (6.6%) | 159 (3.3%) |
| 25 to 29 Years | 392 (8.4%) | 216 (4.4%) |
| 30 to 34 Years | 294 (6.3%) | 326 (6.7%) |
| 35 to 39 Years | 461 (9.8%) | 336 (6.9%) |
| 40 to 44 Years | 358 (7.6%) | 390 (8.0%) |
| 45 to 49 Years | 325 (6.9%) | 475 (9.8%) |
| 50 to 54 Years | 243 (5.2%) | 365 (7.5%) |
| 55 to 59 Years | 304 (6.5%) | 360 (7.4%) |
| 60 to 64 Years | 272 (5.8%) | 284 (5.8%) |
| 65 to 69 Years | 204 (4.3%) | 245 (5.0%) |
| 70 to 74 Years | 114 (2.4%) | 287 (5.9%) |
| 75 to 79 Years | 99 (2.1%) | 115 (2.4%) |
| 80 to 84 Years | 66 (1.4%) | 89 (1.8%) |
| 85 Years and over | 35 (0.7%) | 43 (0.9%) |
| Total | 4,690 (100.0%) | 4,863 (100.0%) |
Families and Households in Lincoln Village
Median Family Size in Lincoln Village
The median family size in Lincoln Village is 3.15 persons per family, with married-couple families (1,451 | 64.6%) accounting for the largest median family size of 3.23 persons per family. On the other hand, single male/father families (240 | 10.7%) represent the smallest median family size with 2.71 persons per family.
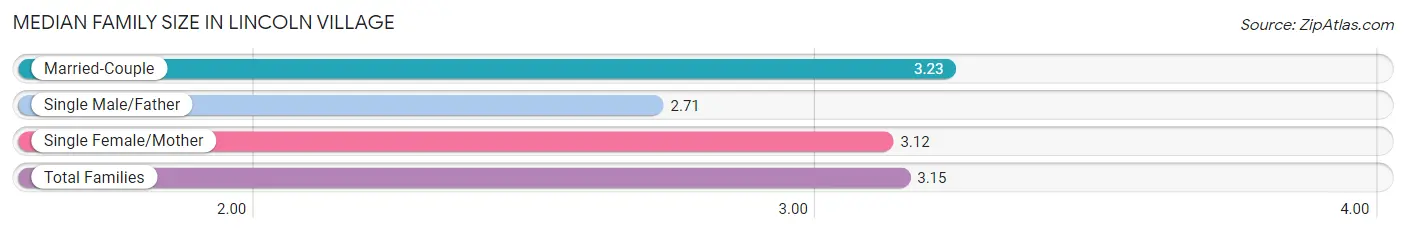
| Family Type | # Families | Family Size |
| Married-Couple | 1,451 (64.6%) | 3.23 |
| Single Male/Father | 240 (10.7%) | 2.71 |
| Single Female/Mother | 555 (24.7%) | 3.12 |
| Total Families | 2,246 (100.0%) | 3.15 |
Median Household Size in Lincoln Village
The median household size in Lincoln Village is 2.44 persons per household, with single female/mother households (555 | 14.2%) accounting for the largest median household size of 3.33 persons per household. non-family households (1,664 | 42.6%) represent the smallest median household size with 1.37 persons per household.
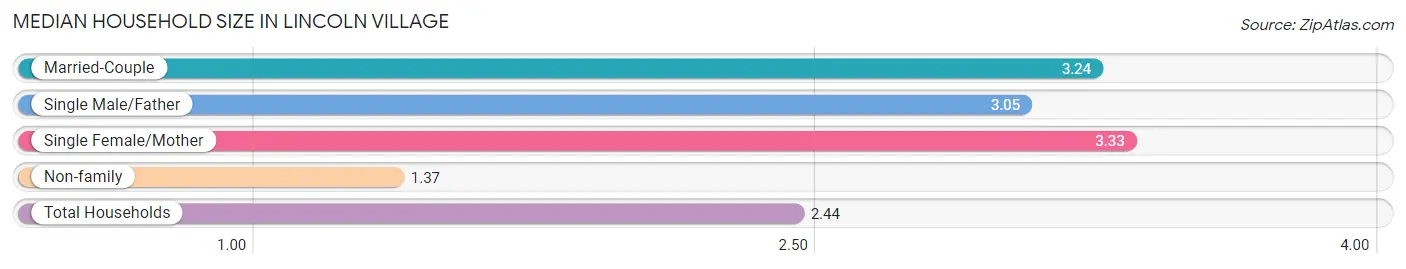
| Household Type | # Households | Household Size |
| Married-Couple | 1,451 (37.1%) | 3.24 |
| Single Male/Father | 240 (6.1%) | 3.05 |
| Single Female/Mother | 555 (14.2%) | 3.33 |
| Non-family | 1,664 (42.6%) | 1.37 |
| Total Households | 3,910 (100.0%) | 2.44 |
Household Size by Marriage Status in Lincoln Village
Out of a total of 3,910 households in Lincoln Village, 2,246 (57.4%) are family households, while 1,664 (42.6%) are nonfamily households. The most numerous type of family households are 2-person households, comprising 944, and the most common type of nonfamily households are 1-person households, comprising 1,255.
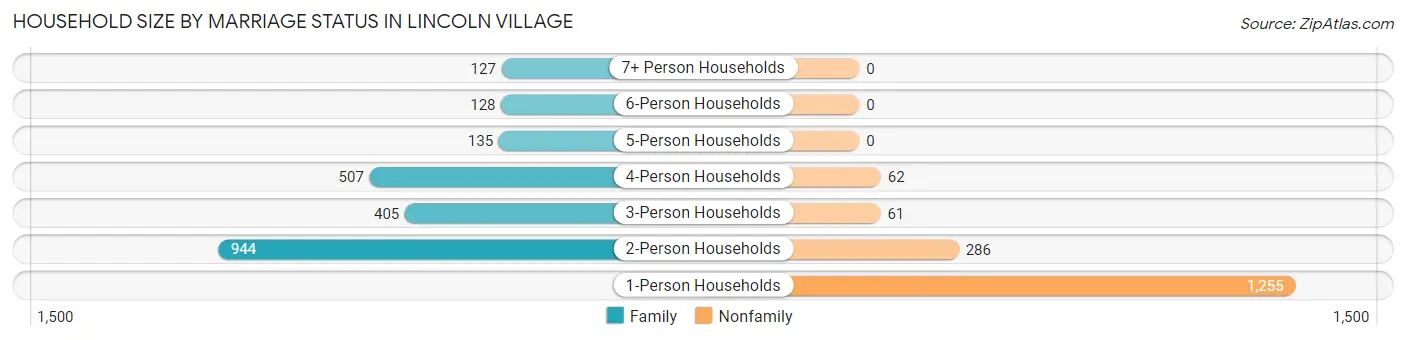
| Household Size | Family Households | Nonfamily Households |
| 1-Person Households | - | 1,255 (32.1%) |
| 2-Person Households | 944 (24.1%) | 286 (7.3%) |
| 3-Person Households | 405 (10.4%) | 61 (1.6%) |
| 4-Person Households | 507 (13.0%) | 62 (1.6%) |
| 5-Person Households | 135 (3.5%) | 0 (0.0%) |
| 6-Person Households | 128 (3.3%) | 0 (0.0%) |
| 7+ Person Households | 127 (3.3%) | 0 (0.0%) |
| Total | 2,246 (57.4%) | 1,664 (42.6%) |
Female Fertility in Lincoln Village
Fertility by Age in Lincoln Village
Average fertility rate in Lincoln Village is 34.0 births per 1,000 women. Women in the age bracket of 20 to 34 years have the highest fertility rate with 90.0 births per 1,000 women. Women in the age bracket of 20 to 34 years acount for 75.0% of all women with births.
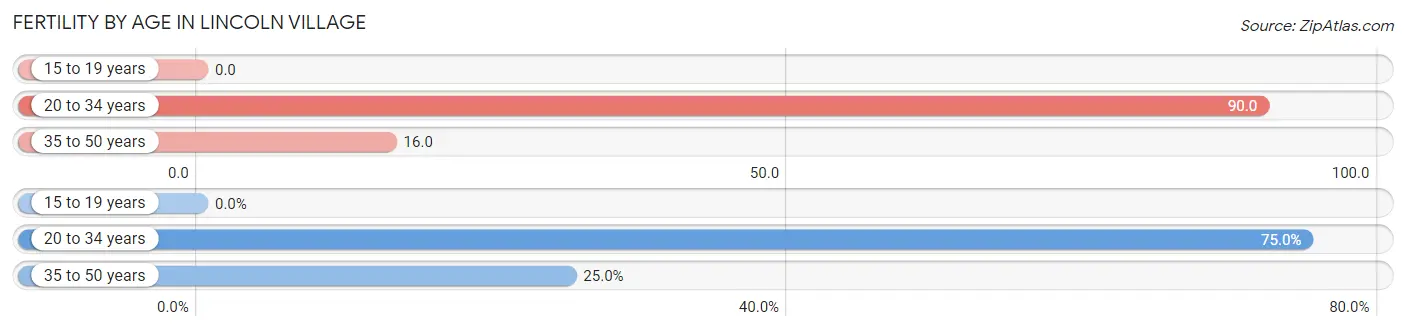
| Age Bracket | Women with Births | Births / 1,000 Women |
| 15 to 19 years | 0 (0.0%) | 0.0 |
| 20 to 34 years | 63 (75.0%) | 90.0 |
| 35 to 50 years | 21 (25.0%) | 16.0 |
| Total | 84 (100.0%) | 34.0 |
Fertility by Age by Marriage Status in Lincoln Village
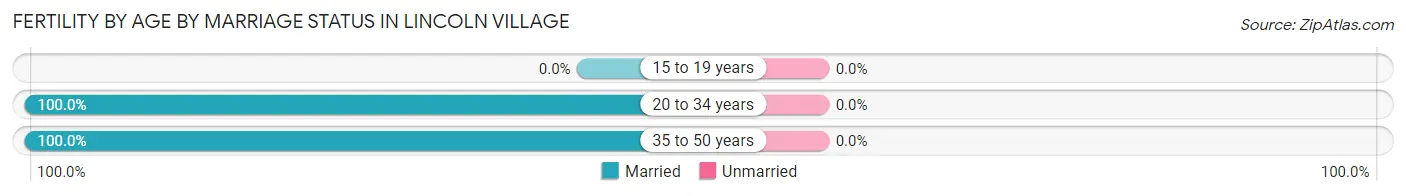
| Age Bracket | Married | Unmarried |
| 15 to 19 years | 0 (0.0%) | 0 (0.0%) |
| 20 to 34 years | 63 (100.0%) | 0 (0.0%) |
| 35 to 50 years | 21 (100.0%) | 0 (0.0%) |
| Total | 84 (100.0%) | 0 (0.0%) |
Fertility by Education in Lincoln Village
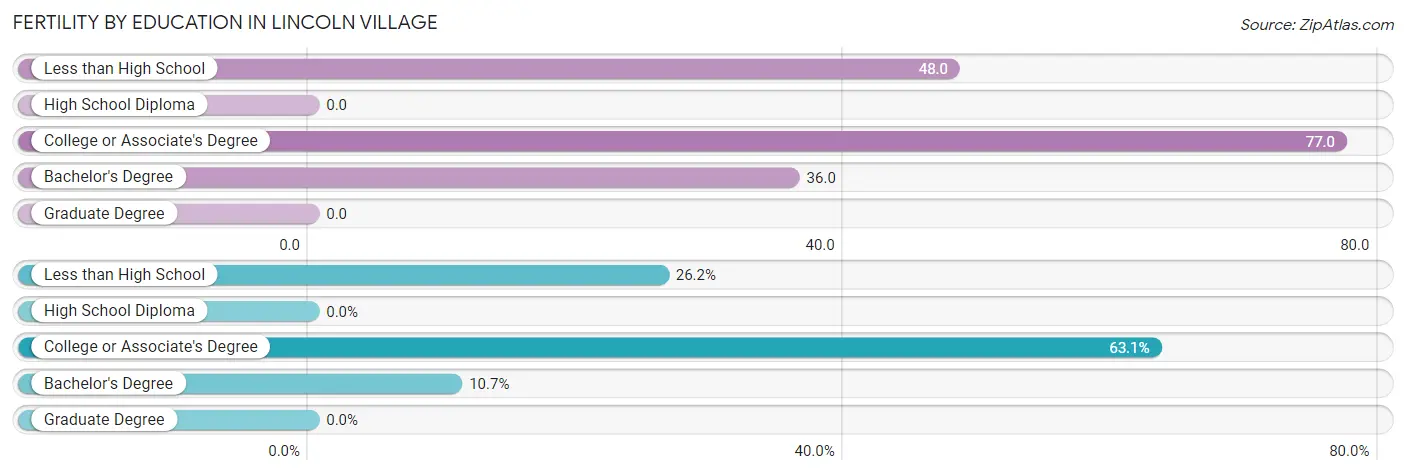
| Educational Attainment | Women with Births | Births / 1,000 Women |
| Less than High School | 22 (26.2%) | 48.0 |
| High School Diploma | 0 (0.0%) | 0.0 |
| College or Associate's Degree | 53 (63.1%) | 77.0 |
| Bachelor's Degree | 9 (10.7%) | 36.0 |
| Graduate Degree | 0 (0.0%) | 0.0 |
| Total | 84 (100.0%) | 34.0 |
Fertility by Education by Marriage Status in Lincoln Village
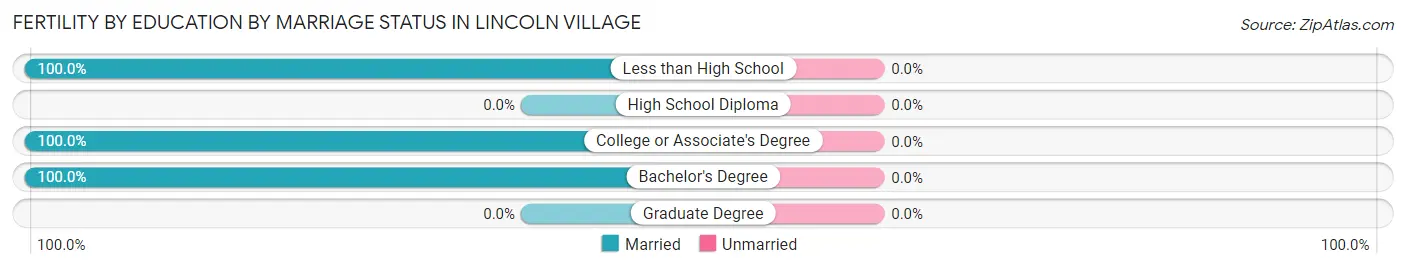
| Educational Attainment | Married | Unmarried |
| Less than High School | 22 (100.0%) | 0 (0.0%) |
| High School Diploma | 0 (0.0%) | 0 (0.0%) |
| College or Associate's Degree | 53 (100.0%) | 0 (0.0%) |
| Bachelor's Degree | 9 (100.0%) | 0 (0.0%) |
| Graduate Degree | 0 (0.0%) | 0 (0.0%) |
| Total | 84 (100.0%) | 0 (0.0%) |
Income in Lincoln Village
Income Overview in Lincoln Village
Per Capita Income in Lincoln Village is $30,720, while median incomes of families and households are $70,789 and $59,151 respectively.
| Characteristic | Number | Measure |
| Per Capita Income | 9,553 | $30,720 |
| Median Family Income | 2,246 | $70,789 |
| Mean Family Income | 2,246 | $85,736 |
| Median Household Income | 3,910 | $59,151 |
| Mean Household Income | 3,910 | $74,339 |
| Income Deficit | 2,246 | $0 |
| Wage / Income Gap (%) | 9,553 | 13.67% |
| Wage / Income Gap ($) | 9,553 | 86.33¢ per $1 |
| Gini / Inequality Index | 9,553 | 0.39 |
Earnings by Sex in Lincoln Village
Average Earnings in Lincoln Village are $39,065, $41,799 for men and $36,084 for women, a difference of 13.7%.
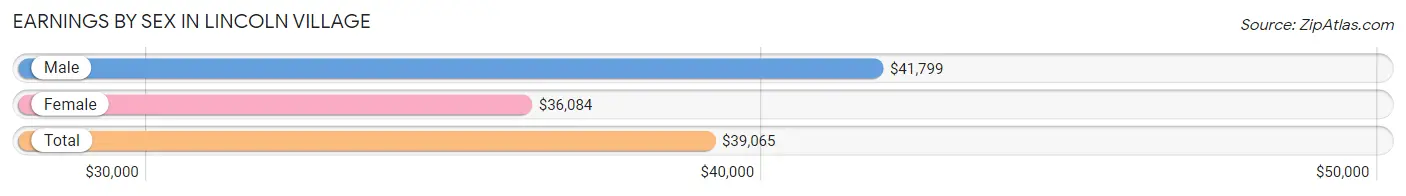
| Sex | Number | Average Earnings |
| Male | 2,945 (52.6%) | $41,799 |
| Female | 2,650 (47.4%) | $36,084 |
| Total | 5,595 (100.0%) | $39,065 |
Earnings by Sex by Income Bracket in Lincoln Village
The most common earnings brackets in Lincoln Village are $75,000 to $99,999 for men (446 | 15.1%) and $50,000 to $54,999 for women (276 | 10.4%).
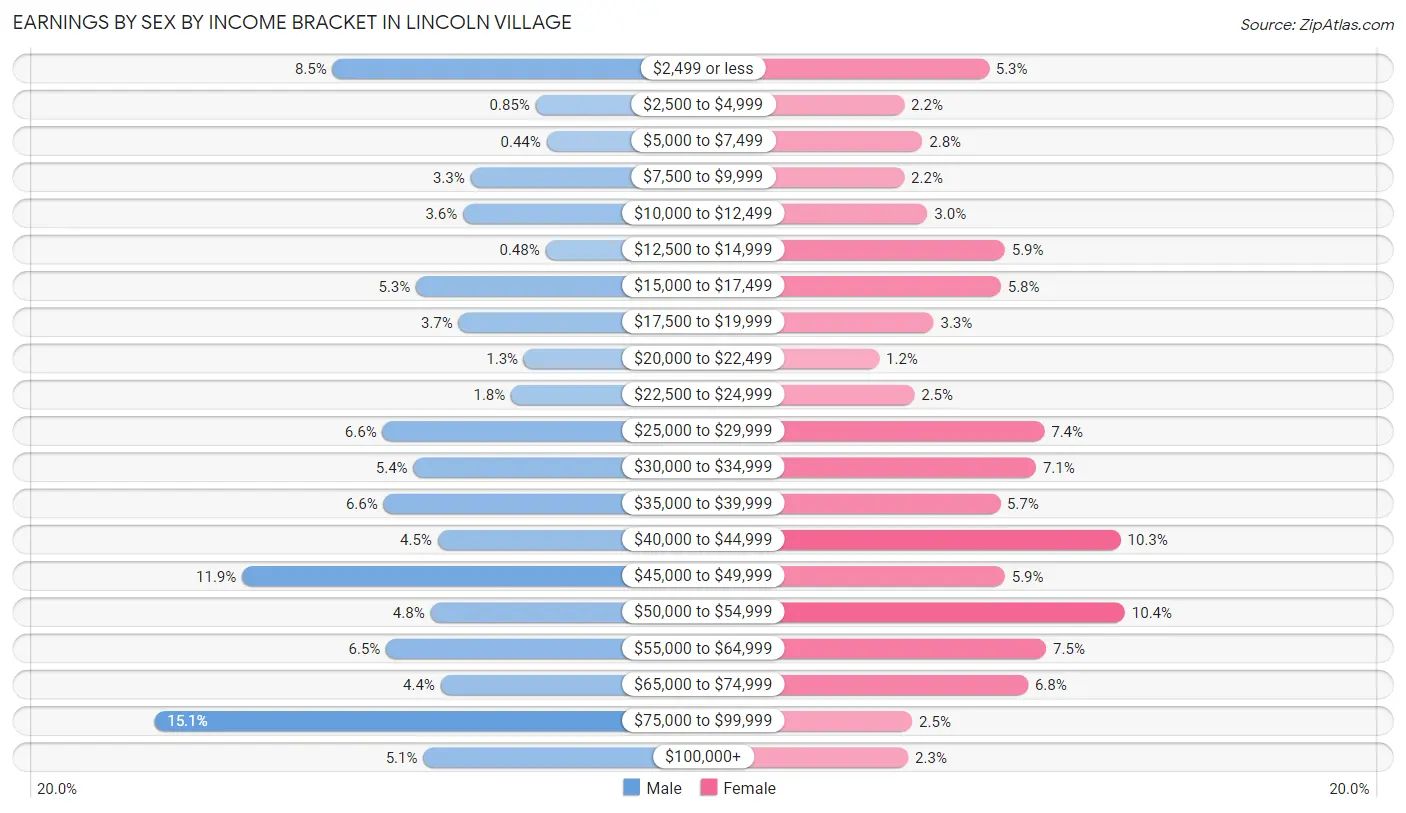
| Income | Male | Female |
| $2,499 or less | 249 (8.5%) | 141 (5.3%) |
| $2,500 to $4,999 | 25 (0.9%) | 57 (2.1%) |
| $5,000 to $7,499 | 13 (0.4%) | 75 (2.8%) |
| $7,500 to $9,999 | 97 (3.3%) | 57 (2.1%) |
| $10,000 to $12,499 | 105 (3.6%) | 80 (3.0%) |
| $12,500 to $14,999 | 14 (0.5%) | 157 (5.9%) |
| $15,000 to $17,499 | 157 (5.3%) | 153 (5.8%) |
| $17,500 to $19,999 | 110 (3.7%) | 86 (3.3%) |
| $20,000 to $22,499 | 38 (1.3%) | 32 (1.2%) |
| $22,500 to $24,999 | 52 (1.8%) | 67 (2.5%) |
| $25,000 to $29,999 | 194 (6.6%) | 196 (7.4%) |
| $30,000 to $34,999 | 160 (5.4%) | 188 (7.1%) |
| $35,000 to $39,999 | 193 (6.6%) | 152 (5.7%) |
| $40,000 to $44,999 | 133 (4.5%) | 272 (10.3%) |
| $45,000 to $49,999 | 349 (11.8%) | 157 (5.9%) |
| $50,000 to $54,999 | 141 (4.8%) | 276 (10.4%) |
| $55,000 to $64,999 | 190 (6.5%) | 198 (7.5%) |
| $65,000 to $74,999 | 130 (4.4%) | 180 (6.8%) |
| $75,000 to $99,999 | 446 (15.1%) | 65 (2.5%) |
| $100,000+ | 149 (5.1%) | 61 (2.3%) |
| Total | 2,945 (100.0%) | 2,650 (100.0%) |
Earnings by Sex by Educational Attainment in Lincoln Village
Average earnings in Lincoln Village are $47,649 for men and $40,338 for women, a difference of 15.3%. Men with an educational attainment of graduate degree enjoy the highest average annual earnings of $56,739, while those with less than high school education earn the least with $38,304. Women with an educational attainment of bachelor's degree earn the most with the average annual earnings of $55,134, while those with less than high school education have the smallest earnings of $28,099.
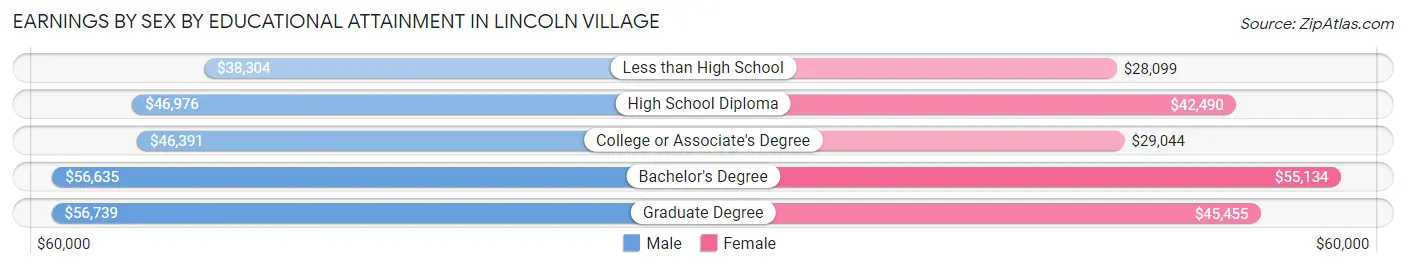
| Educational Attainment | Male Income | Female Income |
| Less than High School | $38,304 | $28,099 |
| High School Diploma | $46,976 | $42,490 |
| College or Associate's Degree | $46,391 | $29,044 |
| Bachelor's Degree | $56,635 | $55,134 |
| Graduate Degree | $56,739 | $45,455 |
| Total | $47,649 | $40,338 |
Family Income in Lincoln Village
Family Income Brackets in Lincoln Village
According to the Lincoln Village family income data, there are 418 families falling into the $50,000 to $74,999 income range, which is the most common income bracket and makes up 18.6% of all families. Conversely, the less than $10,000 income bracket is the least frequent group with only 16 families (0.7%) belonging to this category.
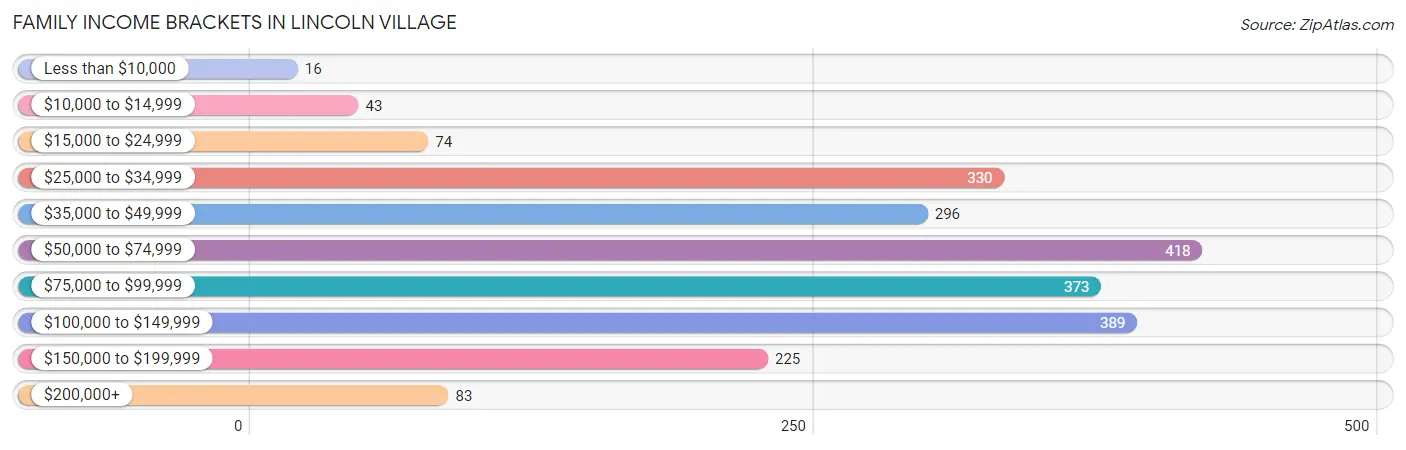
| Income Bracket | # Families | % Families |
| Less than $10,000 | 16 | 0.7% |
| $10,000 to $14,999 | 43 | 1.9% |
| $15,000 to $24,999 | 74 | 3.3% |
| $25,000 to $34,999 | 330 | 14.7% |
| $35,000 to $49,999 | 296 | 13.2% |
| $50,000 to $74,999 | 418 | 18.6% |
| $75,000 to $99,999 | 373 | 16.6% |
| $100,000 to $149,999 | 389 | 17.3% |
| $150,000 to $199,999 | 225 | 10.0% |
| $200,000+ | 83 | 3.7% |
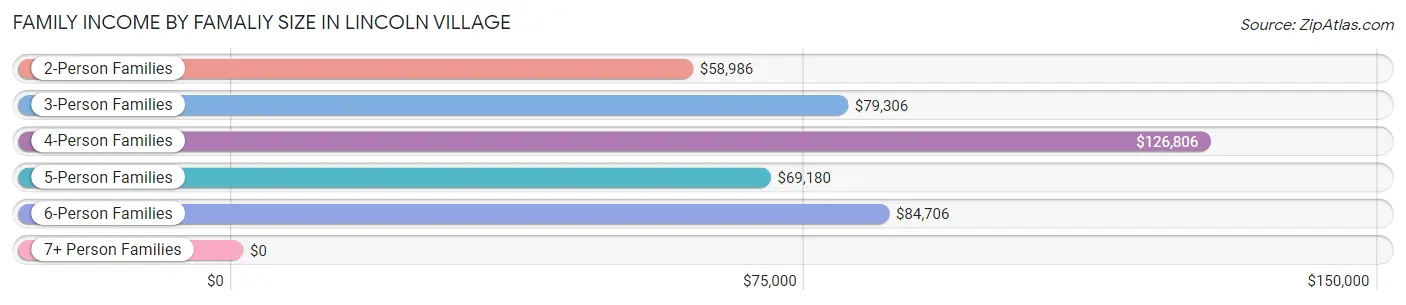
Family Income by Famaliy Size in Lincoln Village
4-person families (389 | 17.3%) account for the highest median family income in Lincoln Village with $126,806 per family, while 4-person families (389 | 17.3%) have the highest median income of $31,702 per family member.
| Income Bracket | # Families | Median Income |
| 2-Person Families | 998 (44.4%) | $58,986 |
| 3-Person Families | 477 (21.2%) | $79,306 |
| 4-Person Families | 389 (17.3%) | $126,806 |
| 5-Person Families | 157 (7.0%) | $69,180 |
| 6-Person Families | 98 (4.4%) | $84,706 |
| 7+ Person Families | 127 (5.7%) | $0 |
| Total | 2,246 (100.0%) | $70,789 |
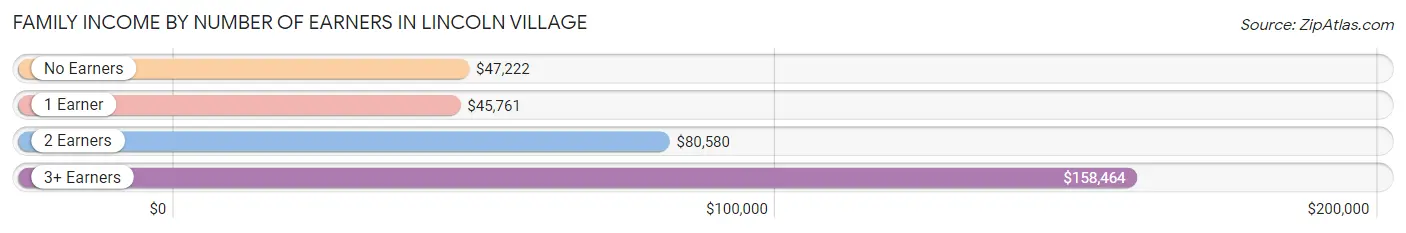
Family Income by Number of Earners in Lincoln Village
The median family income in Lincoln Village is $70,789, with families comprising 3+ earners (359) having the highest median family income of $158,464, while families with 1 earner (650) have the lowest median family income of $45,761, accounting for 16.0% and 28.9% of families, respectively.
| Number of Earners | # Families | Median Income |
| No Earners | 258 (11.5%) | $47,222 |
| 1 Earner | 650 (28.9%) | $45,761 |
| 2 Earners | 979 (43.6%) | $80,580 |
| 3+ Earners | 359 (16.0%) | $158,464 |
| Total | 2,246 (100.0%) | $70,789 |
Household Income in Lincoln Village
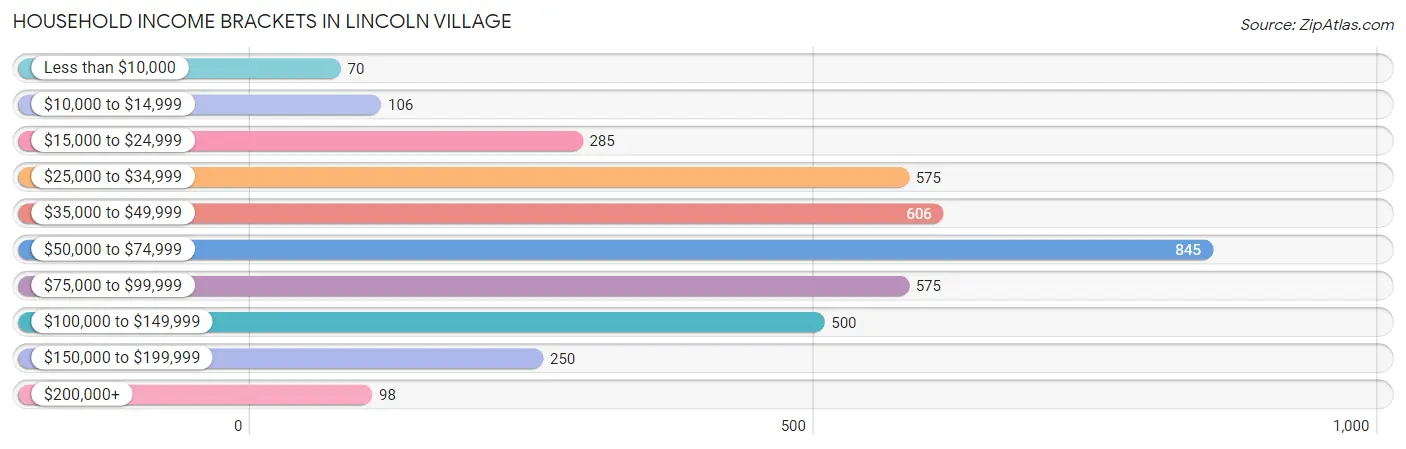
Household Income Brackets in Lincoln Village
With 845 households falling in the category, the $50,000 to $74,999 income range is the most frequent in Lincoln Village, accounting for 21.6% of all households. In contrast, only 70 households (1.8%) fall into the less than $10,000 income bracket, making it the least populous group.
| Income Bracket | # Households | % Households |
| Less than $10,000 | 70 | 1.8% |
| $10,000 to $14,999 | 106 | 2.7% |
| $15,000 to $24,999 | 285 | 7.3% |
| $25,000 to $34,999 | 575 | 14.7% |
| $35,000 to $49,999 | 606 | 15.5% |
| $50,000 to $74,999 | 845 | 21.6% |
| $75,000 to $99,999 | 575 | 14.7% |
| $100,000 to $149,999 | 500 | 12.8% |
| $150,000 to $199,999 | 250 | 6.4% |
| $200,000+ | 98 | 2.5% |
Household Income by Householder Age in Lincoln Village
The median household income in Lincoln Village is $59,151, with the highest median household income of $73,178 found in the 25 to 44 years age bracket for the primary householder. A total of 1,493 households (38.2%) fall into this category. Meanwhile, the 65+ years age bracket for the primary householder has the lowest median household income of $38,750, with 865 households (22.1%) in this group.

| Income Bracket | # Households | Median Income |
| 15 to 24 Years | 91 (2.3%) | $62,361 |
| 25 to 44 Years | 1,493 (38.2%) | $73,178 |
| 45 to 64 Years | 1,461 (37.4%) | $64,219 |
| 65+ Years | 865 (22.1%) | $38,750 |
| Total | 3,910 (100.0%) | $59,151 |
Poverty in Lincoln Village
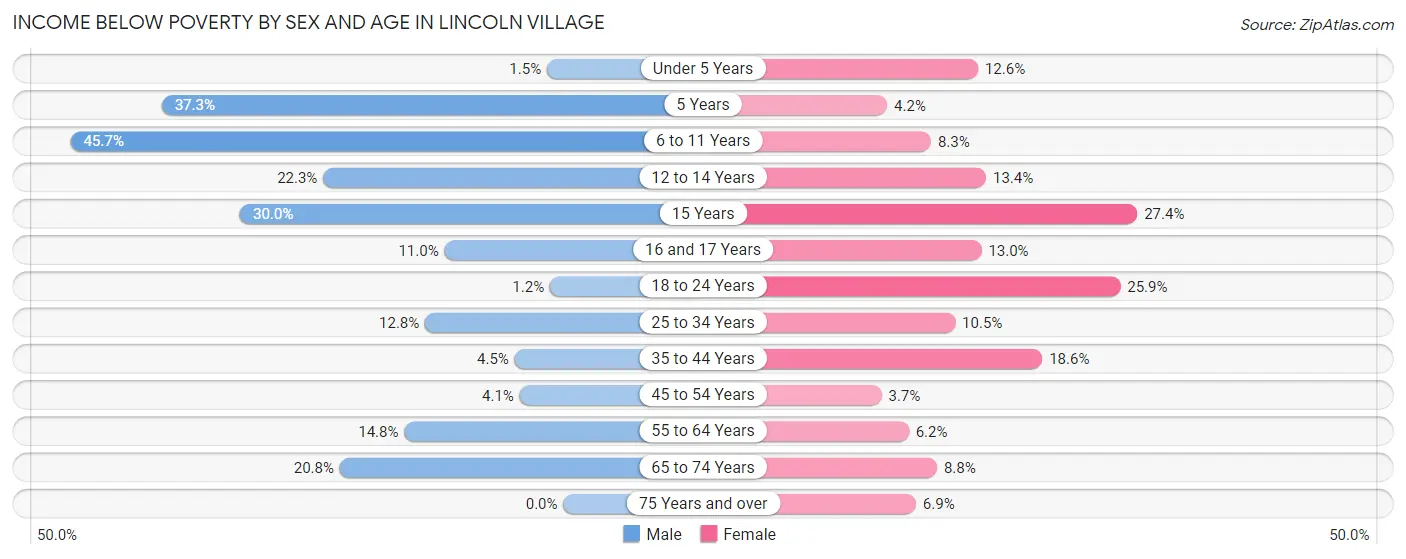
Income Below Poverty by Sex and Age in Lincoln Village
With 11.8% poverty level for males and 10.9% for females among the residents of Lincoln Village, 6 to 11 year old males and 15 year old females are the most vulnerable to poverty, with 102 males (45.7%) and 17 females (27.4%) in their respective age groups living below the poverty level.
| Age Bracket | Male | Female |
| Under 5 Years | 3 (1.5%) | 22 (12.6%) |
| 5 Years | 41 (37.3%) | 4 (4.2%) |
| 6 to 11 Years | 102 (45.7%) | 26 (8.3%) |
| 12 to 14 Years | 72 (22.3%) | 15 (13.4%) |
| 15 Years | 15 (30.0%) | 17 (27.4%) |
| 16 and 17 Years | 15 (11.0%) | 21 (13.0%) |
| 18 to 24 Years | 6 (1.2%) | 91 (25.9%) |
| 25 to 34 Years | 88 (12.8%) | 57 (10.5%) |
| 35 to 44 Years | 37 (4.5%) | 135 (18.6%) |
| 45 to 54 Years | 23 (4.1%) | 31 (3.7%) |
| 55 to 64 Years | 85 (14.8%) | 40 (6.2%) |
| 65 to 74 Years | 66 (20.7%) | 47 (8.8%) |
| 75 Years and over | 0 (0.0%) | 17 (6.9%) |
| Total | 553 (11.8%) | 523 (10.9%) |
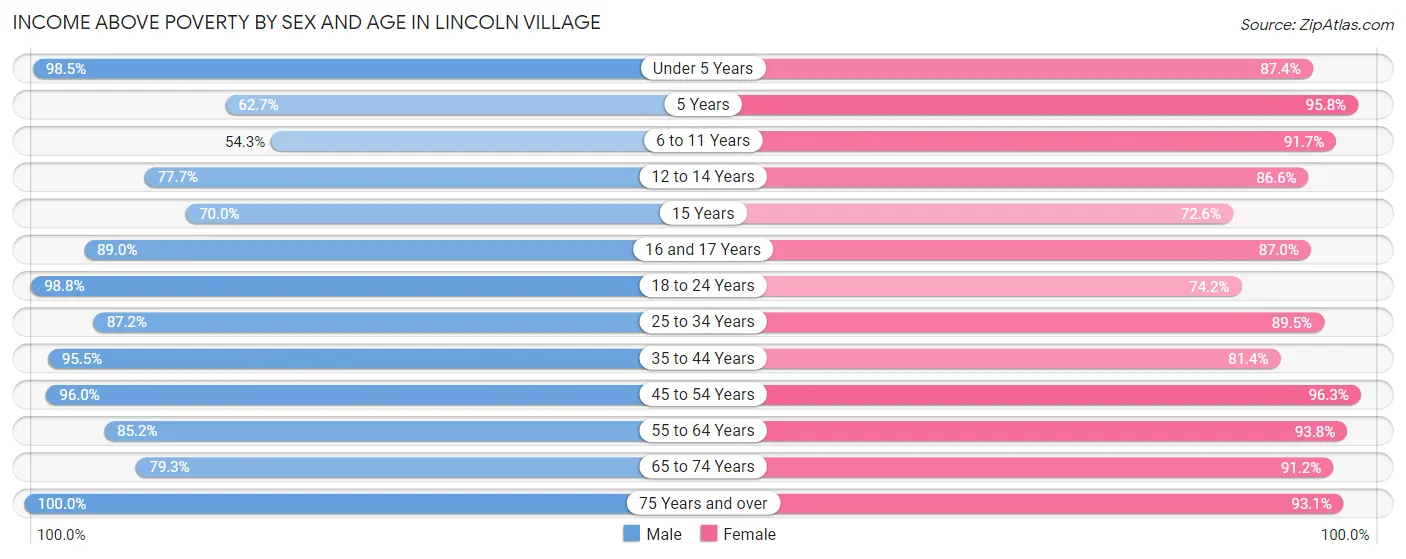
Income Above Poverty by Sex and Age in Lincoln Village
According to the poverty statistics in Lincoln Village, males aged 75 years and over and females aged 45 to 54 years are the age groups that are most secure financially, with 100.0% of males and 96.3% of females in these age groups living above the poverty line.
| Age Bracket | Male | Female |
| Under 5 Years | 194 (98.5%) | 152 (87.4%) |
| 5 Years | 69 (62.7%) | 91 (95.8%) |
| 6 to 11 Years | 121 (54.3%) | 288 (91.7%) |
| 12 to 14 Years | 251 (77.7%) | 97 (86.6%) |
| 15 Years | 35 (70.0%) | 45 (72.6%) |
| 16 and 17 Years | 121 (89.0%) | 141 (87.0%) |
| 18 to 24 Years | 478 (98.8%) | 261 (74.2%) |
| 25 to 34 Years | 598 (87.2%) | 485 (89.5%) |
| 35 to 44 Years | 782 (95.5%) | 591 (81.4%) |
| 45 to 54 Years | 545 (96.0%) | 809 (96.3%) |
| 55 to 64 Years | 491 (85.2%) | 604 (93.8%) |
| 65 to 74 Years | 252 (79.2%) | 485 (91.2%) |
| 75 Years and over | 200 (100.0%) | 230 (93.1%) |
| Total | 4,137 (88.2%) | 4,279 (89.1%) |
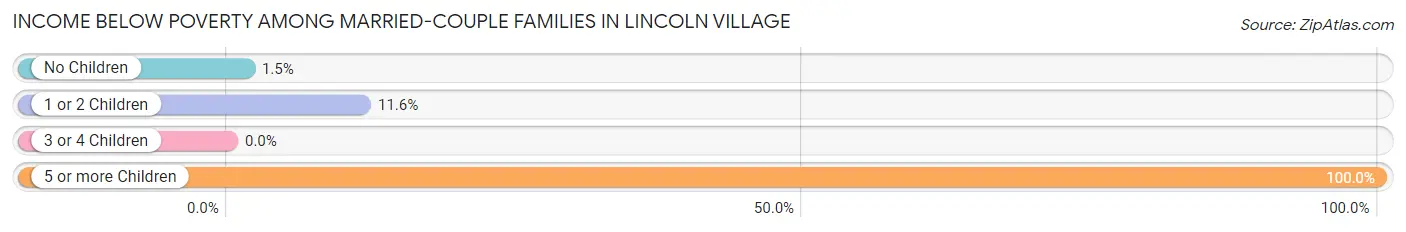
Income Below Poverty Among Married-Couple Families in Lincoln Village
The poverty statistics for married-couple families in Lincoln Village show that 9.0% or 130 of the total 1,451 families live below the poverty line. Families with 5 or more children have the highest poverty rate of 100.0%, comprising of 70 families. On the other hand, families with 3 or 4 children have the lowest poverty rate of 0.0%, which includes 0 families.
| Children | Above Poverty | Below Poverty |
| No Children | 739 (98.5%) | 11 (1.5%) |
| 1 or 2 Children | 374 (88.4%) | 49 (11.6%) |
| 3 or 4 Children | 208 (100.0%) | 0 (0.0%) |
| 5 or more Children | 0 (0.0%) | 70 (100.0%) |
| Total | 1,321 (91.0%) | 130 (9.0%) |
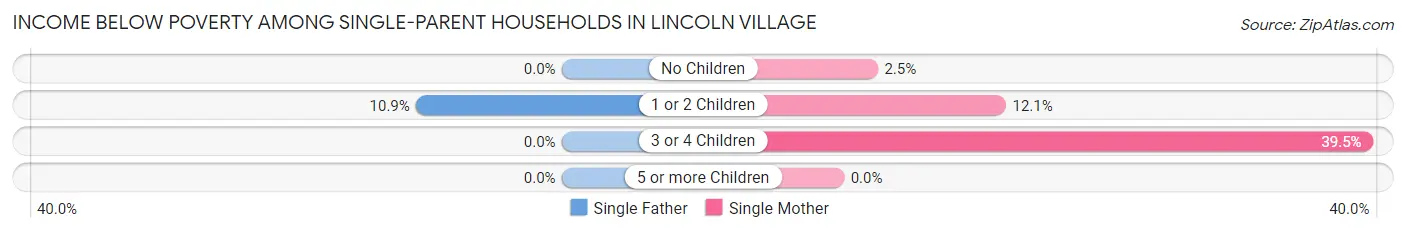
Income Below Poverty Among Single-Parent Households in Lincoln Village
According to the poverty data in Lincoln Village, 6.2% or 15 single-father households and 8.5% or 47 single-mother households are living below the poverty line. Among single-father households, those with 1 or 2 children have the highest poverty rate, with 15 households (10.9%) experiencing poverty. Likewise, among single-mother households, those with 3 or 4 children have the highest poverty rate, with 15 households (39.5%) falling below the poverty line.
| Children | Single Father | Single Mother |
| No Children | 0 (0.0%) | 8 (2.5%) |
| 1 or 2 Children | 15 (10.9%) | 24 (12.1%) |
| 3 or 4 Children | 0 (0.0%) | 15 (39.5%) |
| 5 or more Children | 0 (0.0%) | 0 (0.0%) |
| Total | 15 (6.2%) | 47 (8.5%) |
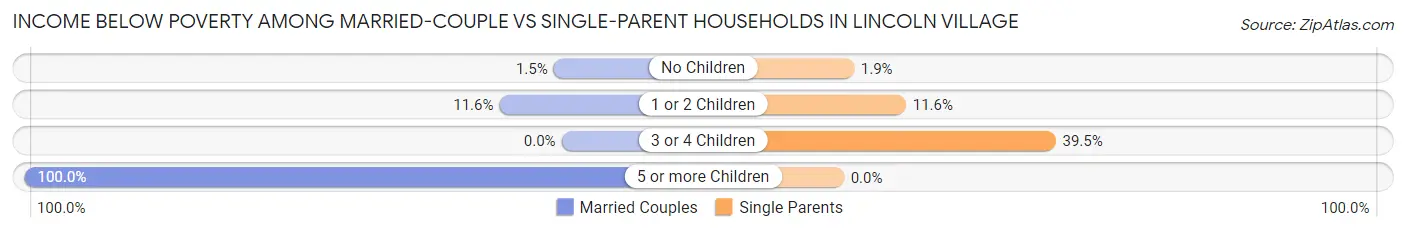
Income Below Poverty Among Married-Couple vs Single-Parent Households in Lincoln Village
The poverty data for Lincoln Village shows that 130 of the married-couple family households (9.0%) and 62 of the single-parent households (7.8%) are living below the poverty level. Within the married-couple family households, those with 5 or more children have the highest poverty rate, with 70 households (100.0%) falling below the poverty line. Among the single-parent households, those with 3 or 4 children have the highest poverty rate, with 15 household (39.5%) living below poverty.
| Children | Married-Couple Families | Single-Parent Households |
| No Children | 11 (1.5%) | 8 (1.9%) |
| 1 or 2 Children | 49 (11.6%) | 39 (11.6%) |
| 3 or 4 Children | 0 (0.0%) | 15 (39.5%) |
| 5 or more Children | 70 (100.0%) | 0 (0.0%) |
| Total | 130 (9.0%) | 62 (7.8%) |
Employment Characteristics in Lincoln Village
Employment by Class of Employer in Lincoln Village
Among the 5,058 employed individuals in Lincoln Village, private company employees (3,932 | 77.7%), not-for-profit organizations (680 | 13.4%), and local government employees (234 | 4.6%) make up the most common classes of employment.
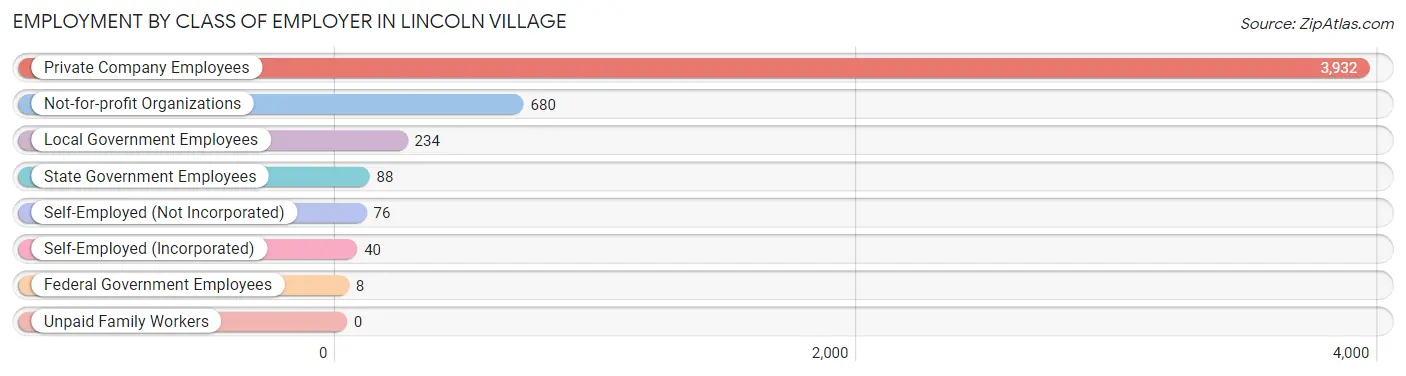
| Employer Class | # Employees | % Employees |
| Private Company Employees | 3,932 | 77.7% |
| Self-Employed (Incorporated) | 40 | 0.8% |
| Self-Employed (Not Incorporated) | 76 | 1.5% |
| Not-for-profit Organizations | 680 | 13.4% |
| Local Government Employees | 234 | 4.6% |
| State Government Employees | 88 | 1.7% |
| Federal Government Employees | 8 | 0.2% |
| Unpaid Family Workers | 0 | 0.0% |
| Total | 5,058 | 100.0% |
Employment Status by Age in Lincoln Village
According to the labor force statistics for Lincoln Village, out of the total population over 16 years of age (7,832), 67.2% or 5,263 individuals are in the labor force, with 2.5% or 132 of them unemployed. The age group with the highest labor force participation rate is 20 to 24 years, with 93.0% or 437 individuals in the labor force. Within the labor force, the 30 to 34 years age range has the highest percentage of unemployed individuals, with 9.7% or 45 of them being unemployed.
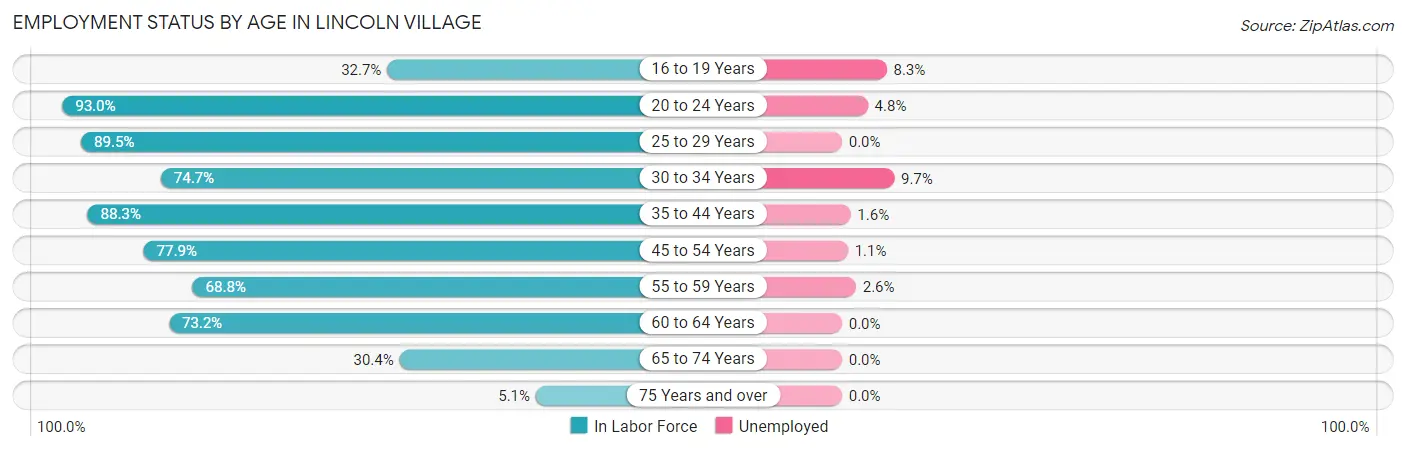
| Age Bracket | In Labor Force | Unemployed |
| 16 to 19 Years | 217 (32.7%) | 18 (8.3%) |
| 20 to 24 Years | 437 (93.0%) | 21 (4.8%) |
| 25 to 29 Years | 544 (89.5%) | 0 (0.0%) |
| 30 to 34 Years | 463 (74.7%) | 45 (9.7%) |
| 35 to 44 Years | 1,364 (88.3%) | 22 (1.6%) |
| 45 to 54 Years | 1,097 (77.9%) | 12 (1.1%) |
| 55 to 59 Years | 457 (68.8%) | 12 (2.6%) |
| 60 to 64 Years | 407 (73.2%) | 0 (0.0%) |
| 65 to 74 Years | 258 (30.4%) | 0 (0.0%) |
| 75 Years and over | 23 (5.1%) | 0 (0.0%) |
| Total | 5,263 (67.2%) | 132 (2.5%) |
Employment Status by Educational Attainment in Lincoln Village
According to labor force statistics for Lincoln Village, 80.2% of individuals (4,332) out of the total population between 25 and 64 years of age (5,401) are in the labor force, with 2.1% or 91 of them being unemployed. The group with the highest labor force participation rate are those with the educational attainment of bachelor's degree or higher, with 89.4% or 791 individuals in the labor force. Within the labor force, individuals with less than high school education have the highest percentage of unemployment, with 8.9% or 51 of them being unemployed.
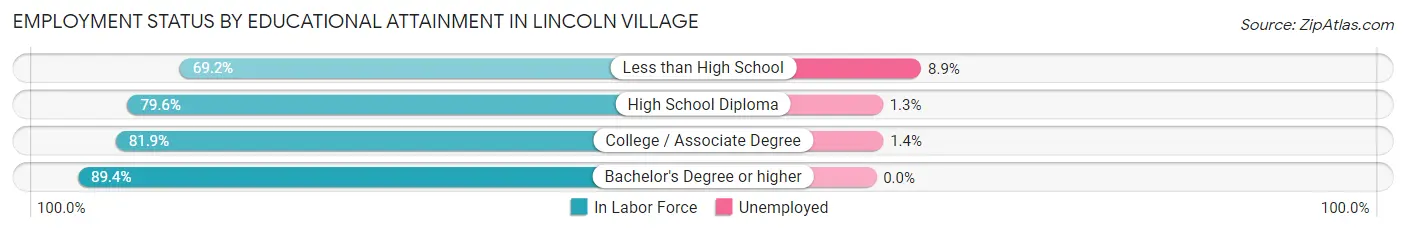
| Educational Attainment | In Labor Force | Unemployed |
| Less than High School | 574 (69.2%) | 74 (8.9%) |
| High School Diploma | 1,790 (79.6%) | 29 (1.3%) |
| College / Associate Degree | 1,177 (81.9%) | 20 (1.4%) |
| Bachelor's Degree or higher | 791 (89.4%) | 0 (0.0%) |
| Total | 4,332 (80.2%) | 113 (2.1%) |
Employment Occupations by Sex in Lincoln Village
Management, Business, Science and Arts Occupations
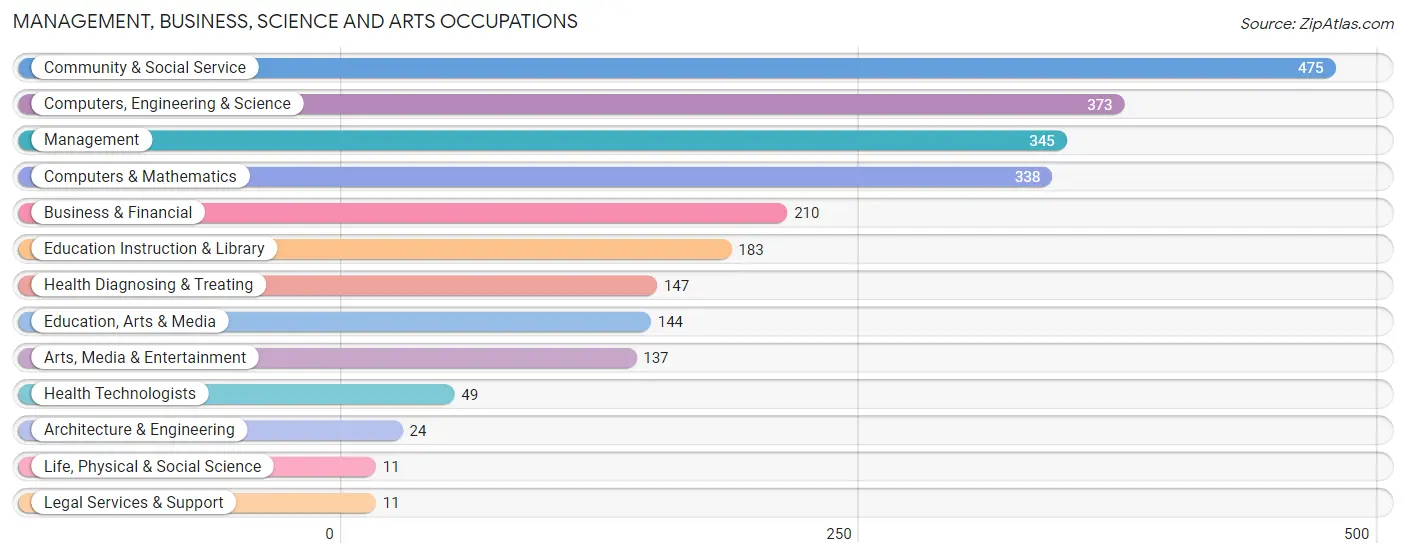
The most common Management, Business, Science and Arts occupations in Lincoln Village are Community & Social Service (475 | 9.2%), Computers, Engineering & Science (373 | 7.3%), Management (345 | 6.7%), Computers & Mathematics (338 | 6.6%), and Business & Financial (210 | 4.1%).
Management, Business, Science and Arts Occupations by Sex
Within the Management, Business, Science and Arts occupations in Lincoln Village, the most male-oriented occupations are Architecture & Engineering (100.0%), Health Technologists (100.0%), and Education, Arts & Media (81.2%), while the most female-oriented occupations are Life, Physical & Social Science (100.0%), Legal Services & Support (100.0%), and Education Instruction & Library (84.7%).
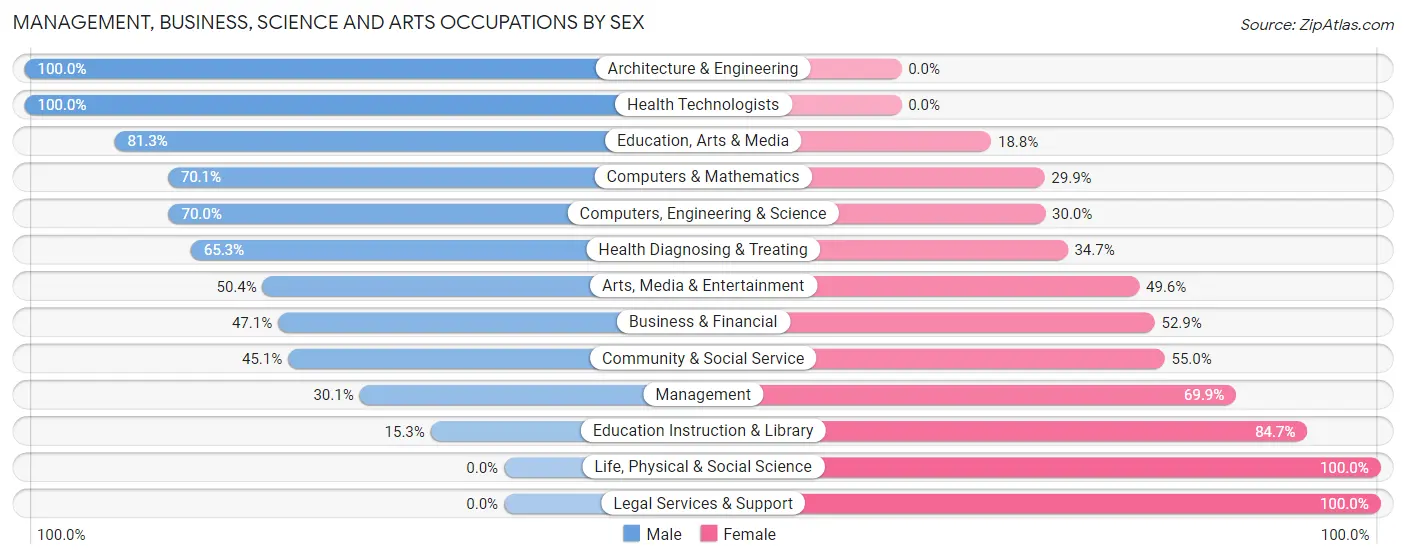
| Occupation | Male | Female |
| Management | 104 (30.1%) | 241 (69.9%) |
| Business & Financial | 99 (47.1%) | 111 (52.9%) |
| Computers, Engineering & Science | 261 (70.0%) | 112 (30.0%) |
| Computers & Mathematics | 237 (70.1%) | 101 (29.9%) |
| Architecture & Engineering | 24 (100.0%) | 0 (0.0%) |
| Life, Physical & Social Science | 0 (0.0%) | 11 (100.0%) |
| Community & Social Service | 214 (45.1%) | 261 (54.9%) |
| Education, Arts & Media | 117 (81.2%) | 27 (18.8%) |
| Legal Services & Support | 0 (0.0%) | 11 (100.0%) |
| Education Instruction & Library | 28 (15.3%) | 155 (84.7%) |
| Arts, Media & Entertainment | 69 (50.4%) | 68 (49.6%) |
| Health Diagnosing & Treating | 96 (65.3%) | 51 (34.7%) |
| Health Technologists | 49 (100.0%) | 0 (0.0%) |
| Total (Category) | 774 (49.9%) | 776 (50.1%) |
| Total (Overall) | 2,679 (52.1%) | 2,458 (47.8%) |
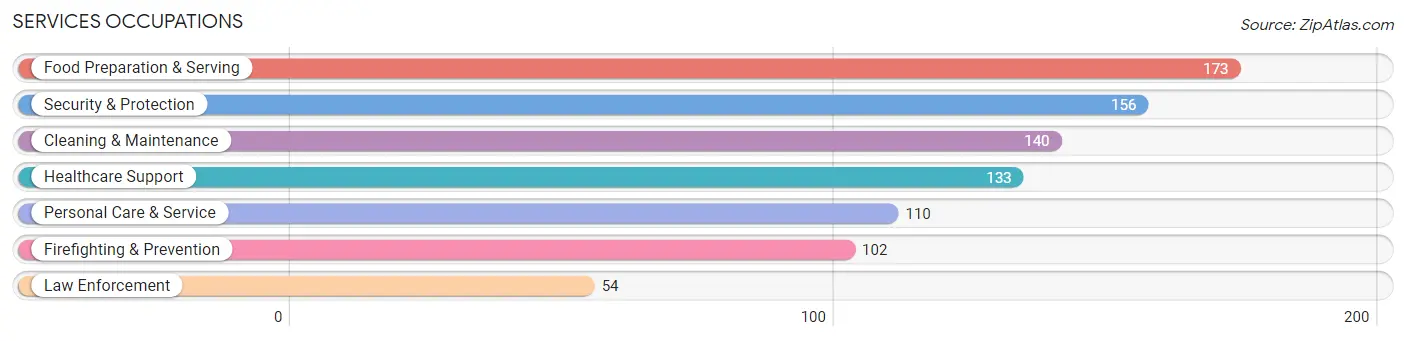
Services Occupations
The most common Services occupations in Lincoln Village are Food Preparation & Serving (173 | 3.4%), Security & Protection (156 | 3.0%), Cleaning & Maintenance (140 | 2.7%), Healthcare Support (133 | 2.6%), and Personal Care & Service (110 | 2.1%).
Services Occupations by Sex
Within the Services occupations in Lincoln Village, the most male-oriented occupations are Firefighting & Prevention (91.2%), Security & Protection (89.1%), and Law Enforcement (85.2%), while the most female-oriented occupations are Personal Care & Service (89.1%), Healthcare Support (78.2%), and Food Preparation & Serving (42.2%).
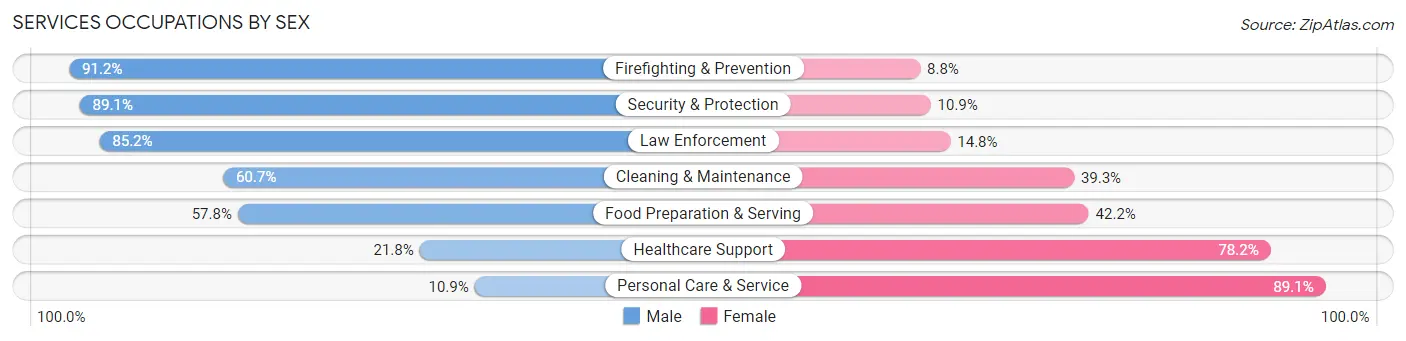
| Occupation | Male | Female |
| Healthcare Support | 29 (21.8%) | 104 (78.2%) |
| Security & Protection | 139 (89.1%) | 17 (10.9%) |
| Firefighting & Prevention | 93 (91.2%) | 9 (8.8%) |
| Law Enforcement | 46 (85.2%) | 8 (14.8%) |
| Food Preparation & Serving | 100 (57.8%) | 73 (42.2%) |
| Cleaning & Maintenance | 85 (60.7%) | 55 (39.3%) |
| Personal Care & Service | 12 (10.9%) | 98 (89.1%) |
| Total (Category) | 365 (51.3%) | 347 (48.7%) |
| Total (Overall) | 2,679 (52.1%) | 2,458 (47.8%) |
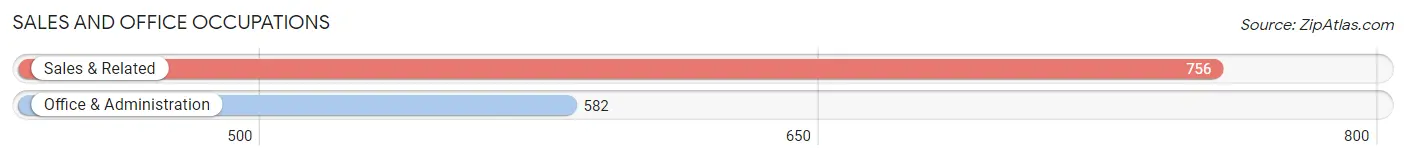
Sales and Office Occupations
The most common Sales and Office occupations in Lincoln Village are Sales & Related (756 | 14.7%), and Office & Administration (582 | 11.3%).
Sales and Office Occupations by Sex
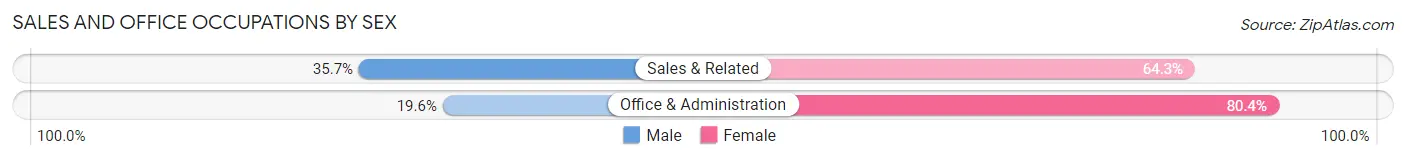
| Occupation | Male | Female |
| Sales & Related | 270 (35.7%) | 486 (64.3%) |
| Office & Administration | 114 (19.6%) | 468 (80.4%) |
| Total (Category) | 384 (28.7%) | 954 (71.3%) |
| Total (Overall) | 2,679 (52.1%) | 2,458 (47.8%) |
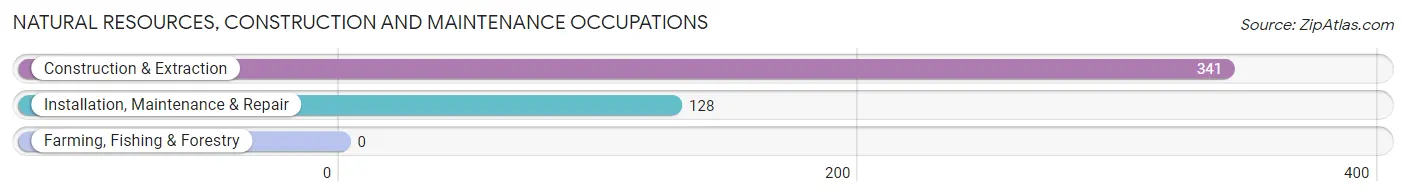
Natural Resources, Construction and Maintenance Occupations
The most common Natural Resources, Construction and Maintenance occupations in Lincoln Village are Construction & Extraction (341 | 6.6%), and Installation, Maintenance & Repair (128 | 2.5%).
Natural Resources, Construction and Maintenance Occupations by Sex
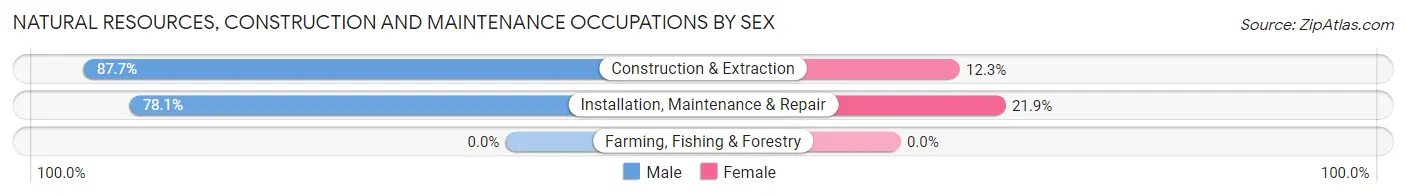
| Occupation | Male | Female |
| Farming, Fishing & Forestry | 0 (0.0%) | 0 (0.0%) |
| Construction & Extraction | 299 (87.7%) | 42 (12.3%) |
| Installation, Maintenance & Repair | 100 (78.1%) | 28 (21.9%) |
| Total (Category) | 399 (85.1%) | 70 (14.9%) |
| Total (Overall) | 2,679 (52.1%) | 2,458 (47.8%) |
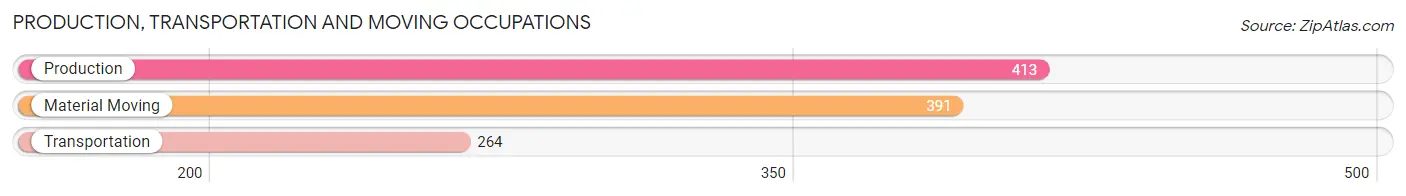
Production, Transportation and Moving Occupations
The most common Production, Transportation and Moving occupations in Lincoln Village are Production (413 | 8.0%), Material Moving (391 | 7.6%), and Transportation (264 | 5.1%).
Production, Transportation and Moving Occupations by Sex
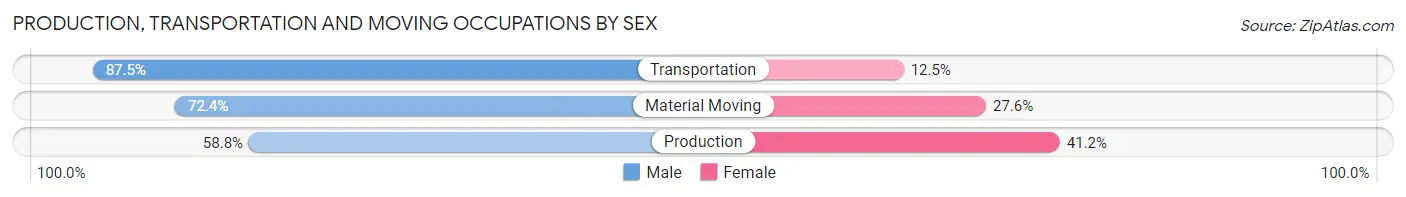
| Occupation | Male | Female |
| Production | 243 (58.8%) | 170 (41.2%) |
| Transportation | 231 (87.5%) | 33 (12.5%) |
| Material Moving | 283 (72.4%) | 108 (27.6%) |
| Total (Category) | 757 (70.9%) | 311 (29.1%) |
| Total (Overall) | 2,679 (52.1%) | 2,458 (47.8%) |
Employment Industries by Sex in Lincoln Village
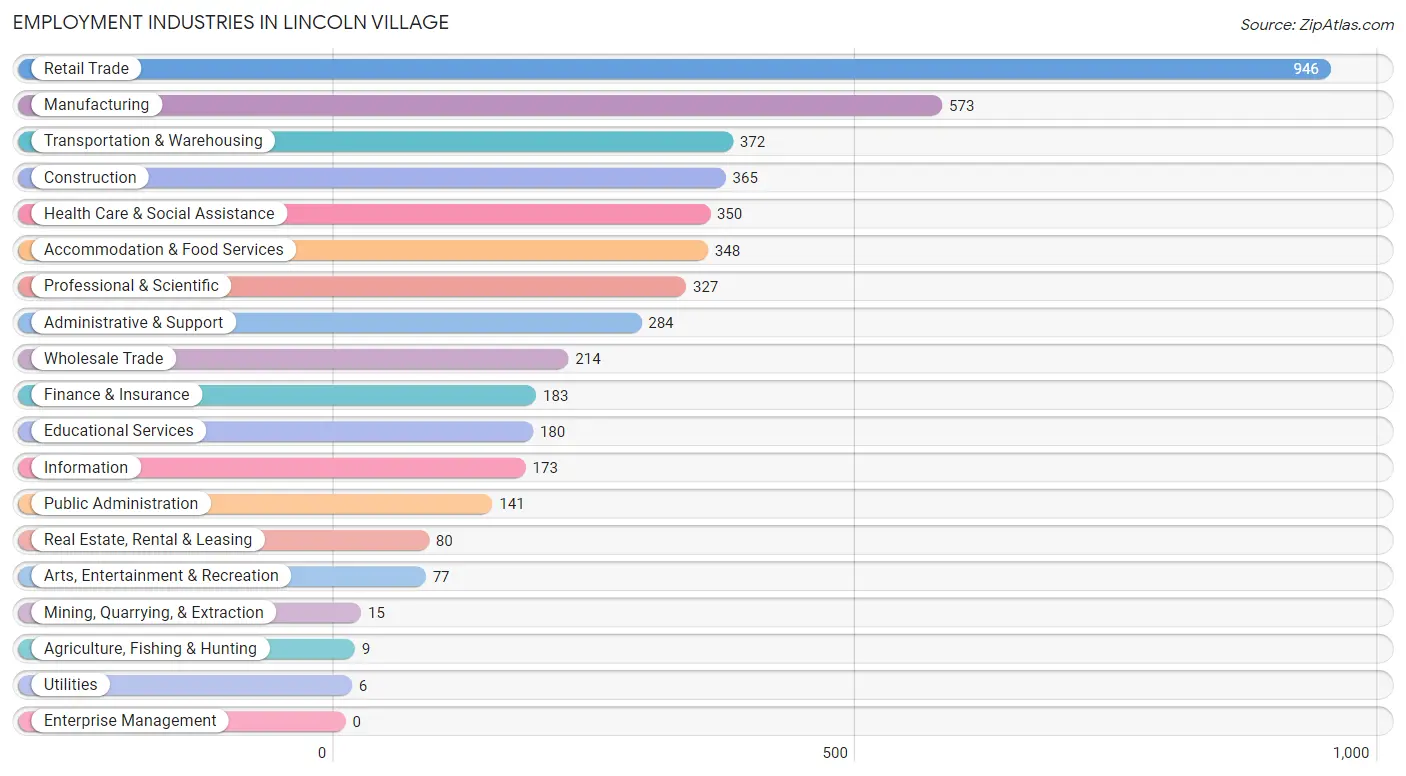
Employment Industries in Lincoln Village
The major employment industries in Lincoln Village include Retail Trade (946 | 18.4%), Manufacturing (573 | 11.2%), Transportation & Warehousing (372 | 7.2%), Construction (365 | 7.1%), and Health Care & Social Assistance (350 | 6.8%).
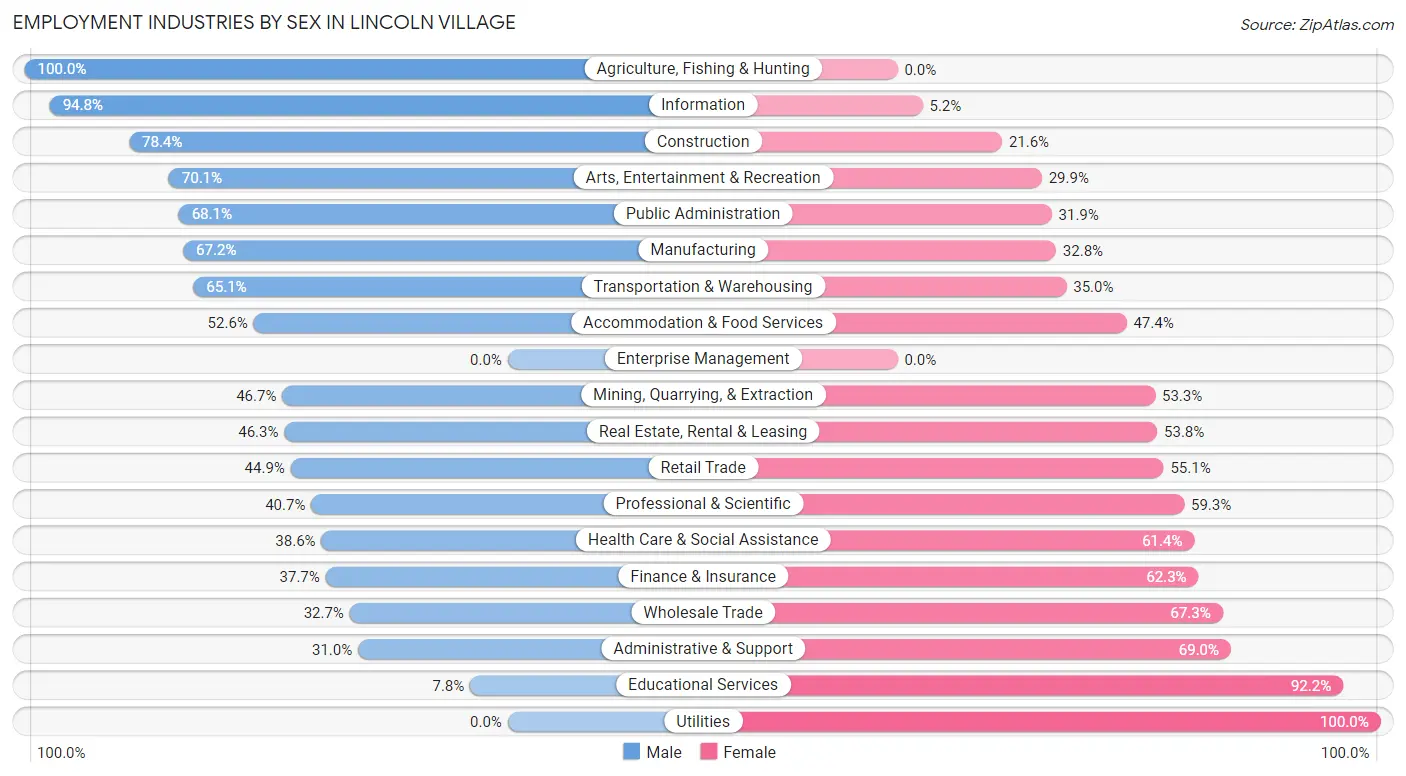
Employment Industries by Sex in Lincoln Village
The Lincoln Village industries that see more men than women are Agriculture, Fishing & Hunting (100.0%), Information (94.8%), and Construction (78.4%), whereas the industries that tend to have a higher number of women are Utilities (100.0%), Educational Services (92.2%), and Administrative & Support (69.0%).
| Industry | Male | Female |
| Agriculture, Fishing & Hunting | 9 (100.0%) | 0 (0.0%) |
| Mining, Quarrying, & Extraction | 7 (46.7%) | 8 (53.3%) |
| Construction | 286 (78.4%) | 79 (21.6%) |
| Manufacturing | 385 (67.2%) | 188 (32.8%) |
| Wholesale Trade | 70 (32.7%) | 144 (67.3%) |
| Retail Trade | 425 (44.9%) | 521 (55.1%) |
| Transportation & Warehousing | 242 (65.0%) | 130 (34.9%) |
| Utilities | 0 (0.0%) | 6 (100.0%) |
| Information | 164 (94.8%) | 9 (5.2%) |
| Finance & Insurance | 69 (37.7%) | 114 (62.3%) |
| Real Estate, Rental & Leasing | 37 (46.3%) | 43 (53.7%) |
| Professional & Scientific | 133 (40.7%) | 194 (59.3%) |
| Enterprise Management | 0 (0.0%) | 0 (0.0%) |
| Administrative & Support | 88 (31.0%) | 196 (69.0%) |
| Educational Services | 14 (7.8%) | 166 (92.2%) |
| Health Care & Social Assistance | 135 (38.6%) | 215 (61.4%) |
| Arts, Entertainment & Recreation | 54 (70.1%) | 23 (29.9%) |
| Accommodation & Food Services | 183 (52.6%) | 165 (47.4%) |
| Public Administration | 96 (68.1%) | 45 (31.9%) |
| Total | 2,679 (52.1%) | 2,458 (47.8%) |
Education in Lincoln Village
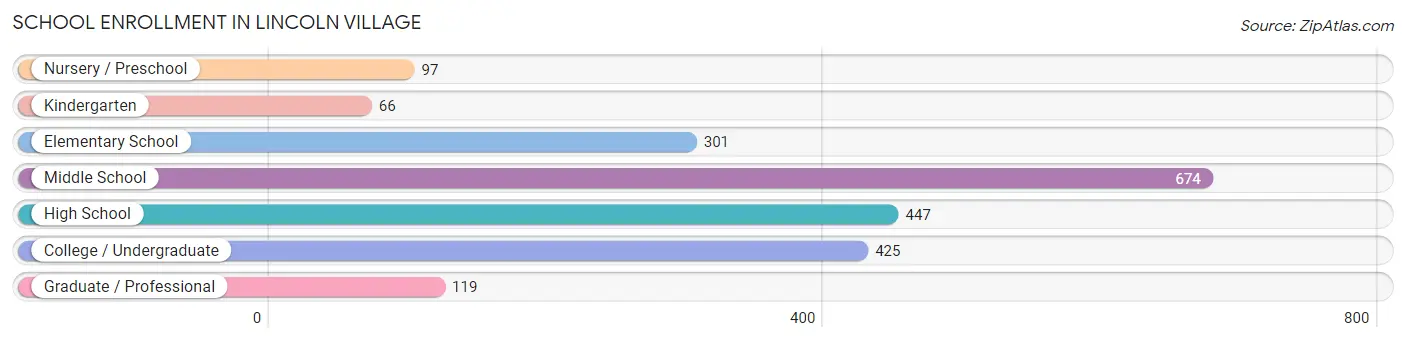
School Enrollment in Lincoln Village
The most common levels of schooling among the 2,129 students in Lincoln Village are middle school (674 | 31.7%), high school (447 | 21.0%), and college / undergraduate (425 | 20.0%).
| School Level | # Students | % Students |
| Nursery / Preschool | 97 | 4.6% |
| Kindergarten | 66 | 3.1% |
| Elementary School | 301 | 14.1% |
| Middle School | 674 | 31.7% |
| High School | 447 | 21.0% |
| College / Undergraduate | 425 | 20.0% |
| Graduate / Professional | 119 | 5.6% |
| Total | 2,129 | 100.0% |
School Enrollment by Age by Funding Source in Lincoln Village
Out of a total of 2,129 students who are enrolled in schools in Lincoln Village, 379 (17.8%) attend a private institution, while the remaining 1,750 (82.2%) are enrolled in public schools. The age group of 35 years and over has the highest likelihood of being enrolled in private schools, with 28 (70.0% in the age bracket) enrolled. Conversely, the age group of 18 to 19 year olds has the lowest likelihood of being enrolled in a private school, with 229 (100.0% in the age bracket) attending a public institution.
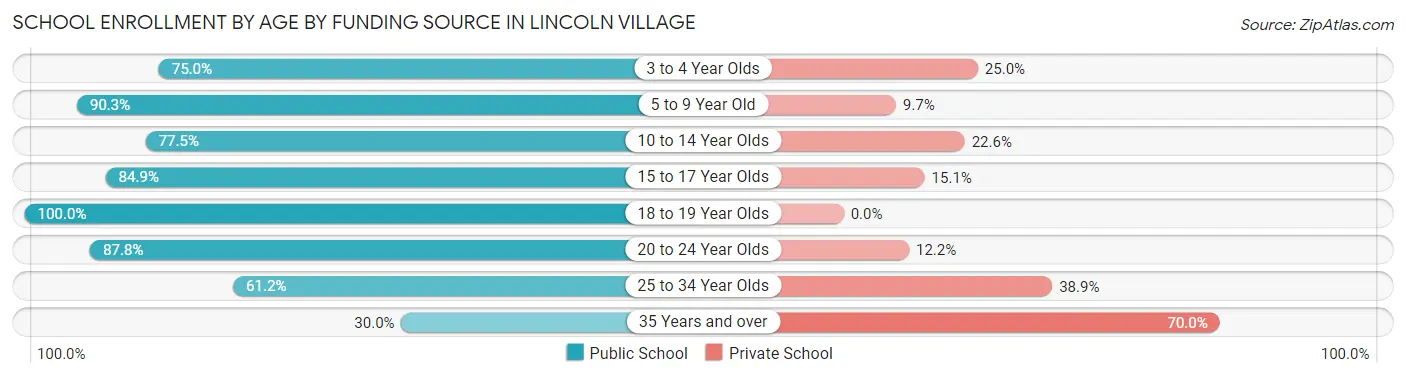
| Age Bracket | Public School | Private School |
| 3 to 4 Year Olds | 24 (75.0%) | 8 (25.0%) |
| 5 to 9 Year Old | 362 (90.3%) | 39 (9.7%) |
| 10 to 14 Year Olds | 570 (77.4%) | 166 (22.6%) |
| 15 to 17 Year Olds | 321 (84.9%) | 57 (15.1%) |
| 18 to 19 Year Olds | 229 (100.0%) | 0 (0.0%) |
| 20 to 24 Year Olds | 137 (87.8%) | 19 (12.2%) |
| 25 to 34 Year Olds | 96 (61.2%) | 61 (38.9%) |
| 35 Years and over | 12 (30.0%) | 28 (70.0%) |
| Total | 1,750 (82.2%) | 379 (17.8%) |
Educational Attainment by Field of Study in Lincoln Village
Business (215 | 18.9%), education (203 | 17.8%), liberal arts & history (119 | 10.4%), science & technology (112 | 9.8%), and bio, nature & agricultural (69 | 6.0%) are the most common fields of study among 1,140 individuals in Lincoln Village who have obtained a bachelor's degree or higher.
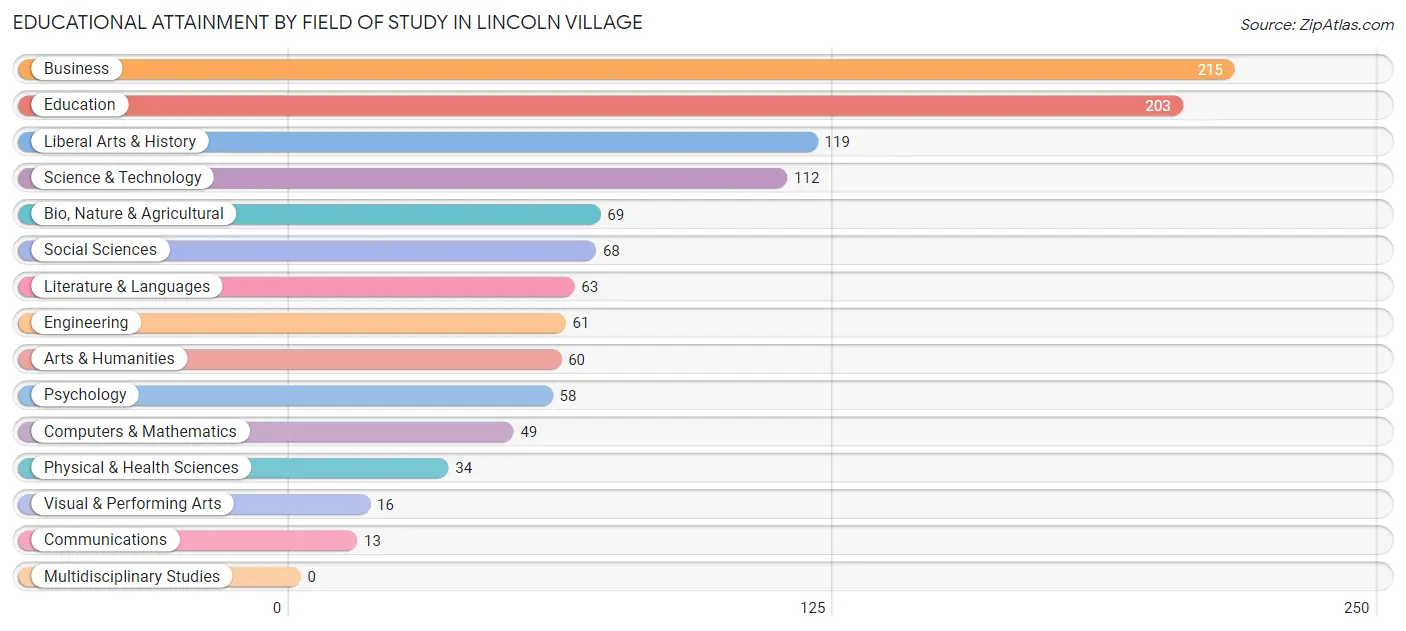
| Field of Study | # Graduates | % Graduates |
| Computers & Mathematics | 49 | 4.3% |
| Bio, Nature & Agricultural | 69 | 6.0% |
| Physical & Health Sciences | 34 | 3.0% |
| Psychology | 58 | 5.1% |
| Social Sciences | 68 | 6.0% |
| Engineering | 61 | 5.3% |
| Multidisciplinary Studies | 0 | 0.0% |
| Science & Technology | 112 | 9.8% |
| Business | 215 | 18.9% |
| Education | 203 | 17.8% |
| Literature & Languages | 63 | 5.5% |
| Liberal Arts & History | 119 | 10.4% |
| Visual & Performing Arts | 16 | 1.4% |
| Communications | 13 | 1.1% |
| Arts & Humanities | 60 | 5.3% |
| Total | 1,140 | 100.0% |
Transportation & Commute in Lincoln Village
Vehicle Availability by Sex in Lincoln Village
The most prevalent vehicle ownership categories in Lincoln Village are males with 2 vehicles (1,238, accounting for 47.0%) and females with 2 vehicles (1,175, making up 51.1%).
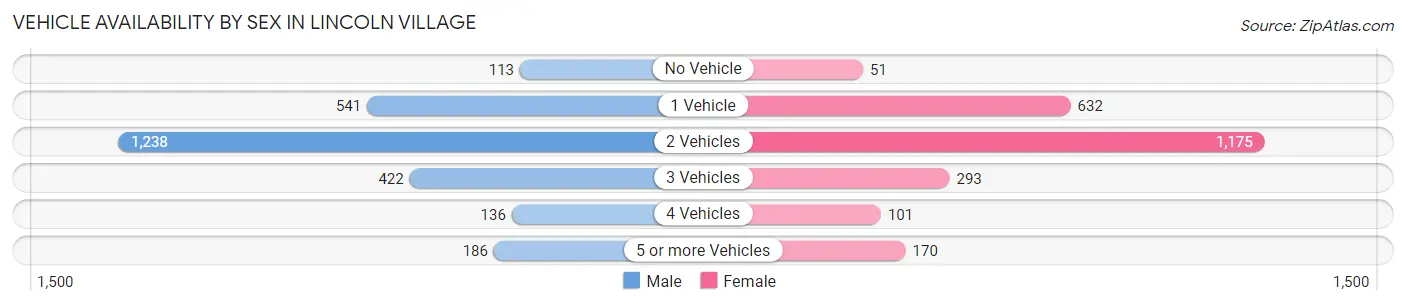
| Vehicles Available | Male | Female |
| No Vehicle | 113 (4.3%) | 51 (2.1%) |
| 1 Vehicle | 541 (20.5%) | 632 (26.1%) |
| 2 Vehicles | 1,238 (47.0%) | 1,175 (48.5%) |
| 3 Vehicles | 422 (16.0%) | 293 (12.1%) |
| 4 Vehicles | 136 (5.2%) | 101 (4.2%) |
| 5 or more Vehicles | 186 (7.1%) | 170 (7.0%) |
| Total | 2,636 (100.0%) | 2,422 (100.0%) |
Commute Time in Lincoln Village
The most frequently occuring commute durations in Lincoln Village are 10 to 14 minutes (1,020 commuters, 22.0%), 15 to 19 minutes (995 commuters, 21.4%), and 20 to 24 minutes (697 commuters, 15.0%).
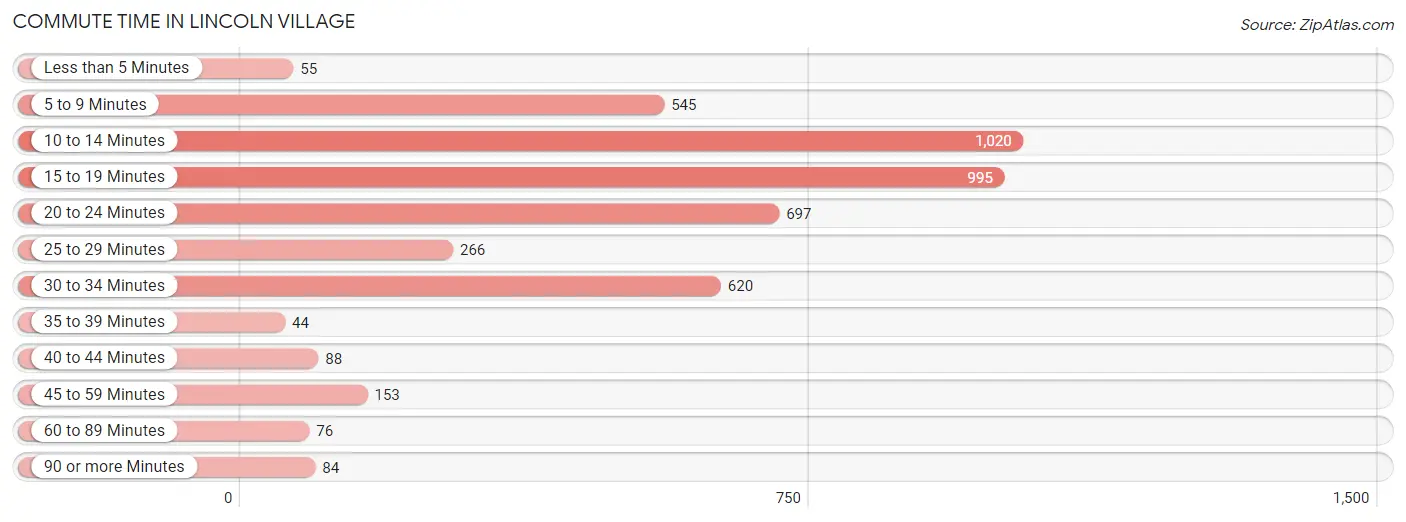
| Commute Time | # Commuters | % Commuters |
| Less than 5 Minutes | 55 | 1.2% |
| 5 to 9 Minutes | 545 | 11.7% |
| 10 to 14 Minutes | 1,020 | 22.0% |
| 15 to 19 Minutes | 995 | 21.4% |
| 20 to 24 Minutes | 697 | 15.0% |
| 25 to 29 Minutes | 266 | 5.7% |
| 30 to 34 Minutes | 620 | 13.4% |
| 35 to 39 Minutes | 44 | 0.9% |
| 40 to 44 Minutes | 88 | 1.9% |
| 45 to 59 Minutes | 153 | 3.3% |
| 60 to 89 Minutes | 76 | 1.6% |
| 90 or more Minutes | 84 | 1.8% |
Commute Time by Sex in Lincoln Village
The most common commute times in Lincoln Village are 10 to 14 minutes (547 commuters, 23.0%) for males and 15 to 19 minutes (536 commuters, 23.7%) for females.
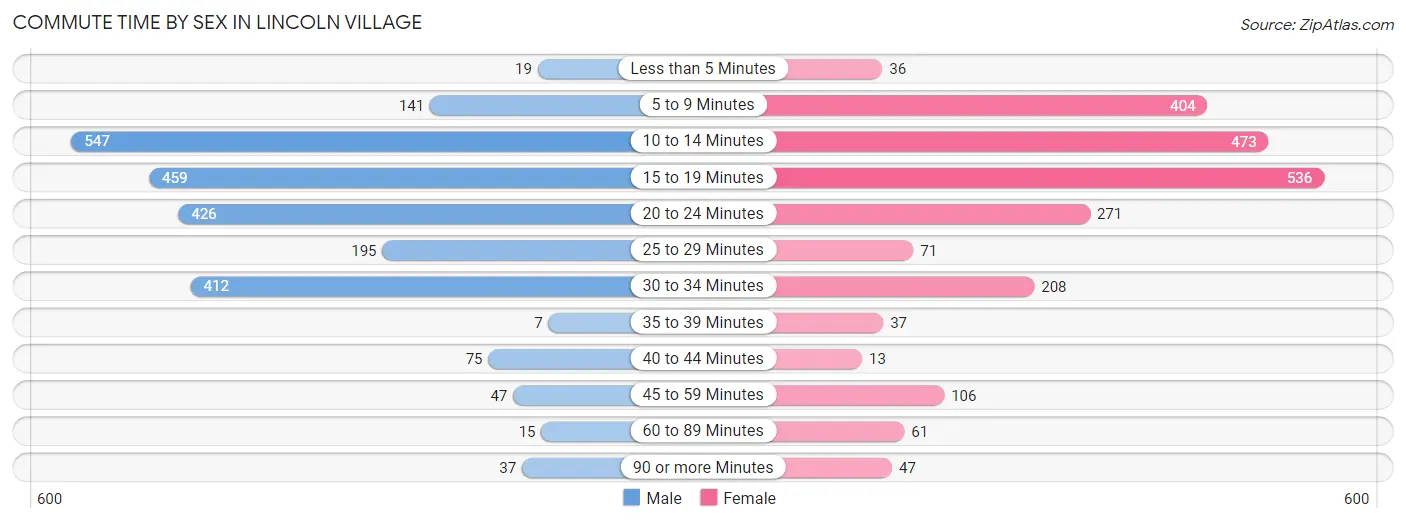
| Commute Time | Male | Female |
| Less than 5 Minutes | 19 (0.8%) | 36 (1.6%) |
| 5 to 9 Minutes | 141 (5.9%) | 404 (17.8%) |
| 10 to 14 Minutes | 547 (23.0%) | 473 (20.9%) |
| 15 to 19 Minutes | 459 (19.3%) | 536 (23.7%) |
| 20 to 24 Minutes | 426 (17.9%) | 271 (12.0%) |
| 25 to 29 Minutes | 195 (8.2%) | 71 (3.1%) |
| 30 to 34 Minutes | 412 (17.3%) | 208 (9.2%) |
| 35 to 39 Minutes | 7 (0.3%) | 37 (1.6%) |
| 40 to 44 Minutes | 75 (3.2%) | 13 (0.6%) |
| 45 to 59 Minutes | 47 (2.0%) | 106 (4.7%) |
| 60 to 89 Minutes | 15 (0.6%) | 61 (2.7%) |
| 90 or more Minutes | 37 (1.5%) | 47 (2.1%) |
Time of Departure to Work by Sex in Lincoln Village
The most frequent times of departure to work in Lincoln Village are 6:00 AM to 6:29 AM (278, 11.7%) for males and 5:00 AM to 5:29 AM (269, 11.9%) for females.
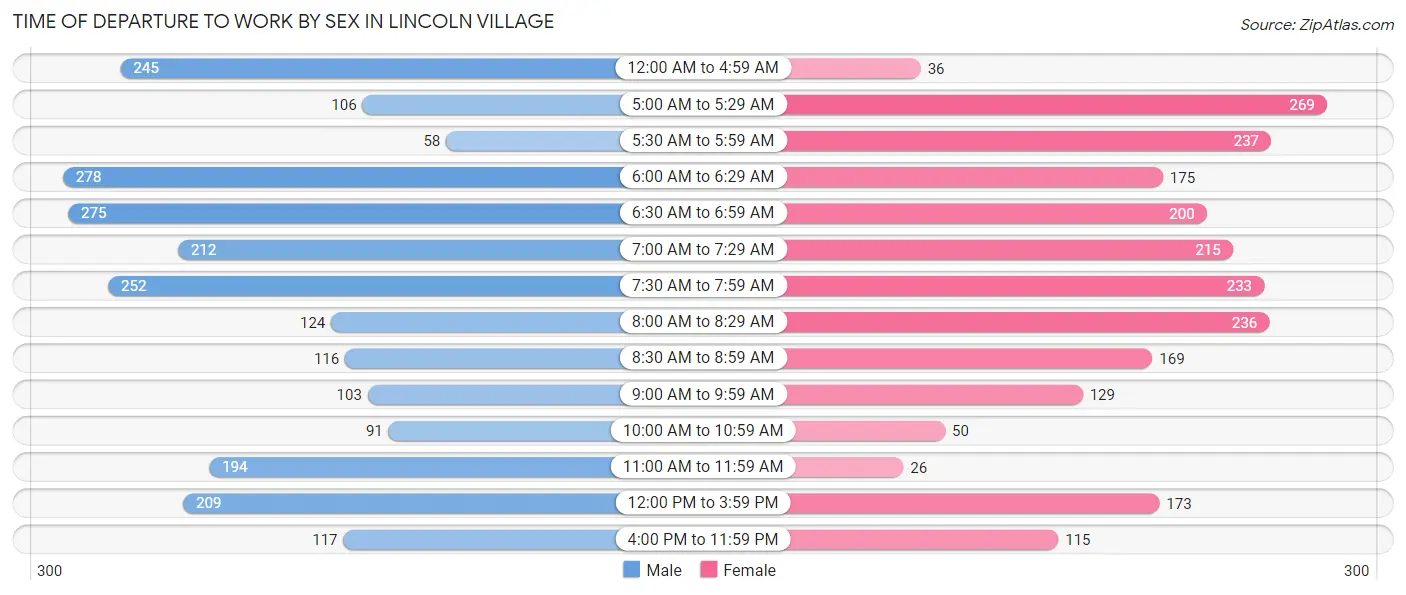
| Time of Departure | Male | Female |
| 12:00 AM to 4:59 AM | 245 (10.3%) | 36 (1.6%) |
| 5:00 AM to 5:29 AM | 106 (4.4%) | 269 (11.9%) |
| 5:30 AM to 5:59 AM | 58 (2.4%) | 237 (10.5%) |
| 6:00 AM to 6:29 AM | 278 (11.7%) | 175 (7.7%) |
| 6:30 AM to 6:59 AM | 275 (11.6%) | 200 (8.8%) |
| 7:00 AM to 7:29 AM | 212 (8.9%) | 215 (9.5%) |
| 7:30 AM to 7:59 AM | 252 (10.6%) | 233 (10.3%) |
| 8:00 AM to 8:29 AM | 124 (5.2%) | 236 (10.4%) |
| 8:30 AM to 8:59 AM | 116 (4.9%) | 169 (7.5%) |
| 9:00 AM to 9:59 AM | 103 (4.3%) | 129 (5.7%) |
| 10:00 AM to 10:59 AM | 91 (3.8%) | 50 (2.2%) |
| 11:00 AM to 11:59 AM | 194 (8.2%) | 26 (1.1%) |
| 12:00 PM to 3:59 PM | 209 (8.8%) | 173 (7.6%) |
| 4:00 PM to 11:59 PM | 117 (4.9%) | 115 (5.1%) |
| Total | 2,380 (100.0%) | 2,263 (100.0%) |
Housing Occupancy in Lincoln Village
Occupancy by Ownership in Lincoln Village
Of the total 3,910 dwellings in Lincoln Village, owner-occupied units account for 2,319 (59.3%), while renter-occupied units make up 1,591 (40.7%).
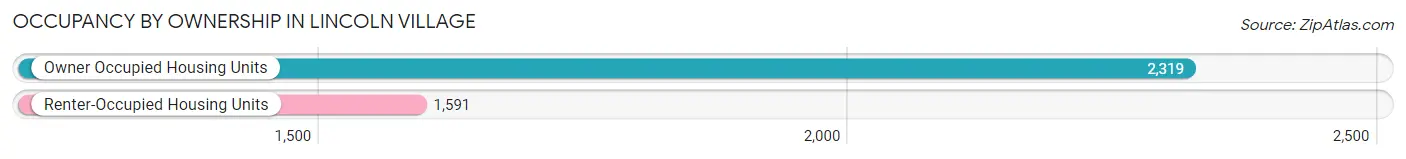
| Occupancy | # Housing Units | % Housing Units |
| Owner Occupied Housing Units | 2,319 | 59.3% |
| Renter-Occupied Housing Units | 1,591 | 40.7% |
| Total Occupied Housing Units | 3,910 | 100.0% |
Occupancy by Household Size in Lincoln Village
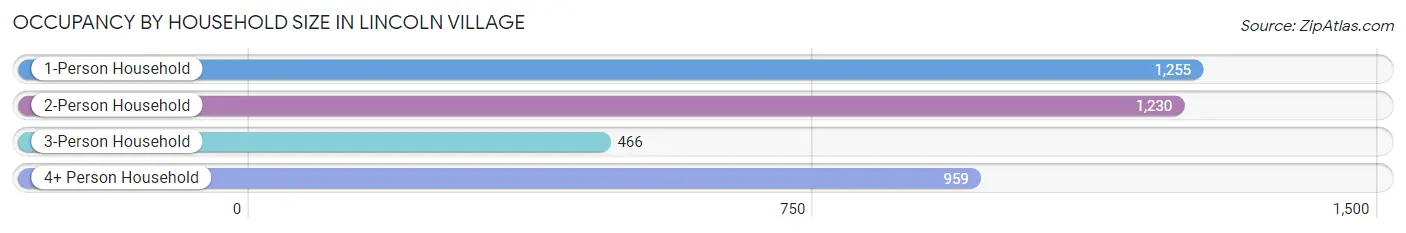
| Household Size | # Housing Units | % Housing Units |
| 1-Person Household | 1,255 | 32.1% |
| 2-Person Household | 1,230 | 31.5% |
| 3-Person Household | 466 | 11.9% |
| 4+ Person Household | 959 | 24.5% |
| Total Housing Units | 3,910 | 100.0% |
Occupancy by Ownership by Household Size in Lincoln Village
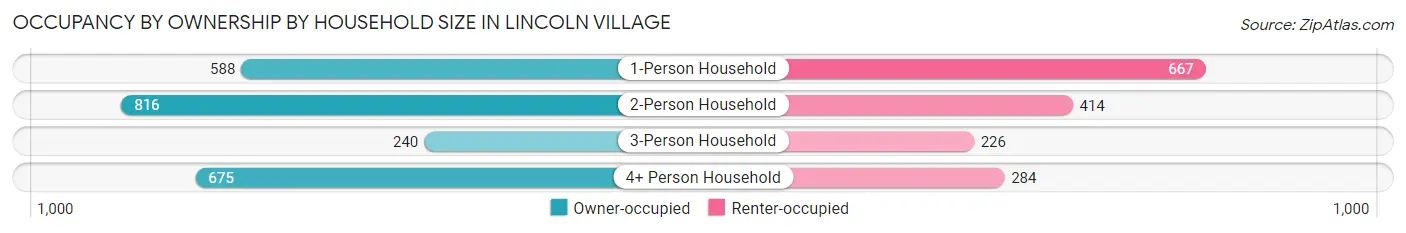
| Household Size | Owner-occupied | Renter-occupied |
| 1-Person Household | 588 (46.9%) | 667 (53.1%) |
| 2-Person Household | 816 (66.3%) | 414 (33.7%) |
| 3-Person Household | 240 (51.5%) | 226 (48.5%) |
| 4+ Person Household | 675 (70.4%) | 284 (29.6%) |
| Total Housing Units | 2,319 (59.3%) | 1,591 (40.7%) |
Occupancy by Educational Attainment in Lincoln Village
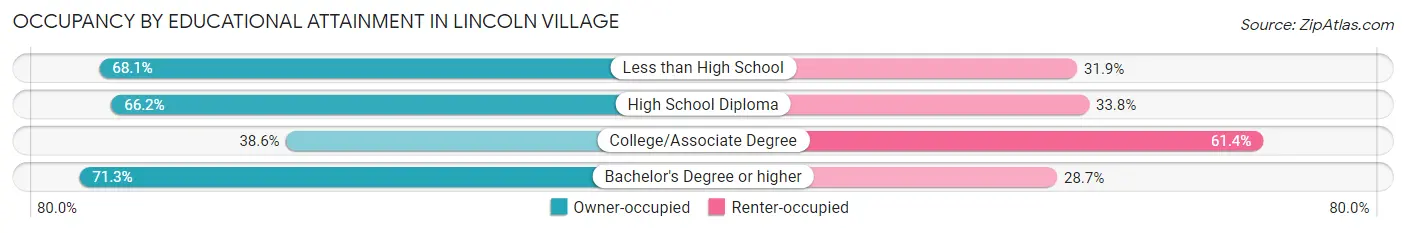
| Household Size | Owner-occupied | Renter-occupied |
| Less than High School | 404 (68.1%) | 189 (31.9%) |
| High School Diploma | 963 (66.2%) | 491 (33.8%) |
| College/Associate Degree | 445 (38.6%) | 707 (61.4%) |
| Bachelor's Degree or higher | 507 (71.3%) | 204 (28.7%) |
Occupancy by Age of Householder in Lincoln Village

| Age Bracket | # Households | % Households |
| Under 35 Years | 678 | 17.3% |
| 35 to 44 Years | 906 | 23.2% |
| 45 to 54 Years | 700 | 17.9% |
| 55 to 64 Years | 761 | 19.5% |
| 65 to 74 Years | 500 | 12.8% |
| 75 to 84 Years | 298 | 7.6% |
| 85 Years and Over | 67 | 1.7% |
| Total | 3,910 | 100.0% |
Housing Finances in Lincoln Village
Median Income by Occupancy in Lincoln Village
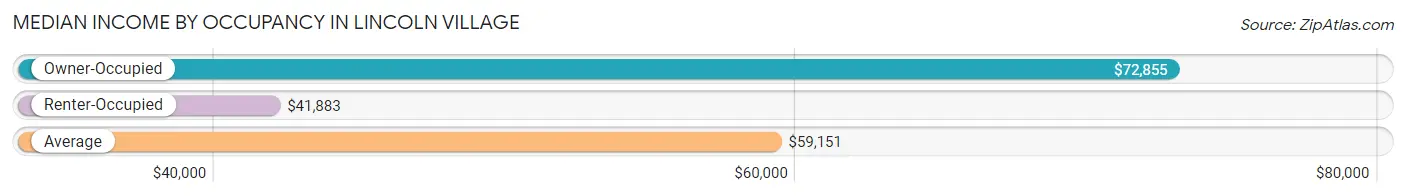
| Occupancy Type | # Households | Median Income |
| Owner-Occupied | 2,319 (59.3%) | $72,855 |
| Renter-Occupied | 1,591 (40.7%) | $41,883 |
| Average | 3,910 (100.0%) | $59,151 |
Occupancy by Householder Income Bracket in Lincoln Village
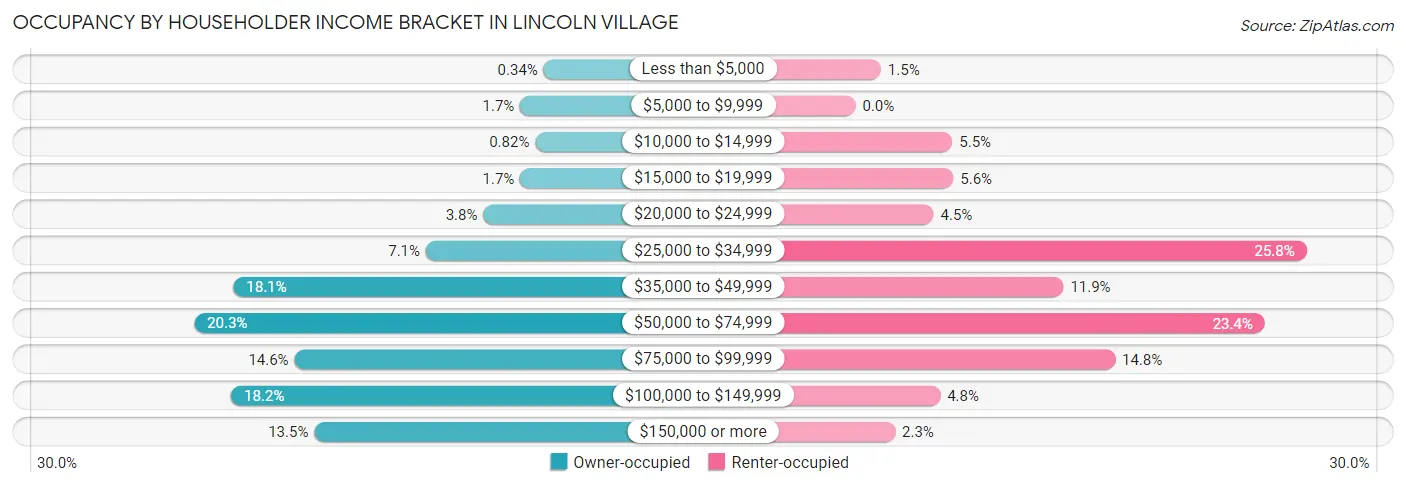
| Income Bracket | Owner-occupied | Renter-occupied |
| Less than $5,000 | 8 (0.3%) | 23 (1.5%) |
| $5,000 to $9,999 | 39 (1.7%) | 0 (0.0%) |
| $10,000 to $14,999 | 19 (0.8%) | 88 (5.5%) |
| $15,000 to $19,999 | 39 (1.7%) | 89 (5.6%) |
| $20,000 to $24,999 | 88 (3.8%) | 71 (4.5%) |
| $25,000 to $34,999 | 164 (7.1%) | 410 (25.8%) |
| $35,000 to $49,999 | 419 (18.1%) | 189 (11.9%) |
| $50,000 to $74,999 | 471 (20.3%) | 372 (23.4%) |
| $75,000 to $99,999 | 338 (14.6%) | 236 (14.8%) |
| $100,000 to $149,999 | 422 (18.2%) | 77 (4.8%) |
| $150,000 or more | 312 (13.5%) | 36 (2.3%) |
| Total | 2,319 (100.0%) | 1,591 (100.0%) |
Monthly Housing Cost Tiers in Lincoln Village
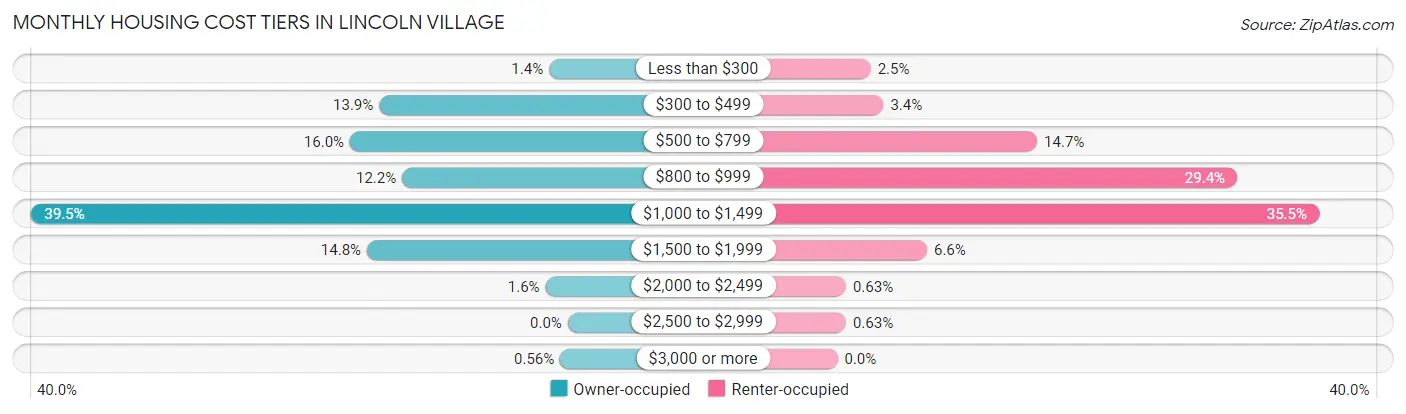
| Monthly Cost | Owner-occupied | Renter-occupied |
| Less than $300 | 32 (1.4%) | 39 (2.5%) |
| $300 to $499 | 322 (13.9%) | 54 (3.4%) |
| $500 to $799 | 372 (16.0%) | 234 (14.7%) |
| $800 to $999 | 283 (12.2%) | 468 (29.4%) |
| $1,000 to $1,499 | 916 (39.5%) | 564 (35.4%) |
| $1,500 to $1,999 | 343 (14.8%) | 105 (6.6%) |
| $2,000 to $2,499 | 38 (1.6%) | 10 (0.6%) |
| $2,500 to $2,999 | 0 (0.0%) | 10 (0.6%) |
| $3,000 or more | 13 (0.6%) | 0 (0.0%) |
| Total | 2,319 (100.0%) | 1,591 (100.0%) |
Physical Housing Characteristics in Lincoln Village
Housing Structures in Lincoln Village
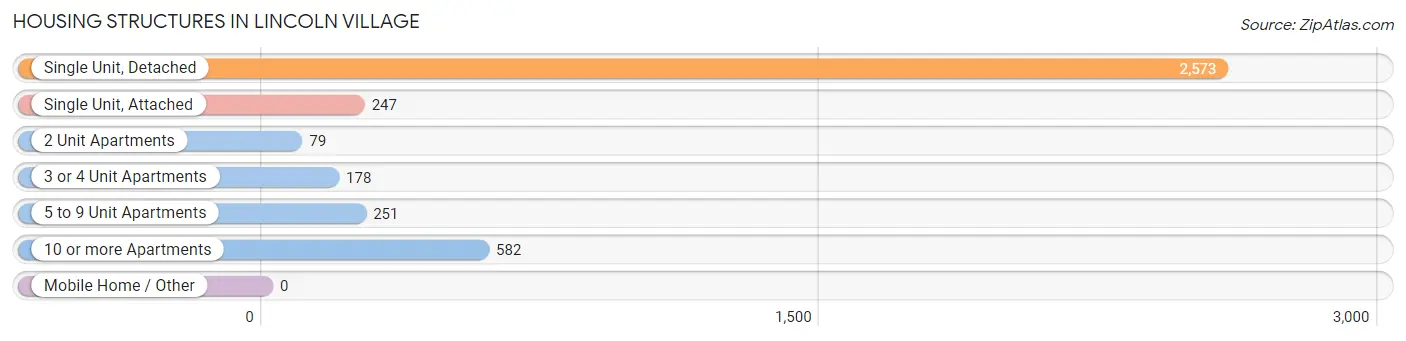
| Structure Type | # Housing Units | % Housing Units |
| Single Unit, Detached | 2,573 | 65.8% |
| Single Unit, Attached | 247 | 6.3% |
| 2 Unit Apartments | 79 | 2.0% |
| 3 or 4 Unit Apartments | 178 | 4.5% |
| 5 to 9 Unit Apartments | 251 | 6.4% |
| 10 or more Apartments | 582 | 14.9% |
| Mobile Home / Other | 0 | 0.0% |
| Total | 3,910 | 100.0% |
Housing Structures by Occupancy in Lincoln Village
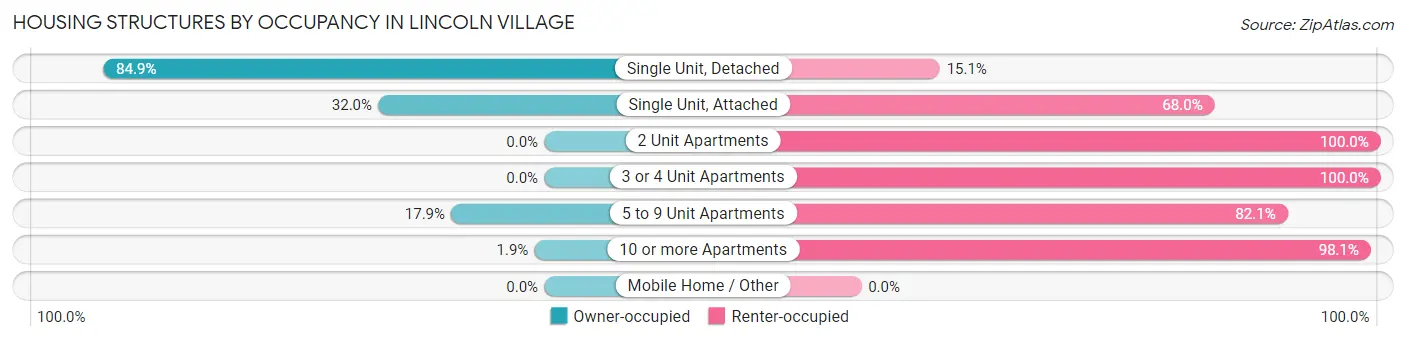
| Structure Type | Owner-occupied | Renter-occupied |
| Single Unit, Detached | 2,184 (84.9%) | 389 (15.1%) |
| Single Unit, Attached | 79 (32.0%) | 168 (68.0%) |
| 2 Unit Apartments | 0 (0.0%) | 79 (100.0%) |
| 3 or 4 Unit Apartments | 0 (0.0%) | 178 (100.0%) |
| 5 to 9 Unit Apartments | 45 (17.9%) | 206 (82.1%) |
| 10 or more Apartments | 11 (1.9%) | 571 (98.1%) |
| Mobile Home / Other | 0 (0.0%) | 0 (0.0%) |
| Total | 2,319 (59.3%) | 1,591 (40.7%) |
Housing Structures by Number of Rooms in Lincoln Village
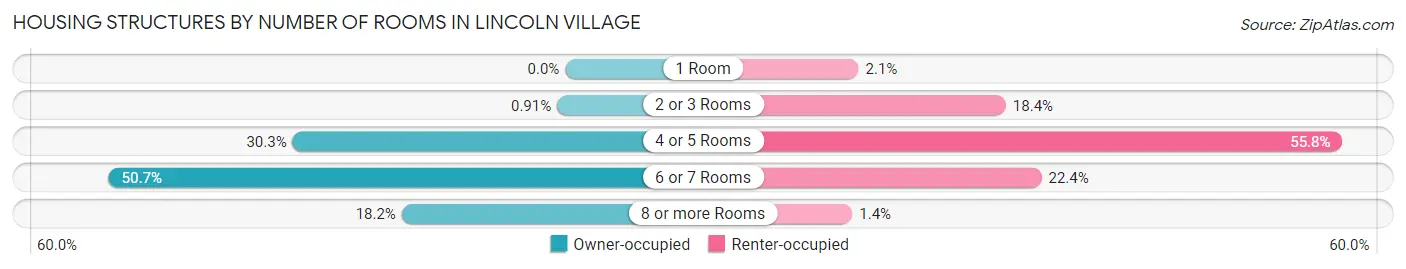
| Number of Rooms | Owner-occupied | Renter-occupied |
| 1 Room | 0 (0.0%) | 33 (2.1%) |
| 2 or 3 Rooms | 21 (0.9%) | 293 (18.4%) |
| 4 or 5 Rooms | 702 (30.3%) | 887 (55.7%) |
| 6 or 7 Rooms | 1,175 (50.7%) | 356 (22.4%) |
| 8 or more Rooms | 421 (18.1%) | 22 (1.4%) |
| Total | 2,319 (100.0%) | 1,591 (100.0%) |
Housing Structure by Heating Type in Lincoln Village
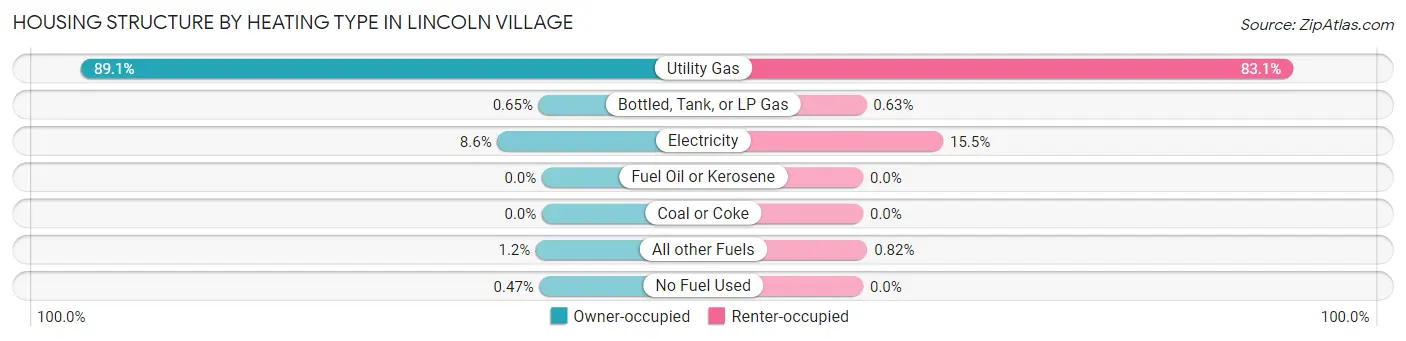
| Heating Type | Owner-occupied | Renter-occupied |
| Utility Gas | 2,066 (89.1%) | 1,322 (83.1%) |
| Bottled, Tank, or LP Gas | 15 (0.6%) | 10 (0.6%) |
| Electricity | 200 (8.6%) | 246 (15.5%) |
| Fuel Oil or Kerosene | 0 (0.0%) | 0 (0.0%) |
| Coal or Coke | 0 (0.0%) | 0 (0.0%) |
| All other Fuels | 27 (1.2%) | 13 (0.8%) |
| No Fuel Used | 11 (0.5%) | 0 (0.0%) |
| Total | 2,319 (100.0%) | 1,591 (100.0%) |
Household Vehicle Usage in Lincoln Village
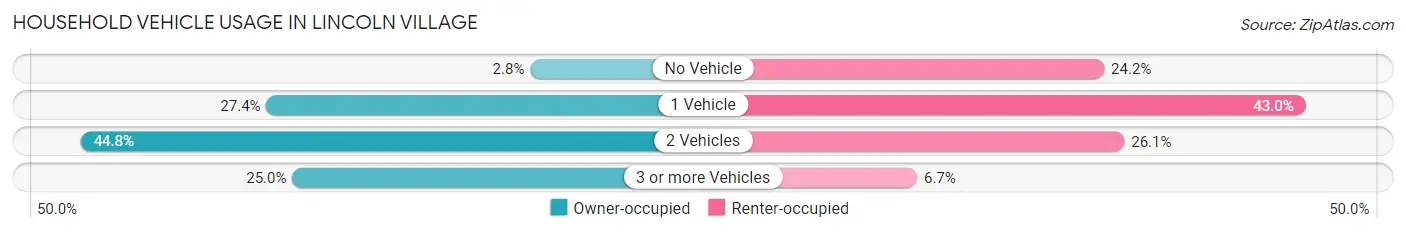
| Vehicles per Household | Owner-occupied | Renter-occupied |
| No Vehicle | 65 (2.8%) | 385 (24.2%) |
| 1 Vehicle | 636 (27.4%) | 684 (43.0%) |
| 2 Vehicles | 1,038 (44.8%) | 415 (26.1%) |
| 3 or more Vehicles | 580 (25.0%) | 107 (6.7%) |
| Total | 2,319 (100.0%) | 1,591 (100.0%) |
Real Estate & Mortgages in Lincoln Village
Real Estate and Mortgage Overview in Lincoln Village
| Characteristic | Without Mortgage | With Mortgage |
| Housing Units | 680 | 1,639 |
| Median Property Value | $139,300 | $152,600 |
| Median Household Income | $47,768 | $242 |
| Monthly Housing Costs | $520 | $13 |
| Real Estate Taxes | $2,194 | $37 |
Property Value by Mortgage Status in Lincoln Village
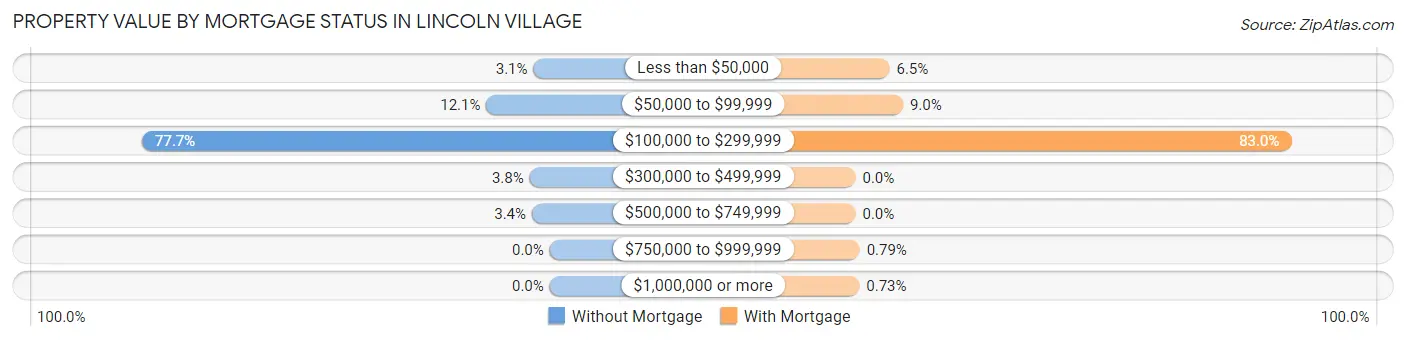
| Property Value | Without Mortgage | With Mortgage |
| Less than $50,000 | 21 (3.1%) | 106 (6.5%) |
| $50,000 to $99,999 | 82 (12.1%) | 148 (9.0%) |
| $100,000 to $299,999 | 528 (77.6%) | 1,360 (83.0%) |
| $300,000 to $499,999 | 26 (3.8%) | 0 (0.0%) |
| $500,000 to $749,999 | 23 (3.4%) | 0 (0.0%) |
| $750,000 to $999,999 | 0 (0.0%) | 13 (0.8%) |
| $1,000,000 or more | 0 (0.0%) | 12 (0.7%) |
| Total | 680 (100.0%) | 1,639 (100.0%) |
Household Income by Mortgage Status in Lincoln Village
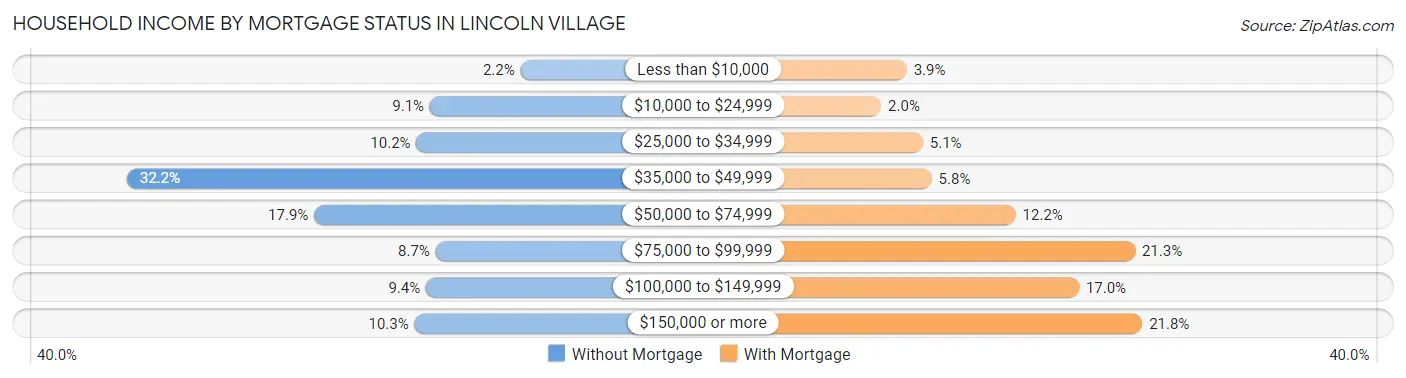
| Household Income | Without Mortgage | With Mortgage |
| Less than $10,000 | 15 (2.2%) | 64 (3.9%) |
| $10,000 to $24,999 | 62 (9.1%) | 32 (1.9%) |
| $25,000 to $34,999 | 69 (10.2%) | 84 (5.1%) |
| $35,000 to $49,999 | 219 (32.2%) | 95 (5.8%) |
| $50,000 to $74,999 | 122 (17.9%) | 200 (12.2%) |
| $75,000 to $99,999 | 59 (8.7%) | 349 (21.3%) |
| $100,000 to $149,999 | 64 (9.4%) | 279 (17.0%) |
| $150,000 or more | 70 (10.3%) | 358 (21.8%) |
| Total | 680 (100.0%) | 1,639 (100.0%) |
Property Value to Household Income Ratio in Lincoln Village
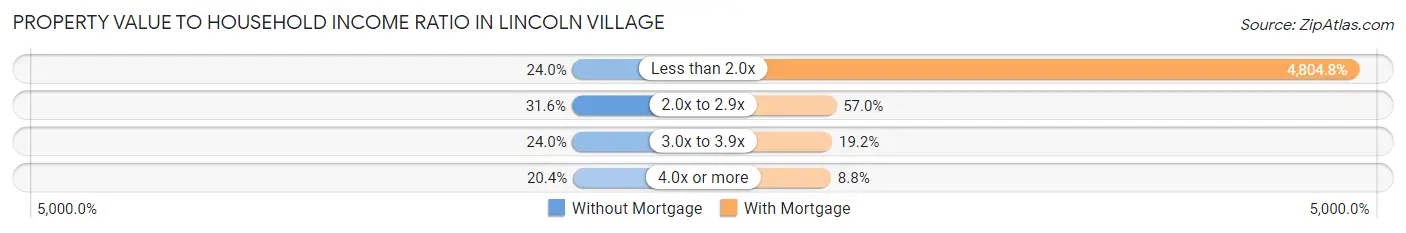
| Value-to-Income Ratio | Without Mortgage | With Mortgage |
| Less than 2.0x | 163 (24.0%) | 78,750 (4,804.8%) |
| 2.0x to 2.9x | 215 (31.6%) | 934 (57.0%) |
| 3.0x to 3.9x | 163 (24.0%) | 314 (19.2%) |
| 4.0x or more | 139 (20.4%) | 144 (8.8%) |
| Total | 680 (100.0%) | 1,639 (100.0%) |
Real Estate Taxes by Mortgage Status in Lincoln Village
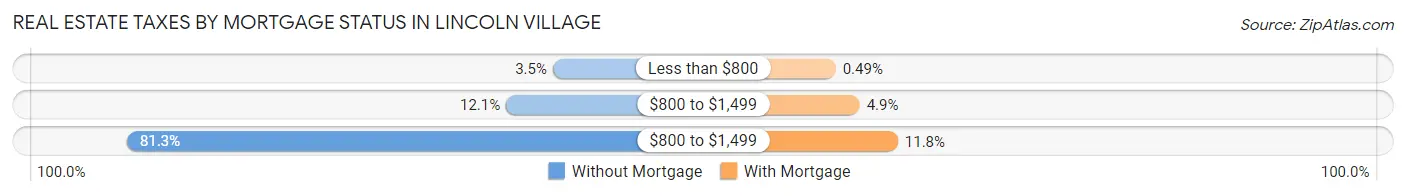
| Property Taxes | Without Mortgage | With Mortgage |
| Less than $800 | 24 (3.5%) | 8 (0.5%) |
| $800 to $1,499 | 82 (12.1%) | 80 (4.9%) |
| $800 to $1,499 | 553 (81.3%) | 194 (11.8%) |
| Total | 680 (100.0%) | 1,639 (100.0%) |
Health & Disability in Lincoln Village
Health Insurance Coverage by Age in Lincoln Village
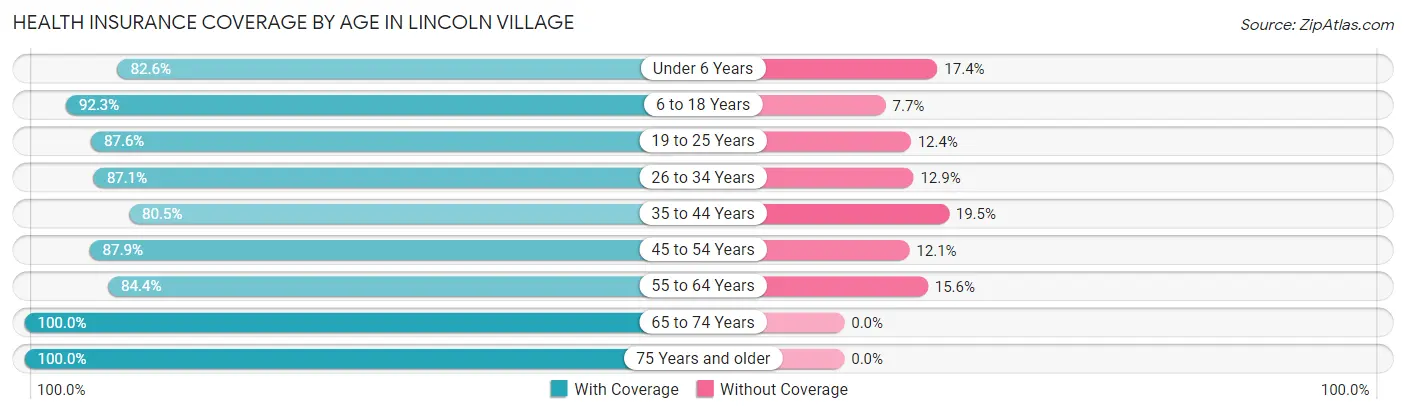
| Age Bracket | With Coverage | Without Coverage |
| Under 6 Years | 476 (82.6%) | 100 (17.4%) |
| 6 to 18 Years | 1,475 (92.3%) | 123 (7.7%) |
| 19 to 25 Years | 708 (87.6%) | 100 (12.4%) |
| 26 to 34 Years | 959 (87.1%) | 142 (12.9%) |
| 35 to 44 Years | 1,244 (80.5%) | 301 (19.5%) |
| 45 to 54 Years | 1,237 (87.9%) | 171 (12.1%) |
| 55 to 64 Years | 1,030 (84.4%) | 190 (15.6%) |
| 65 to 74 Years | 850 (100.0%) | 0 (0.0%) |
| 75 Years and older | 447 (100.0%) | 0 (0.0%) |
| Total | 8,426 (88.2%) | 1,127 (11.8%) |
Health Insurance Coverage by Citizenship Status in Lincoln Village
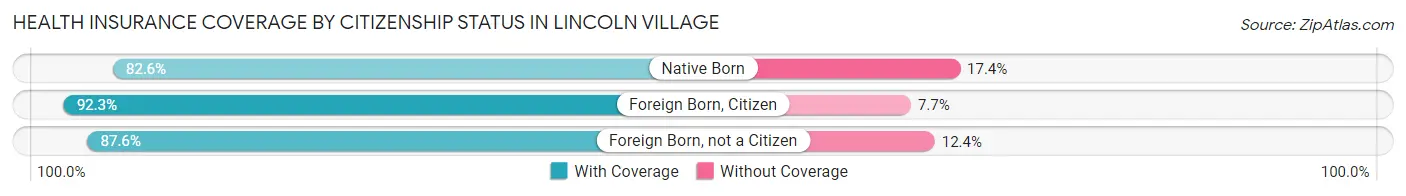
| Citizenship Status | With Coverage | Without Coverage |
| Native Born | 476 (82.6%) | 100 (17.4%) |
| Foreign Born, Citizen | 1,475 (92.3%) | 123 (7.7%) |
| Foreign Born, not a Citizen | 708 (87.6%) | 100 (12.4%) |
Health Insurance Coverage by Household Income in Lincoln Village
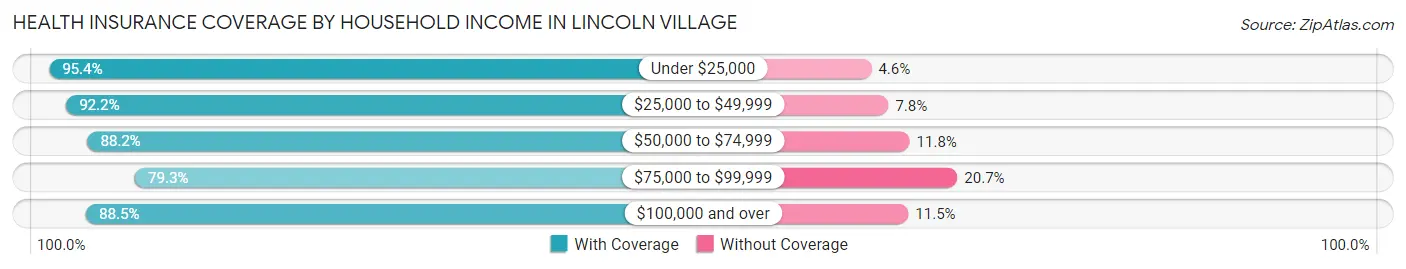
| Household Income | With Coverage | Without Coverage |
| Under $25,000 | 640 (95.4%) | 31 (4.6%) |
| $25,000 to $49,999 | 2,195 (92.2%) | 186 (7.8%) |
| $50,000 to $74,999 | 1,647 (88.2%) | 220 (11.8%) |
| $75,000 to $99,999 | 1,339 (79.3%) | 350 (20.7%) |
| $100,000 and over | 2,605 (88.5%) | 340 (11.5%) |
Public vs Private Health Insurance Coverage by Age in Lincoln Village
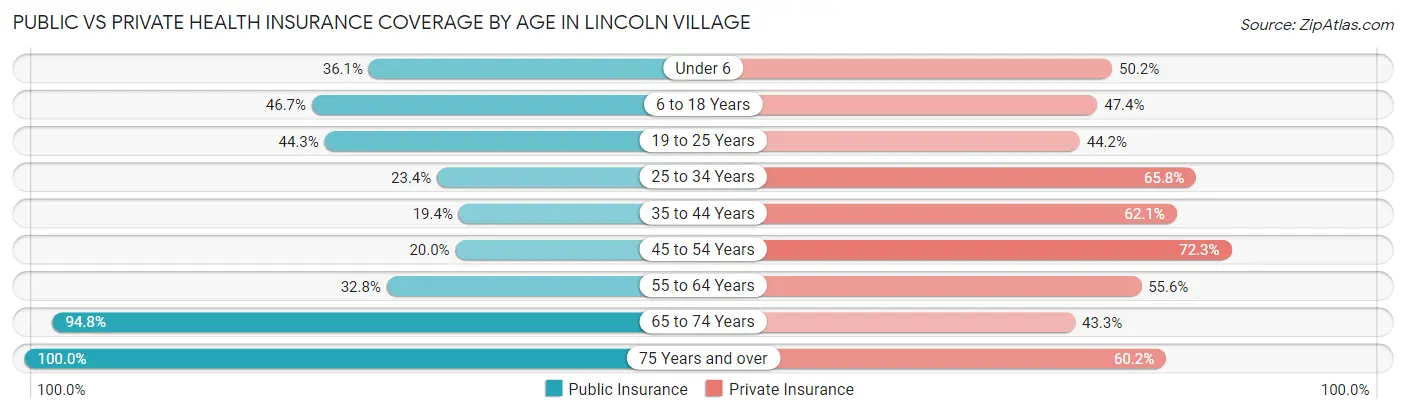
| Age Bracket | Public Insurance | Private Insurance |
| Under 6 | 208 (36.1%) | 289 (50.2%) |
| 6 to 18 Years | 746 (46.7%) | 758 (47.4%) |
| 19 to 25 Years | 358 (44.3%) | 357 (44.2%) |
| 25 to 34 Years | 258 (23.4%) | 724 (65.8%) |
| 35 to 44 Years | 300 (19.4%) | 960 (62.1%) |
| 45 to 54 Years | 282 (20.0%) | 1,018 (72.3%) |
| 55 to 64 Years | 400 (32.8%) | 678 (55.6%) |
| 65 to 74 Years | 806 (94.8%) | 368 (43.3%) |
| 75 Years and over | 447 (100.0%) | 269 (60.2%) |
| Total | 3,805 (39.8%) | 5,421 (56.8%) |
Disability Status by Sex by Age in Lincoln Village
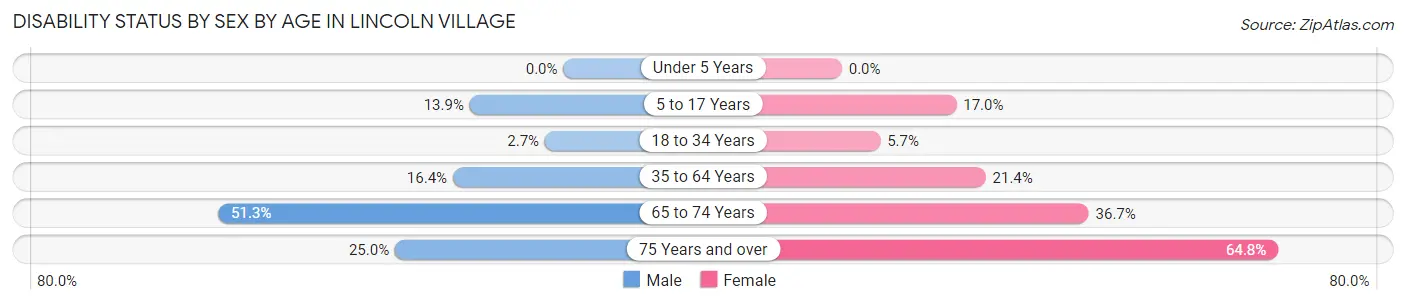
| Age Bracket | Male | Female |
| Under 5 Years | 0 (0.0%) | 0 (0.0%) |
| 5 to 17 Years | 117 (13.9%) | 137 (17.0%) |
| 18 to 34 Years | 32 (2.7%) | 51 (5.7%) |
| 35 to 64 Years | 322 (16.4%) | 472 (21.4%) |
| 65 to 74 Years | 163 (51.3%) | 195 (36.6%) |
| 75 Years and over | 50 (25.0%) | 160 (64.8%) |
Disability Class by Sex by Age in Lincoln Village
Disability Class: Hearing Difficulty
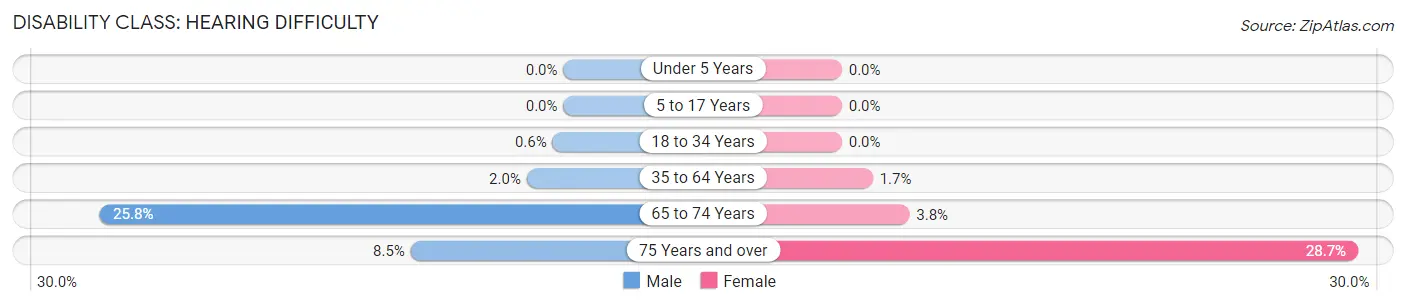
| Age Bracket | Male | Female |
| Under 5 Years | 0 (0.0%) | 0 (0.0%) |
| 5 to 17 Years | 0 (0.0%) | 0 (0.0%) |
| 18 to 34 Years | 7 (0.6%) | 0 (0.0%) |
| 35 to 64 Years | 40 (2.0%) | 38 (1.7%) |
| 65 to 74 Years | 82 (25.8%) | 20 (3.8%) |
| 75 Years and over | 17 (8.5%) | 71 (28.7%) |
Disability Class: Vision Difficulty
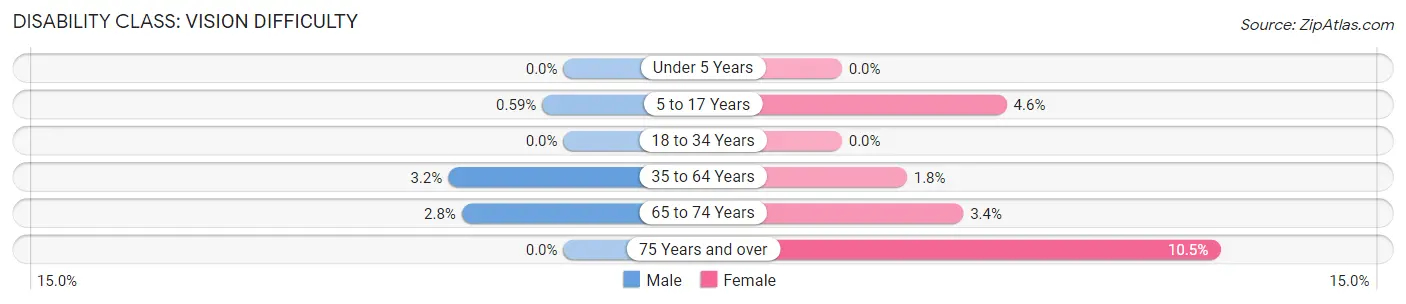
| Age Bracket | Male | Female |
| Under 5 Years | 0 (0.0%) | 0 (0.0%) |
| 5 to 17 Years | 5 (0.6%) | 37 (4.6%) |
| 18 to 34 Years | 0 (0.0%) | 0 (0.0%) |
| 35 to 64 Years | 63 (3.2%) | 40 (1.8%) |
| 65 to 74 Years | 9 (2.8%) | 18 (3.4%) |
| 75 Years and over | 0 (0.0%) | 26 (10.5%) |
Disability Class: Cognitive Difficulty
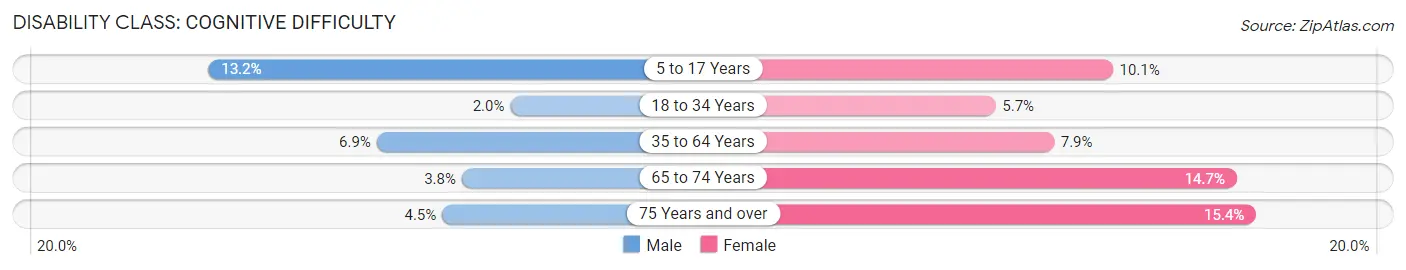
| Age Bracket | Male | Female |
| 5 to 17 Years | 111 (13.2%) | 81 (10.1%) |
| 18 to 34 Years | 23 (2.0%) | 51 (5.7%) |
| 35 to 64 Years | 136 (6.9%) | 174 (7.9%) |
| 65 to 74 Years | 12 (3.8%) | 78 (14.7%) |
| 75 Years and over | 9 (4.5%) | 38 (15.4%) |
Disability Class: Ambulatory Difficulty
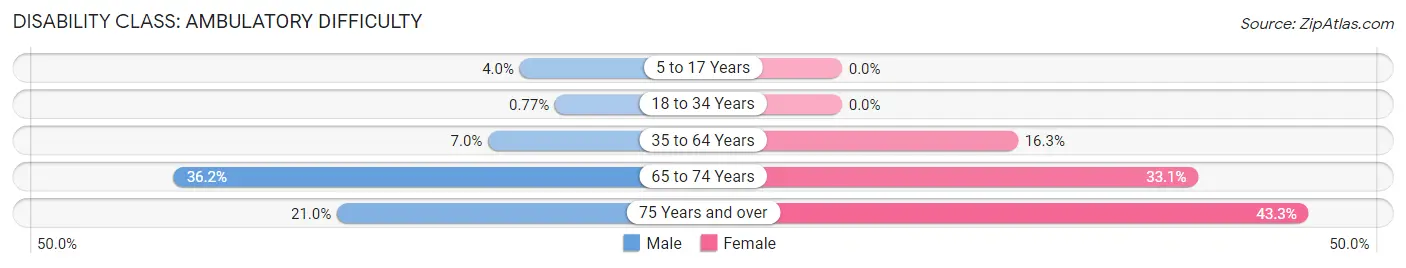
| Age Bracket | Male | Female |
| 5 to 17 Years | 34 (4.0%) | 0 (0.0%) |
| 18 to 34 Years | 9 (0.8%) | 0 (0.0%) |
| 35 to 64 Years | 137 (7.0%) | 361 (16.3%) |
| 65 to 74 Years | 115 (36.2%) | 176 (33.1%) |
| 75 Years and over | 42 (21.0%) | 107 (43.3%) |
Disability Class: Self-Care Difficulty
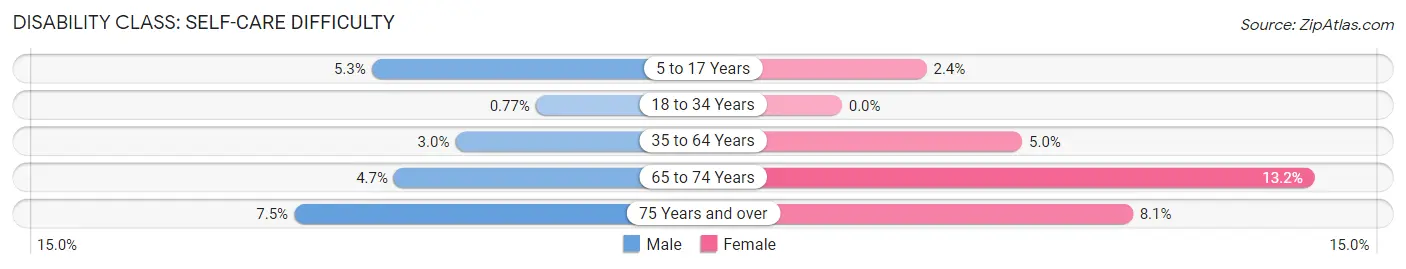
| Age Bracket | Male | Female |
| 5 to 17 Years | 45 (5.3%) | 19 (2.4%) |
| 18 to 34 Years | 9 (0.8%) | 0 (0.0%) |
| 35 to 64 Years | 59 (3.0%) | 111 (5.0%) |
| 65 to 74 Years | 15 (4.7%) | 70 (13.2%) |
| 75 Years and over | 15 (7.5%) | 20 (8.1%) |
Technology Access in Lincoln Village
Computing Device Access in Lincoln Village
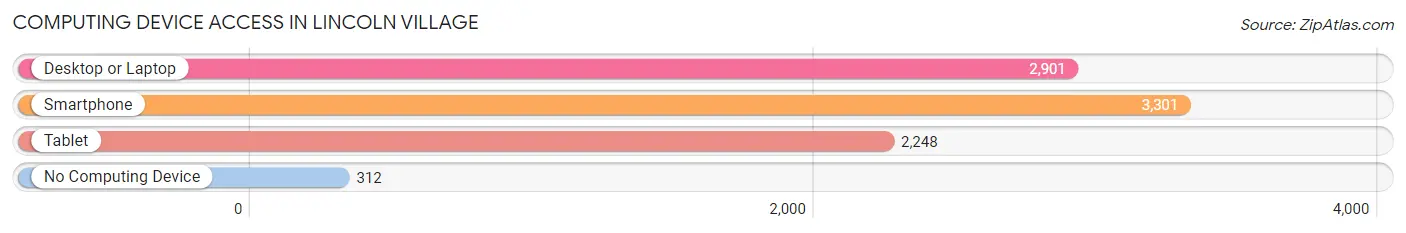
| Device Type | # Households | % Households |
| Desktop or Laptop | 2,901 | 74.2% |
| Smartphone | 3,301 | 84.4% |
| Tablet | 2,248 | 57.5% |
| No Computing Device | 312 | 8.0% |
| Total | 3,910 | 100.0% |
Internet Access in Lincoln Village
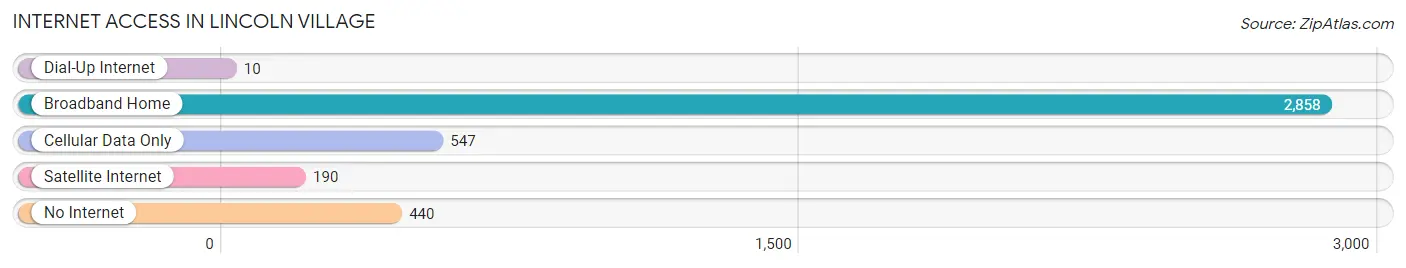
| Internet Type | # Households | % Households |
| Dial-Up Internet | 10 | 0.3% |
| Broadband Home | 2,858 | 73.1% |
| Cellular Data Only | 547 | 14.0% |
| Satellite Internet | 190 | 4.9% |
| No Internet | 440 | 11.3% |
| Total | 3,910 | 100.0% |
Lincoln Village Summary
Lincoln Village is a small village located in the state of Ohio, United States. It is situated in the southeastern part of the state, in the county of Franklin. The village is located on the banks of the Scioto River, and is part of the Columbus metropolitan area. The population of Lincoln Village was estimated to be 1,845 in the year 2020.
History
Lincoln Village was founded in 1817 by a group of settlers from Pennsylvania. The village was named after President Abraham Lincoln, who had recently been elected to office. The settlers were attracted to the area due to its fertile soil and abundant natural resources. The village quickly grew and became a thriving community.
In 1820, the village was incorporated as a village. The village was home to a variety of businesses, including a sawmill, a gristmill, a blacksmith shop, and a general store. The village also had a post office, a school, and a church.
In the late 19th century, the village experienced a period of growth and prosperity. The village was home to several factories, including a paper mill, a flour mill, and a brickyard. The village also had a railroad station, which connected it to the larger cities of Columbus and Cincinnati.
In the early 20th century, the village experienced a period of decline. The factories closed, and the population began to decline. The village was eventually annexed by the city of Columbus in the 1950s.
Geography
Lincoln Village is located in the southeastern part of the state of Ohio, in the county of Franklin. The village is situated on the banks of the Scioto River, and is part of the Columbus metropolitan area. The village is located approximately 20 miles south of downtown Columbus.
The village is located in a predominantly rural area, with rolling hills and farmland. The village is surrounded by several small towns and villages, including Grove City, Hilliard, and Groveport.
Economy
The economy of Lincoln Village is largely based on agriculture and manufacturing. The village is home to several small businesses, including a grocery store, a hardware store, and a restaurant. The village also has a post office, a bank, and a library.
The village is also home to several manufacturing companies, including a paper mill, a flour mill, and a brickyard. The village is also home to several small farms, which produce a variety of crops, including corn, soybeans, and wheat.
Demographics
As of the 2020 census, the population of Lincoln Village was estimated to be 1,845. The population is predominantly white, with a small percentage of African Americans and Hispanics. The median household income in the village is $45,000, and the median home value is $150,000.
The village is served by the Columbus City Schools district. The village is also home to several churches, including the First Presbyterian Church, the Church of the Nazarene, and the Church of Jesus Christ of Latter-day Saints.
Conclusion
Lincoln Village is a small village located in the southeastern part of the state of Ohio. The village was founded in 1817 by a group of settlers from Pennsylvania, and was named after President Abraham Lincoln. The village experienced a period of growth and prosperity in the late 19th century, but experienced a period of decline in the early 20th century. The village is now home to a variety of businesses, including a grocery store, a hardware store, and a restaurant. The population of Lincoln Village was estimated to be 1,845 in the year 2020.
Common Questions
What is the Total Population of Lincoln Village?
Total Population of Lincoln Village is 9,553.
What is the Total Male Population of Lincoln Village?
Total Male Population of Lincoln Village is 4,690.
What is the Total Female Population of Lincoln Village?
Total Female Population of Lincoln Village is 4,863.
What is the Ratio of Males per 100 Females in Lincoln Village?
There are 96.44 Males per 100 Females in Lincoln Village.
What is the Ratio of Females per 100 Males in Lincoln Village?
There are 103.69 Females per 100 Males in Lincoln Village.
What is the Median Population Age in Lincoln Village?
Median Population Age in Lincoln Village is 39.0 Years.
What is the Average Family Size in Lincoln Village
Average Family Size in Lincoln Village is 3.1 People.
What is the Average Household Size in Lincoln Village
Average Household Size in Lincoln Village is 2.4 People.
What is Per Capita Income in Lincoln Village?
Per Capita income in Lincoln Village is $30,720.
What is the Median Family Income in Lincoln Village?
Median Family Income in Lincoln Village is $70,789.
What is the Median Household income in Lincoln Village?
Median Household Income in Lincoln Village is $59,151.
What is Income or Wage Gap in Lincoln Village?
Income or Wage Gap in Lincoln Village is 13.7%.
Women in Lincoln Village earn 86.3 cents for every dollar earned by a man.
What is Inequality or Gini Index in Lincoln Village?
Inequality or Gini Index in Lincoln Village is 0.39.
How Large is the Labor Force in Lincoln Village?
There are 5,263 People in the Labor Forcein in Lincoln Village.
What is the Percentage of People in the Labor Force in Lincoln Village?
67.2% of People are in the Labor Force in Lincoln Village.
What is the Unemployment Rate in Lincoln Village?
Unemployment Rate in Lincoln Village is 2.5%.