Wrightsboro, NC
Wrightsboro Map
Wrightsboro Overview
4,876
TOTAL POPULATION
2,020
MALE POPULATION
2,856
FEMALE POPULATION
70.73
MALES / 100 FEMALES
141.39
FEMALES / 100 MALES
41.2
MEDIAN AGE
2.9
AVG FAMILY SIZE
2.2
AVG HOUSEHOLD SIZE
$30,188
PER CAPITA INCOME
$67,406
AVG FAMILY INCOME
$56,719
AVG HOUSEHOLD INCOME
49.7%
WAGE / INCOME GAP [ % ]
50.3¢/ $1
WAGE / INCOME GAP [ $ ]
0.34
INEQUALITY / GINI INDEX
2,790
LABOR FORCE [ PEOPLE ]
66.2%
PERCENT IN LABOR FORCE
1.9%
UNEMPLOYMENT RATE
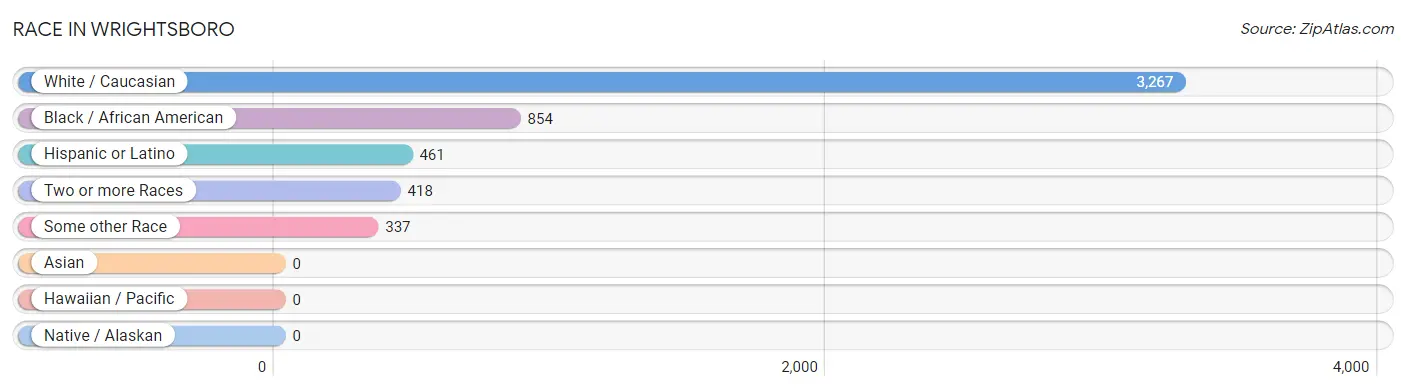
Race in Wrightsboro
The most populous races in Wrightsboro are White / Caucasian (3,267 | 67.0%), Black / African American (854 | 17.5%), and Hispanic or Latino (461 | 9.5%).
| Race | # Population | % Population |
| Asian | 0 | 0.0% |
| Black / African American | 854 | 17.5% |
| Hawaiian / Pacific | 0 | 0.0% |
| Hispanic or Latino | 461 | 9.5% |
| Native / Alaskan | 0 | 0.0% |
| White / Caucasian | 3,267 | 67.0% |
| Two or more Races | 418 | 8.6% |
| Some other Race | 337 | 6.9% |
| Total | 4,876 | 100.0% |
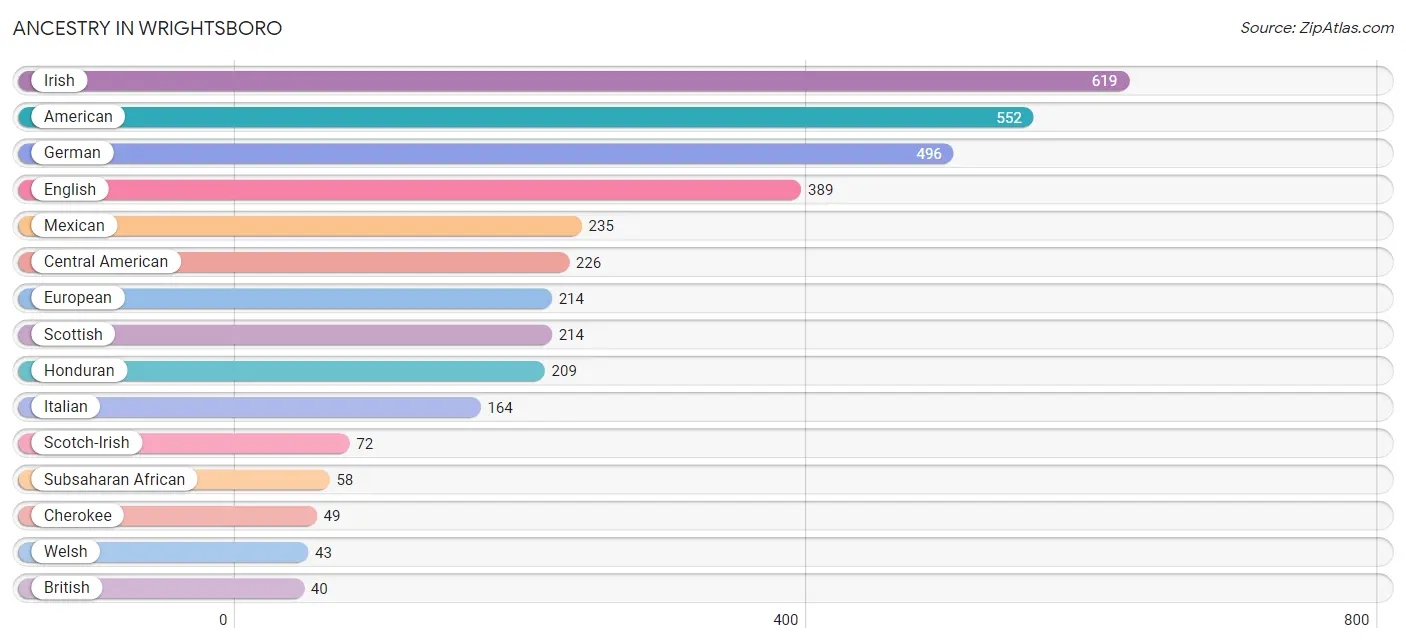
Ancestry in Wrightsboro
The most populous ancestries reported in Wrightsboro are Irish (619 | 12.7%), American (552 | 11.3%), German (496 | 10.2%), English (389 | 8.0%), and Mexican (235 | 4.8%), together accounting for 47.0% of all Wrightsboro residents.
| Ancestry | # Population | % Population |
| African | 38 | 0.8% |
| American | 552 | 11.3% |
| British | 40 | 0.8% |
| Central American | 226 | 4.6% |
| Cherokee | 49 | 1.0% |
| English | 389 | 8.0% |
| European | 214 | 4.4% |
| French | 39 | 0.8% |
| German | 496 | 10.2% |
| Honduran | 209 | 4.3% |
| Irish | 619 | 12.7% |
| Italian | 164 | 3.4% |
| Korean | 17 | 0.4% |
| Mexican | 235 | 4.8% |
| Nigerian | 20 | 0.4% |
| Norwegian | 21 | 0.4% |
| Panamanian | 17 | 0.4% |
| Polish | 30 | 0.6% |
| Russian | 20 | 0.4% |
| Scotch-Irish | 72 | 1.5% |
| Scottish | 214 | 4.4% |
| Subsaharan African | 58 | 1.2% |
| Welsh | 43 | 0.9% | View All 23 Rows |
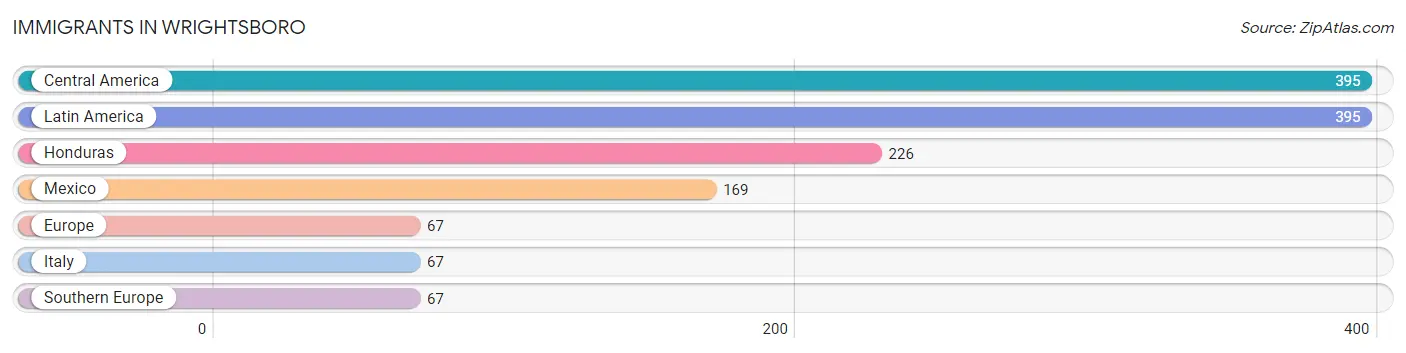
Immigrants in Wrightsboro
The most numerous immigrant groups reported in Wrightsboro came from Central America (395 | 8.1%), Latin America (395 | 8.1%), Honduras (226 | 4.6%), Mexico (169 | 3.5%), and Europe (67 | 1.4%), together accounting for 25.7% of all Wrightsboro residents.
| Immigration Origin | # Population | % Population |
| Central America | 395 | 8.1% |
| Europe | 67 | 1.4% |
| Honduras | 226 | 4.6% |
| Italy | 67 | 1.4% |
| Latin America | 395 | 8.1% |
| Mexico | 169 | 3.5% |
| Southern Europe | 67 | 1.4% | View All 7 Rows |
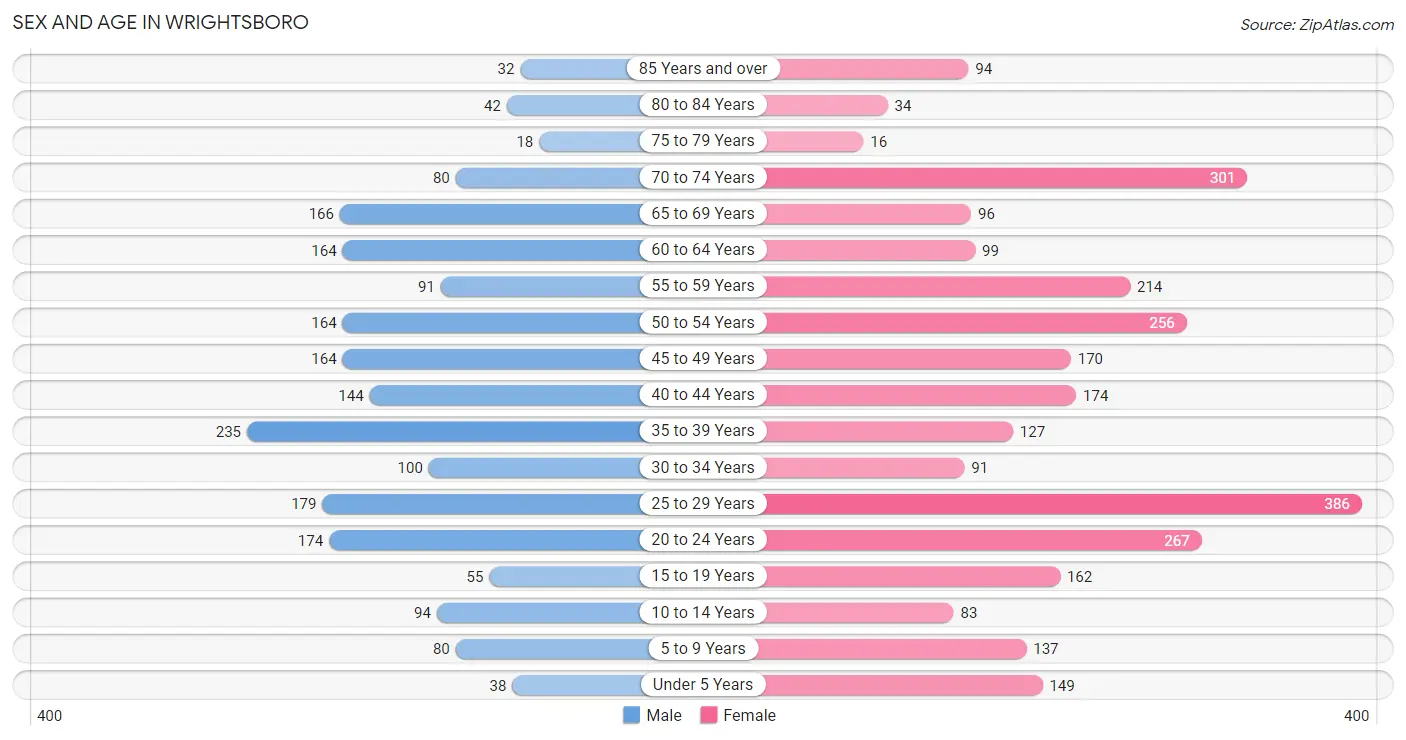
Sex and Age in Wrightsboro
Sex and Age in Wrightsboro
The most populous age groups in Wrightsboro are 35 to 39 Years (235 | 11.6%) for men and 25 to 29 Years (386 | 13.5%) for women.
| Age Bracket | Male | Female |
| Under 5 Years | 38 (1.9%) | 149 (5.2%) |
| 5 to 9 Years | 80 (4.0%) | 137 (4.8%) |
| 10 to 14 Years | 94 (4.6%) | 83 (2.9%) |
| 15 to 19 Years | 55 (2.7%) | 162 (5.7%) |
| 20 to 24 Years | 174 (8.6%) | 267 (9.3%) |
| 25 to 29 Years | 179 (8.9%) | 386 (13.5%) |
| 30 to 34 Years | 100 (5.0%) | 91 (3.2%) |
| 35 to 39 Years | 235 (11.6%) | 127 (4.4%) |
| 40 to 44 Years | 144 (7.1%) | 174 (6.1%) |
| 45 to 49 Years | 164 (8.1%) | 170 (5.9%) |
| 50 to 54 Years | 164 (8.1%) | 256 (9.0%) |
| 55 to 59 Years | 91 (4.5%) | 214 (7.5%) |
| 60 to 64 Years | 164 (8.1%) | 99 (3.5%) |
| 65 to 69 Years | 166 (8.2%) | 96 (3.4%) |
| 70 to 74 Years | 80 (4.0%) | 301 (10.5%) |
| 75 to 79 Years | 18 (0.9%) | 16 (0.6%) |
| 80 to 84 Years | 42 (2.1%) | 34 (1.2%) |
| 85 Years and over | 32 (1.6%) | 94 (3.3%) |
| Total | 2,020 (100.0%) | 2,856 (100.0%) |
Families and Households in Wrightsboro
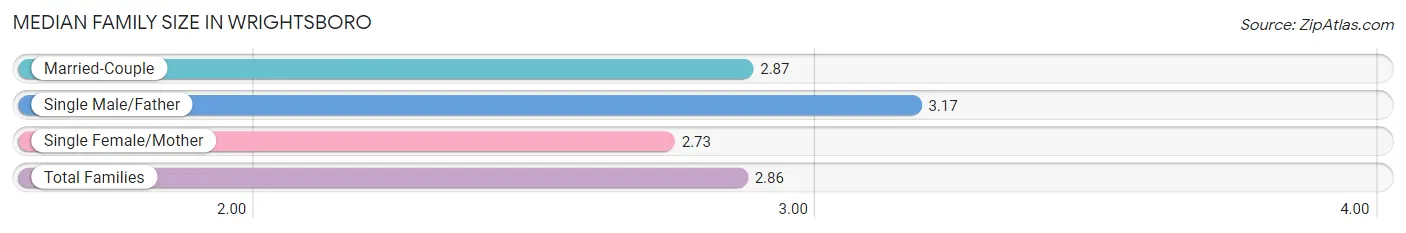
Median Family Size in Wrightsboro
The median family size in Wrightsboro is 2.86 persons per family, with single male/father families (60 | 4.6%) accounting for the largest median family size of 3.17 persons per family. On the other hand, single female/mother families (238 | 18.4%) represent the smallest median family size with 2.73 persons per family.
| Family Type | # Families | Family Size |
| Married-Couple | 997 (77.0%) | 2.87 |
| Single Male/Father | 60 (4.6%) | 3.17 |
| Single Female/Mother | 238 (18.4%) | 2.73 |
| Total Families | 1,295 (100.0%) | 2.86 |
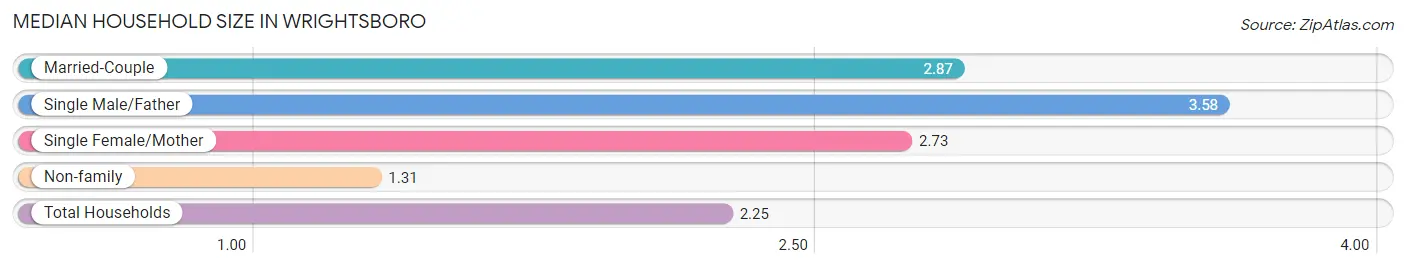
Median Household Size in Wrightsboro
The median household size in Wrightsboro is 2.25 persons per household, with single male/father households (60 | 2.8%) accounting for the largest median household size of 3.58 persons per household. non-family households (870 | 40.2%) represent the smallest median household size with 1.31 persons per household.
| Household Type | # Households | Household Size |
| Married-Couple | 997 (46.1%) | 2.87 |
| Single Male/Father | 60 (2.8%) | 3.58 |
| Single Female/Mother | 238 (11.0%) | 2.73 |
| Non-family | 870 (40.2%) | 1.31 |
| Total Households | 2,165 (100.0%) | 2.25 |
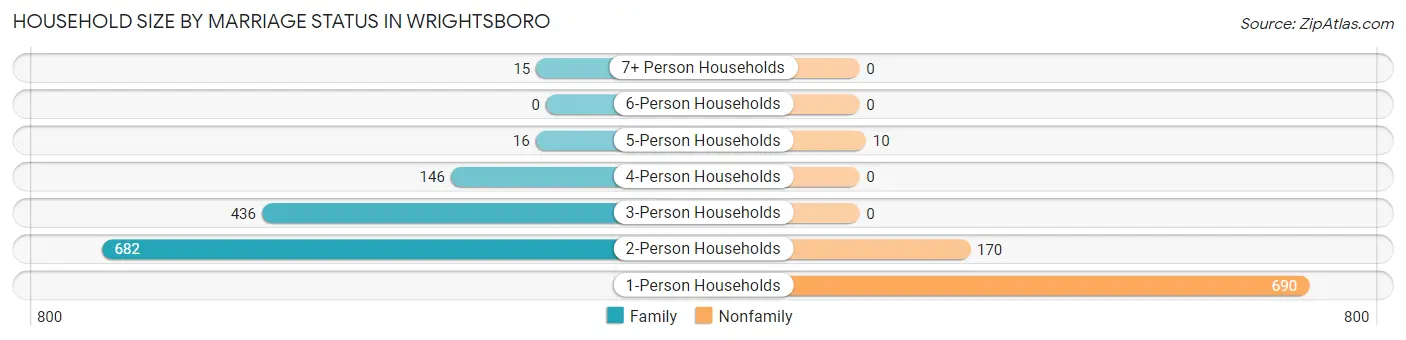
Household Size by Marriage Status in Wrightsboro
Out of a total of 2,165 households in Wrightsboro, 1,295 (59.8%) are family households, while 870 (40.2%) are nonfamily households. The most numerous type of family households are 2-person households, comprising 682, and the most common type of nonfamily households are 1-person households, comprising 690.
| Household Size | Family Households | Nonfamily Households |
| 1-Person Households | - | 690 (31.9%) |
| 2-Person Households | 682 (31.5%) | 170 (7.9%) |
| 3-Person Households | 436 (20.1%) | 0 (0.0%) |
| 4-Person Households | 146 (6.7%) | 0 (0.0%) |
| 5-Person Households | 16 (0.7%) | 10 (0.5%) |
| 6-Person Households | 0 (0.0%) | 0 (0.0%) |
| 7+ Person Households | 15 (0.7%) | 0 (0.0%) |
| Total | 1,295 (59.8%) | 870 (40.2%) |
Female Fertility in Wrightsboro
Fertility by Age in Wrightsboro
Average fertility rate in Wrightsboro is 29.0 births per 1,000 women. Women in the age bracket of 20 to 34 years have the highest fertility rate with 58.0 births per 1,000 women. Women in the age bracket of 20 to 34 years acount for 100.0% of all women with births.
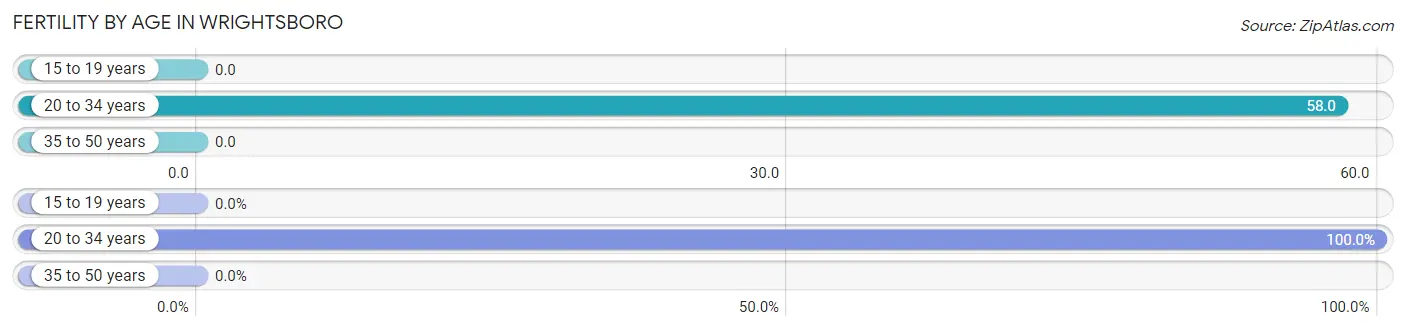
| Age Bracket | Women with Births | Births / 1,000 Women |
| 15 to 19 years | 0 (0.0%) | 0.0 |
| 20 to 34 years | 43 (100.0%) | 58.0 |
| 35 to 50 years | 0 (0.0%) | 0.0 |
| Total | 43 (100.0%) | 29.0 |
Fertility by Age by Marriage Status in Wrightsboro
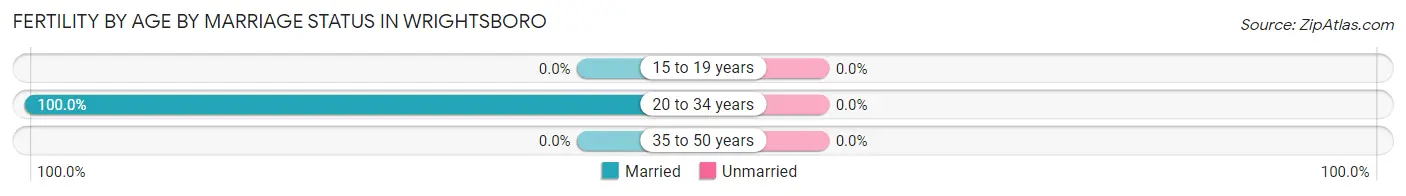
| Age Bracket | Married | Unmarried |
| 15 to 19 years | 0 (0.0%) | 0 (0.0%) |
| 20 to 34 years | 43 (100.0%) | 0 (0.0%) |
| 35 to 50 years | 0 (0.0%) | 0 (0.0%) |
| Total | 43 (100.0%) | 0 (0.0%) |
Fertility by Education in Wrightsboro
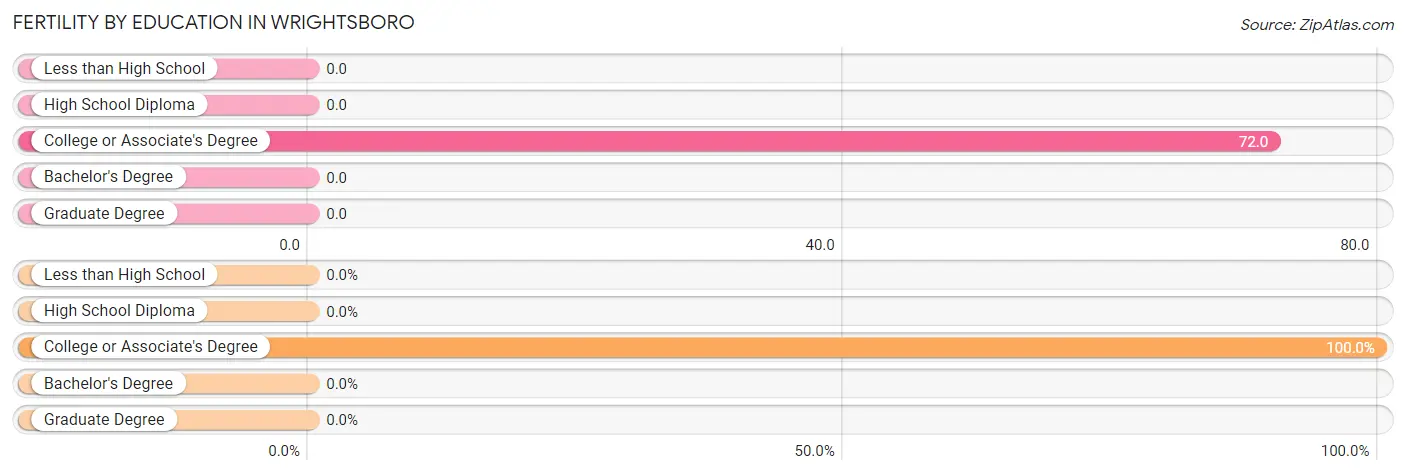
| Educational Attainment | Women with Births | Births / 1,000 Women |
| Less than High School | 0 (0.0%) | 0.0 |
| High School Diploma | 0 (0.0%) | 0.0 |
| College or Associate's Degree | 43 (100.0%) | 72.0 |
| Bachelor's Degree | 0 (0.0%) | 0.0 |
| Graduate Degree | 0 (0.0%) | 0.0 |
| Total | 43 (100.0%) | 29.0 |
Fertility by Education by Marriage Status in Wrightsboro
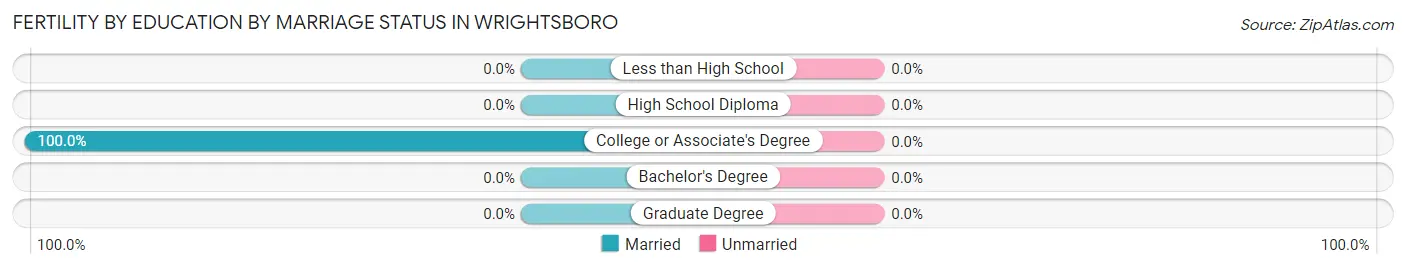
| Educational Attainment | Married | Unmarried |
| Less than High School | 0 (0.0%) | 0 (0.0%) |
| High School Diploma | 0 (0.0%) | 0 (0.0%) |
| College or Associate's Degree | 43 (100.0%) | 0 (0.0%) |
| Bachelor's Degree | 0 (0.0%) | 0 (0.0%) |
| Graduate Degree | 0 (0.0%) | 0 (0.0%) |
| Total | 43 (100.0%) | 0 (0.0%) |
Income in Wrightsboro
Income Overview in Wrightsboro
Per Capita Income in Wrightsboro is $30,188, while median incomes of families and households are $67,406 and $56,719 respectively.
| Characteristic | Number | Measure |
| Per Capita Income | 4,876 | $30,188 |
| Median Family Income | 1,295 | $67,406 |
| Mean Family Income | 1,295 | $74,896 |
| Median Household Income | 2,165 | $56,719 |
| Mean Household Income | 2,165 | $66,937 |
| Income Deficit | 1,295 | $0 |
| Wage / Income Gap (%) | 4,876 | 49.66% |
| Wage / Income Gap ($) | 4,876 | 50.34¢ per $1 |
| Gini / Inequality Index | 4,876 | 0.34 |
Earnings by Sex in Wrightsboro
Average Earnings in Wrightsboro are $38,571, $49,609 for men and $24,972 for women, a difference of 49.7%.
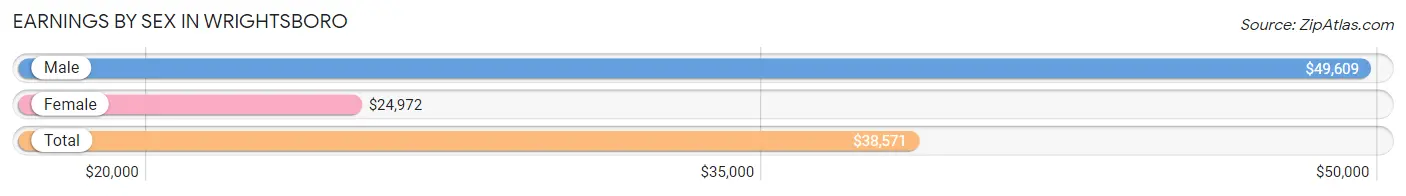
| Sex | Number | Average Earnings |
| Male | 1,285 (43.4%) | $49,609 |
| Female | 1,673 (56.6%) | $24,972 |
| Total | 2,958 (100.0%) | $38,571 |
Earnings by Sex by Income Bracket in Wrightsboro
The most common earnings brackets in Wrightsboro are $55,000 to $64,999 for men (200 | 15.6%) and $10,000 to $12,499 for women (314 | 18.8%).
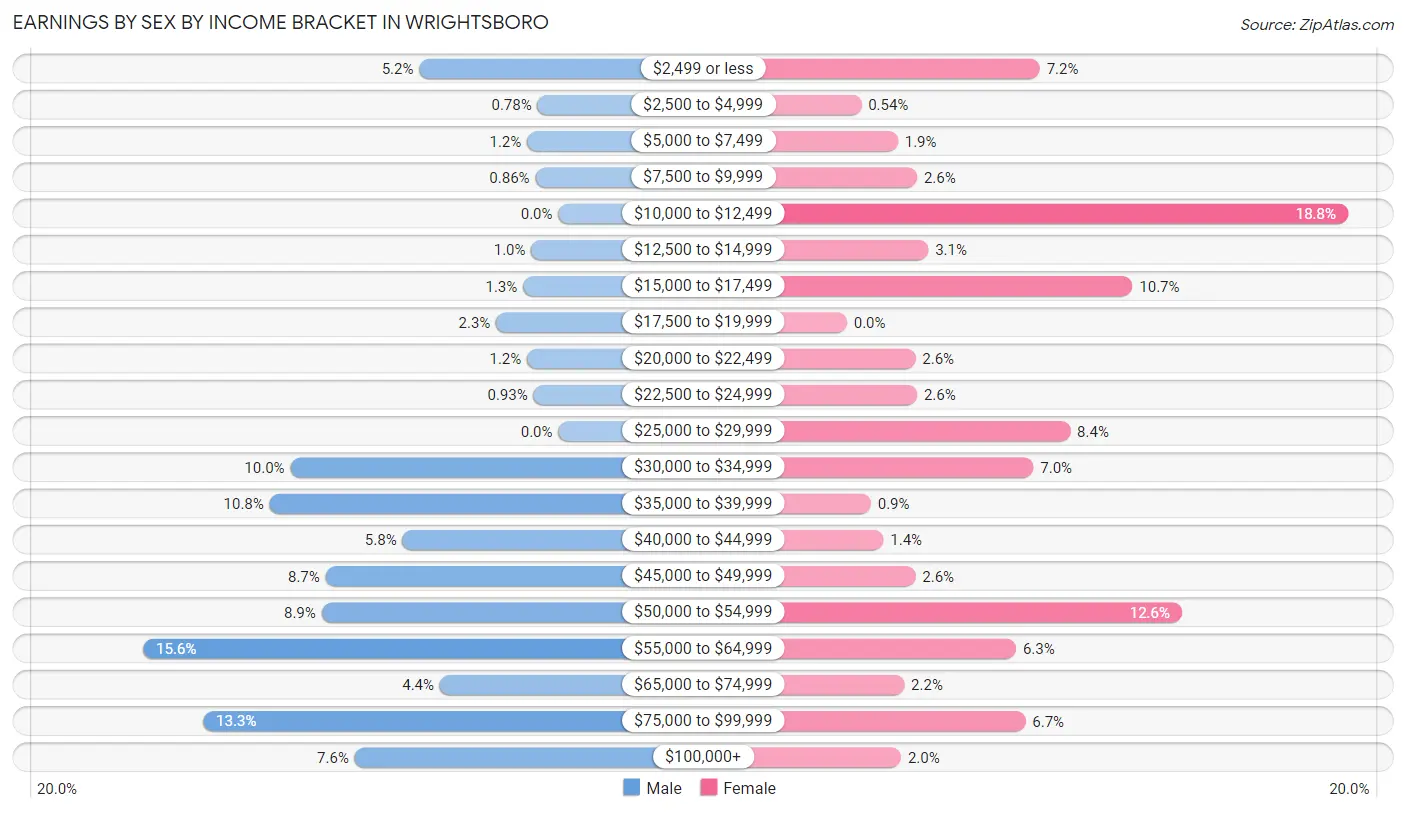
| Income | Male | Female |
| $2,499 or less | 67 (5.2%) | 121 (7.2%) |
| $2,500 to $4,999 | 10 (0.8%) | 9 (0.5%) |
| $5,000 to $7,499 | 15 (1.2%) | 32 (1.9%) |
| $7,500 to $9,999 | 11 (0.9%) | 44 (2.6%) |
| $10,000 to $12,499 | 0 (0.0%) | 314 (18.8%) |
| $12,500 to $14,999 | 13 (1.0%) | 51 (3.0%) |
| $15,000 to $17,499 | 17 (1.3%) | 179 (10.7%) |
| $17,500 to $19,999 | 30 (2.3%) | 0 (0.0%) |
| $20,000 to $22,499 | 15 (1.2%) | 43 (2.6%) |
| $22,500 to $24,999 | 12 (0.9%) | 44 (2.6%) |
| $25,000 to $29,999 | 0 (0.0%) | 140 (8.4%) |
| $30,000 to $34,999 | 129 (10.0%) | 117 (7.0%) |
| $35,000 to $39,999 | 139 (10.8%) | 15 (0.9%) |
| $40,000 to $44,999 | 75 (5.8%) | 23 (1.4%) |
| $45,000 to $49,999 | 112 (8.7%) | 43 (2.6%) |
| $50,000 to $54,999 | 114 (8.9%) | 210 (12.6%) |
| $55,000 to $64,999 | 200 (15.6%) | 106 (6.3%) |
| $65,000 to $74,999 | 57 (4.4%) | 36 (2.1%) |
| $75,000 to $99,999 | 171 (13.3%) | 112 (6.7%) |
| $100,000+ | 98 (7.6%) | 34 (2.0%) |
| Total | 1,285 (100.0%) | 1,673 (100.0%) |
Earnings by Sex by Educational Attainment in Wrightsboro
Average earnings in Wrightsboro are $53,956 for men and $26,657 for women, a difference of 50.6%. Men with an educational attainment of college or associate's degree enjoy the highest average annual earnings of $59,375, while those with high school diploma education earn the least with $32,402. Women with an educational attainment of bachelor's degree earn the most with the average annual earnings of $56,875, while those with high school diploma education have the smallest earnings of $11,342.
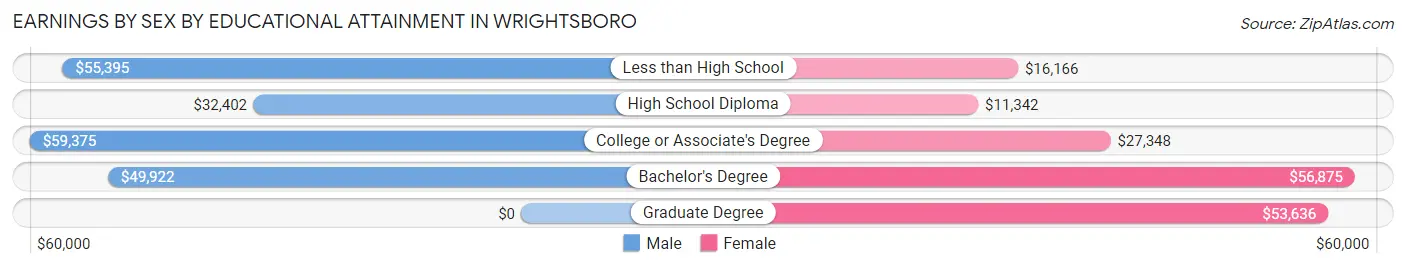
| Educational Attainment | Male Income | Female Income |
| Less than High School | $55,395 | $16,166 |
| High School Diploma | $32,402 | $11,342 |
| College or Associate's Degree | $59,375 | $27,348 |
| Bachelor's Degree | $49,922 | $56,875 |
| Graduate Degree | - | - |
| Total | $53,956 | $26,657 |
Family Income in Wrightsboro
Family Income Brackets in Wrightsboro
According to the Wrightsboro family income data, there are 297 families falling into the $50,000 to $74,999 income range, which is the most common income bracket and makes up 22.9% of all families.
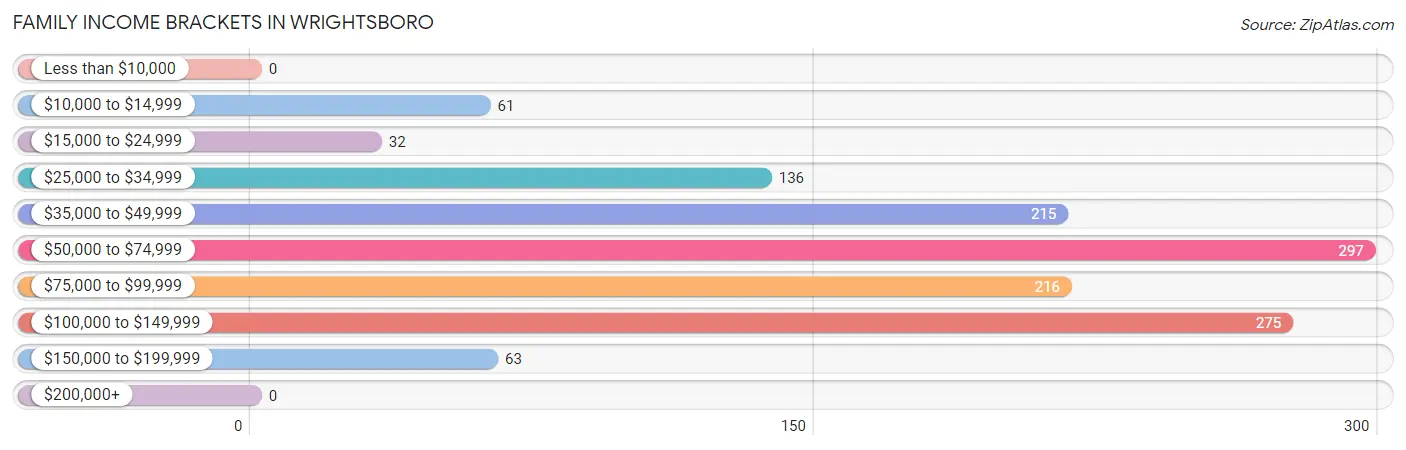
| Income Bracket | # Families | % Families |
| Less than $10,000 | 0 | 0.0% |
| $10,000 to $14,999 | 61 | 4.7% |
| $15,000 to $24,999 | 32 | 2.5% |
| $25,000 to $34,999 | 136 | 10.5% |
| $35,000 to $49,999 | 215 | 16.6% |
| $50,000 to $74,999 | 297 | 22.9% |
| $75,000 to $99,999 | 216 | 16.7% |
| $100,000 to $149,999 | 275 | 21.2% |
| $150,000 to $199,999 | 63 | 4.9% |
| $200,000+ | 0 | 0.0% |
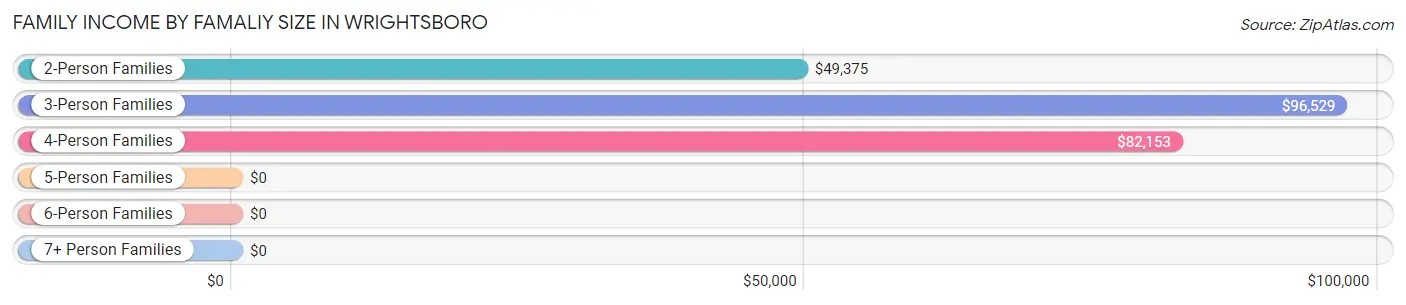
Family Income by Famaliy Size in Wrightsboro
3-person families (440 | 34.0%) account for the highest median family income in Wrightsboro with $96,529 per family, while 3-person families (440 | 34.0%) have the highest median income of $32,176 per family member.
| Income Bracket | # Families | Median Income |
| 2-Person Families | 695 (53.7%) | $49,375 |
| 3-Person Families | 440 (34.0%) | $96,529 |
| 4-Person Families | 129 (10.0%) | $82,153 |
| 5-Person Families | 16 (1.2%) | $0 |
| 6-Person Families | 0 (0.0%) | $0 |
| 7+ Person Families | 15 (1.2%) | $0 |
| Total | 1,295 (100.0%) | $67,406 |
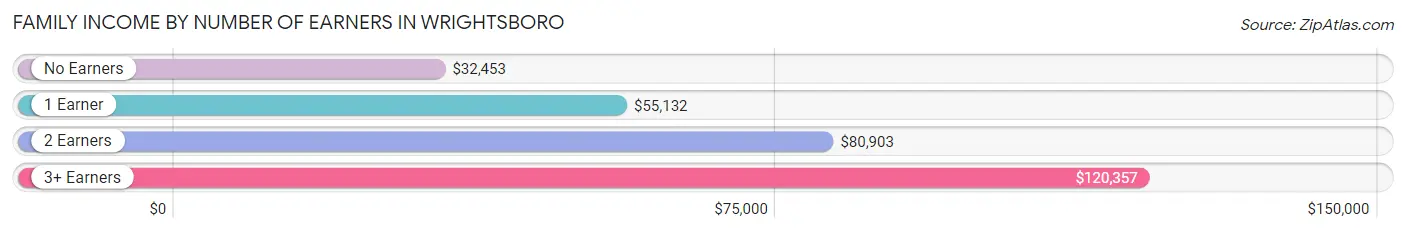
Family Income by Number of Earners in Wrightsboro
The median family income in Wrightsboro is $67,406, with families comprising 3+ earners (150) having the highest median family income of $120,357, while families with no earners (193) have the lowest median family income of $32,453, accounting for 11.6% and 14.9% of families, respectively.
| Number of Earners | # Families | Median Income |
| No Earners | 193 (14.9%) | $32,453 |
| 1 Earner | 360 (27.8%) | $55,132 |
| 2 Earners | 592 (45.7%) | $80,903 |
| 3+ Earners | 150 (11.6%) | $120,357 |
| Total | 1,295 (100.0%) | $67,406 |
Household Income in Wrightsboro
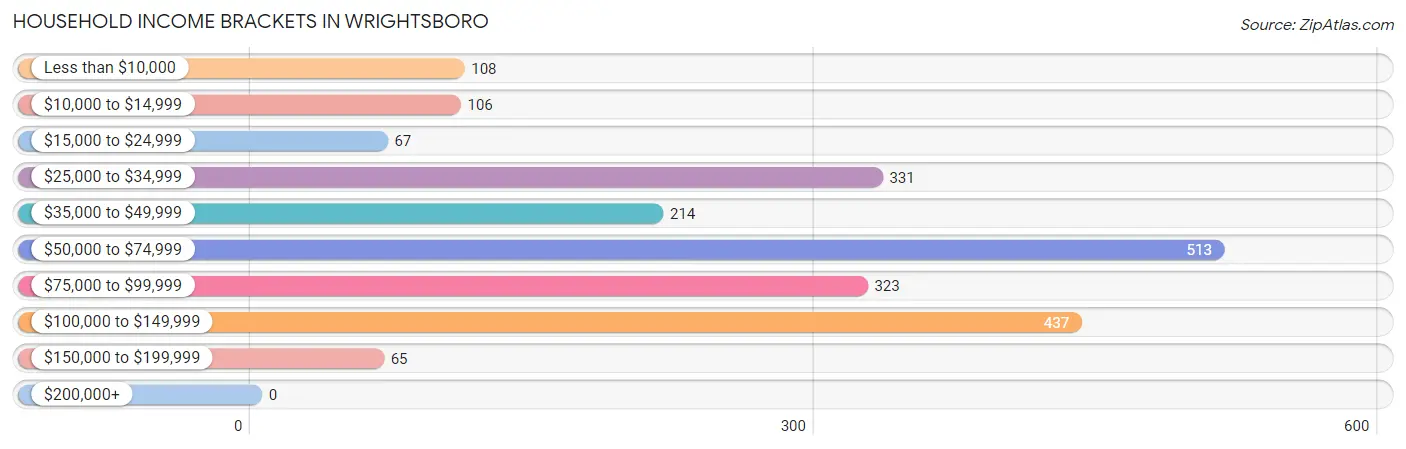
Household Income Brackets in Wrightsboro
With 513 households falling in the category, the $50,000 to $74,999 income range is the most frequent in Wrightsboro, accounting for 23.7% of all households.
| Income Bracket | # Households | % Households |
| Less than $10,000 | 108 | 5.0% |
| $10,000 to $14,999 | 106 | 4.9% |
| $15,000 to $24,999 | 67 | 3.1% |
| $25,000 to $34,999 | 331 | 15.3% |
| $35,000 to $49,999 | 214 | 9.9% |
| $50,000 to $74,999 | 513 | 23.7% |
| $75,000 to $99,999 | 323 | 14.9% |
| $100,000 to $149,999 | 437 | 20.2% |
| $150,000 to $199,999 | 65 | 3.0% |
| $200,000+ | 0 | 0.0% |
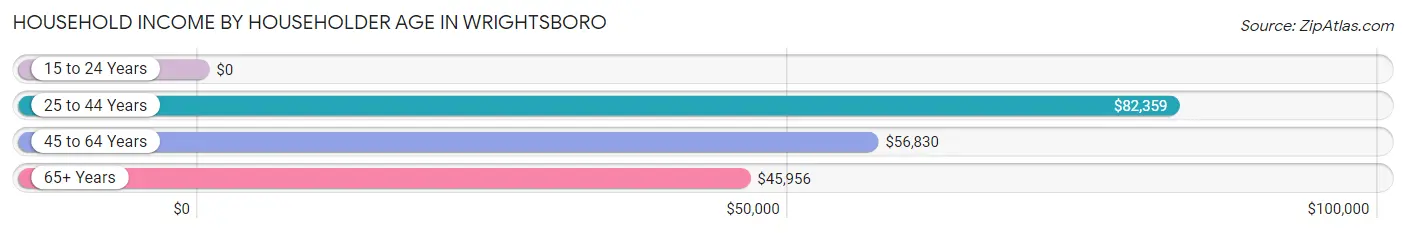
Household Income by Householder Age in Wrightsboro
The median household income in Wrightsboro is $56,719, with the highest median household income of $82,359 found in the 25 to 44 years age bracket for the primary householder. A total of 559 households (25.8%) fall into this category. Meanwhile, the 15 to 24 years age bracket for the primary householder has the lowest median household income of $0, with 157 households (7.2%) in this group.
| Income Bracket | # Households | Median Income |
| 15 to 24 Years | 157 (7.2%) | $0 |
| 25 to 44 Years | 559 (25.8%) | $82,359 |
| 45 to 64 Years | 788 (36.4%) | $56,830 |
| 65+ Years | 661 (30.5%) | $45,956 |
| Total | 2,165 (100.0%) | $56,719 |
Poverty in Wrightsboro
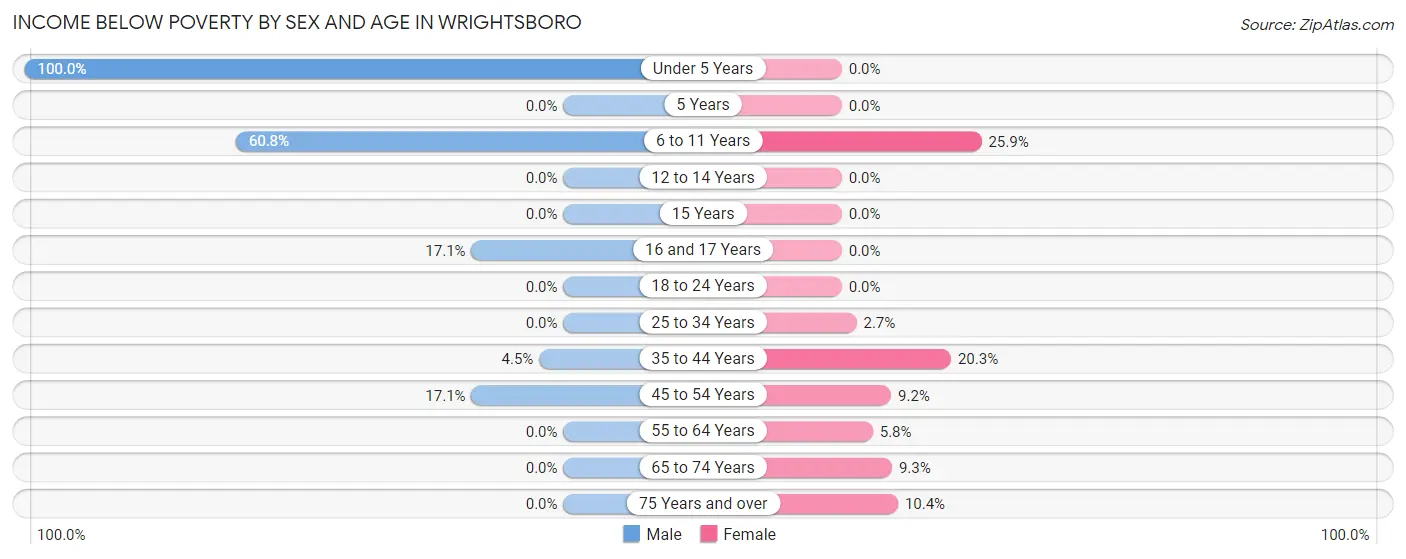
Income Below Poverty by Sex and Age in Wrightsboro
With 9.0% poverty level for males and 7.4% for females among the residents of Wrightsboro, under 5 year old males and 6 to 11 year old females are the most vulnerable to poverty, with 38 males (100.0%) and 28 females (25.9%) in their respective age groups living below the poverty level.
| Age Bracket | Male | Female |
| Under 5 Years | 38 (100.0%) | 0 (0.0%) |
| 5 Years | 0 (0.0%) | 0 (0.0%) |
| 6 to 11 Years | 62 (60.8%) | 28 (25.9%) |
| 12 to 14 Years | 0 (0.0%) | 0 (0.0%) |
| 15 Years | 0 (0.0%) | 0 (0.0%) |
| 16 and 17 Years | 7 (17.1%) | 0 (0.0%) |
| 18 to 24 Years | 0 (0.0%) | 0 (0.0%) |
| 25 to 34 Years | 0 (0.0%) | 13 (2.7%) |
| 35 to 44 Years | 17 (4.5%) | 61 (20.3%) |
| 45 to 54 Years | 56 (17.1%) | 39 (9.1%) |
| 55 to 64 Years | 0 (0.0%) | 18 (5.8%) |
| 65 to 74 Years | 0 (0.0%) | 37 (9.3%) |
| 75 Years and over | 0 (0.0%) | 15 (10.4%) |
| Total | 180 (9.0%) | 211 (7.4%) |
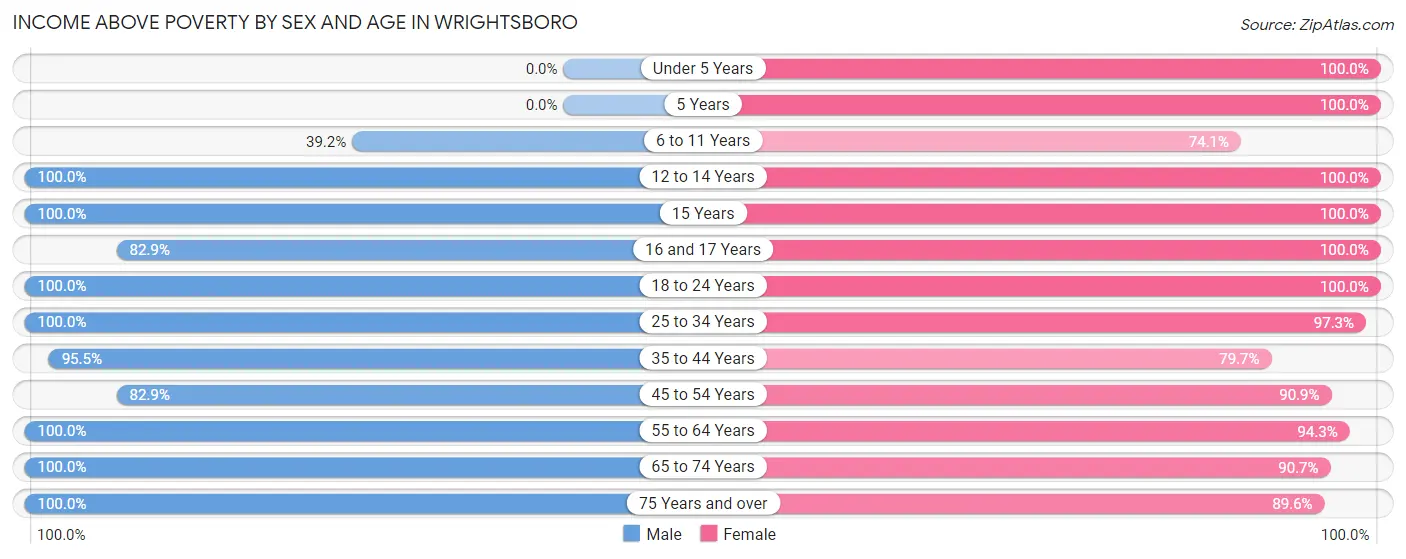
Income Above Poverty by Sex and Age in Wrightsboro
According to the poverty statistics in Wrightsboro, males aged 12 to 14 years and females aged under 5 years are the age groups that are most secure financially, with 100.0% of males and 100.0% of females in these age groups living above the poverty line.
| Age Bracket | Male | Female |
| Under 5 Years | 0 (0.0%) | 149 (100.0%) |
| 5 Years | 0 (0.0%) | 20 (100.0%) |
| 6 to 11 Years | 40 (39.2%) | 80 (74.1%) |
| 12 to 14 Years | 62 (100.0%) | 83 (100.0%) |
| 15 Years | 13 (100.0%) | 66 (100.0%) |
| 16 and 17 Years | 34 (82.9%) | 64 (100.0%) |
| 18 to 24 Years | 174 (100.0%) | 299 (100.0%) |
| 25 to 34 Years | 279 (100.0%) | 464 (97.3%) |
| 35 to 44 Years | 362 (95.5%) | 240 (79.7%) |
| 45 to 54 Years | 272 (82.9%) | 387 (90.8%) |
| 55 to 64 Years | 255 (100.0%) | 295 (94.3%) |
| 65 to 74 Years | 246 (100.0%) | 360 (90.7%) |
| 75 Years and over | 92 (100.0%) | 129 (89.6%) |
| Total | 1,829 (91.0%) | 2,636 (92.6%) |
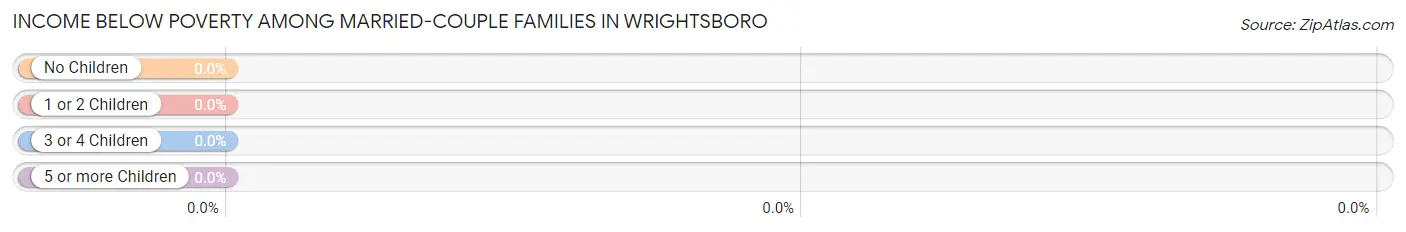
Income Below Poverty Among Married-Couple Families in Wrightsboro
| Children | Above Poverty | Below Poverty |
| No Children | 739 (100.0%) | 0 (0.0%) |
| 1 or 2 Children | 227 (100.0%) | 0 (0.0%) |
| 3 or 4 Children | 31 (100.0%) | 0 (0.0%) |
| 5 or more Children | 0 (0.0%) | 0 (0.0%) |
| Total | 997 (100.0%) | 0 (0.0%) |
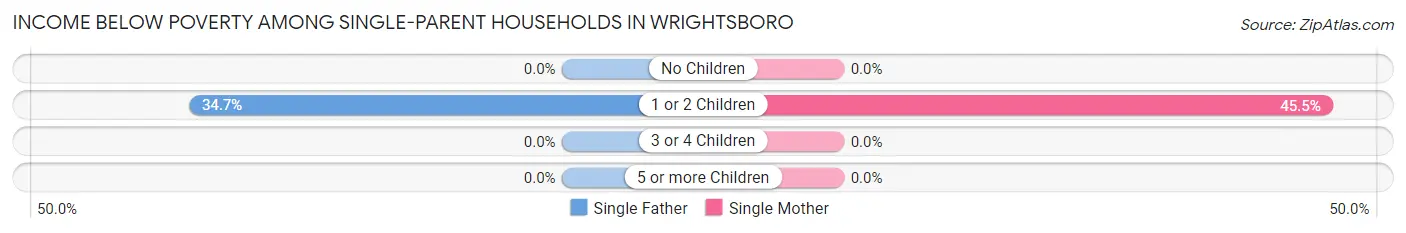
Income Below Poverty Among Single-Parent Households in Wrightsboro
According to the poverty data in Wrightsboro, 28.3% or 17 single-father households and 25.6% or 61 single-mother households are living below the poverty line. Among single-father households, those with 1 or 2 children have the highest poverty rate, with 17 households (34.7%) experiencing poverty. Likewise, among single-mother households, those with 1 or 2 children have the highest poverty rate, with 61 households (45.5%) falling below the poverty line.
| Children | Single Father | Single Mother |
| No Children | 0 (0.0%) | 0 (0.0%) |
| 1 or 2 Children | 17 (34.7%) | 61 (45.5%) |
| 3 or 4 Children | 0 (0.0%) | 0 (0.0%) |
| 5 or more Children | 0 (0.0%) | 0 (0.0%) |
| Total | 17 (28.3%) | 61 (25.6%) |
Income Below Poverty Among Married-Couple vs Single-Parent Households in Wrightsboro
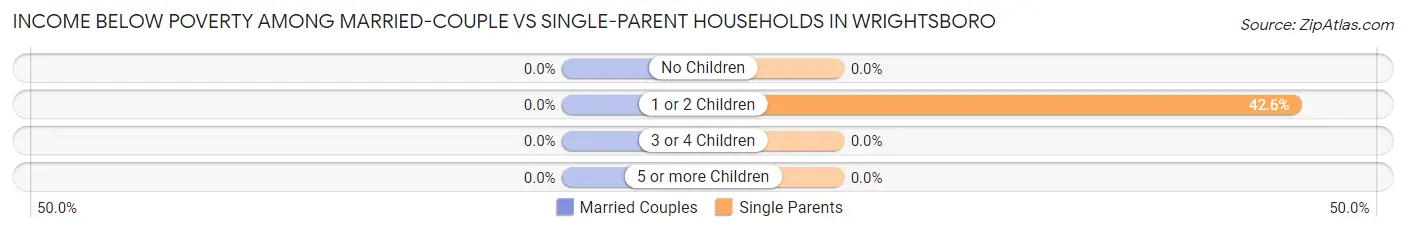
| Children | Married-Couple Families | Single-Parent Households |
| No Children | 0 (0.0%) | 0 (0.0%) |
| 1 or 2 Children | 0 (0.0%) | 78 (42.6%) |
| 3 or 4 Children | 0 (0.0%) | 0 (0.0%) |
| 5 or more Children | 0 (0.0%) | 0 (0.0%) |
| Total | 0 (0.0%) | 78 (26.2%) |
Employment Characteristics in Wrightsboro
Employment by Class of Employer in Wrightsboro
Among the 2,717 employed individuals in Wrightsboro, private company employees (1,924 | 70.8%), self-employed (not incorporated) (301 | 11.1%), and state government employees (176 | 6.5%) make up the most common classes of employment.
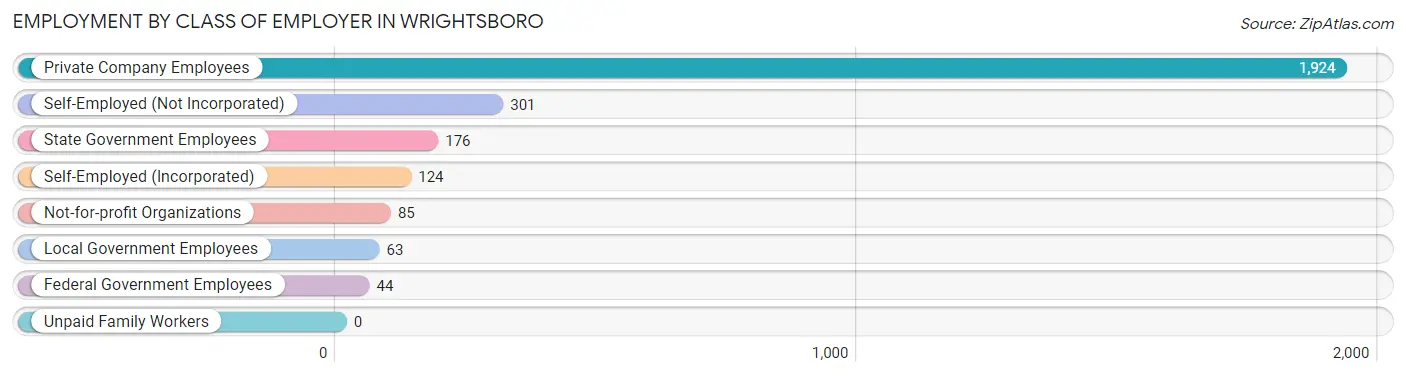
| Employer Class | # Employees | % Employees |
| Private Company Employees | 1,924 | 70.8% |
| Self-Employed (Incorporated) | 124 | 4.6% |
| Self-Employed (Not Incorporated) | 301 | 11.1% |
| Not-for-profit Organizations | 85 | 3.1% |
| Local Government Employees | 63 | 2.3% |
| State Government Employees | 176 | 6.5% |
| Federal Government Employees | 44 | 1.6% |
| Unpaid Family Workers | 0 | 0.0% |
| Total | 2,717 | 100.0% |
Employment Status by Age in Wrightsboro
According to the labor force statistics for Wrightsboro, out of the total population over 16 years of age (4,215), 66.2% or 2,790 individuals are in the labor force, with 1.9% or 53 of them unemployed. The age group with the highest labor force participation rate is 25 to 29 years, with 94.7% or 535 individuals in the labor force. Within the labor force, the 55 to 59 years age range has the highest percentage of unemployed individuals, with 8.4% or 17 of them being unemployed.
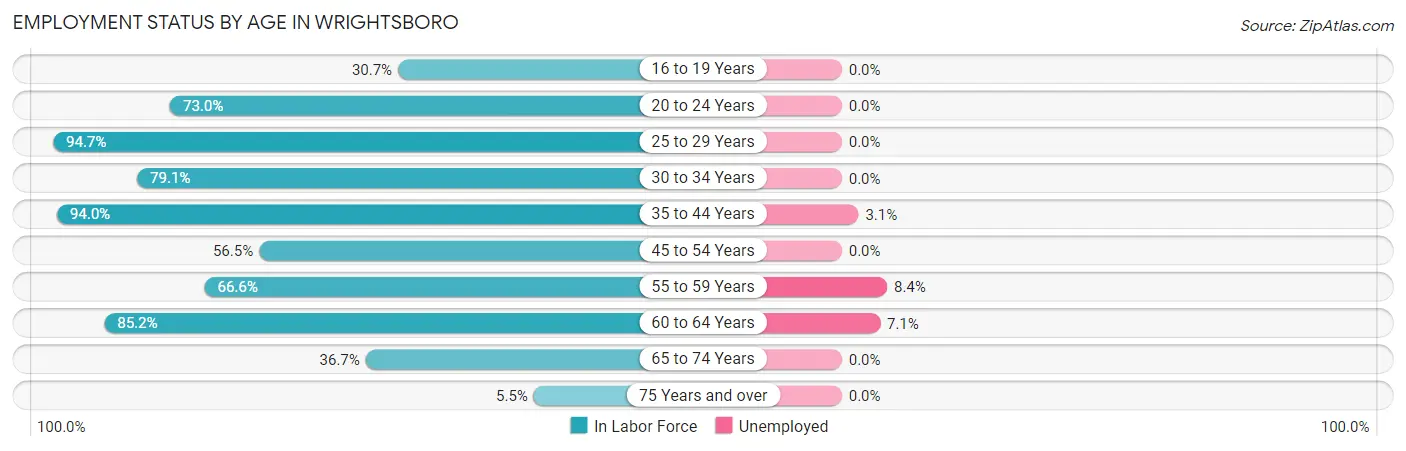
| Age Bracket | In Labor Force | Unemployed |
| 16 to 19 Years | 42 (30.7%) | 0 (0.0%) |
| 20 to 24 Years | 322 (73.0%) | 0 (0.0%) |
| 25 to 29 Years | 535 (94.7%) | 0 (0.0%) |
| 30 to 34 Years | 151 (79.1%) | 0 (0.0%) |
| 35 to 44 Years | 639 (94.0%) | 20 (3.1%) |
| 45 to 54 Years | 426 (56.5%) | 0 (0.0%) |
| 55 to 59 Years | 203 (66.6%) | 17 (8.4%) |
| 60 to 64 Years | 224 (85.2%) | 16 (7.1%) |
| 65 to 74 Years | 236 (36.7%) | 0 (0.0%) |
| 75 Years and over | 13 (5.5%) | 0 (0.0%) |
| Total | 2,790 (66.2%) | 53 (1.9%) |
Employment Status by Educational Attainment in Wrightsboro
According to labor force statistics for Wrightsboro, 79.0% of individuals (2,179) out of the total population between 25 and 64 years of age (2,758) are in the labor force, with 2.5% or 54 of them being unemployed. The group with the highest labor force participation rate are those with the educational attainment of bachelor's degree or higher, with 95.8% or 523 individuals in the labor force. Within the labor force, individuals with bachelor's degree or higher education have the highest percentage of unemployment, with 6.9% or 36 of them being unemployed.
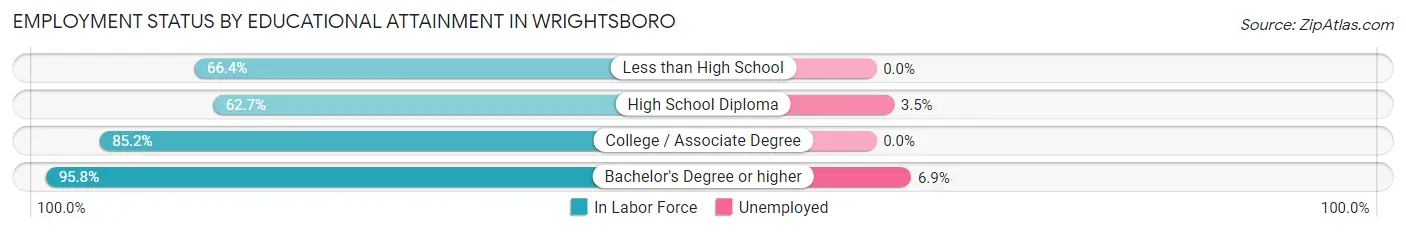
| Educational Attainment | In Labor Force | Unemployed |
| Less than High School | 172 (66.4%) | 0 (0.0%) |
| High School Diploma | 504 (62.7%) | 28 (3.5%) |
| College / Associate Degree | 979 (85.2%) | 0 (0.0%) |
| Bachelor's Degree or higher | 523 (95.8%) | 38 (6.9%) |
| Total | 2,179 (79.0%) | 69 (2.5%) |
Employment Occupations by Sex in Wrightsboro
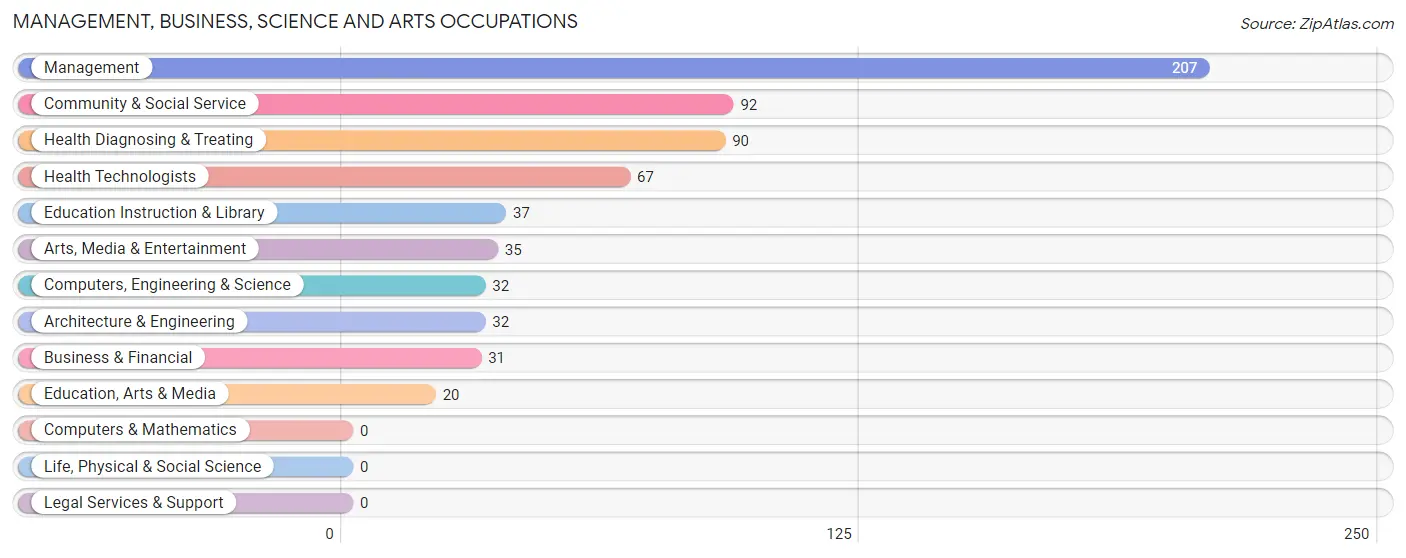
Management, Business, Science and Arts Occupations
The most common Management, Business, Science and Arts occupations in Wrightsboro are Management (207 | 7.6%), Community & Social Service (92 | 3.4%), Health Diagnosing & Treating (90 | 3.3%), Health Technologists (67 | 2.5%), and Education Instruction & Library (37 | 1.4%).
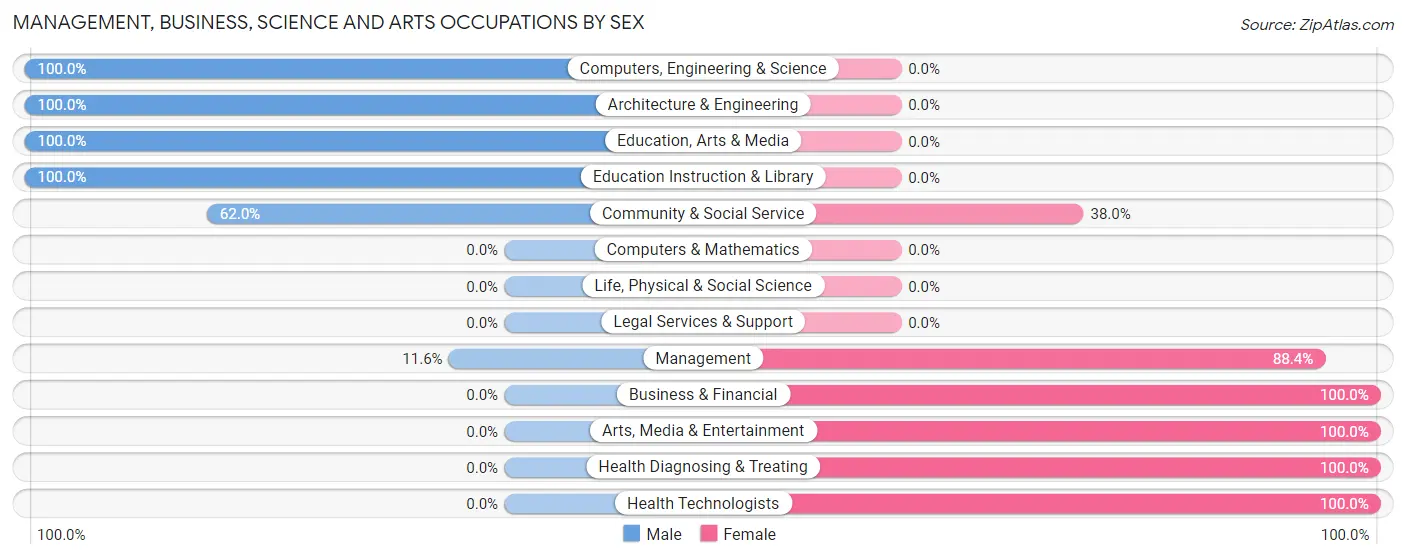
Management, Business, Science and Arts Occupations by Sex
Within the Management, Business, Science and Arts occupations in Wrightsboro, the most male-oriented occupations are Computers, Engineering & Science (100.0%), Architecture & Engineering (100.0%), and Education, Arts & Media (100.0%), while the most female-oriented occupations are Business & Financial (100.0%), Arts, Media & Entertainment (100.0%), and Health Diagnosing & Treating (100.0%).
| Occupation | Male | Female |
| Management | 24 (11.6%) | 183 (88.4%) |
| Business & Financial | 0 (0.0%) | 31 (100.0%) |
| Computers, Engineering & Science | 32 (100.0%) | 0 (0.0%) |
| Computers & Mathematics | 0 (0.0%) | 0 (0.0%) |
| Architecture & Engineering | 32 (100.0%) | 0 (0.0%) |
| Life, Physical & Social Science | 0 (0.0%) | 0 (0.0%) |
| Community & Social Service | 57 (62.0%) | 35 (38.0%) |
| Education, Arts & Media | 20 (100.0%) | 0 (0.0%) |
| Legal Services & Support | 0 (0.0%) | 0 (0.0%) |
| Education Instruction & Library | 37 (100.0%) | 0 (0.0%) |
| Arts, Media & Entertainment | 0 (0.0%) | 35 (100.0%) |
| Health Diagnosing & Treating | 0 (0.0%) | 90 (100.0%) |
| Health Technologists | 0 (0.0%) | 67 (100.0%) |
| Total (Category) | 113 (25.0%) | 339 (75.0%) |
| Total (Overall) | 1,161 (42.7%) | 1,556 (57.3%) |
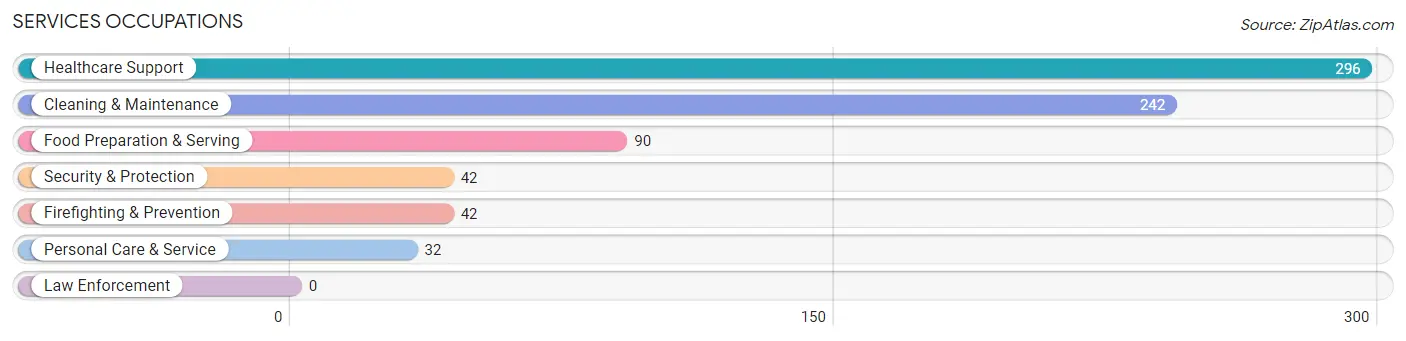
Services Occupations
The most common Services occupations in Wrightsboro are Healthcare Support (296 | 10.9%), Cleaning & Maintenance (242 | 8.9%), Food Preparation & Serving (90 | 3.3%), Security & Protection (42 | 1.5%), and Firefighting & Prevention (42 | 1.5%).
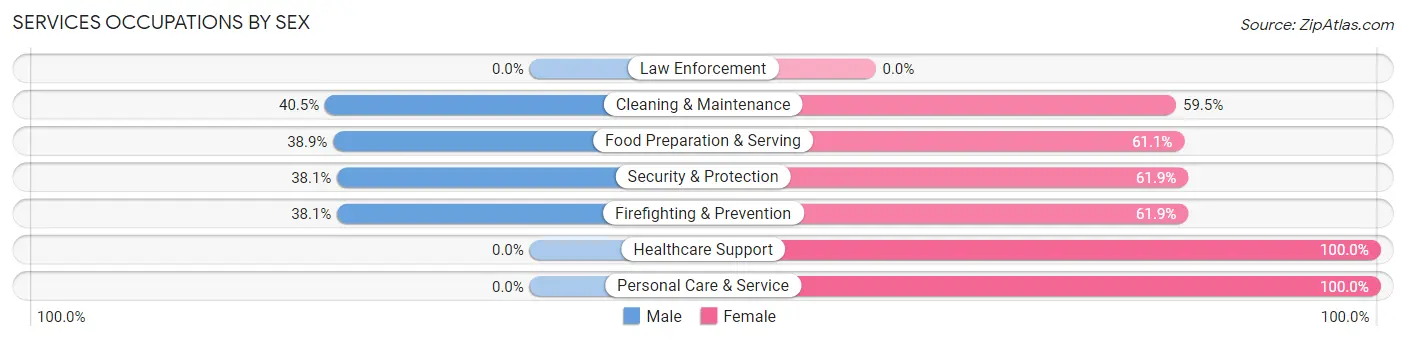
Services Occupations by Sex
Within the Services occupations in Wrightsboro, the most male-oriented occupations are Cleaning & Maintenance (40.5%), Food Preparation & Serving (38.9%), and Security & Protection (38.1%), while the most female-oriented occupations are Healthcare Support (100.0%), Personal Care & Service (100.0%), and Security & Protection (61.9%).
| Occupation | Male | Female |
| Healthcare Support | 0 (0.0%) | 296 (100.0%) |
| Security & Protection | 16 (38.1%) | 26 (61.9%) |
| Firefighting & Prevention | 16 (38.1%) | 26 (61.9%) |
| Law Enforcement | 0 (0.0%) | 0 (0.0%) |
| Food Preparation & Serving | 35 (38.9%) | 55 (61.1%) |
| Cleaning & Maintenance | 98 (40.5%) | 144 (59.5%) |
| Personal Care & Service | 0 (0.0%) | 32 (100.0%) |
| Total (Category) | 149 (21.2%) | 553 (78.8%) |
| Total (Overall) | 1,161 (42.7%) | 1,556 (57.3%) |
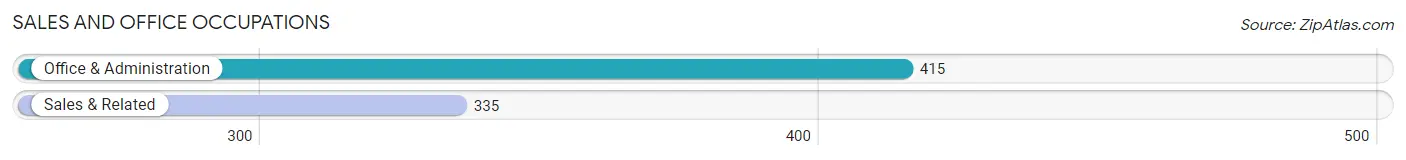
Sales and Office Occupations
The most common Sales and Office occupations in Wrightsboro are Office & Administration (415 | 15.3%), and Sales & Related (335 | 12.3%).
Sales and Office Occupations by Sex
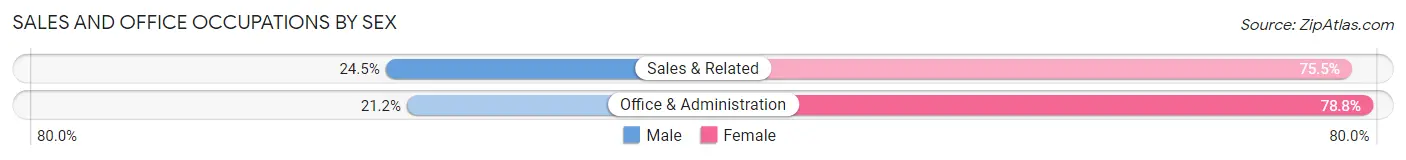
| Occupation | Male | Female |
| Sales & Related | 82 (24.5%) | 253 (75.5%) |
| Office & Administration | 88 (21.2%) | 327 (78.8%) |
| Total (Category) | 170 (22.7%) | 580 (77.3%) |
| Total (Overall) | 1,161 (42.7%) | 1,556 (57.3%) |
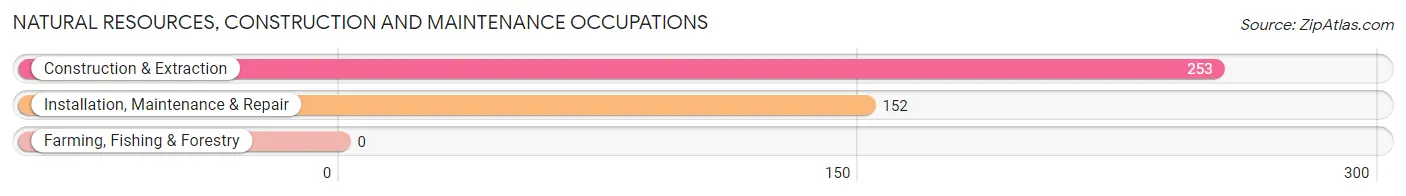
Natural Resources, Construction and Maintenance Occupations
The most common Natural Resources, Construction and Maintenance occupations in Wrightsboro are Construction & Extraction (253 | 9.3%), and Installation, Maintenance & Repair (152 | 5.6%).
Natural Resources, Construction and Maintenance Occupations by Sex
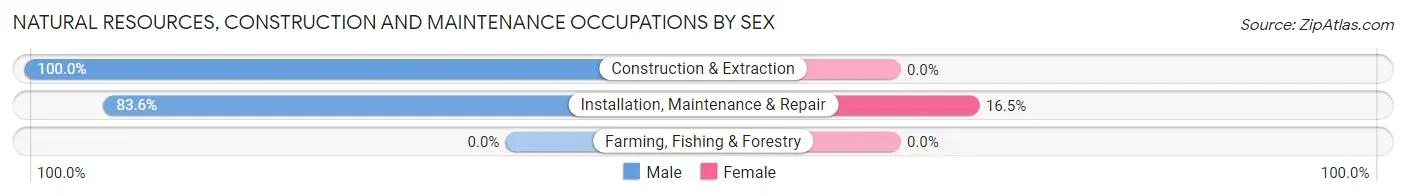
| Occupation | Male | Female |
| Farming, Fishing & Forestry | 0 (0.0%) | 0 (0.0%) |
| Construction & Extraction | 253 (100.0%) | 0 (0.0%) |
| Installation, Maintenance & Repair | 127 (83.6%) | 25 (16.5%) |
| Total (Category) | 380 (93.8%) | 25 (6.2%) |
| Total (Overall) | 1,161 (42.7%) | 1,556 (57.3%) |
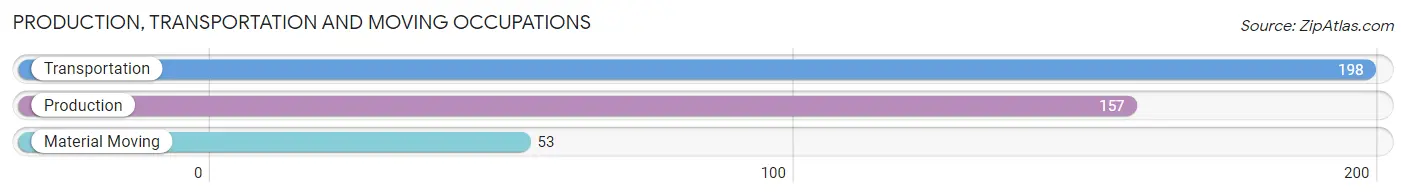
Production, Transportation and Moving Occupations
The most common Production, Transportation and Moving occupations in Wrightsboro are Transportation (198 | 7.3%), Production (157 | 5.8%), and Material Moving (53 | 1.9%).
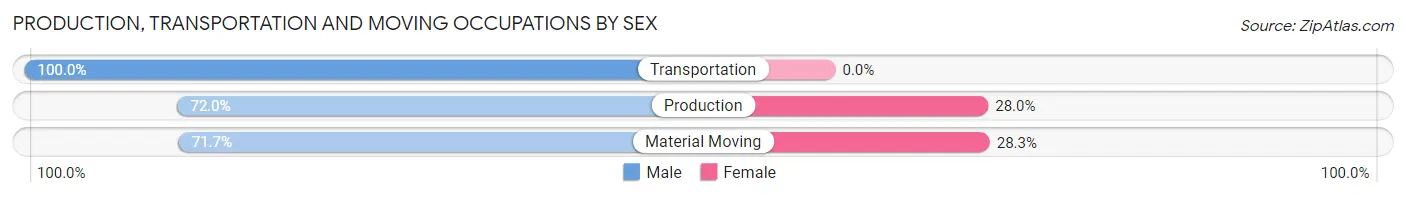
Production, Transportation and Moving Occupations by Sex
| Occupation | Male | Female |
| Production | 113 (72.0%) | 44 (28.0%) |
| Transportation | 198 (100.0%) | 0 (0.0%) |
| Material Moving | 38 (71.7%) | 15 (28.3%) |
| Total (Category) | 349 (85.5%) | 59 (14.5%) |
| Total (Overall) | 1,161 (42.7%) | 1,556 (57.3%) |
Employment Industries by Sex in Wrightsboro
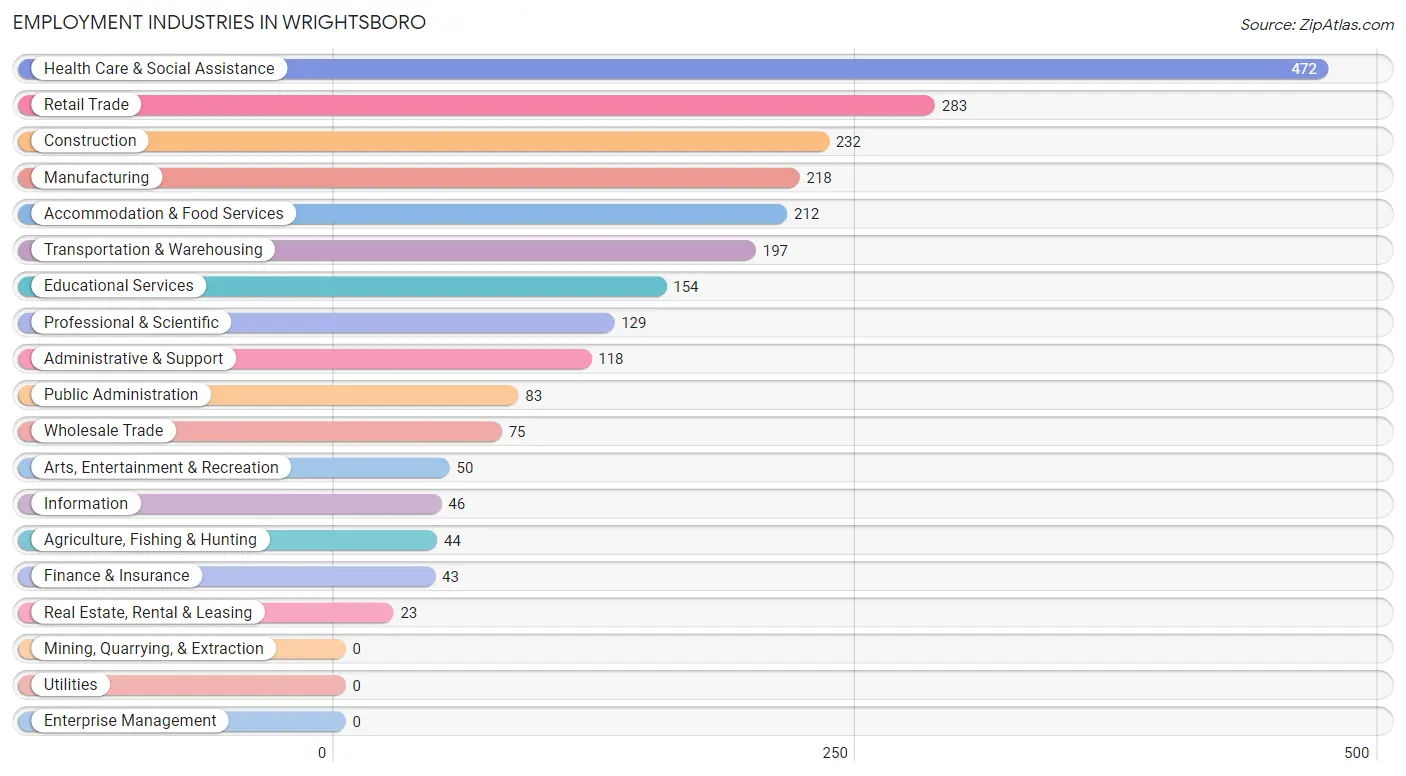
Employment Industries in Wrightsboro
The major employment industries in Wrightsboro include Health Care & Social Assistance (472 | 17.4%), Retail Trade (283 | 10.4%), Construction (232 | 8.5%), Manufacturing (218 | 8.0%), and Accommodation & Food Services (212 | 7.8%).
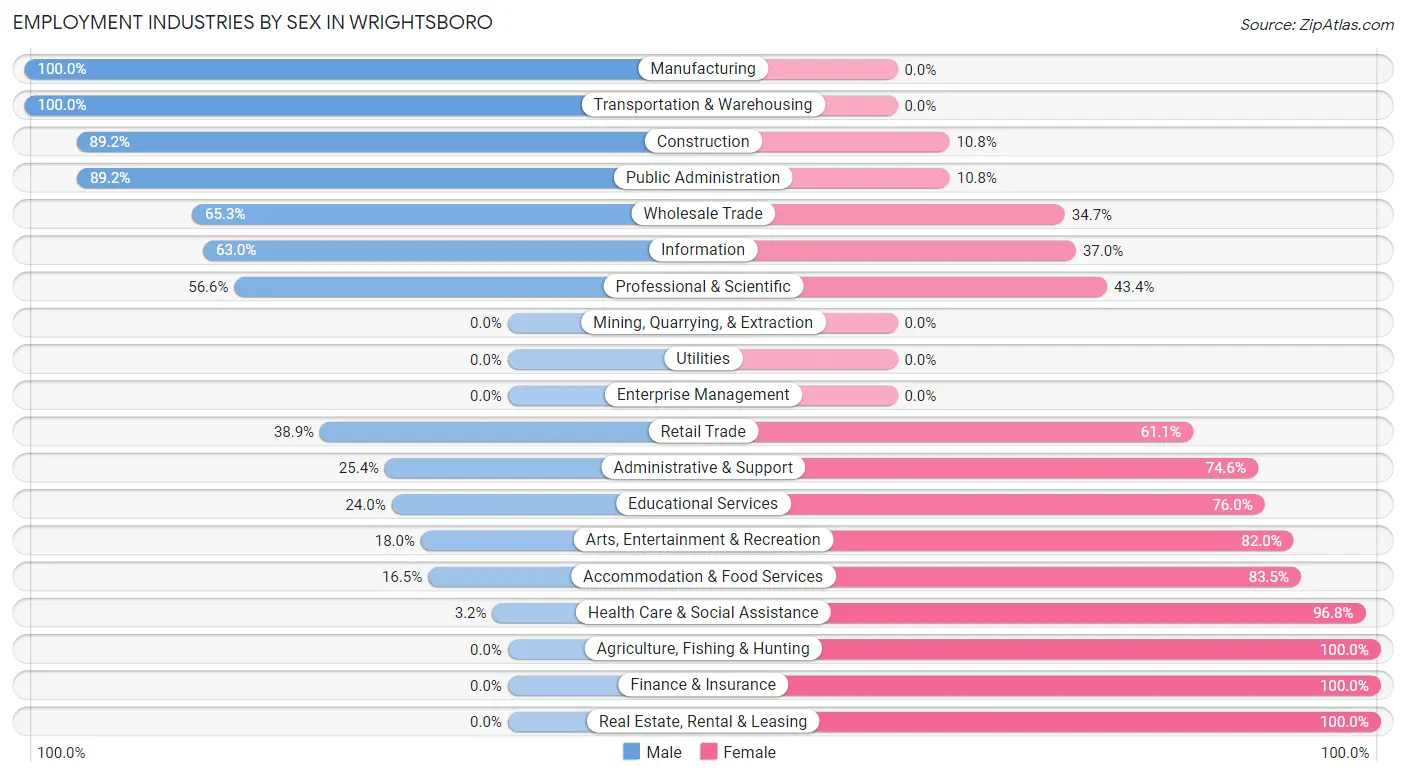
Employment Industries by Sex in Wrightsboro
The Wrightsboro industries that see more men than women are Manufacturing (100.0%), Transportation & Warehousing (100.0%), and Construction (89.2%), whereas the industries that tend to have a higher number of women are Agriculture, Fishing & Hunting (100.0%), Finance & Insurance (100.0%), and Real Estate, Rental & Leasing (100.0%).
| Industry | Male | Female |
| Agriculture, Fishing & Hunting | 0 (0.0%) | 44 (100.0%) |
| Mining, Quarrying, & Extraction | 0 (0.0%) | 0 (0.0%) |
| Construction | 207 (89.2%) | 25 (10.8%) |
| Manufacturing | 218 (100.0%) | 0 (0.0%) |
| Wholesale Trade | 49 (65.3%) | 26 (34.7%) |
| Retail Trade | 110 (38.9%) | 173 (61.1%) |
| Transportation & Warehousing | 197 (100.0%) | 0 (0.0%) |
| Utilities | 0 (0.0%) | 0 (0.0%) |
| Information | 29 (63.0%) | 17 (37.0%) |
| Finance & Insurance | 0 (0.0%) | 43 (100.0%) |
| Real Estate, Rental & Leasing | 0 (0.0%) | 23 (100.0%) |
| Professional & Scientific | 73 (56.6%) | 56 (43.4%) |
| Enterprise Management | 0 (0.0%) | 0 (0.0%) |
| Administrative & Support | 30 (25.4%) | 88 (74.6%) |
| Educational Services | 37 (24.0%) | 117 (76.0%) |
| Health Care & Social Assistance | 15 (3.2%) | 457 (96.8%) |
| Arts, Entertainment & Recreation | 9 (18.0%) | 41 (82.0%) |
| Accommodation & Food Services | 35 (16.5%) | 177 (83.5%) |
| Public Administration | 74 (89.2%) | 9 (10.8%) |
| Total | 1,161 (42.7%) | 1,556 (57.3%) |
Education in Wrightsboro
School Enrollment in Wrightsboro
The most common levels of schooling among the 1,108 students in Wrightsboro are college / undergraduate (433 | 39.1%), high school (205 | 18.5%), and elementary school (182 | 16.4%).
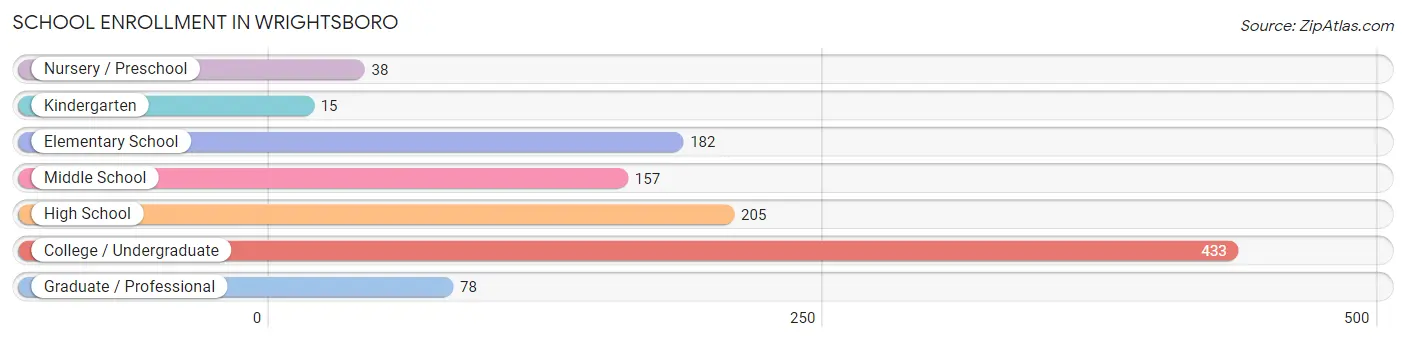
| School Level | # Students | % Students |
| Nursery / Preschool | 38 | 3.4% |
| Kindergarten | 15 | 1.3% |
| Elementary School | 182 | 16.4% |
| Middle School | 157 | 14.2% |
| High School | 205 | 18.5% |
| College / Undergraduate | 433 | 39.1% |
| Graduate / Professional | 78 | 7.0% |
| Total | 1,108 | 100.0% |
School Enrollment by Age by Funding Source in Wrightsboro
Out of a total of 1,108 students who are enrolled in schools in Wrightsboro, 172 (15.5%) attend a private institution, while the remaining 936 (84.5%) are enrolled in public schools. The age group of 3 to 4 year olds has the highest likelihood of being enrolled in private schools, with 18 (100.0% in the age bracket) enrolled. Conversely, the age group of 10 to 14 year olds has the lowest likelihood of being enrolled in a private school, with 177 (100.0% in the age bracket) attending a public institution.
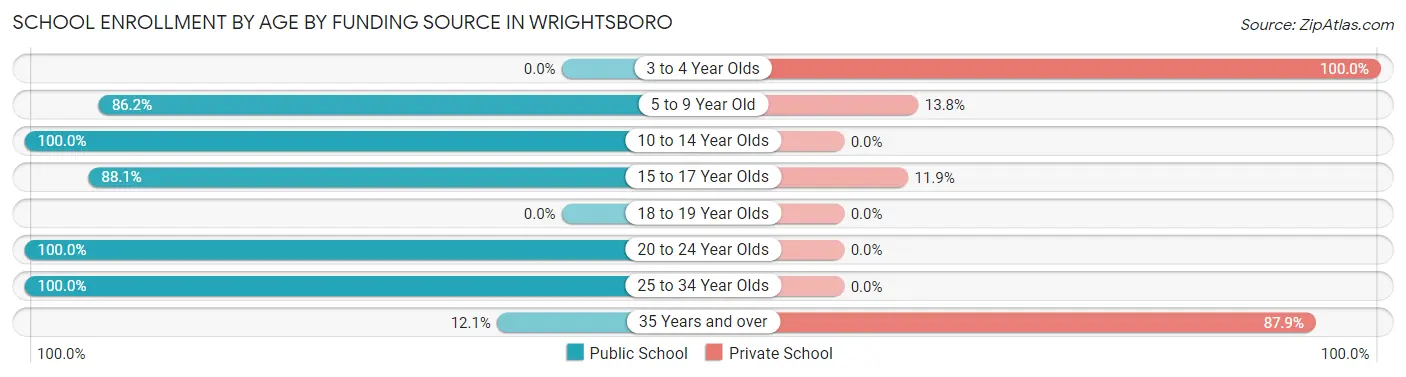
| Age Bracket | Public School | Private School |
| 3 to 4 Year Olds | 0 (0.0%) | 18 (100.0%) |
| 5 to 9 Year Old | 187 (86.2%) | 30 (13.8%) |
| 10 to 14 Year Olds | 177 (100.0%) | 0 (0.0%) |
| 15 to 17 Year Olds | 163 (88.1%) | 22 (11.9%) |
| 18 to 19 Year Olds | 0 (0.0%) | 0 (0.0%) |
| 20 to 24 Year Olds | 154 (100.0%) | 0 (0.0%) |
| 25 to 34 Year Olds | 241 (100.0%) | 0 (0.0%) |
| 35 Years and over | 14 (12.1%) | 102 (87.9%) |
| Total | 936 (84.5%) | 172 (15.5%) |
Educational Attainment by Field of Study in Wrightsboro
Business (192 | 27.6%), education (170 | 24.4%), social sciences (75 | 10.8%), psychology (62 | 8.9%), and science & technology (47 | 6.7%) are the most common fields of study among 697 individuals in Wrightsboro who have obtained a bachelor's degree or higher.
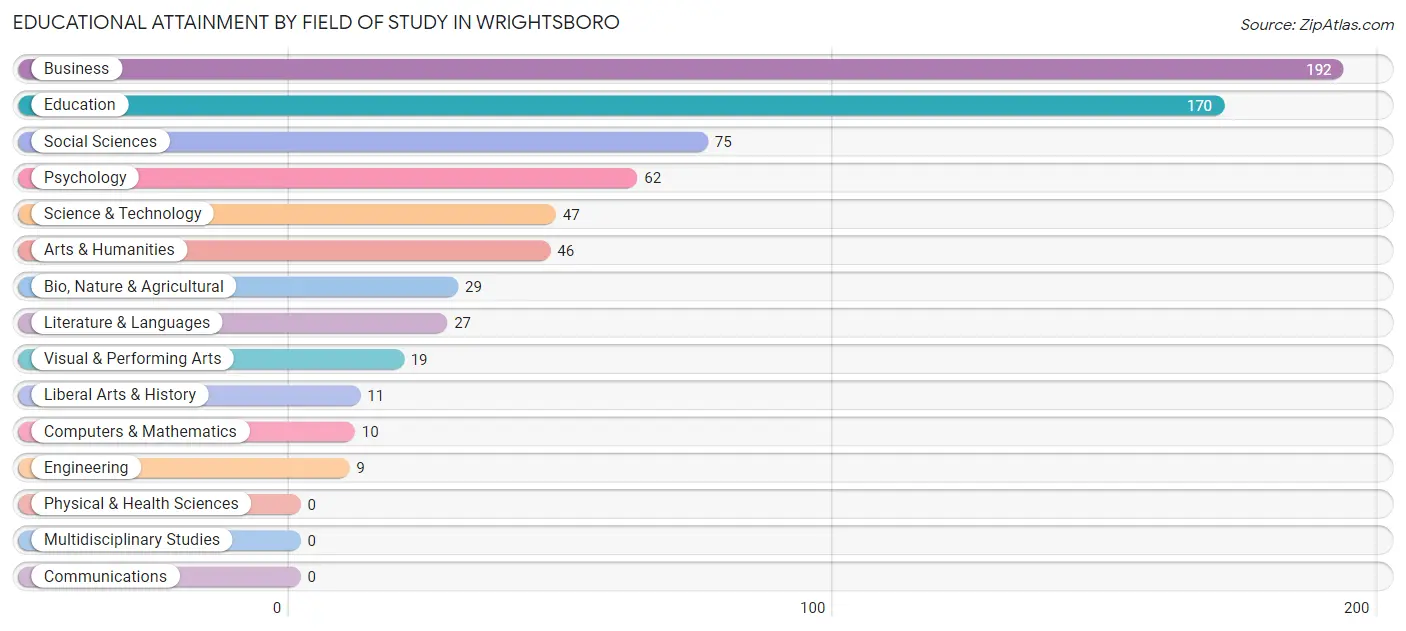
| Field of Study | # Graduates | % Graduates |
| Computers & Mathematics | 10 | 1.4% |
| Bio, Nature & Agricultural | 29 | 4.2% |
| Physical & Health Sciences | 0 | 0.0% |
| Psychology | 62 | 8.9% |
| Social Sciences | 75 | 10.8% |
| Engineering | 9 | 1.3% |
| Multidisciplinary Studies | 0 | 0.0% |
| Science & Technology | 47 | 6.7% |
| Business | 192 | 27.6% |
| Education | 170 | 24.4% |
| Literature & Languages | 27 | 3.9% |
| Liberal Arts & History | 11 | 1.6% |
| Visual & Performing Arts | 19 | 2.7% |
| Communications | 0 | 0.0% |
| Arts & Humanities | 46 | 6.6% |
| Total | 697 | 100.0% |
Transportation & Commute in Wrightsboro
Vehicle Availability by Sex in Wrightsboro
The most prevalent vehicle ownership categories in Wrightsboro are males with 2 vehicles (704, accounting for 60.6%) and females with 2 vehicles (669, making up 45.2%).
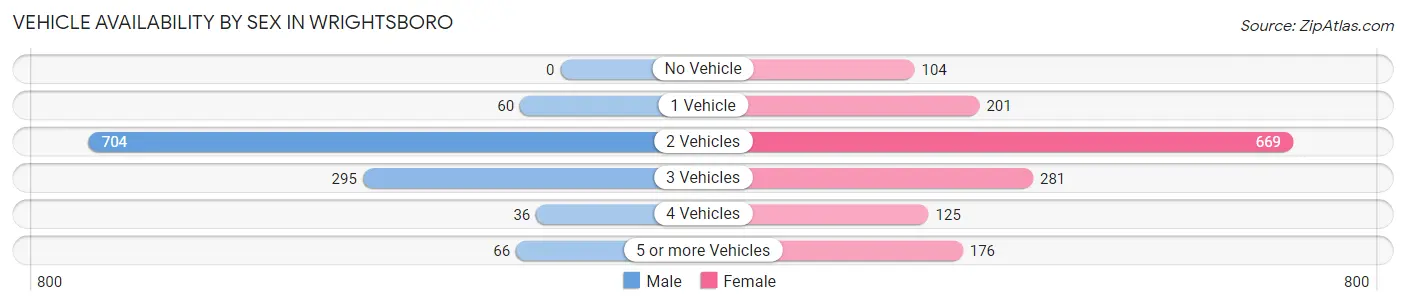
| Vehicles Available | Male | Female |
| No Vehicle | 0 (0.0%) | 104 (6.7%) |
| 1 Vehicle | 60 (5.2%) | 201 (12.9%) |
| 2 Vehicles | 704 (60.6%) | 669 (43.0%) |
| 3 Vehicles | 295 (25.4%) | 281 (18.1%) |
| 4 Vehicles | 36 (3.1%) | 125 (8.0%) |
| 5 or more Vehicles | 66 (5.7%) | 176 (11.3%) |
| Total | 1,161 (100.0%) | 1,556 (100.0%) |
Commute Time in Wrightsboro
The most frequently occuring commute durations in Wrightsboro are 15 to 19 minutes (772 commuters, 30.1%), 20 to 24 minutes (583 commuters, 22.7%), and 10 to 14 minutes (383 commuters, 14.9%).
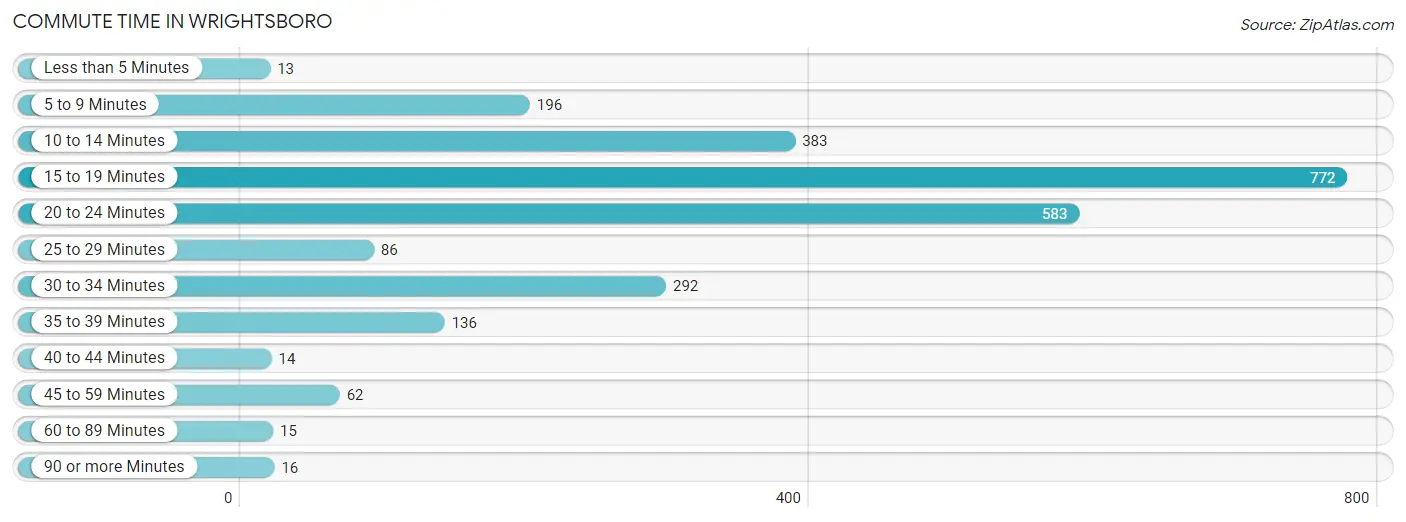
| Commute Time | # Commuters | % Commuters |
| Less than 5 Minutes | 13 | 0.5% |
| 5 to 9 Minutes | 196 | 7.6% |
| 10 to 14 Minutes | 383 | 14.9% |
| 15 to 19 Minutes | 772 | 30.1% |
| 20 to 24 Minutes | 583 | 22.7% |
| 25 to 29 Minutes | 86 | 3.4% |
| 30 to 34 Minutes | 292 | 11.4% |
| 35 to 39 Minutes | 136 | 5.3% |
| 40 to 44 Minutes | 14 | 0.5% |
| 45 to 59 Minutes | 62 | 2.4% |
| 60 to 89 Minutes | 15 | 0.6% |
| 90 or more Minutes | 16 | 0.6% |
Commute Time by Sex in Wrightsboro
The most common commute times in Wrightsboro are 15 to 19 minutes (492 commuters, 43.9%) for males and 20 to 24 minutes (436 commuters, 30.1%) for females.
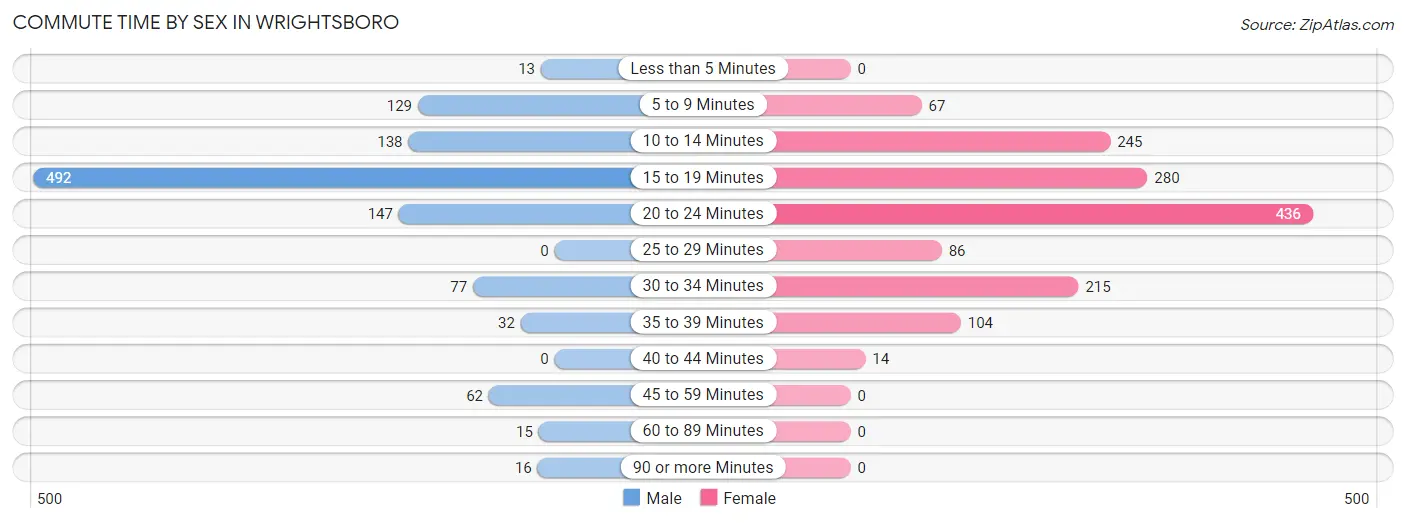
| Commute Time | Male | Female |
| Less than 5 Minutes | 13 (1.2%) | 0 (0.0%) |
| 5 to 9 Minutes | 129 (11.5%) | 67 (4.6%) |
| 10 to 14 Minutes | 138 (12.3%) | 245 (16.9%) |
| 15 to 19 Minutes | 492 (43.9%) | 280 (19.4%) |
| 20 to 24 Minutes | 147 (13.1%) | 436 (30.1%) |
| 25 to 29 Minutes | 0 (0.0%) | 86 (5.9%) |
| 30 to 34 Minutes | 77 (6.9%) | 215 (14.9%) |
| 35 to 39 Minutes | 32 (2.9%) | 104 (7.2%) |
| 40 to 44 Minutes | 0 (0.0%) | 14 (1.0%) |
| 45 to 59 Minutes | 62 (5.5%) | 0 (0.0%) |
| 60 to 89 Minutes | 15 (1.3%) | 0 (0.0%) |
| 90 or more Minutes | 16 (1.4%) | 0 (0.0%) |
Time of Departure to Work by Sex in Wrightsboro
The most frequent times of departure to work in Wrightsboro are 8:00 AM to 8:29 AM (261, 23.3%) for males and 8:00 AM to 8:29 AM (263, 18.2%) for females.
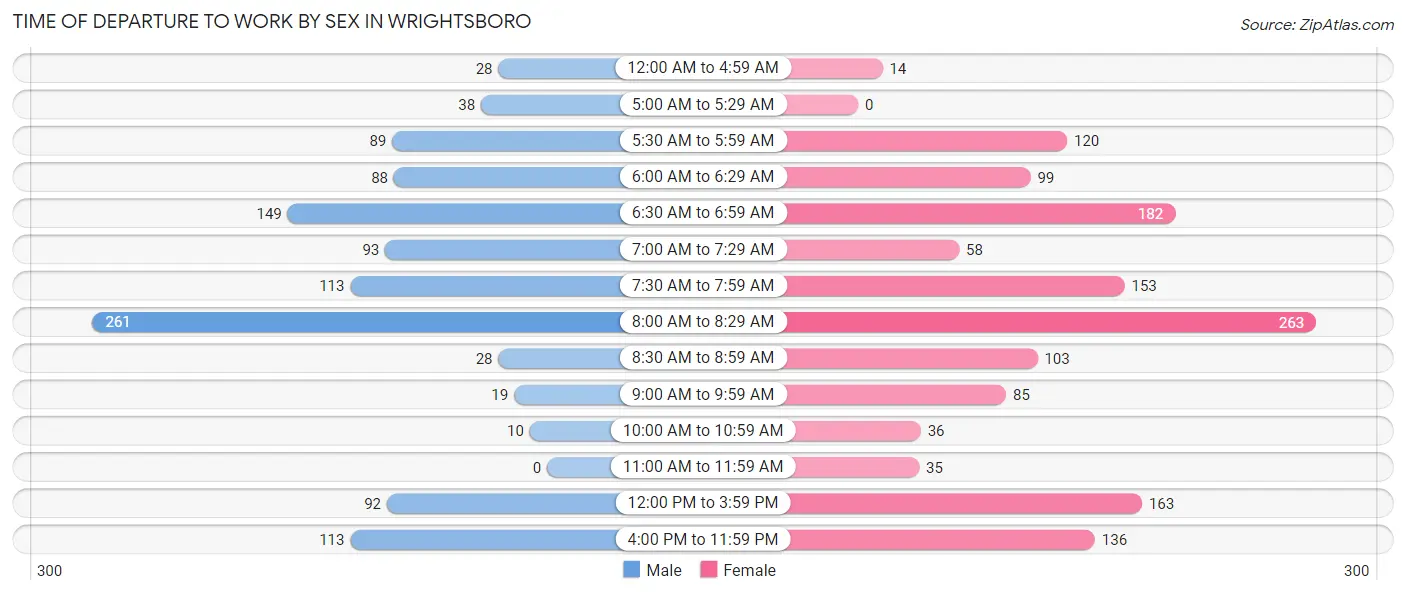
| Time of Departure | Male | Female |
| 12:00 AM to 4:59 AM | 28 (2.5%) | 14 (1.0%) |
| 5:00 AM to 5:29 AM | 38 (3.4%) | 0 (0.0%) |
| 5:30 AM to 5:59 AM | 89 (7.9%) | 120 (8.3%) |
| 6:00 AM to 6:29 AM | 88 (7.9%) | 99 (6.8%) |
| 6:30 AM to 6:59 AM | 149 (13.3%) | 182 (12.6%) |
| 7:00 AM to 7:29 AM | 93 (8.3%) | 58 (4.0%) |
| 7:30 AM to 7:59 AM | 113 (10.1%) | 153 (10.6%) |
| 8:00 AM to 8:29 AM | 261 (23.3%) | 263 (18.2%) |
| 8:30 AM to 8:59 AM | 28 (2.5%) | 103 (7.1%) |
| 9:00 AM to 9:59 AM | 19 (1.7%) | 85 (5.9%) |
| 10:00 AM to 10:59 AM | 10 (0.9%) | 36 (2.5%) |
| 11:00 AM to 11:59 AM | 0 (0.0%) | 35 (2.4%) |
| 12:00 PM to 3:59 PM | 92 (8.2%) | 163 (11.3%) |
| 4:00 PM to 11:59 PM | 113 (10.1%) | 136 (9.4%) |
| Total | 1,121 (100.0%) | 1,447 (100.0%) |
Housing Occupancy in Wrightsboro
Occupancy by Ownership in Wrightsboro
Of the total 2,165 dwellings in Wrightsboro, owner-occupied units account for 1,696 (78.3%), while renter-occupied units make up 469 (21.7%).
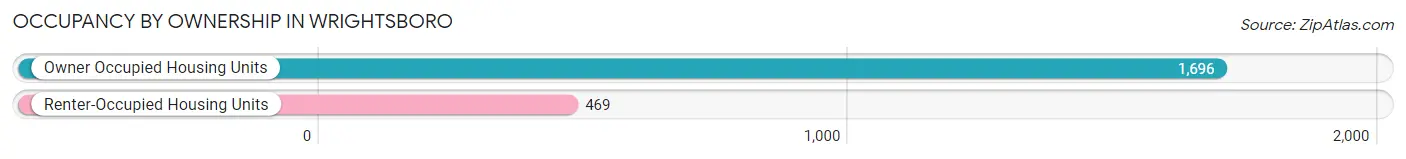
| Occupancy | # Housing Units | % Housing Units |
| Owner Occupied Housing Units | 1,696 | 78.3% |
| Renter-Occupied Housing Units | 469 | 21.7% |
| Total Occupied Housing Units | 2,165 | 100.0% |
Occupancy by Household Size in Wrightsboro
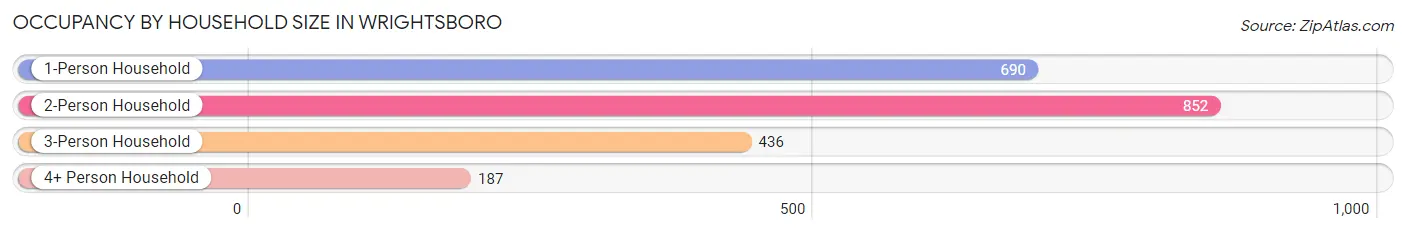
| Household Size | # Housing Units | % Housing Units |
| 1-Person Household | 690 | 31.9% |
| 2-Person Household | 852 | 39.4% |
| 3-Person Household | 436 | 20.1% |
| 4+ Person Household | 187 | 8.6% |
| Total Housing Units | 2,165 | 100.0% |
Occupancy by Ownership by Household Size in Wrightsboro
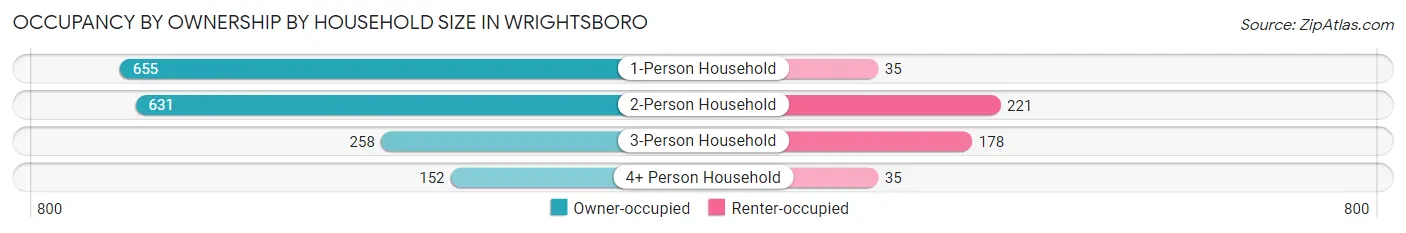
| Household Size | Owner-occupied | Renter-occupied |
| 1-Person Household | 655 (94.9%) | 35 (5.1%) |
| 2-Person Household | 631 (74.1%) | 221 (25.9%) |
| 3-Person Household | 258 (59.2%) | 178 (40.8%) |
| 4+ Person Household | 152 (81.3%) | 35 (18.7%) |
| Total Housing Units | 1,696 (78.3%) | 469 (21.7%) |
Occupancy by Educational Attainment in Wrightsboro
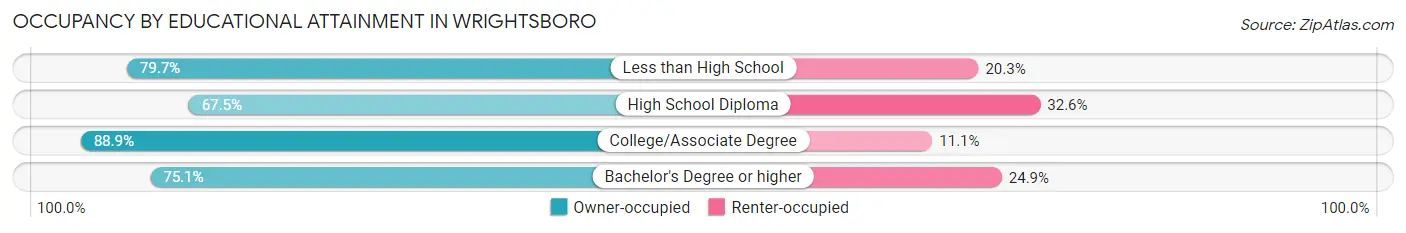
| Household Size | Owner-occupied | Renter-occupied |
| Less than High School | 271 (79.7%) | 69 (20.3%) |
| High School Diploma | 346 (67.4%) | 167 (32.6%) |
| College/Associate Degree | 606 (88.9%) | 76 (11.1%) |
| Bachelor's Degree or higher | 473 (75.1%) | 157 (24.9%) |
Occupancy by Age of Householder in Wrightsboro
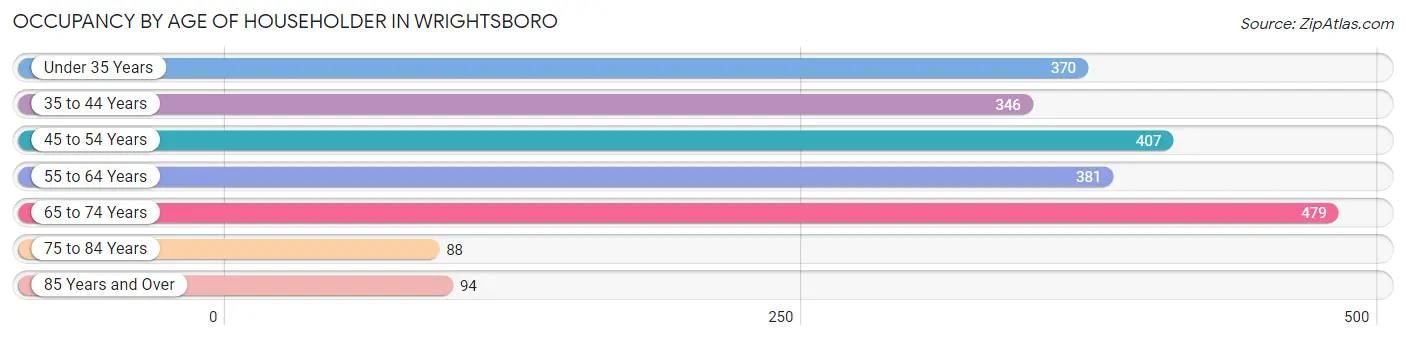
| Age Bracket | # Households | % Households |
| Under 35 Years | 370 | 17.1% |
| 35 to 44 Years | 346 | 16.0% |
| 45 to 54 Years | 407 | 18.8% |
| 55 to 64 Years | 381 | 17.6% |
| 65 to 74 Years | 479 | 22.1% |
| 75 to 84 Years | 88 | 4.1% |
| 85 Years and Over | 94 | 4.3% |
| Total | 2,165 | 100.0% |
Housing Finances in Wrightsboro
Median Income by Occupancy in Wrightsboro
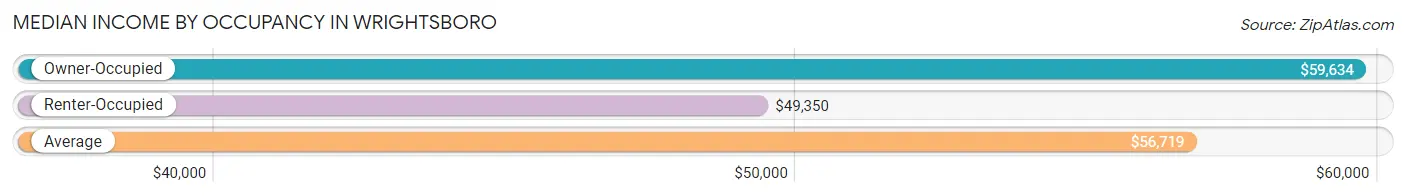
| Occupancy Type | # Households | Median Income |
| Owner-Occupied | 1,696 (78.3%) | $59,634 |
| Renter-Occupied | 469 (21.7%) | $49,350 |
| Average | 2,165 (100.0%) | $56,719 |
Occupancy by Householder Income Bracket in Wrightsboro
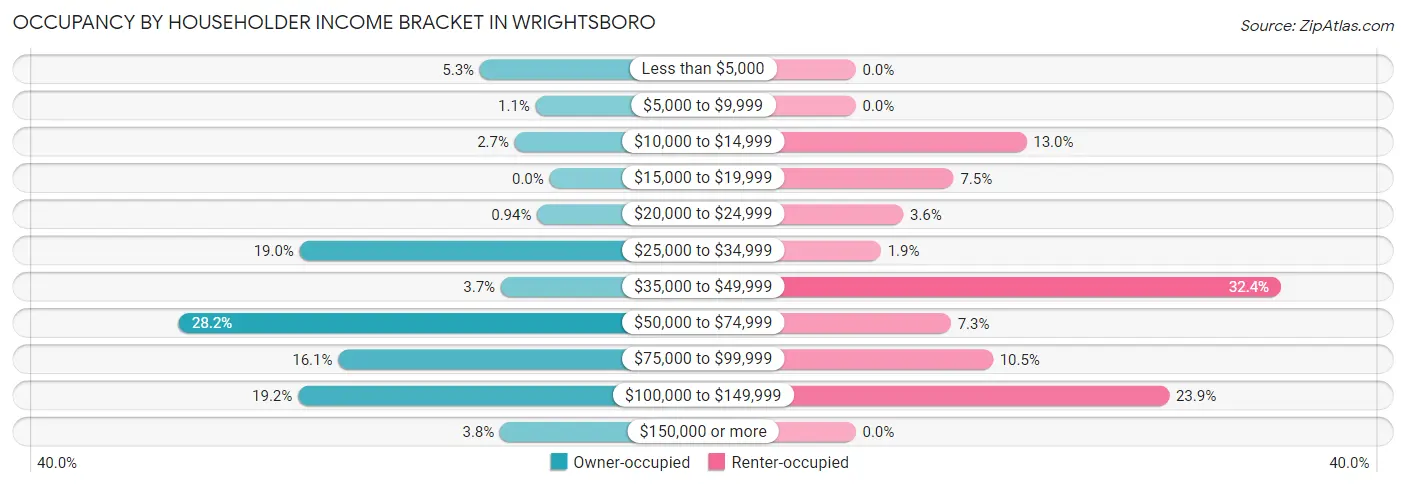
| Income Bracket | Owner-occupied | Renter-occupied |
| Less than $5,000 | 90 (5.3%) | 0 (0.0%) |
| $5,000 to $9,999 | 18 (1.1%) | 0 (0.0%) |
| $10,000 to $14,999 | 45 (2.6%) | 61 (13.0%) |
| $15,000 to $19,999 | 0 (0.0%) | 35 (7.5%) |
| $20,000 to $24,999 | 16 (0.9%) | 17 (3.6%) |
| $25,000 to $34,999 | 323 (19.0%) | 9 (1.9%) |
| $35,000 to $49,999 | 63 (3.7%) | 152 (32.4%) |
| $50,000 to $74,999 | 479 (28.2%) | 34 (7.2%) |
| $75,000 to $99,999 | 273 (16.1%) | 49 (10.4%) |
| $100,000 to $149,999 | 325 (19.2%) | 112 (23.9%) |
| $150,000 or more | 64 (3.8%) | 0 (0.0%) |
| Total | 1,696 (100.0%) | 469 (100.0%) |
Monthly Housing Cost Tiers in Wrightsboro
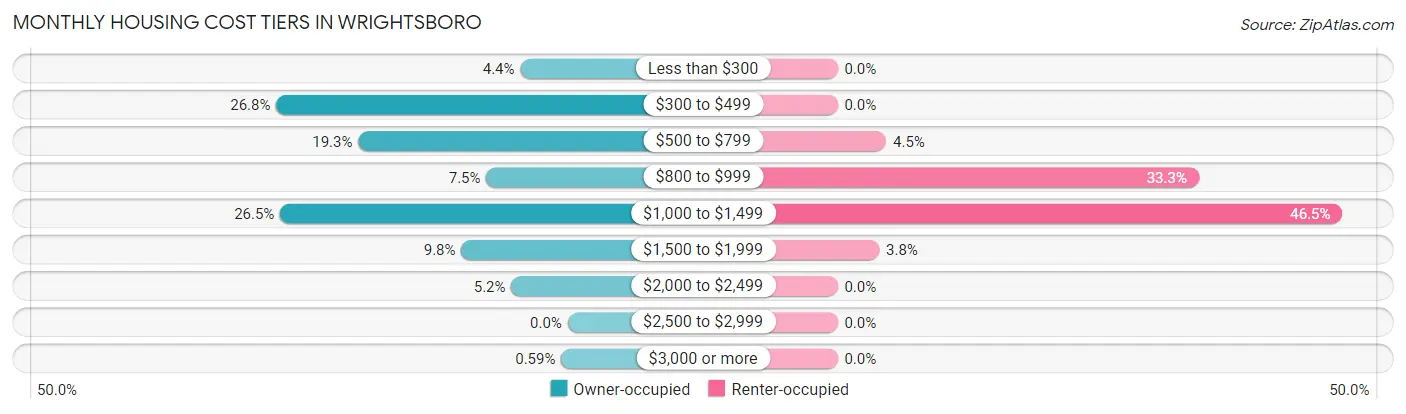
| Monthly Cost | Owner-occupied | Renter-occupied |
| Less than $300 | 74 (4.4%) | 0 (0.0%) |
| $300 to $499 | 455 (26.8%) | 0 (0.0%) |
| $500 to $799 | 327 (19.3%) | 21 (4.5%) |
| $800 to $999 | 127 (7.5%) | 156 (33.3%) |
| $1,000 to $1,499 | 449 (26.5%) | 218 (46.5%) |
| $1,500 to $1,999 | 166 (9.8%) | 18 (3.8%) |
| $2,000 to $2,499 | 88 (5.2%) | 0 (0.0%) |
| $2,500 to $2,999 | 0 (0.0%) | 0 (0.0%) |
| $3,000 or more | 10 (0.6%) | 0 (0.0%) |
| Total | 1,696 (100.0%) | 469 (100.0%) |
Physical Housing Characteristics in Wrightsboro
Housing Structures in Wrightsboro
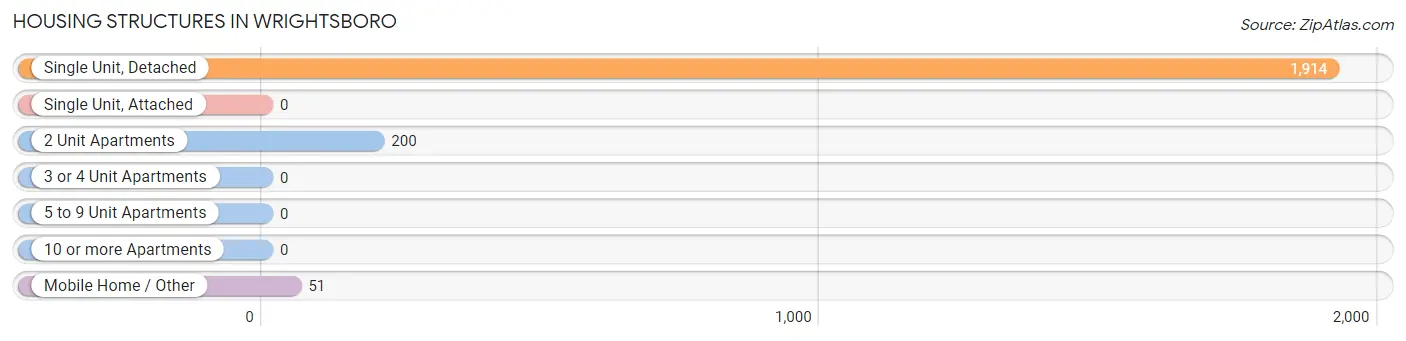
| Structure Type | # Housing Units | % Housing Units |
| Single Unit, Detached | 1,914 | 88.4% |
| Single Unit, Attached | 0 | 0.0% |
| 2 Unit Apartments | 200 | 9.2% |
| 3 or 4 Unit Apartments | 0 | 0.0% |
| 5 to 9 Unit Apartments | 0 | 0.0% |
| 10 or more Apartments | 0 | 0.0% |
| Mobile Home / Other | 51 | 2.4% |
| Total | 2,165 | 100.0% |
Housing Structures by Occupancy in Wrightsboro
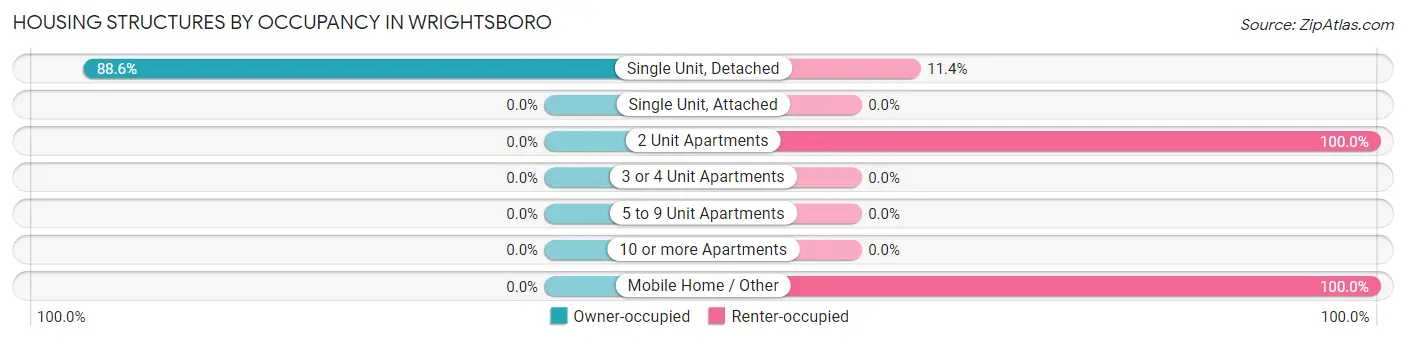
| Structure Type | Owner-occupied | Renter-occupied |
| Single Unit, Detached | 1,696 (88.6%) | 218 (11.4%) |
| Single Unit, Attached | 0 (0.0%) | 0 (0.0%) |
| 2 Unit Apartments | 0 (0.0%) | 200 (100.0%) |
| 3 or 4 Unit Apartments | 0 (0.0%) | 0 (0.0%) |
| 5 to 9 Unit Apartments | 0 (0.0%) | 0 (0.0%) |
| 10 or more Apartments | 0 (0.0%) | 0 (0.0%) |
| Mobile Home / Other | 0 (0.0%) | 51 (100.0%) |
| Total | 1,696 (78.3%) | 469 (21.7%) |
Housing Structures by Number of Rooms in Wrightsboro
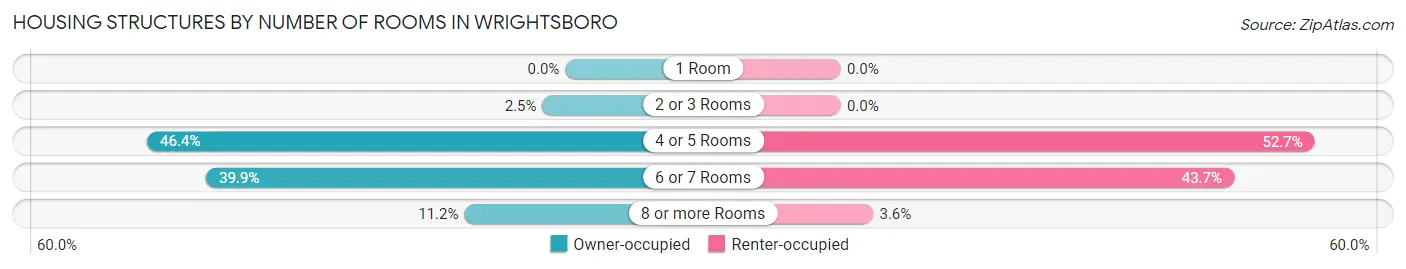
| Number of Rooms | Owner-occupied | Renter-occupied |
| 1 Room | 0 (0.0%) | 0 (0.0%) |
| 2 or 3 Rooms | 43 (2.5%) | 0 (0.0%) |
| 4 or 5 Rooms | 787 (46.4%) | 247 (52.7%) |
| 6 or 7 Rooms | 676 (39.9%) | 205 (43.7%) |
| 8 or more Rooms | 190 (11.2%) | 17 (3.6%) |
| Total | 1,696 (100.0%) | 469 (100.0%) |
Housing Structure by Heating Type in Wrightsboro
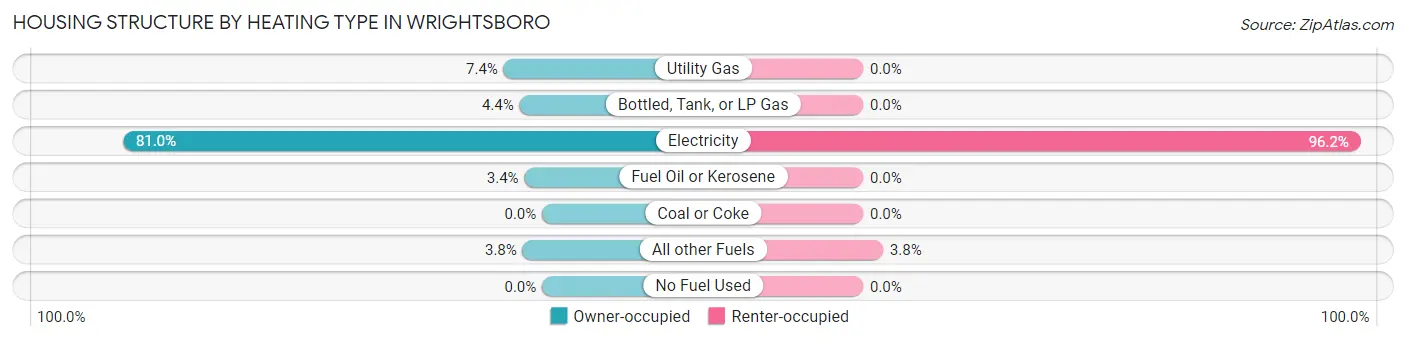
| Heating Type | Owner-occupied | Renter-occupied |
| Utility Gas | 126 (7.4%) | 0 (0.0%) |
| Bottled, Tank, or LP Gas | 74 (4.4%) | 0 (0.0%) |
| Electricity | 1,374 (81.0%) | 451 (96.2%) |
| Fuel Oil or Kerosene | 58 (3.4%) | 0 (0.0%) |
| Coal or Coke | 0 (0.0%) | 0 (0.0%) |
| All other Fuels | 64 (3.8%) | 18 (3.8%) |
| No Fuel Used | 0 (0.0%) | 0 (0.0%) |
| Total | 1,696 (100.0%) | 469 (100.0%) |
Household Vehicle Usage in Wrightsboro
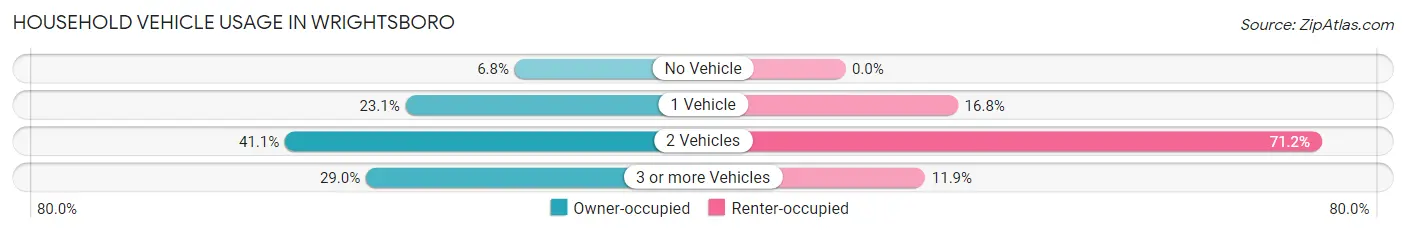
| Vehicles per Household | Owner-occupied | Renter-occupied |
| No Vehicle | 115 (6.8%) | 0 (0.0%) |
| 1 Vehicle | 392 (23.1%) | 79 (16.8%) |
| 2 Vehicles | 697 (41.1%) | 334 (71.2%) |
| 3 or more Vehicles | 492 (29.0%) | 56 (11.9%) |
| Total | 1,696 (100.0%) | 469 (100.0%) |
Real Estate & Mortgages in Wrightsboro
Real Estate and Mortgage Overview in Wrightsboro
| Characteristic | Without Mortgage | With Mortgage |
| Housing Units | 634 | 1,062 |
| Median Property Value | $169,900 | $192,500 |
| Median Household Income | $51,950 | $50 |
| Monthly Housing Costs | $429 | $0 |
| Real Estate Taxes | $996 | $31 |
Property Value by Mortgage Status in Wrightsboro
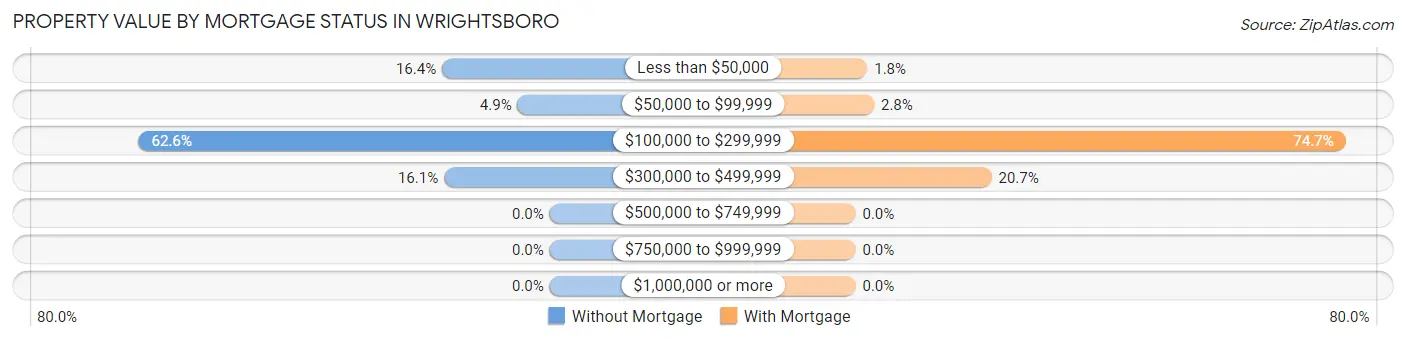
| Property Value | Without Mortgage | With Mortgage |
| Less than $50,000 | 104 (16.4%) | 19 (1.8%) |
| $50,000 to $99,999 | 31 (4.9%) | 30 (2.8%) |
| $100,000 to $299,999 | 397 (62.6%) | 793 (74.7%) |
| $300,000 to $499,999 | 102 (16.1%) | 220 (20.7%) |
| $500,000 to $749,999 | 0 (0.0%) | 0 (0.0%) |
| $750,000 to $999,999 | 0 (0.0%) | 0 (0.0%) |
| $1,000,000 or more | 0 (0.0%) | 0 (0.0%) |
| Total | 634 (100.0%) | 1,062 (100.0%) |
Household Income by Mortgage Status in Wrightsboro
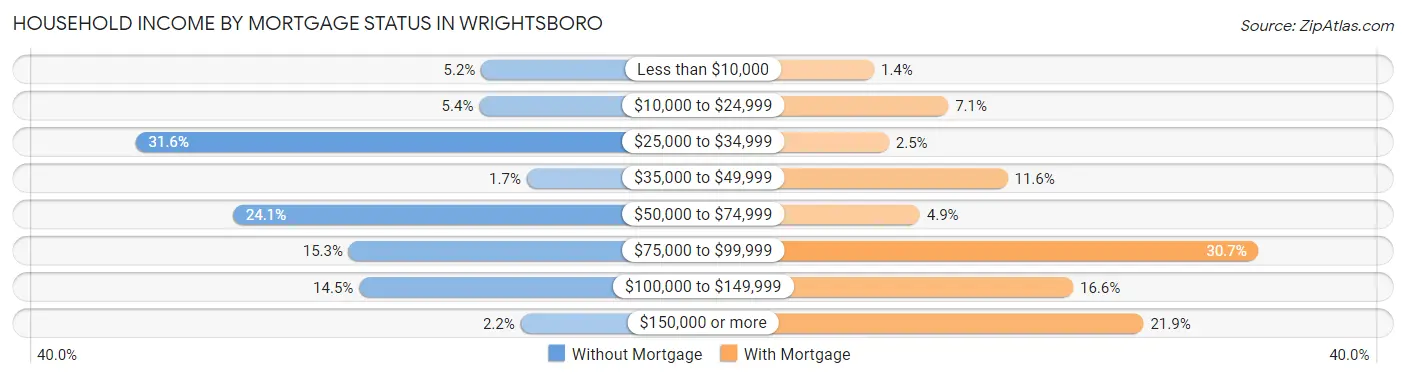
| Household Income | Without Mortgage | With Mortgage |
| Less than $10,000 | 33 (5.2%) | 15 (1.4%) |
| $10,000 to $24,999 | 34 (5.4%) | 75 (7.1%) |
| $25,000 to $34,999 | 200 (31.6%) | 27 (2.5%) |
| $35,000 to $49,999 | 11 (1.7%) | 123 (11.6%) |
| $50,000 to $74,999 | 153 (24.1%) | 52 (4.9%) |
| $75,000 to $99,999 | 97 (15.3%) | 326 (30.7%) |
| $100,000 to $149,999 | 92 (14.5%) | 176 (16.6%) |
| $150,000 or more | 14 (2.2%) | 233 (21.9%) |
| Total | 634 (100.0%) | 1,062 (100.0%) |
Property Value to Household Income Ratio in Wrightsboro
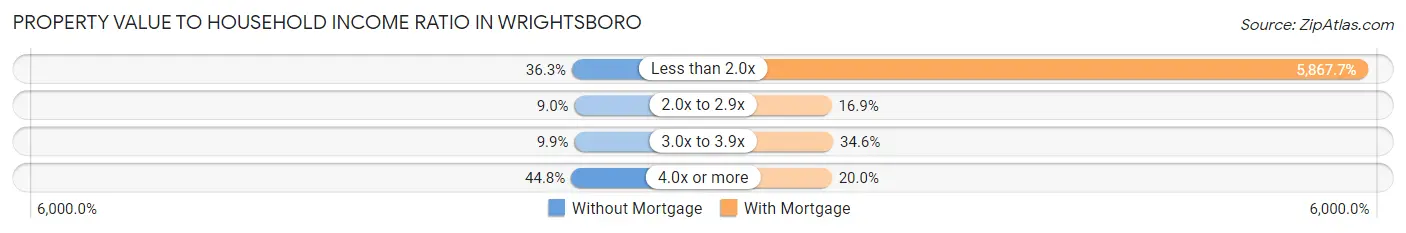
| Value-to-Income Ratio | Without Mortgage | With Mortgage |
| Less than 2.0x | 230 (36.3%) | 62,315 (5,867.7%) |
| 2.0x to 2.9x | 57 (9.0%) | 179 (16.9%) |
| 3.0x to 3.9x | 63 (9.9%) | 367 (34.6%) |
| 4.0x or more | 284 (44.8%) | 212 (20.0%) |
| Total | 634 (100.0%) | 1,062 (100.0%) |
Real Estate Taxes by Mortgage Status in Wrightsboro
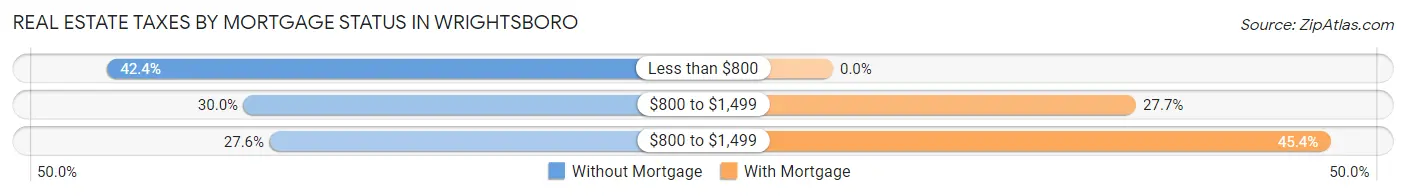
| Property Taxes | Without Mortgage | With Mortgage |
| Less than $800 | 269 (42.4%) | 0 (0.0%) |
| $800 to $1,499 | 190 (30.0%) | 294 (27.7%) |
| $800 to $1,499 | 175 (27.6%) | 482 (45.4%) |
| Total | 634 (100.0%) | 1,062 (100.0%) |
Health & Disability in Wrightsboro
Health Insurance Coverage by Age in Wrightsboro
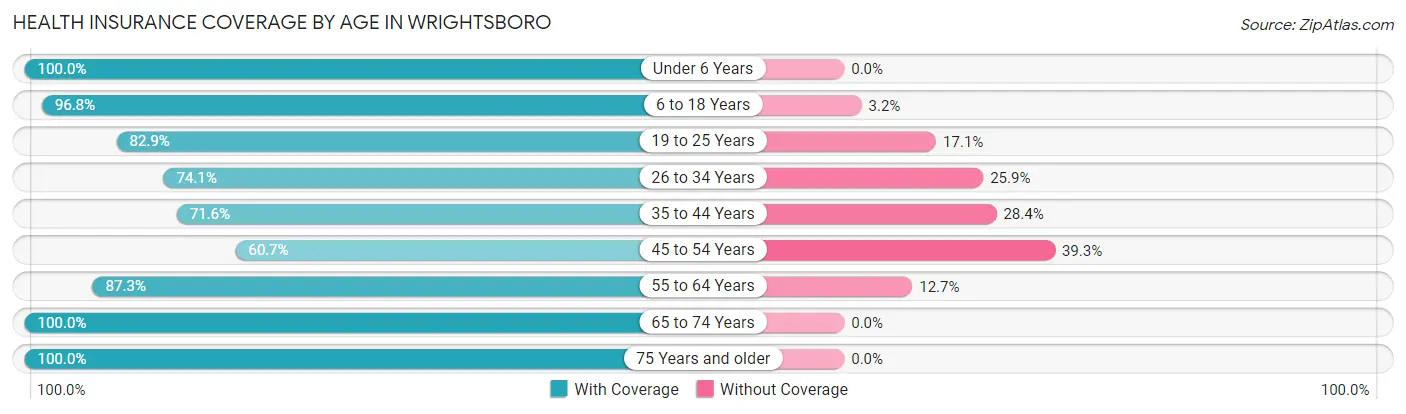
| Age Bracket | With Coverage | Without Coverage |
| Under 6 Years | 207 (100.0%) | 0 (0.0%) |
| 6 to 18 Years | 571 (96.8%) | 19 (3.2%) |
| 19 to 25 Years | 445 (82.9%) | 92 (17.1%) |
| 26 to 34 Years | 489 (74.1%) | 171 (25.9%) |
| 35 to 44 Years | 487 (71.6%) | 193 (28.4%) |
| 45 to 54 Years | 445 (60.7%) | 288 (39.3%) |
| 55 to 64 Years | 496 (87.3%) | 72 (12.7%) |
| 65 to 74 Years | 643 (100.0%) | 0 (0.0%) |
| 75 Years and older | 236 (100.0%) | 0 (0.0%) |
| Total | 4,019 (82.8%) | 835 (17.2%) |
Health Insurance Coverage by Citizenship Status in Wrightsboro
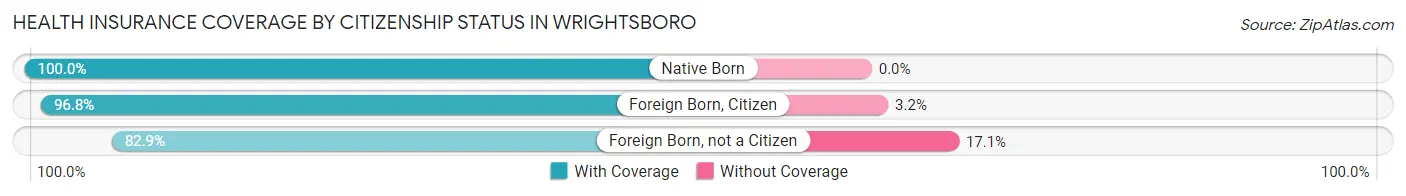
| Citizenship Status | With Coverage | Without Coverage |
| Native Born | 207 (100.0%) | 0 (0.0%) |
| Foreign Born, Citizen | 571 (96.8%) | 19 (3.2%) |
| Foreign Born, not a Citizen | 445 (82.9%) | 92 (17.1%) |
Health Insurance Coverage by Household Income in Wrightsboro
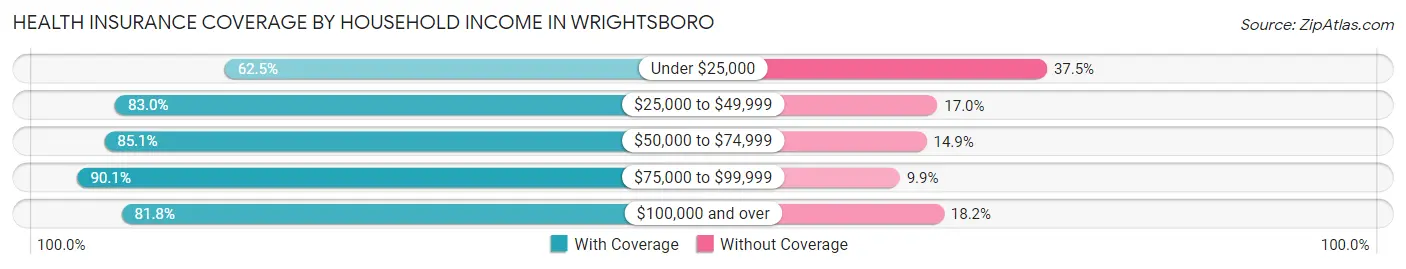
| Household Income | With Coverage | Without Coverage |
| Under $25,000 | 275 (62.5%) | 165 (37.5%) |
| $25,000 to $49,999 | 763 (83.0%) | 156 (17.0%) |
| $50,000 to $74,999 | 888 (85.1%) | 156 (14.9%) |
| $75,000 to $99,999 | 954 (90.1%) | 105 (9.9%) |
| $100,000 and over | 1,139 (81.8%) | 253 (18.2%) |
Public vs Private Health Insurance Coverage by Age in Wrightsboro
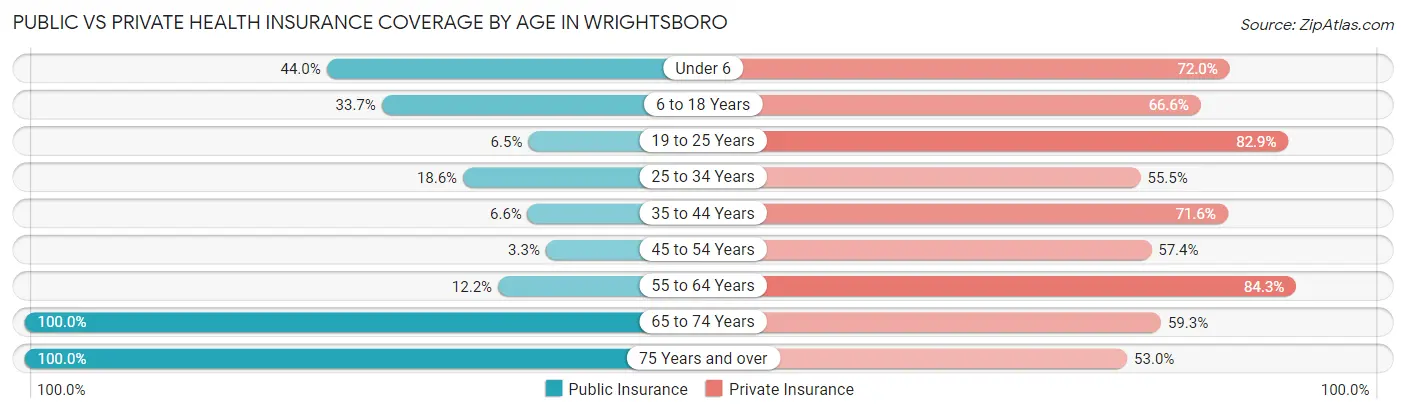
| Age Bracket | Public Insurance | Private Insurance |
| Under 6 | 91 (44.0%) | 149 (72.0%) |
| 6 to 18 Years | 199 (33.7%) | 393 (66.6%) |
| 19 to 25 Years | 35 (6.5%) | 445 (82.9%) |
| 25 to 34 Years | 123 (18.6%) | 366 (55.4%) |
| 35 to 44 Years | 45 (6.6%) | 487 (71.6%) |
| 45 to 54 Years | 24 (3.3%) | 421 (57.4%) |
| 55 to 64 Years | 69 (12.1%) | 479 (84.3%) |
| 65 to 74 Years | 643 (100.0%) | 381 (59.3%) |
| 75 Years and over | 236 (100.0%) | 125 (53.0%) |
| Total | 1,465 (30.2%) | 3,246 (66.9%) |
Disability Status by Sex by Age in Wrightsboro
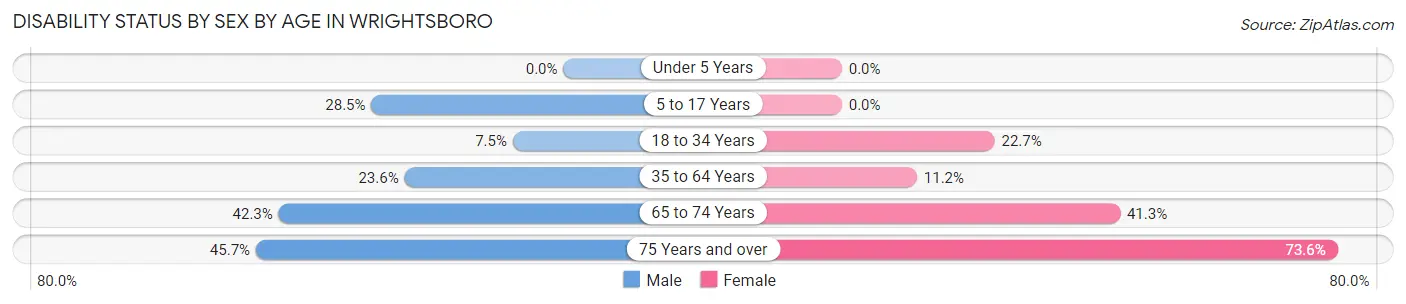
| Age Bracket | Male | Female |
| Under 5 Years | 0 (0.0%) | 0 (0.0%) |
| 5 to 17 Years | 65 (28.5%) | 0 (0.0%) |
| 18 to 34 Years | 34 (7.5%) | 176 (22.7%) |
| 35 to 64 Years | 222 (23.6%) | 116 (11.2%) |
| 65 to 74 Years | 104 (42.3%) | 164 (41.3%) |
| 75 Years and over | 42 (45.7%) | 106 (73.6%) |
Disability Class by Sex by Age in Wrightsboro
Disability Class: Hearing Difficulty
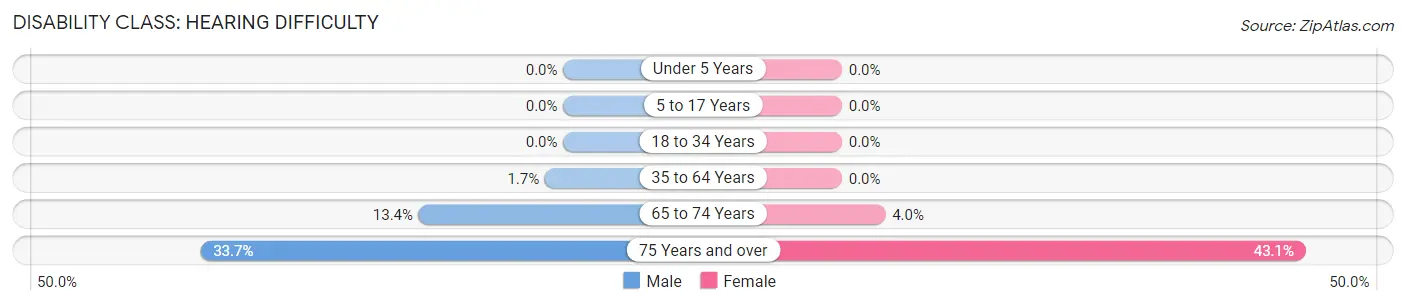
| Age Bracket | Male | Female |
| Under 5 Years | 0 (0.0%) | 0 (0.0%) |
| 5 to 17 Years | 0 (0.0%) | 0 (0.0%) |
| 18 to 34 Years | 0 (0.0%) | 0 (0.0%) |
| 35 to 64 Years | 16 (1.7%) | 0 (0.0%) |
| 65 to 74 Years | 33 (13.4%) | 16 (4.0%) |
| 75 Years and over | 31 (33.7%) | 62 (43.1%) |
Disability Class: Vision Difficulty
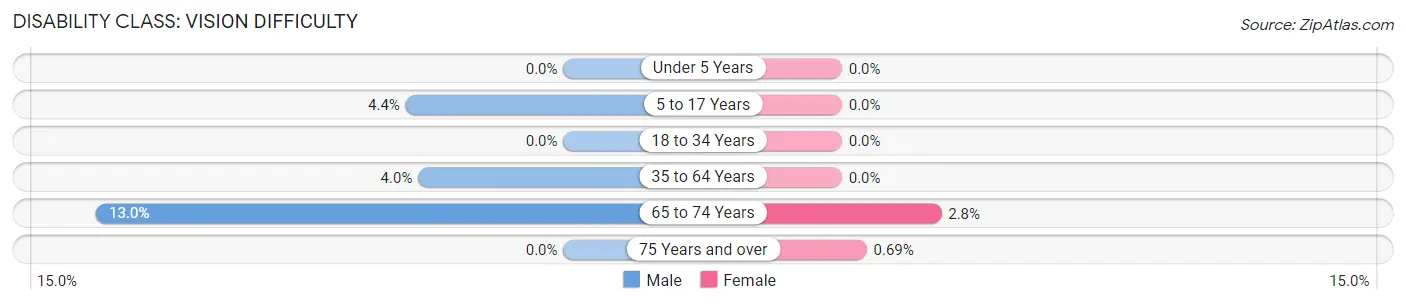
| Age Bracket | Male | Female |
| Under 5 Years | 0 (0.0%) | 0 (0.0%) |
| 5 to 17 Years | 10 (4.4%) | 0 (0.0%) |
| 18 to 34 Years | 0 (0.0%) | 0 (0.0%) |
| 35 to 64 Years | 38 (4.0%) | 0 (0.0%) |
| 65 to 74 Years | 32 (13.0%) | 11 (2.8%) |
| 75 Years and over | 0 (0.0%) | 1 (0.7%) |
Disability Class: Cognitive Difficulty
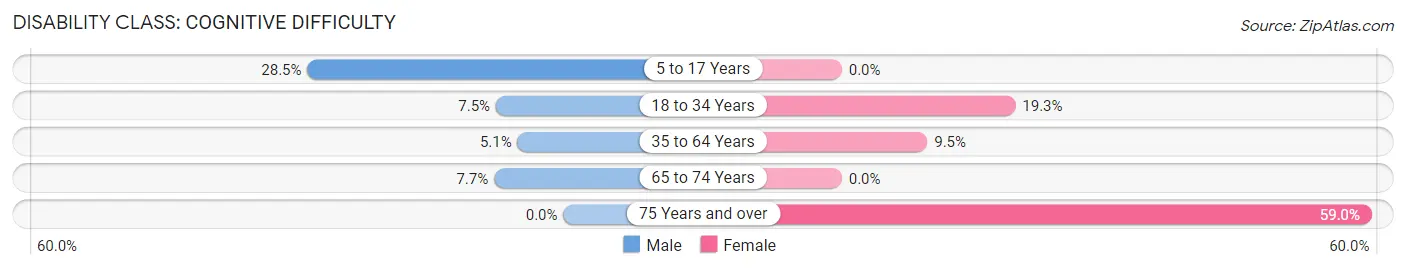
| Age Bracket | Male | Female |
| 5 to 17 Years | 65 (28.5%) | 0 (0.0%) |
| 18 to 34 Years | 34 (7.5%) | 150 (19.3%) |
| 35 to 64 Years | 48 (5.1%) | 99 (9.5%) |
| 65 to 74 Years | 19 (7.7%) | 0 (0.0%) |
| 75 Years and over | 0 (0.0%) | 85 (59.0%) |
Disability Class: Ambulatory Difficulty
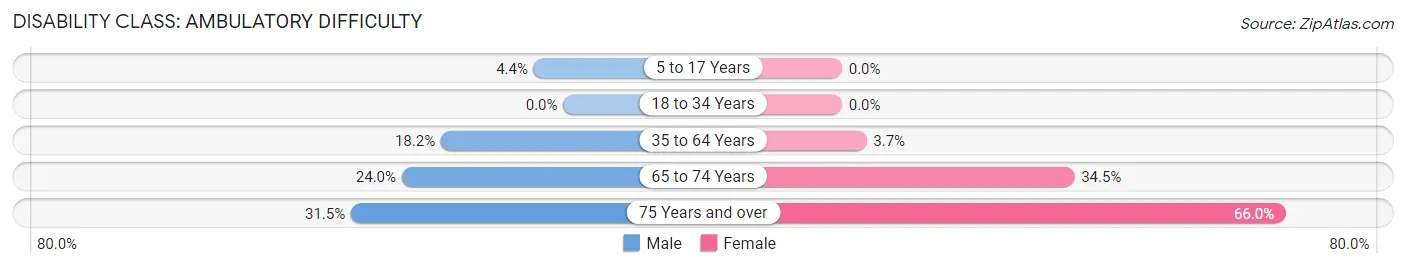
| Age Bracket | Male | Female |
| 5 to 17 Years | 10 (4.4%) | 0 (0.0%) |
| 18 to 34 Years | 0 (0.0%) | 0 (0.0%) |
| 35 to 64 Years | 171 (18.2%) | 38 (3.6%) |
| 65 to 74 Years | 59 (24.0%) | 137 (34.5%) |
| 75 Years and over | 29 (31.5%) | 95 (66.0%) |
Disability Class: Self-Care Difficulty
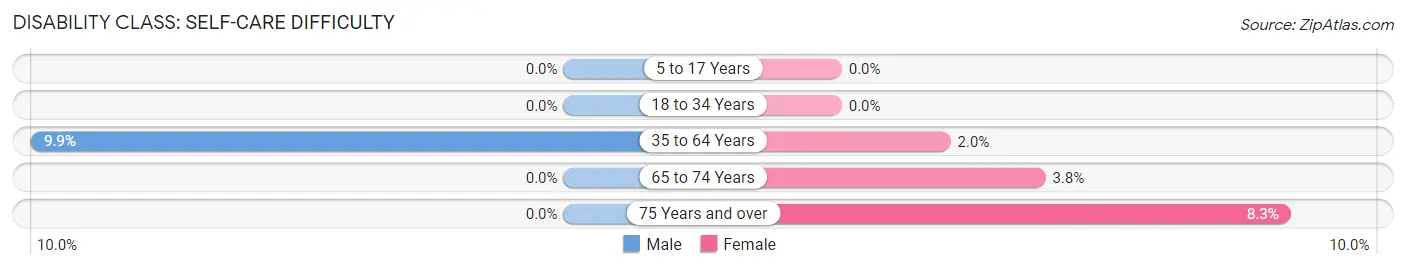
| Age Bracket | Male | Female |
| 5 to 17 Years | 0 (0.0%) | 0 (0.0%) |
| 18 to 34 Years | 0 (0.0%) | 0 (0.0%) |
| 35 to 64 Years | 93 (9.9%) | 21 (2.0%) |
| 65 to 74 Years | 0 (0.0%) | 15 (3.8%) |
| 75 Years and over | 0 (0.0%) | 12 (8.3%) |
Technology Access in Wrightsboro
Computing Device Access in Wrightsboro
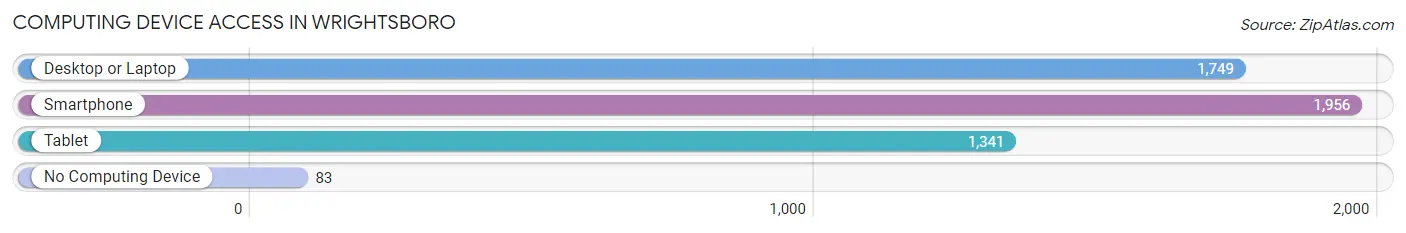
| Device Type | # Households | % Households |
| Desktop or Laptop | 1,749 | 80.8% |
| Smartphone | 1,956 | 90.3% |
| Tablet | 1,341 | 61.9% |
| No Computing Device | 83 | 3.8% |
| Total | 2,165 | 100.0% |
Internet Access in Wrightsboro

| Internet Type | # Households | % Households |
| Dial-Up Internet | 0 | 0.0% |
| Broadband Home | 1,596 | 73.7% |
| Cellular Data Only | 313 | 14.5% |
| Satellite Internet | 26 | 1.2% |
| No Internet | 239 | 11.0% |
| Total | 2,165 | 100.0% |
Wrightsboro Summary
Wrightsboro is an unincorporated community located in New Hanover County, North Carolina. It is situated on the banks of the Cape Fear River, approximately 10 miles south of Wilmington. The community is home to a population of approximately 1,000 people and is part of the Wilmington Metropolitan Statistical Area.
History
Wrightsboro was first settled in the late 1700s by a group of Quakers from Pennsylvania. The community was named after the Wright family, who were among the first settlers. The Wrights were farmers and operated a ferry across the Cape Fear River. The ferry was used to transport goods and people between Wilmington and the surrounding areas.
In the early 1800s, the community began to grow and develop. A post office was established in 1820 and a school was built in 1825. The community also had a general store, a blacksmith shop, and a grist mill.
In the late 1800s, the community began to decline. The post office was closed in 1891 and the school was closed in 1895. The decline was due to the lack of economic opportunities in the area.
Geography
Wrightsboro is located in southeastern North Carolina, approximately 10 miles south of Wilmington. The community is situated on the banks of the Cape Fear River. The terrain is mostly flat and the climate is humid subtropical.
The community is part of the Wilmington Metropolitan Statistical Area. The nearest cities are Wilmington, Leland, and Burgaw.
Economy
The economy of Wrightsboro is largely based on agriculture. The community is home to several farms that produce a variety of crops, including corn, soybeans, and cotton.
The community also has a few small businesses, including a convenience store, a gas station, and a restaurant.
Demographics
As of the 2010 census, the population of Wrightsboro was 1,000. The racial makeup of the community was 94.7% White, 2.7% African American, 0.7% Native American, 0.3% Asian, and 1.3% from other races.
The median household income in Wrightsboro was $37,500, and the median family income was $41,250. The per capita income was $17,500. Approximately 10.7% of the population was below the poverty line.
Conclusion
Wrightsboro is an unincorporated community located in New Hanover County, North Carolina. It is situated on the banks of the Cape Fear River, approximately 10 miles south of Wilmington. The community is home to a population of approximately 1,000 people and is part of the Wilmington Metropolitan Statistical Area. The economy of Wrightsboro is largely based on agriculture, and the community also has a few small businesses. The racial makeup of the community is 94.7% White, 2.7% African American, 0.7% Native American, 0.3% Asian, and 1.3% from other races. The median household income in Wrightsboro was $37,500, and the median family income was $41,250. Approximately 10.7% of the population was below the poverty line.
Common Questions
What is the Total Population of Wrightsboro?
Total Population of Wrightsboro is 4,876.
What is the Total Male Population of Wrightsboro?
Total Male Population of Wrightsboro is 2,020.
What is the Total Female Population of Wrightsboro?
Total Female Population of Wrightsboro is 2,856.
What is the Ratio of Males per 100 Females in Wrightsboro?
There are 70.73 Males per 100 Females in Wrightsboro.
What is the Ratio of Females per 100 Males in Wrightsboro?
There are 141.39 Females per 100 Males in Wrightsboro.
What is the Median Population Age in Wrightsboro?
Median Population Age in Wrightsboro is 41.2 Years.
What is the Average Family Size in Wrightsboro
Average Family Size in Wrightsboro is 2.9 People.
What is the Average Household Size in Wrightsboro
Average Household Size in Wrightsboro is 2.2 People.
What is Per Capita Income in Wrightsboro?
Per Capita income in Wrightsboro is $30,188.
What is the Median Family Income in Wrightsboro?
Median Family Income in Wrightsboro is $67,406.
What is the Median Household income in Wrightsboro?
Median Household Income in Wrightsboro is $56,719.
What is Income or Wage Gap in Wrightsboro?
Income or Wage Gap in Wrightsboro is 49.7%.
Women in Wrightsboro earn 50.3 cents for every dollar earned by a man.
What is Inequality or Gini Index in Wrightsboro?
Inequality or Gini Index in Wrightsboro is 0.34.
How Large is the Labor Force in Wrightsboro?
There are 2,790 People in the Labor Forcein in Wrightsboro.
What is the Percentage of People in the Labor Force in Wrightsboro?
66.2% of People are in the Labor Force in Wrightsboro.
What is the Unemployment Rate in Wrightsboro?
Unemployment Rate in Wrightsboro is 1.9%.