Navassa, NC
Navassa Map
Navassa Overview
1,976
TOTAL POPULATION
818
MALE POPULATION
1,158
FEMALE POPULATION
70.64
MALES / 100 FEMALES
141.56
FEMALES / 100 MALES
32.7
MEDIAN AGE
3.6
AVG FAMILY SIZE
3.1
AVG HOUSEHOLD SIZE
$20,939
PER CAPITA INCOME
$57,303
AVG FAMILY INCOME
$50,694
AVG HOUSEHOLD INCOME
27.8%
WAGE / INCOME GAP [ % ]
72.2¢/ $1
WAGE / INCOME GAP [ $ ]
0.37
INEQUALITY / GINI INDEX
814
LABOR FORCE [ PEOPLE ]
49.9%
PERCENT IN LABOR FORCE
5.9%
UNEMPLOYMENT RATE
Navassa Area Codes
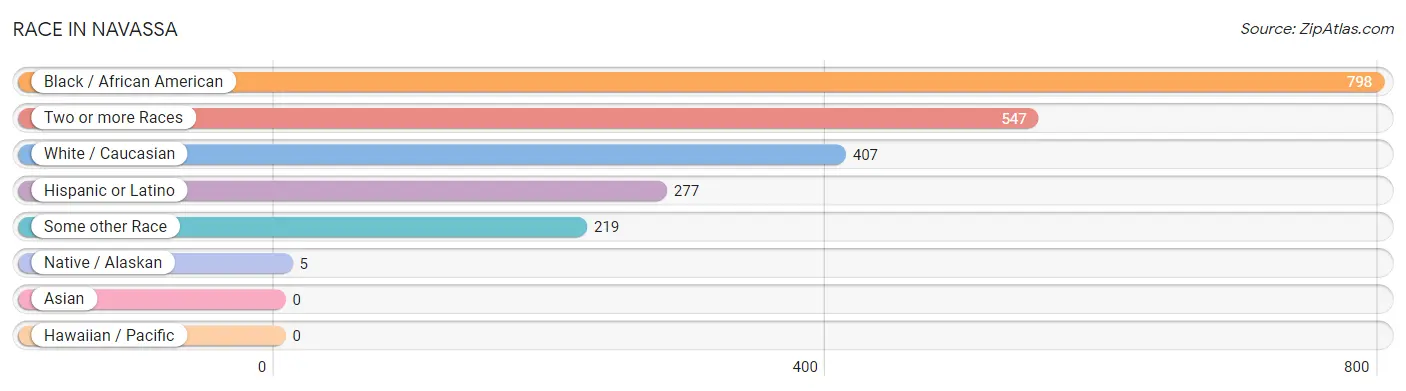
Race in Navassa
The most populous races in Navassa are Black / African American (798 | 40.4%), Two or more Races (547 | 27.7%), and White / Caucasian (407 | 20.6%).
| Race | # Population | % Population |
| Asian | 0 | 0.0% |
| Black / African American | 798 | 40.4% |
| Hawaiian / Pacific | 0 | 0.0% |
| Hispanic or Latino | 277 | 14.0% |
| Native / Alaskan | 5 | 0.3% |
| White / Caucasian | 407 | 20.6% |
| Two or more Races | 547 | 27.7% |
| Some other Race | 219 | 11.1% |
| Total | 1,976 | 100.0% |
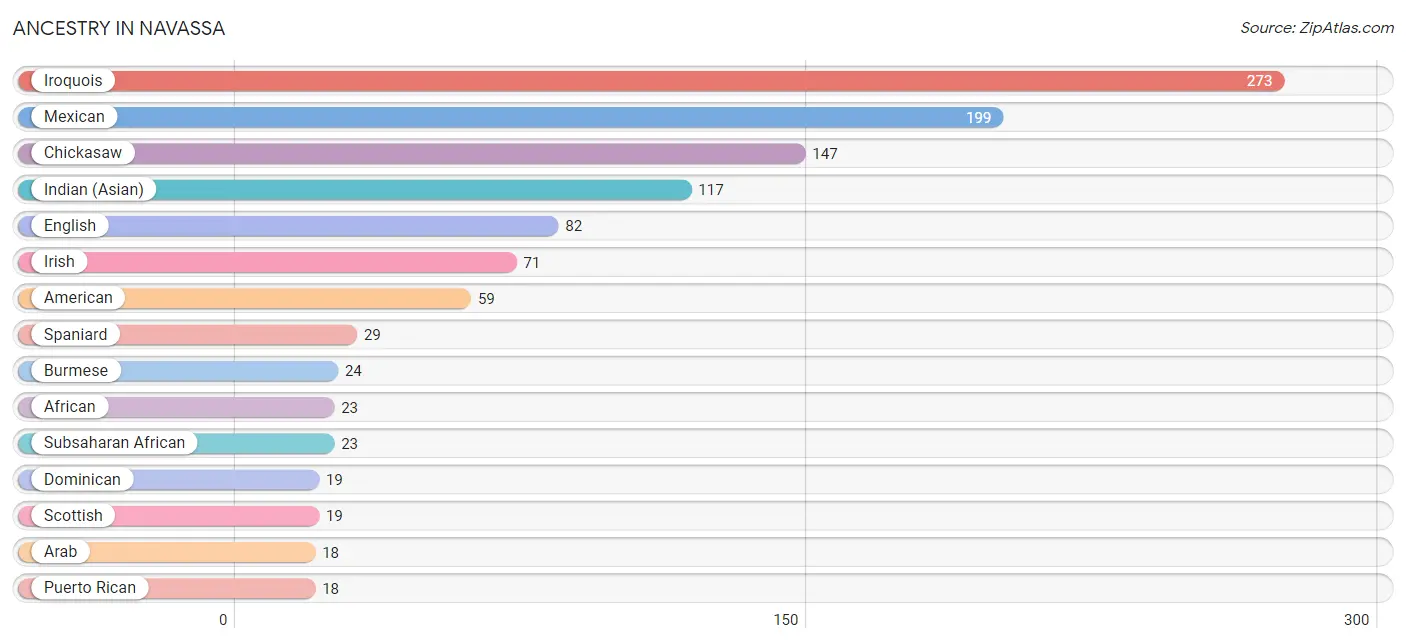
Ancestry in Navassa
The most populous ancestries reported in Navassa are Iroquois (273 | 13.8%), Mexican (199 | 10.1%), Chickasaw (147 | 7.4%), Indian (Asian) (117 | 5.9%), and English (82 | 4.2%), together accounting for 41.4% of all Navassa residents.
| Ancestry | # Population | % Population |
| African | 23 | 1.2% |
| American | 59 | 3.0% |
| Arab | 18 | 0.9% |
| Burmese | 24 | 1.2% |
| Central American | 12 | 0.6% |
| Cherokee | 2 | 0.1% |
| Chickasaw | 147 | 7.4% |
| Dominican | 19 | 1.0% |
| English | 82 | 4.2% |
| European | 11 | 0.6% |
| French | 3 | 0.2% |
| German | 17 | 0.9% |
| Honduran | 12 | 0.6% |
| Indian (Asian) | 117 | 5.9% |
| Irish | 71 | 3.6% |
| Iroquois | 273 | 13.8% |
| Italian | 15 | 0.8% |
| Lumbee | 5 | 0.3% |
| Mexican | 199 | 10.1% |
| Polish | 2 | 0.1% |
| Puerto Rican | 18 | 0.9% |
| Russian | 5 | 0.3% |
| Scotch-Irish | 5 | 0.3% |
| Scottish | 19 | 1.0% |
| Spaniard | 29 | 1.5% |
| Subsaharan African | 23 | 1.2% | View All 26 Rows |
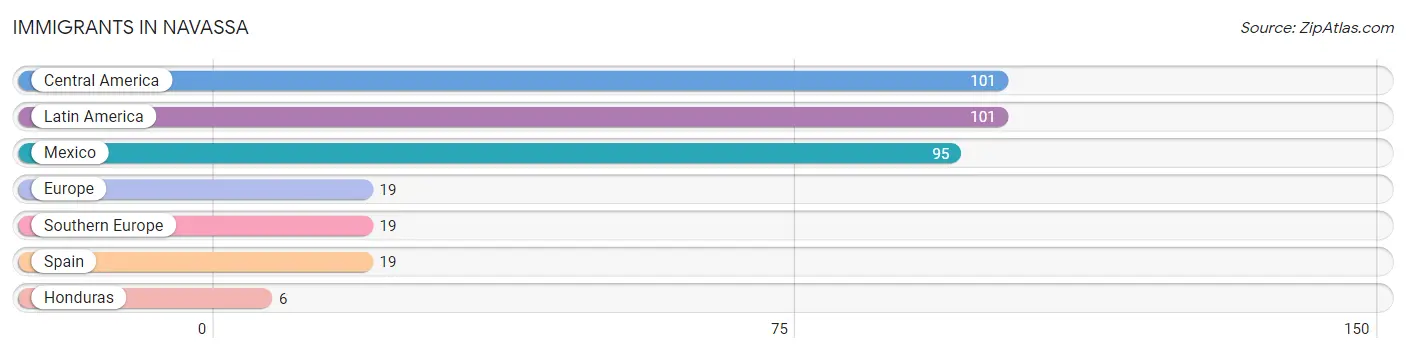
Immigrants in Navassa
The most numerous immigrant groups reported in Navassa came from Central America (101 | 5.1%), Latin America (101 | 5.1%), Mexico (95 | 4.8%), Europe (19 | 1.0%), and Southern Europe (19 | 1.0%), together accounting for 16.9% of all Navassa residents.
| Immigration Origin | # Population | % Population |
| Central America | 101 | 5.1% |
| Europe | 19 | 1.0% |
| Honduras | 6 | 0.3% |
| Latin America | 101 | 5.1% |
| Mexico | 95 | 4.8% |
| Southern Europe | 19 | 1.0% |
| Spain | 19 | 1.0% | View All 7 Rows |
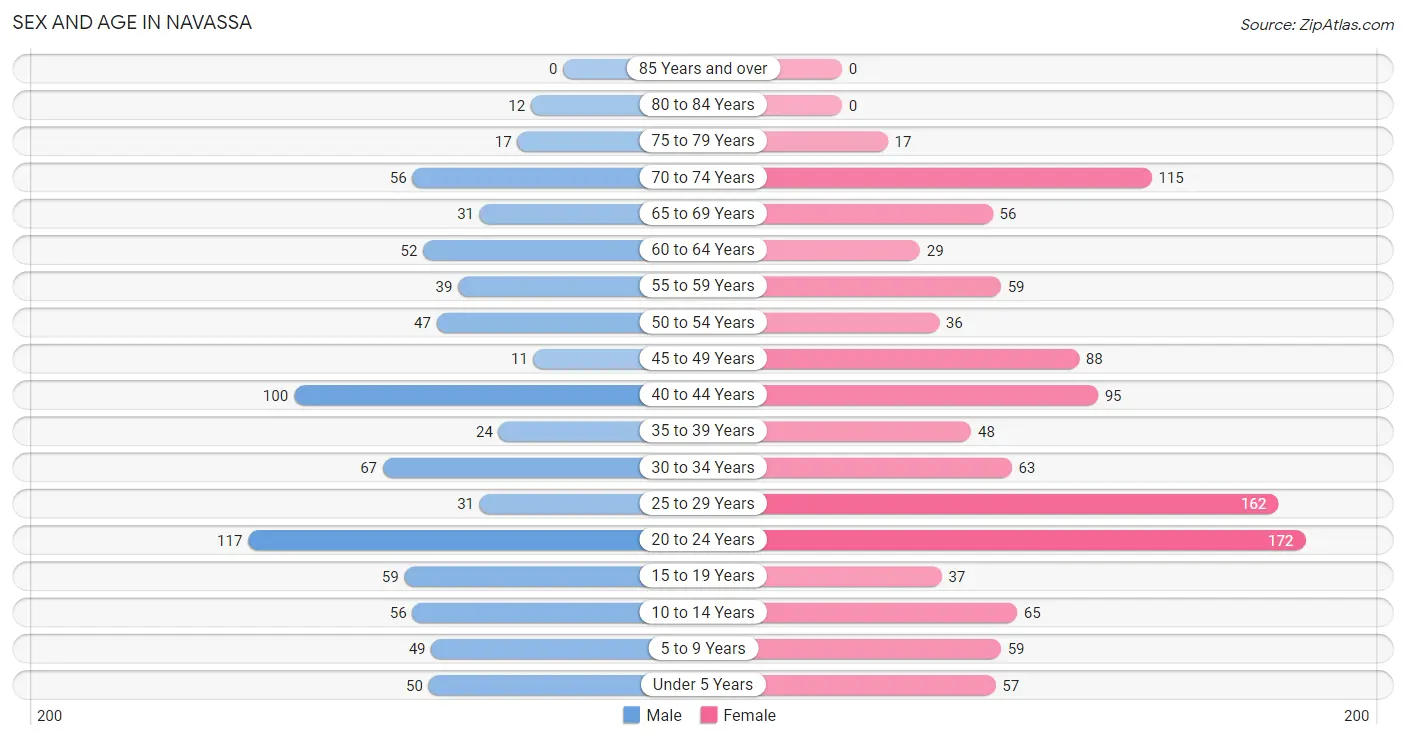
Sex and Age in Navassa
Sex and Age in Navassa
The most populous age groups in Navassa are 20 to 24 Years (117 | 14.3%) for men and 20 to 24 Years (172 | 14.8%) for women.
| Age Bracket | Male | Female |
| Under 5 Years | 50 (6.1%) | 57 (4.9%) |
| 5 to 9 Years | 49 (6.0%) | 59 (5.1%) |
| 10 to 14 Years | 56 (6.9%) | 65 (5.6%) |
| 15 to 19 Years | 59 (7.2%) | 37 (3.2%) |
| 20 to 24 Years | 117 (14.3%) | 172 (14.8%) |
| 25 to 29 Years | 31 (3.8%) | 162 (14.0%) |
| 30 to 34 Years | 67 (8.2%) | 63 (5.4%) |
| 35 to 39 Years | 24 (2.9%) | 48 (4.2%) |
| 40 to 44 Years | 100 (12.2%) | 95 (8.2%) |
| 45 to 49 Years | 11 (1.3%) | 88 (7.6%) |
| 50 to 54 Years | 47 (5.8%) | 36 (3.1%) |
| 55 to 59 Years | 39 (4.8%) | 59 (5.1%) |
| 60 to 64 Years | 52 (6.4%) | 29 (2.5%) |
| 65 to 69 Years | 31 (3.8%) | 56 (4.8%) |
| 70 to 74 Years | 56 (6.9%) | 115 (9.9%) |
| 75 to 79 Years | 17 (2.1%) | 17 (1.5%) |
| 80 to 84 Years | 12 (1.5%) | 0 (0.0%) |
| 85 Years and over | 0 (0.0%) | 0 (0.0%) |
| Total | 818 (100.0%) | 1,158 (100.0%) |
Families and Households in Navassa
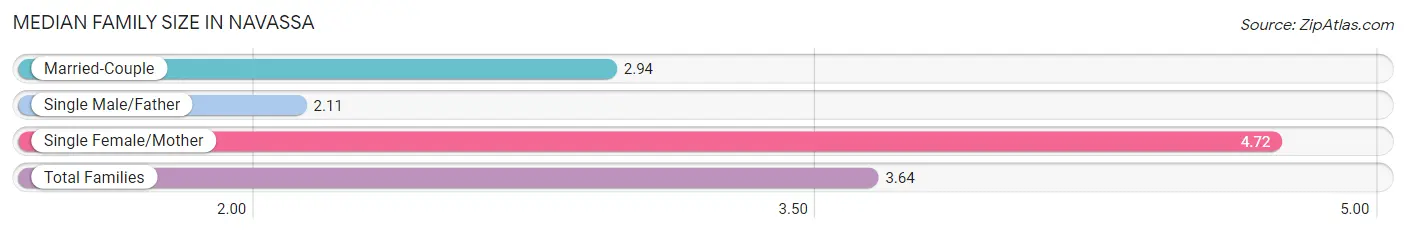
Median Family Size in Navassa
The median family size in Navassa is 3.64 persons per family, with single female/mother families (188 | 42.1%) accounting for the largest median family size of 4.72 persons per family. On the other hand, single male/father families (27 | 6.0%) represent the smallest median family size with 2.11 persons per family.
| Family Type | # Families | Family Size |
| Married-Couple | 232 (51.9%) | 2.94 |
| Single Male/Father | 27 (6.0%) | 2.11 |
| Single Female/Mother | 188 (42.1%) | 4.72 |
| Total Families | 447 (100.0%) | 3.64 |
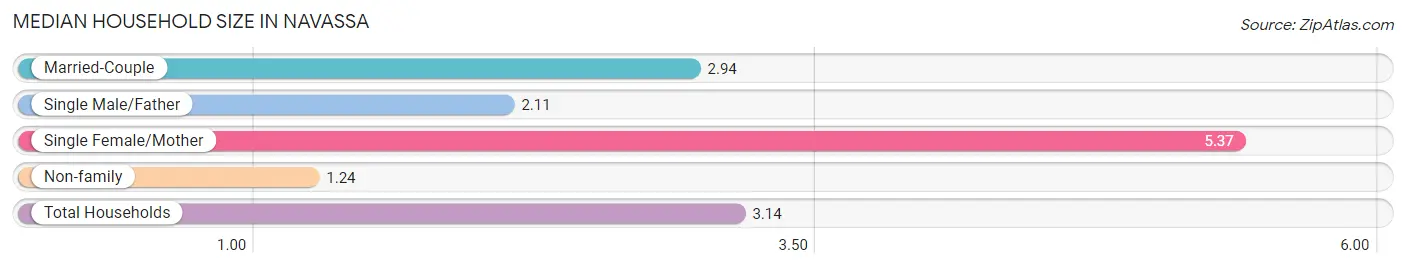
Median Household Size in Navassa
The median household size in Navassa is 3.14 persons per household, with single female/mother households (188 | 29.8%) accounting for the largest median household size of 5.37 persons per household. non-family households (183 | 29.0%) represent the smallest median household size with 1.24 persons per household.
| Household Type | # Households | Household Size |
| Married-Couple | 232 (36.8%) | 2.94 |
| Single Male/Father | 27 (4.3%) | 2.11 |
| Single Female/Mother | 188 (29.8%) | 5.37 |
| Non-family | 183 (29.0%) | 1.24 |
| Total Households | 630 (100.0%) | 3.14 |
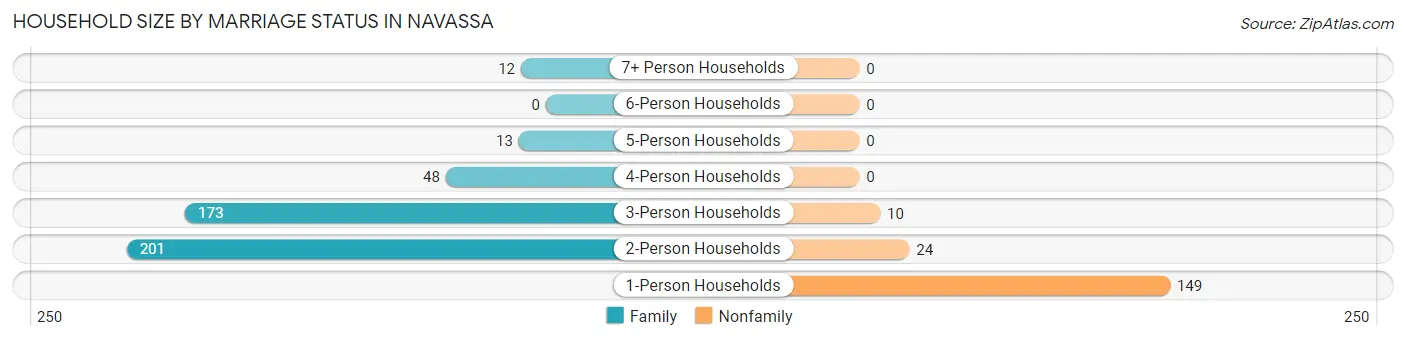
Household Size by Marriage Status in Navassa
Out of a total of 630 households in Navassa, 447 (71.0%) are family households, while 183 (29.0%) are nonfamily households. The most numerous type of family households are 2-person households, comprising 201, and the most common type of nonfamily households are 1-person households, comprising 149.
| Household Size | Family Households | Nonfamily Households |
| 1-Person Households | - | 149 (23.6%) |
| 2-Person Households | 201 (31.9%) | 24 (3.8%) |
| 3-Person Households | 173 (27.5%) | 10 (1.6%) |
| 4-Person Households | 48 (7.6%) | 0 (0.0%) |
| 5-Person Households | 13 (2.1%) | 0 (0.0%) |
| 6-Person Households | 0 (0.0%) | 0 (0.0%) |
| 7+ Person Households | 12 (1.9%) | 0 (0.0%) |
| Total | 447 (71.0%) | 183 (29.0%) |
Female Fertility in Navassa
Fertility by Age in Navassa
Average fertility rate in Navassa is 18.0 births per 1,000 women. Women in the age bracket of 35 to 50 years have the highest fertility rate with 21.0 births per 1,000 women. Women in the age bracket of 20 to 34 years acount for 58.3% of all women with births.
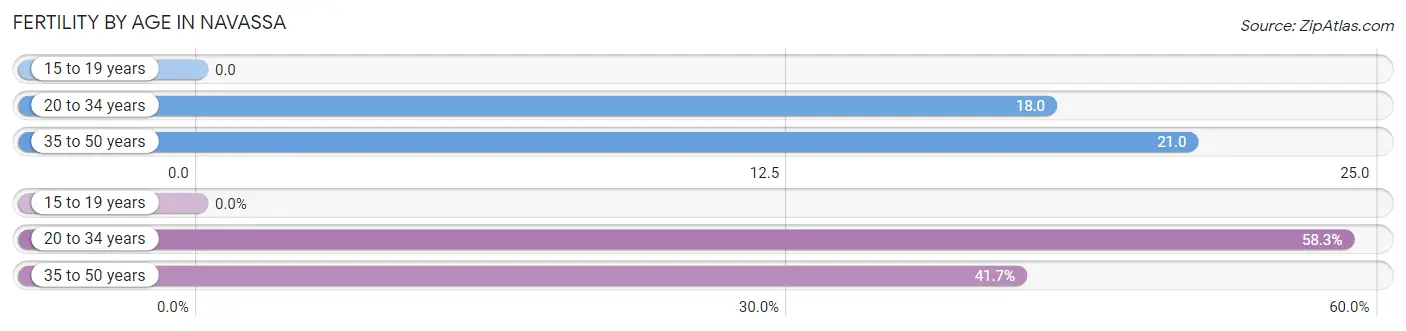
| Age Bracket | Women with Births | Births / 1,000 Women |
| 15 to 19 years | 0 (0.0%) | 0.0 |
| 20 to 34 years | 7 (58.3%) | 18.0 |
| 35 to 50 years | 5 (41.7%) | 21.0 |
| Total | 12 (100.0%) | 18.0 |
Fertility by Age by Marriage Status in Navassa
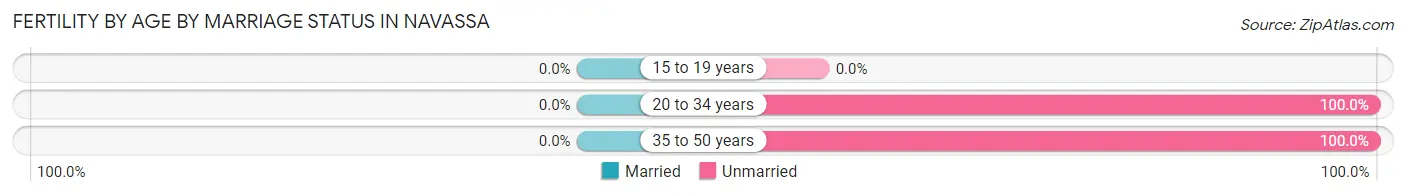
| Age Bracket | Married | Unmarried |
| 15 to 19 years | 0 (0.0%) | 0 (0.0%) |
| 20 to 34 years | 0 (0.0%) | 7 (100.0%) |
| 35 to 50 years | 0 (0.0%) | 5 (100.0%) |
| Total | 0 (0.0%) | 12 (100.0%) |
Fertility by Education in Navassa
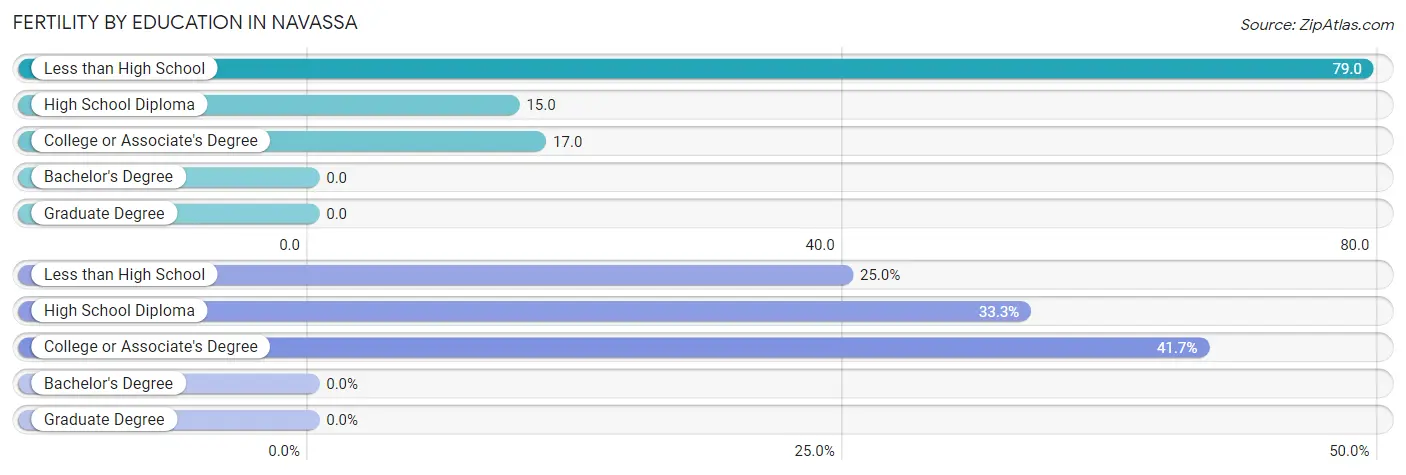
| Educational Attainment | Women with Births | Births / 1,000 Women |
| Less than High School | 3 (25.0%) | 79.0 |
| High School Diploma | 4 (33.3%) | 15.0 |
| College or Associate's Degree | 5 (41.7%) | 17.0 |
| Bachelor's Degree | 0 (0.0%) | 0.0 |
| Graduate Degree | 0 (0.0%) | 0.0 |
| Total | 12 (100.0%) | 18.0 |
Fertility by Education by Marriage Status in Navassa
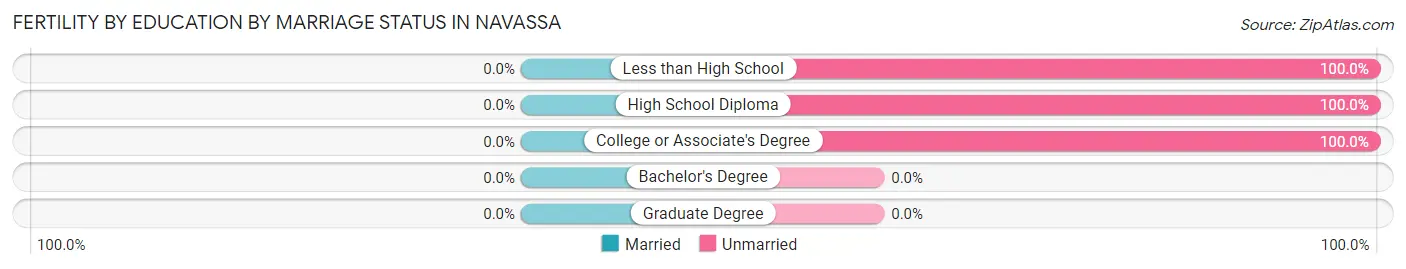
| Educational Attainment | Married | Unmarried |
| Less than High School | 0 (0.0%) | 3 (100.0%) |
| High School Diploma | 0 (0.0%) | 4 (100.0%) |
| College or Associate's Degree | 0 (0.0%) | 5 (100.0%) |
| Bachelor's Degree | 0 (0.0%) | 0 (0.0%) |
| Graduate Degree | 0 (0.0%) | 0 (0.0%) |
| Total | 0 (0.0%) | 12 (100.0%) |
Income in Navassa
Income Overview in Navassa
Per Capita Income in Navassa is $20,939, while median incomes of families and households are $57,303 and $50,694 respectively.
| Characteristic | Number | Measure |
| Per Capita Income | 1,976 | $20,939 |
| Median Family Income | 447 | $57,303 |
| Mean Family Income | 447 | $61,351 |
| Median Household Income | 630 | $50,694 |
| Mean Household Income | 630 | $55,589 |
| Income Deficit | 447 | $0 |
| Wage / Income Gap (%) | 1,976 | 27.83% |
| Wage / Income Gap ($) | 1,976 | 72.17¢ per $1 |
| Gini / Inequality Index | 1,976 | 0.37 |
Earnings by Sex in Navassa
Average Earnings in Navassa are $24,315, $30,066 for men and $21,700 for women, a difference of 27.8%.
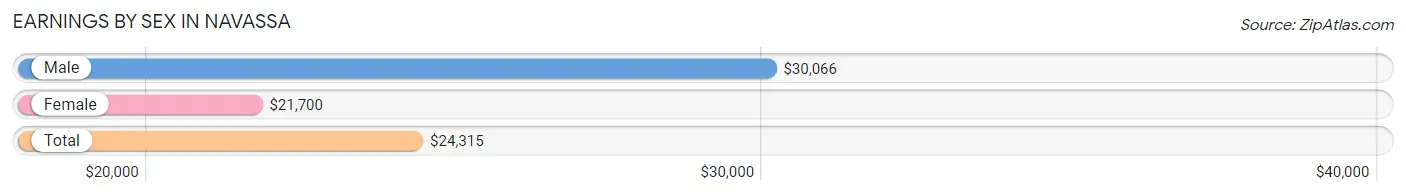
| Sex | Number | Average Earnings |
| Male | 393 (40.4%) | $30,066 |
| Female | 580 (59.6%) | $21,700 |
| Total | 973 (100.0%) | $24,315 |
Earnings by Sex by Income Bracket in Navassa
The most common earnings brackets in Navassa are $5,000 to $7,499 for men (61 | 15.5%) and $5,000 to $7,499 for women (162 | 27.9%).
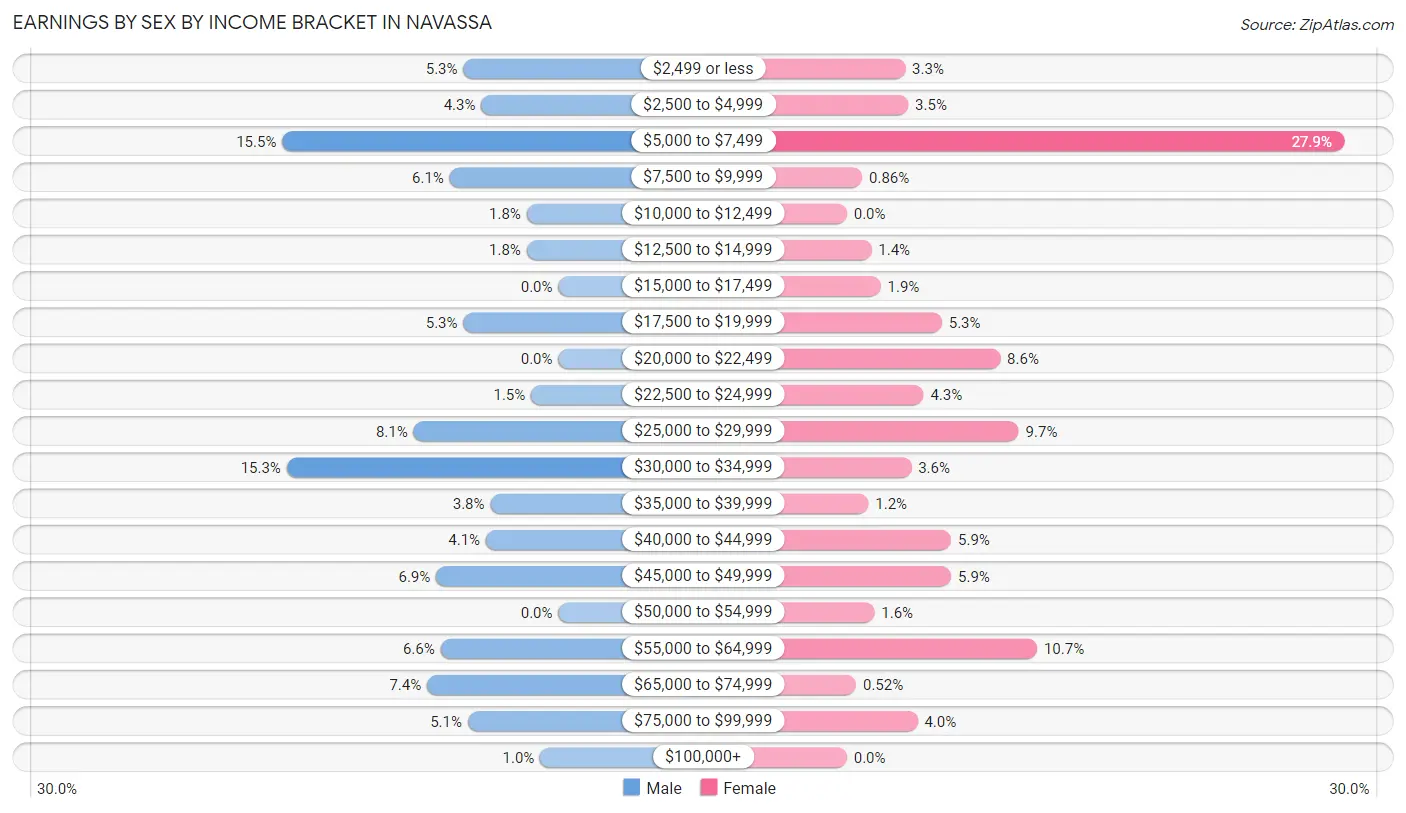
| Income | Male | Female |
| $2,499 or less | 21 (5.3%) | 19 (3.3%) |
| $2,500 to $4,999 | 17 (4.3%) | 20 (3.5%) |
| $5,000 to $7,499 | 61 (15.5%) | 162 (27.9%) |
| $7,500 to $9,999 | 24 (6.1%) | 5 (0.9%) |
| $10,000 to $12,499 | 7 (1.8%) | 0 (0.0%) |
| $12,500 to $14,999 | 7 (1.8%) | 8 (1.4%) |
| $15,000 to $17,499 | 0 (0.0%) | 11 (1.9%) |
| $17,500 to $19,999 | 21 (5.3%) | 31 (5.3%) |
| $20,000 to $22,499 | 0 (0.0%) | 50 (8.6%) |
| $22,500 to $24,999 | 6 (1.5%) | 25 (4.3%) |
| $25,000 to $29,999 | 32 (8.1%) | 56 (9.7%) |
| $30,000 to $34,999 | 60 (15.3%) | 21 (3.6%) |
| $35,000 to $39,999 | 15 (3.8%) | 7 (1.2%) |
| $40,000 to $44,999 | 16 (4.1%) | 34 (5.9%) |
| $45,000 to $49,999 | 27 (6.9%) | 34 (5.9%) |
| $50,000 to $54,999 | 0 (0.0%) | 9 (1.5%) |
| $55,000 to $64,999 | 26 (6.6%) | 62 (10.7%) |
| $65,000 to $74,999 | 29 (7.4%) | 3 (0.5%) |
| $75,000 to $99,999 | 20 (5.1%) | 23 (4.0%) |
| $100,000+ | 4 (1.0%) | 0 (0.0%) |
| Total | 393 (100.0%) | 580 (100.0%) |
Earnings by Sex by Educational Attainment in Navassa
Average earnings in Navassa are $33,110 for men and $29,154 for women, a difference of 11.9%. Men with an educational attainment of bachelor's degree enjoy the highest average annual earnings of $45,833, while those with high school diploma education earn the least with $28,750. Women with an educational attainment of graduate degree earn the most with the average annual earnings of $53,250, while those with less than high school education have the smallest earnings of $2,499.
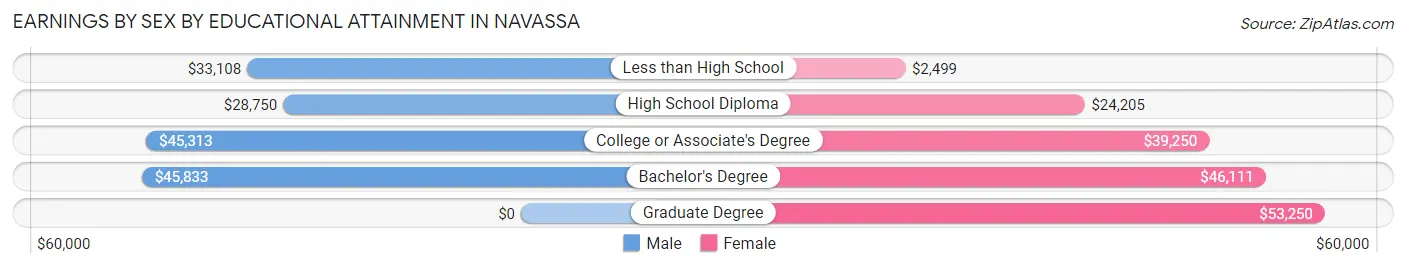
| Educational Attainment | Male Income | Female Income |
| Less than High School | $33,108 | $2,499 |
| High School Diploma | $28,750 | $24,205 |
| College or Associate's Degree | $45,313 | $39,250 |
| Bachelor's Degree | $45,833 | $46,111 |
| Graduate Degree | - | - |
| Total | $33,110 | $29,154 |
Family Income in Navassa
Family Income Brackets in Navassa
According to the Navassa family income data, there are 125 families falling into the $50,000 to $74,999 income range, which is the most common income bracket and makes up 28.0% of all families.
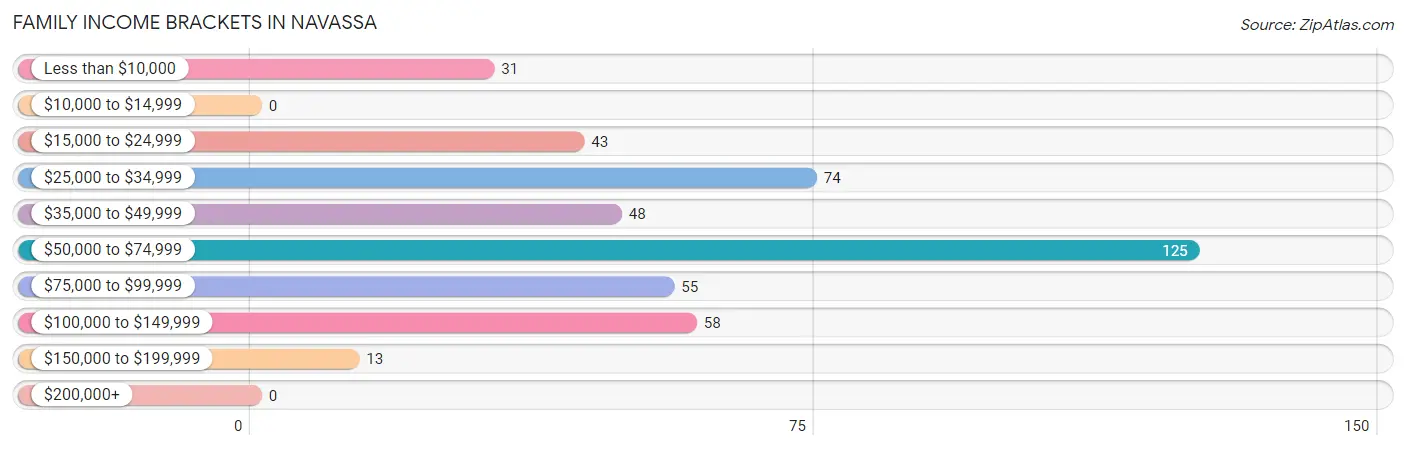
| Income Bracket | # Families | % Families |
| Less than $10,000 | 31 | 6.9% |
| $10,000 to $14,999 | 0 | 0.0% |
| $15,000 to $24,999 | 43 | 9.6% |
| $25,000 to $34,999 | 74 | 16.6% |
| $35,000 to $49,999 | 48 | 10.7% |
| $50,000 to $74,999 | 125 | 28.0% |
| $75,000 to $99,999 | 55 | 12.3% |
| $100,000 to $149,999 | 58 | 13.0% |
| $150,000 to $199,999 | 13 | 2.9% |
| $200,000+ | 0 | 0.0% |
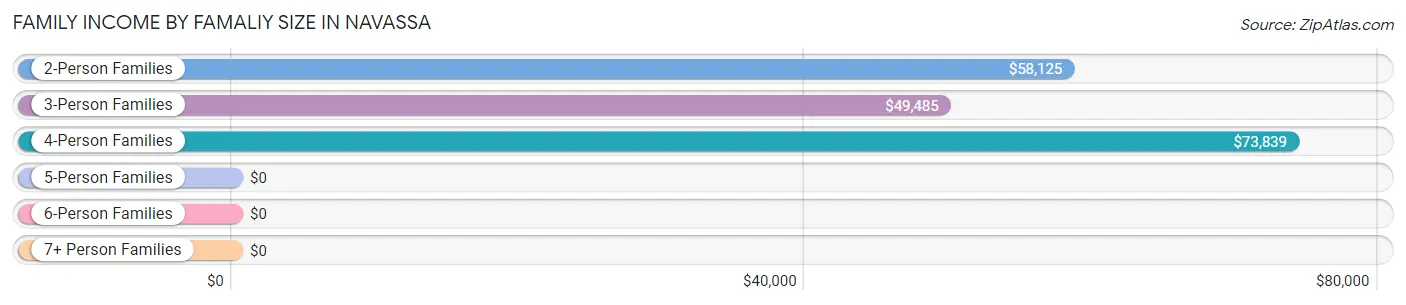
Family Income by Famaliy Size in Navassa
4-person families (33 | 7.4%) account for the highest median family income in Navassa with $73,839 per family, while 2-person families (239 | 53.5%) have the highest median income of $29,062 per family member.
| Income Bracket | # Families | Median Income |
| 2-Person Families | 239 (53.5%) | $58,125 |
| 3-Person Families | 152 (34.0%) | $49,485 |
| 4-Person Families | 33 (7.4%) | $73,839 |
| 5-Person Families | 11 (2.5%) | $0 |
| 6-Person Families | 3 (0.7%) | $0 |
| 7+ Person Families | 9 (2.0%) | $0 |
| Total | 447 (100.0%) | $57,303 |
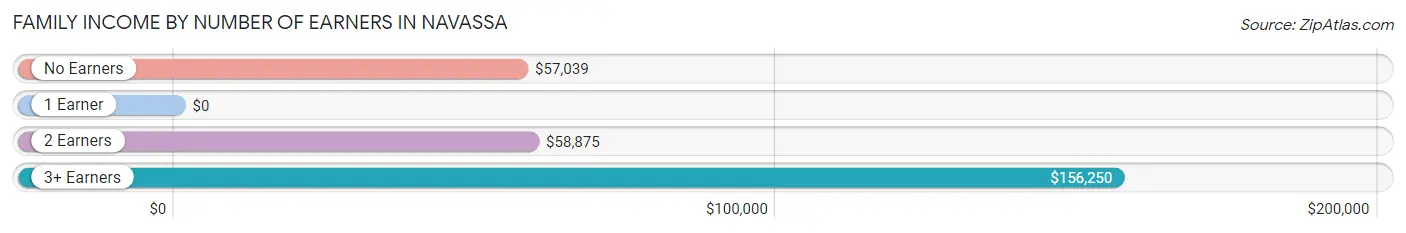
Family Income by Number of Earners in Navassa
| Number of Earners | # Families | Median Income |
| No Earners | 119 (26.6%) | $57,039 |
| 1 Earner | 166 (37.1%) | $0 |
| 2 Earners | 149 (33.3%) | $58,875 |
| 3+ Earners | 13 (2.9%) | $156,250 |
| Total | 447 (100.0%) | $57,303 |
Household Income in Navassa
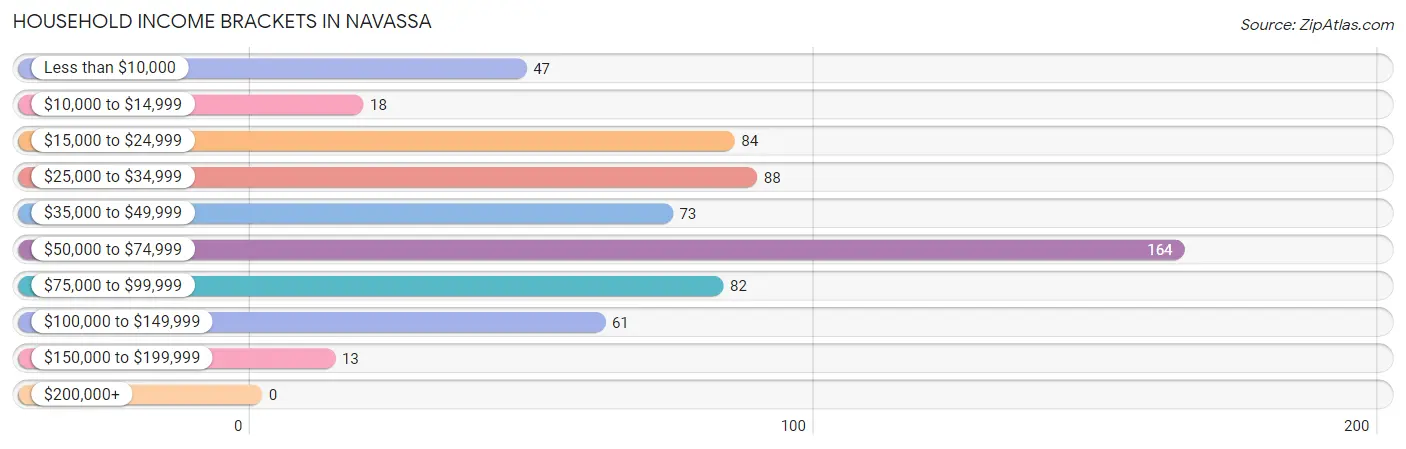
Household Income Brackets in Navassa
With 164 households falling in the category, the $50,000 to $74,999 income range is the most frequent in Navassa, accounting for 26.0% of all households.
| Income Bracket | # Households | % Households |
| Less than $10,000 | 47 | 7.5% |
| $10,000 to $14,999 | 18 | 2.9% |
| $15,000 to $24,999 | 84 | 13.3% |
| $25,000 to $34,999 | 88 | 14.0% |
| $35,000 to $49,999 | 73 | 11.6% |
| $50,000 to $74,999 | 164 | 26.0% |
| $75,000 to $99,999 | 82 | 13.0% |
| $100,000 to $149,999 | 61 | 9.7% |
| $150,000 to $199,999 | 13 | 2.1% |
| $200,000+ | 0 | 0.0% |
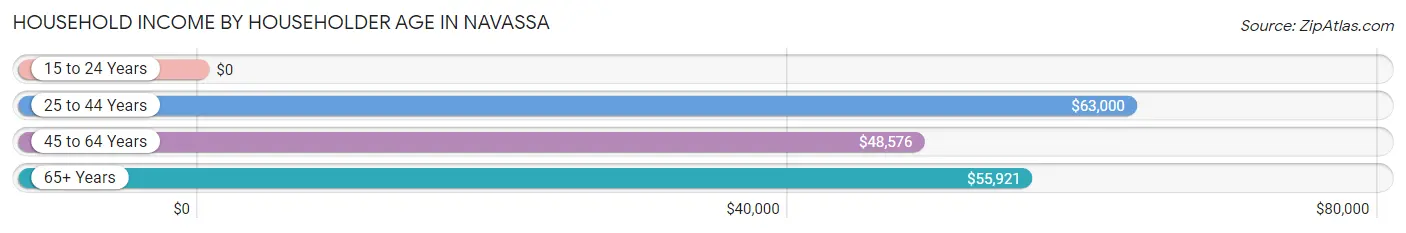
Household Income by Householder Age in Navassa
The median household income in Navassa is $50,694, with the highest median household income of $63,000 found in the 25 to 44 years age bracket for the primary householder. A total of 200 households (31.8%) fall into this category. Meanwhile, the 15 to 24 years age bracket for the primary householder has the lowest median household income of $0, with 19 households (3.0%) in this group.
| Income Bracket | # Households | Median Income |
| 15 to 24 Years | 19 (3.0%) | $0 |
| 25 to 44 Years | 200 (31.8%) | $63,000 |
| 45 to 64 Years | 233 (37.0%) | $48,576 |
| 65+ Years | 178 (28.2%) | $55,921 |
| Total | 630 (100.0%) | $50,694 |
Poverty in Navassa
Income Below Poverty by Sex and Age in Navassa
With 22.7% poverty level for males and 10.6% for females among the residents of Navassa, 5 year old males and 6 to 11 year old females are the most vulnerable to poverty, with 7 males (100.0%) and 23 females (35.9%) in their respective age groups living below the poverty level.
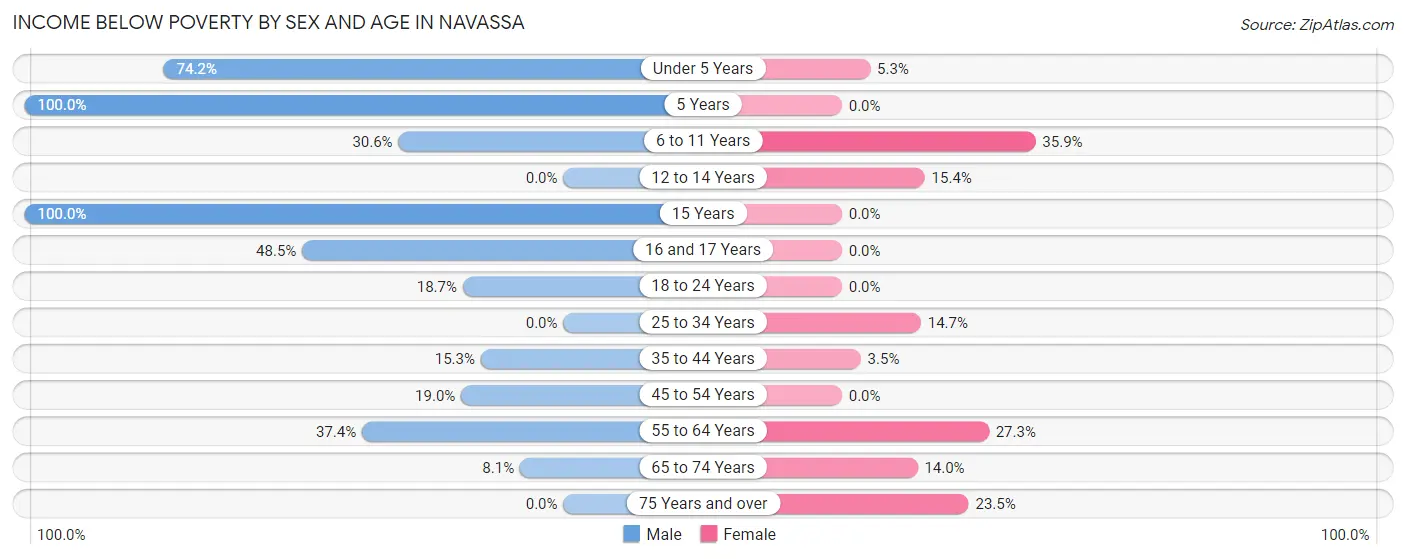
| Age Bracket | Male | Female |
| Under 5 Years | 23 (74.2%) | 3 (5.3%) |
| 5 Years | 7 (100.0%) | 0 (0.0%) |
| 6 to 11 Years | 30 (30.6%) | 23 (35.9%) |
| 12 to 14 Years | 0 (0.0%) | 6 (15.4%) |
| 15 Years | 9 (100.0%) | 0 (0.0%) |
| 16 and 17 Years | 16 (48.5%) | 0 (0.0%) |
| 18 to 24 Years | 25 (18.7%) | 0 (0.0%) |
| 25 to 34 Years | 0 (0.0%) | 33 (14.7%) |
| 35 to 44 Years | 19 (15.3%) | 5 (3.5%) |
| 45 to 54 Years | 11 (19.0%) | 0 (0.0%) |
| 55 to 64 Years | 34 (37.4%) | 24 (27.3%) |
| 65 to 74 Years | 7 (8.1%) | 24 (14.0%) |
| 75 Years and over | 0 (0.0%) | 4 (23.5%) |
| Total | 181 (22.7%) | 122 (10.6%) |
Income Above Poverty by Sex and Age in Navassa
According to the poverty statistics in Navassa, males aged 25 to 34 years and females aged 5 years are the age groups that are most secure financially, with 100.0% of males and 100.0% of females in these age groups living above the poverty line.
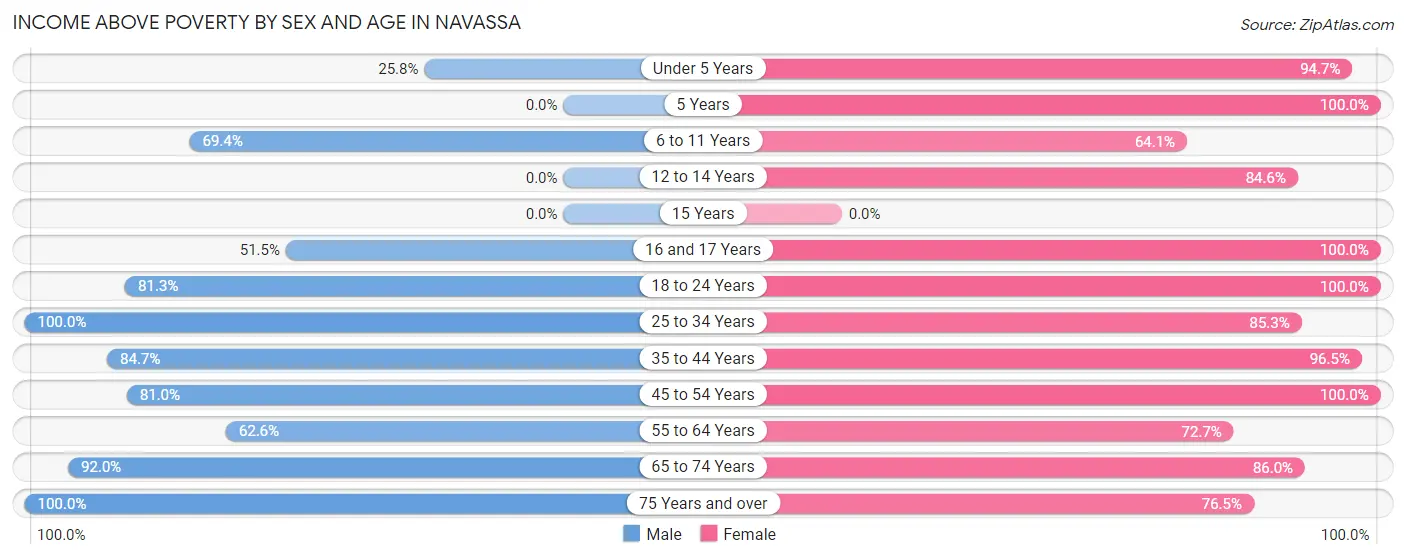
| Age Bracket | Male | Female |
| Under 5 Years | 8 (25.8%) | 54 (94.7%) |
| 5 Years | 0 (0.0%) | 18 (100.0%) |
| 6 to 11 Years | 68 (69.4%) | 41 (64.1%) |
| 12 to 14 Years | 0 (0.0%) | 33 (84.6%) |
| 15 Years | 0 (0.0%) | 0 (0.0%) |
| 16 and 17 Years | 17 (51.5%) | 8 (100.0%) |
| 18 to 24 Years | 109 (81.3%) | 201 (100.0%) |
| 25 to 34 Years | 98 (100.0%) | 192 (85.3%) |
| 35 to 44 Years | 105 (84.7%) | 138 (96.5%) |
| 45 to 54 Years | 47 (81.0%) | 124 (100.0%) |
| 55 to 64 Years | 57 (62.6%) | 64 (72.7%) |
| 65 to 74 Years | 80 (91.9%) | 147 (86.0%) |
| 75 Years and over | 29 (100.0%) | 13 (76.5%) |
| Total | 618 (77.3%) | 1,033 (89.4%) |
Income Below Poverty Among Married-Couple Families in Navassa
The poverty statistics for married-couple families in Navassa show that 10.3% or 24 of the total 232 families live below the poverty line. Families with no children have the highest poverty rate of 14.5%, comprising of 24 families. On the other hand, families with 1 or 2 children have the lowest poverty rate of 0.0%, which includes 0 families.
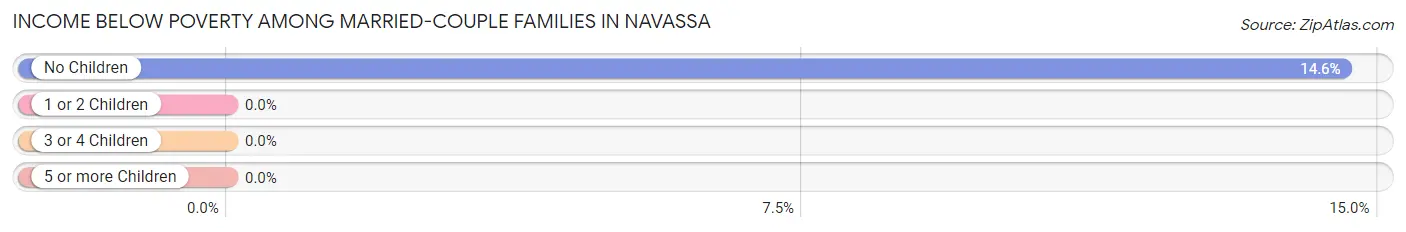
| Children | Above Poverty | Below Poverty |
| No Children | 141 (85.5%) | 24 (14.5%) |
| 1 or 2 Children | 63 (100.0%) | 0 (0.0%) |
| 3 or 4 Children | 4 (100.0%) | 0 (0.0%) |
| 5 or more Children | 0 (0.0%) | 0 (0.0%) |
| Total | 208 (89.7%) | 24 (10.3%) |
Income Below Poverty Among Single-Parent Households in Navassa
According to the poverty data in Navassa, 63.0% or 17 single-father households and 11.7% or 22 single-mother households are living below the poverty line. Among single-father households, those with no children have the highest poverty rate, with 17 households (73.9%) experiencing poverty. Likewise, among single-mother households, those with 3 or 4 children have the highest poverty rate, with 3 households (100.0%) falling below the poverty line.
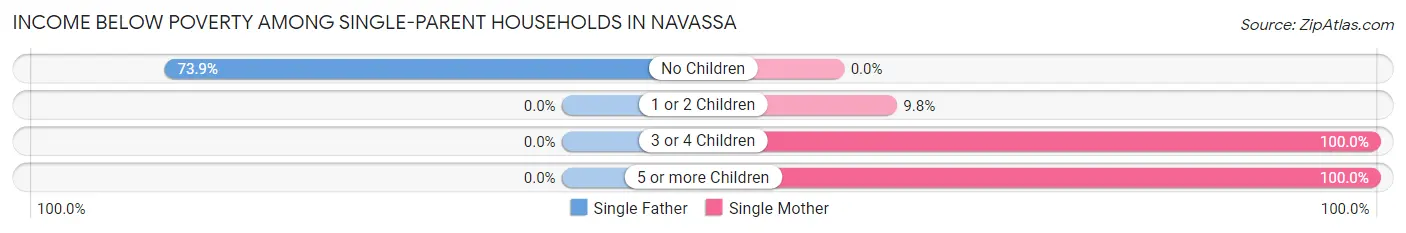
| Children | Single Father | Single Mother |
| No Children | 17 (73.9%) | 0 (0.0%) |
| 1 or 2 Children | 0 (0.0%) | 11 (9.8%) |
| 3 or 4 Children | 0 (0.0%) | 3 (100.0%) |
| 5 or more Children | 0 (0.0%) | 8 (100.0%) |
| Total | 17 (63.0%) | 22 (11.7%) |
Income Below Poverty Among Married-Couple vs Single-Parent Households in Navassa
The poverty data for Navassa shows that 24 of the married-couple family households (10.3%) and 39 of the single-parent households (18.1%) are living below the poverty level. Within the married-couple family households, those with no children have the highest poverty rate, with 24 households (14.5%) falling below the poverty line. Among the single-parent households, those with 3 or 4 children have the highest poverty rate, with 3 household (100.0%) living below poverty.
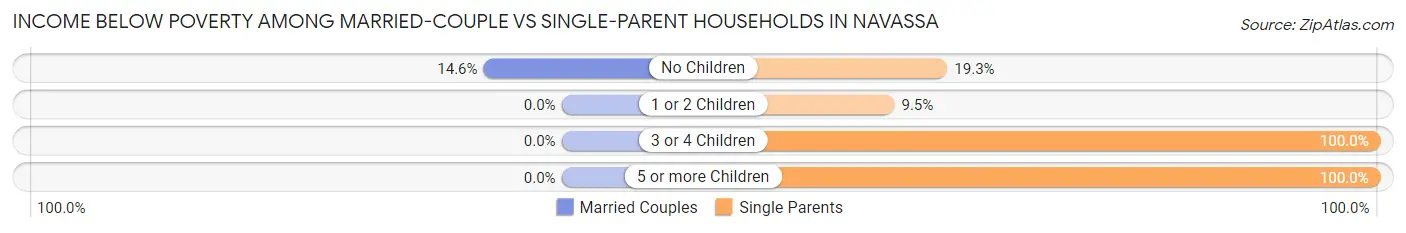
| Children | Married-Couple Families | Single-Parent Households |
| No Children | 24 (14.5%) | 17 (19.3%) |
| 1 or 2 Children | 0 (0.0%) | 11 (9.5%) |
| 3 or 4 Children | 0 (0.0%) | 3 (100.0%) |
| 5 or more Children | 0 (0.0%) | 8 (100.0%) |
| Total | 24 (10.3%) | 39 (18.1%) |
Employment Characteristics in Navassa
Employment by Class of Employer in Navassa
Among the 758 employed individuals in Navassa, private company employees (538 | 71.0%), local government employees (71 | 9.4%), and state government employees (57 | 7.5%) make up the most common classes of employment.
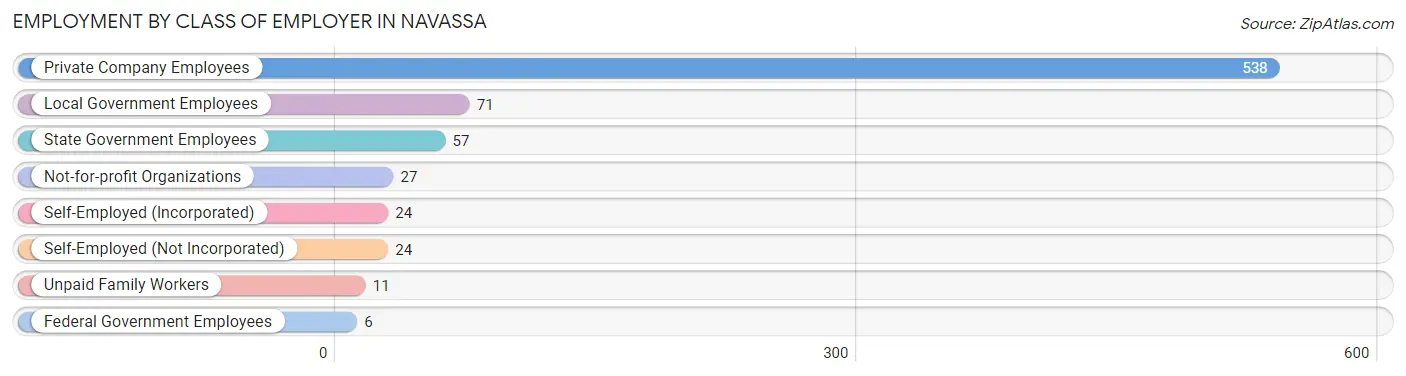
| Employer Class | # Employees | % Employees |
| Private Company Employees | 538 | 71.0% |
| Self-Employed (Incorporated) | 24 | 3.2% |
| Self-Employed (Not Incorporated) | 24 | 3.2% |
| Not-for-profit Organizations | 27 | 3.6% |
| Local Government Employees | 71 | 9.4% |
| State Government Employees | 57 | 7.5% |
| Federal Government Employees | 6 | 0.8% |
| Unpaid Family Workers | 11 | 1.5% |
| Total | 758 | 100.0% |
Employment Status by Age in Navassa
According to the labor force statistics for Navassa, out of the total population over 16 years of age (1,631), 49.9% or 814 individuals are in the labor force, with 5.9% or 48 of them unemployed. The age group with the highest labor force participation rate is 30 to 34 years, with 90.0% or 117 individuals in the labor force. Within the labor force, the 16 to 19 years age range has the highest percentage of unemployed individuals, with 58.8% or 20 of them being unemployed.
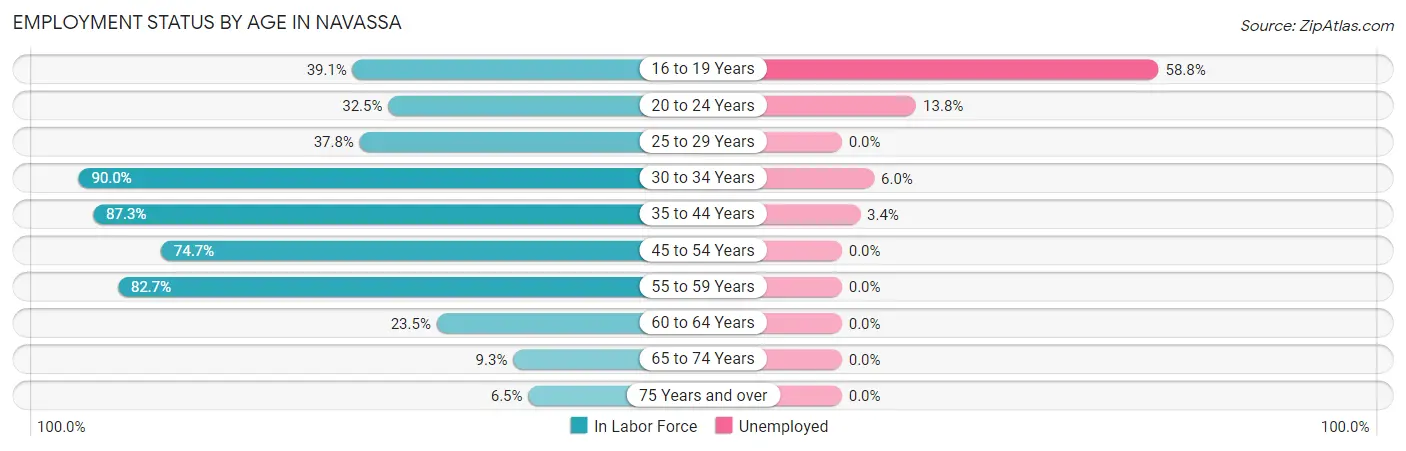
| Age Bracket | In Labor Force | Unemployed |
| 16 to 19 Years | 34 (39.1%) | 20 (58.8%) |
| 20 to 24 Years | 94 (32.5%) | 13 (13.8%) |
| 25 to 29 Years | 73 (37.8%) | 0 (0.0%) |
| 30 to 34 Years | 117 (90.0%) | 7 (6.0%) |
| 35 to 44 Years | 233 (87.3%) | 8 (3.4%) |
| 45 to 54 Years | 136 (74.7%) | 0 (0.0%) |
| 55 to 59 Years | 81 (82.7%) | 0 (0.0%) |
| 60 to 64 Years | 19 (23.5%) | 0 (0.0%) |
| 65 to 74 Years | 24 (9.3%) | 0 (0.0%) |
| 75 Years and over | 3 (6.5%) | 0 (0.0%) |
| Total | 814 (49.9%) | 48 (5.9%) |
Employment Status by Educational Attainment in Navassa
According to labor force statistics for Navassa, 69.3% of individuals (659) out of the total population between 25 and 64 years of age (951) are in the labor force, with 2.3% or 15 of them being unemployed. The group with the highest labor force participation rate are those with the educational attainment of bachelor's degree or higher, with 97.7% or 125 individuals in the labor force. Within the labor force, individuals with high school diploma education have the highest percentage of unemployment, with 3.8% or 8 of them being unemployed.
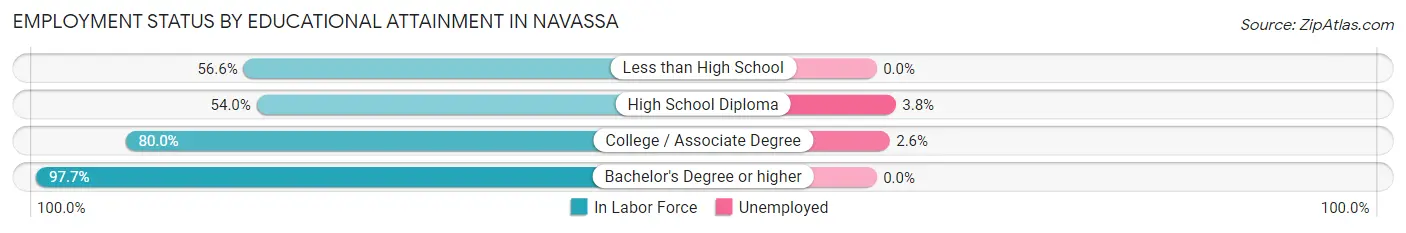
| Educational Attainment | In Labor Force | Unemployed |
| Less than High School | 56 (56.6%) | 0 (0.0%) |
| High School Diploma | 210 (54.0%) | 15 (3.8%) |
| College / Associate Degree | 268 (80.0%) | 9 (2.6%) |
| Bachelor's Degree or higher | 125 (97.7%) | 0 (0.0%) |
| Total | 659 (69.3%) | 22 (2.3%) |
Employment Occupations by Sex in Navassa
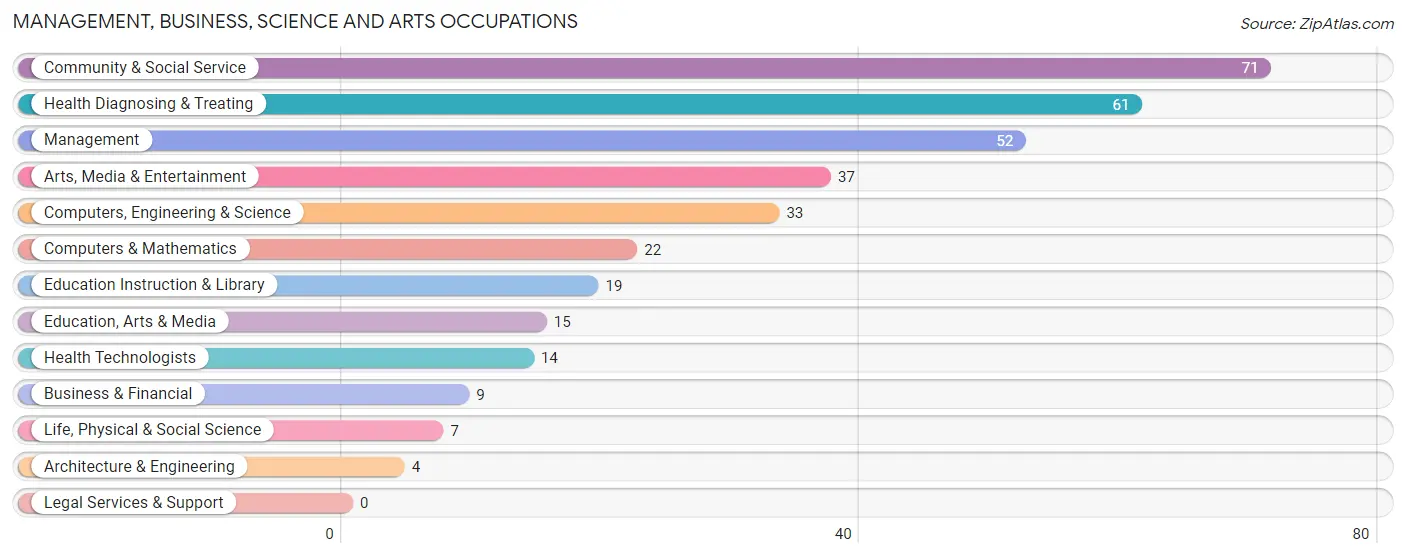
Management, Business, Science and Arts Occupations
The most common Management, Business, Science and Arts occupations in Navassa are Community & Social Service (71 | 9.3%), Health Diagnosing & Treating (61 | 8.0%), Management (52 | 6.8%), Arts, Media & Entertainment (37 | 4.8%), and Computers, Engineering & Science (33 | 4.3%).
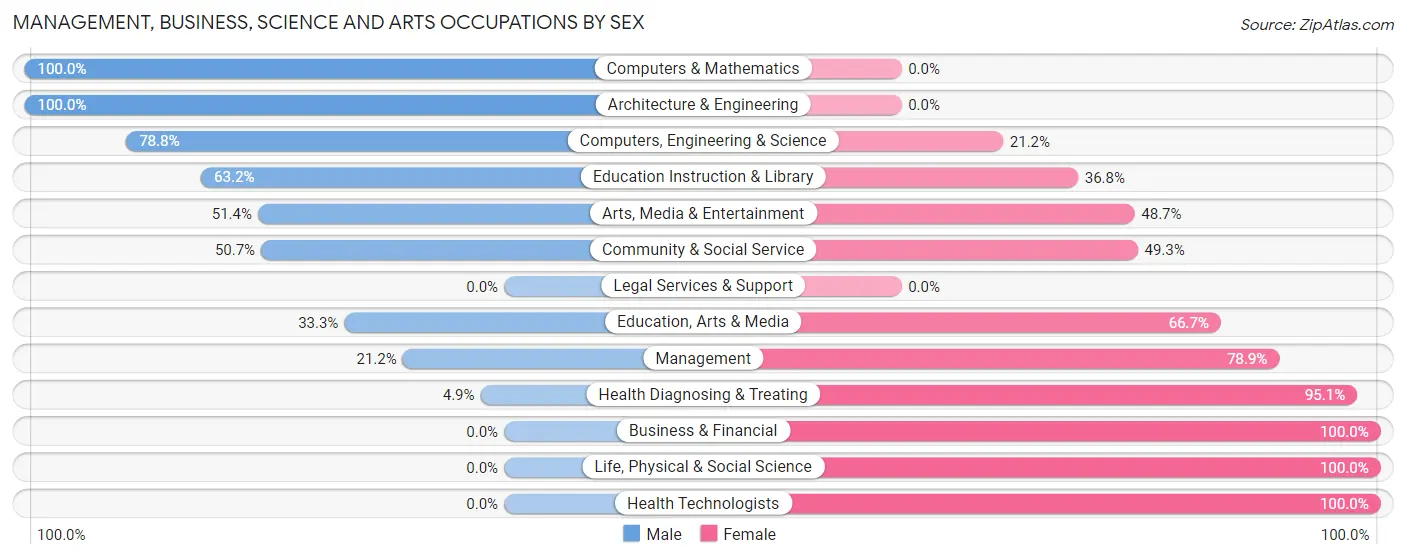
Management, Business, Science and Arts Occupations by Sex
Within the Management, Business, Science and Arts occupations in Navassa, the most male-oriented occupations are Computers & Mathematics (100.0%), Architecture & Engineering (100.0%), and Computers, Engineering & Science (78.8%), while the most female-oriented occupations are Business & Financial (100.0%), Life, Physical & Social Science (100.0%), and Health Technologists (100.0%).
| Occupation | Male | Female |
| Management | 11 (21.1%) | 41 (78.8%) |
| Business & Financial | 0 (0.0%) | 9 (100.0%) |
| Computers, Engineering & Science | 26 (78.8%) | 7 (21.2%) |
| Computers & Mathematics | 22 (100.0%) | 0 (0.0%) |
| Architecture & Engineering | 4 (100.0%) | 0 (0.0%) |
| Life, Physical & Social Science | 0 (0.0%) | 7 (100.0%) |
| Community & Social Service | 36 (50.7%) | 35 (49.3%) |
| Education, Arts & Media | 5 (33.3%) | 10 (66.7%) |
| Legal Services & Support | 0 (0.0%) | 0 (0.0%) |
| Education Instruction & Library | 12 (63.2%) | 7 (36.8%) |
| Arts, Media & Entertainment | 19 (51.3%) | 18 (48.6%) |
| Health Diagnosing & Treating | 3 (4.9%) | 58 (95.1%) |
| Health Technologists | 0 (0.0%) | 14 (100.0%) |
| Total (Category) | 76 (33.6%) | 150 (66.4%) |
| Total (Overall) | 371 (48.4%) | 395 (51.6%) |
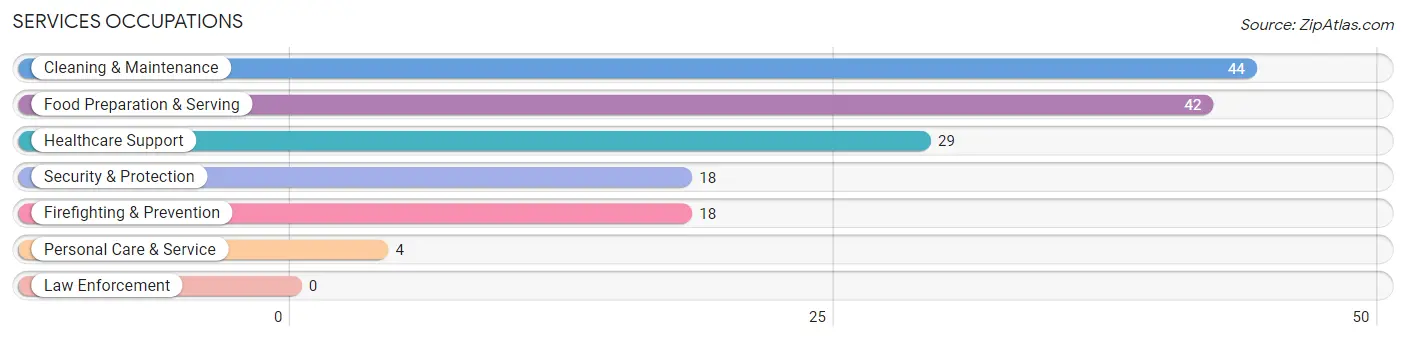
Services Occupations
The most common Services occupations in Navassa are Cleaning & Maintenance (44 | 5.7%), Food Preparation & Serving (42 | 5.5%), Healthcare Support (29 | 3.8%), Security & Protection (18 | 2.4%), and Firefighting & Prevention (18 | 2.4%).
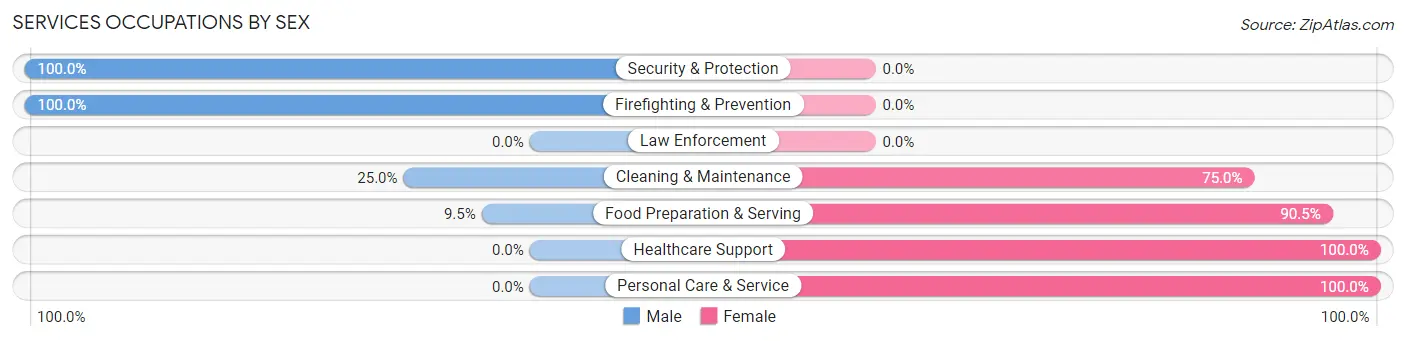
Services Occupations by Sex
Within the Services occupations in Navassa, the most male-oriented occupations are Security & Protection (100.0%), Firefighting & Prevention (100.0%), and Cleaning & Maintenance (25.0%), while the most female-oriented occupations are Healthcare Support (100.0%), Personal Care & Service (100.0%), and Food Preparation & Serving (90.5%).
| Occupation | Male | Female |
| Healthcare Support | 0 (0.0%) | 29 (100.0%) |
| Security & Protection | 18 (100.0%) | 0 (0.0%) |
| Firefighting & Prevention | 18 (100.0%) | 0 (0.0%) |
| Law Enforcement | 0 (0.0%) | 0 (0.0%) |
| Food Preparation & Serving | 4 (9.5%) | 38 (90.5%) |
| Cleaning & Maintenance | 11 (25.0%) | 33 (75.0%) |
| Personal Care & Service | 0 (0.0%) | 4 (100.0%) |
| Total (Category) | 33 (24.1%) | 104 (75.9%) |
| Total (Overall) | 371 (48.4%) | 395 (51.6%) |
Sales and Office Occupations
The most common Sales and Office occupations in Navassa are Sales & Related (113 | 14.7%), and Office & Administration (72 | 9.4%).
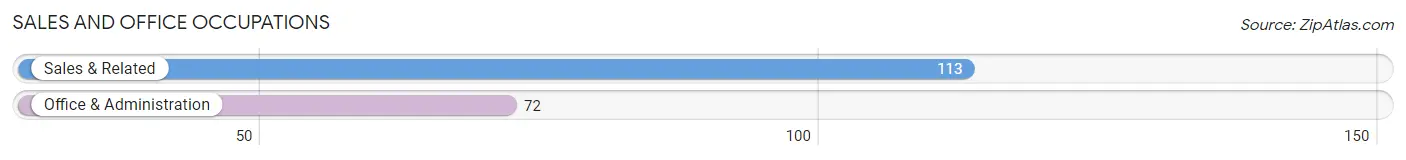
Sales and Office Occupations by Sex
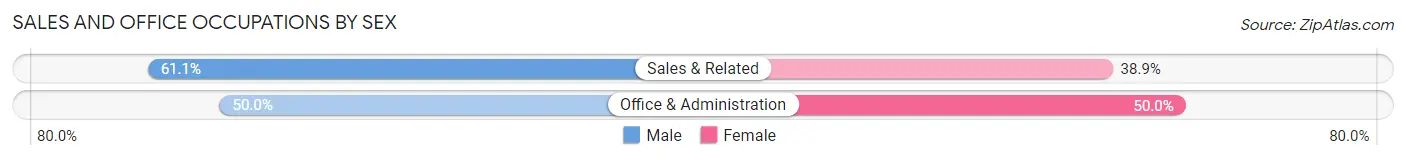
| Occupation | Male | Female |
| Sales & Related | 69 (61.1%) | 44 (38.9%) |
| Office & Administration | 36 (50.0%) | 36 (50.0%) |
| Total (Category) | 105 (56.8%) | 80 (43.2%) |
| Total (Overall) | 371 (48.4%) | 395 (51.6%) |
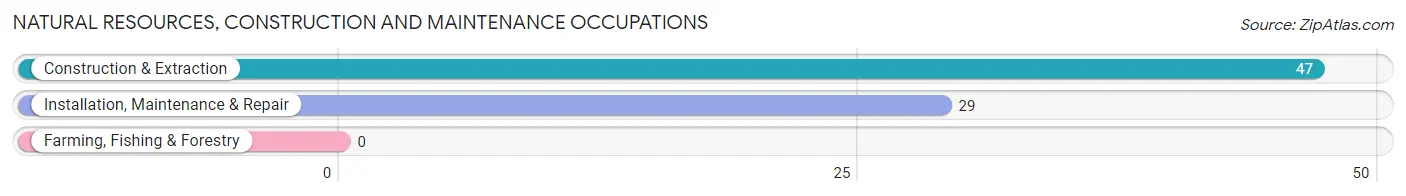
Natural Resources, Construction and Maintenance Occupations
The most common Natural Resources, Construction and Maintenance occupations in Navassa are Construction & Extraction (47 | 6.1%), and Installation, Maintenance & Repair (29 | 3.8%).
Natural Resources, Construction and Maintenance Occupations by Sex
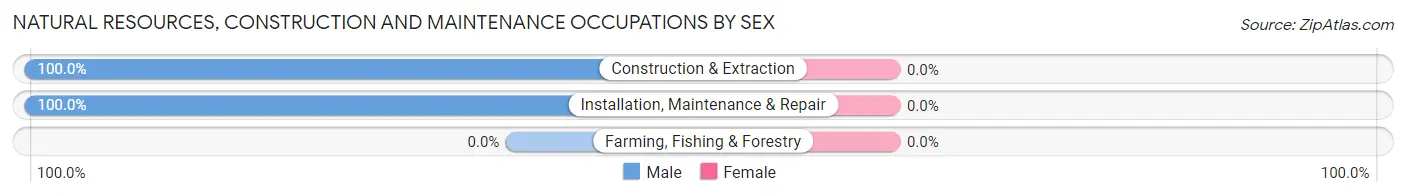
| Occupation | Male | Female |
| Farming, Fishing & Forestry | 0 (0.0%) | 0 (0.0%) |
| Construction & Extraction | 47 (100.0%) | 0 (0.0%) |
| Installation, Maintenance & Repair | 29 (100.0%) | 0 (0.0%) |
| Total (Category) | 76 (100.0%) | 0 (0.0%) |
| Total (Overall) | 371 (48.4%) | 395 (51.6%) |
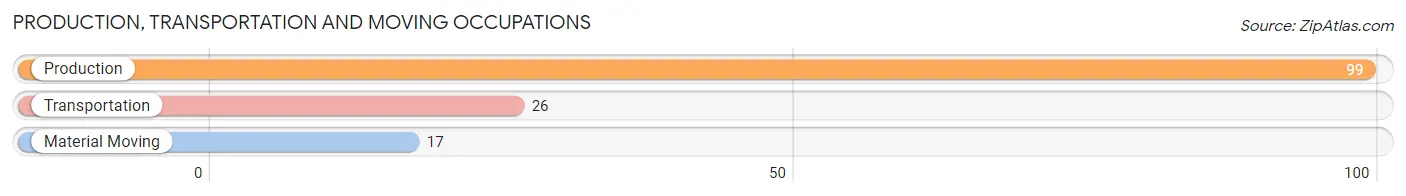
Production, Transportation and Moving Occupations
The most common Production, Transportation and Moving occupations in Navassa are Production (99 | 12.9%), Transportation (26 | 3.4%), and Material Moving (17 | 2.2%).
Production, Transportation and Moving Occupations by Sex
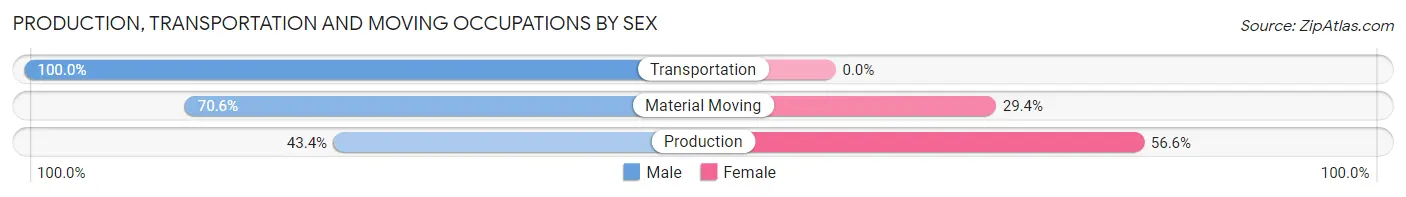
| Occupation | Male | Female |
| Production | 43 (43.4%) | 56 (56.6%) |
| Transportation | 26 (100.0%) | 0 (0.0%) |
| Material Moving | 12 (70.6%) | 5 (29.4%) |
| Total (Category) | 81 (57.0%) | 61 (43.0%) |
| Total (Overall) | 371 (48.4%) | 395 (51.6%) |
Employment Industries by Sex in Navassa
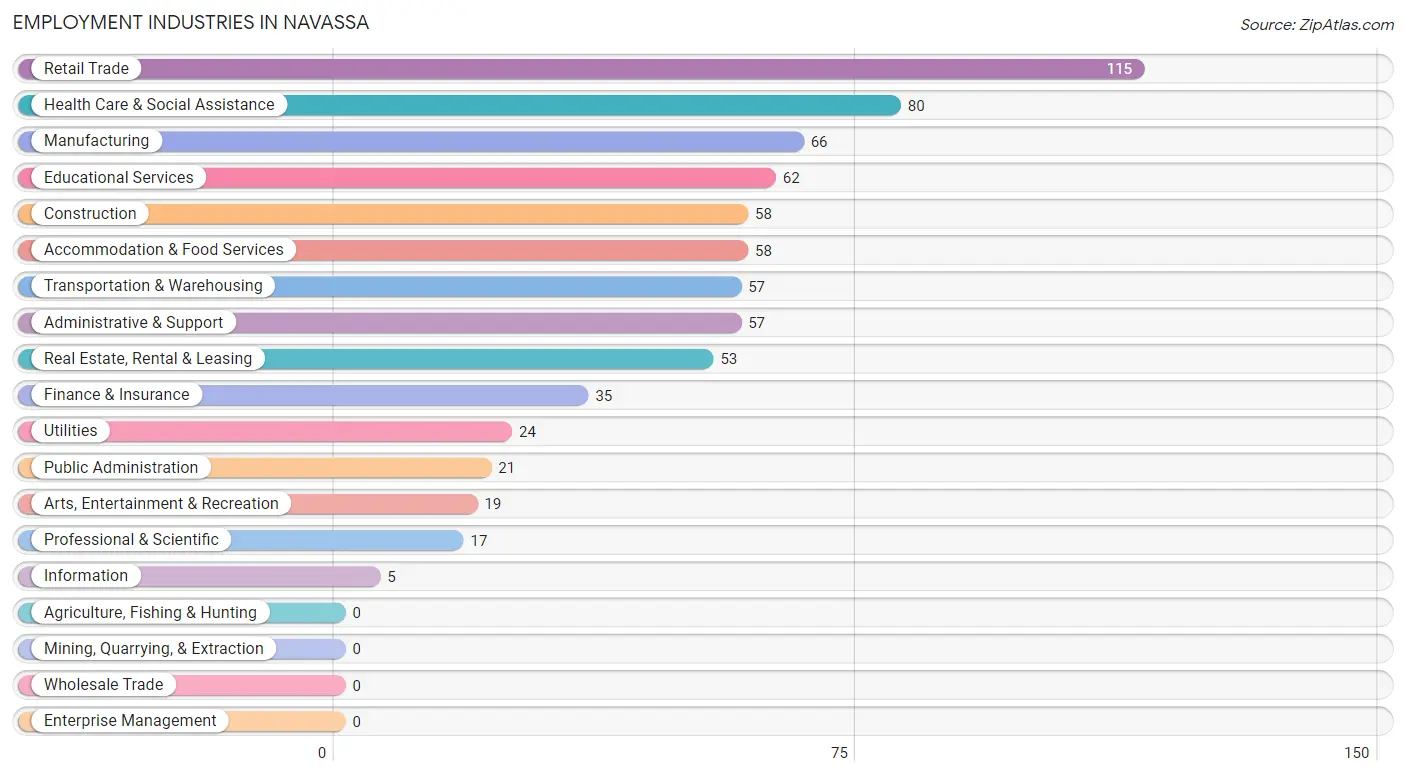
Employment Industries in Navassa
The major employment industries in Navassa include Retail Trade (115 | 15.0%), Health Care & Social Assistance (80 | 10.4%), Manufacturing (66 | 8.6%), Educational Services (62 | 8.1%), and Construction (58 | 7.6%).
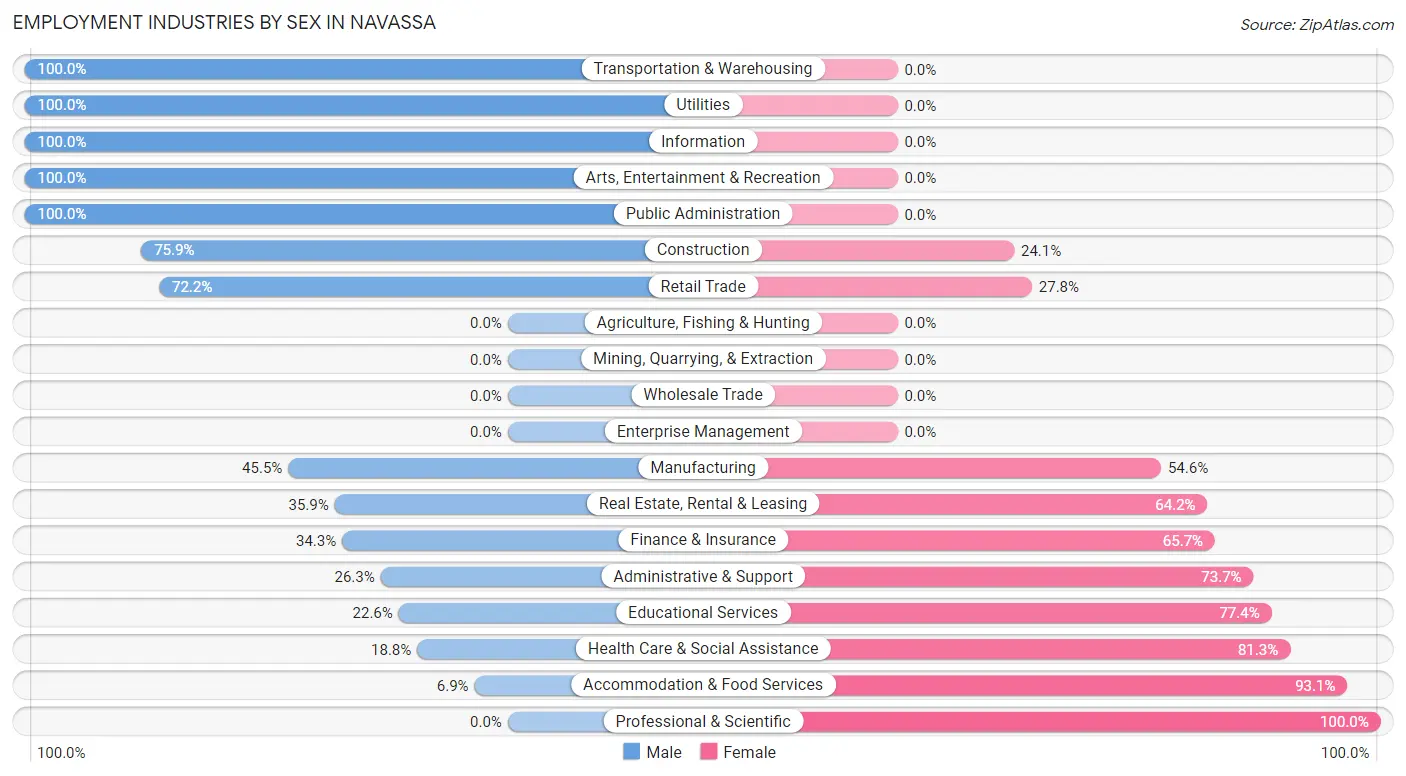
Employment Industries by Sex in Navassa
The Navassa industries that see more men than women are Transportation & Warehousing (100.0%), Utilities (100.0%), and Information (100.0%), whereas the industries that tend to have a higher number of women are Professional & Scientific (100.0%), Accommodation & Food Services (93.1%), and Health Care & Social Assistance (81.2%).
| Industry | Male | Female |
| Agriculture, Fishing & Hunting | 0 (0.0%) | 0 (0.0%) |
| Mining, Quarrying, & Extraction | 0 (0.0%) | 0 (0.0%) |
| Construction | 44 (75.9%) | 14 (24.1%) |
| Manufacturing | 30 (45.5%) | 36 (54.5%) |
| Wholesale Trade | 0 (0.0%) | 0 (0.0%) |
| Retail Trade | 83 (72.2%) | 32 (27.8%) |
| Transportation & Warehousing | 57 (100.0%) | 0 (0.0%) |
| Utilities | 24 (100.0%) | 0 (0.0%) |
| Information | 5 (100.0%) | 0 (0.0%) |
| Finance & Insurance | 12 (34.3%) | 23 (65.7%) |
| Real Estate, Rental & Leasing | 19 (35.8%) | 34 (64.1%) |
| Professional & Scientific | 0 (0.0%) | 17 (100.0%) |
| Enterprise Management | 0 (0.0%) | 0 (0.0%) |
| Administrative & Support | 15 (26.3%) | 42 (73.7%) |
| Educational Services | 14 (22.6%) | 48 (77.4%) |
| Health Care & Social Assistance | 15 (18.8%) | 65 (81.2%) |
| Arts, Entertainment & Recreation | 19 (100.0%) | 0 (0.0%) |
| Accommodation & Food Services | 4 (6.9%) | 54 (93.1%) |
| Public Administration | 21 (100.0%) | 0 (0.0%) |
| Total | 371 (48.4%) | 395 (51.6%) |
Education in Navassa
School Enrollment in Navassa
The most common levels of schooling among the 448 students in Navassa are college / undergraduate (185 | 41.3%), middle school (97 | 21.6%), and high school (70 | 15.6%).
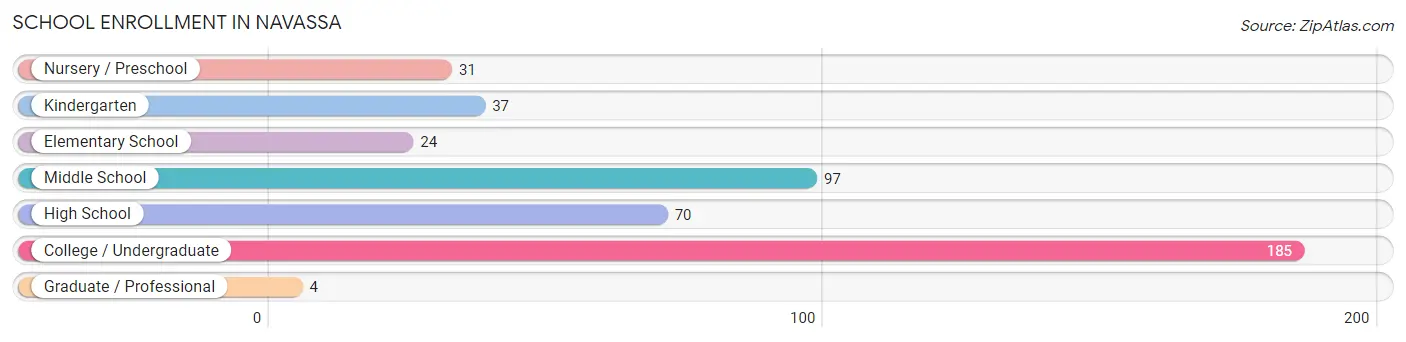
| School Level | # Students | % Students |
| Nursery / Preschool | 31 | 6.9% |
| Kindergarten | 37 | 8.3% |
| Elementary School | 24 | 5.4% |
| Middle School | 97 | 21.6% |
| High School | 70 | 15.6% |
| College / Undergraduate | 185 | 41.3% |
| Graduate / Professional | 4 | 0.9% |
| Total | 448 | 100.0% |
School Enrollment by Age by Funding Source in Navassa
Out of a total of 448 students who are enrolled in schools in Navassa, 14 (3.1%) attend a private institution, while the remaining 434 (96.9%) are enrolled in public schools. The age group of 5 to 9 year old has the highest likelihood of being enrolled in private schools, with 14 (22.2% in the age bracket) enrolled. Conversely, the age group of 3 to 4 year olds has the lowest likelihood of being enrolled in a private school, with 17 (100.0% in the age bracket) attending a public institution.
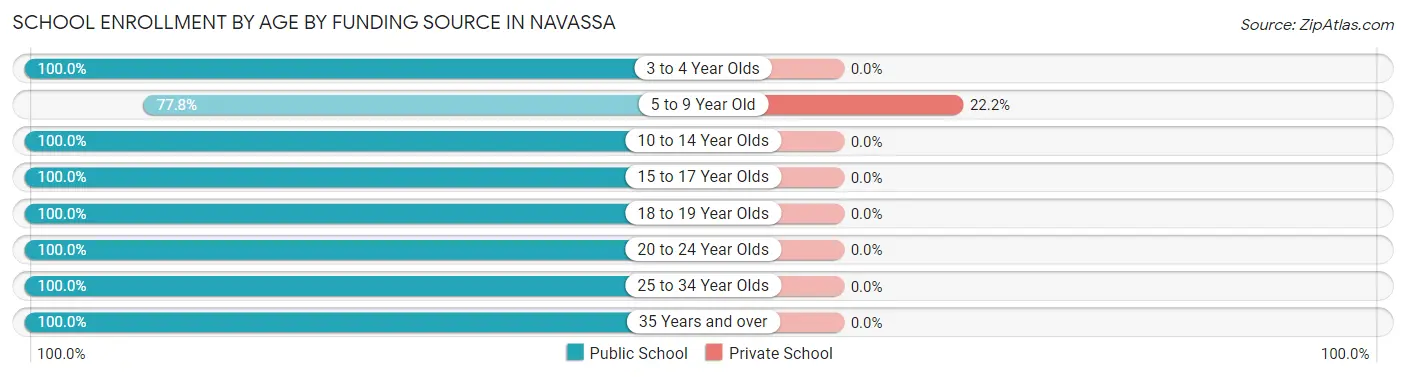
| Age Bracket | Public School | Private School |
| 3 to 4 Year Olds | 17 (100.0%) | 0 (0.0%) |
| 5 to 9 Year Old | 49 (77.8%) | 14 (22.2%) |
| 10 to 14 Year Olds | 109 (100.0%) | 0 (0.0%) |
| 15 to 17 Year Olds | 50 (100.0%) | 0 (0.0%) |
| 18 to 19 Year Olds | 20 (100.0%) | 0 (0.0%) |
| 20 to 24 Year Olds | 147 (100.0%) | 0 (0.0%) |
| 25 to 34 Year Olds | 14 (100.0%) | 0 (0.0%) |
| 35 Years and over | 28 (100.0%) | 0 (0.0%) |
| Total | 434 (96.9%) | 14 (3.1%) |
Educational Attainment by Field of Study in Navassa
Arts & humanities (37 | 16.4%), social sciences (35 | 15.6%), psychology (28 | 12.4%), liberal arts & history (26 | 11.6%), and business (24 | 10.7%) are the most common fields of study among 225 individuals in Navassa who have obtained a bachelor's degree or higher.
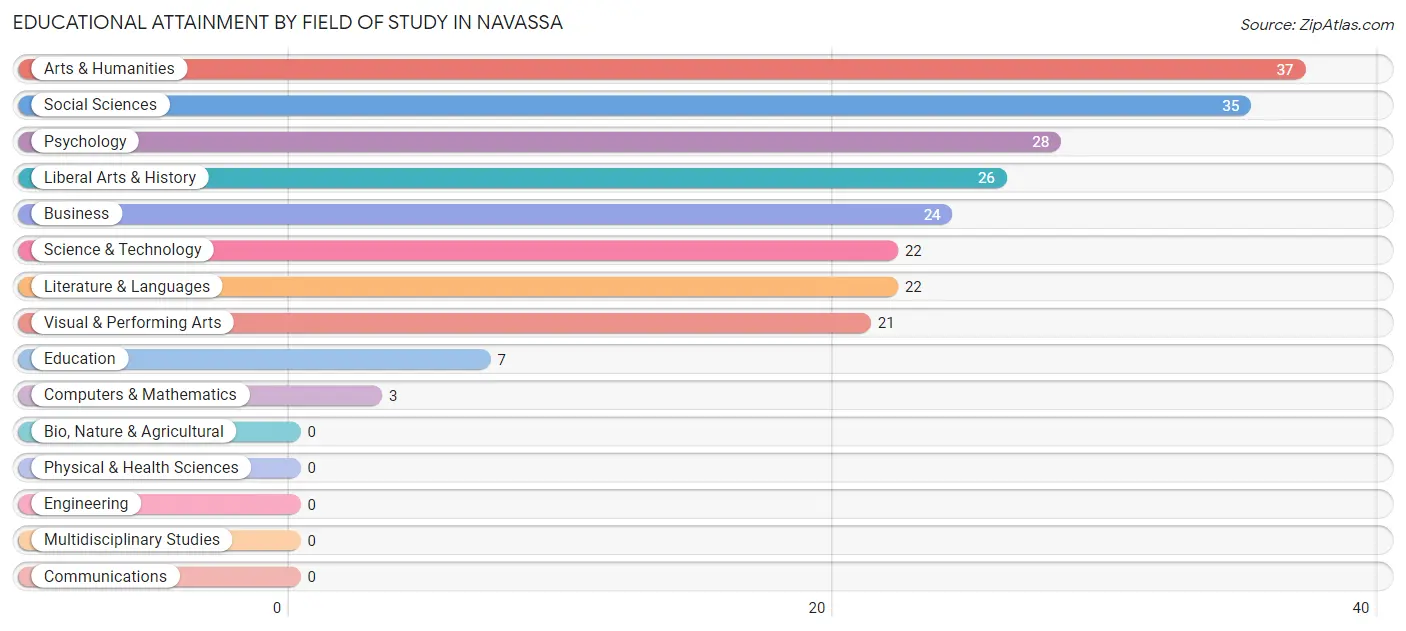
| Field of Study | # Graduates | % Graduates |
| Computers & Mathematics | 3 | 1.3% |
| Bio, Nature & Agricultural | 0 | 0.0% |
| Physical & Health Sciences | 0 | 0.0% |
| Psychology | 28 | 12.4% |
| Social Sciences | 35 | 15.6% |
| Engineering | 0 | 0.0% |
| Multidisciplinary Studies | 0 | 0.0% |
| Science & Technology | 22 | 9.8% |
| Business | 24 | 10.7% |
| Education | 7 | 3.1% |
| Literature & Languages | 22 | 9.8% |
| Liberal Arts & History | 26 | 11.6% |
| Visual & Performing Arts | 21 | 9.3% |
| Communications | 0 | 0.0% |
| Arts & Humanities | 37 | 16.4% |
| Total | 225 | 100.0% |
Transportation & Commute in Navassa
Vehicle Availability by Sex in Navassa
The most prevalent vehicle ownership categories in Navassa are males with 2 vehicles (134, accounting for 36.1%) and females with 2 vehicles (139, making up 34.6%).
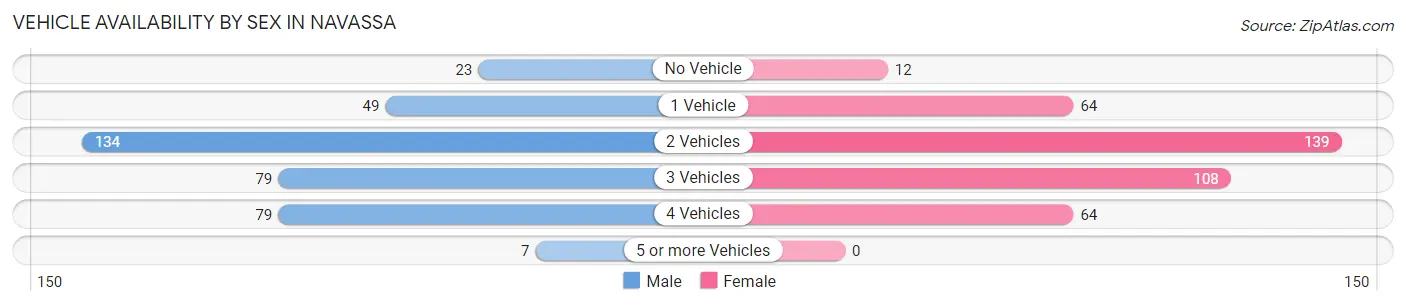
| Vehicles Available | Male | Female |
| No Vehicle | 23 (6.2%) | 12 (3.1%) |
| 1 Vehicle | 49 (13.2%) | 64 (16.5%) |
| 2 Vehicles | 134 (36.1%) | 139 (35.9%) |
| 3 Vehicles | 79 (21.3%) | 108 (27.9%) |
| 4 Vehicles | 79 (21.3%) | 64 (16.5%) |
| 5 or more Vehicles | 7 (1.9%) | 0 (0.0%) |
| Total | 371 (100.0%) | 387 (100.0%) |
Commute Time in Navassa
The most frequently occuring commute durations in Navassa are 15 to 19 minutes (148 commuters, 21.5%), 20 to 24 minutes (128 commuters, 18.6%), and 25 to 29 minutes (121 commuters, 17.6%).
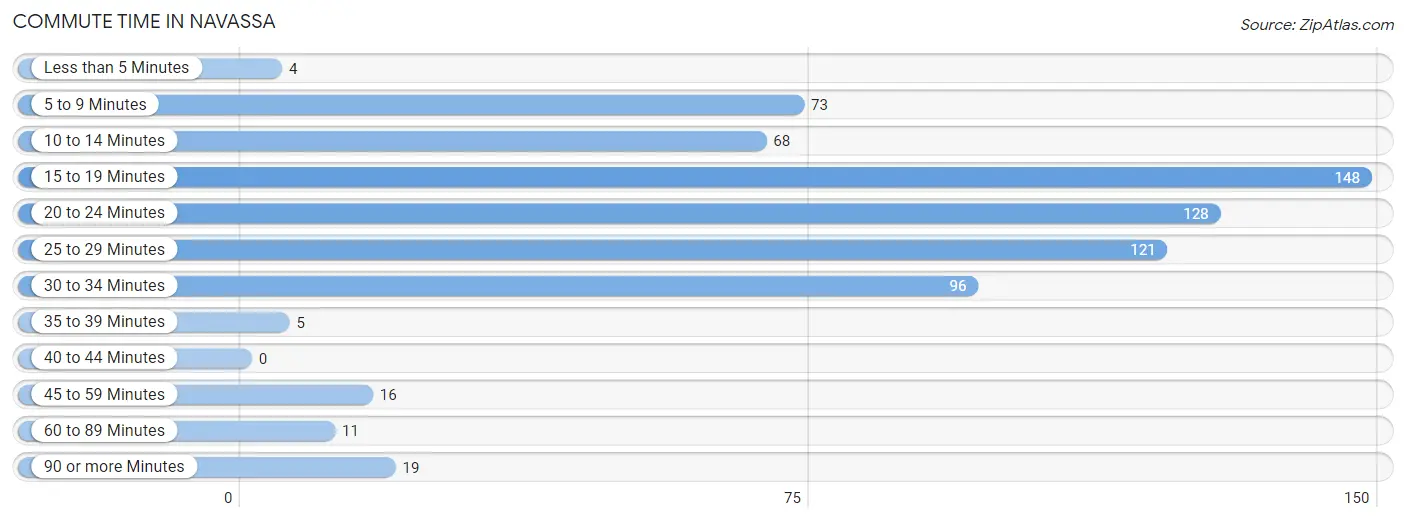
| Commute Time | # Commuters | % Commuters |
| Less than 5 Minutes | 4 | 0.6% |
| 5 to 9 Minutes | 73 | 10.6% |
| 10 to 14 Minutes | 68 | 9.9% |
| 15 to 19 Minutes | 148 | 21.5% |
| 20 to 24 Minutes | 128 | 18.6% |
| 25 to 29 Minutes | 121 | 17.6% |
| 30 to 34 Minutes | 96 | 13.9% |
| 35 to 39 Minutes | 5 | 0.7% |
| 40 to 44 Minutes | 0 | 0.0% |
| 45 to 59 Minutes | 16 | 2.3% |
| 60 to 89 Minutes | 11 | 1.6% |
| 90 or more Minutes | 19 | 2.8% |
Commute Time by Sex in Navassa
The most common commute times in Navassa are 20 to 24 minutes (81 commuters, 24.4%) for males and 15 to 19 minutes (126 commuters, 35.3%) for females.
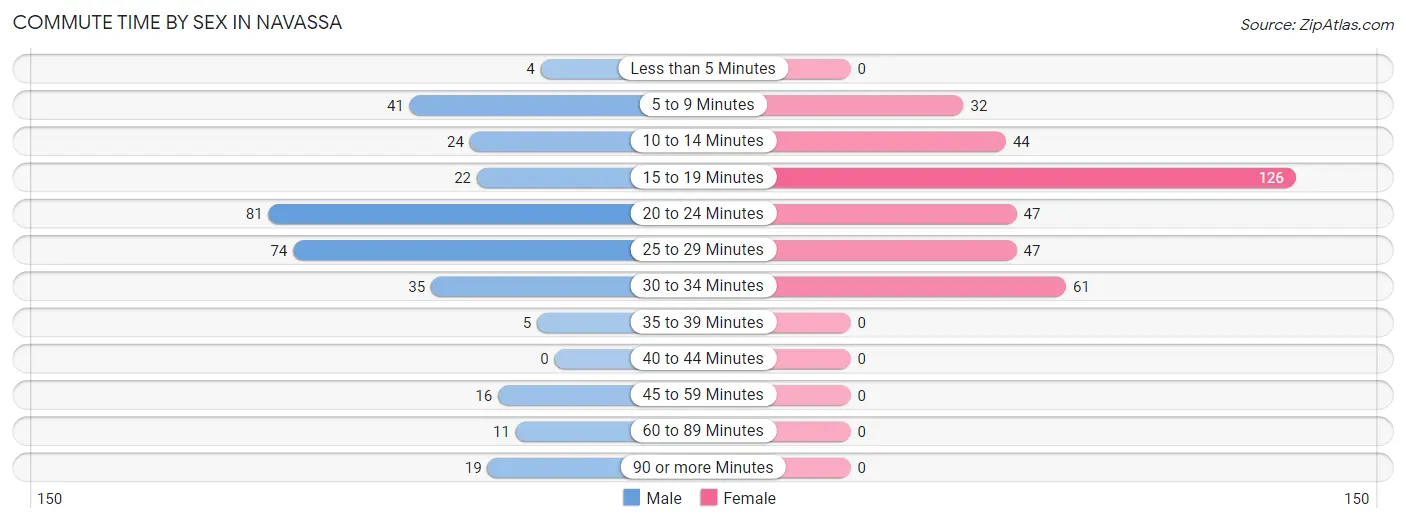
| Commute Time | Male | Female |
| Less than 5 Minutes | 4 (1.2%) | 0 (0.0%) |
| 5 to 9 Minutes | 41 (12.3%) | 32 (9.0%) |
| 10 to 14 Minutes | 24 (7.2%) | 44 (12.3%) |
| 15 to 19 Minutes | 22 (6.6%) | 126 (35.3%) |
| 20 to 24 Minutes | 81 (24.4%) | 47 (13.2%) |
| 25 to 29 Minutes | 74 (22.3%) | 47 (13.2%) |
| 30 to 34 Minutes | 35 (10.5%) | 61 (17.1%) |
| 35 to 39 Minutes | 5 (1.5%) | 0 (0.0%) |
| 40 to 44 Minutes | 0 (0.0%) | 0 (0.0%) |
| 45 to 59 Minutes | 16 (4.8%) | 0 (0.0%) |
| 60 to 89 Minutes | 11 (3.3%) | 0 (0.0%) |
| 90 or more Minutes | 19 (5.7%) | 0 (0.0%) |
Time of Departure to Work by Sex in Navassa
The most frequent times of departure to work in Navassa are 5:30 AM to 5:59 AM (99, 29.8%) for males and 7:30 AM to 7:59 AM (100, 28.0%) for females.
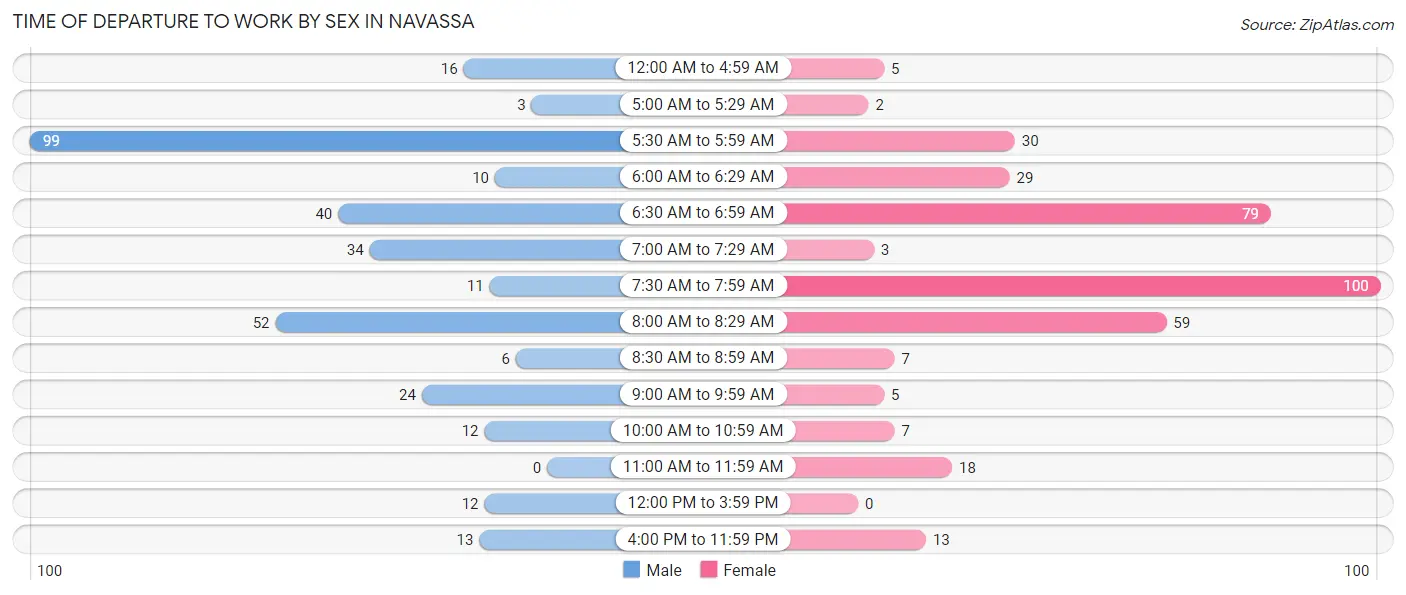
| Time of Departure | Male | Female |
| 12:00 AM to 4:59 AM | 16 (4.8%) | 5 (1.4%) |
| 5:00 AM to 5:29 AM | 3 (0.9%) | 2 (0.6%) |
| 5:30 AM to 5:59 AM | 99 (29.8%) | 30 (8.4%) |
| 6:00 AM to 6:29 AM | 10 (3.0%) | 29 (8.1%) |
| 6:30 AM to 6:59 AM | 40 (12.0%) | 79 (22.1%) |
| 7:00 AM to 7:29 AM | 34 (10.2%) | 3 (0.8%) |
| 7:30 AM to 7:59 AM | 11 (3.3%) | 100 (28.0%) |
| 8:00 AM to 8:29 AM | 52 (15.7%) | 59 (16.5%) |
| 8:30 AM to 8:59 AM | 6 (1.8%) | 7 (2.0%) |
| 9:00 AM to 9:59 AM | 24 (7.2%) | 5 (1.4%) |
| 10:00 AM to 10:59 AM | 12 (3.6%) | 7 (2.0%) |
| 11:00 AM to 11:59 AM | 0 (0.0%) | 18 (5.0%) |
| 12:00 PM to 3:59 PM | 12 (3.6%) | 0 (0.0%) |
| 4:00 PM to 11:59 PM | 13 (3.9%) | 13 (3.6%) |
| Total | 332 (100.0%) | 357 (100.0%) |
Housing Occupancy in Navassa
Occupancy by Ownership in Navassa
Of the total 630 dwellings in Navassa, owner-occupied units account for 493 (78.2%), while renter-occupied units make up 137 (21.7%).
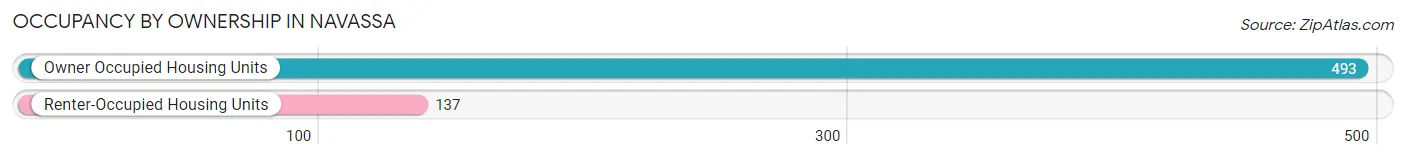
| Occupancy | # Housing Units | % Housing Units |
| Owner Occupied Housing Units | 493 | 78.2% |
| Renter-Occupied Housing Units | 137 | 21.7% |
| Total Occupied Housing Units | 630 | 100.0% |
Occupancy by Household Size in Navassa
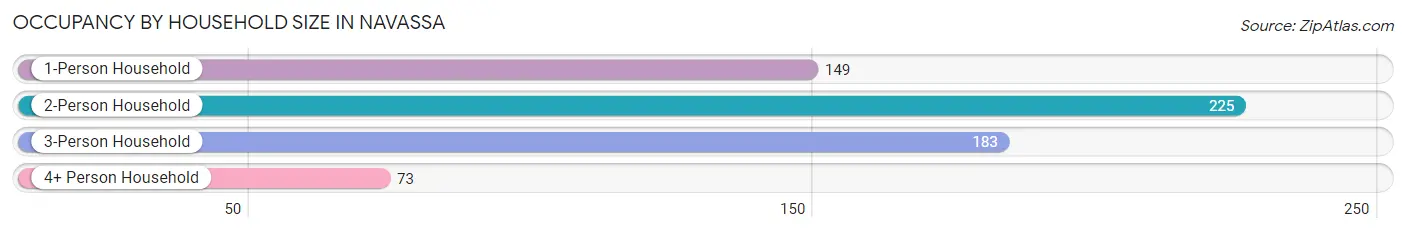
| Household Size | # Housing Units | % Housing Units |
| 1-Person Household | 149 | 23.6% |
| 2-Person Household | 225 | 35.7% |
| 3-Person Household | 183 | 29.0% |
| 4+ Person Household | 73 | 11.6% |
| Total Housing Units | 630 | 100.0% |
Occupancy by Ownership by Household Size in Navassa
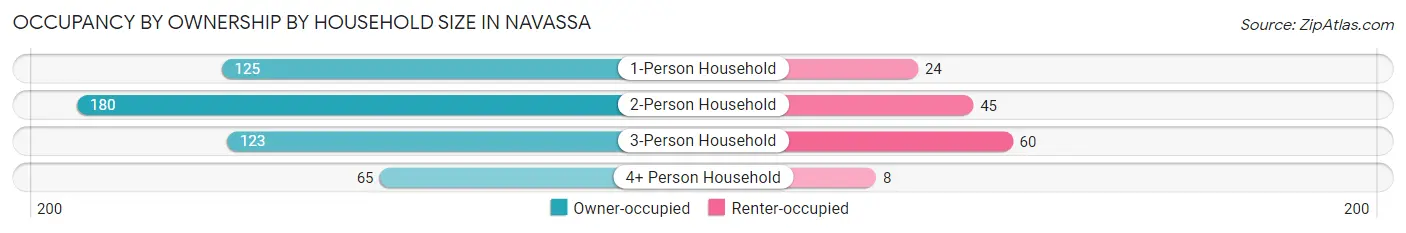
| Household Size | Owner-occupied | Renter-occupied |
| 1-Person Household | 125 (83.9%) | 24 (16.1%) |
| 2-Person Household | 180 (80.0%) | 45 (20.0%) |
| 3-Person Household | 123 (67.2%) | 60 (32.8%) |
| 4+ Person Household | 65 (89.0%) | 8 (11.0%) |
| Total Housing Units | 493 (78.2%) | 137 (21.7%) |
Occupancy by Educational Attainment in Navassa
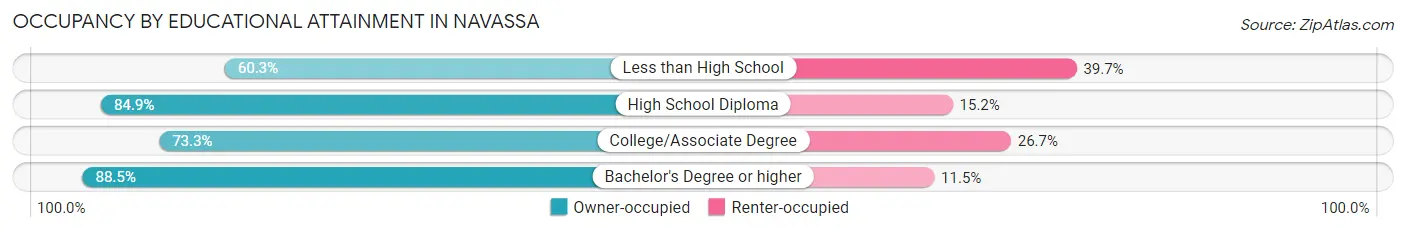
| Household Size | Owner-occupied | Renter-occupied |
| Less than High School | 41 (60.3%) | 27 (39.7%) |
| High School Diploma | 168 (84.9%) | 30 (15.1%) |
| College/Associate Degree | 184 (73.3%) | 67 (26.7%) |
| Bachelor's Degree or higher | 100 (88.5%) | 13 (11.5%) |
Occupancy by Age of Householder in Navassa
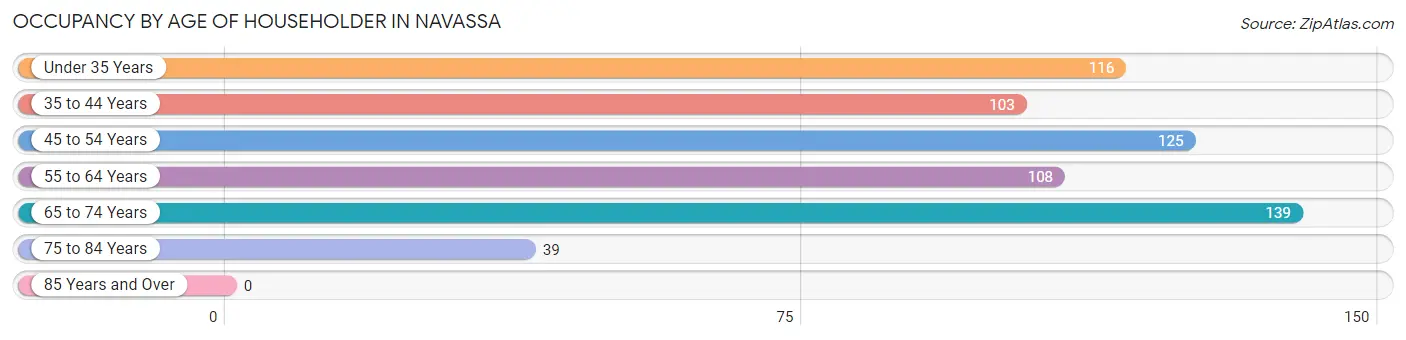
| Age Bracket | # Households | % Households |
| Under 35 Years | 116 | 18.4% |
| 35 to 44 Years | 103 | 16.4% |
| 45 to 54 Years | 125 | 19.8% |
| 55 to 64 Years | 108 | 17.1% |
| 65 to 74 Years | 139 | 22.1% |
| 75 to 84 Years | 39 | 6.2% |
| 85 Years and Over | 0 | 0.0% |
| Total | 630 | 100.0% |
Housing Finances in Navassa
Median Income by Occupancy in Navassa
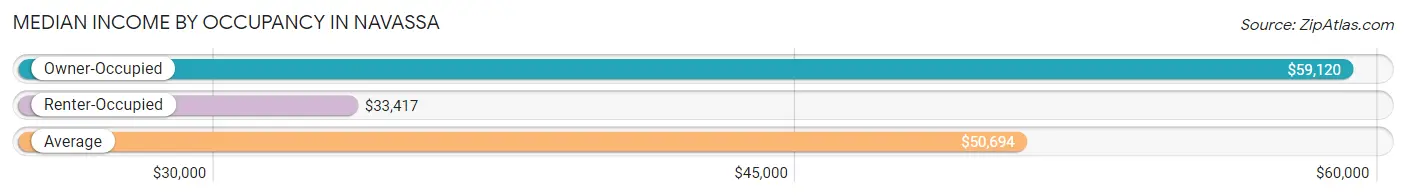
| Occupancy Type | # Households | Median Income |
| Owner-Occupied | 493 (78.2%) | $59,120 |
| Renter-Occupied | 137 (21.7%) | $33,417 |
| Average | 630 (100.0%) | $50,694 |
Occupancy by Householder Income Bracket in Navassa
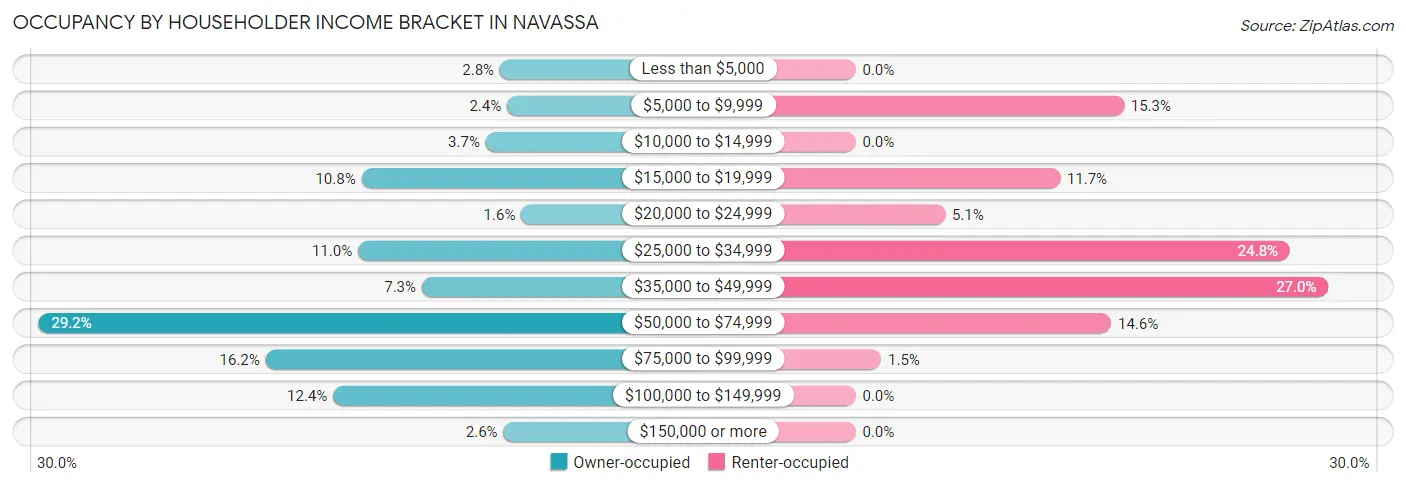
| Income Bracket | Owner-occupied | Renter-occupied |
| Less than $5,000 | 14 (2.8%) | 0 (0.0%) |
| $5,000 to $9,999 | 12 (2.4%) | 21 (15.3%) |
| $10,000 to $14,999 | 18 (3.6%) | 0 (0.0%) |
| $15,000 to $19,999 | 53 (10.7%) | 16 (11.7%) |
| $20,000 to $24,999 | 8 (1.6%) | 7 (5.1%) |
| $25,000 to $34,999 | 54 (11.0%) | 34 (24.8%) |
| $35,000 to $49,999 | 36 (7.3%) | 37 (27.0%) |
| $50,000 to $74,999 | 144 (29.2%) | 20 (14.6%) |
| $75,000 to $99,999 | 80 (16.2%) | 2 (1.5%) |
| $100,000 to $149,999 | 61 (12.4%) | 0 (0.0%) |
| $150,000 or more | 13 (2.6%) | 0 (0.0%) |
| Total | 493 (100.0%) | 137 (100.0%) |
Monthly Housing Cost Tiers in Navassa
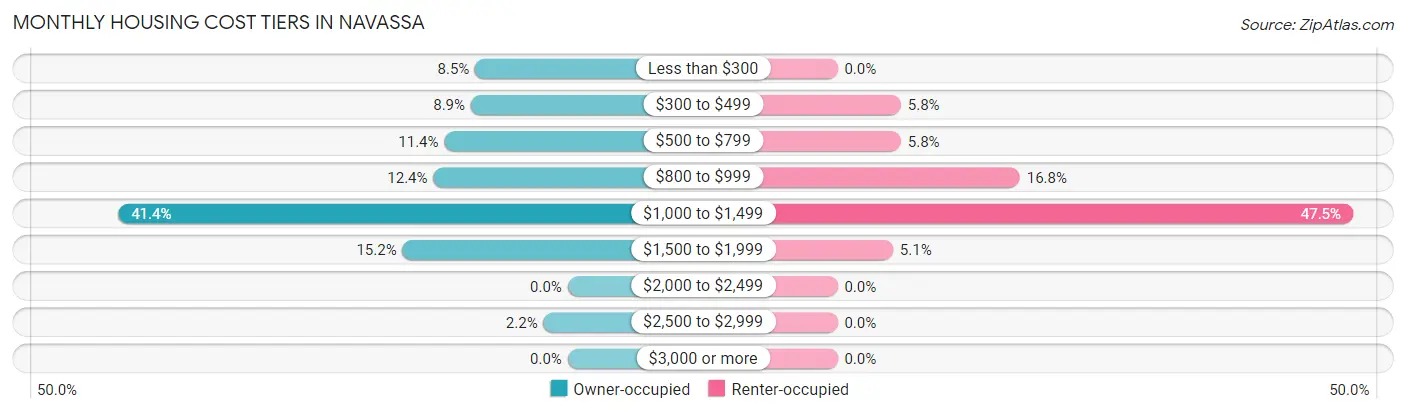
| Monthly Cost | Owner-occupied | Renter-occupied |
| Less than $300 | 42 (8.5%) | 0 (0.0%) |
| $300 to $499 | 44 (8.9%) | 8 (5.8%) |
| $500 to $799 | 56 (11.4%) | 8 (5.8%) |
| $800 to $999 | 61 (12.4%) | 23 (16.8%) |
| $1,000 to $1,499 | 204 (41.4%) | 65 (47.4%) |
| $1,500 to $1,999 | 75 (15.2%) | 7 (5.1%) |
| $2,000 to $2,499 | 0 (0.0%) | 0 (0.0%) |
| $2,500 to $2,999 | 11 (2.2%) | 0 (0.0%) |
| $3,000 or more | 0 (0.0%) | 0 (0.0%) |
| Total | 493 (100.0%) | 137 (100.0%) |
Physical Housing Characteristics in Navassa
Housing Structures in Navassa

| Structure Type | # Housing Units | % Housing Units |
| Single Unit, Detached | 427 | 67.8% |
| Single Unit, Attached | 20 | 3.2% |
| 2 Unit Apartments | 14 | 2.2% |
| 3 or 4 Unit Apartments | 0 | 0.0% |
| 5 to 9 Unit Apartments | 0 | 0.0% |
| 10 or more Apartments | 0 | 0.0% |
| Mobile Home / Other | 169 | 26.8% |
| Total | 630 | 100.0% |
Housing Structures by Occupancy in Navassa
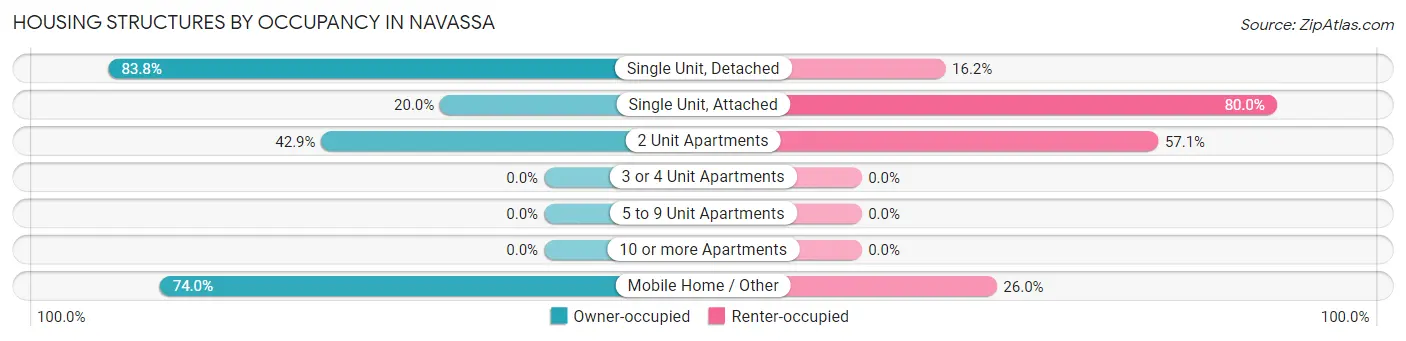
| Structure Type | Owner-occupied | Renter-occupied |
| Single Unit, Detached | 358 (83.8%) | 69 (16.2%) |
| Single Unit, Attached | 4 (20.0%) | 16 (80.0%) |
| 2 Unit Apartments | 6 (42.9%) | 8 (57.1%) |
| 3 or 4 Unit Apartments | 0 (0.0%) | 0 (0.0%) |
| 5 to 9 Unit Apartments | 0 (0.0%) | 0 (0.0%) |
| 10 or more Apartments | 0 (0.0%) | 0 (0.0%) |
| Mobile Home / Other | 125 (74.0%) | 44 (26.0%) |
| Total | 493 (78.2%) | 137 (21.7%) |
Housing Structures by Number of Rooms in Navassa
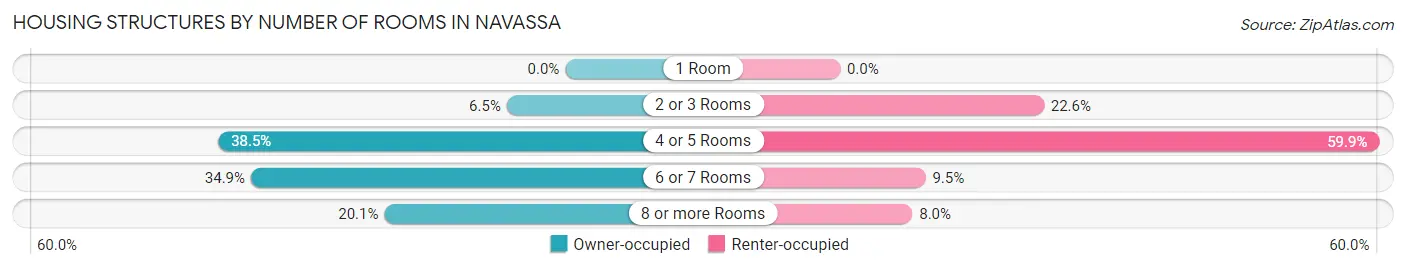
| Number of Rooms | Owner-occupied | Renter-occupied |
| 1 Room | 0 (0.0%) | 0 (0.0%) |
| 2 or 3 Rooms | 32 (6.5%) | 31 (22.6%) |
| 4 or 5 Rooms | 190 (38.5%) | 82 (59.9%) |
| 6 or 7 Rooms | 172 (34.9%) | 13 (9.5%) |
| 8 or more Rooms | 99 (20.1%) | 11 (8.0%) |
| Total | 493 (100.0%) | 137 (100.0%) |
Housing Structure by Heating Type in Navassa
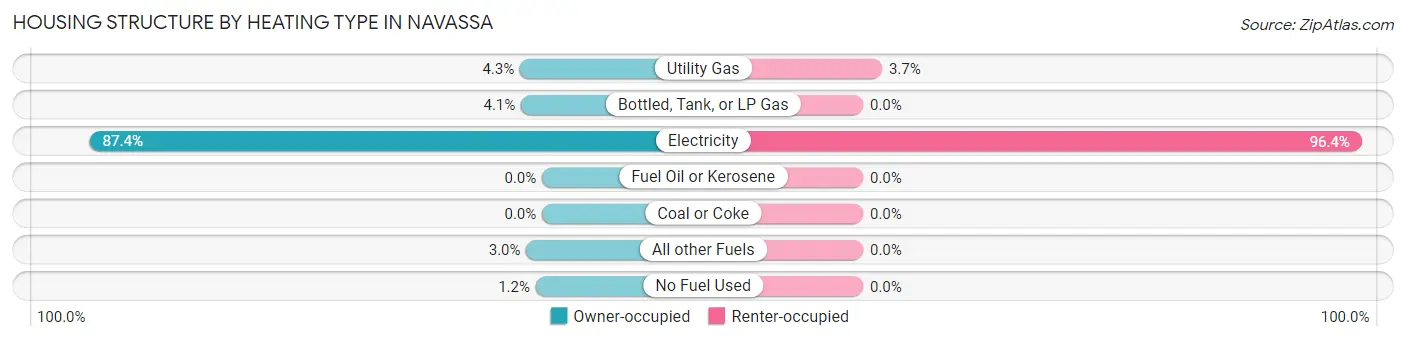
| Heating Type | Owner-occupied | Renter-occupied |
| Utility Gas | 21 (4.3%) | 5 (3.6%) |
| Bottled, Tank, or LP Gas | 20 (4.1%) | 0 (0.0%) |
| Electricity | 431 (87.4%) | 132 (96.4%) |
| Fuel Oil or Kerosene | 0 (0.0%) | 0 (0.0%) |
| Coal or Coke | 0 (0.0%) | 0 (0.0%) |
| All other Fuels | 15 (3.0%) | 0 (0.0%) |
| No Fuel Used | 6 (1.2%) | 0 (0.0%) |
| Total | 493 (100.0%) | 137 (100.0%) |
Household Vehicle Usage in Navassa
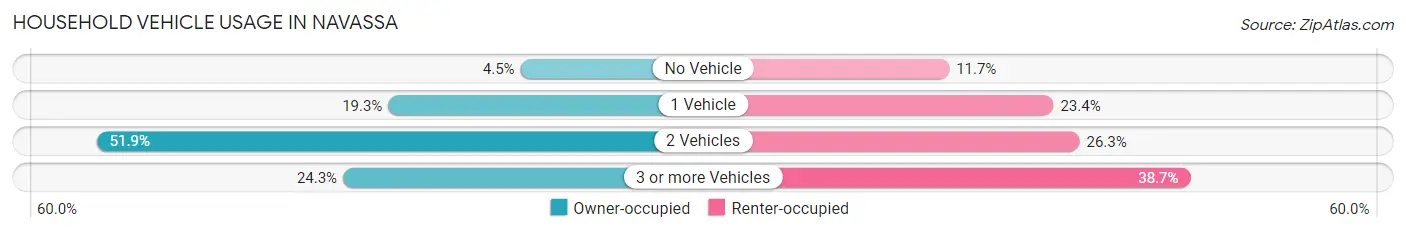
| Vehicles per Household | Owner-occupied | Renter-occupied |
| No Vehicle | 22 (4.5%) | 16 (11.7%) |
| 1 Vehicle | 95 (19.3%) | 32 (23.4%) |
| 2 Vehicles | 256 (51.9%) | 36 (26.3%) |
| 3 or more Vehicles | 120 (24.3%) | 53 (38.7%) |
| Total | 493 (100.0%) | 137 (100.0%) |
Real Estate & Mortgages in Navassa
Real Estate and Mortgage Overview in Navassa
| Characteristic | Without Mortgage | With Mortgage |
| Housing Units | 145 | 348 |
| Median Property Value | $136,600 | $187,100 |
| Median Household Income | $65,417 | $13 |
| Monthly Housing Costs | $396 | $0 |
| Real Estate Taxes | $981 | $0 |
Property Value by Mortgage Status in Navassa
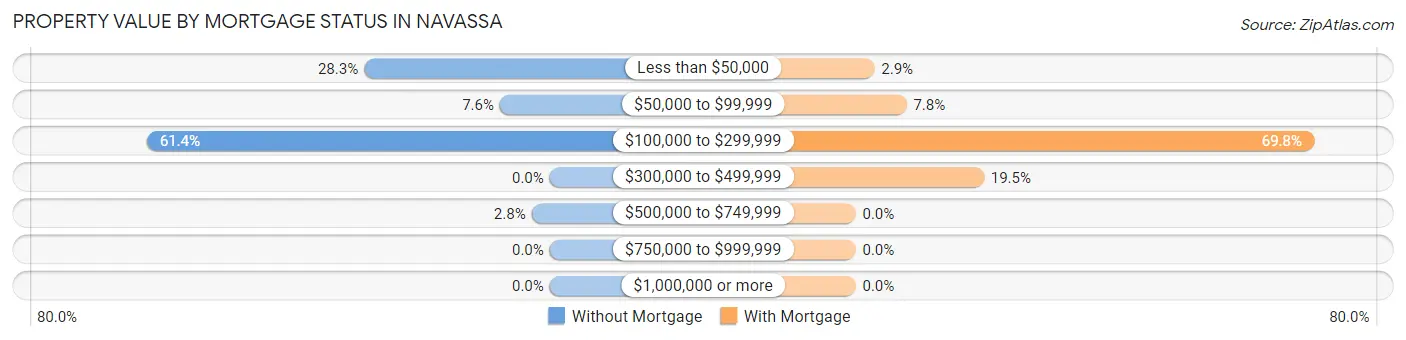
| Property Value | Without Mortgage | With Mortgage |
| Less than $50,000 | 41 (28.3%) | 10 (2.9%) |
| $50,000 to $99,999 | 11 (7.6%) | 27 (7.8%) |
| $100,000 to $299,999 | 89 (61.4%) | 243 (69.8%) |
| $300,000 to $499,999 | 0 (0.0%) | 68 (19.5%) |
| $500,000 to $749,999 | 4 (2.8%) | 0 (0.0%) |
| $750,000 to $999,999 | 0 (0.0%) | 0 (0.0%) |
| $1,000,000 or more | 0 (0.0%) | 0 (0.0%) |
| Total | 145 (100.0%) | 348 (100.0%) |
Household Income by Mortgage Status in Navassa
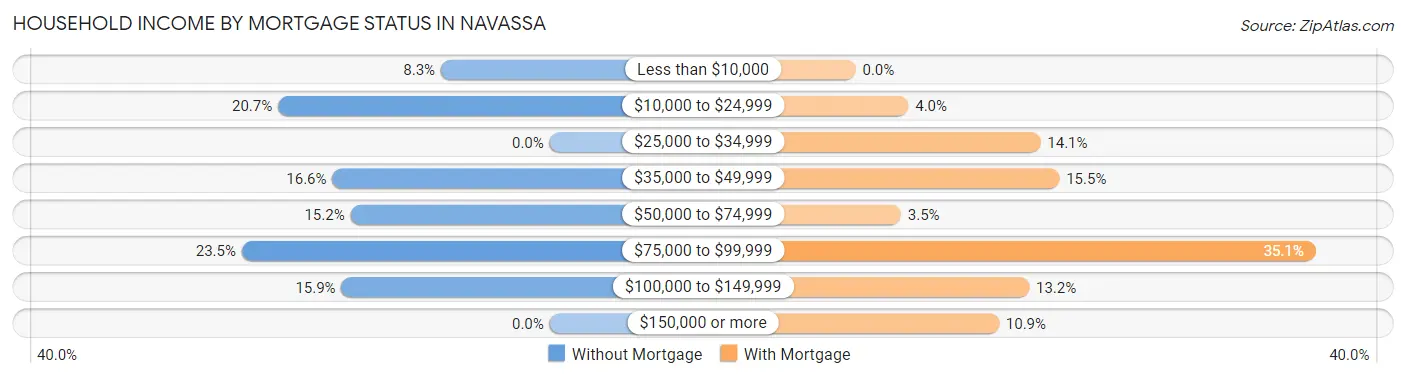
| Household Income | Without Mortgage | With Mortgage |
| Less than $10,000 | 12 (8.3%) | 0 (0.0%) |
| $10,000 to $24,999 | 30 (20.7%) | 14 (4.0%) |
| $25,000 to $34,999 | 0 (0.0%) | 49 (14.1%) |
| $35,000 to $49,999 | 24 (16.6%) | 54 (15.5%) |
| $50,000 to $74,999 | 22 (15.2%) | 12 (3.5%) |
| $75,000 to $99,999 | 34 (23.4%) | 122 (35.1%) |
| $100,000 to $149,999 | 23 (15.9%) | 46 (13.2%) |
| $150,000 or more | 0 (0.0%) | 38 (10.9%) |
| Total | 145 (100.0%) | 348 (100.0%) |
Property Value to Household Income Ratio in Navassa
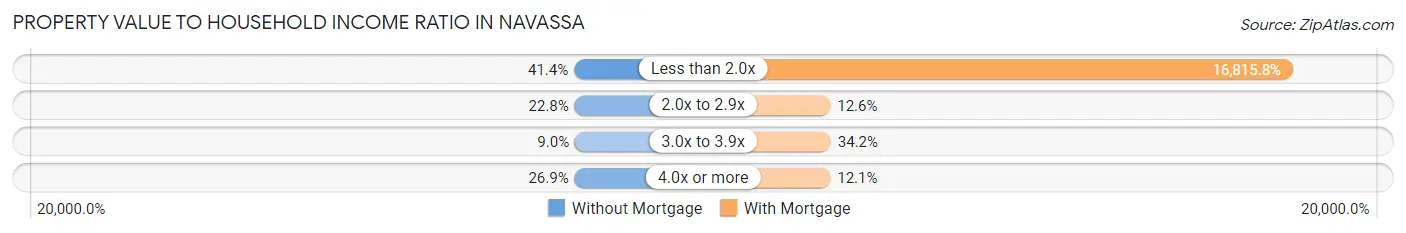
| Value-to-Income Ratio | Without Mortgage | With Mortgage |
| Less than 2.0x | 60 (41.4%) | 58,519 (16,815.8%) |
| 2.0x to 2.9x | 33 (22.8%) | 44 (12.6%) |
| 3.0x to 3.9x | 13 (9.0%) | 119 (34.2%) |
| 4.0x or more | 39 (26.9%) | 42 (12.1%) |
| Total | 145 (100.0%) | 348 (100.0%) |
Real Estate Taxes by Mortgage Status in Navassa
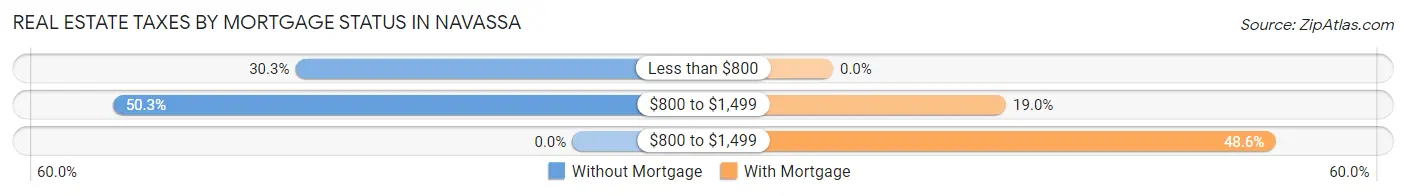
| Property Taxes | Without Mortgage | With Mortgage |
| Less than $800 | 44 (30.3%) | 0 (0.0%) |
| $800 to $1,499 | 73 (50.3%) | 66 (19.0%) |
| $800 to $1,499 | 0 (0.0%) | 169 (48.6%) |
| Total | 145 (100.0%) | 348 (100.0%) |
Health & Disability in Navassa
Health Insurance Coverage by Age in Navassa
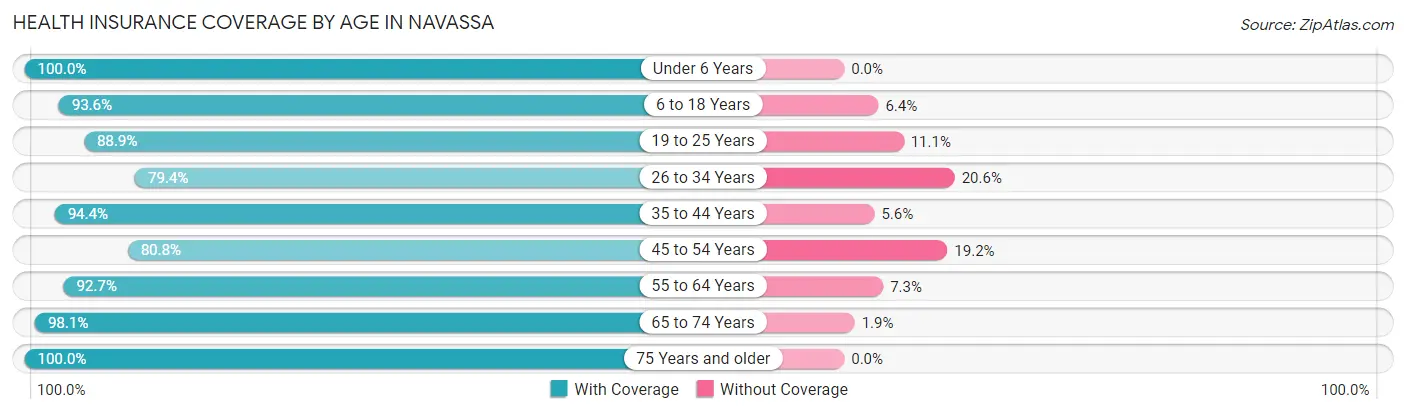
| Age Bracket | With Coverage | Without Coverage |
| Under 6 Years | 132 (100.0%) | 0 (0.0%) |
| 6 to 18 Years | 279 (93.6%) | 19 (6.4%) |
| 19 to 25 Years | 369 (88.9%) | 46 (11.1%) |
| 26 to 34 Years | 158 (79.4%) | 41 (20.6%) |
| 35 to 44 Years | 252 (94.4%) | 15 (5.6%) |
| 45 to 54 Years | 147 (80.8%) | 35 (19.2%) |
| 55 to 64 Years | 166 (92.7%) | 13 (7.3%) |
| 65 to 74 Years | 253 (98.1%) | 5 (1.9%) |
| 75 Years and older | 46 (100.0%) | 0 (0.0%) |
| Total | 1,802 (91.2%) | 174 (8.8%) |
Health Insurance Coverage by Citizenship Status in Navassa
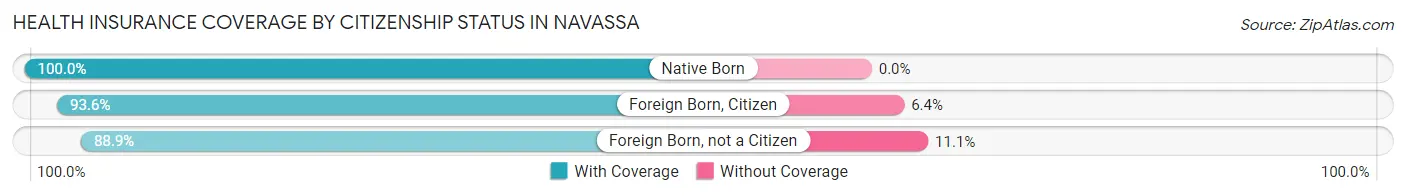
| Citizenship Status | With Coverage | Without Coverage |
| Native Born | 132 (100.0%) | 0 (0.0%) |
| Foreign Born, Citizen | 279 (93.6%) | 19 (6.4%) |
| Foreign Born, not a Citizen | 369 (88.9%) | 46 (11.1%) |
Health Insurance Coverage by Household Income in Navassa
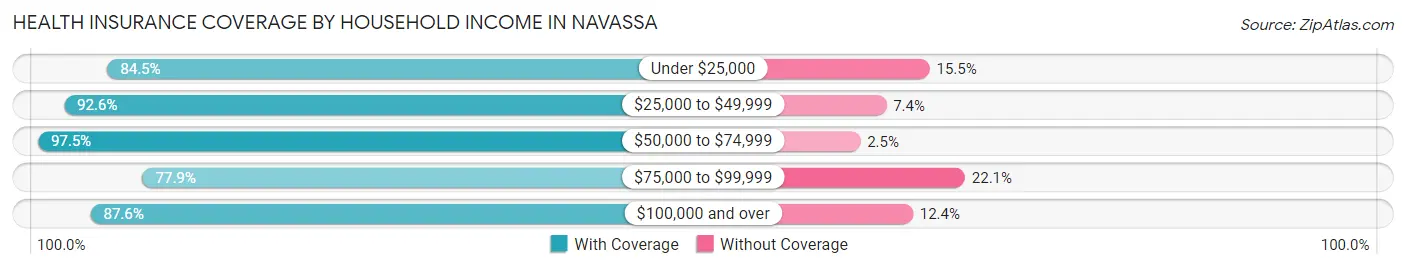
| Household Income | With Coverage | Without Coverage |
| Under $25,000 | 207 (84.5%) | 38 (15.5%) |
| $25,000 to $49,999 | 401 (92.6%) | 32 (7.4%) |
| $50,000 to $74,999 | 777 (97.5%) | 20 (2.5%) |
| $75,000 to $99,999 | 176 (77.9%) | 50 (22.1%) |
| $100,000 and over | 241 (87.6%) | 34 (12.4%) |
Public vs Private Health Insurance Coverage by Age in Navassa
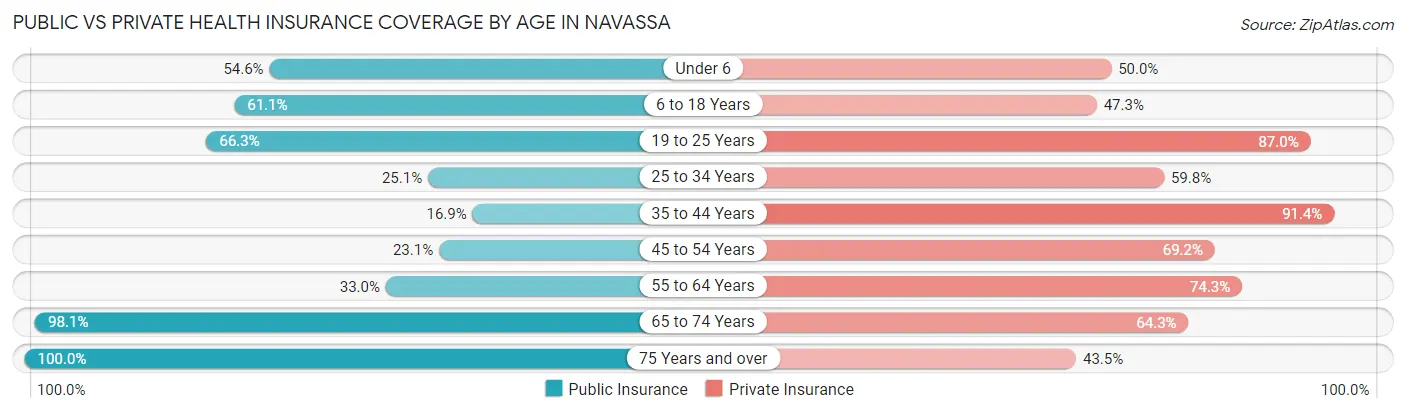
| Age Bracket | Public Insurance | Private Insurance |
| Under 6 | 72 (54.5%) | 66 (50.0%) |
| 6 to 18 Years | 182 (61.1%) | 141 (47.3%) |
| 19 to 25 Years | 275 (66.3%) | 361 (87.0%) |
| 25 to 34 Years | 50 (25.1%) | 119 (59.8%) |
| 35 to 44 Years | 45 (16.9%) | 244 (91.4%) |
| 45 to 54 Years | 42 (23.1%) | 126 (69.2%) |
| 55 to 64 Years | 59 (33.0%) | 133 (74.3%) |
| 65 to 74 Years | 253 (98.1%) | 166 (64.3%) |
| 75 Years and over | 46 (100.0%) | 20 (43.5%) |
| Total | 1,024 (51.8%) | 1,376 (69.6%) |
Disability Status by Sex by Age in Navassa
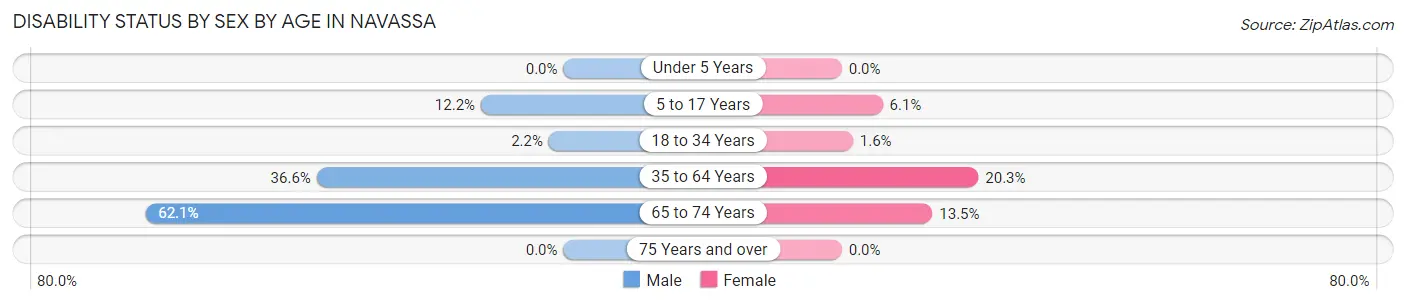
| Age Bracket | Male | Female |
| Under 5 Years | 0 (0.0%) | 0 (0.0%) |
| 5 to 17 Years | 18 (12.2%) | 8 (6.1%) |
| 18 to 34 Years | 5 (2.2%) | 7 (1.6%) |
| 35 to 64 Years | 100 (36.6%) | 72 (20.3%) |
| 65 to 74 Years | 54 (62.1%) | 23 (13.5%) |
| 75 Years and over | 0 (0.0%) | 0 (0.0%) |
Disability Class by Sex by Age in Navassa
Disability Class: Hearing Difficulty
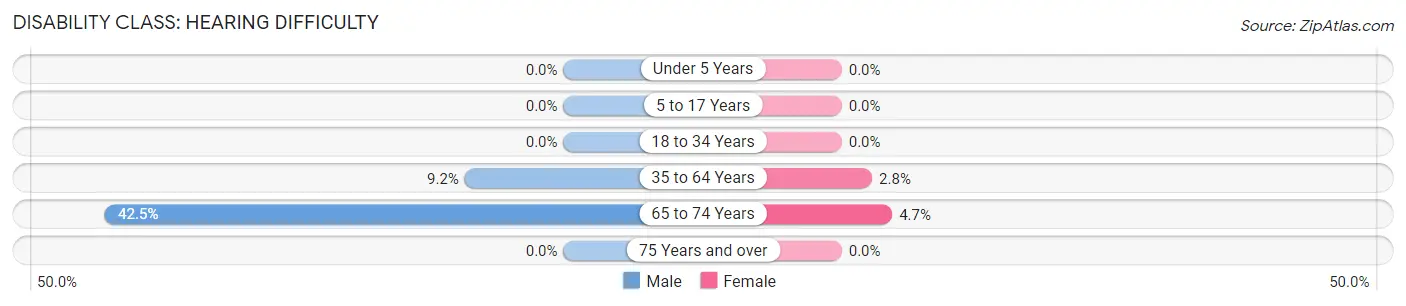
| Age Bracket | Male | Female |
| Under 5 Years | 0 (0.0%) | 0 (0.0%) |
| 5 to 17 Years | 0 (0.0%) | 0 (0.0%) |
| 18 to 34 Years | 0 (0.0%) | 0 (0.0%) |
| 35 to 64 Years | 25 (9.2%) | 10 (2.8%) |
| 65 to 74 Years | 37 (42.5%) | 8 (4.7%) |
| 75 Years and over | 0 (0.0%) | 0 (0.0%) |
Disability Class: Vision Difficulty
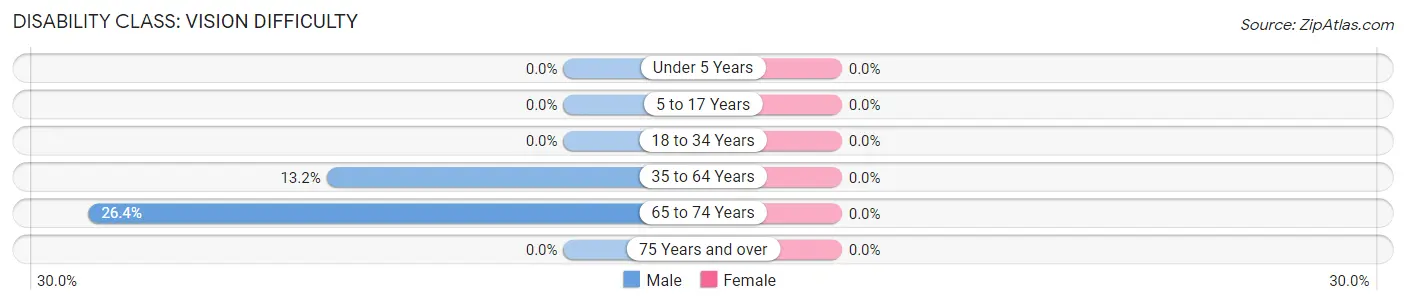
| Age Bracket | Male | Female |
| Under 5 Years | 0 (0.0%) | 0 (0.0%) |
| 5 to 17 Years | 0 (0.0%) | 0 (0.0%) |
| 18 to 34 Years | 0 (0.0%) | 0 (0.0%) |
| 35 to 64 Years | 36 (13.2%) | 0 (0.0%) |
| 65 to 74 Years | 23 (26.4%) | 0 (0.0%) |
| 75 Years and over | 0 (0.0%) | 0 (0.0%) |
Disability Class: Cognitive Difficulty
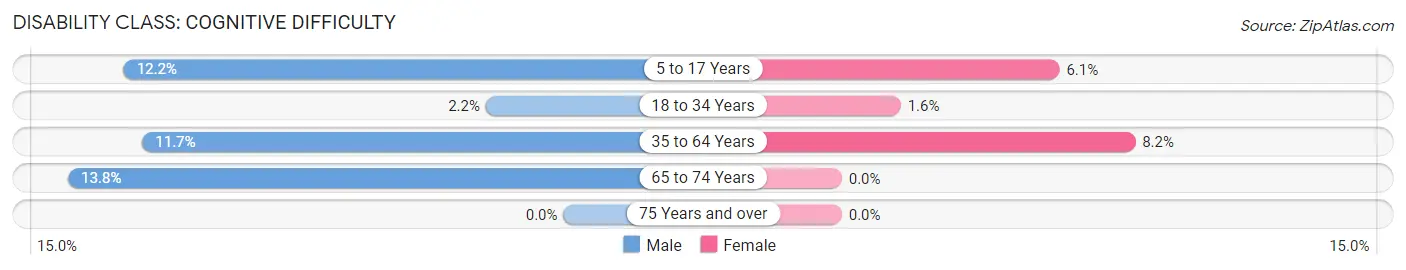
| Age Bracket | Male | Female |
| 5 to 17 Years | 18 (12.2%) | 8 (6.1%) |
| 18 to 34 Years | 5 (2.2%) | 7 (1.6%) |
| 35 to 64 Years | 32 (11.7%) | 29 (8.2%) |
| 65 to 74 Years | 12 (13.8%) | 0 (0.0%) |
| 75 Years and over | 0 (0.0%) | 0 (0.0%) |
Disability Class: Ambulatory Difficulty
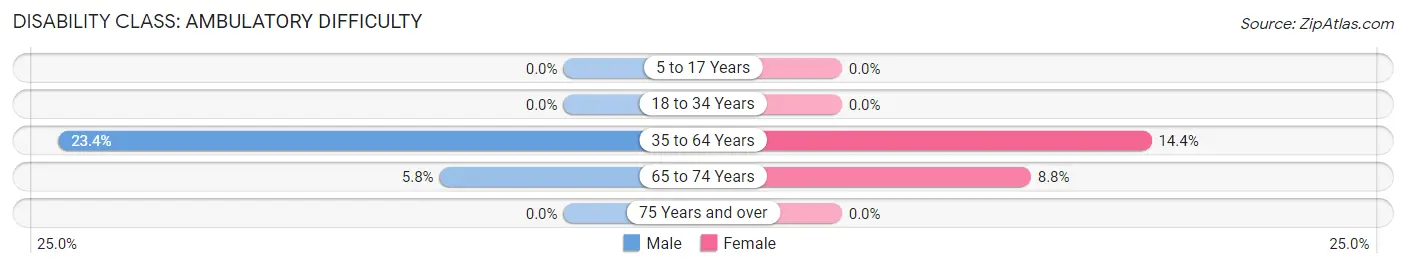
| Age Bracket | Male | Female |
| 5 to 17 Years | 0 (0.0%) | 0 (0.0%) |
| 18 to 34 Years | 0 (0.0%) | 0 (0.0%) |
| 35 to 64 Years | 64 (23.4%) | 51 (14.4%) |
| 65 to 74 Years | 5 (5.8%) | 15 (8.8%) |
| 75 Years and over | 0 (0.0%) | 0 (0.0%) |
Disability Class: Self-Care Difficulty
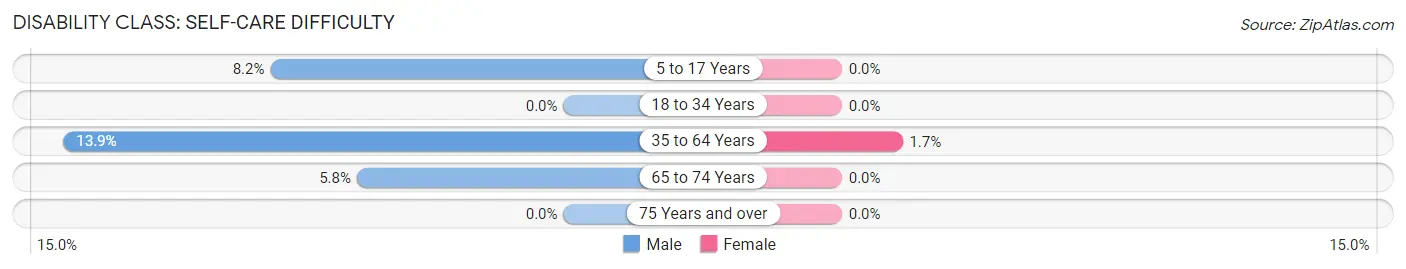
| Age Bracket | Male | Female |
| 5 to 17 Years | 12 (8.2%) | 0 (0.0%) |
| 18 to 34 Years | 0 (0.0%) | 0 (0.0%) |
| 35 to 64 Years | 38 (13.9%) | 6 (1.7%) |
| 65 to 74 Years | 5 (5.8%) | 0 (0.0%) |
| 75 Years and over | 0 (0.0%) | 0 (0.0%) |
Technology Access in Navassa
Computing Device Access in Navassa
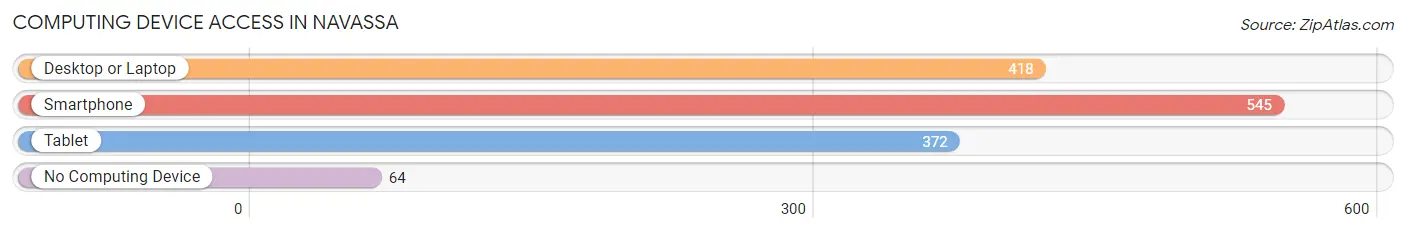
| Device Type | # Households | % Households |
| Desktop or Laptop | 418 | 66.3% |
| Smartphone | 545 | 86.5% |
| Tablet | 372 | 59.1% |
| No Computing Device | 64 | 10.2% |
| Total | 630 | 100.0% |
Internet Access in Navassa
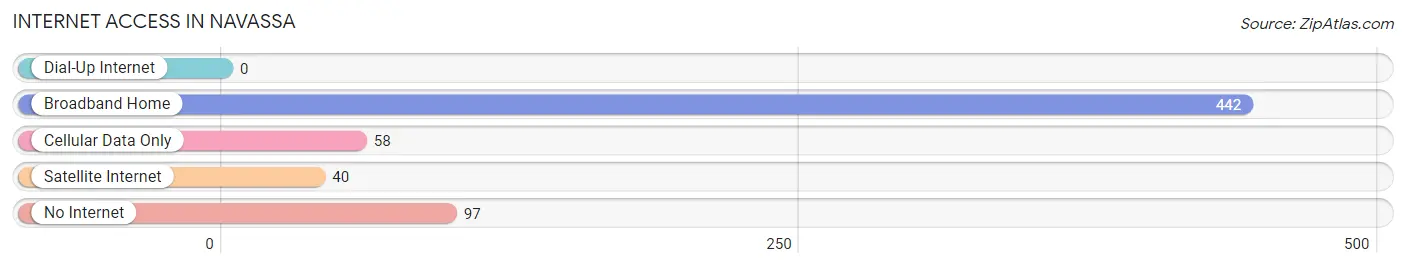
| Internet Type | # Households | % Households |
| Dial-Up Internet | 0 | 0.0% |
| Broadband Home | 442 | 70.2% |
| Cellular Data Only | 58 | 9.2% |
| Satellite Internet | 40 | 6.4% |
| No Internet | 97 | 15.4% |
| Total | 630 | 100.0% |
Navassa Summary
Navassa is a small town located in Brunswick County, North Carolina. It is situated on the banks of the Cape Fear River, approximately 20 miles north of Wilmington. The town has a population of approximately 1,500 people and is part of the Wilmington Metropolitan Statistical Area.
History
Navassa was founded in 1883 by the Navassa Phosphate Company, which was established to mine phosphate from the area. The company was owned by the prominent Wilmington businessman, John D. Bellamy. The town was named after the nearby Navassa Island, which was named after the Spanish navigator, Juan de la Navas. The town grew rapidly in the late 19th century, and by 1900, it had a population of over 1,000 people.
The town was incorporated in 1901 and was home to a variety of businesses, including a sawmill, a brickyard, a cotton gin, and a phosphate plant. The town also had a railroad station, which connected it to Wilmington and other nearby towns.
In the early 20th century, the town began to decline as the phosphate industry declined. The town was hit hard by the Great Depression and World War II, and by the 1950s, the population had dropped to just over 500 people.
Geography
Navassa is located in southeastern North Carolina, approximately 20 miles north of Wilmington. The town is situated on the banks of the Cape Fear River, and is surrounded by a variety of natural features, including the Green Swamp, the Brunswick River, and the Intracoastal Waterway.
The town has a total area of 1.2 square miles, all of which is land. The town is located in a humid subtropical climate zone, and has mild winters and hot, humid summers.
Economy
Navassa’s economy is largely based on agriculture and tourism. The town is home to a variety of farms, including vegetable farms, poultry farms, and hog farms. The town is also home to a number of tourist attractions, including the Navassa National Wildlife Refuge, the Navassa Island National Wildlife Refuge, and the Navassa Island State Park.
Demographics
As of the 2010 census, Navassa had a population of 1,479 people. The racial makeup of the town was 79.2% White, 16.2% African American, 0.7% Native American, 0.3% Asian, 0.1% Pacific Islander, and 3.5% from other races. The median household income was $31,250, and the median family income was $37,500.
Navassa is a small town with a rich history and a diverse population. The town is home to a variety of businesses and attractions, and is a popular destination for tourists and outdoor enthusiasts. The town is also home to a variety of farms, which provide employment opportunities for local residents.
Common Questions
What is the Total Population of Navassa?
Total Population of Navassa is 1,976.
What is the Total Male Population of Navassa?
Total Male Population of Navassa is 818.
What is the Total Female Population of Navassa?
Total Female Population of Navassa is 1,158.
What is the Ratio of Males per 100 Females in Navassa?
There are 70.64 Males per 100 Females in Navassa.
What is the Ratio of Females per 100 Males in Navassa?
There are 141.56 Females per 100 Males in Navassa.
What is the Median Population Age in Navassa?
Median Population Age in Navassa is 32.7 Years.
What is the Average Family Size in Navassa
Average Family Size in Navassa is 3.6 People.
What is the Average Household Size in Navassa
Average Household Size in Navassa is 3.1 People.
What is Per Capita Income in Navassa?
Per Capita income in Navassa is $20,939.
What is the Median Family Income in Navassa?
Median Family Income in Navassa is $57,303.
What is the Median Household income in Navassa?
Median Household Income in Navassa is $50,694.
What is Income or Wage Gap in Navassa?
Income or Wage Gap in Navassa is 27.8%.
Women in Navassa earn 72.2 cents for every dollar earned by a man.
What is Inequality or Gini Index in Navassa?
Inequality or Gini Index in Navassa is 0.37.
How Large is the Labor Force in Navassa?
There are 814 People in the Labor Forcein in Navassa.
What is the Percentage of People in the Labor Force in Navassa?
49.9% of People are in the Labor Force in Navassa.
What is the Unemployment Rate in Navassa?
Unemployment Rate in Navassa is 5.9%.