Bermuda Run, NC
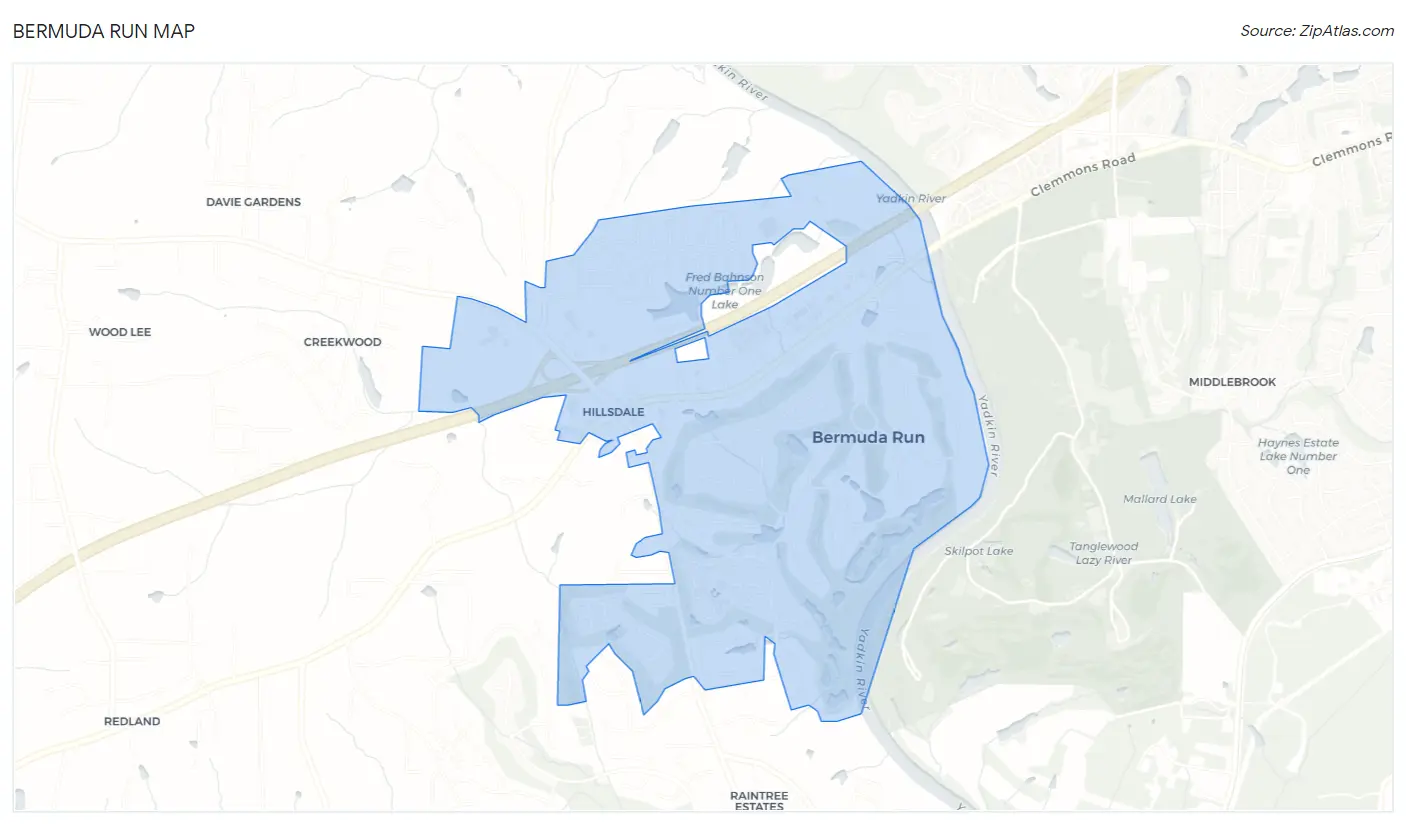
Bermuda Run Map
Bermuda Run Overview
3,118
TOTAL POPULATION
1,134
MALE POPULATION
1,984
FEMALE POPULATION
57.16
MALES / 100 FEMALES
174.96
FEMALES / 100 MALES
60.1
MEDIAN AGE
2.9
AVG FAMILY SIZE
2.0
AVG HOUSEHOLD SIZE
$51,087
PER CAPITA INCOME
$116,042
AVG FAMILY INCOME
$71,515
AVG HOUSEHOLD INCOME
48.7%
WAGE / INCOME GAP [ % ]
51.3¢/ $1
WAGE / INCOME GAP [ $ ]
0.46
INEQUALITY / GINI INDEX
1,008
LABOR FORCE [ PEOPLE ]
38.9%
PERCENT IN LABOR FORCE
Bermuda Run Area Codes
Race in Bermuda Run
The most populous races in Bermuda Run are White / Caucasian (2,920 | 93.6%), Black / African American (128 | 4.1%), and Asian (48 | 1.5%).
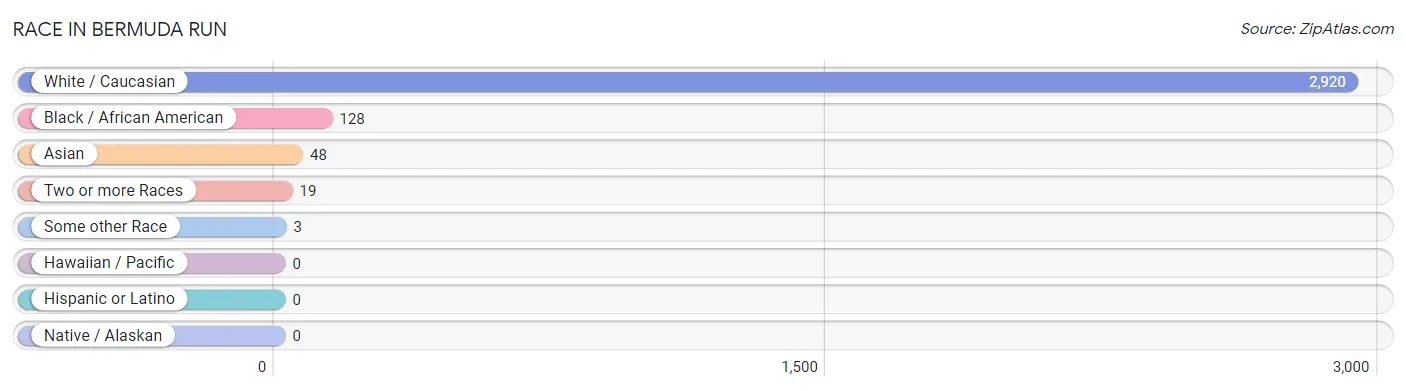
| Race | # Population | % Population |
| Asian | 48 | 1.5% |
| Black / African American | 128 | 4.1% |
| Hawaiian / Pacific | 0 | 0.0% |
| Hispanic or Latino | 0 | 0.0% |
| Native / Alaskan | 0 | 0.0% |
| White / Caucasian | 2,920 | 93.6% |
| Two or more Races | 19 | 0.6% |
| Some other Race | 3 | 0.1% |
| Total | 3,118 | 100.0% |
Ancestry in Bermuda Run
The most populous ancestries reported in Bermuda Run are English (603 | 19.3%), Irish (598 | 19.2%), German (531 | 17.0%), Italian (373 | 12.0%), and American (228 | 7.3%), together accounting for 74.8% of all Bermuda Run residents.
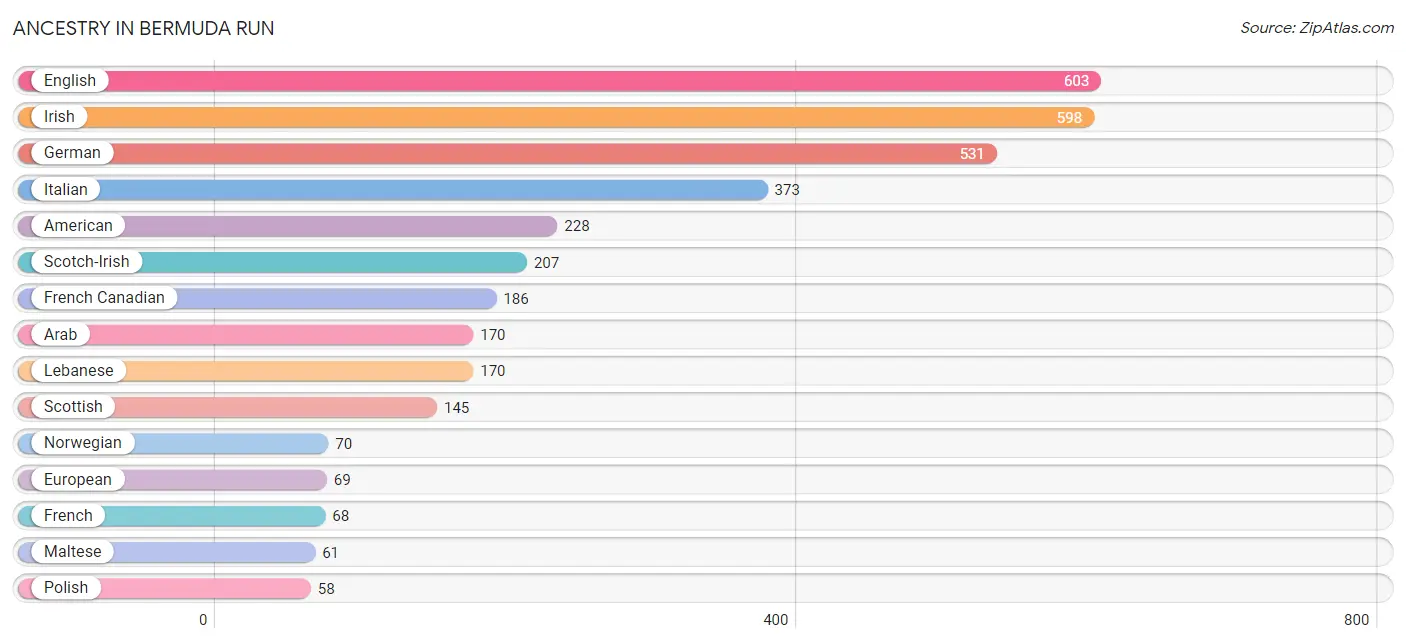
| Ancestry | # Population | % Population |
| American | 228 | 7.3% |
| Arab | 170 | 5.4% |
| Austrian | 15 | 0.5% |
| Burmese | 19 | 0.6% |
| Dutch | 14 | 0.4% |
| English | 603 | 19.3% |
| Estonian | 22 | 0.7% |
| European | 69 | 2.2% |
| French | 68 | 2.2% |
| French Canadian | 186 | 6.0% |
| German | 531 | 17.0% |
| Greek | 25 | 0.8% |
| Irish | 598 | 19.2% |
| Israeli | 44 | 1.4% |
| Italian | 373 | 12.0% |
| Korean | 48 | 1.5% |
| Lebanese | 170 | 5.4% |
| Maltese | 61 | 2.0% |
| Norwegian | 70 | 2.2% |
| Polish | 58 | 1.9% |
| Russian | 33 | 1.1% |
| Scandinavian | 27 | 0.9% |
| Scotch-Irish | 207 | 6.6% |
| Scottish | 145 | 4.6% |
| Swiss | 12 | 0.4% | View All 25 Rows |
Immigrants in Bermuda Run
The most numerous immigrant groups reported in Bermuda Run came from Europe (42 | 1.3%), Asia (35 | 1.1%), Southern Europe (19 | 0.6%), Philippines (18 | 0.6%), and South Eastern Asia (18 | 0.6%), together accounting for 4.2% of all Bermuda Run residents.
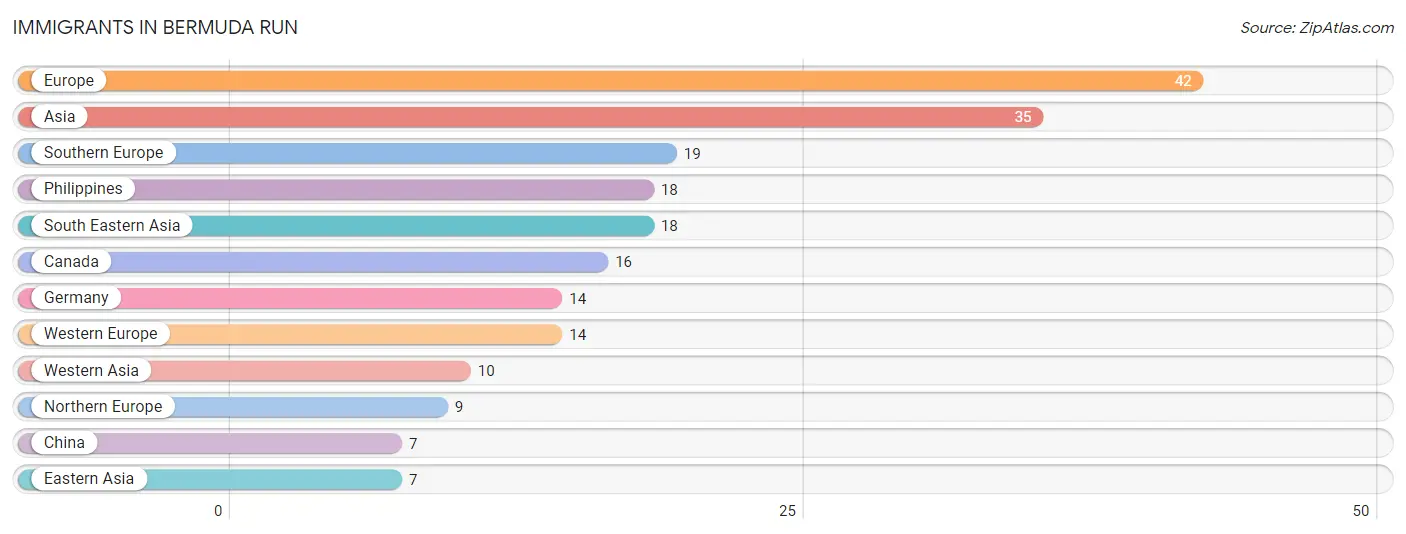
| Immigration Origin | # Population | % Population |
| Asia | 35 | 1.1% |
| Canada | 16 | 0.5% |
| China | 7 | 0.2% |
| Eastern Asia | 7 | 0.2% |
| Europe | 42 | 1.3% |
| Germany | 14 | 0.4% |
| Northern Europe | 9 | 0.3% |
| Philippines | 18 | 0.6% |
| South Eastern Asia | 18 | 0.6% |
| Southern Europe | 19 | 0.6% |
| Western Asia | 10 | 0.3% |
| Western Europe | 14 | 0.4% | View All 12 Rows |
Sex and Age in Bermuda Run
Sex and Age in Bermuda Run
The most populous age groups in Bermuda Run are 85 Years and over (132 | 11.6%) for men and 85 Years and over (384 | 19.4%) for women.
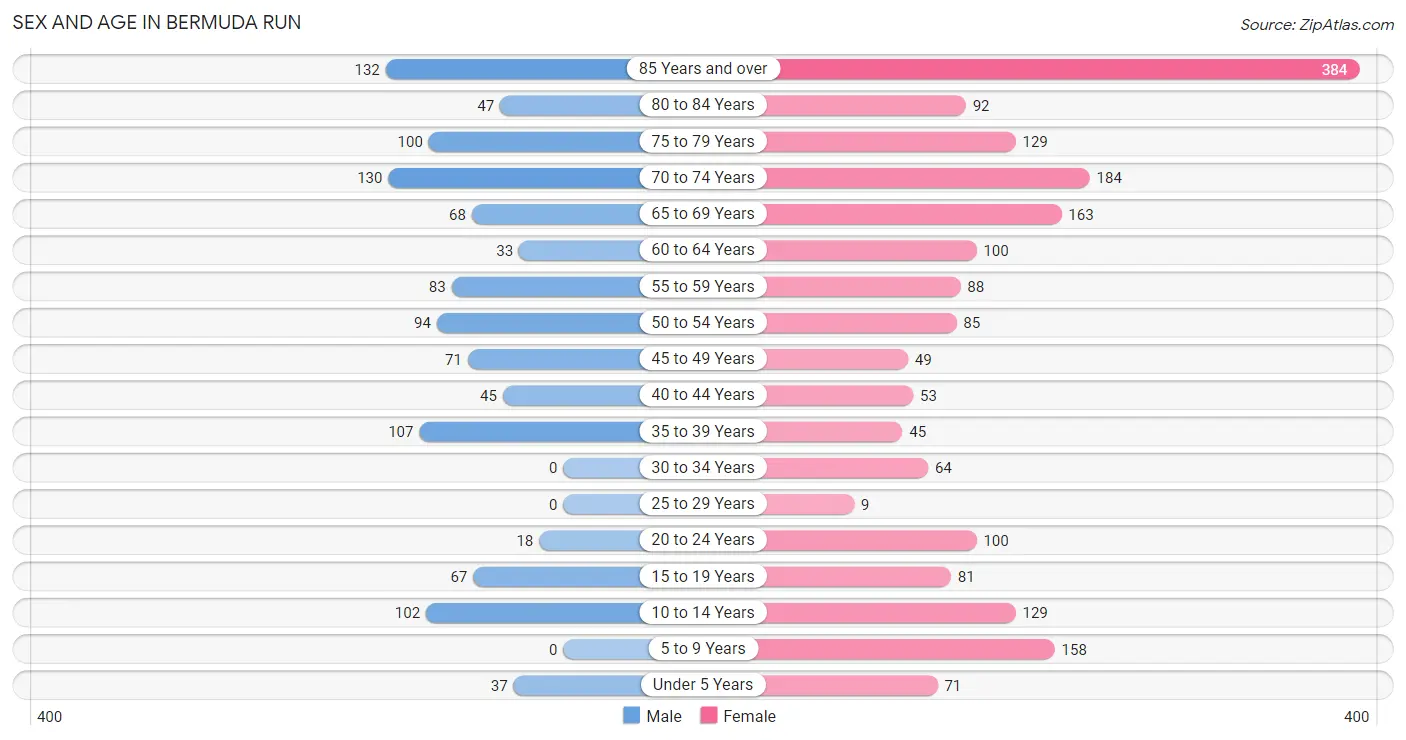
| Age Bracket | Male | Female |
| Under 5 Years | 37 (3.3%) | 71 (3.6%) |
| 5 to 9 Years | 0 (0.0%) | 158 (8.0%) |
| 10 to 14 Years | 102 (9.0%) | 129 (6.5%) |
| 15 to 19 Years | 67 (5.9%) | 81 (4.1%) |
| 20 to 24 Years | 18 (1.6%) | 100 (5.0%) |
| 25 to 29 Years | 0 (0.0%) | 9 (0.4%) |
| 30 to 34 Years | 0 (0.0%) | 64 (3.2%) |
| 35 to 39 Years | 107 (9.4%) | 45 (2.3%) |
| 40 to 44 Years | 45 (4.0%) | 53 (2.7%) |
| 45 to 49 Years | 71 (6.3%) | 49 (2.5%) |
| 50 to 54 Years | 94 (8.3%) | 85 (4.3%) |
| 55 to 59 Years | 83 (7.3%) | 88 (4.4%) |
| 60 to 64 Years | 33 (2.9%) | 100 (5.0%) |
| 65 to 69 Years | 68 (6.0%) | 163 (8.2%) |
| 70 to 74 Years | 130 (11.5%) | 184 (9.3%) |
| 75 to 79 Years | 100 (8.8%) | 129 (6.5%) |
| 80 to 84 Years | 47 (4.1%) | 92 (4.6%) |
| 85 Years and over | 132 (11.6%) | 384 (19.4%) |
| Total | 1,134 (100.0%) | 1,984 (100.0%) |
Families and Households in Bermuda Run
Median Family Size in Bermuda Run
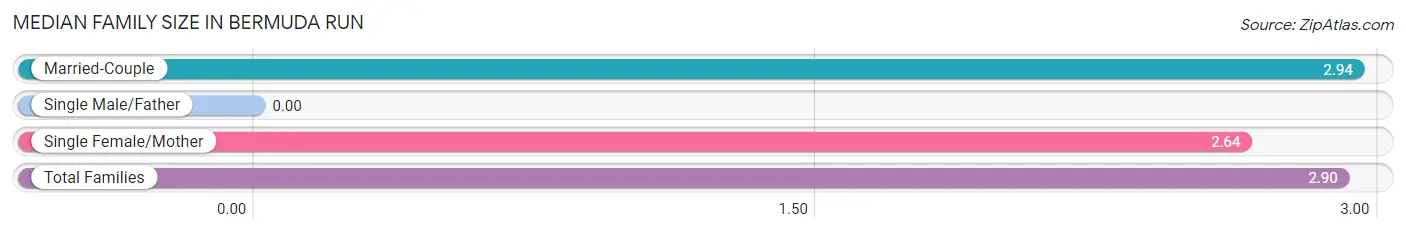
| Family Type | # Families | Family Size |
| Married-Couple | 693 (88.6%) | 2.94 |
| Single Male/Father | 0 (0.0%) | - |
| Single Female/Mother | 89 (11.4%) | 2.64 |
| Total Families | 782 (100.0%) | 2.90 |
Median Household Size in Bermuda Run
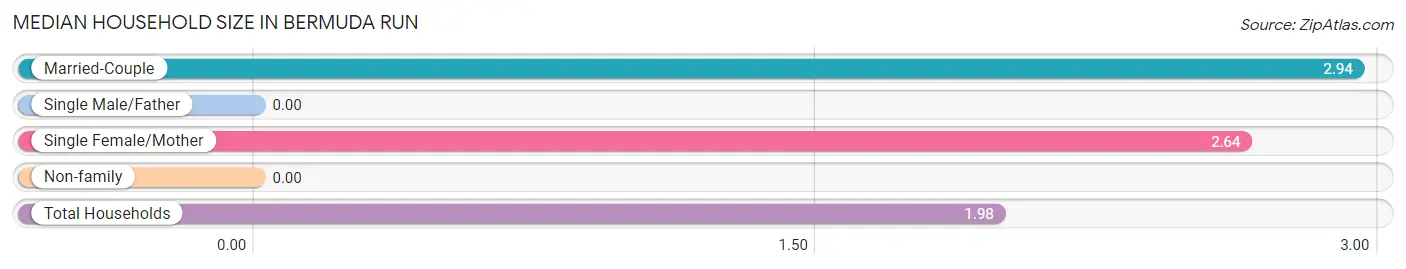
| Household Type | # Households | Household Size |
| Married-Couple | 693 (45.5%) | 2.94 |
| Single Male/Father | 0 (0.0%) | - |
| Single Female/Mother | 89 (5.8%) | 2.64 |
| Non-family | 742 (48.7%) | - |
| Total Households | 1,524 (100.0%) | 1.98 |
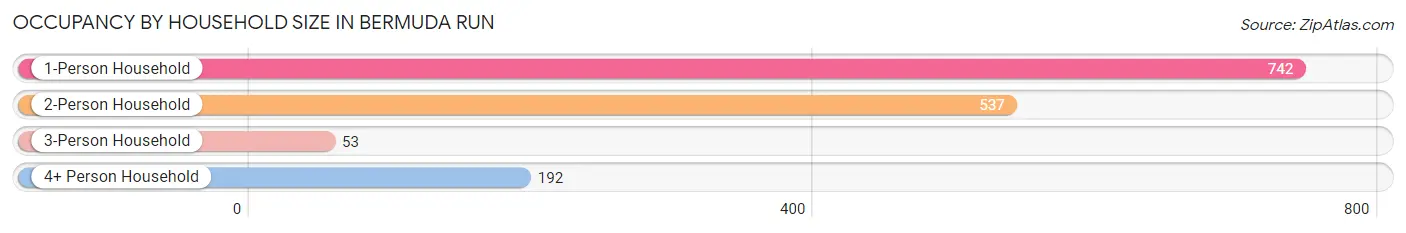
Household Size by Marriage Status in Bermuda Run
Out of a total of 1,524 households in Bermuda Run, 782 (51.3%) are family households, while 742 (48.7%) are nonfamily households. The most numerous type of family households are 2-person households, comprising 537, and the most common type of nonfamily households are 1-person households, comprising 742.
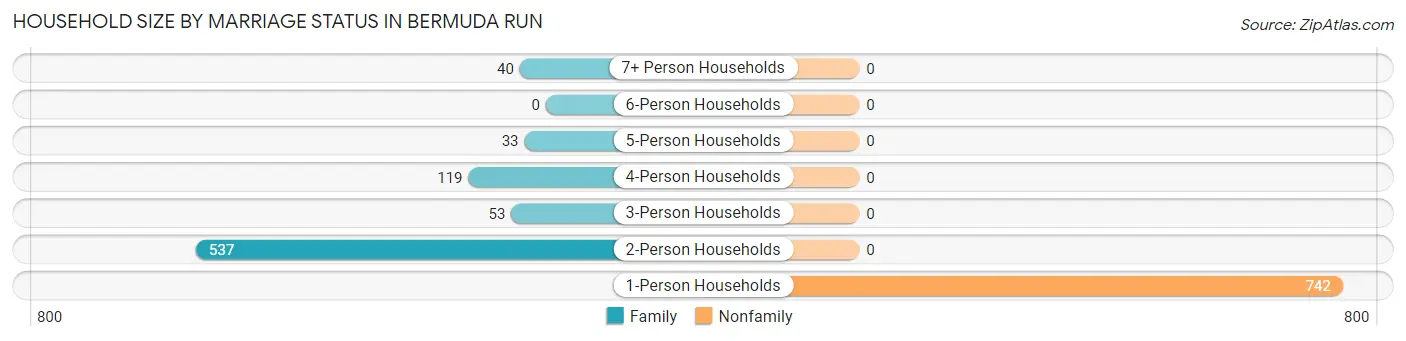
| Household Size | Family Households | Nonfamily Households |
| 1-Person Households | - | 742 (48.7%) |
| 2-Person Households | 537 (35.2%) | 0 (0.0%) |
| 3-Person Households | 53 (3.5%) | 0 (0.0%) |
| 4-Person Households | 119 (7.8%) | 0 (0.0%) |
| 5-Person Households | 33 (2.2%) | 0 (0.0%) |
| 6-Person Households | 0 (0.0%) | 0 (0.0%) |
| 7+ Person Households | 40 (2.6%) | 0 (0.0%) |
| Total | 782 (51.3%) | 742 (48.7%) |
Female Fertility in Bermuda Run
Fertility by Age in Bermuda Run
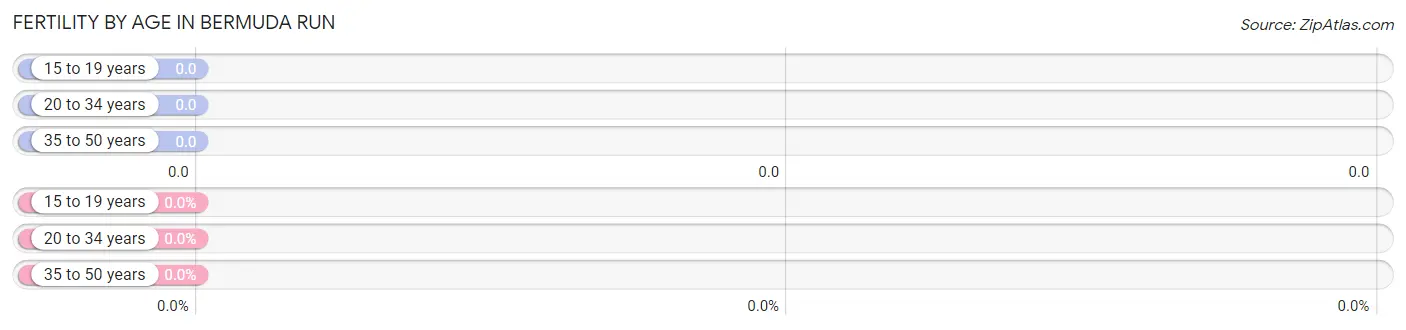
| Age Bracket | Women with Births | Births / 1,000 Women |
| 15 to 19 years | 0 (0.0%) | 0.0 |
| 20 to 34 years | 0 (0.0%) | 0.0 |
| 35 to 50 years | 0 (0.0%) | 0.0 |
| Total | 0 (0.0%) | 0.0 |
Fertility by Age by Marriage Status in Bermuda Run
| Age Bracket | Married | Unmarried |
| 15 to 19 years | 0 (0.0%) | 0 (0.0%) |
| 20 to 34 years | 0 (0.0%) | 0 (0.0%) |
| 35 to 50 years | 0 (0.0%) | 0 (0.0%) |
| Total | 0 (0.0%) | 0 (0.0%) |
Fertility by Education in Bermuda Run
| Educational Attainment | Women with Births | Births / 1,000 Women |
| Less than High School | 0 (0.0%) | 0.0 |
| High School Diploma | 0 (0.0%) | 0.0 |
| College or Associate's Degree | 0 (0.0%) | 0.0 |
| Bachelor's Degree | 0 (0.0%) | 0.0 |
| Graduate Degree | 0 (0.0%) | 0.0 |
| Total | 0 (0.0%) | 0.0 |
Fertility by Education by Marriage Status in Bermuda Run
| Educational Attainment | Married | Unmarried |
| Less than High School | 0 (0.0%) | 0 (0.0%) |
| High School Diploma | 0 (0.0%) | 0 (0.0%) |
| College or Associate's Degree | 0 (0.0%) | 0 (0.0%) |
| Bachelor's Degree | 0 (0.0%) | 0 (0.0%) |
| Graduate Degree | 0 (0.0%) | 0 (0.0%) |
| Total | 0 (0.0%) | 0 (0.0%) |
Income in Bermuda Run
Income Overview in Bermuda Run
Per Capita Income in Bermuda Run is $51,087, while median incomes of families and households are $116,042 and $71,515 respectively.
| Characteristic | Number | Measure |
| Per Capita Income | 3,118 | $51,087 |
| Median Family Income | 782 | $116,042 |
| Mean Family Income | 782 | $149,954 |
| Median Household Income | 1,524 | $71,515 |
| Mean Household Income | 1,524 | $103,778 |
| Income Deficit | 782 | $0 |
| Wage / Income Gap (%) | 3,118 | 48.65% |
| Wage / Income Gap ($) | 3,118 | 51.35¢ per $1 |
| Gini / Inequality Index | 3,118 | 0.46 |
Earnings by Sex in Bermuda Run
Average Earnings in Bermuda Run are $44,969, $60,500 for men and $31,066 for women, a difference of 48.6%.
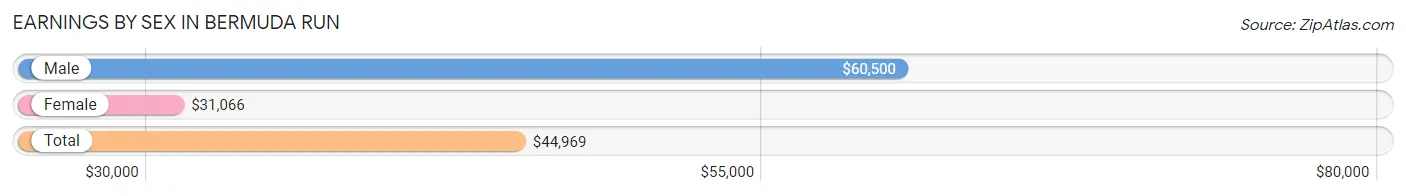
| Sex | Number | Average Earnings |
| Male | 554 (51.6%) | $60,500 |
| Female | 519 (48.4%) | $31,066 |
| Total | 1,073 (100.0%) | $44,969 |
Earnings by Sex by Income Bracket in Bermuda Run
The most common earnings brackets in Bermuda Run are $100,000+ for men (215 | 38.8%) and $75,000 to $99,999 for women (103 | 19.9%).
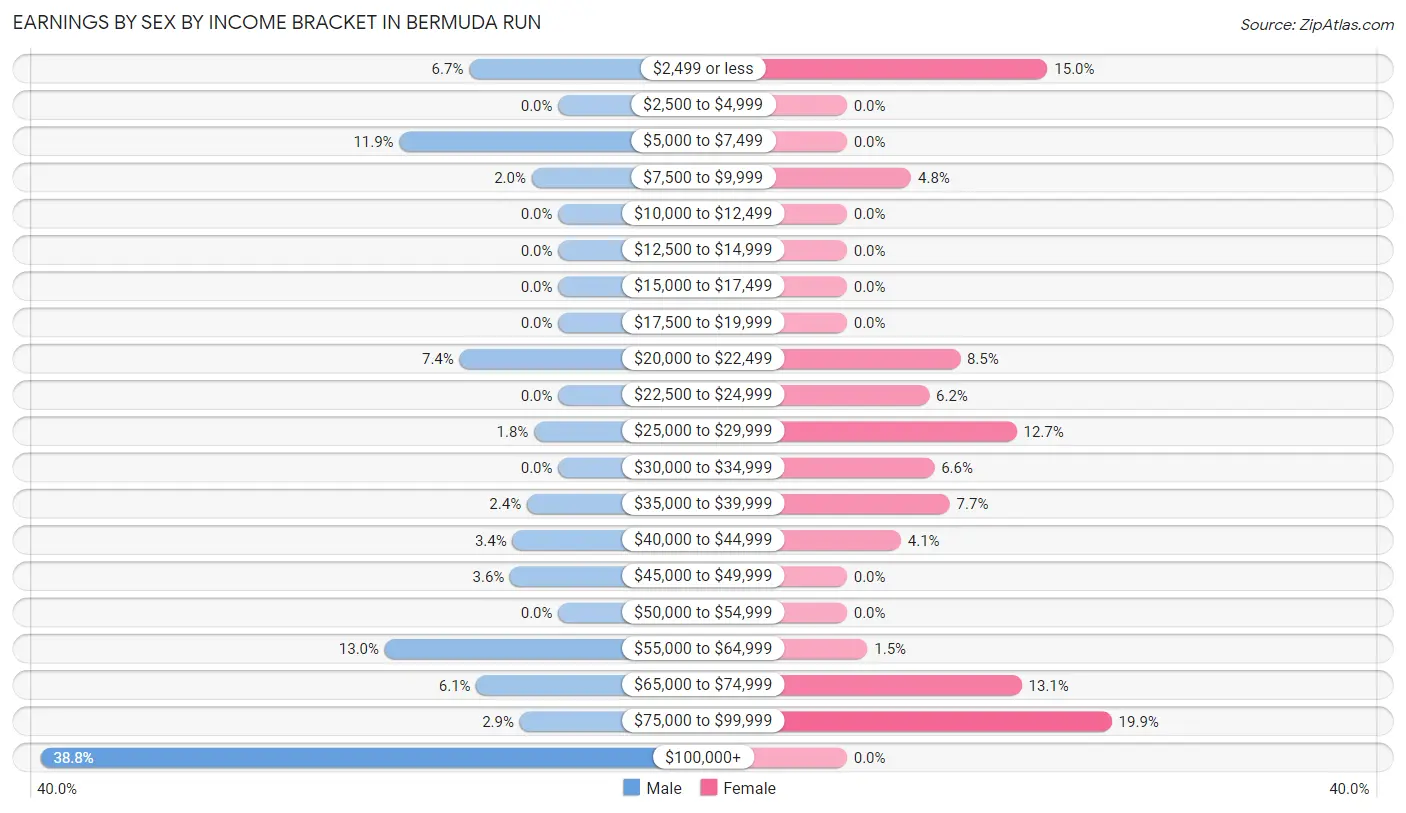
| Income | Male | Female |
| $2,499 or less | 37 (6.7%) | 78 (15.0%) |
| $2,500 to $4,999 | 0 (0.0%) | 0 (0.0%) |
| $5,000 to $7,499 | 66 (11.9%) | 0 (0.0%) |
| $7,500 to $9,999 | 11 (2.0%) | 25 (4.8%) |
| $10,000 to $12,499 | 0 (0.0%) | 0 (0.0%) |
| $12,500 to $14,999 | 0 (0.0%) | 0 (0.0%) |
| $15,000 to $17,499 | 0 (0.0%) | 0 (0.0%) |
| $17,500 to $19,999 | 0 (0.0%) | 0 (0.0%) |
| $20,000 to $22,499 | 41 (7.4%) | 44 (8.5%) |
| $22,500 to $24,999 | 0 (0.0%) | 32 (6.2%) |
| $25,000 to $29,999 | 10 (1.8%) | 66 (12.7%) |
| $30,000 to $34,999 | 0 (0.0%) | 34 (6.6%) |
| $35,000 to $39,999 | 13 (2.4%) | 40 (7.7%) |
| $40,000 to $44,999 | 19 (3.4%) | 21 (4.1%) |
| $45,000 to $49,999 | 20 (3.6%) | 0 (0.0%) |
| $50,000 to $54,999 | 0 (0.0%) | 0 (0.0%) |
| $55,000 to $64,999 | 72 (13.0%) | 8 (1.5%) |
| $65,000 to $74,999 | 34 (6.1%) | 68 (13.1%) |
| $75,000 to $99,999 | 16 (2.9%) | 103 (19.9%) |
| $100,000+ | 215 (38.8%) | 0 (0.0%) |
| Total | 554 (100.0%) | 519 (100.0%) |
Earnings by Sex by Educational Attainment in Bermuda Run
Average earnings in Bermuda Run are $68,239 for men and $39,406 for women, a difference of 42.2%. Men with an educational attainment of graduate degree enjoy the highest average annual earnings of $141,000, while those with high school diploma education earn the least with $58,531. Women with an educational attainment of graduate degree earn the most with the average annual earnings of $73,538, while those with college or associate's degree education have the smallest earnings of $24,414.
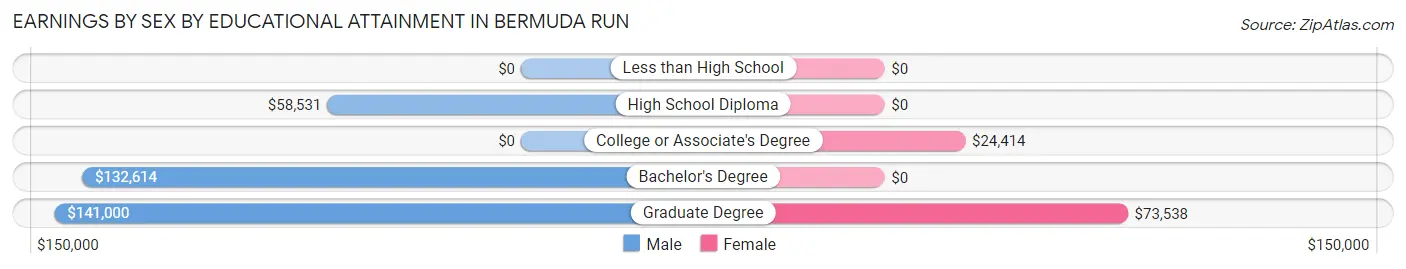
| Educational Attainment | Male Income | Female Income |
| Less than High School | - | - |
| High School Diploma | $58,531 | $0 |
| College or Associate's Degree | - | - |
| Bachelor's Degree | $132,614 | $0 |
| Graduate Degree | $141,000 | $73,538 |
| Total | $68,239 | $39,406 |
Family Income in Bermuda Run
Family Income Brackets in Bermuda Run
According to the Bermuda Run family income data, there are 223 families falling into the $100,000 to $149,999 income range, which is the most common income bracket and makes up 28.5% of all families.
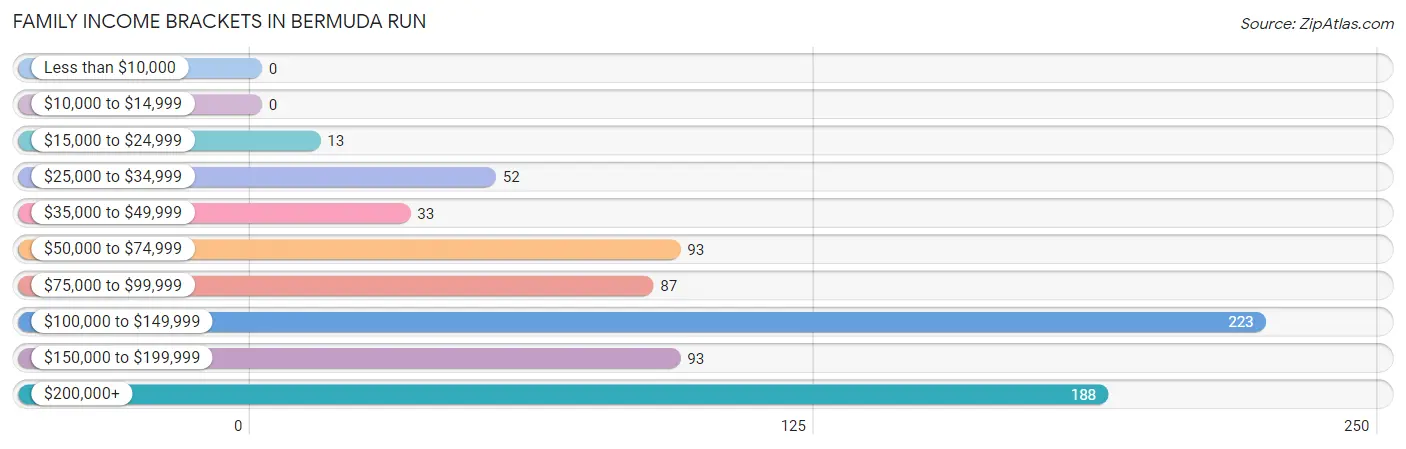
| Income Bracket | # Families | % Families |
| Less than $10,000 | 0 | 0.0% |
| $10,000 to $14,999 | 0 | 0.0% |
| $15,000 to $24,999 | 13 | 1.7% |
| $25,000 to $34,999 | 52 | 6.6% |
| $35,000 to $49,999 | 33 | 4.2% |
| $50,000 to $74,999 | 93 | 11.9% |
| $75,000 to $99,999 | 87 | 11.1% |
| $100,000 to $149,999 | 223 | 28.5% |
| $150,000 to $199,999 | 93 | 11.9% |
| $200,000+ | 188 | 24.0% |
Family Income by Famaliy Size in Bermuda Run
4-person families (119 | 15.2%) account for the highest median family income in Bermuda Run with $230,924 per family, while 4-person families (119 | 15.2%) have the highest median income of $57,731 per family member.
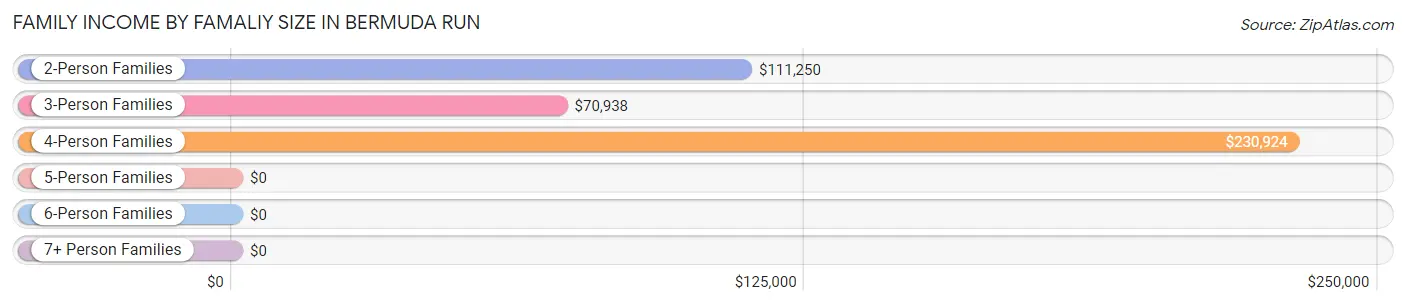
| Income Bracket | # Families | Median Income |
| 2-Person Families | 537 (68.7%) | $111,250 |
| 3-Person Families | 53 (6.8%) | $70,938 |
| 4-Person Families | 119 (15.2%) | $230,924 |
| 5-Person Families | 33 (4.2%) | $0 |
| 6-Person Families | 0 (0.0%) | $0 |
| 7+ Person Families | 40 (5.1%) | $0 |
| Total | 782 (100.0%) | $116,042 |
Family Income by Number of Earners in Bermuda Run
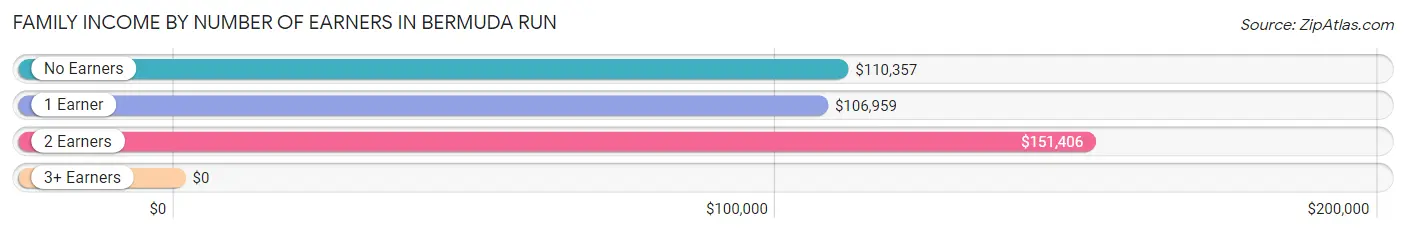
| Number of Earners | # Families | Median Income |
| No Earners | 326 (41.7%) | $110,357 |
| 1 Earner | 140 (17.9%) | $106,959 |
| 2 Earners | 299 (38.2%) | $151,406 |
| 3+ Earners | 17 (2.2%) | $0 |
| Total | 782 (100.0%) | $116,042 |
Household Income in Bermuda Run
Household Income Brackets in Bermuda Run
With 349 households falling in the category, the $50,000 to $74,999 income range is the most frequent in Bermuda Run, accounting for 22.9% of all households.
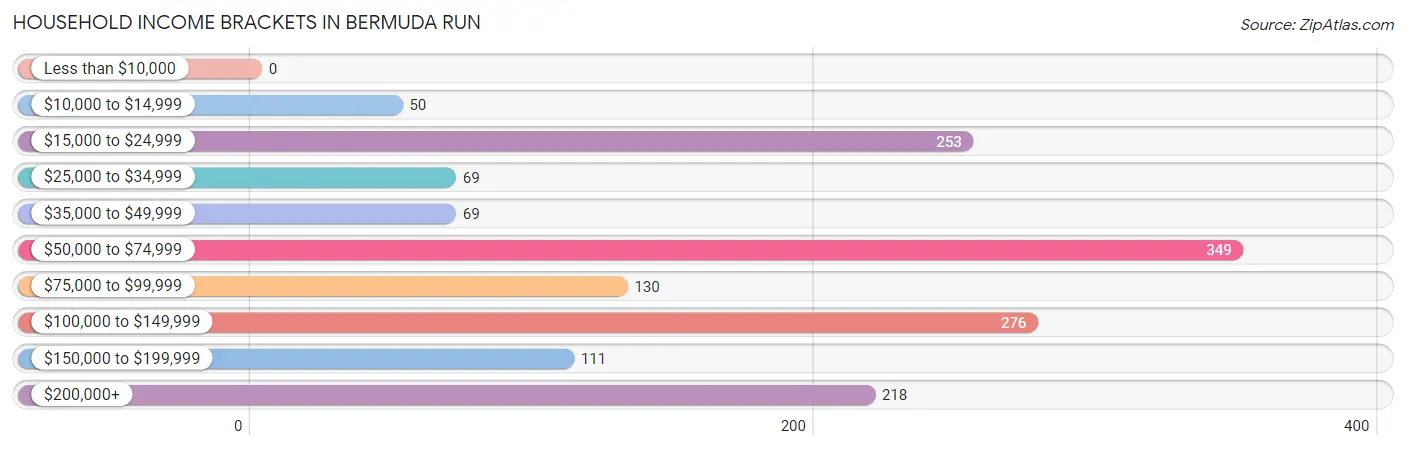
| Income Bracket | # Households | % Households |
| Less than $10,000 | 0 | 0.0% |
| $10,000 to $14,999 | 50 | 3.3% |
| $15,000 to $24,999 | 253 | 16.6% |
| $25,000 to $34,999 | 69 | 4.5% |
| $35,000 to $49,999 | 69 | 4.5% |
| $50,000 to $74,999 | 349 | 22.9% |
| $75,000 to $99,999 | 130 | 8.5% |
| $100,000 to $149,999 | 276 | 18.1% |
| $150,000 to $199,999 | 111 | 7.3% |
| $200,000+ | 218 | 14.3% |
Household Income by Householder Age in Bermuda Run
The median household income in Bermuda Run is $71,515, with the highest median household income of $151,063 found in the 25 to 44 years age bracket for the primary householder. A total of 164 households (10.8%) fall into this category.
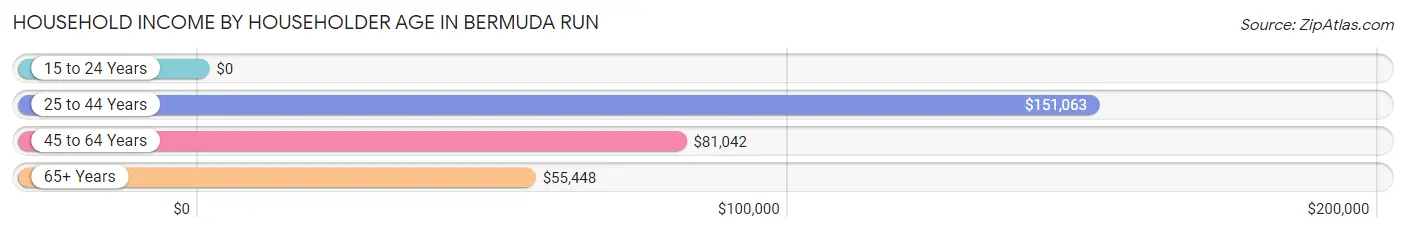
| Income Bracket | # Households | Median Income |
| 15 to 24 Years | 0 (0.0%) | $0 |
| 25 to 44 Years | 164 (10.8%) | $151,063 |
| 45 to 64 Years | 345 (22.6%) | $81,042 |
| 65+ Years | 1,015 (66.6%) | $55,448 |
| Total | 1,524 (100.0%) | $71,515 |
Poverty in Bermuda Run
Income Below Poverty by Sex and Age in Bermuda Run
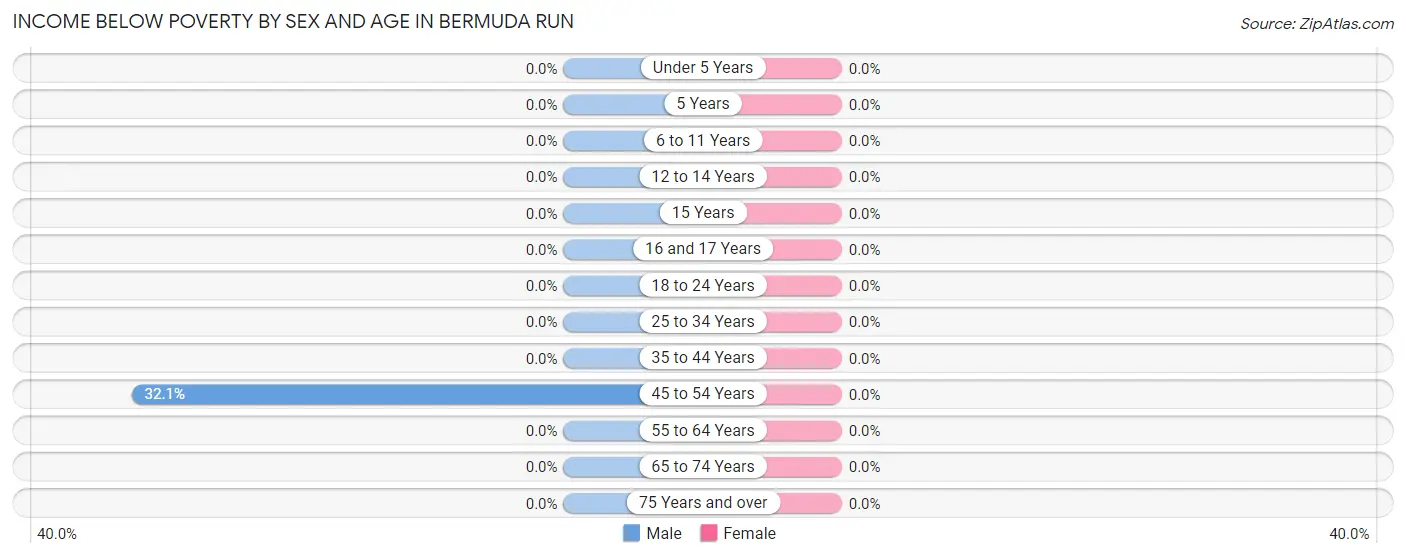
| Age Bracket | Male | Female |
| Under 5 Years | 0 (0.0%) | 0 (0.0%) |
| 5 Years | 0 (0.0%) | 0 (0.0%) |
| 6 to 11 Years | 0 (0.0%) | 0 (0.0%) |
| 12 to 14 Years | 0 (0.0%) | 0 (0.0%) |
| 15 Years | 0 (0.0%) | 0 (0.0%) |
| 16 and 17 Years | 0 (0.0%) | 0 (0.0%) |
| 18 to 24 Years | 0 (0.0%) | 0 (0.0%) |
| 25 to 34 Years | 0 (0.0%) | 0 (0.0%) |
| 35 to 44 Years | 0 (0.0%) | 0 (0.0%) |
| 45 to 54 Years | 50 (32.1%) | 0 (0.0%) |
| 55 to 64 Years | 0 (0.0%) | 0 (0.0%) |
| 65 to 74 Years | 0 (0.0%) | 0 (0.0%) |
| 75 Years and over | 0 (0.0%) | 0 (0.0%) |
| Total | 50 (4.5%) | 0 (0.0%) |
Income Above Poverty by Sex and Age in Bermuda Run
According to the poverty statistics in Bermuda Run, males aged under 5 years and females aged under 5 years are the age groups that are most secure financially, with 100.0% of males and 100.0% of females in these age groups living above the poverty line.
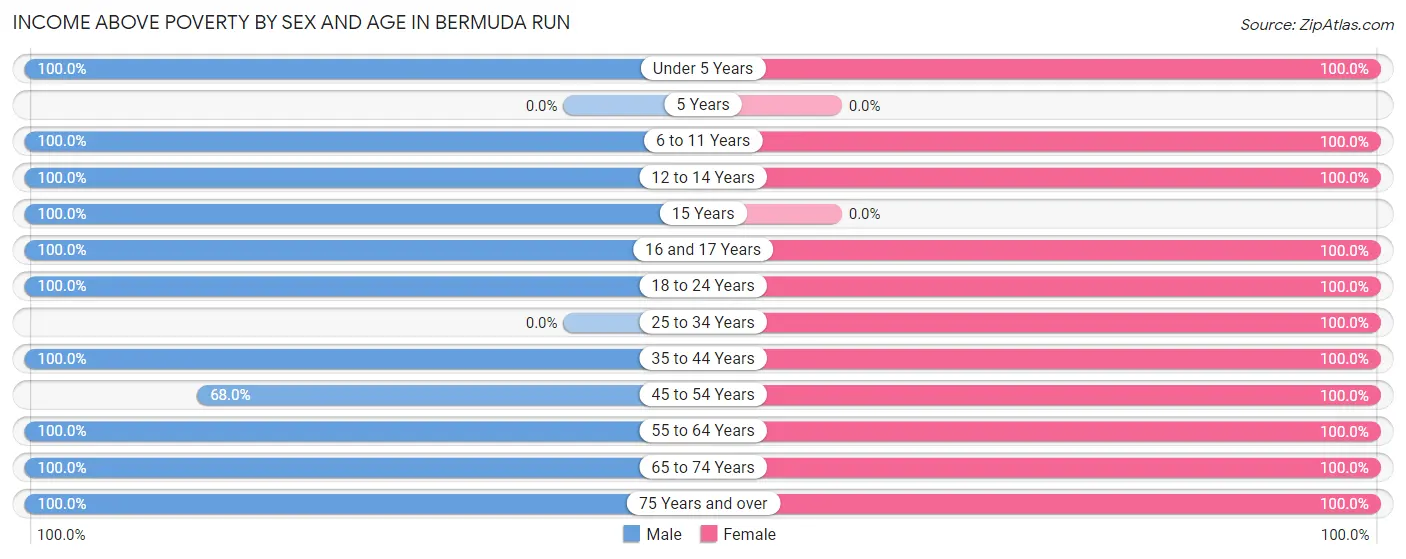
| Age Bracket | Male | Female |
| Under 5 Years | 37 (100.0%) | 71 (100.0%) |
| 5 Years | 0 (0.0%) | 0 (0.0%) |
| 6 to 11 Years | 60 (100.0%) | 158 (100.0%) |
| 12 to 14 Years | 42 (100.0%) | 129 (100.0%) |
| 15 Years | 31 (100.0%) | 0 (0.0%) |
| 16 and 17 Years | 36 (100.0%) | 81 (100.0%) |
| 18 to 24 Years | 18 (100.0%) | 100 (100.0%) |
| 25 to 34 Years | 0 (0.0%) | 73 (100.0%) |
| 35 to 44 Years | 152 (100.0%) | 98 (100.0%) |
| 45 to 54 Years | 106 (67.9%) | 127 (100.0%) |
| 55 to 64 Years | 116 (100.0%) | 179 (100.0%) |
| 65 to 74 Years | 198 (100.0%) | 330 (100.0%) |
| 75 Years and over | 272 (100.0%) | 549 (100.0%) |
| Total | 1,068 (95.5%) | 1,895 (100.0%) |
Income Below Poverty Among Married-Couple Families in Bermuda Run
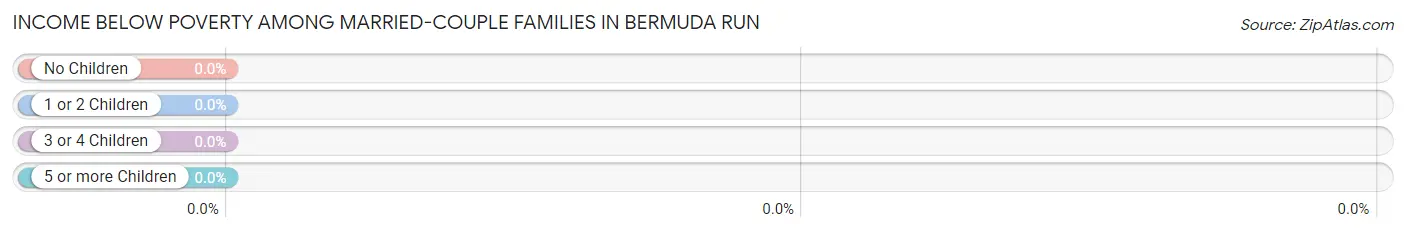
| Children | Above Poverty | Below Poverty |
| No Children | 481 (100.0%) | 0 (0.0%) |
| 1 or 2 Children | 172 (100.0%) | 0 (0.0%) |
| 3 or 4 Children | 0 (0.0%) | 0 (0.0%) |
| 5 or more Children | 40 (100.0%) | 0 (0.0%) |
| Total | 693 (100.0%) | 0 (0.0%) |
Income Below Poverty Among Single-Parent Households in Bermuda Run
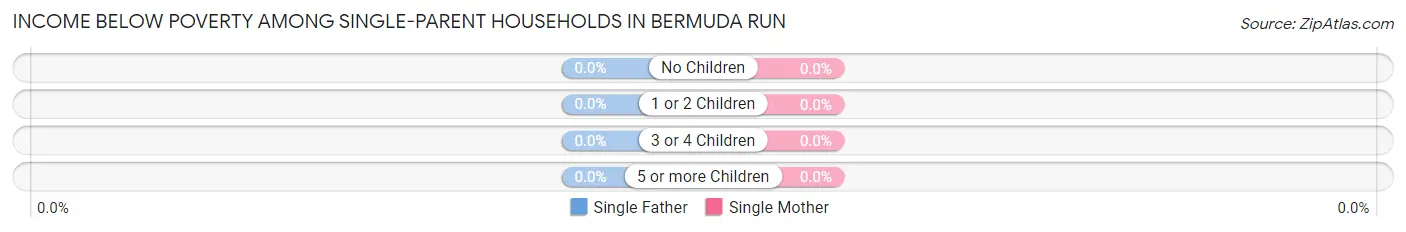
| Children | Single Father | Single Mother |
| No Children | 0 (0.0%) | 0 (0.0%) |
| 1 or 2 Children | 0 (0.0%) | 0 (0.0%) |
| 3 or 4 Children | 0 (0.0%) | 0 (0.0%) |
| 5 or more Children | 0 (0.0%) | 0 (0.0%) |
| Total | 0 (0.0%) | 0 (0.0%) |
Income Below Poverty Among Married-Couple vs Single-Parent Households in Bermuda Run
| Children | Married-Couple Families | Single-Parent Households |
| No Children | 0 (0.0%) | 0 (0.0%) |
| 1 or 2 Children | 0 (0.0%) | 0 (0.0%) |
| 3 or 4 Children | 0 (0.0%) | 0 (0.0%) |
| 5 or more Children | 0 (0.0%) | 0 (0.0%) |
| Total | 0 (0.0%) | 0 (0.0%) |
Employment Characteristics in Bermuda Run
Employment by Class of Employer in Bermuda Run
Among the 1,007 employed individuals in Bermuda Run, private company employees (796 | 79.0%), not-for-profit organizations (129 | 12.8%), and local government employees (35 | 3.5%) make up the most common classes of employment.
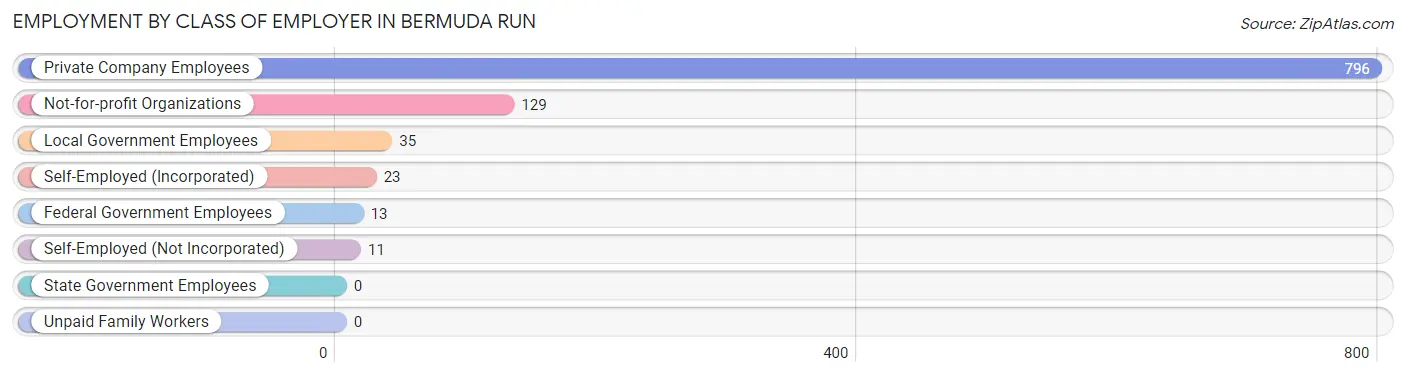
| Employer Class | # Employees | % Employees |
| Private Company Employees | 796 | 79.0% |
| Self-Employed (Incorporated) | 23 | 2.3% |
| Self-Employed (Not Incorporated) | 11 | 1.1% |
| Not-for-profit Organizations | 129 | 12.8% |
| Local Government Employees | 35 | 3.5% |
| State Government Employees | 0 | 0.0% |
| Federal Government Employees | 13 | 1.3% |
| Unpaid Family Workers | 0 | 0.0% |
| Total | 1,007 | 100.0% |
Employment Status by Age in Bermuda Run
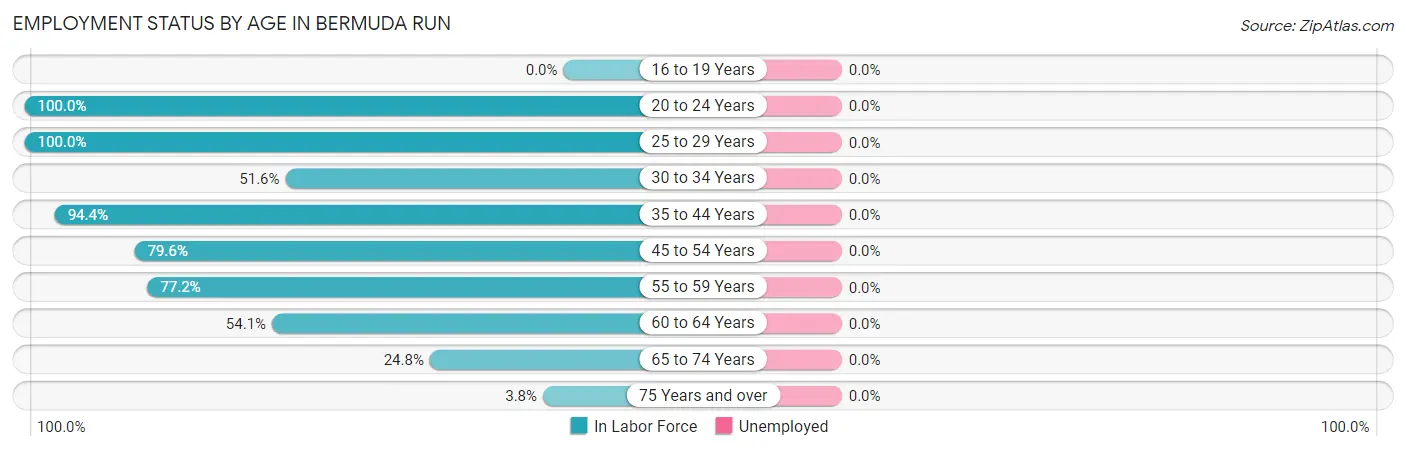
| Age Bracket | In Labor Force | Unemployed |
| 16 to 19 Years | 0 (0.0%) | 0 (0.0%) |
| 20 to 24 Years | 118 (100.0%) | 0 (0.0%) |
| 25 to 29 Years | 9 (100.0%) | 0 (0.0%) |
| 30 to 34 Years | 33 (51.6%) | 0 (0.0%) |
| 35 to 44 Years | 236 (94.4%) | 0 (0.0%) |
| 45 to 54 Years | 238 (79.6%) | 0 (0.0%) |
| 55 to 59 Years | 132 (77.2%) | 0 (0.0%) |
| 60 to 64 Years | 72 (54.1%) | 0 (0.0%) |
| 65 to 74 Years | 135 (24.8%) | 0 (0.0%) |
| 75 Years and over | 34 (3.8%) | 0 (0.0%) |
| Total | 1,008 (38.9%) | 0 (0.0%) |
Employment Status by Educational Attainment in Bermuda Run
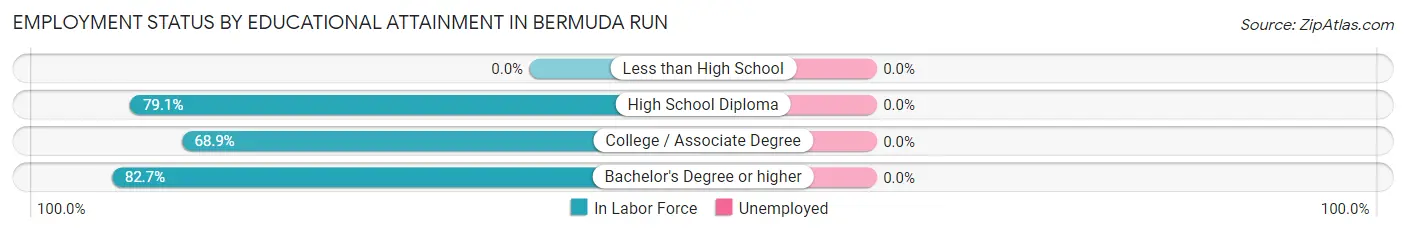
| Educational Attainment | In Labor Force | Unemployed |
| Less than High School | 0 (0.0%) | 0 (0.0%) |
| High School Diploma | 121 (79.1%) | 0 (0.0%) |
| College / Associate Degree | 164 (68.9%) | 0 (0.0%) |
| Bachelor's Degree or higher | 435 (82.7%) | 0 (0.0%) |
| Total | 720 (77.8%) | 0 (0.0%) |
Employment Occupations by Sex in Bermuda Run
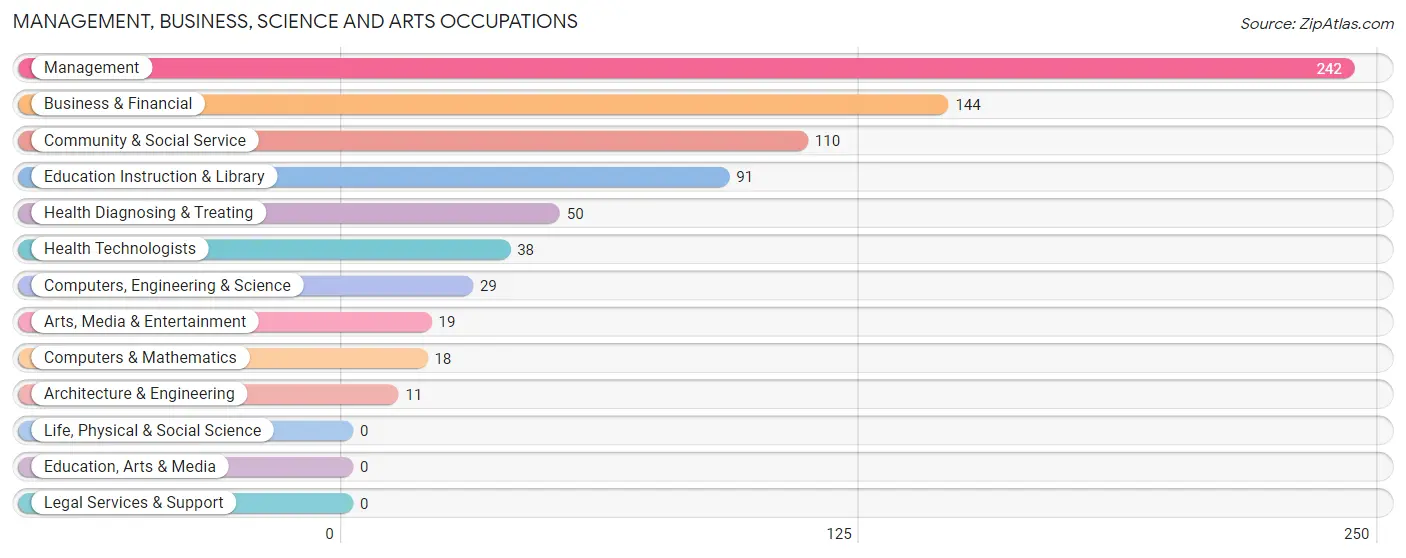
Management, Business, Science and Arts Occupations
The most common Management, Business, Science and Arts occupations in Bermuda Run are Management (242 | 24.0%), Business & Financial (144 | 14.3%), Community & Social Service (110 | 10.9%), Education Instruction & Library (91 | 9.0%), and Health Diagnosing & Treating (50 | 5.0%).
Management, Business, Science and Arts Occupations by Sex
Within the Management, Business, Science and Arts occupations in Bermuda Run, the most male-oriented occupations are Computers, Engineering & Science (100.0%), Computers & Mathematics (100.0%), and Architecture & Engineering (100.0%), while the most female-oriented occupations are Health Diagnosing & Treating (78.0%), Health Technologists (71.1%), and Management (54.5%).
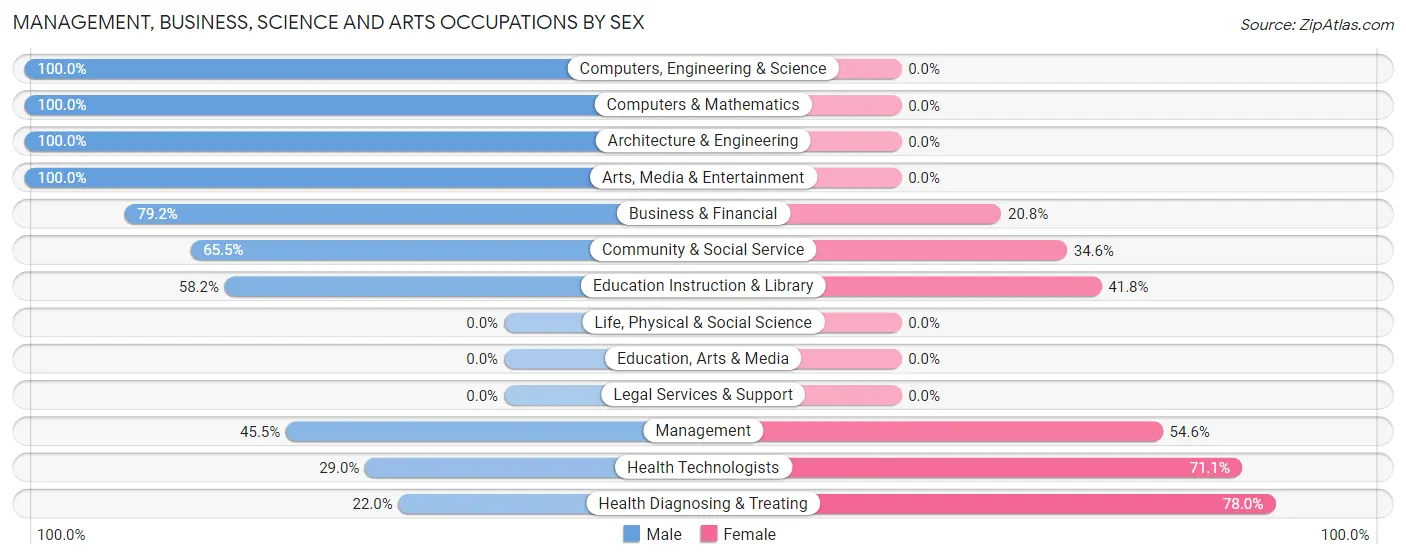
| Occupation | Male | Female |
| Management | 110 (45.5%) | 132 (54.5%) |
| Business & Financial | 114 (79.2%) | 30 (20.8%) |
| Computers, Engineering & Science | 29 (100.0%) | 0 (0.0%) |
| Computers & Mathematics | 18 (100.0%) | 0 (0.0%) |
| Architecture & Engineering | 11 (100.0%) | 0 (0.0%) |
| Life, Physical & Social Science | 0 (0.0%) | 0 (0.0%) |
| Community & Social Service | 72 (65.4%) | 38 (34.5%) |
| Education, Arts & Media | 0 (0.0%) | 0 (0.0%) |
| Legal Services & Support | 0 (0.0%) | 0 (0.0%) |
| Education Instruction & Library | 53 (58.2%) | 38 (41.8%) |
| Arts, Media & Entertainment | 19 (100.0%) | 0 (0.0%) |
| Health Diagnosing & Treating | 11 (22.0%) | 39 (78.0%) |
| Health Technologists | 11 (28.9%) | 27 (71.1%) |
| Total (Category) | 336 (58.4%) | 239 (41.6%) |
| Total (Overall) | 519 (51.5%) | 488 (48.5%) |
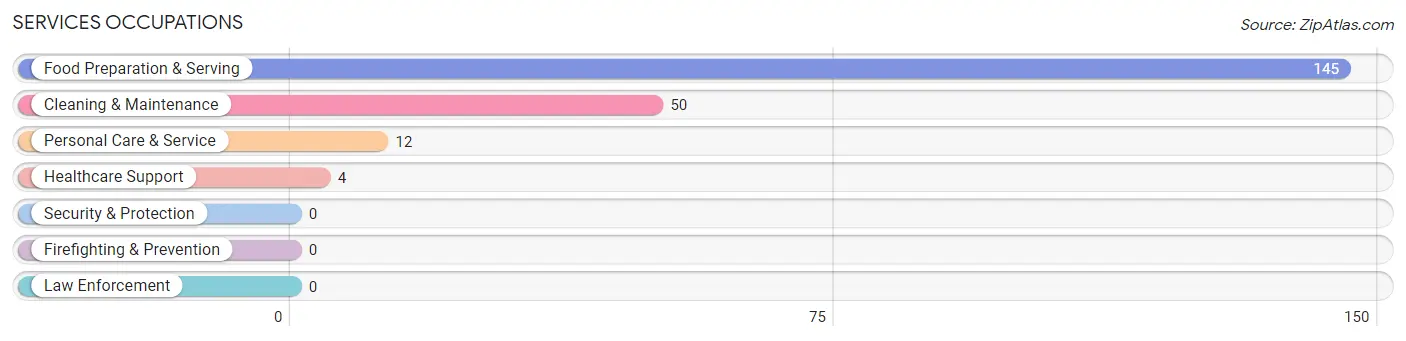
Services Occupations
The most common Services occupations in Bermuda Run are Food Preparation & Serving (145 | 14.4%), Cleaning & Maintenance (50 | 5.0%), Personal Care & Service (12 | 1.2%), and Healthcare Support (4 | 0.4%).
Services Occupations by Sex
Within the Services occupations in Bermuda Run, the most male-oriented occupations are Cleaning & Maintenance (100.0%), and Personal Care & Service (100.0%), while the most female-oriented occupations are Healthcare Support (100.0%), and Food Preparation & Serving (100.0%).
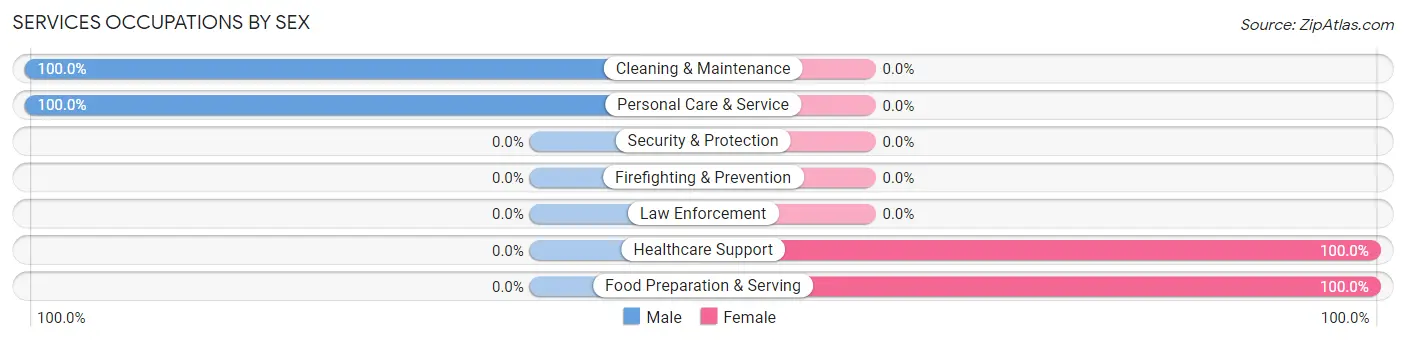
| Occupation | Male | Female |
| Healthcare Support | 0 (0.0%) | 4 (100.0%) |
| Security & Protection | 0 (0.0%) | 0 (0.0%) |
| Firefighting & Prevention | 0 (0.0%) | 0 (0.0%) |
| Law Enforcement | 0 (0.0%) | 0 (0.0%) |
| Food Preparation & Serving | 0 (0.0%) | 145 (100.0%) |
| Cleaning & Maintenance | 50 (100.0%) | 0 (0.0%) |
| Personal Care & Service | 12 (100.0%) | 0 (0.0%) |
| Total (Category) | 62 (29.4%) | 149 (70.6%) |
| Total (Overall) | 519 (51.5%) | 488 (48.5%) |
Sales and Office Occupations
The most common Sales and Office occupations in Bermuda Run are Office & Administration (100 | 9.9%), and Sales & Related (35 | 3.5%).
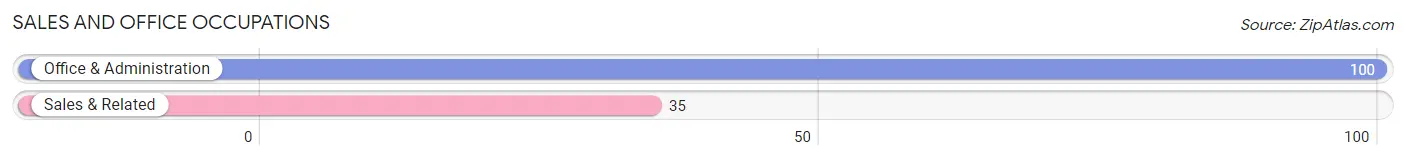
Sales and Office Occupations by Sex
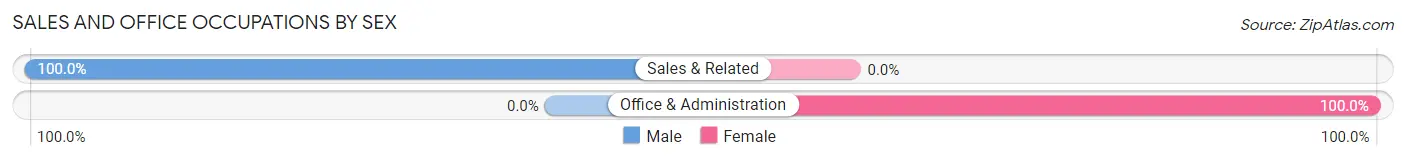
| Occupation | Male | Female |
| Sales & Related | 35 (100.0%) | 0 (0.0%) |
| Office & Administration | 0 (0.0%) | 100 (100.0%) |
| Total (Category) | 35 (25.9%) | 100 (74.1%) |
| Total (Overall) | 519 (51.5%) | 488 (48.5%) |
Natural Resources, Construction and Maintenance Occupations
The most common Natural Resources, Construction and Maintenance occupations in Bermuda Run are , and Installation, Maintenance & Repair (15 | 1.5%).
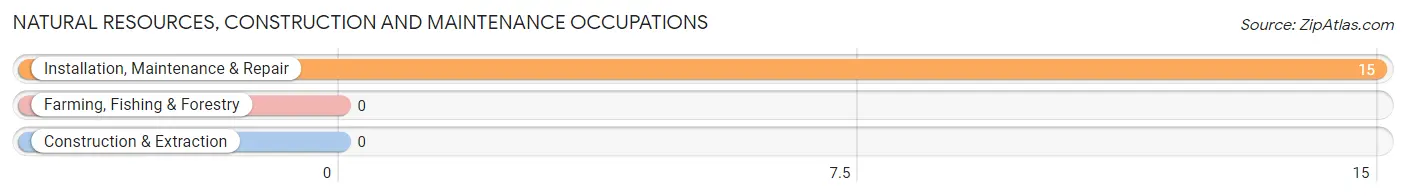
Natural Resources, Construction and Maintenance Occupations by Sex
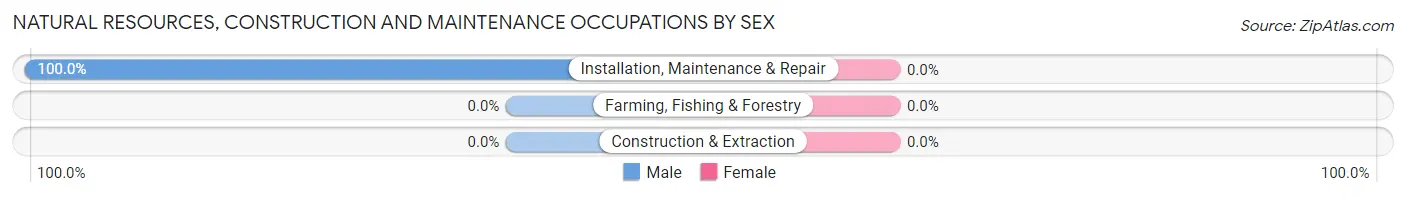
| Occupation | Male | Female |
| Farming, Fishing & Forestry | 0 (0.0%) | 0 (0.0%) |
| Construction & Extraction | 0 (0.0%) | 0 (0.0%) |
| Installation, Maintenance & Repair | 15 (100.0%) | 0 (0.0%) |
| Total (Category) | 15 (100.0%) | 0 (0.0%) |
| Total (Overall) | 519 (51.5%) | 488 (48.5%) |
Production, Transportation and Moving Occupations
The most common Production, Transportation and Moving occupations in Bermuda Run are Transportation (36 | 3.6%), and Production (35 | 3.5%).
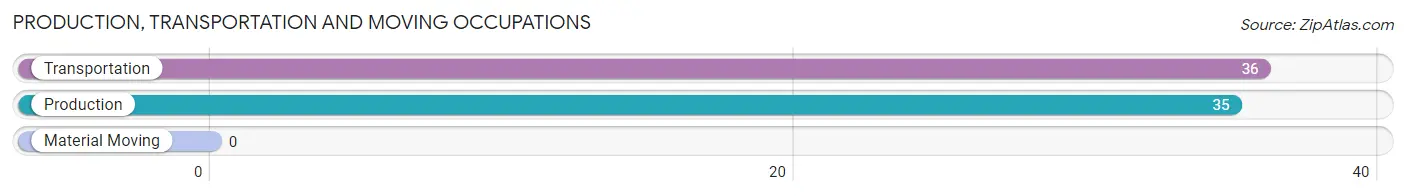
Production, Transportation and Moving Occupations by Sex
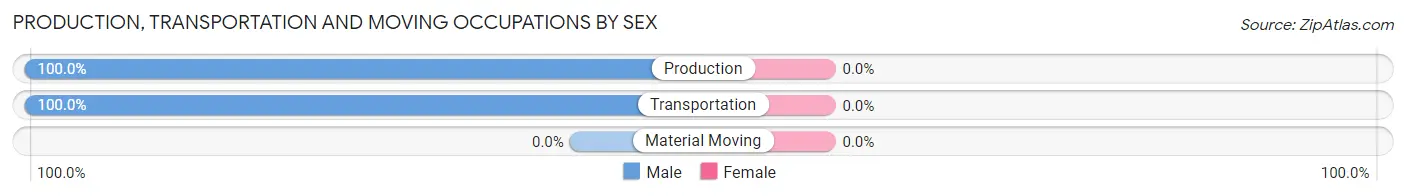
| Occupation | Male | Female |
| Production | 35 (100.0%) | 0 (0.0%) |
| Transportation | 36 (100.0%) | 0 (0.0%) |
| Material Moving | 0 (0.0%) | 0 (0.0%) |
| Total (Category) | 71 (100.0%) | 0 (0.0%) |
| Total (Overall) | 519 (51.5%) | 488 (48.5%) |
Employment Industries by Sex in Bermuda Run
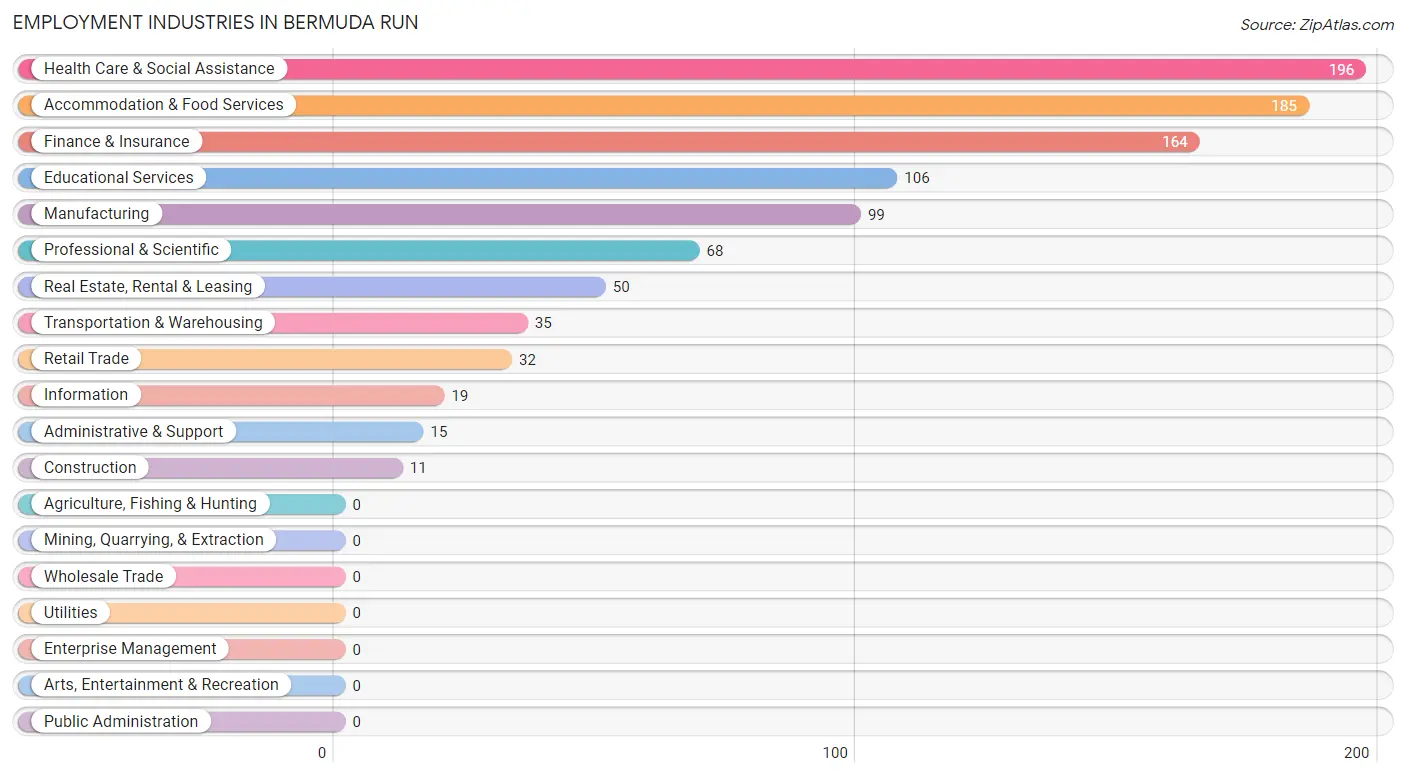
Employment Industries in Bermuda Run
The major employment industries in Bermuda Run include Health Care & Social Assistance (196 | 19.5%), Accommodation & Food Services (185 | 18.4%), Finance & Insurance (164 | 16.3%), Educational Services (106 | 10.5%), and Manufacturing (99 | 9.8%).
Employment Industries by Sex in Bermuda Run
The Bermuda Run industries that see more men than women are Construction (100.0%), Retail Trade (100.0%), and Transportation & Warehousing (100.0%), whereas the industries that tend to have a higher number of women are Health Care & Social Assistance (82.7%), Accommodation & Food Services (78.4%), and Manufacturing (53.5%).
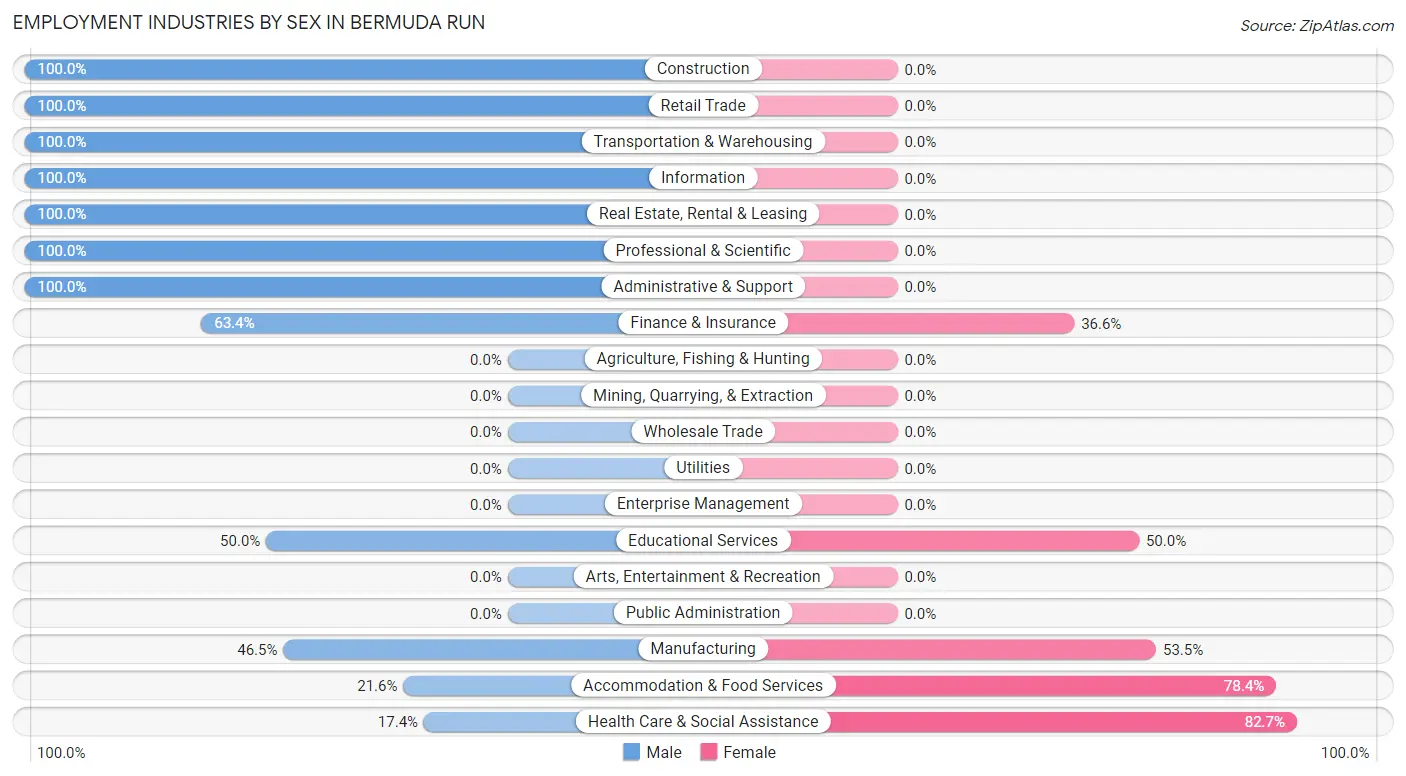
| Industry | Male | Female |
| Agriculture, Fishing & Hunting | 0 (0.0%) | 0 (0.0%) |
| Mining, Quarrying, & Extraction | 0 (0.0%) | 0 (0.0%) |
| Construction | 11 (100.0%) | 0 (0.0%) |
| Manufacturing | 46 (46.5%) | 53 (53.5%) |
| Wholesale Trade | 0 (0.0%) | 0 (0.0%) |
| Retail Trade | 32 (100.0%) | 0 (0.0%) |
| Transportation & Warehousing | 35 (100.0%) | 0 (0.0%) |
| Utilities | 0 (0.0%) | 0 (0.0%) |
| Information | 19 (100.0%) | 0 (0.0%) |
| Finance & Insurance | 104 (63.4%) | 60 (36.6%) |
| Real Estate, Rental & Leasing | 50 (100.0%) | 0 (0.0%) |
| Professional & Scientific | 68 (100.0%) | 0 (0.0%) |
| Enterprise Management | 0 (0.0%) | 0 (0.0%) |
| Administrative & Support | 15 (100.0%) | 0 (0.0%) |
| Educational Services | 53 (50.0%) | 53 (50.0%) |
| Health Care & Social Assistance | 34 (17.3%) | 162 (82.7%) |
| Arts, Entertainment & Recreation | 0 (0.0%) | 0 (0.0%) |
| Accommodation & Food Services | 40 (21.6%) | 145 (78.4%) |
| Public Administration | 0 (0.0%) | 0 (0.0%) |
| Total | 519 (51.5%) | 488 (48.5%) |
Education in Bermuda Run
School Enrollment in Bermuda Run
The most common levels of schooling among the 651 students in Bermuda Run are high school (210 | 32.3%), middle school (169 | 26.0%), and elementary school (158 | 24.3%).
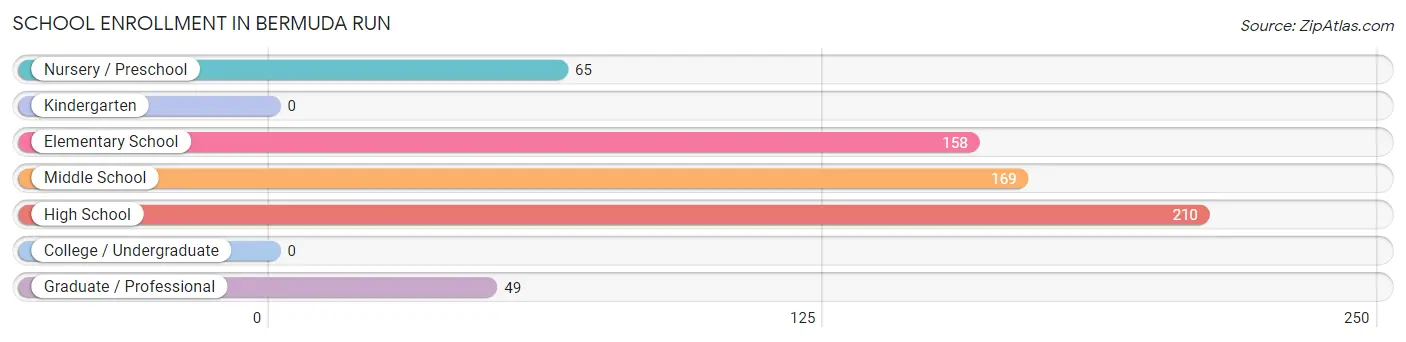
| School Level | # Students | % Students |
| Nursery / Preschool | 65 | 10.0% |
| Kindergarten | 0 | 0.0% |
| Elementary School | 158 | 24.3% |
| Middle School | 169 | 26.0% |
| High School | 210 | 32.3% |
| College / Undergraduate | 0 | 0.0% |
| Graduate / Professional | 49 | 7.5% |
| Total | 651 | 100.0% |
School Enrollment by Age by Funding Source in Bermuda Run
Out of a total of 651 students who are enrolled in schools in Bermuda Run, 129 (19.8%) attend a private institution, while the remaining 522 (80.2%) are enrolled in public schools. The age group of 15 to 17 year olds has the highest likelihood of being enrolled in private schools, with 81 (54.7% in the age bracket) enrolled. Conversely, the age group of 5 to 9 year old has the lowest likelihood of being enrolled in a private school, with 158 (100.0% in the age bracket) attending a public institution.
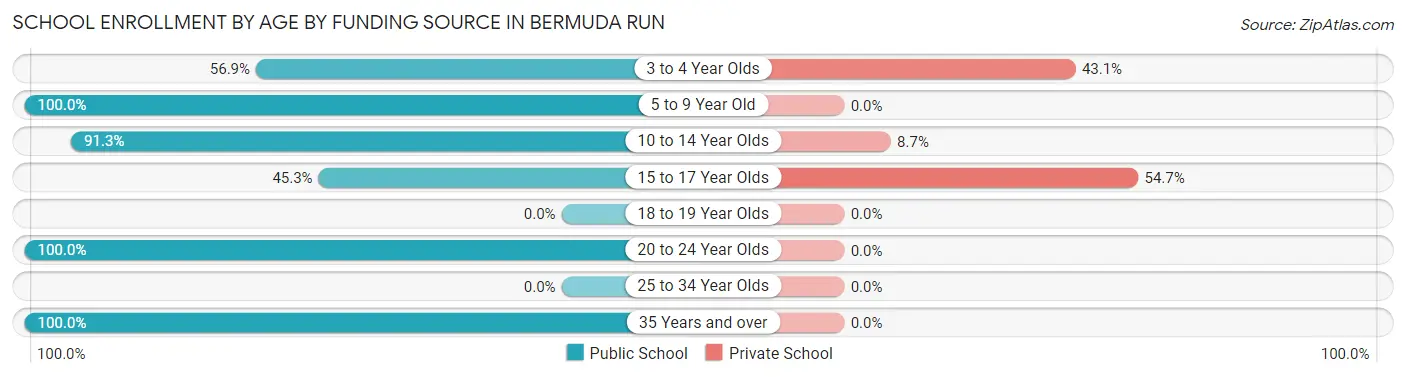
| Age Bracket | Public School | Private School |
| 3 to 4 Year Olds | 37 (56.9%) | 28 (43.1%) |
| 5 to 9 Year Old | 158 (100.0%) | 0 (0.0%) |
| 10 to 14 Year Olds | 211 (91.3%) | 20 (8.7%) |
| 15 to 17 Year Olds | 67 (45.3%) | 81 (54.7%) |
| 18 to 19 Year Olds | 0 (0.0%) | 0 (0.0%) |
| 20 to 24 Year Olds | 18 (100.0%) | 0 (0.0%) |
| 25 to 34 Year Olds | 0 (0.0%) | 0 (0.0%) |
| 35 Years and over | 31 (100.0%) | 0 (0.0%) |
| Total | 522 (80.2%) | 129 (19.8%) |
Educational Attainment by Field of Study in Bermuda Run
Business (355 | 28.2%), education (268 | 21.3%), science & technology (169 | 13.4%), engineering (96 | 7.6%), and social sciences (80 | 6.4%) are the most common fields of study among 1,258 individuals in Bermuda Run who have obtained a bachelor's degree or higher.
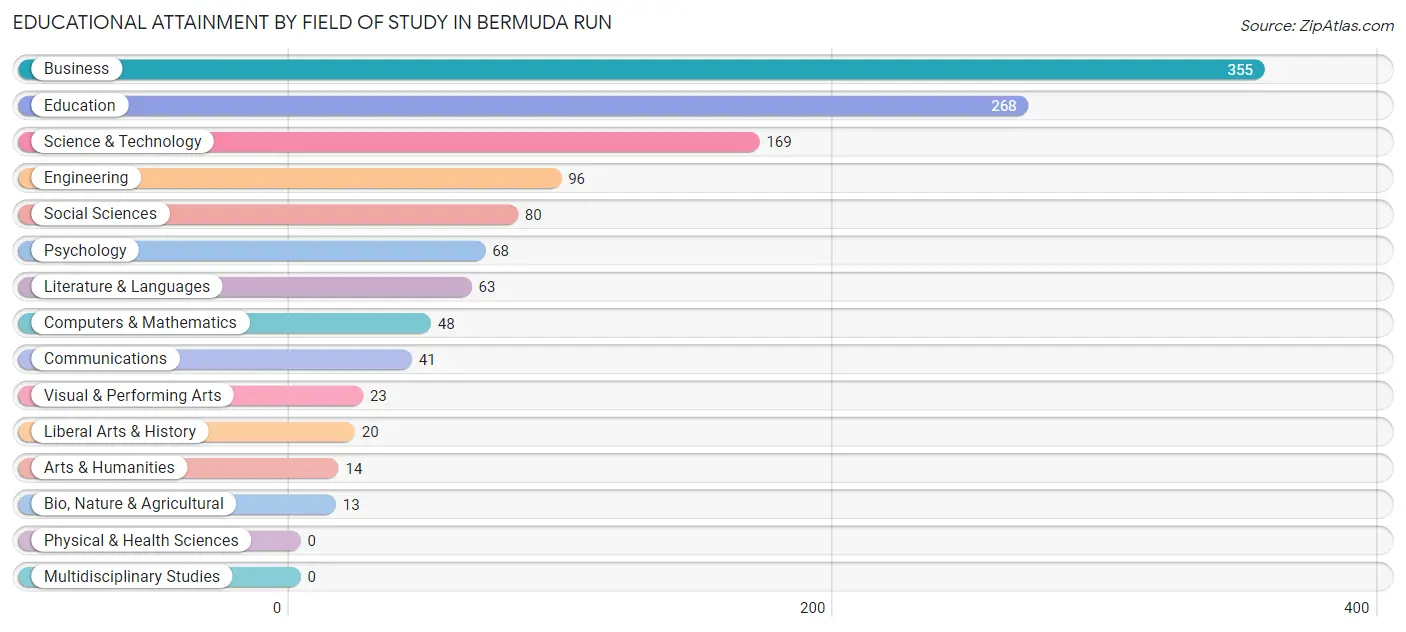
| Field of Study | # Graduates | % Graduates |
| Computers & Mathematics | 48 | 3.8% |
| Bio, Nature & Agricultural | 13 | 1.0% |
| Physical & Health Sciences | 0 | 0.0% |
| Psychology | 68 | 5.4% |
| Social Sciences | 80 | 6.4% |
| Engineering | 96 | 7.6% |
| Multidisciplinary Studies | 0 | 0.0% |
| Science & Technology | 169 | 13.4% |
| Business | 355 | 28.2% |
| Education | 268 | 21.3% |
| Literature & Languages | 63 | 5.0% |
| Liberal Arts & History | 20 | 1.6% |
| Visual & Performing Arts | 23 | 1.8% |
| Communications | 41 | 3.3% |
| Arts & Humanities | 14 | 1.1% |
| Total | 1,258 | 100.0% |
Transportation & Commute in Bermuda Run
Vehicle Availability by Sex in Bermuda Run
The most prevalent vehicle ownership categories in Bermuda Run are males with 2 vehicles (324, accounting for 62.4%) and females with 2 vehicles (176, making up 66.4%).
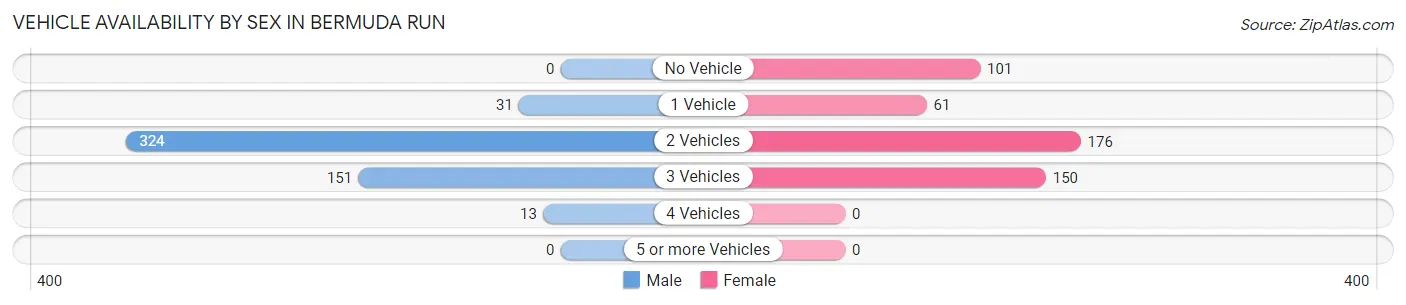
| Vehicles Available | Male | Female |
| No Vehicle | 0 (0.0%) | 101 (20.7%) |
| 1 Vehicle | 31 (6.0%) | 61 (12.5%) |
| 2 Vehicles | 324 (62.4%) | 176 (36.1%) |
| 3 Vehicles | 151 (29.1%) | 150 (30.7%) |
| 4 Vehicles | 13 (2.5%) | 0 (0.0%) |
| 5 or more Vehicles | 0 (0.0%) | 0 (0.0%) |
| Total | 519 (100.0%) | 488 (100.0%) |
Commute Time in Bermuda Run
The most frequently occuring commute durations in Bermuda Run are 20 to 24 minutes (269 commuters, 30.8%), 15 to 19 minutes (162 commuters, 18.6%), and 30 to 34 minutes (115 commuters, 13.2%).
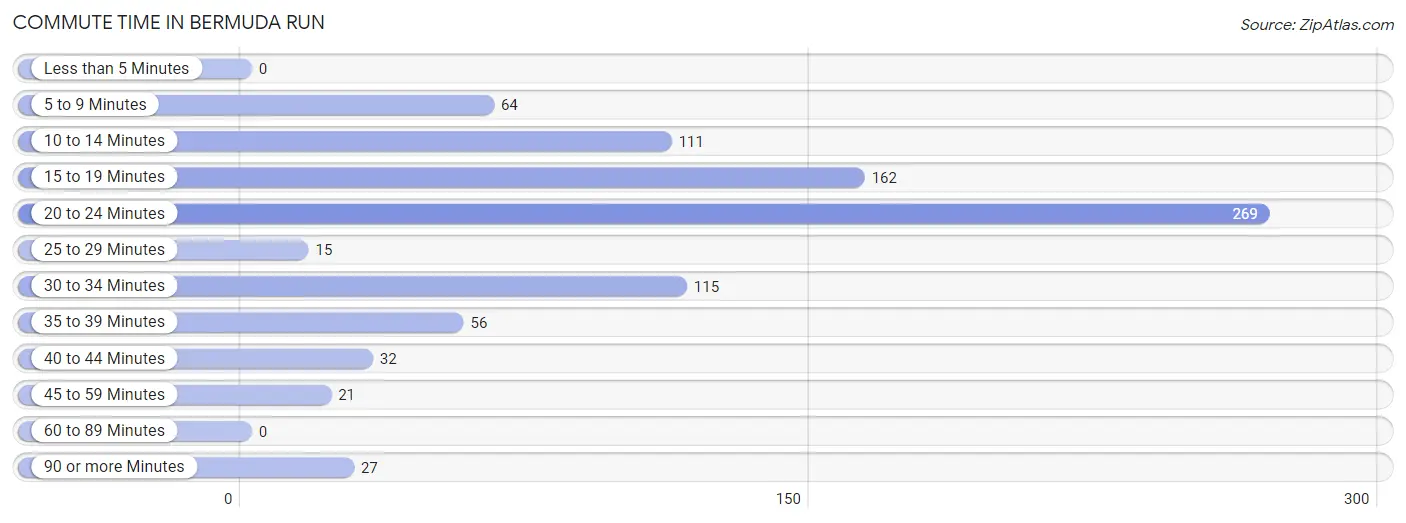
| Commute Time | # Commuters | % Commuters |
| Less than 5 Minutes | 0 | 0.0% |
| 5 to 9 Minutes | 64 | 7.3% |
| 10 to 14 Minutes | 111 | 12.7% |
| 15 to 19 Minutes | 162 | 18.6% |
| 20 to 24 Minutes | 269 | 30.8% |
| 25 to 29 Minutes | 15 | 1.7% |
| 30 to 34 Minutes | 115 | 13.2% |
| 35 to 39 Minutes | 56 | 6.4% |
| 40 to 44 Minutes | 32 | 3.7% |
| 45 to 59 Minutes | 21 | 2.4% |
| 60 to 89 Minutes | 0 | 0.0% |
| 90 or more Minutes | 27 | 3.1% |
Commute Time by Sex in Bermuda Run
The most common commute times in Bermuda Run are 20 to 24 minutes (125 commuters, 30.3%) for males and 20 to 24 minutes (144 commuters, 31.3%) for females.
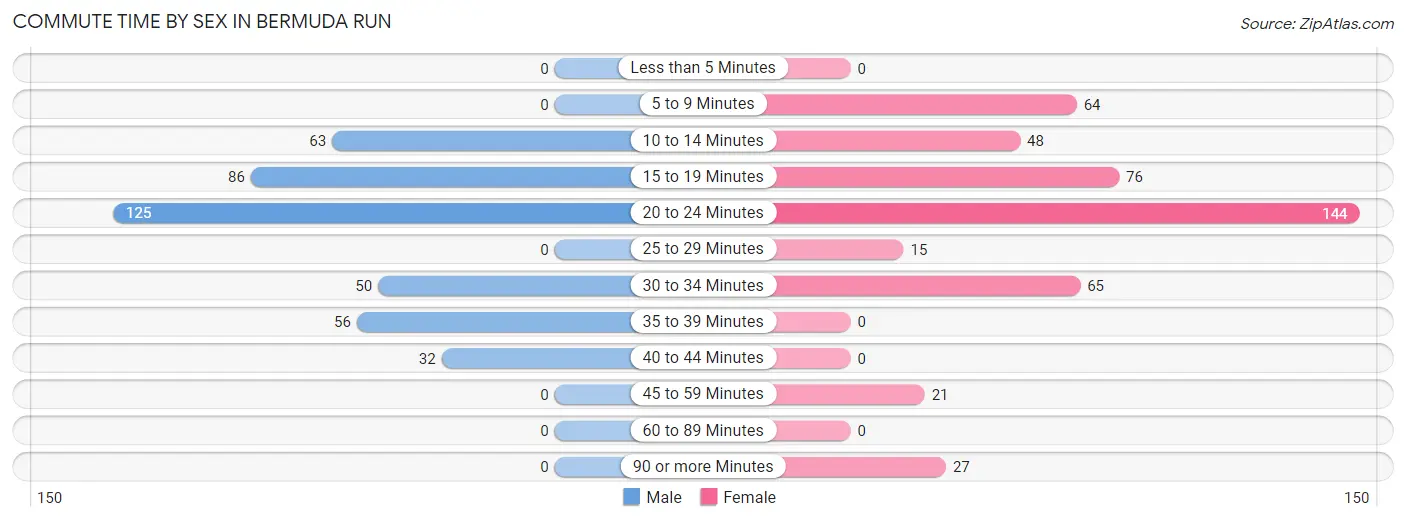
| Commute Time | Male | Female |
| Less than 5 Minutes | 0 (0.0%) | 0 (0.0%) |
| 5 to 9 Minutes | 0 (0.0%) | 64 (13.9%) |
| 10 to 14 Minutes | 63 (15.3%) | 48 (10.4%) |
| 15 to 19 Minutes | 86 (20.9%) | 76 (16.5%) |
| 20 to 24 Minutes | 125 (30.3%) | 144 (31.3%) |
| 25 to 29 Minutes | 0 (0.0%) | 15 (3.3%) |
| 30 to 34 Minutes | 50 (12.1%) | 65 (14.1%) |
| 35 to 39 Minutes | 56 (13.6%) | 0 (0.0%) |
| 40 to 44 Minutes | 32 (7.8%) | 0 (0.0%) |
| 45 to 59 Minutes | 0 (0.0%) | 21 (4.6%) |
| 60 to 89 Minutes | 0 (0.0%) | 0 (0.0%) |
| 90 or more Minutes | 0 (0.0%) | 27 (5.9%) |
Time of Departure to Work by Sex in Bermuda Run
The most frequent times of departure to work in Bermuda Run are 8:30 AM to 8:59 AM (100, 24.3%) for males and 7:30 AM to 7:59 AM (134, 29.1%) for females.
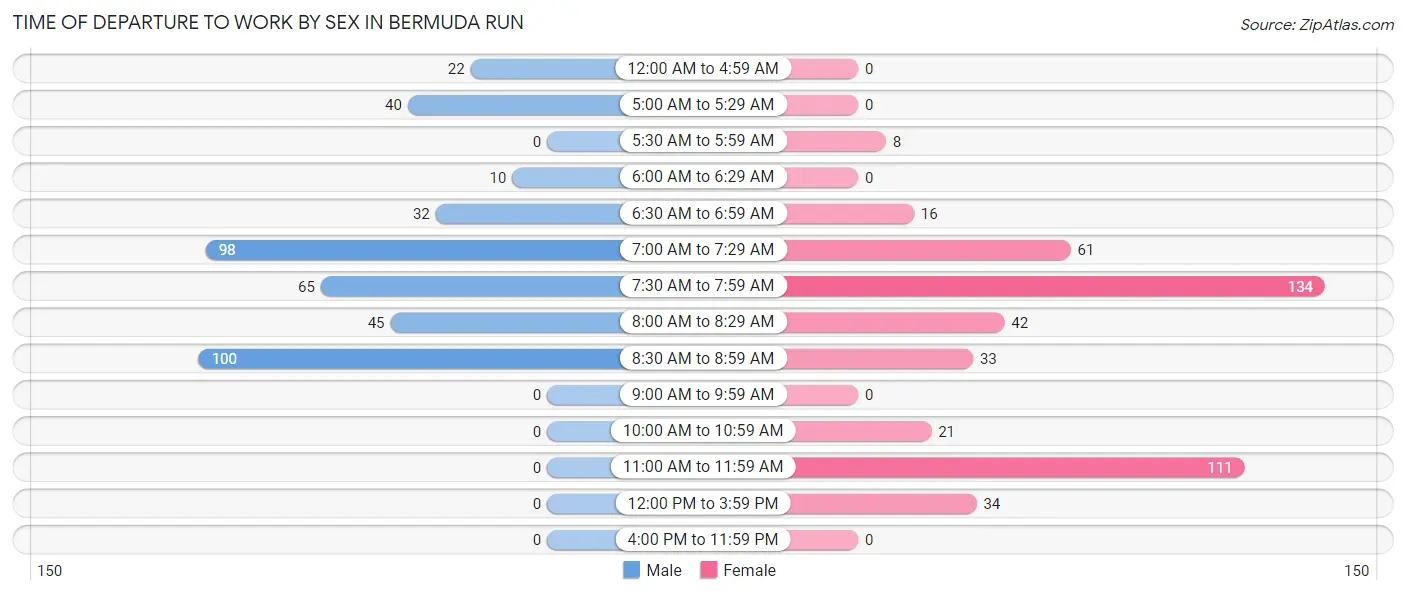
| Time of Departure | Male | Female |
| 12:00 AM to 4:59 AM | 22 (5.3%) | 0 (0.0%) |
| 5:00 AM to 5:29 AM | 40 (9.7%) | 0 (0.0%) |
| 5:30 AM to 5:59 AM | 0 (0.0%) | 8 (1.7%) |
| 6:00 AM to 6:29 AM | 10 (2.4%) | 0 (0.0%) |
| 6:30 AM to 6:59 AM | 32 (7.8%) | 16 (3.5%) |
| 7:00 AM to 7:29 AM | 98 (23.8%) | 61 (13.3%) |
| 7:30 AM to 7:59 AM | 65 (15.8%) | 134 (29.1%) |
| 8:00 AM to 8:29 AM | 45 (10.9%) | 42 (9.1%) |
| 8:30 AM to 8:59 AM | 100 (24.3%) | 33 (7.2%) |
| 9:00 AM to 9:59 AM | 0 (0.0%) | 0 (0.0%) |
| 10:00 AM to 10:59 AM | 0 (0.0%) | 21 (4.6%) |
| 11:00 AM to 11:59 AM | 0 (0.0%) | 111 (24.1%) |
| 12:00 PM to 3:59 PM | 0 (0.0%) | 34 (7.4%) |
| 4:00 PM to 11:59 PM | 0 (0.0%) | 0 (0.0%) |
| Total | 412 (100.0%) | 460 (100.0%) |
Housing Occupancy in Bermuda Run
Occupancy by Ownership in Bermuda Run
Of the total 1,524 dwellings in Bermuda Run, owner-occupied units account for 1,330 (87.3%), while renter-occupied units make up 194 (12.7%).
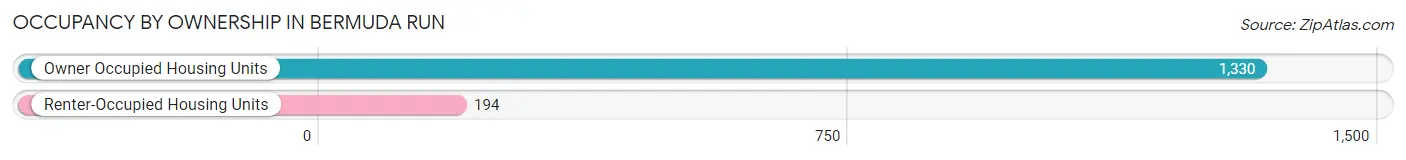
| Occupancy | # Housing Units | % Housing Units |
| Owner Occupied Housing Units | 1,330 | 87.3% |
| Renter-Occupied Housing Units | 194 | 12.7% |
| Total Occupied Housing Units | 1,524 | 100.0% |
Occupancy by Household Size in Bermuda Run
| Household Size | # Housing Units | % Housing Units |
| 1-Person Household | 742 | 48.7% |
| 2-Person Household | 537 | 35.2% |
| 3-Person Household | 53 | 3.5% |
| 4+ Person Household | 192 | 12.6% |
| Total Housing Units | 1,524 | 100.0% |
Occupancy by Ownership by Household Size in Bermuda Run
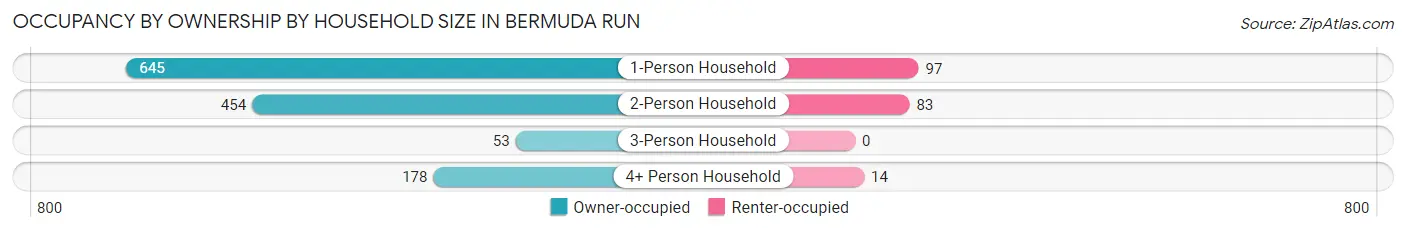
| Household Size | Owner-occupied | Renter-occupied |
| 1-Person Household | 645 (86.9%) | 97 (13.1%) |
| 2-Person Household | 454 (84.5%) | 83 (15.5%) |
| 3-Person Household | 53 (100.0%) | 0 (0.0%) |
| 4+ Person Household | 178 (92.7%) | 14 (7.3%) |
| Total Housing Units | 1,330 (87.3%) | 194 (12.7%) |
Occupancy by Educational Attainment in Bermuda Run
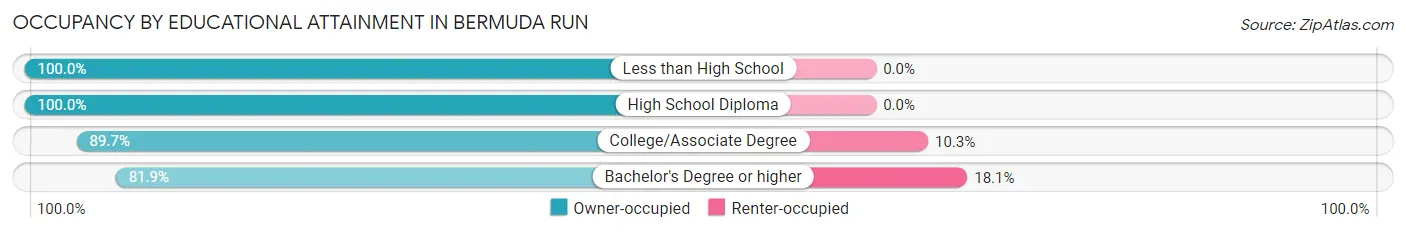
| Household Size | Owner-occupied | Renter-occupied |
| Less than High School | 19 (100.0%) | 0 (0.0%) |
| High School Diploma | 176 (100.0%) | 0 (0.0%) |
| College/Associate Degree | 532 (89.7%) | 61 (10.3%) |
| Bachelor's Degree or higher | 603 (81.9%) | 133 (18.1%) |
Occupancy by Age of Householder in Bermuda Run
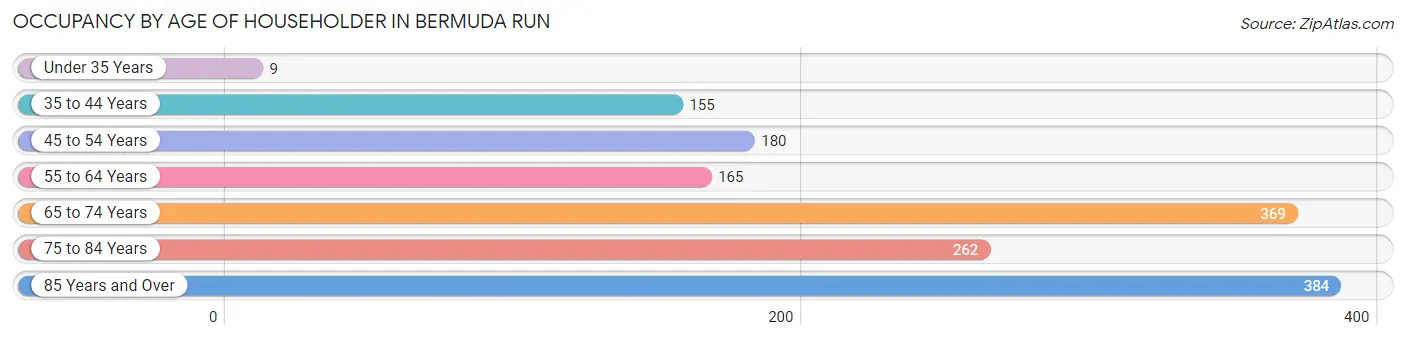
| Age Bracket | # Households | % Households |
| Under 35 Years | 9 | 0.6% |
| 35 to 44 Years | 155 | 10.2% |
| 45 to 54 Years | 180 | 11.8% |
| 55 to 64 Years | 165 | 10.8% |
| 65 to 74 Years | 369 | 24.2% |
| 75 to 84 Years | 262 | 17.2% |
| 85 Years and Over | 384 | 25.2% |
| Total | 1,524 | 100.0% |
Housing Finances in Bermuda Run
Median Income by Occupancy in Bermuda Run
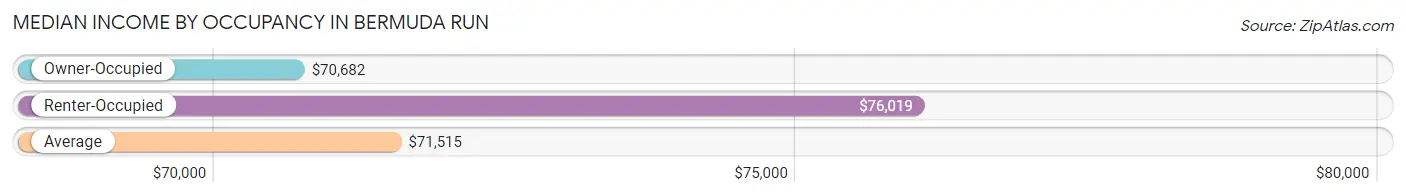
| Occupancy Type | # Households | Median Income |
| Owner-Occupied | 1,330 (87.3%) | $70,682 |
| Renter-Occupied | 194 (12.7%) | $76,019 |
| Average | 1,524 (100.0%) | $71,515 |
Occupancy by Householder Income Bracket in Bermuda Run
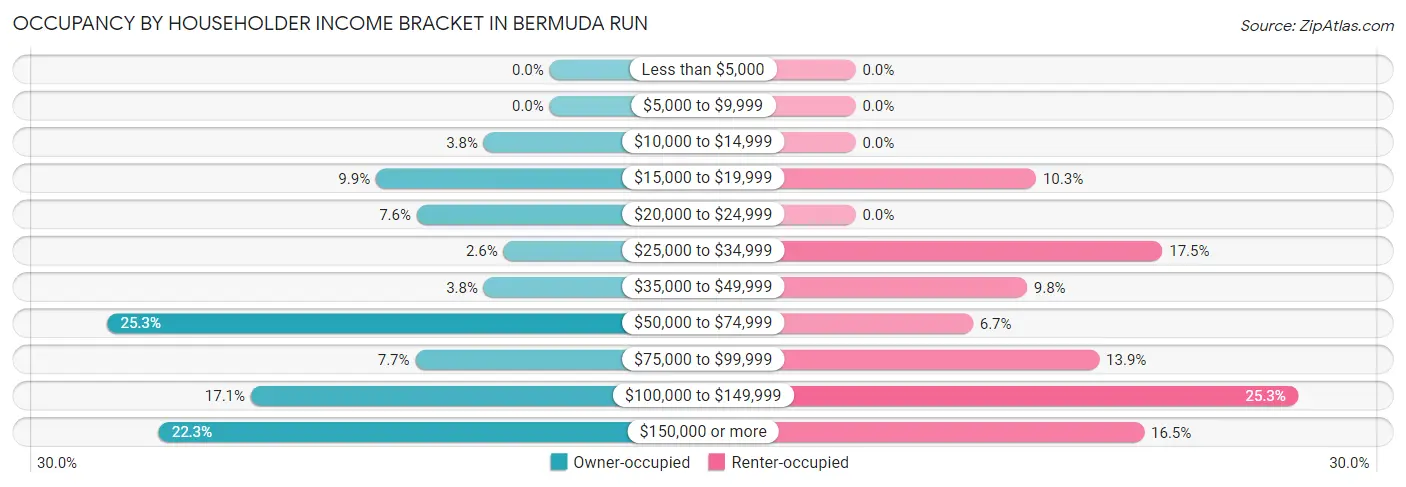
| Income Bracket | Owner-occupied | Renter-occupied |
| Less than $5,000 | 0 (0.0%) | 0 (0.0%) |
| $5,000 to $9,999 | 0 (0.0%) | 0 (0.0%) |
| $10,000 to $14,999 | 50 (3.8%) | 0 (0.0%) |
| $15,000 to $19,999 | 132 (9.9%) | 20 (10.3%) |
| $20,000 to $24,999 | 101 (7.6%) | 0 (0.0%) |
| $25,000 to $34,999 | 35 (2.6%) | 34 (17.5%) |
| $35,000 to $49,999 | 50 (3.8%) | 19 (9.8%) |
| $50,000 to $74,999 | 336 (25.3%) | 13 (6.7%) |
| $75,000 to $99,999 | 102 (7.7%) | 27 (13.9%) |
| $100,000 to $149,999 | 227 (17.1%) | 49 (25.3%) |
| $150,000 or more | 297 (22.3%) | 32 (16.5%) |
| Total | 1,330 (100.0%) | 194 (100.0%) |
Monthly Housing Cost Tiers in Bermuda Run
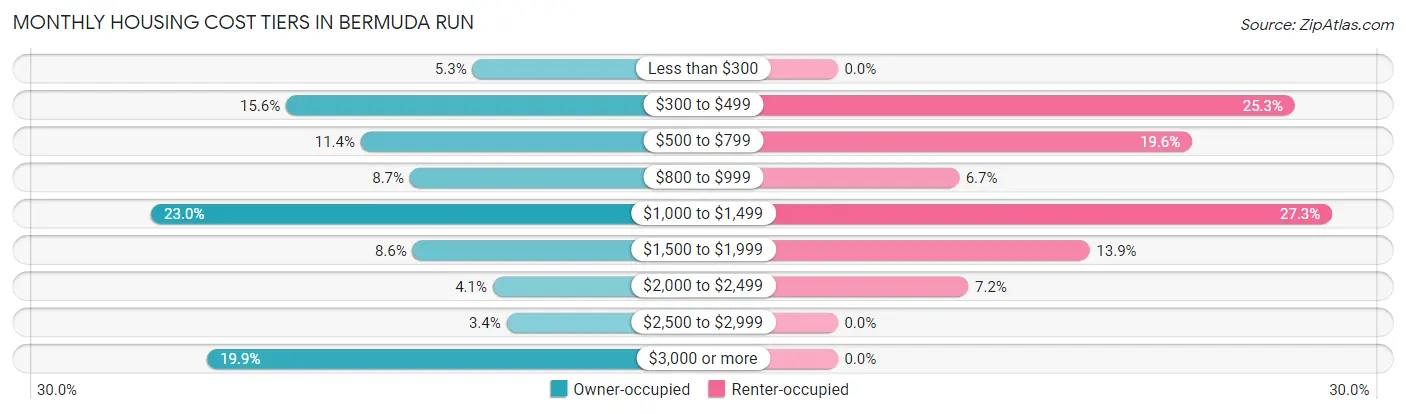
| Monthly Cost | Owner-occupied | Renter-occupied |
| Less than $300 | 70 (5.3%) | 0 (0.0%) |
| $300 to $499 | 207 (15.6%) | 49 (25.3%) |
| $500 to $799 | 152 (11.4%) | 38 (19.6%) |
| $800 to $999 | 116 (8.7%) | 13 (6.7%) |
| $1,000 to $1,499 | 306 (23.0%) | 53 (27.3%) |
| $1,500 to $1,999 | 114 (8.6%) | 27 (13.9%) |
| $2,000 to $2,499 | 55 (4.1%) | 14 (7.2%) |
| $2,500 to $2,999 | 45 (3.4%) | 0 (0.0%) |
| $3,000 or more | 265 (19.9%) | 0 (0.0%) |
| Total | 1,330 (100.0%) | 194 (100.0%) |
Physical Housing Characteristics in Bermuda Run
Housing Structures in Bermuda Run
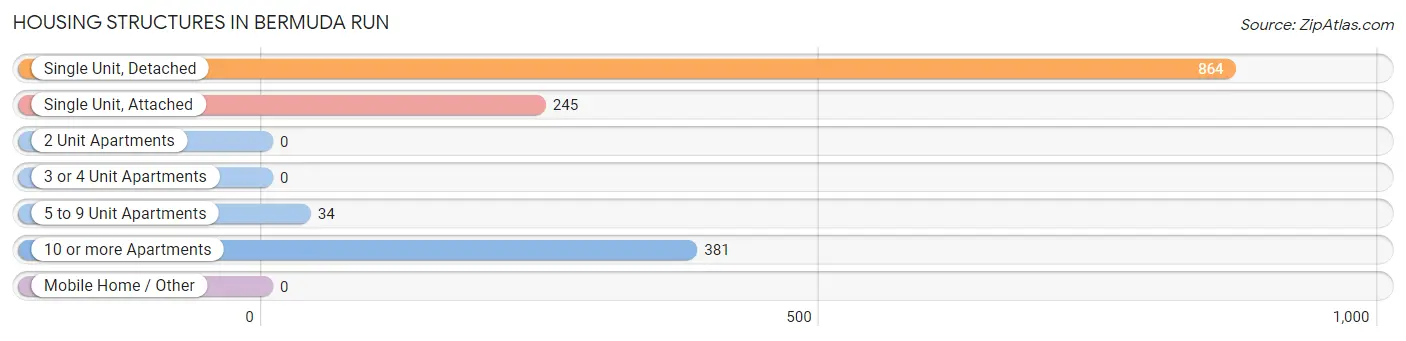
| Structure Type | # Housing Units | % Housing Units |
| Single Unit, Detached | 864 | 56.7% |
| Single Unit, Attached | 245 | 16.1% |
| 2 Unit Apartments | 0 | 0.0% |
| 3 or 4 Unit Apartments | 0 | 0.0% |
| 5 to 9 Unit Apartments | 34 | 2.2% |
| 10 or more Apartments | 381 | 25.0% |
| Mobile Home / Other | 0 | 0.0% |
| Total | 1,524 | 100.0% |
Housing Structures by Occupancy in Bermuda Run
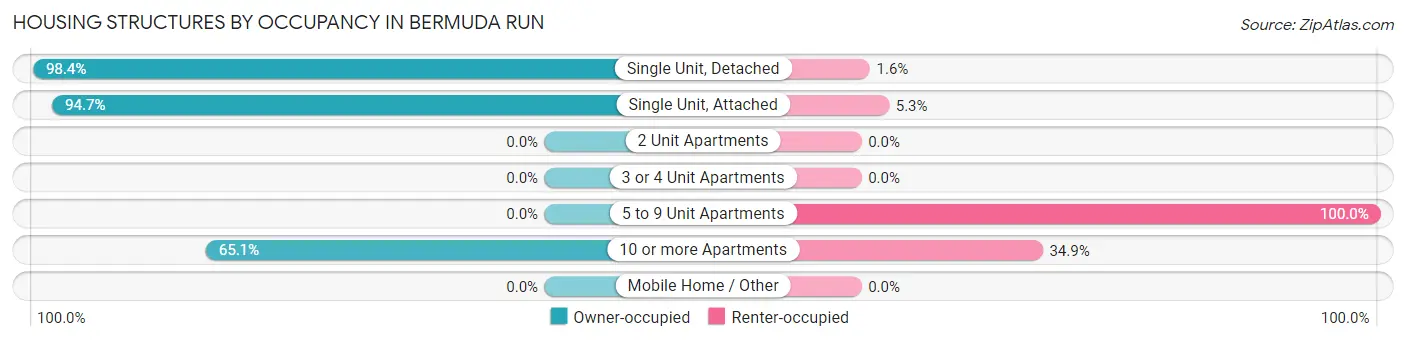
| Structure Type | Owner-occupied | Renter-occupied |
| Single Unit, Detached | 850 (98.4%) | 14 (1.6%) |
| Single Unit, Attached | 232 (94.7%) | 13 (5.3%) |
| 2 Unit Apartments | 0 (0.0%) | 0 (0.0%) |
| 3 or 4 Unit Apartments | 0 (0.0%) | 0 (0.0%) |
| 5 to 9 Unit Apartments | 0 (0.0%) | 34 (100.0%) |
| 10 or more Apartments | 248 (65.1%) | 133 (34.9%) |
| Mobile Home / Other | 0 (0.0%) | 0 (0.0%) |
| Total | 1,330 (87.3%) | 194 (12.7%) |
Housing Structures by Number of Rooms in Bermuda Run
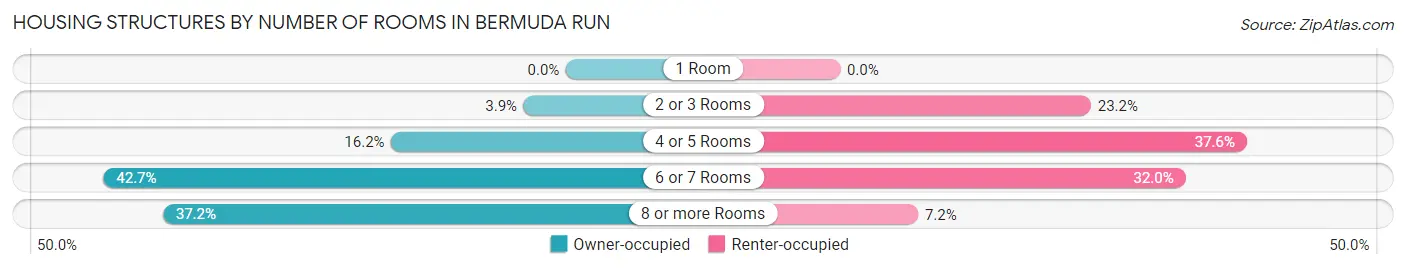
| Number of Rooms | Owner-occupied | Renter-occupied |
| 1 Room | 0 (0.0%) | 0 (0.0%) |
| 2 or 3 Rooms | 52 (3.9%) | 45 (23.2%) |
| 4 or 5 Rooms | 215 (16.2%) | 73 (37.6%) |
| 6 or 7 Rooms | 568 (42.7%) | 62 (32.0%) |
| 8 or more Rooms | 495 (37.2%) | 14 (7.2%) |
| Total | 1,330 (100.0%) | 194 (100.0%) |
Housing Structure by Heating Type in Bermuda Run
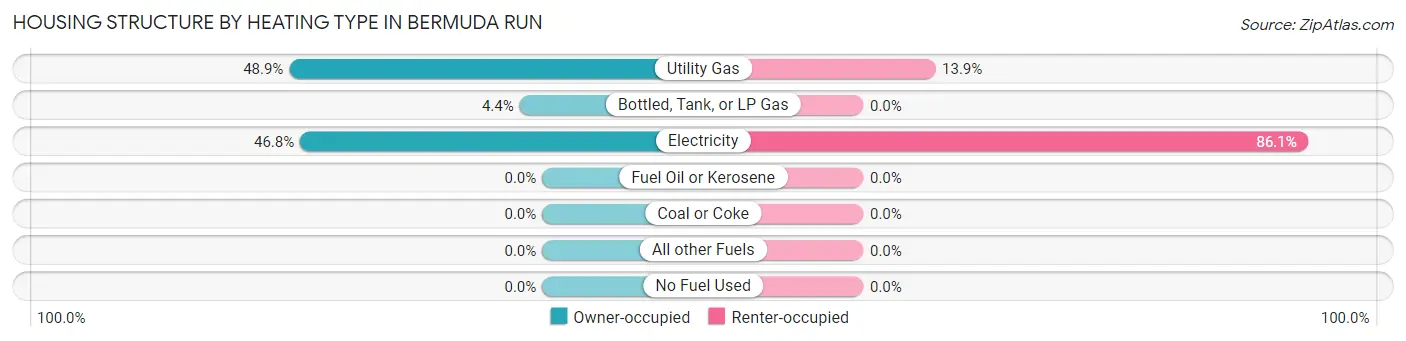
| Heating Type | Owner-occupied | Renter-occupied |
| Utility Gas | 650 (48.9%) | 27 (13.9%) |
| Bottled, Tank, or LP Gas | 58 (4.4%) | 0 (0.0%) |
| Electricity | 622 (46.8%) | 167 (86.1%) |
| Fuel Oil or Kerosene | 0 (0.0%) | 0 (0.0%) |
| Coal or Coke | 0 (0.0%) | 0 (0.0%) |
| All other Fuels | 0 (0.0%) | 0 (0.0%) |
| No Fuel Used | 0 (0.0%) | 0 (0.0%) |
| Total | 1,330 (100.0%) | 194 (100.0%) |
Household Vehicle Usage in Bermuda Run
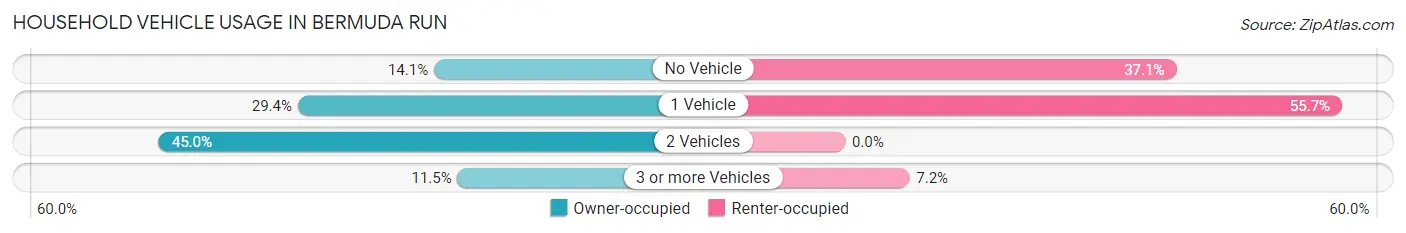
| Vehicles per Household | Owner-occupied | Renter-occupied |
| No Vehicle | 188 (14.1%) | 72 (37.1%) |
| 1 Vehicle | 391 (29.4%) | 108 (55.7%) |
| 2 Vehicles | 598 (45.0%) | 0 (0.0%) |
| 3 or more Vehicles | 153 (11.5%) | 14 (7.2%) |
| Total | 1,330 (100.0%) | 194 (100.0%) |
Real Estate & Mortgages in Bermuda Run
Real Estate and Mortgage Overview in Bermuda Run
| Characteristic | Without Mortgage | With Mortgage |
| Housing Units | 665 | 665 |
| Median Property Value | $218,100 | $321,900 |
| Median Household Income | $54,105 | $203 |
| Monthly Housing Costs | $579 | $95 |
| Real Estate Taxes | $2,361 | $0 |
Property Value by Mortgage Status in Bermuda Run
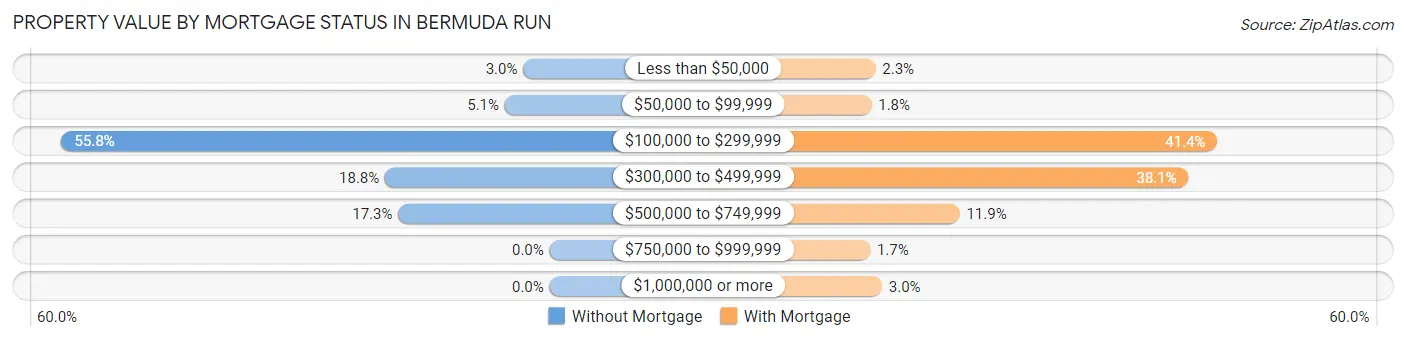
| Property Value | Without Mortgage | With Mortgage |
| Less than $50,000 | 20 (3.0%) | 15 (2.3%) |
| $50,000 to $99,999 | 34 (5.1%) | 12 (1.8%) |
| $100,000 to $299,999 | 371 (55.8%) | 275 (41.3%) |
| $300,000 to $499,999 | 125 (18.8%) | 253 (38.1%) |
| $500,000 to $749,999 | 115 (17.3%) | 79 (11.9%) |
| $750,000 to $999,999 | 0 (0.0%) | 11 (1.7%) |
| $1,000,000 or more | 0 (0.0%) | 20 (3.0%) |
| Total | 665 (100.0%) | 665 (100.0%) |
Household Income by Mortgage Status in Bermuda Run
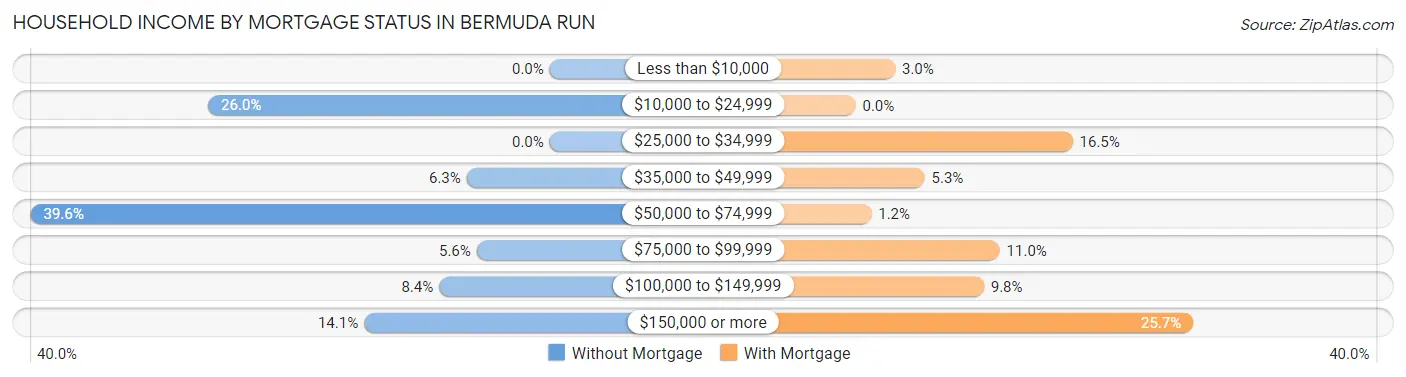
| Household Income | Without Mortgage | With Mortgage |
| Less than $10,000 | 0 (0.0%) | 20 (3.0%) |
| $10,000 to $24,999 | 173 (26.0%) | 0 (0.0%) |
| $25,000 to $34,999 | 0 (0.0%) | 110 (16.5%) |
| $35,000 to $49,999 | 42 (6.3%) | 35 (5.3%) |
| $50,000 to $74,999 | 263 (39.6%) | 8 (1.2%) |
| $75,000 to $99,999 | 37 (5.6%) | 73 (11.0%) |
| $100,000 to $149,999 | 56 (8.4%) | 65 (9.8%) |
| $150,000 or more | 94 (14.1%) | 171 (25.7%) |
| Total | 665 (100.0%) | 665 (100.0%) |
Property Value to Household Income Ratio in Bermuda Run

| Value-to-Income Ratio | Without Mortgage | With Mortgage |
| Less than 2.0x | 157 (23.6%) | 106,453 (16,008.0%) |
| 2.0x to 2.9x | 215 (32.3%) | 186 (28.0%) |
| 3.0x to 3.9x | 34 (5.1%) | 111 (16.7%) |
| 4.0x or more | 259 (39.0%) | 101 (15.2%) |
| Total | 665 (100.0%) | 665 (100.0%) |
Real Estate Taxes by Mortgage Status in Bermuda Run
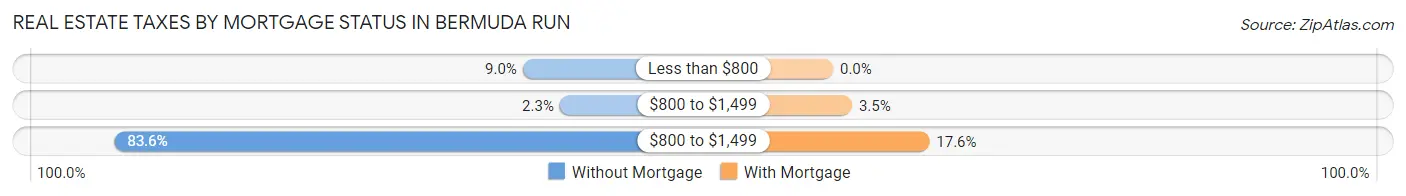
| Property Taxes | Without Mortgage | With Mortgage |
| Less than $800 | 60 (9.0%) | 0 (0.0%) |
| $800 to $1,499 | 15 (2.3%) | 23 (3.5%) |
| $800 to $1,499 | 556 (83.6%) | 117 (17.6%) |
| Total | 665 (100.0%) | 665 (100.0%) |
Health & Disability in Bermuda Run
Health Insurance Coverage by Age in Bermuda Run
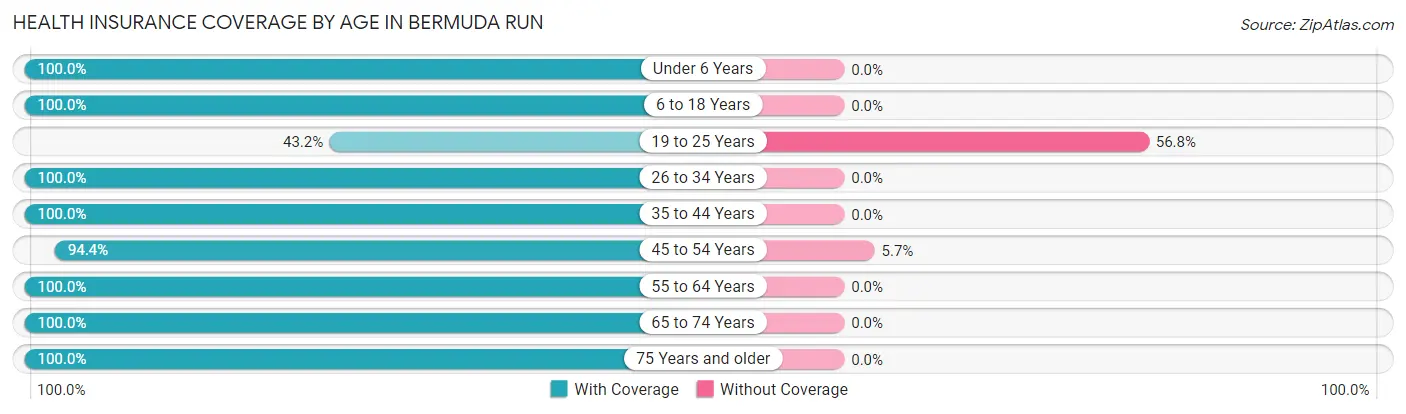
| Age Bracket | With Coverage | Without Coverage |
| Under 6 Years | 108 (100.0%) | 0 (0.0%) |
| 6 to 18 Years | 537 (100.0%) | 0 (0.0%) |
| 19 to 25 Years | 51 (43.2%) | 67 (56.8%) |
| 26 to 34 Years | 73 (100.0%) | 0 (0.0%) |
| 35 to 44 Years | 250 (100.0%) | 0 (0.0%) |
| 45 to 54 Years | 267 (94.4%) | 16 (5.7%) |
| 55 to 64 Years | 295 (100.0%) | 0 (0.0%) |
| 65 to 74 Years | 528 (100.0%) | 0 (0.0%) |
| 75 Years and older | 821 (100.0%) | 0 (0.0%) |
| Total | 2,930 (97.3%) | 83 (2.8%) |
Health Insurance Coverage by Citizenship Status in Bermuda Run
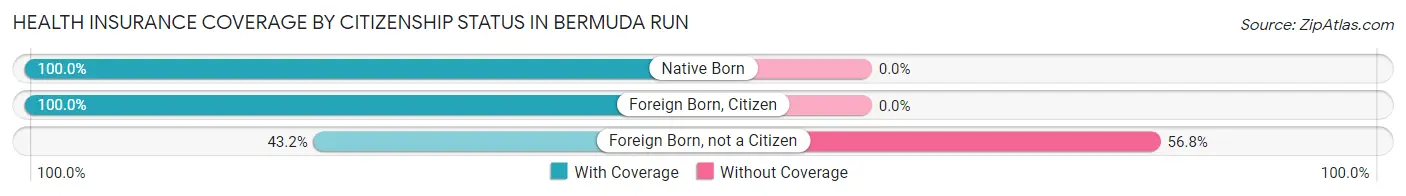
| Citizenship Status | With Coverage | Without Coverage |
| Native Born | 108 (100.0%) | 0 (0.0%) |
| Foreign Born, Citizen | 537 (100.0%) | 0 (0.0%) |
| Foreign Born, not a Citizen | 51 (43.2%) | 67 (56.8%) |
Health Insurance Coverage by Household Income in Bermuda Run
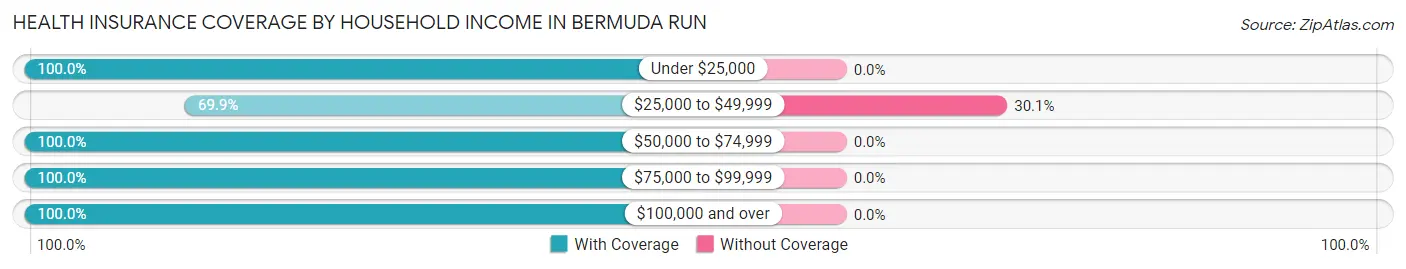
| Household Income | With Coverage | Without Coverage |
| Under $25,000 | 315 (100.0%) | 0 (0.0%) |
| $25,000 to $49,999 | 193 (69.9%) | 83 (30.1%) |
| $50,000 to $74,999 | 458 (100.0%) | 0 (0.0%) |
| $75,000 to $99,999 | 296 (100.0%) | 0 (0.0%) |
| $100,000 and over | 1,668 (100.0%) | 0 (0.0%) |
Public vs Private Health Insurance Coverage by Age in Bermuda Run
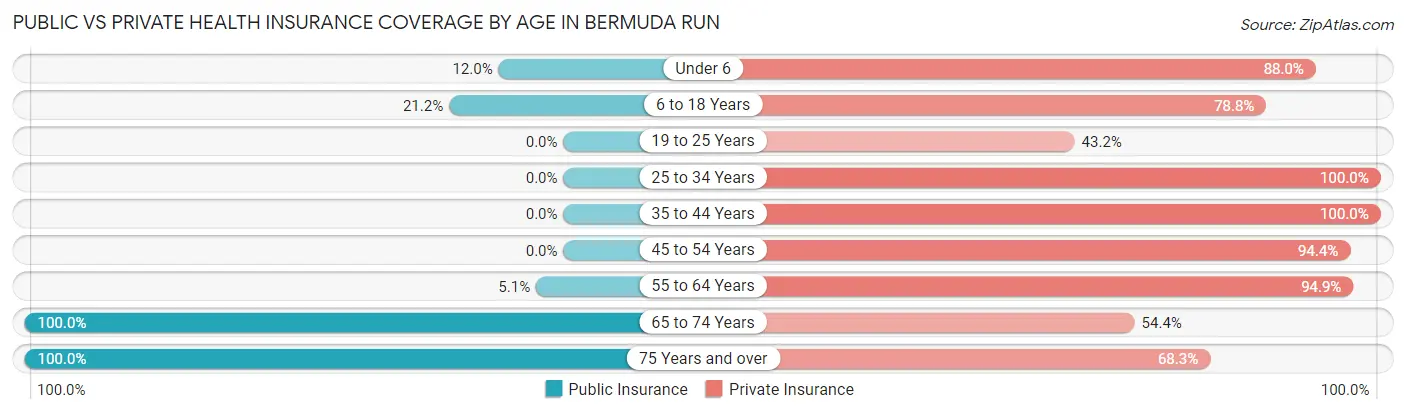
| Age Bracket | Public Insurance | Private Insurance |
| Under 6 | 13 (12.0%) | 95 (88.0%) |
| 6 to 18 Years | 114 (21.2%) | 423 (78.8%) |
| 19 to 25 Years | 0 (0.0%) | 51 (43.2%) |
| 25 to 34 Years | 0 (0.0%) | 73 (100.0%) |
| 35 to 44 Years | 0 (0.0%) | 250 (100.0%) |
| 45 to 54 Years | 0 (0.0%) | 267 (94.4%) |
| 55 to 64 Years | 15 (5.1%) | 280 (94.9%) |
| 65 to 74 Years | 528 (100.0%) | 287 (54.4%) |
| 75 Years and over | 821 (100.0%) | 561 (68.3%) |
| Total | 1,491 (49.5%) | 2,287 (75.9%) |
Disability Status by Sex by Age in Bermuda Run
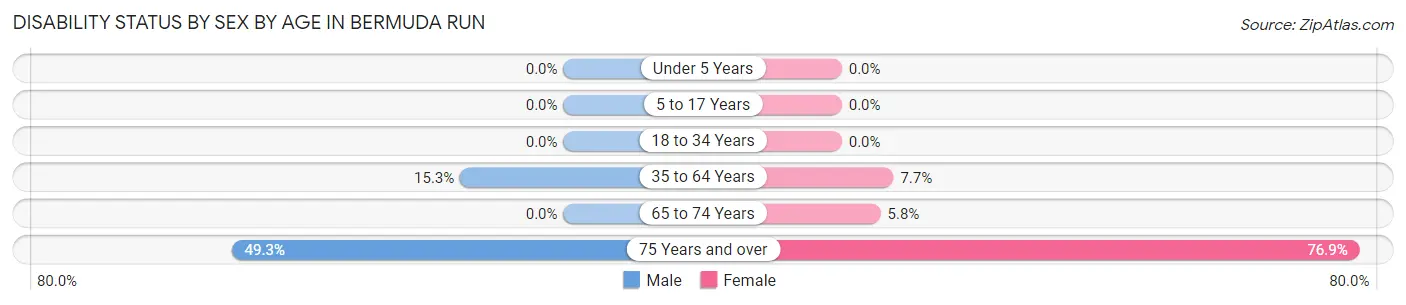
| Age Bracket | Male | Female |
| Under 5 Years | 0 (0.0%) | 0 (0.0%) |
| 5 to 17 Years | 0 (0.0%) | 0 (0.0%) |
| 18 to 34 Years | 0 (0.0%) | 0 (0.0%) |
| 35 to 64 Years | 65 (15.3%) | 31 (7.7%) |
| 65 to 74 Years | 0 (0.0%) | 19 (5.8%) |
| 75 Years and over | 134 (49.3%) | 422 (76.9%) |
Disability Class by Sex by Age in Bermuda Run
Disability Class: Hearing Difficulty
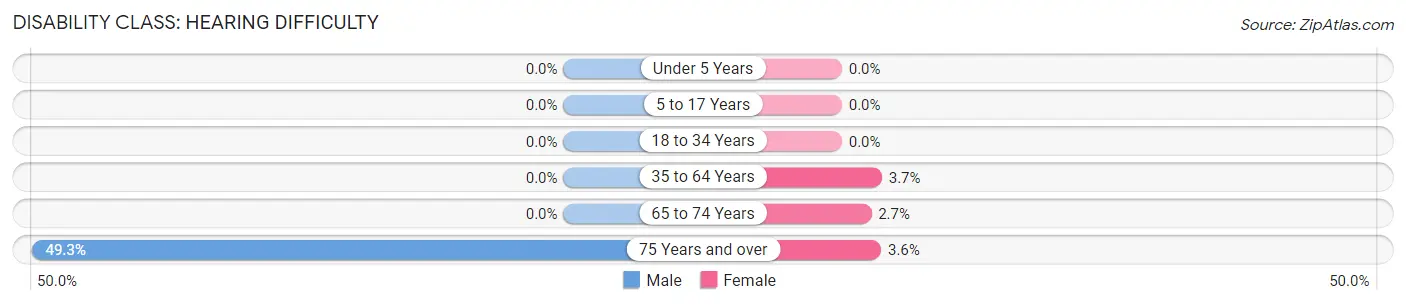
| Age Bracket | Male | Female |
| Under 5 Years | 0 (0.0%) | 0 (0.0%) |
| 5 to 17 Years | 0 (0.0%) | 0 (0.0%) |
| 18 to 34 Years | 0 (0.0%) | 0 (0.0%) |
| 35 to 64 Years | 0 (0.0%) | 15 (3.7%) |
| 65 to 74 Years | 0 (0.0%) | 9 (2.7%) |
| 75 Years and over | 134 (49.3%) | 20 (3.6%) |
Disability Class: Vision Difficulty
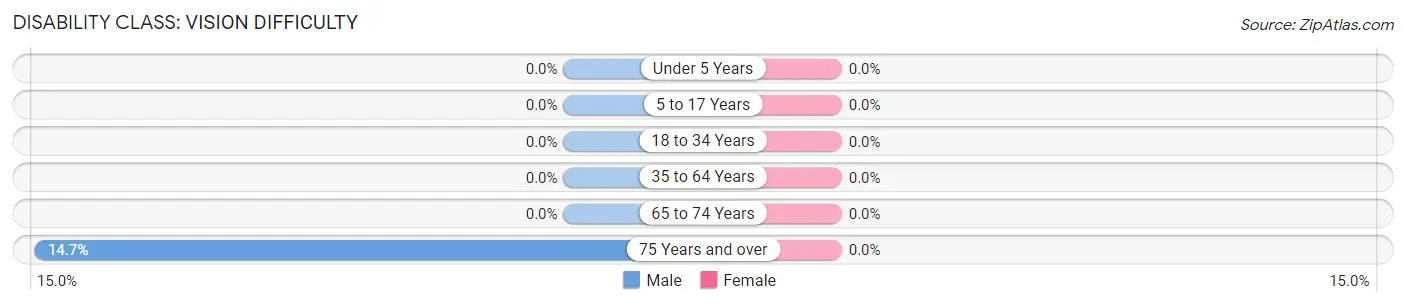
| Age Bracket | Male | Female |
| Under 5 Years | 0 (0.0%) | 0 (0.0%) |
| 5 to 17 Years | 0 (0.0%) | 0 (0.0%) |
| 18 to 34 Years | 0 (0.0%) | 0 (0.0%) |
| 35 to 64 Years | 0 (0.0%) | 0 (0.0%) |
| 65 to 74 Years | 0 (0.0%) | 0 (0.0%) |
| 75 Years and over | 40 (14.7%) | 0 (0.0%) |
Disability Class: Cognitive Difficulty
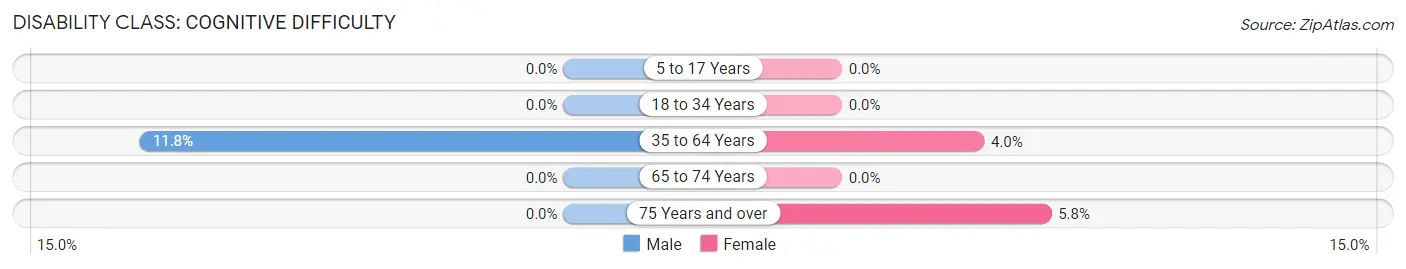
| Age Bracket | Male | Female |
| 5 to 17 Years | 0 (0.0%) | 0 (0.0%) |
| 18 to 34 Years | 0 (0.0%) | 0 (0.0%) |
| 35 to 64 Years | 50 (11.8%) | 16 (4.0%) |
| 65 to 74 Years | 0 (0.0%) | 0 (0.0%) |
| 75 Years and over | 0 (0.0%) | 32 (5.8%) |
Disability Class: Ambulatory Difficulty
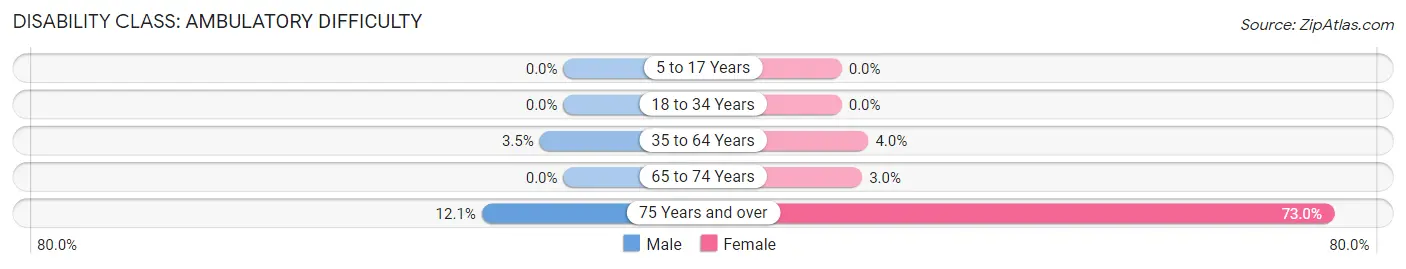
| Age Bracket | Male | Female |
| 5 to 17 Years | 0 (0.0%) | 0 (0.0%) |
| 18 to 34 Years | 0 (0.0%) | 0 (0.0%) |
| 35 to 64 Years | 15 (3.5%) | 16 (4.0%) |
| 65 to 74 Years | 0 (0.0%) | 10 (3.0%) |
| 75 Years and over | 33 (12.1%) | 401 (73.0%) |
Disability Class: Self-Care Difficulty
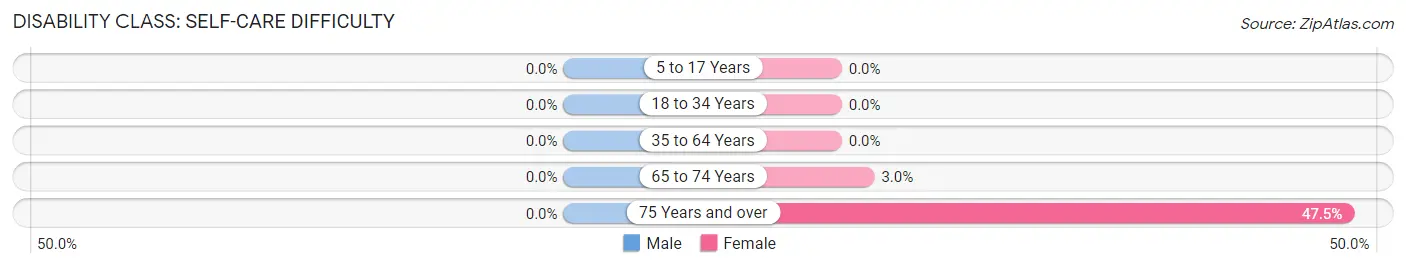
| Age Bracket | Male | Female |
| 5 to 17 Years | 0 (0.0%) | 0 (0.0%) |
| 18 to 34 Years | 0 (0.0%) | 0 (0.0%) |
| 35 to 64 Years | 0 (0.0%) | 0 (0.0%) |
| 65 to 74 Years | 0 (0.0%) | 10 (3.0%) |
| 75 Years and over | 0 (0.0%) | 261 (47.5%) |
Technology Access in Bermuda Run
Computing Device Access in Bermuda Run
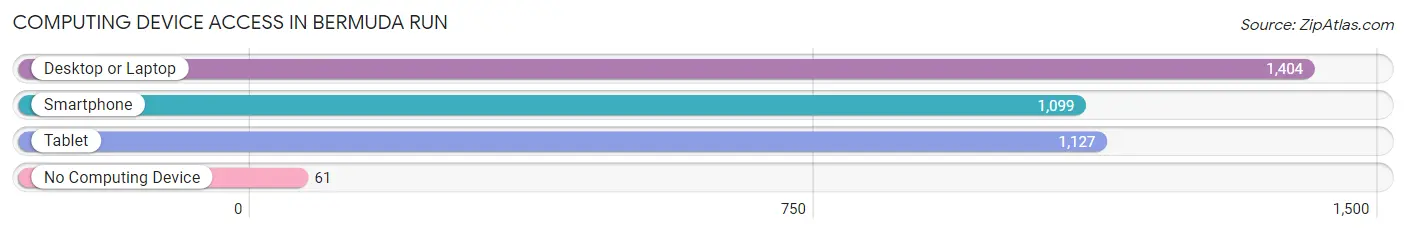
| Device Type | # Households | % Households |
| Desktop or Laptop | 1,404 | 92.1% |
| Smartphone | 1,099 | 72.1% |
| Tablet | 1,127 | 74.0% |
| No Computing Device | 61 | 4.0% |
| Total | 1,524 | 100.0% |
Internet Access in Bermuda Run
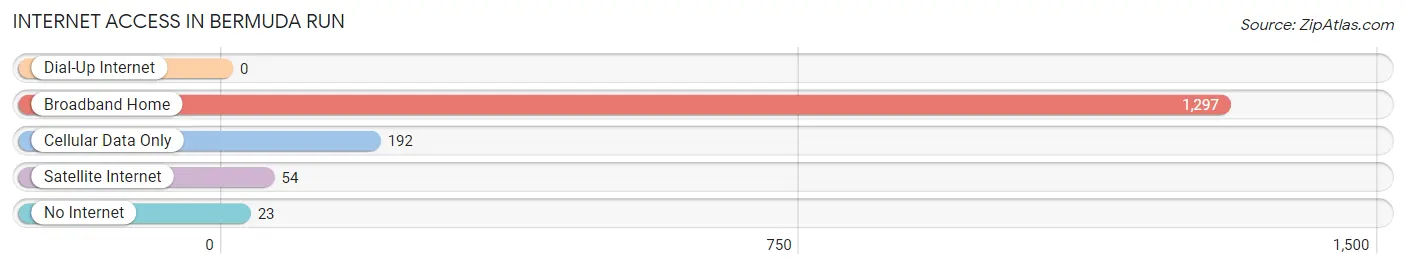
| Internet Type | # Households | % Households |
| Dial-Up Internet | 0 | 0.0% |
| Broadband Home | 1,297 | 85.1% |
| Cellular Data Only | 192 | 12.6% |
| Satellite Internet | 54 | 3.5% |
| No Internet | 23 | 1.5% |
| Total | 1,524 | 100.0% |
Bermuda Run Summary
Bermuda Run is a small town located in Davie County, North Carolina. It is situated in the foothills of the Blue Ridge Mountains, approximately 20 miles north of Winston-Salem. The town was founded in 1883 and was named after the Bermuda Islands, which were a popular destination for travelers at the time.
Geography
Bermuda Run is located in the Piedmont region of North Carolina, which is characterized by rolling hills and valleys. The town is situated in the Yadkin Valley, which is known for its fertile soil and abundant natural resources. The town is located at an elevation of 890 feet above sea level and is surrounded by the towns of Advance, Mocksville, and Clemmons. The town is located near the Yadkin River, which provides a source of recreation for the residents.
Climate
Bermuda Run has a humid subtropical climate, with hot, humid summers and mild winters. The average annual temperature is around 61°F, with an average high of 79°F in the summer and an average low of 43°F in the winter. The town receives an average of 45 inches of precipitation per year, with most of it falling in the summer months.
Demographics
As of the 2010 census, the population of Bermuda Run was 2,845. The racial makeup of the town was 94.3% White, 2.3% African American, 0.3% Native American, 0.7% Asian, 0.1% Pacific Islander, and 2.3% from other races. The median household income was $45,938, and the median family income was $54,938.
Economy
Bermuda Run is a small, rural town with a primarily agricultural economy. The town is home to several farms, which produce a variety of crops, including corn, soybeans, wheat, and hay. The town is also home to several wineries, which produce a variety of wines. The town is also home to several small businesses, including restaurants, retail stores, and professional services.
History
Bermuda Run was founded in 1883 by a group of settlers from the nearby town of Mocksville. The town was named after the Bermuda Islands, which were a popular destination for travelers at the time. The town was originally a farming community, and the residents grew a variety of crops, including corn, wheat, and hay. The town was also home to several small businesses, including a general store, a blacksmith shop, and a grist mill.
In the early 1900s, the town began to grow and develop. The town was home to several churches, a school, and a post office. The town also had a railroad station, which allowed for the transportation of goods and people. The town continued to grow and develop throughout the 20th century, and today it is a small, rural town with a population of just over 2,800.
Common Questions
What is the Total Population of Bermuda Run?
Total Population of Bermuda Run is 3,118.
What is the Total Male Population of Bermuda Run?
Total Male Population of Bermuda Run is 1,134.
What is the Total Female Population of Bermuda Run?
Total Female Population of Bermuda Run is 1,984.
What is the Ratio of Males per 100 Females in Bermuda Run?
There are 57.16 Males per 100 Females in Bermuda Run.
What is the Ratio of Females per 100 Males in Bermuda Run?
There are 174.96 Females per 100 Males in Bermuda Run.
What is the Median Population Age in Bermuda Run?
Median Population Age in Bermuda Run is 60.1 Years.
What is the Average Family Size in Bermuda Run
Average Family Size in Bermuda Run is 2.9 People.
What is the Average Household Size in Bermuda Run
Average Household Size in Bermuda Run is 2.0 People.
What is Per Capita Income in Bermuda Run?
Per Capita income in Bermuda Run is $51,087.
What is the Median Family Income in Bermuda Run?
Median Family Income in Bermuda Run is $116,042.
What is the Median Household income in Bermuda Run?
Median Household Income in Bermuda Run is $71,515.
What is Income or Wage Gap in Bermuda Run?
Income or Wage Gap in Bermuda Run is 48.7%.
Women in Bermuda Run earn 51.3 cents for every dollar earned by a man.
What is Inequality or Gini Index in Bermuda Run?
Inequality or Gini Index in Bermuda Run is 0.46.
How Large is the Labor Force in Bermuda Run?
There are 1,008 People in the Labor Forcein in Bermuda Run.
What is the Percentage of People in the Labor Force in Bermuda Run?
38.9% of People are in the Labor Force in Bermuda Run.