Everetts, NC
Everetts Map
Everetts Overview
269
TOTAL POPULATION
119
MALE POPULATION
150
FEMALE POPULATION
79.33
MALES / 100 FEMALES
126.05
FEMALES / 100 MALES
24.8
MEDIAN AGE
4.9
AVG FAMILY SIZE
4.3
AVG HOUSEHOLD SIZE
$16,597
PER CAPITA INCOME
$76,250
AVG FAMILY INCOME
$55,000
AVG HOUSEHOLD INCOME
0.35
INEQUALITY / GINI INDEX
130
LABOR FORCE [ PEOPLE ]
67.4%
PERCENT IN LABOR FORCE
Everetts Zip Codes
Everetts Area Codes
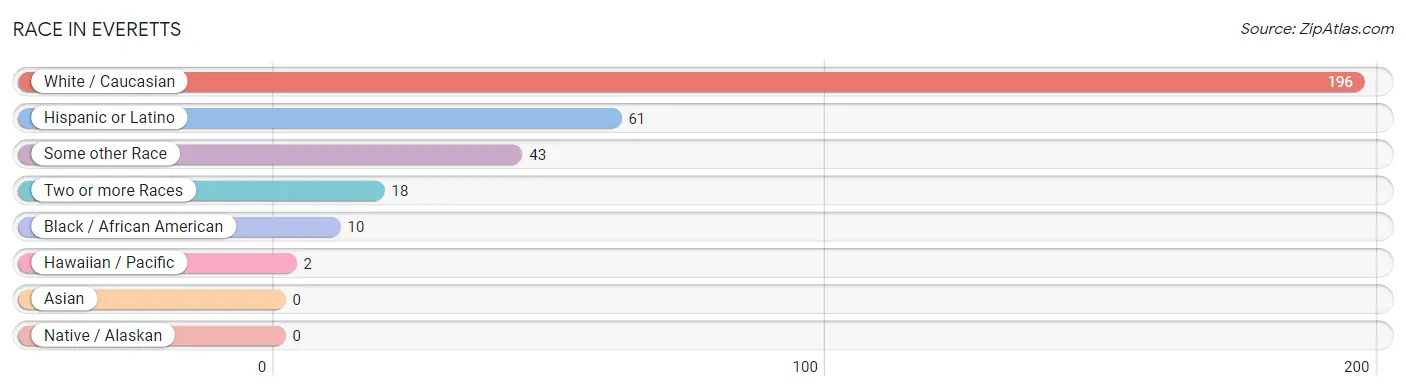
Race in Everetts
The most populous races in Everetts are White / Caucasian (196 | 72.9%), Hispanic or Latino (61 | 22.7%), and Some other Race (43 | 16.0%).
| Race | # Population | % Population |
| Asian | 0 | 0.0% |
| Black / African American | 10 | 3.7% |
| Hawaiian / Pacific | 2 | 0.7% |
| Hispanic or Latino | 61 | 22.7% |
| Native / Alaskan | 0 | 0.0% |
| White / Caucasian | 196 | 72.9% |
| Two or more Races | 18 | 6.7% |
| Some other Race | 43 | 16.0% |
| Total | 269 | 100.0% |
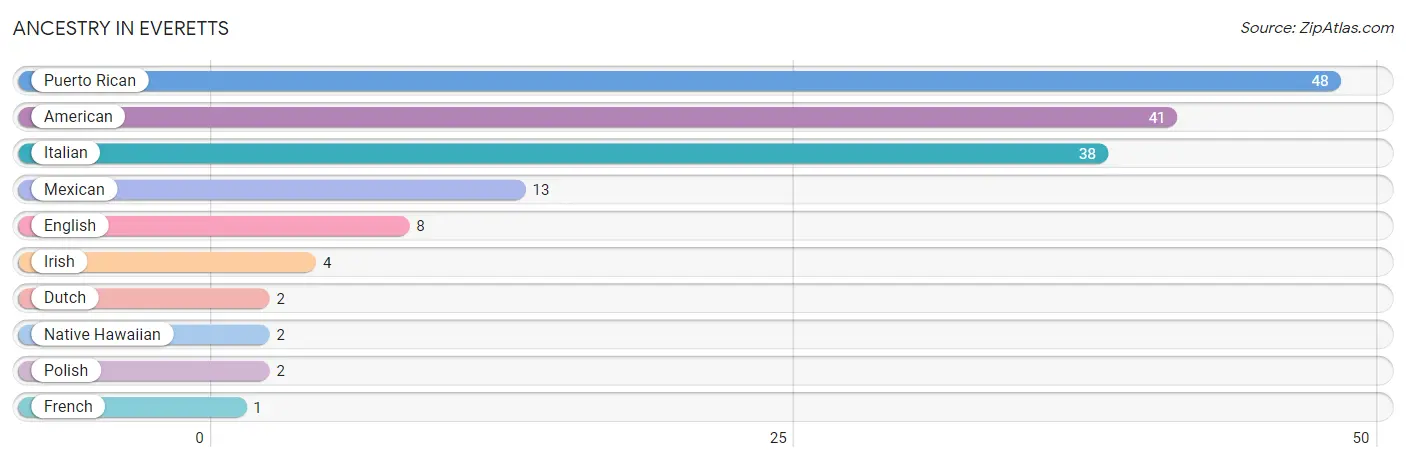
Ancestry in Everetts
The most populous ancestries reported in Everetts are Puerto Rican (48 | 17.8%), American (41 | 15.2%), Italian (38 | 14.1%), Mexican (13 | 4.8%), and English (8 | 3.0%), together accounting for 55.0% of all Everetts residents.
| Ancestry | # Population | % Population |
| American | 41 | 15.2% |
| Dutch | 2 | 0.7% |
| English | 8 | 3.0% |
| French | 1 | 0.4% |
| Irish | 4 | 1.5% |
| Italian | 38 | 14.1% |
| Mexican | 13 | 4.8% |
| Native Hawaiian | 2 | 0.7% |
| Polish | 2 | 0.7% |
| Puerto Rican | 48 | 17.8% | View All 10 Rows |
Immigrants in Everetts

| Immigration Origin | # Population | % Population | View All 0 Rows |
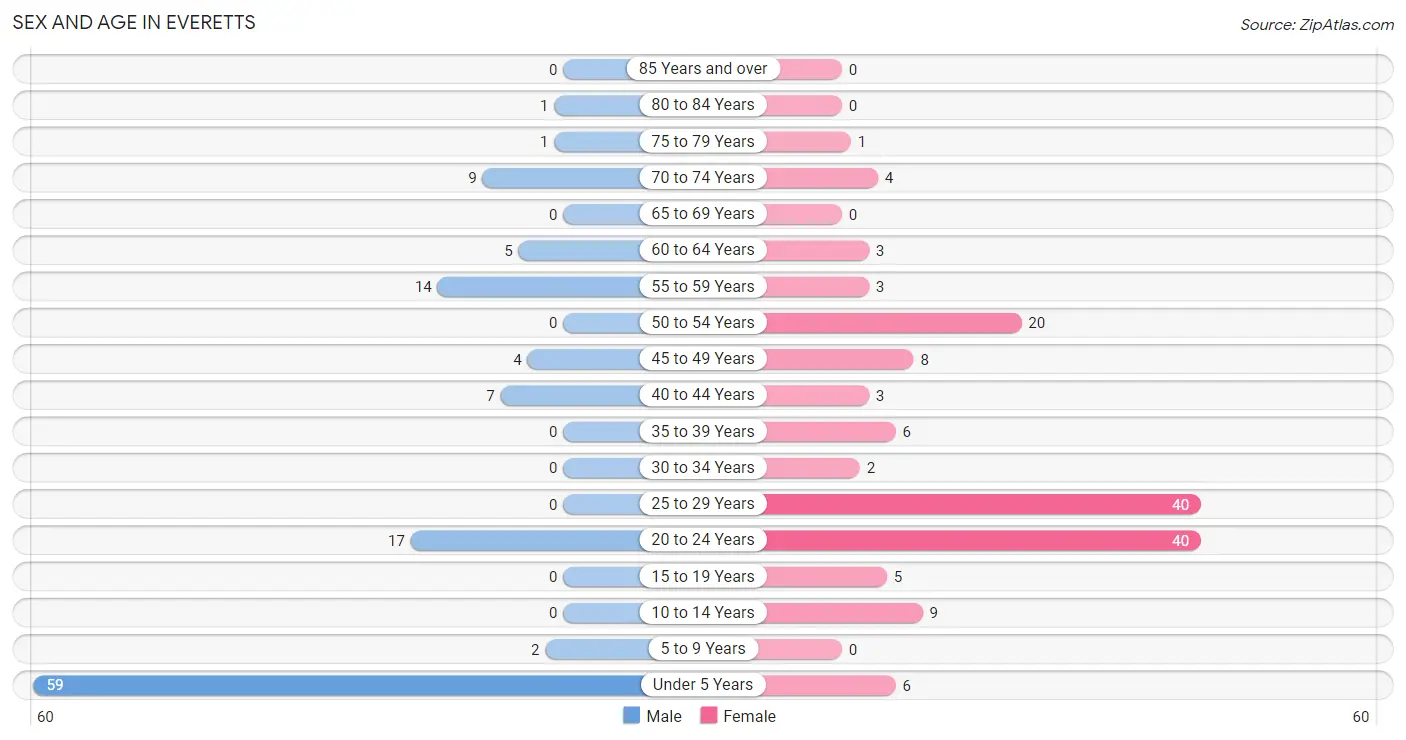
Sex and Age in Everetts
Sex and Age in Everetts
The most populous age groups in Everetts are Under 5 Years (59 | 49.6%) for men and 20 to 24 Years (40 | 26.7%) for women.
| Age Bracket | Male | Female |
| Under 5 Years | 59 (49.6%) | 6 (4.0%) |
| 5 to 9 Years | 2 (1.7%) | 0 (0.0%) |
| 10 to 14 Years | 0 (0.0%) | 9 (6.0%) |
| 15 to 19 Years | 0 (0.0%) | 5 (3.3%) |
| 20 to 24 Years | 17 (14.3%) | 40 (26.7%) |
| 25 to 29 Years | 0 (0.0%) | 40 (26.7%) |
| 30 to 34 Years | 0 (0.0%) | 2 (1.3%) |
| 35 to 39 Years | 0 (0.0%) | 6 (4.0%) |
| 40 to 44 Years | 7 (5.9%) | 3 (2.0%) |
| 45 to 49 Years | 4 (3.4%) | 8 (5.3%) |
| 50 to 54 Years | 0 (0.0%) | 20 (13.3%) |
| 55 to 59 Years | 14 (11.8%) | 3 (2.0%) |
| 60 to 64 Years | 5 (4.2%) | 3 (2.0%) |
| 65 to 69 Years | 0 (0.0%) | 0 (0.0%) |
| 70 to 74 Years | 9 (7.6%) | 4 (2.7%) |
| 75 to 79 Years | 1 (0.8%) | 1 (0.7%) |
| 80 to 84 Years | 1 (0.8%) | 0 (0.0%) |
| 85 Years and over | 0 (0.0%) | 0 (0.0%) |
| Total | 119 (100.0%) | 150 (100.0%) |
Families and Households in Everetts
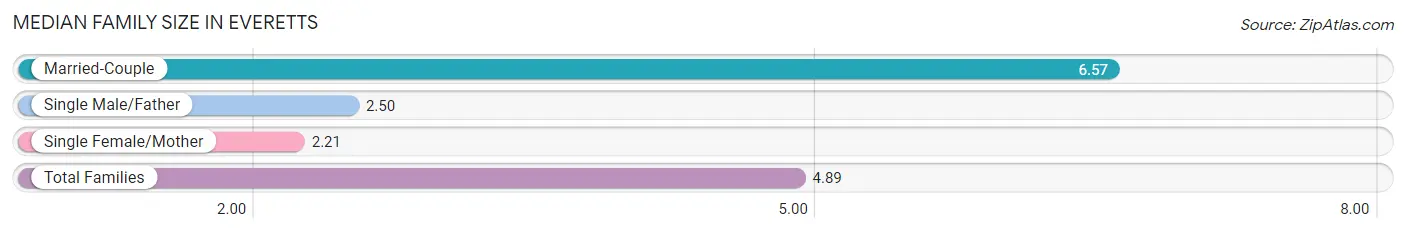
Median Family Size in Everetts
The median family size in Everetts is 4.89 persons per family, with married-couple families (28 | 60.9%) accounting for the largest median family size of 6.57 persons per family. On the other hand, single female/mother families (14 | 30.4%) represent the smallest median family size with 2.21 persons per family.
| Family Type | # Families | Family Size |
| Married-Couple | 28 (60.9%) | 6.57 |
| Single Male/Father | 4 (8.7%) | 2.50 |
| Single Female/Mother | 14 (30.4%) | 2.21 |
| Total Families | 46 (100.0%) | 4.89 |
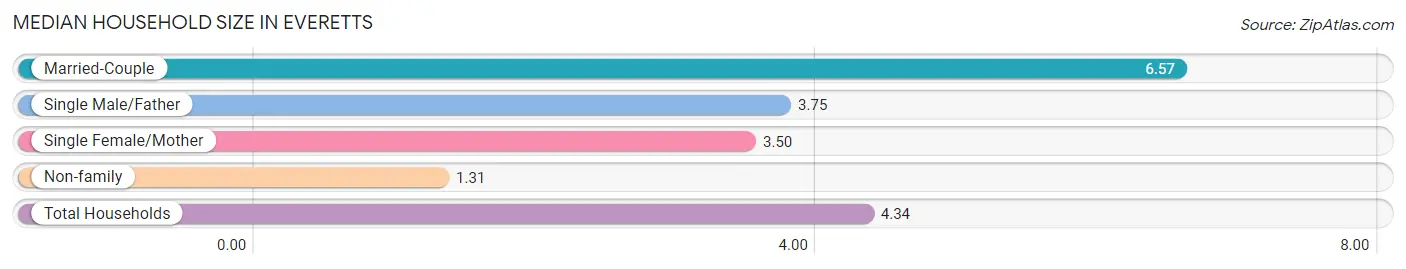
Median Household Size in Everetts
The median household size in Everetts is 4.34 persons per household, with married-couple households (28 | 45.2%) accounting for the largest median household size of 6.57 persons per household. non-family households (16 | 25.8%) represent the smallest median household size with 1.31 persons per household.
| Household Type | # Households | Household Size |
| Married-Couple | 28 (45.2%) | 6.57 |
| Single Male/Father | 4 (6.5%) | 3.75 |
| Single Female/Mother | 14 (22.6%) | 3.50 |
| Non-family | 16 (25.8%) | 1.31 |
| Total Households | 62 (100.0%) | 4.34 |
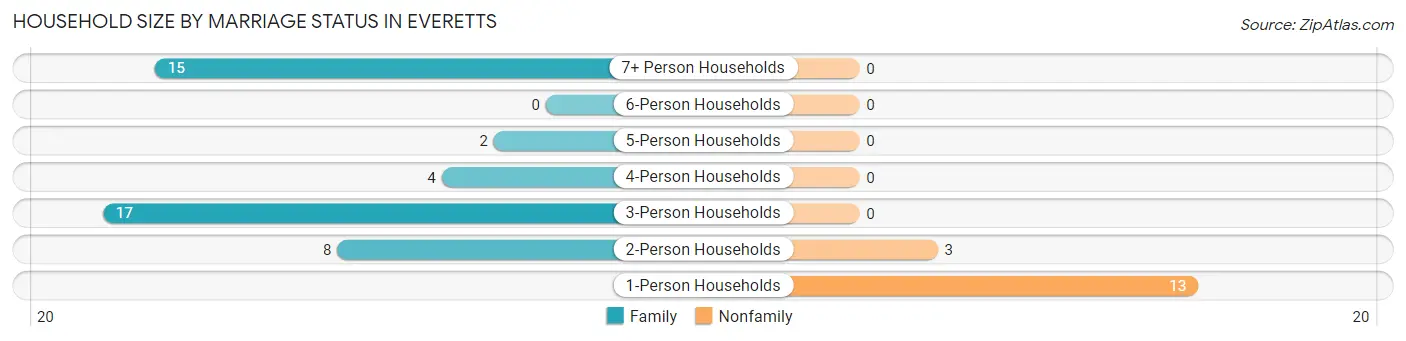
Household Size by Marriage Status in Everetts
Out of a total of 62 households in Everetts, 46 (74.2%) are family households, while 16 (25.8%) are nonfamily households. The most numerous type of family households are 3-person households, comprising 17, and the most common type of nonfamily households are 1-person households, comprising 13.
| Household Size | Family Households | Nonfamily Households |
| 1-Person Households | - | 13 (21.0%) |
| 2-Person Households | 8 (12.9%) | 3 (4.8%) |
| 3-Person Households | 17 (27.4%) | 0 (0.0%) |
| 4-Person Households | 4 (6.5%) | 0 (0.0%) |
| 5-Person Households | 2 (3.2%) | 0 (0.0%) |
| 6-Person Households | 0 (0.0%) | 0 (0.0%) |
| 7+ Person Households | 15 (24.2%) | 0 (0.0%) |
| Total | 46 (74.2%) | 16 (25.8%) |
Female Fertility in Everetts
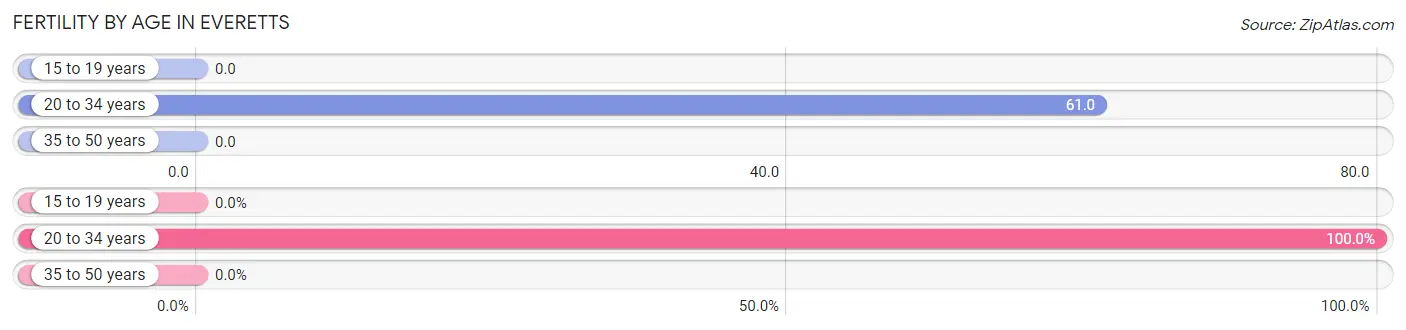
Fertility by Age in Everetts
Average fertility rate in Everetts is 42.0 births per 1,000 women. Women in the age bracket of 20 to 34 years have the highest fertility rate with 61.0 births per 1,000 women. Women in the age bracket of 20 to 34 years acount for 100.0% of all women with births.
| Age Bracket | Women with Births | Births / 1,000 Women |
| 15 to 19 years | 0 (0.0%) | 0.0 |
| 20 to 34 years | 5 (100.0%) | 61.0 |
| 35 to 50 years | 0 (0.0%) | 0.0 |
| Total | 5 (100.0%) | 42.0 |
Fertility by Age by Marriage Status in Everetts
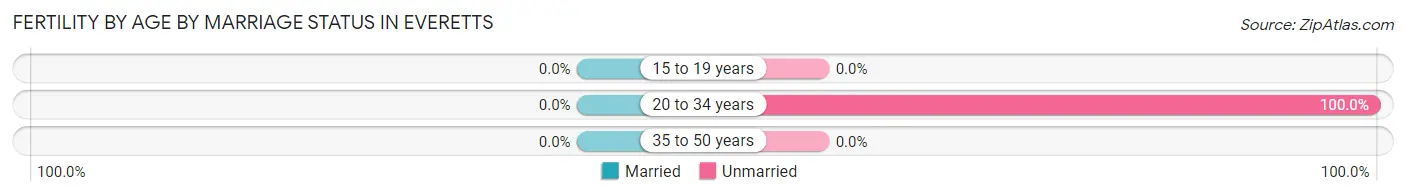
| Age Bracket | Married | Unmarried |
| 15 to 19 years | 0 (0.0%) | 0 (0.0%) |
| 20 to 34 years | 0 (0.0%) | 5 (100.0%) |
| 35 to 50 years | 0 (0.0%) | 0 (0.0%) |
| Total | 0 (0.0%) | 5 (100.0%) |
Fertility by Education in Everetts
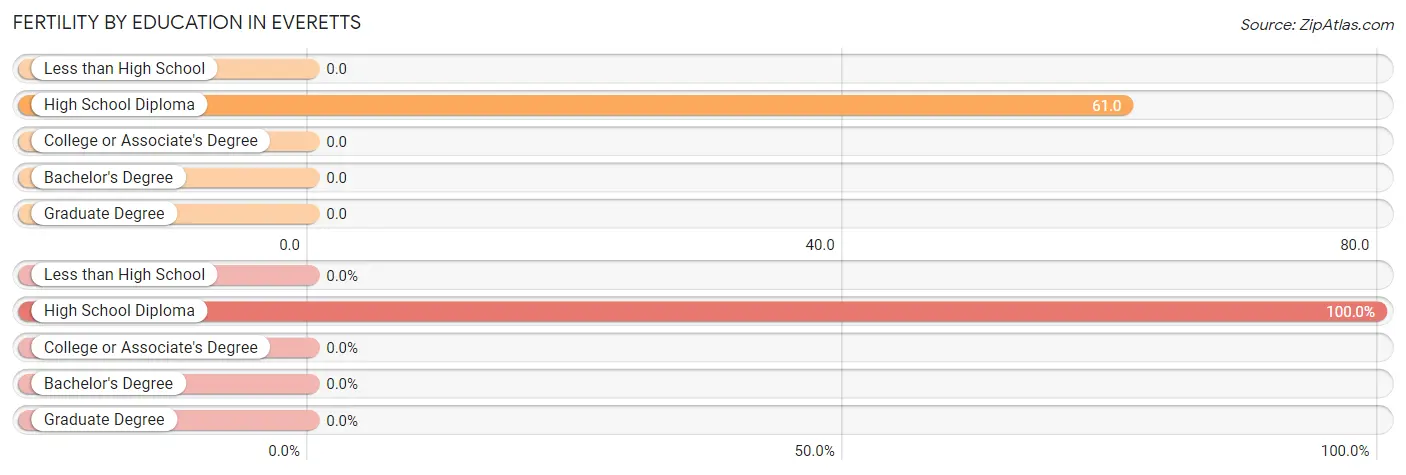
| Educational Attainment | Women with Births | Births / 1,000 Women |
| Less than High School | 0 (0.0%) | 0.0 |
| High School Diploma | 5 (100.0%) | 61.0 |
| College or Associate's Degree | 0 (0.0%) | 0.0 |
| Bachelor's Degree | 0 (0.0%) | 0.0 |
| Graduate Degree | 0 (0.0%) | 0.0 |
| Total | 5 (100.0%) | 42.0 |
Fertility by Education by Marriage Status in Everetts
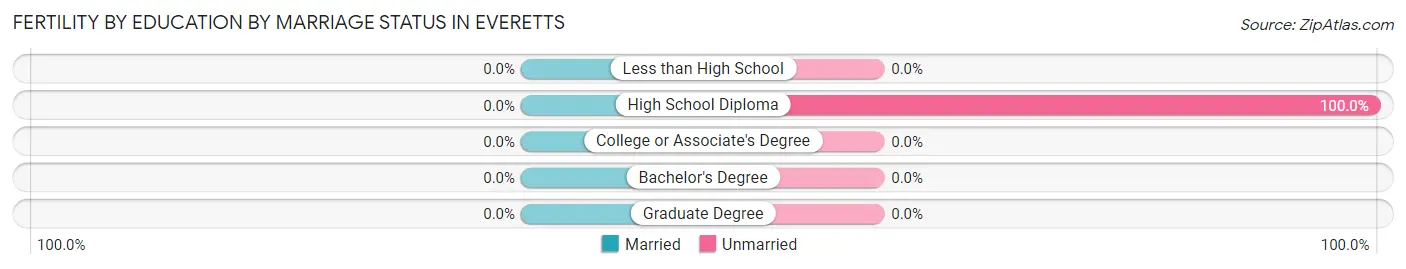
| Educational Attainment | Married | Unmarried |
| Less than High School | 0 (0.0%) | 0 (0.0%) |
| High School Diploma | 0 (0.0%) | 5 (100.0%) |
| College or Associate's Degree | 0 (0.0%) | 0 (0.0%) |
| Bachelor's Degree | 0 (0.0%) | 0 (0.0%) |
| Graduate Degree | 0 (0.0%) | 0 (0.0%) |
| Total | 0 (0.0%) | 5 (100.0%) |
Income in Everetts
Income Overview in Everetts
Per Capita Income in Everetts is $16,597, while median incomes of families and households are $76,250 and $55,000 respectively.
| Characteristic | Number | Measure |
| Per Capita Income | 269 | $16,597 |
| Median Family Income | 46 | $76,250 |
| Mean Family Income | 46 | $61,148 |
| Median Household Income | 62 | $55,000 |
| Mean Household Income | 62 | $63,452 |
| Income Deficit | 46 | $0 |
| Wage / Income Gap (%) | 269 | 0.00% |
| Wage / Income Gap ($) | 269 | 100.00¢ per $1 |
| Gini / Inequality Index | 269 | 0.35 |
Earnings by Sex in Everetts
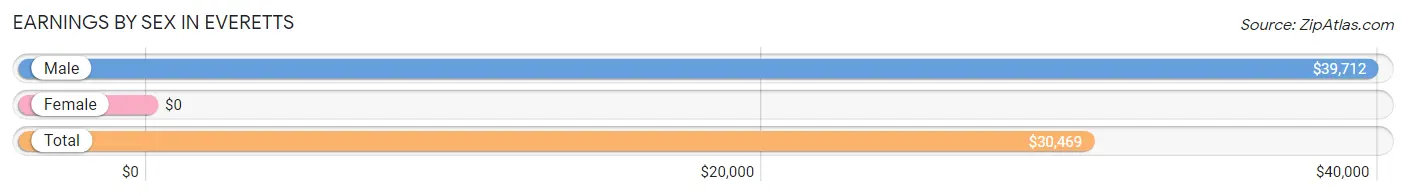
| Sex | Number | Average Earnings |
| Male | 47 (35.6%) | $39,712 |
| Female | 85 (64.4%) | $0 |
| Total | 132 (100.0%) | $30,469 |
Earnings by Sex by Income Bracket in Everetts
The most common earnings brackets in Everetts are $55,000 to $64,999 for men (16 | 34.0%) and $15,000 to $17,499 for women (24 | 28.2%).
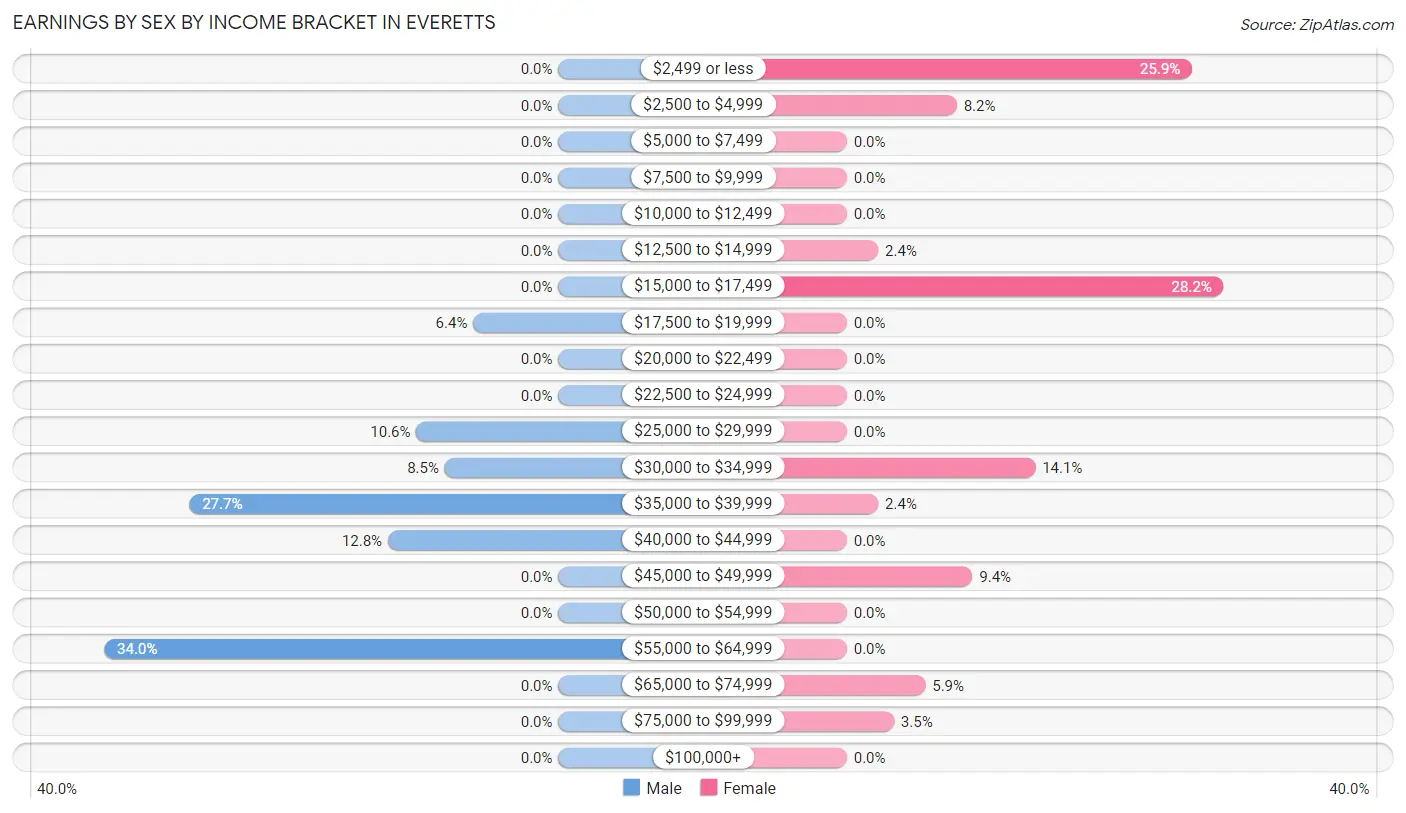
| Income | Male | Female |
| $2,499 or less | 0 (0.0%) | 22 (25.9%) |
| $2,500 to $4,999 | 0 (0.0%) | 7 (8.2%) |
| $5,000 to $7,499 | 0 (0.0%) | 0 (0.0%) |
| $7,500 to $9,999 | 0 (0.0%) | 0 (0.0%) |
| $10,000 to $12,499 | 0 (0.0%) | 0 (0.0%) |
| $12,500 to $14,999 | 0 (0.0%) | 2 (2.4%) |
| $15,000 to $17,499 | 0 (0.0%) | 24 (28.2%) |
| $17,500 to $19,999 | 3 (6.4%) | 0 (0.0%) |
| $20,000 to $22,499 | 0 (0.0%) | 0 (0.0%) |
| $22,500 to $24,999 | 0 (0.0%) | 0 (0.0%) |
| $25,000 to $29,999 | 5 (10.6%) | 0 (0.0%) |
| $30,000 to $34,999 | 4 (8.5%) | 12 (14.1%) |
| $35,000 to $39,999 | 13 (27.7%) | 2 (2.4%) |
| $40,000 to $44,999 | 6 (12.8%) | 0 (0.0%) |
| $45,000 to $49,999 | 0 (0.0%) | 8 (9.4%) |
| $50,000 to $54,999 | 0 (0.0%) | 0 (0.0%) |
| $55,000 to $64,999 | 16 (34.0%) | 0 (0.0%) |
| $65,000 to $74,999 | 0 (0.0%) | 5 (5.9%) |
| $75,000 to $99,999 | 0 (0.0%) | 3 (3.5%) |
| $100,000+ | 0 (0.0%) | 0 (0.0%) |
| Total | 47 (100.0%) | 85 (100.0%) |
Earnings by Sex by Educational Attainment in Everetts
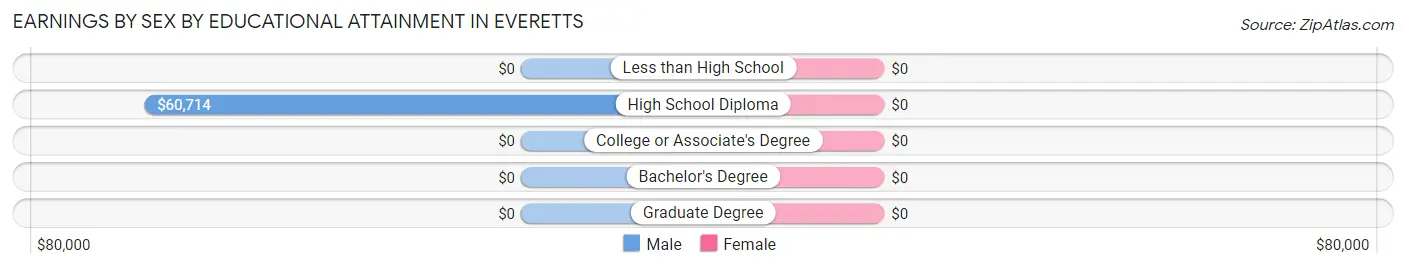
| Educational Attainment | Male Income | Female Income |
| Less than High School | - | - |
| High School Diploma | $60,714 | $0 |
| College or Associate's Degree | - | - |
| Bachelor's Degree | - | - |
| Graduate Degree | - | - |
| Total | $60,179 | $0 |
Family Income in Everetts
Family Income Brackets in Everetts
According to the Everetts family income data, there are 21 families falling into the $75,000 to $99,999 income range, which is the most common income bracket and makes up 45.7% of all families.
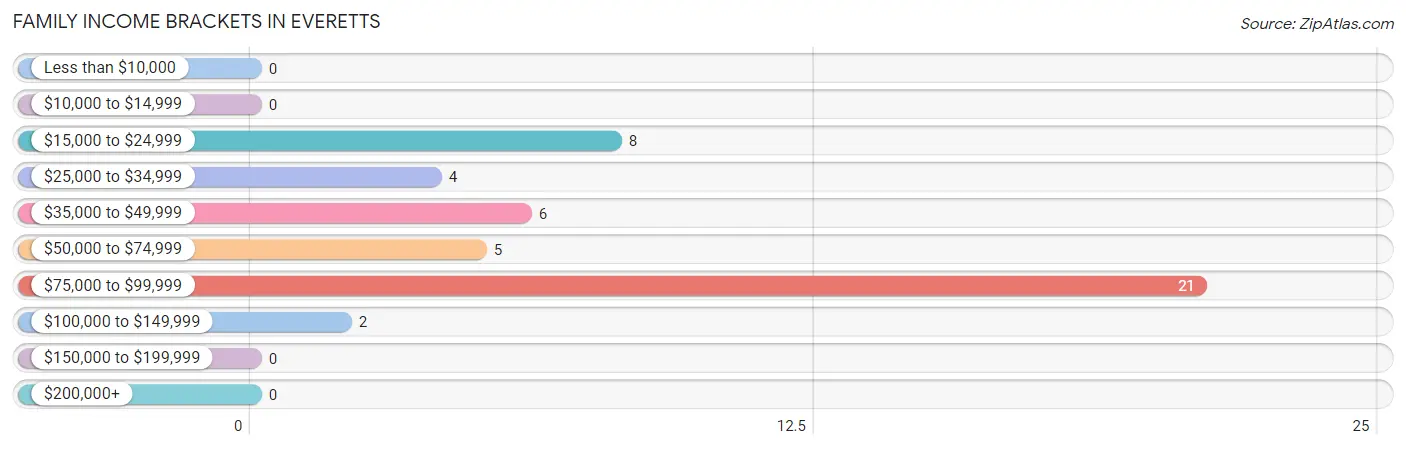
| Income Bracket | # Families | % Families |
| Less than $10,000 | 0 | 0.0% |
| $10,000 to $14,999 | 0 | 0.0% |
| $15,000 to $24,999 | 8 | 17.4% |
| $25,000 to $34,999 | 4 | 8.7% |
| $35,000 to $49,999 | 6 | 13.0% |
| $50,000 to $74,999 | 5 | 10.9% |
| $75,000 to $99,999 | 21 | 45.7% |
| $100,000 to $149,999 | 2 | 4.3% |
| $150,000 to $199,999 | 0 | 0.0% |
| $200,000+ | 0 | 0.0% |
Family Income by Famaliy Size in Everetts
| Income Bracket | # Families | Median Income |
| 2-Person Families | 25 (54.3%) | $0 |
| 3-Person Families | 0 (0.0%) | $0 |
| 4-Person Families | 4 (8.7%) | $0 |
| 5-Person Families | 2 (4.3%) | $0 |
| 6-Person Families | 0 (0.0%) | $0 |
| 7+ Person Families | 15 (32.6%) | $0 |
| Total | 46 (100.0%) | $76,250 |
Family Income by Number of Earners in Everetts
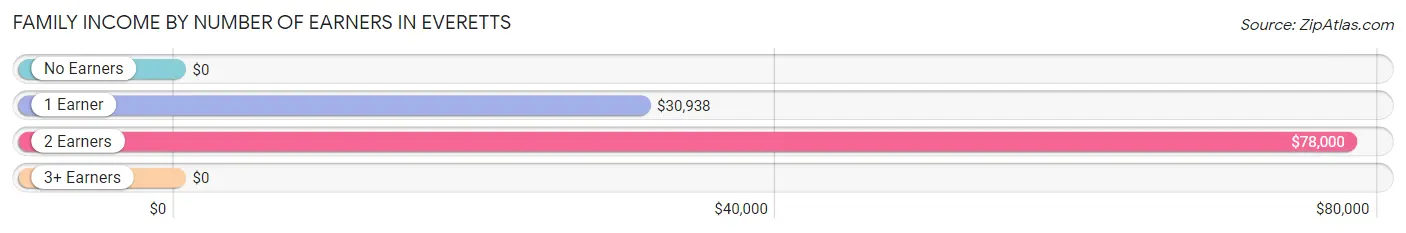
| Number of Earners | # Families | Median Income |
| No Earners | 2 (4.3%) | $0 |
| 1 Earner | 19 (41.3%) | $30,938 |
| 2 Earners | 8 (17.4%) | $78,000 |
| 3+ Earners | 17 (37.0%) | $0 |
| Total | 46 (100.0%) | $76,250 |
Household Income in Everetts
Household Income Brackets in Everetts
With 21 households falling in the category, the $35,000 to $49,999 income range is the most frequent in Everetts, accounting for 33.9% of all households.
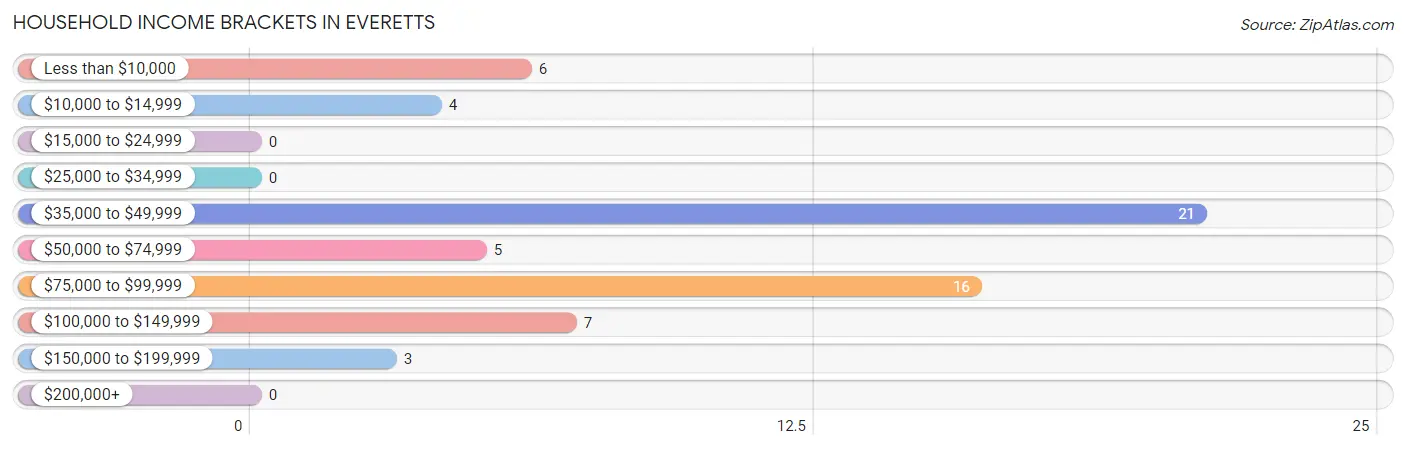
| Income Bracket | # Households | % Households |
| Less than $10,000 | 6 | 9.7% |
| $10,000 to $14,999 | 4 | 6.5% |
| $15,000 to $24,999 | 0 | 0.0% |
| $25,000 to $34,999 | 0 | 0.0% |
| $35,000 to $49,999 | 21 | 33.9% |
| $50,000 to $74,999 | 5 | 8.1% |
| $75,000 to $99,999 | 16 | 25.8% |
| $100,000 to $149,999 | 7 | 11.3% |
| $150,000 to $199,999 | 3 | 4.8% |
| $200,000+ | 0 | 0.0% |
Household Income by Householder Age in Everetts
The median household income in Everetts is $55,000, with the highest median household income of $75,000 found in the 45 to 64 years age bracket for the primary householder. A total of 40 households (64.5%) fall into this category. Meanwhile, the 15 to 24 years age bracket for the primary householder has the lowest median household income of $0, with 4 households (6.5%) in this group.
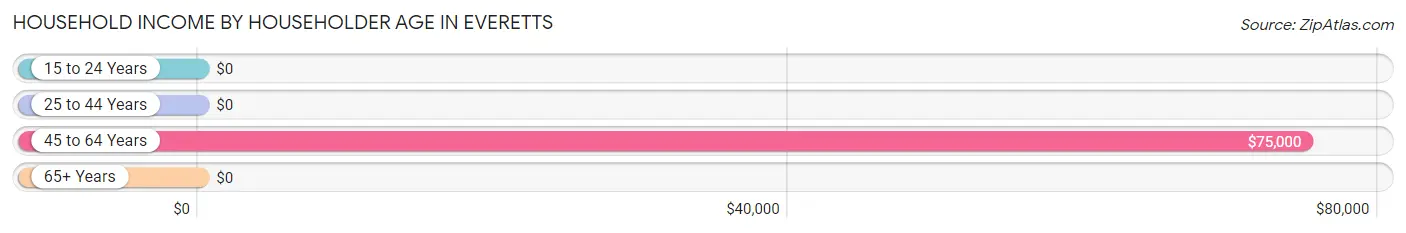
| Income Bracket | # Households | Median Income |
| 15 to 24 Years | 4 (6.5%) | $0 |
| 25 to 44 Years | 7 (11.3%) | $0 |
| 45 to 64 Years | 40 (64.5%) | $75,000 |
| 65+ Years | 11 (17.7%) | $0 |
| Total | 62 (100.0%) | $55,000 |
Poverty in Everetts
Income Below Poverty by Sex and Age in Everetts
With 7.6% poverty level for males and 13.3% for females among the residents of Everetts, 65 to 74 year old males and 6 to 11 year old females are the most vulnerable to poverty, with 6 males (66.7%) and 6 females (100.0%) in their respective age groups living below the poverty level.
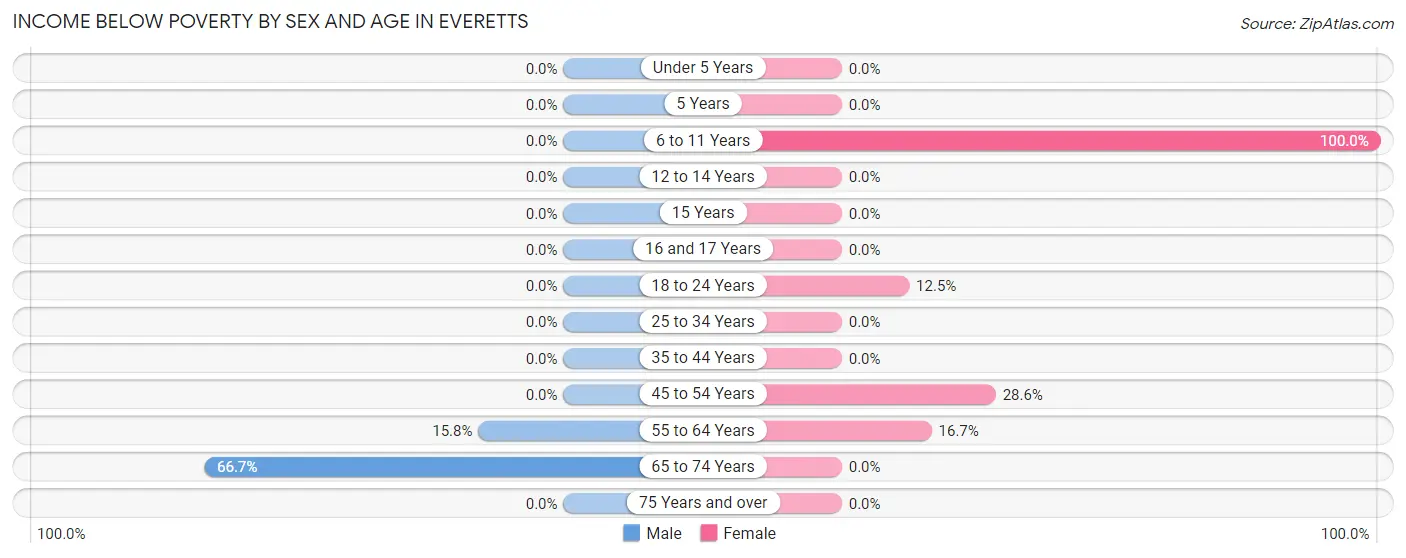
| Age Bracket | Male | Female |
| Under 5 Years | 0 (0.0%) | 0 (0.0%) |
| 5 Years | 0 (0.0%) | 0 (0.0%) |
| 6 to 11 Years | 0 (0.0%) | 6 (100.0%) |
| 12 to 14 Years | 0 (0.0%) | 0 (0.0%) |
| 15 Years | 0 (0.0%) | 0 (0.0%) |
| 16 and 17 Years | 0 (0.0%) | 0 (0.0%) |
| 18 to 24 Years | 0 (0.0%) | 5 (12.5%) |
| 25 to 34 Years | 0 (0.0%) | 0 (0.0%) |
| 35 to 44 Years | 0 (0.0%) | 0 (0.0%) |
| 45 to 54 Years | 0 (0.0%) | 8 (28.6%) |
| 55 to 64 Years | 3 (15.8%) | 1 (16.7%) |
| 65 to 74 Years | 6 (66.7%) | 0 (0.0%) |
| 75 Years and over | 0 (0.0%) | 0 (0.0%) |
| Total | 9 (7.6%) | 20 (13.3%) |
Income Above Poverty by Sex and Age in Everetts
According to the poverty statistics in Everetts, males aged under 5 years and females aged under 5 years are the age groups that are most secure financially, with 100.0% of males and 100.0% of females in these age groups living above the poverty line.
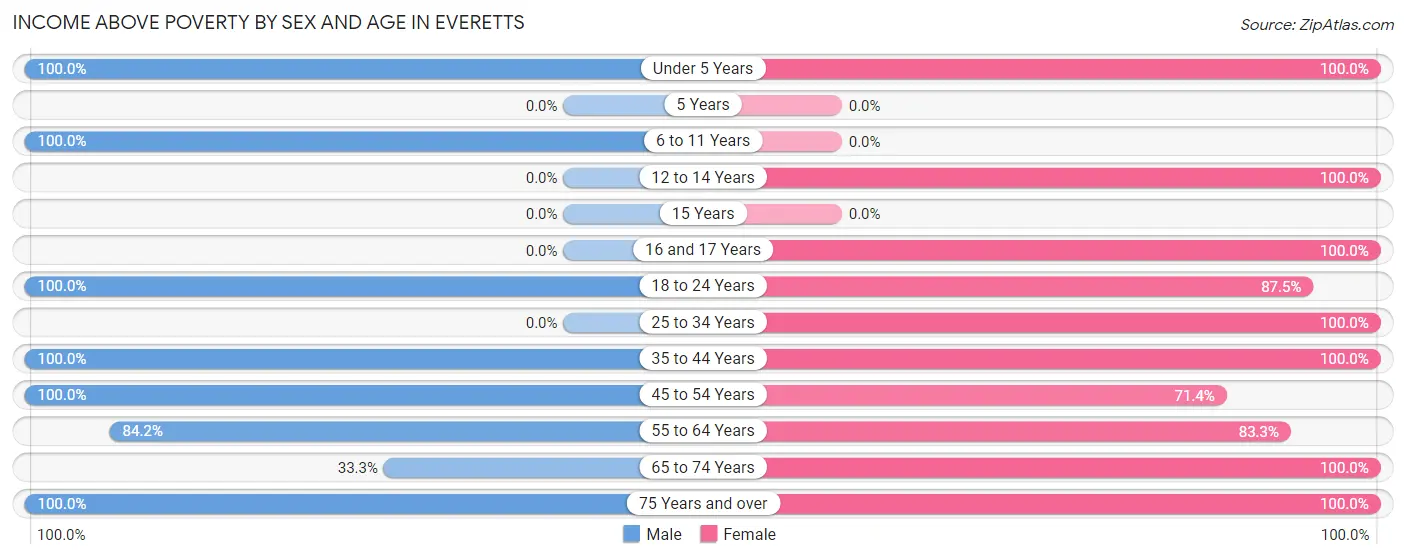
| Age Bracket | Male | Female |
| Under 5 Years | 59 (100.0%) | 6 (100.0%) |
| 5 Years | 0 (0.0%) | 0 (0.0%) |
| 6 to 11 Years | 2 (100.0%) | 0 (0.0%) |
| 12 to 14 Years | 0 (0.0%) | 3 (100.0%) |
| 15 Years | 0 (0.0%) | 0 (0.0%) |
| 16 and 17 Years | 0 (0.0%) | 5 (100.0%) |
| 18 to 24 Years | 17 (100.0%) | 35 (87.5%) |
| 25 to 34 Years | 0 (0.0%) | 42 (100.0%) |
| 35 to 44 Years | 7 (100.0%) | 9 (100.0%) |
| 45 to 54 Years | 4 (100.0%) | 20 (71.4%) |
| 55 to 64 Years | 16 (84.2%) | 5 (83.3%) |
| 65 to 74 Years | 3 (33.3%) | 4 (100.0%) |
| 75 Years and over | 2 (100.0%) | 1 (100.0%) |
| Total | 110 (92.4%) | 130 (86.7%) |
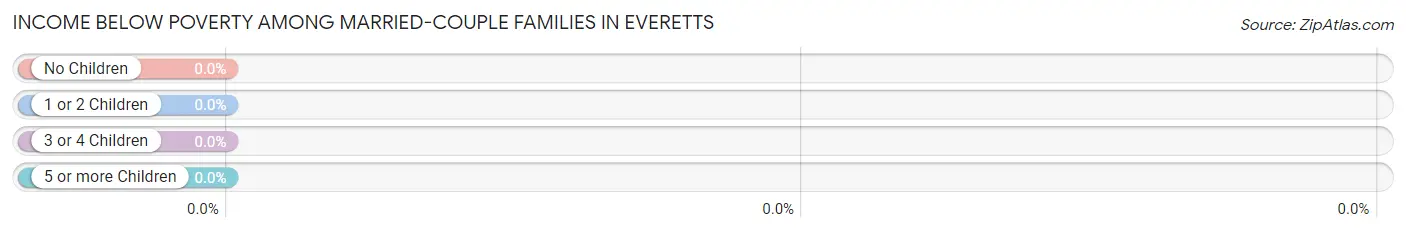
Income Below Poverty Among Married-Couple Families in Everetts
| Children | Above Poverty | Below Poverty |
| No Children | 7 (100.0%) | 0 (0.0%) |
| 1 or 2 Children | 6 (100.0%) | 0 (0.0%) |
| 3 or 4 Children | 15 (100.0%) | 0 (0.0%) |
| 5 or more Children | 0 (0.0%) | 0 (0.0%) |
| Total | 28 (100.0%) | 0 (0.0%) |
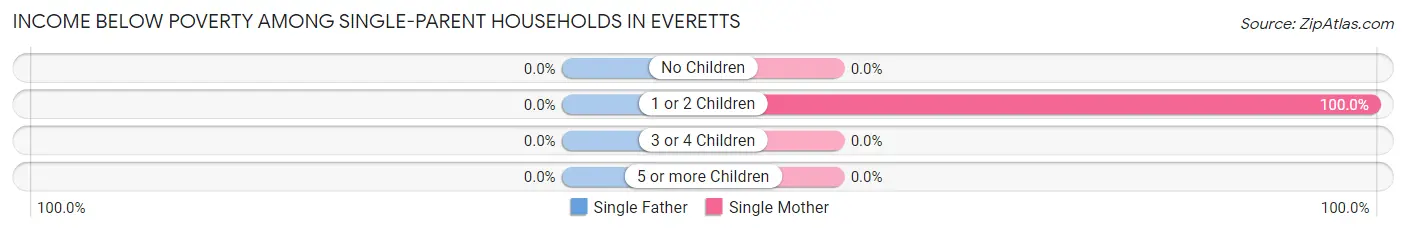
Income Below Poverty Among Single-Parent Households in Everetts
| Children | Single Father | Single Mother |
| No Children | 0 (0.0%) | 0 (0.0%) |
| 1 or 2 Children | 0 (0.0%) | 8 (100.0%) |
| 3 or 4 Children | 0 (0.0%) | 0 (0.0%) |
| 5 or more Children | 0 (0.0%) | 0 (0.0%) |
| Total | 0 (0.0%) | 8 (57.1%) |
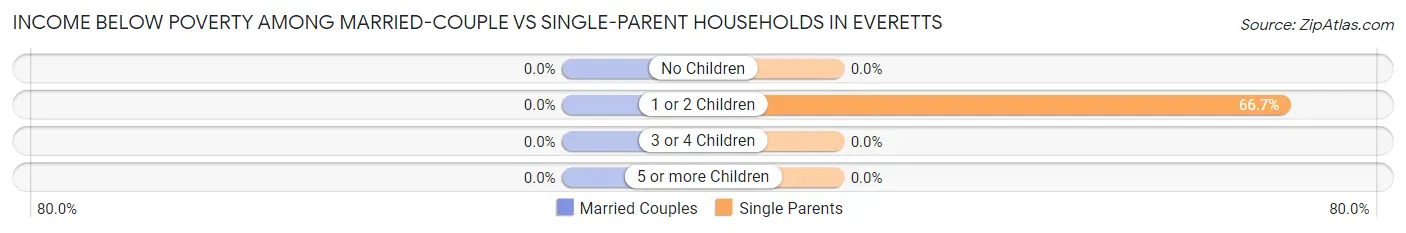
Income Below Poverty Among Married-Couple vs Single-Parent Households in Everetts
| Children | Married-Couple Families | Single-Parent Households |
| No Children | 0 (0.0%) | 0 (0.0%) |
| 1 or 2 Children | 0 (0.0%) | 8 (66.7%) |
| 3 or 4 Children | 0 (0.0%) | 0 (0.0%) |
| 5 or more Children | 0 (0.0%) | 0 (0.0%) |
| Total | 0 (0.0%) | 8 (44.4%) |
Employment Characteristics in Everetts
Employment by Class of Employer in Everetts
Among the 108 employed individuals in Everetts, private company employees (77 | 71.3%), state government employees (21 | 19.4%), and not-for-profit organizations (4 | 3.7%) make up the most common classes of employment.
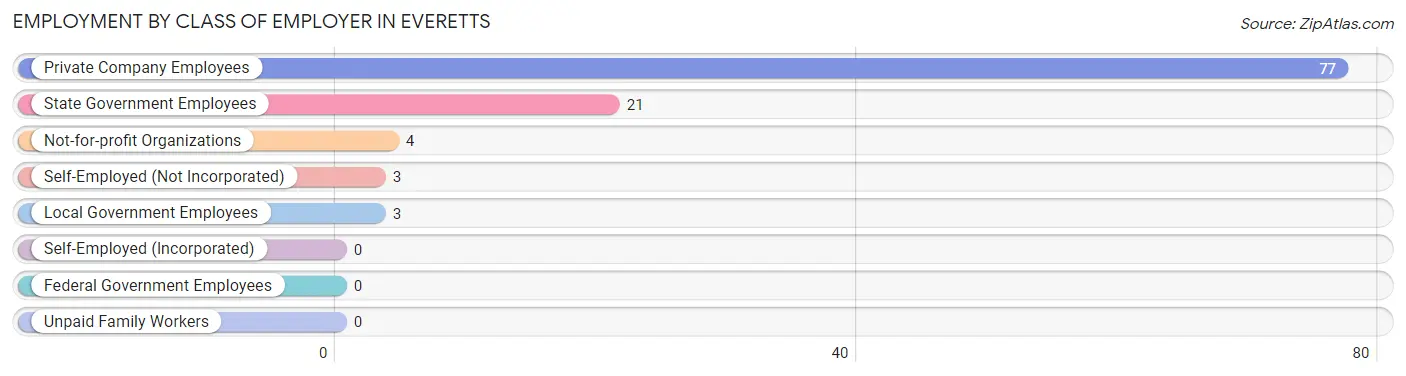
| Employer Class | # Employees | % Employees |
| Private Company Employees | 77 | 71.3% |
| Self-Employed (Incorporated) | 0 | 0.0% |
| Self-Employed (Not Incorporated) | 3 | 2.8% |
| Not-for-profit Organizations | 4 | 3.7% |
| Local Government Employees | 3 | 2.8% |
| State Government Employees | 21 | 19.4% |
| Federal Government Employees | 0 | 0.0% |
| Unpaid Family Workers | 0 | 0.0% |
| Total | 108 | 100.0% |
Employment Status by Age in Everetts
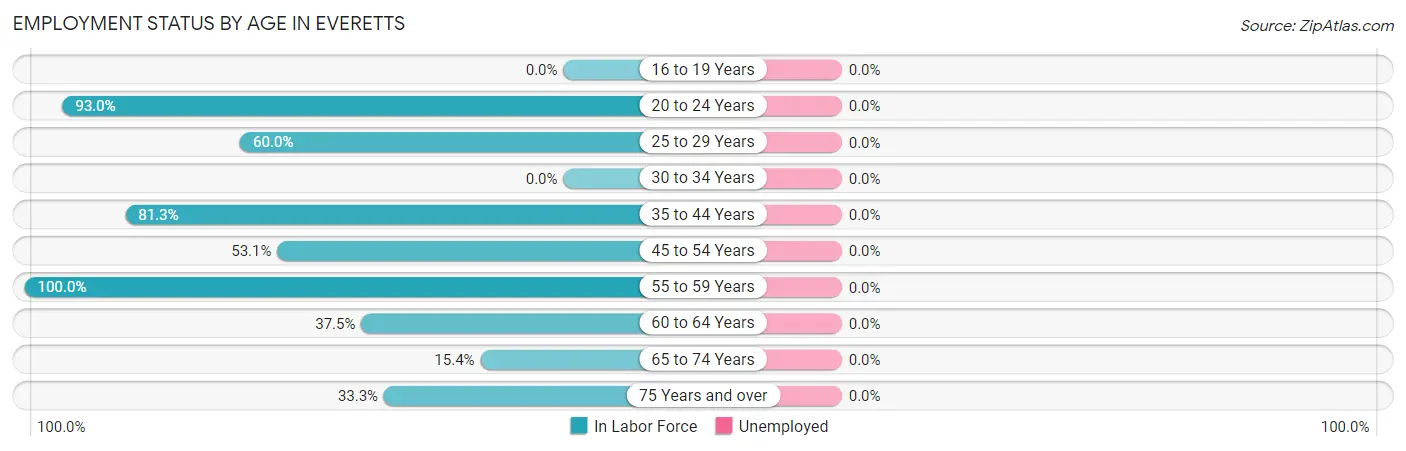
| Age Bracket | In Labor Force | Unemployed |
| 16 to 19 Years | 0 (0.0%) | 0 (0.0%) |
| 20 to 24 Years | 53 (93.0%) | 0 (0.0%) |
| 25 to 29 Years | 24 (60.0%) | 0 (0.0%) |
| 30 to 34 Years | 0 (0.0%) | 0 (0.0%) |
| 35 to 44 Years | 13 (81.3%) | 0 (0.0%) |
| 45 to 54 Years | 17 (53.1%) | 0 (0.0%) |
| 55 to 59 Years | 17 (100.0%) | 0 (0.0%) |
| 60 to 64 Years | 3 (37.5%) | 0 (0.0%) |
| 65 to 74 Years | 2 (15.4%) | 0 (0.0%) |
| 75 Years and over | 1 (33.3%) | 0 (0.0%) |
| Total | 130 (67.4%) | 0 (0.0%) |
Employment Status by Educational Attainment in Everetts
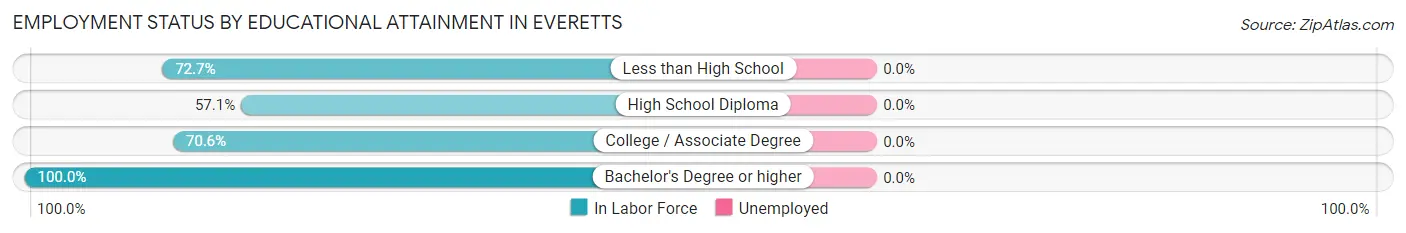
| Educational Attainment | In Labor Force | Unemployed |
| Less than High School | 8 (72.7%) | 0 (0.0%) |
| High School Diploma | 44 (57.1%) | 0 (0.0%) |
| College / Associate Degree | 12 (70.6%) | 0 (0.0%) |
| Bachelor's Degree or higher | 10 (100.0%) | 0 (0.0%) |
| Total | 74 (64.3%) | 0 (0.0%) |
Employment Occupations by Sex in Everetts
Management, Business, Science and Arts Occupations
The most common Management, Business, Science and Arts occupations in Everetts are Management (27 | 20.8%), Health Diagnosing & Treating (9 | 6.9%), Community & Social Service (5 | 3.8%), Education, Arts & Media (5 | 3.8%), and Health Technologists (5 | 3.8%).
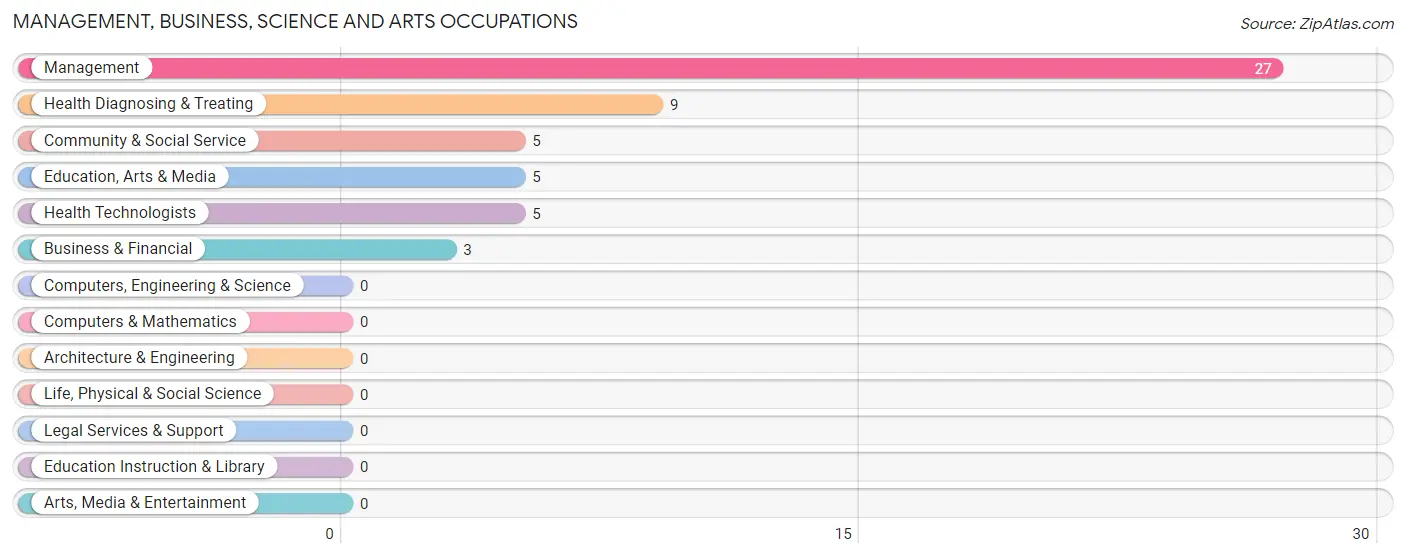
Management, Business, Science and Arts Occupations by Sex
Within the Management, Business, Science and Arts occupations in Everetts, the most male-oriented occupations are Business & Financial (100.0%), and Health Diagnosing & Treating (44.4%), while the most female-oriented occupations are Management (100.0%), Community & Social Service (100.0%), and Education, Arts & Media (100.0%).
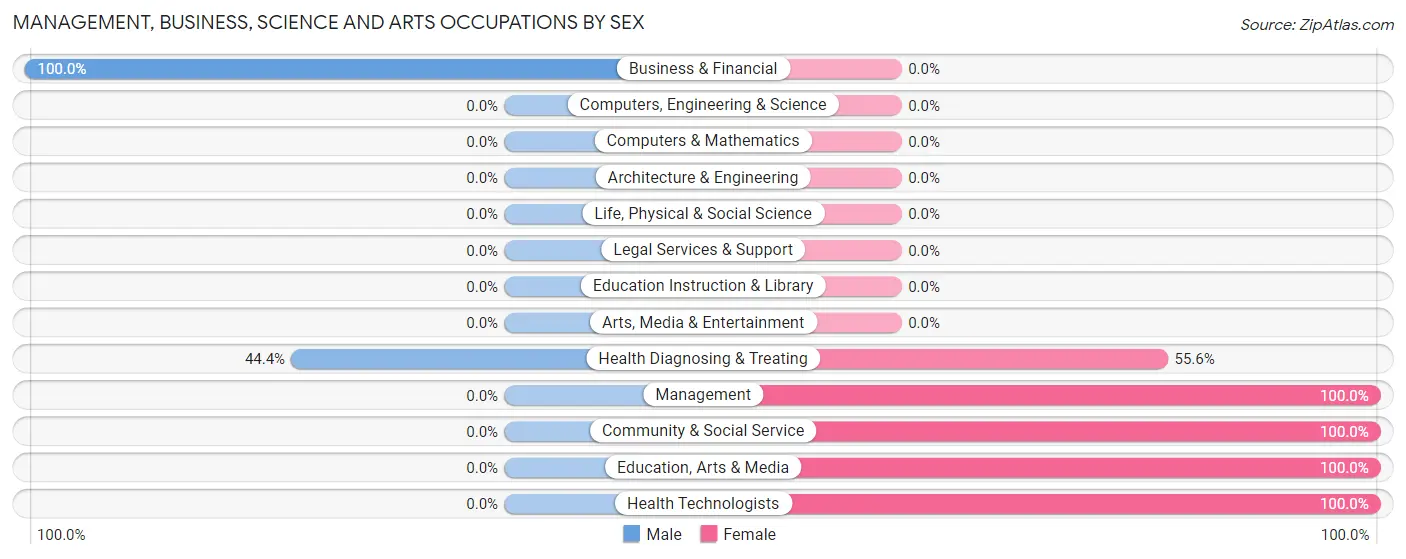
| Occupation | Male | Female |
| Management | 0 (0.0%) | 27 (100.0%) |
| Business & Financial | 3 (100.0%) | 0 (0.0%) |
| Computers, Engineering & Science | 0 (0.0%) | 0 (0.0%) |
| Computers & Mathematics | 0 (0.0%) | 0 (0.0%) |
| Architecture & Engineering | 0 (0.0%) | 0 (0.0%) |
| Life, Physical & Social Science | 0 (0.0%) | 0 (0.0%) |
| Community & Social Service | 0 (0.0%) | 5 (100.0%) |
| Education, Arts & Media | 0 (0.0%) | 5 (100.0%) |
| Legal Services & Support | 0 (0.0%) | 0 (0.0%) |
| Education Instruction & Library | 0 (0.0%) | 0 (0.0%) |
| Arts, Media & Entertainment | 0 (0.0%) | 0 (0.0%) |
| Health Diagnosing & Treating | 4 (44.4%) | 5 (55.6%) |
| Health Technologists | 0 (0.0%) | 5 (100.0%) |
| Total (Category) | 7 (15.9%) | 37 (84.1%) |
| Total (Overall) | 47 (36.1%) | 83 (63.8%) |
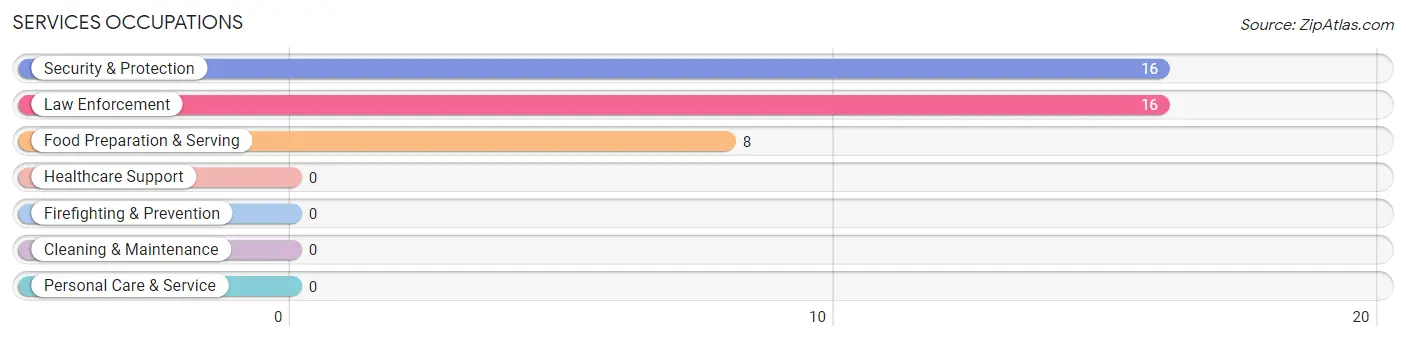
Services Occupations
The most common Services occupations in Everetts are Security & Protection (16 | 12.3%), Law Enforcement (16 | 12.3%), and Food Preparation & Serving (8 | 6.1%).
Services Occupations by Sex
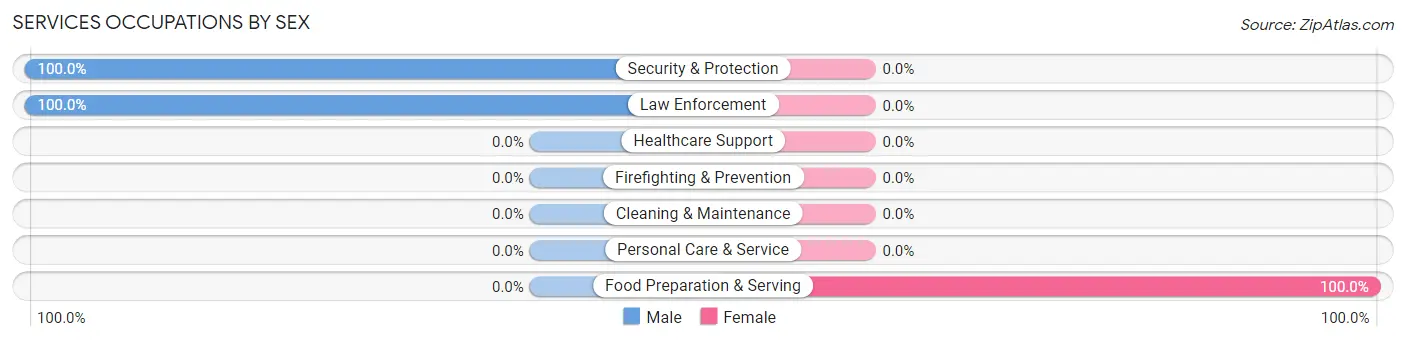
| Occupation | Male | Female |
| Healthcare Support | 0 (0.0%) | 0 (0.0%) |
| Security & Protection | 16 (100.0%) | 0 (0.0%) |
| Firefighting & Prevention | 0 (0.0%) | 0 (0.0%) |
| Law Enforcement | 16 (100.0%) | 0 (0.0%) |
| Food Preparation & Serving | 0 (0.0%) | 8 (100.0%) |
| Cleaning & Maintenance | 0 (0.0%) | 0 (0.0%) |
| Personal Care & Service | 0 (0.0%) | 0 (0.0%) |
| Total (Category) | 16 (66.7%) | 8 (33.3%) |
| Total (Overall) | 47 (36.1%) | 83 (63.8%) |
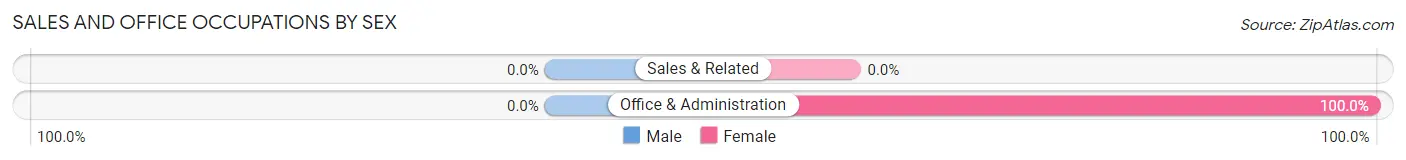
Sales and Office Occupations
The most common Sales and Office occupations in Everetts are , and Office & Administration (19 | 14.6%).
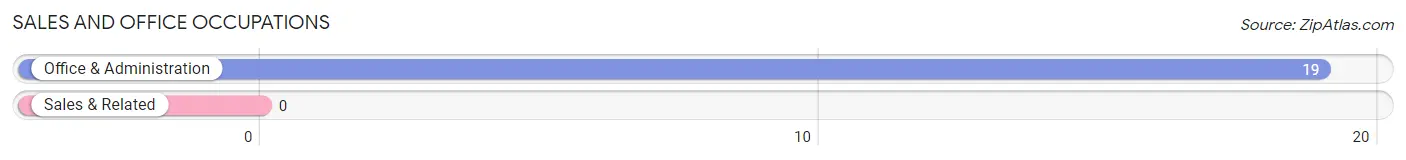
Sales and Office Occupations by Sex
| Occupation | Male | Female |
| Sales & Related | 0 (0.0%) | 0 (0.0%) |
| Office & Administration | 0 (0.0%) | 19 (100.0%) |
| Total (Category) | 0 (0.0%) | 19 (100.0%) |
| Total (Overall) | 47 (36.1%) | 83 (63.8%) |
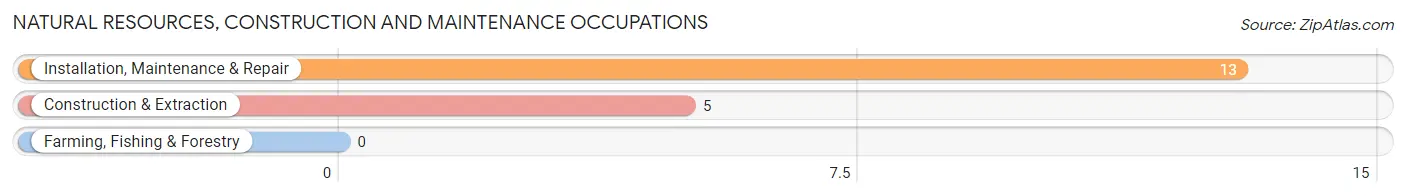
Natural Resources, Construction and Maintenance Occupations
The most common Natural Resources, Construction and Maintenance occupations in Everetts are Installation, Maintenance & Repair (13 | 10.0%), and Construction & Extraction (5 | 3.8%).
Natural Resources, Construction and Maintenance Occupations by Sex
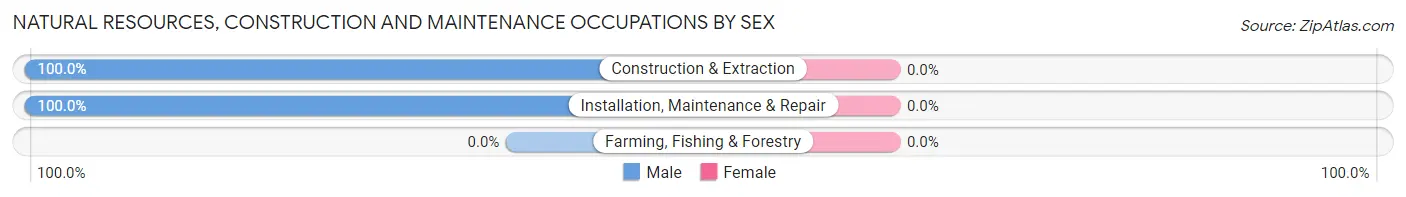
| Occupation | Male | Female |
| Farming, Fishing & Forestry | 0 (0.0%) | 0 (0.0%) |
| Construction & Extraction | 5 (100.0%) | 0 (0.0%) |
| Installation, Maintenance & Repair | 13 (100.0%) | 0 (0.0%) |
| Total (Category) | 18 (100.0%) | 0 (0.0%) |
| Total (Overall) | 47 (36.1%) | 83 (63.8%) |
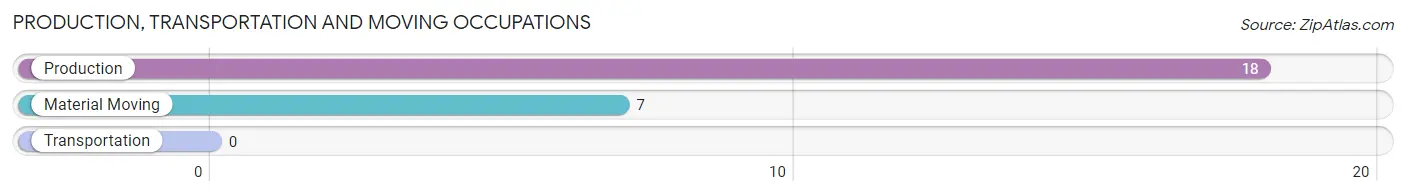
Production, Transportation and Moving Occupations
The most common Production, Transportation and Moving occupations in Everetts are Production (18 | 13.9%), and Material Moving (7 | 5.4%).
Production, Transportation and Moving Occupations by Sex
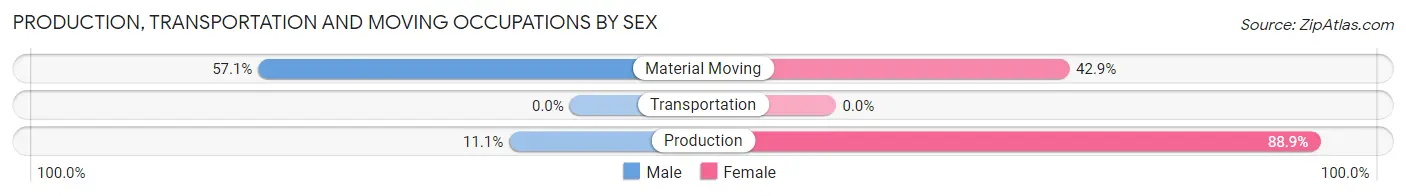
| Occupation | Male | Female |
| Production | 2 (11.1%) | 16 (88.9%) |
| Transportation | 0 (0.0%) | 0 (0.0%) |
| Material Moving | 4 (57.1%) | 3 (42.9%) |
| Total (Category) | 6 (24.0%) | 19 (76.0%) |
| Total (Overall) | 47 (36.1%) | 83 (63.8%) |
Employment Industries by Sex in Everetts
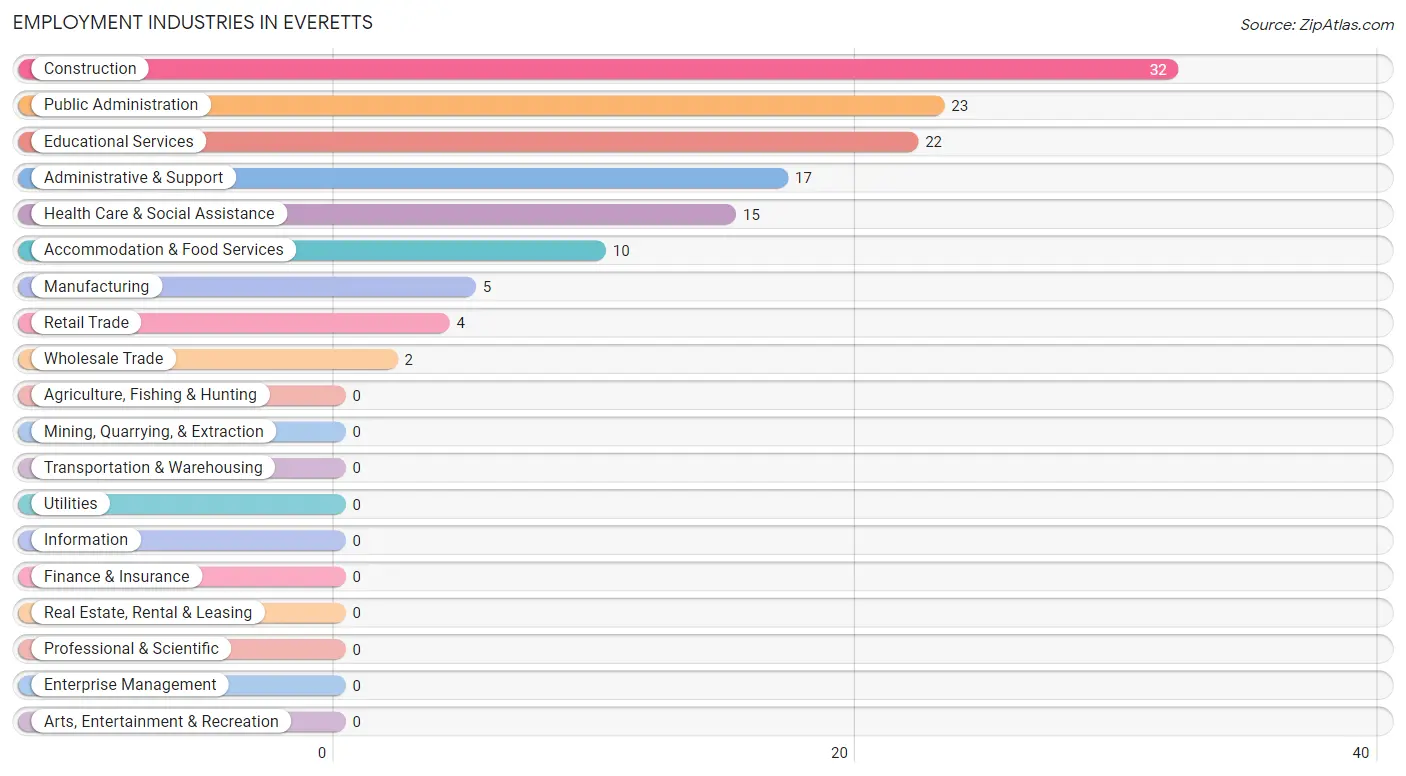
Employment Industries in Everetts
The major employment industries in Everetts include Construction (32 | 24.6%), Public Administration (23 | 17.7%), Educational Services (22 | 16.9%), Administrative & Support (17 | 13.1%), and Health Care & Social Assistance (15 | 11.5%).
Employment Industries by Sex in Everetts
The Everetts industries that see more men than women are Wholesale Trade (100.0%), Retail Trade (100.0%), and Public Administration (91.3%), whereas the industries that tend to have a higher number of women are Administrative & Support (100.0%), Educational Services (100.0%), and Health Care & Social Assistance (100.0%).
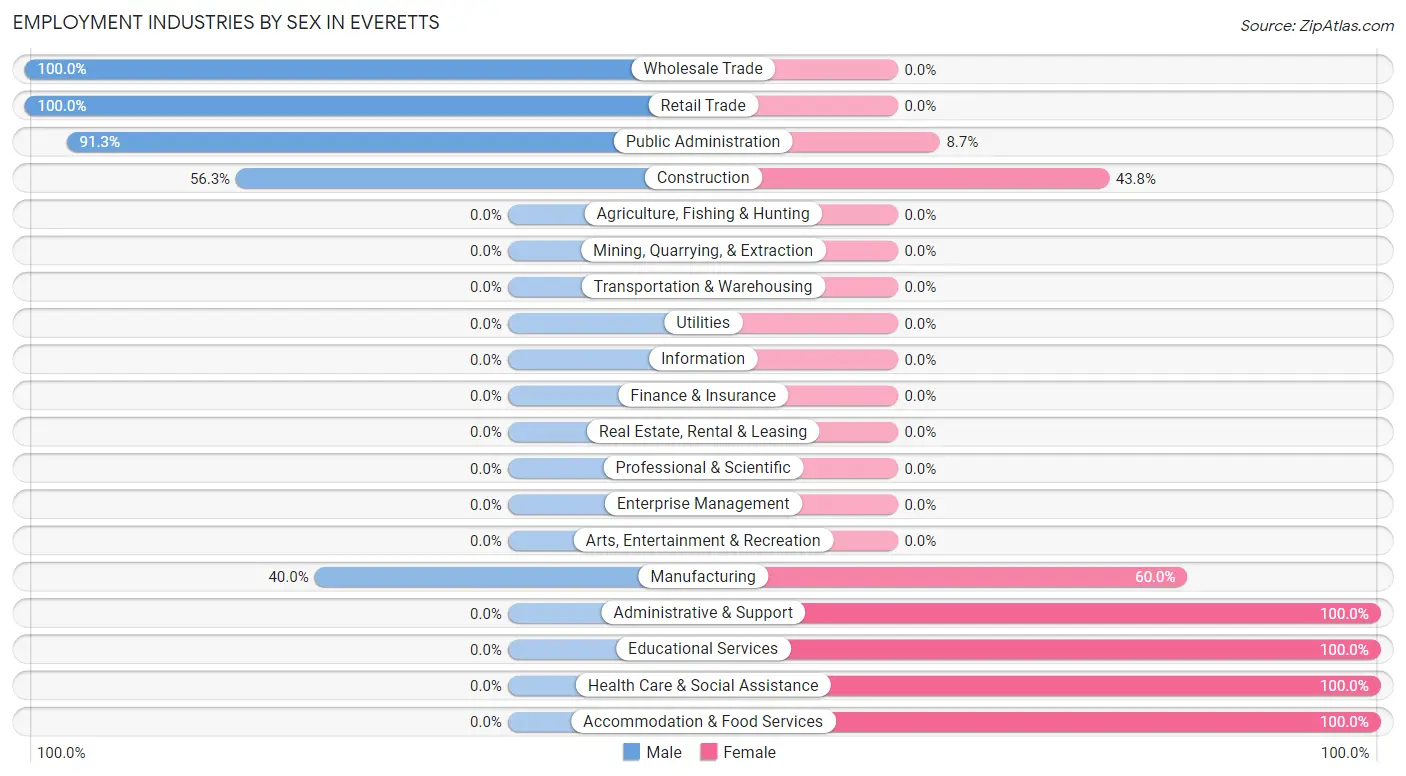
| Industry | Male | Female |
| Agriculture, Fishing & Hunting | 0 (0.0%) | 0 (0.0%) |
| Mining, Quarrying, & Extraction | 0 (0.0%) | 0 (0.0%) |
| Construction | 18 (56.2%) | 14 (43.8%) |
| Manufacturing | 2 (40.0%) | 3 (60.0%) |
| Wholesale Trade | 2 (100.0%) | 0 (0.0%) |
| Retail Trade | 4 (100.0%) | 0 (0.0%) |
| Transportation & Warehousing | 0 (0.0%) | 0 (0.0%) |
| Utilities | 0 (0.0%) | 0 (0.0%) |
| Information | 0 (0.0%) | 0 (0.0%) |
| Finance & Insurance | 0 (0.0%) | 0 (0.0%) |
| Real Estate, Rental & Leasing | 0 (0.0%) | 0 (0.0%) |
| Professional & Scientific | 0 (0.0%) | 0 (0.0%) |
| Enterprise Management | 0 (0.0%) | 0 (0.0%) |
| Administrative & Support | 0 (0.0%) | 17 (100.0%) |
| Educational Services | 0 (0.0%) | 22 (100.0%) |
| Health Care & Social Assistance | 0 (0.0%) | 15 (100.0%) |
| Arts, Entertainment & Recreation | 0 (0.0%) | 0 (0.0%) |
| Accommodation & Food Services | 0 (0.0%) | 10 (100.0%) |
| Public Administration | 21 (91.3%) | 2 (8.7%) |
| Total | 47 (36.1%) | 83 (63.8%) |
Education in Everetts
School Enrollment in Everetts
The most common levels of schooling among the 65 students in Everetts are college / undergraduate (33 | 50.8%), nursery / preschool (16 | 24.6%), and elementary school (8 | 12.3%).
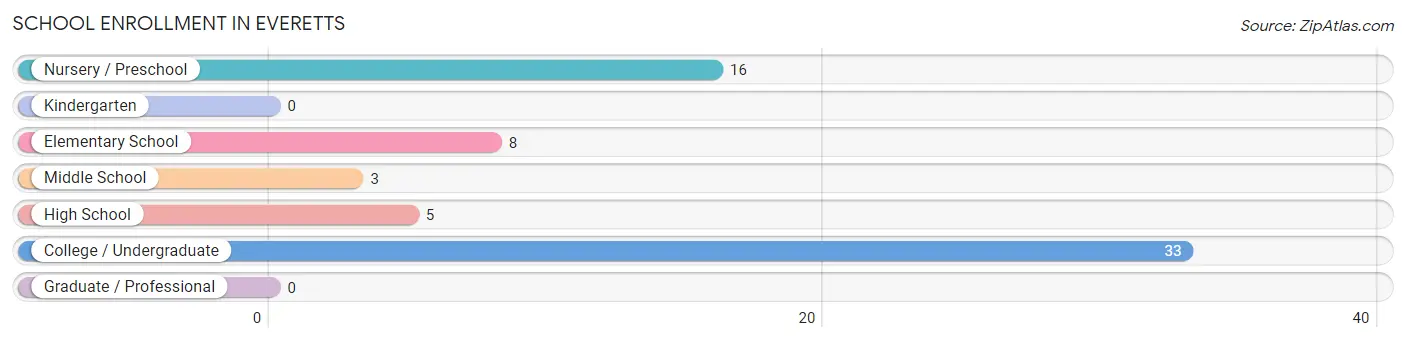
| School Level | # Students | % Students |
| Nursery / Preschool | 16 | 24.6% |
| Kindergarten | 0 | 0.0% |
| Elementary School | 8 | 12.3% |
| Middle School | 3 | 4.6% |
| High School | 5 | 7.7% |
| College / Undergraduate | 33 | 50.8% |
| Graduate / Professional | 0 | 0.0% |
| Total | 65 | 100.0% |
School Enrollment by Age by Funding Source in Everetts
Out of a total of 65 students who are enrolled in schools in Everetts, 30 (46.2%) attend a private institution, while the remaining 35 (53.8%) are enrolled in public schools. The age group of 15 to 17 year olds has the highest likelihood of being enrolled in private schools, with 5 (100.0% in the age bracket) enrolled. Conversely, the age group of 3 to 4 year olds has the lowest likelihood of being enrolled in a private school, with 16 (100.0% in the age bracket) attending a public institution.
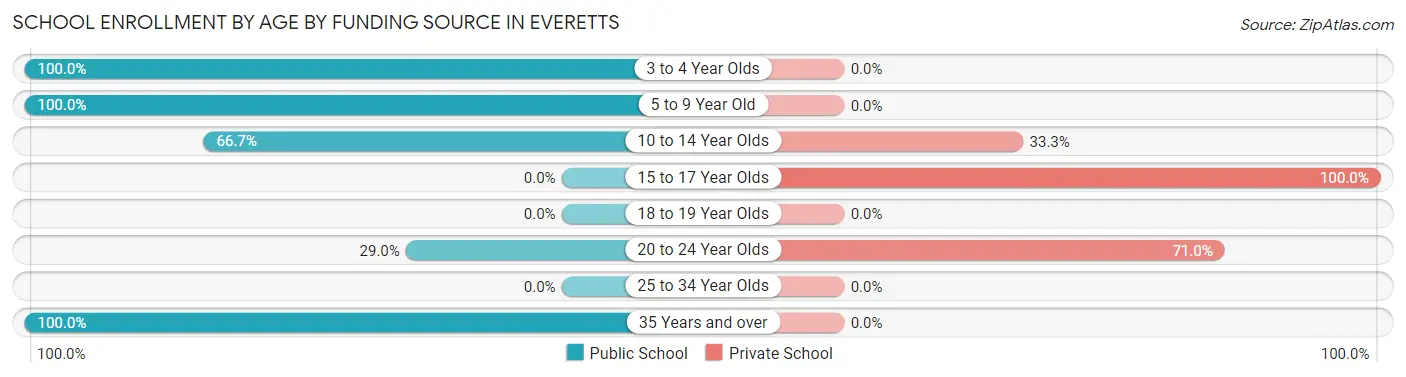
| Age Bracket | Public School | Private School |
| 3 to 4 Year Olds | 16 (100.0%) | 0 (0.0%) |
| 5 to 9 Year Old | 2 (100.0%) | 0 (0.0%) |
| 10 to 14 Year Olds | 6 (66.7%) | 3 (33.3%) |
| 15 to 17 Year Olds | 0 (0.0%) | 5 (100.0%) |
| 18 to 19 Year Olds | 0 (0.0%) | 0 (0.0%) |
| 20 to 24 Year Olds | 9 (29.0%) | 22 (71.0%) |
| 25 to 34 Year Olds | 0 (0.0%) | 0 (0.0%) |
| 35 Years and over | 2 (100.0%) | 0 (0.0%) |
| Total | 35 (53.8%) | 30 (46.2%) |
Educational Attainment by Field of Study in Everetts
Social sciences (6 | 35.3%), science & technology (5 | 29.4%), education (3 | 17.6%), and visual & performing arts (3 | 17.6%) are the most common fields of study among 17 individuals in Everetts who have obtained a bachelor's degree or higher.
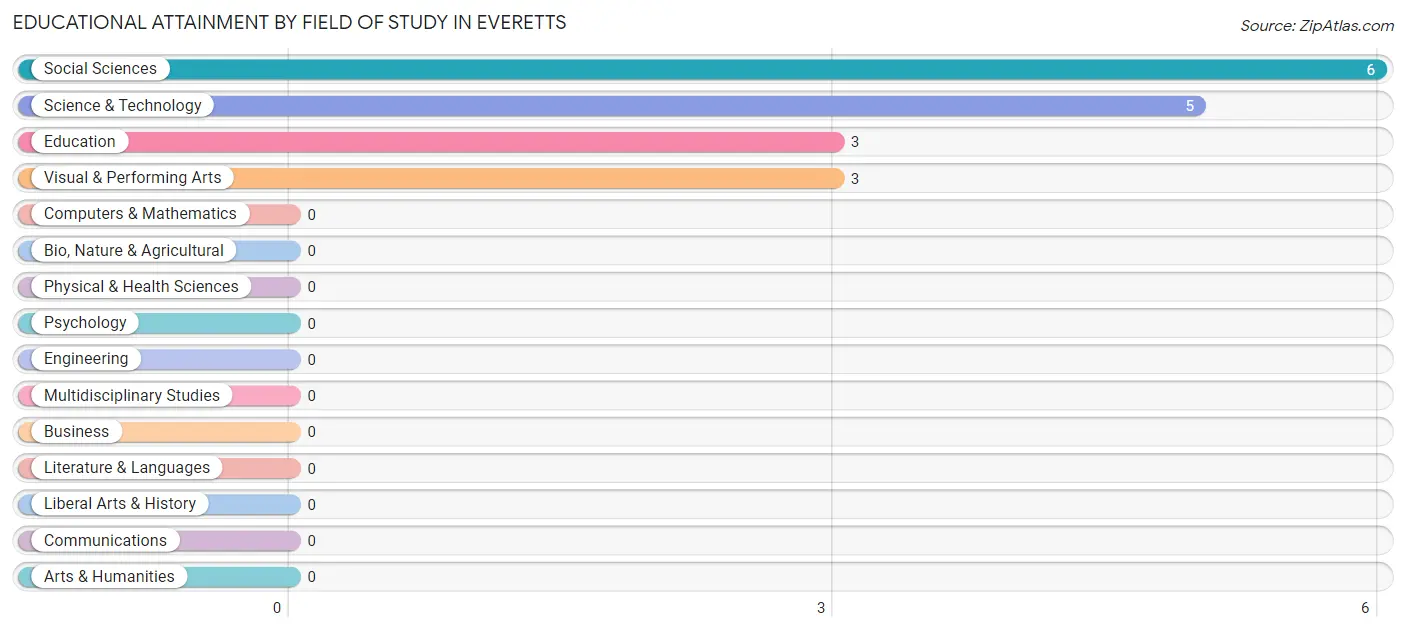
| Field of Study | # Graduates | % Graduates |
| Computers & Mathematics | 0 | 0.0% |
| Bio, Nature & Agricultural | 0 | 0.0% |
| Physical & Health Sciences | 0 | 0.0% |
| Psychology | 0 | 0.0% |
| Social Sciences | 6 | 35.3% |
| Engineering | 0 | 0.0% |
| Multidisciplinary Studies | 0 | 0.0% |
| Science & Technology | 5 | 29.4% |
| Business | 0 | 0.0% |
| Education | 3 | 17.6% |
| Literature & Languages | 0 | 0.0% |
| Liberal Arts & History | 0 | 0.0% |
| Visual & Performing Arts | 3 | 17.6% |
| Communications | 0 | 0.0% |
| Arts & Humanities | 0 | 0.0% |
| Total | 17 | 100.0% |
Transportation & Commute in Everetts
Vehicle Availability by Sex in Everetts
The most prevalent vehicle ownership categories in Everetts are males with 4 vehicles (16, accounting for 34.0%) and females with 4 vehicles (18, making up 26.2%).
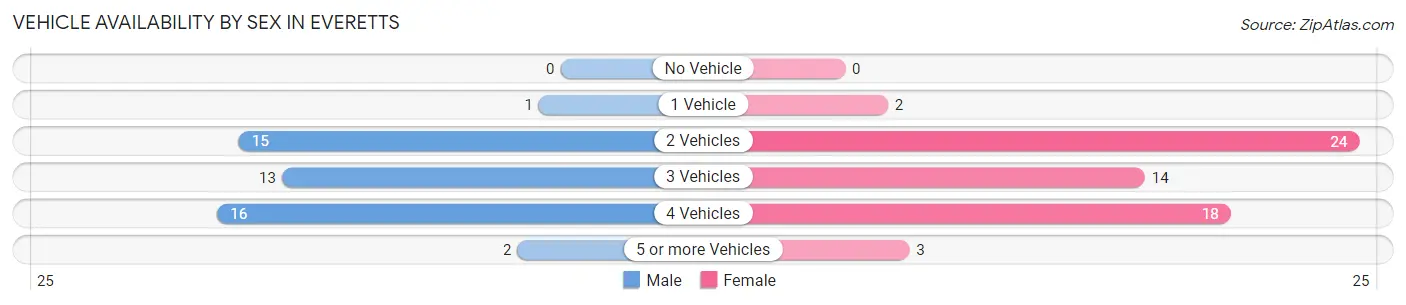
| Vehicles Available | Male | Female |
| No Vehicle | 0 (0.0%) | 0 (0.0%) |
| 1 Vehicle | 1 (2.1%) | 2 (3.3%) |
| 2 Vehicles | 15 (31.9%) | 24 (39.3%) |
| 3 Vehicles | 13 (27.7%) | 14 (23.0%) |
| 4 Vehicles | 16 (34.0%) | 18 (29.5%) |
| 5 or more Vehicles | 2 (4.3%) | 3 (4.9%) |
| Total | 47 (100.0%) | 61 (100.0%) |
Commute Time in Everetts
The most frequently occuring commute durations in Everetts are 30 to 34 minutes (46 commuters, 42.6%), 5 to 9 minutes (16 commuters, 14.8%), and 20 to 24 minutes (16 commuters, 14.8%).
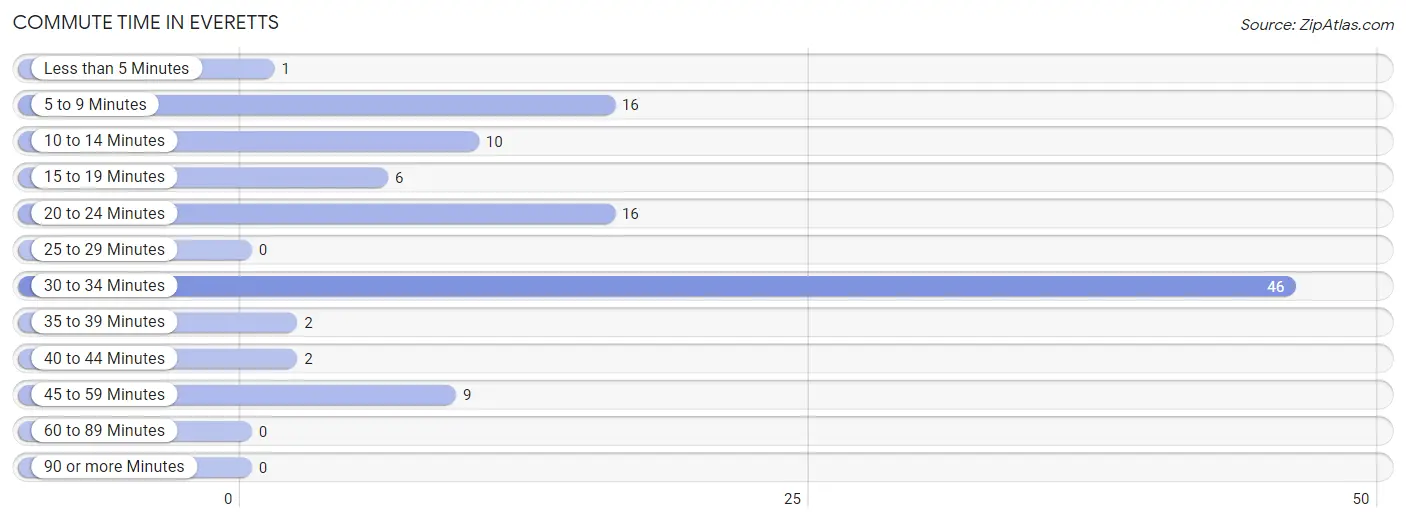
| Commute Time | # Commuters | % Commuters |
| Less than 5 Minutes | 1 | 0.9% |
| 5 to 9 Minutes | 16 | 14.8% |
| 10 to 14 Minutes | 10 | 9.3% |
| 15 to 19 Minutes | 6 | 5.6% |
| 20 to 24 Minutes | 16 | 14.8% |
| 25 to 29 Minutes | 0 | 0.0% |
| 30 to 34 Minutes | 46 | 42.6% |
| 35 to 39 Minutes | 2 | 1.8% |
| 40 to 44 Minutes | 2 | 1.8% |
| 45 to 59 Minutes | 9 | 8.3% |
| 60 to 89 Minutes | 0 | 0.0% |
| 90 or more Minutes | 0 | 0.0% |
Commute Time by Sex in Everetts
The most common commute times in Everetts are 30 to 34 minutes (34 commuters, 72.3%) for males and 20 to 24 minutes (16 commuters, 26.2%) for females.
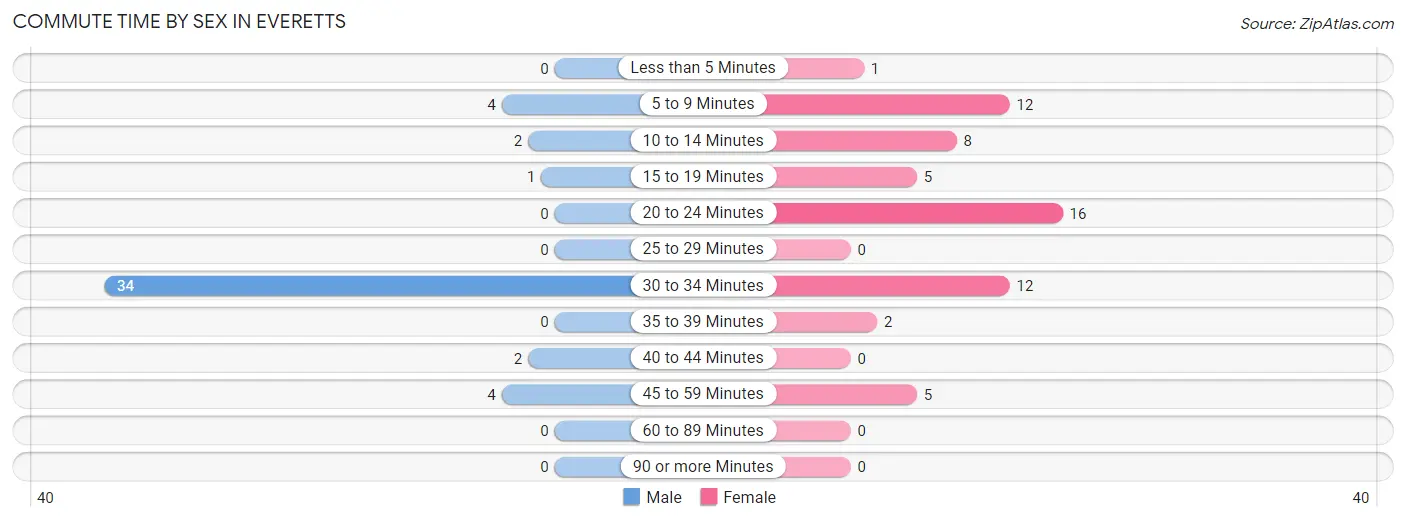
| Commute Time | Male | Female |
| Less than 5 Minutes | 0 (0.0%) | 1 (1.6%) |
| 5 to 9 Minutes | 4 (8.5%) | 12 (19.7%) |
| 10 to 14 Minutes | 2 (4.3%) | 8 (13.1%) |
| 15 to 19 Minutes | 1 (2.1%) | 5 (8.2%) |
| 20 to 24 Minutes | 0 (0.0%) | 16 (26.2%) |
| 25 to 29 Minutes | 0 (0.0%) | 0 (0.0%) |
| 30 to 34 Minutes | 34 (72.3%) | 12 (19.7%) |
| 35 to 39 Minutes | 0 (0.0%) | 2 (3.3%) |
| 40 to 44 Minutes | 2 (4.3%) | 0 (0.0%) |
| 45 to 59 Minutes | 4 (8.5%) | 5 (8.2%) |
| 60 to 89 Minutes | 0 (0.0%) | 0 (0.0%) |
| 90 or more Minutes | 0 (0.0%) | 0 (0.0%) |
Time of Departure to Work by Sex in Everetts
The most frequent times of departure to work in Everetts are 4:00 PM to 11:59 PM (14, 29.8%) for males and 8:00 AM to 8:29 AM (19, 31.1%) for females.
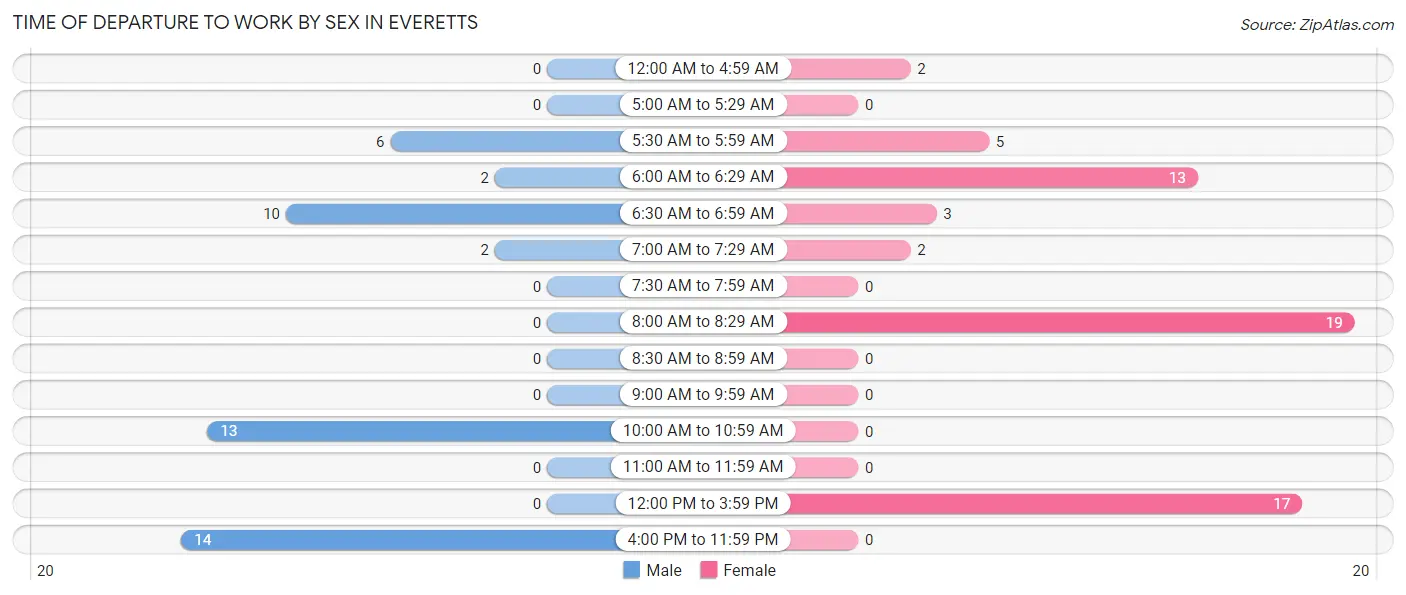
| Time of Departure | Male | Female |
| 12:00 AM to 4:59 AM | 0 (0.0%) | 2 (3.3%) |
| 5:00 AM to 5:29 AM | 0 (0.0%) | 0 (0.0%) |
| 5:30 AM to 5:59 AM | 6 (12.8%) | 5 (8.2%) |
| 6:00 AM to 6:29 AM | 2 (4.3%) | 13 (21.3%) |
| 6:30 AM to 6:59 AM | 10 (21.3%) | 3 (4.9%) |
| 7:00 AM to 7:29 AM | 2 (4.3%) | 2 (3.3%) |
| 7:30 AM to 7:59 AM | 0 (0.0%) | 0 (0.0%) |
| 8:00 AM to 8:29 AM | 0 (0.0%) | 19 (31.1%) |
| 8:30 AM to 8:59 AM | 0 (0.0%) | 0 (0.0%) |
| 9:00 AM to 9:59 AM | 0 (0.0%) | 0 (0.0%) |
| 10:00 AM to 10:59 AM | 13 (27.7%) | 0 (0.0%) |
| 11:00 AM to 11:59 AM | 0 (0.0%) | 0 (0.0%) |
| 12:00 PM to 3:59 PM | 0 (0.0%) | 17 (27.9%) |
| 4:00 PM to 11:59 PM | 14 (29.8%) | 0 (0.0%) |
| Total | 47 (100.0%) | 61 (100.0%) |
Housing Occupancy in Everetts
Occupancy by Ownership in Everetts
Of the total 62 dwellings in Everetts, owner-occupied units account for 33 (53.2%), while renter-occupied units make up 29 (46.8%).
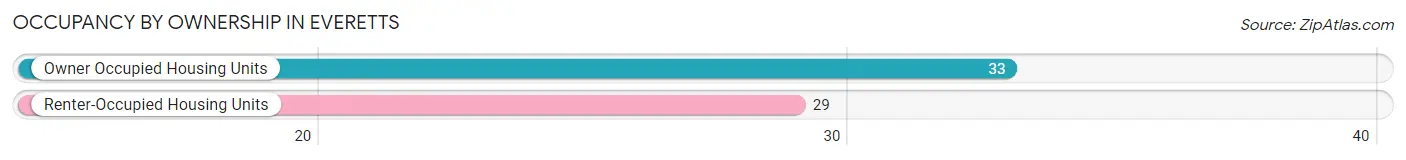
| Occupancy | # Housing Units | % Housing Units |
| Owner Occupied Housing Units | 33 | 53.2% |
| Renter-Occupied Housing Units | 29 | 46.8% |
| Total Occupied Housing Units | 62 | 100.0% |
Occupancy by Household Size in Everetts
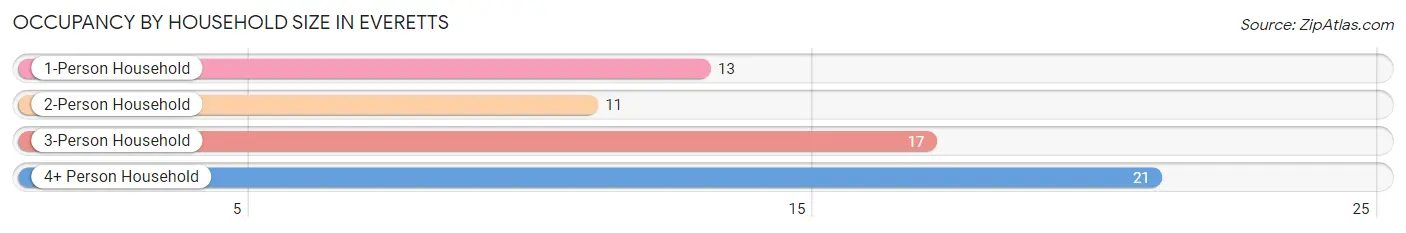
| Household Size | # Housing Units | % Housing Units |
| 1-Person Household | 13 | 21.0% |
| 2-Person Household | 11 | 17.7% |
| 3-Person Household | 17 | 27.4% |
| 4+ Person Household | 21 | 33.9% |
| Total Housing Units | 62 | 100.0% |
Occupancy by Ownership by Household Size in Everetts
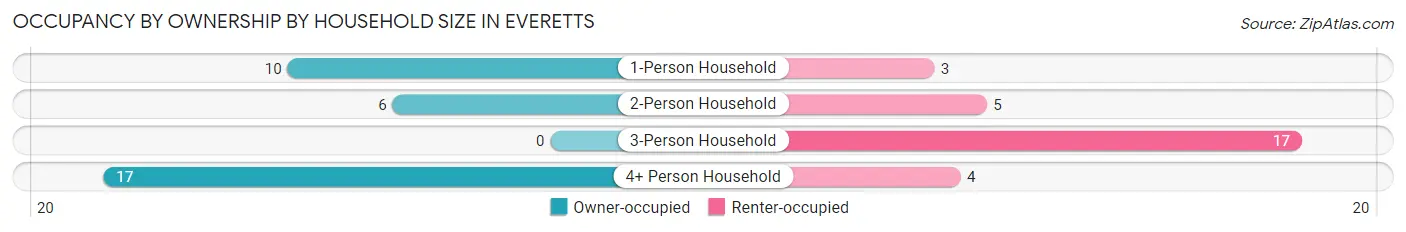
| Household Size | Owner-occupied | Renter-occupied |
| 1-Person Household | 10 (76.9%) | 3 (23.1%) |
| 2-Person Household | 6 (54.5%) | 5 (45.5%) |
| 3-Person Household | 0 (0.0%) | 17 (100.0%) |
| 4+ Person Household | 17 (80.9%) | 4 (19.1%) |
| Total Housing Units | 33 (53.2%) | 29 (46.8%) |
Occupancy by Educational Attainment in Everetts
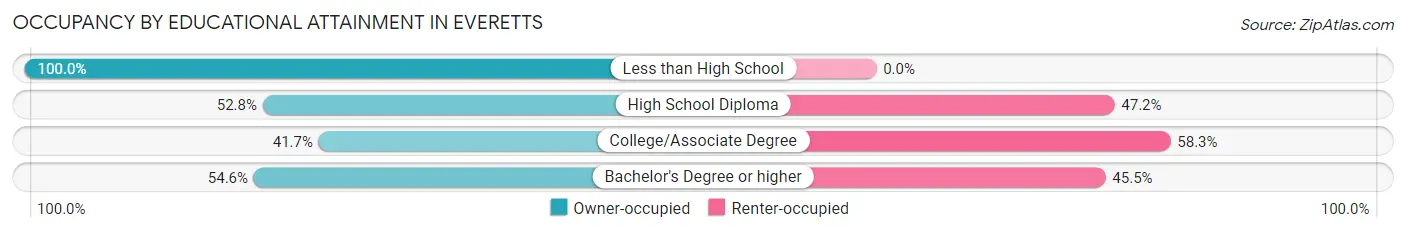
| Household Size | Owner-occupied | Renter-occupied |
| Less than High School | 3 (100.0%) | 0 (0.0%) |
| High School Diploma | 19 (52.8%) | 17 (47.2%) |
| College/Associate Degree | 5 (41.7%) | 7 (58.3%) |
| Bachelor's Degree or higher | 6 (54.5%) | 5 (45.5%) |
Occupancy by Age of Householder in Everetts
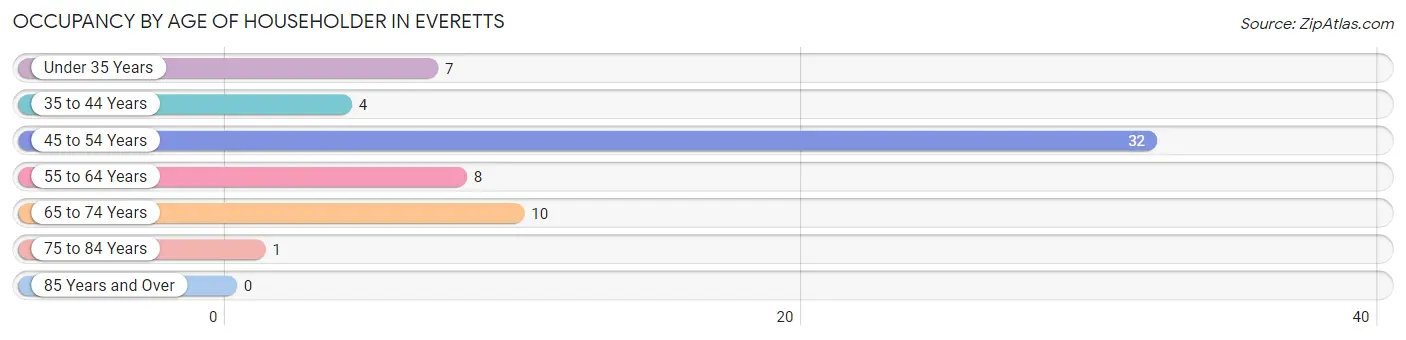
| Age Bracket | # Households | % Households |
| Under 35 Years | 7 | 11.3% |
| 35 to 44 Years | 4 | 6.5% |
| 45 to 54 Years | 32 | 51.6% |
| 55 to 64 Years | 8 | 12.9% |
| 65 to 74 Years | 10 | 16.1% |
| 75 to 84 Years | 1 | 1.6% |
| 85 Years and Over | 0 | 0.0% |
| Total | 62 | 100.0% |
Housing Finances in Everetts
Median Income by Occupancy in Everetts
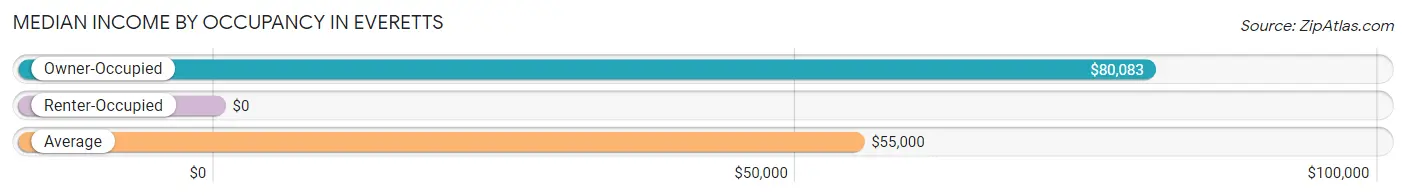
| Occupancy Type | # Households | Median Income |
| Owner-Occupied | 33 (53.2%) | $80,083 |
| Renter-Occupied | 29 (46.8%) | $0 |
| Average | 62 (100.0%) | $55,000 |
Occupancy by Householder Income Bracket in Everetts
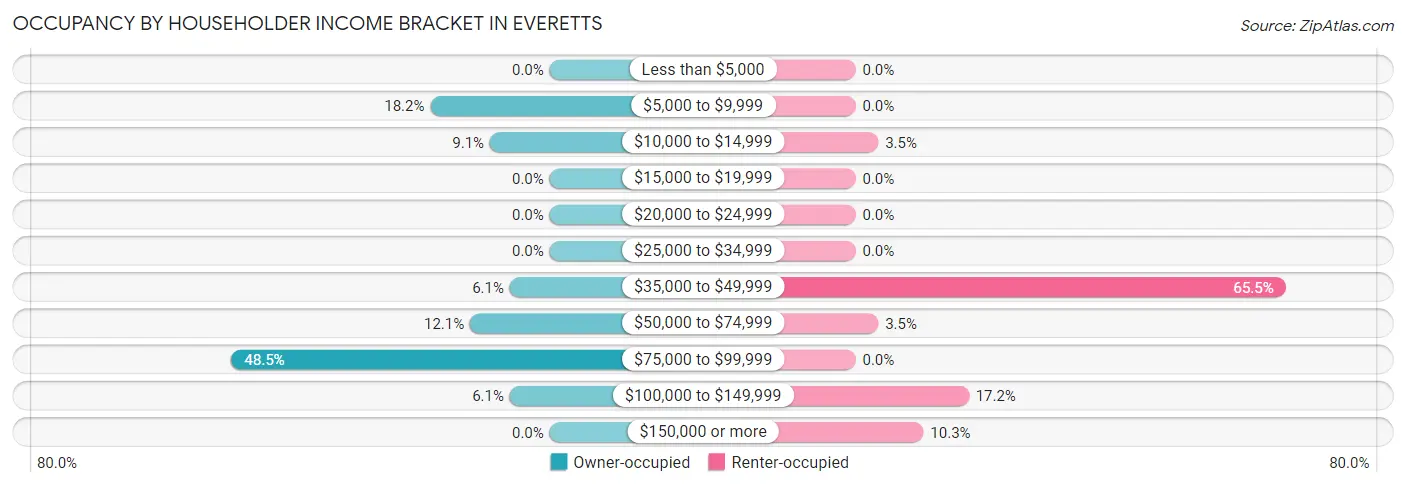
| Income Bracket | Owner-occupied | Renter-occupied |
| Less than $5,000 | 0 (0.0%) | 0 (0.0%) |
| $5,000 to $9,999 | 6 (18.2%) | 0 (0.0%) |
| $10,000 to $14,999 | 3 (9.1%) | 1 (3.5%) |
| $15,000 to $19,999 | 0 (0.0%) | 0 (0.0%) |
| $20,000 to $24,999 | 0 (0.0%) | 0 (0.0%) |
| $25,000 to $34,999 | 0 (0.0%) | 0 (0.0%) |
| $35,000 to $49,999 | 2 (6.1%) | 19 (65.5%) |
| $50,000 to $74,999 | 4 (12.1%) | 1 (3.5%) |
| $75,000 to $99,999 | 16 (48.5%) | 0 (0.0%) |
| $100,000 to $149,999 | 2 (6.1%) | 5 (17.2%) |
| $150,000 or more | 0 (0.0%) | 3 (10.3%) |
| Total | 33 (100.0%) | 29 (100.0%) |
Monthly Housing Cost Tiers in Everetts
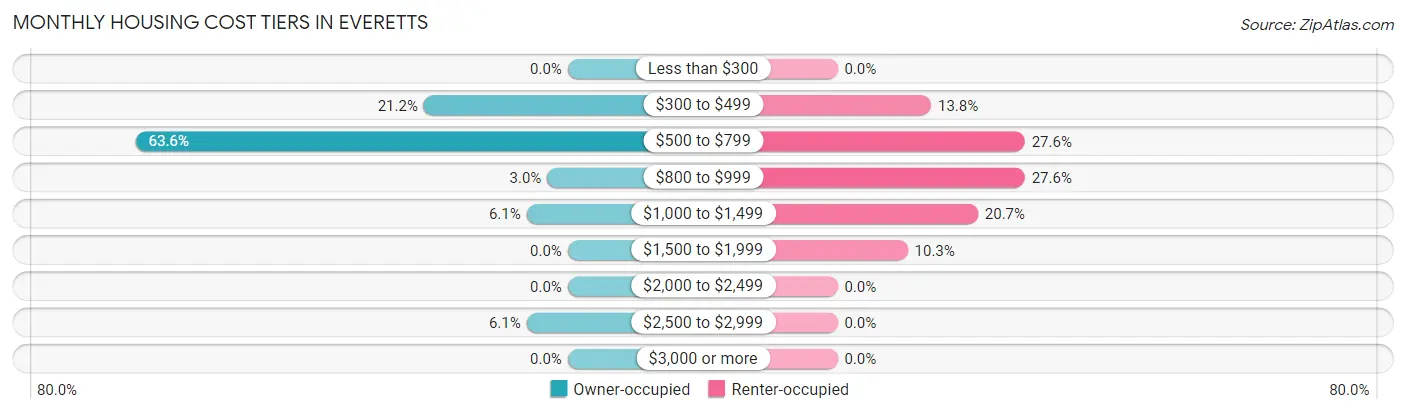
| Monthly Cost | Owner-occupied | Renter-occupied |
| Less than $300 | 0 (0.0%) | 0 (0.0%) |
| $300 to $499 | 7 (21.2%) | 4 (13.8%) |
| $500 to $799 | 21 (63.6%) | 8 (27.6%) |
| $800 to $999 | 1 (3.0%) | 8 (27.6%) |
| $1,000 to $1,499 | 2 (6.1%) | 6 (20.7%) |
| $1,500 to $1,999 | 0 (0.0%) | 3 (10.3%) |
| $2,000 to $2,499 | 0 (0.0%) | 0 (0.0%) |
| $2,500 to $2,999 | 2 (6.1%) | 0 (0.0%) |
| $3,000 or more | 0 (0.0%) | 0 (0.0%) |
| Total | 33 (100.0%) | 29 (100.0%) |
Physical Housing Characteristics in Everetts
Housing Structures in Everetts
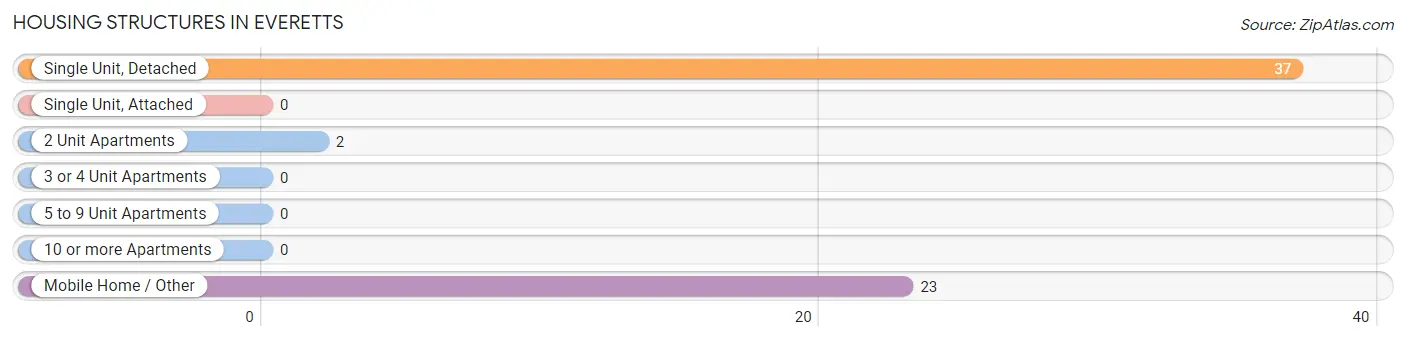
| Structure Type | # Housing Units | % Housing Units |
| Single Unit, Detached | 37 | 59.7% |
| Single Unit, Attached | 0 | 0.0% |
| 2 Unit Apartments | 2 | 3.2% |
| 3 or 4 Unit Apartments | 0 | 0.0% |
| 5 to 9 Unit Apartments | 0 | 0.0% |
| 10 or more Apartments | 0 | 0.0% |
| Mobile Home / Other | 23 | 37.1% |
| Total | 62 | 100.0% |
Housing Structures by Occupancy in Everetts
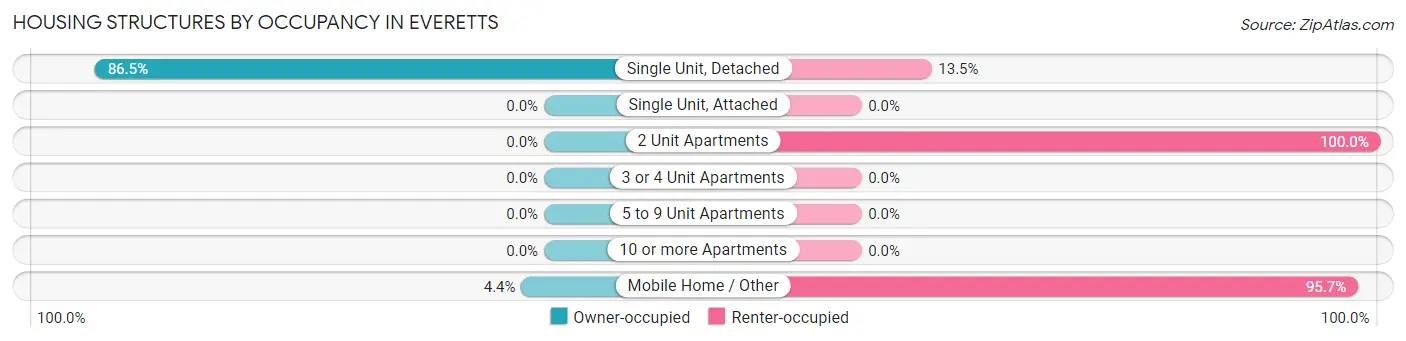
| Structure Type | Owner-occupied | Renter-occupied |
| Single Unit, Detached | 32 (86.5%) | 5 (13.5%) |
| Single Unit, Attached | 0 (0.0%) | 0 (0.0%) |
| 2 Unit Apartments | 0 (0.0%) | 2 (100.0%) |
| 3 or 4 Unit Apartments | 0 (0.0%) | 0 (0.0%) |
| 5 to 9 Unit Apartments | 0 (0.0%) | 0 (0.0%) |
| 10 or more Apartments | 0 (0.0%) | 0 (0.0%) |
| Mobile Home / Other | 1 (4.3%) | 22 (95.7%) |
| Total | 33 (53.2%) | 29 (46.8%) |
Housing Structures by Number of Rooms in Everetts
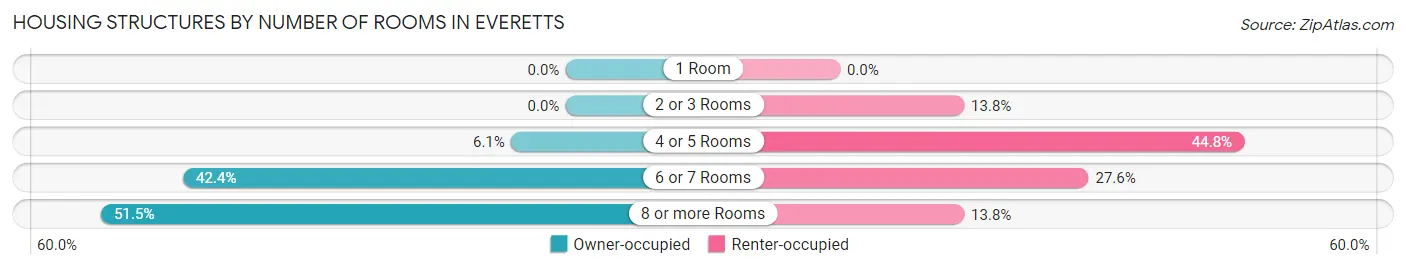
| Number of Rooms | Owner-occupied | Renter-occupied |
| 1 Room | 0 (0.0%) | 0 (0.0%) |
| 2 or 3 Rooms | 0 (0.0%) | 4 (13.8%) |
| 4 or 5 Rooms | 2 (6.1%) | 13 (44.8%) |
| 6 or 7 Rooms | 14 (42.4%) | 8 (27.6%) |
| 8 or more Rooms | 17 (51.5%) | 4 (13.8%) |
| Total | 33 (100.0%) | 29 (100.0%) |
Housing Structure by Heating Type in Everetts
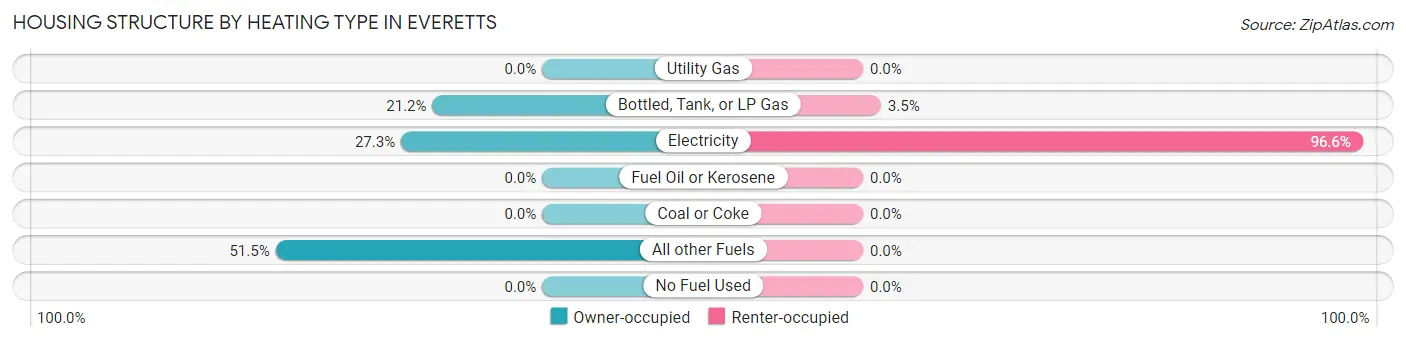
| Heating Type | Owner-occupied | Renter-occupied |
| Utility Gas | 0 (0.0%) | 0 (0.0%) |
| Bottled, Tank, or LP Gas | 7 (21.2%) | 1 (3.5%) |
| Electricity | 9 (27.3%) | 28 (96.6%) |
| Fuel Oil or Kerosene | 0 (0.0%) | 0 (0.0%) |
| Coal or Coke | 0 (0.0%) | 0 (0.0%) |
| All other Fuels | 17 (51.5%) | 0 (0.0%) |
| No Fuel Used | 0 (0.0%) | 0 (0.0%) |
| Total | 33 (100.0%) | 29 (100.0%) |
Household Vehicle Usage in Everetts
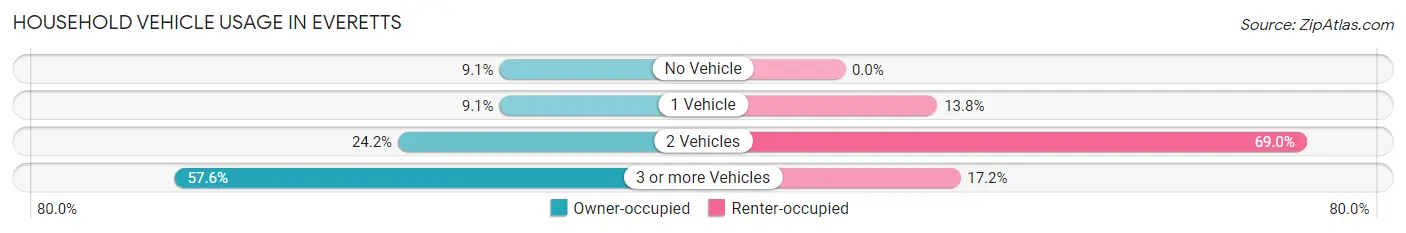
| Vehicles per Household | Owner-occupied | Renter-occupied |
| No Vehicle | 3 (9.1%) | 0 (0.0%) |
| 1 Vehicle | 3 (9.1%) | 4 (13.8%) |
| 2 Vehicles | 8 (24.2%) | 20 (69.0%) |
| 3 or more Vehicles | 19 (57.6%) | 5 (17.2%) |
| Total | 33 (100.0%) | 29 (100.0%) |
Real Estate & Mortgages in Everetts
Real Estate and Mortgage Overview in Everetts
| Characteristic | Without Mortgage | With Mortgage |
| Housing Units | 19 | 14 |
| Median Property Value | $93,700 | $77,100 |
| Median Household Income | $80,917 | $0 |
| Monthly Housing Costs | $650 | $0 |
| Real Estate Taxes | - | - |
Property Value by Mortgage Status in Everetts
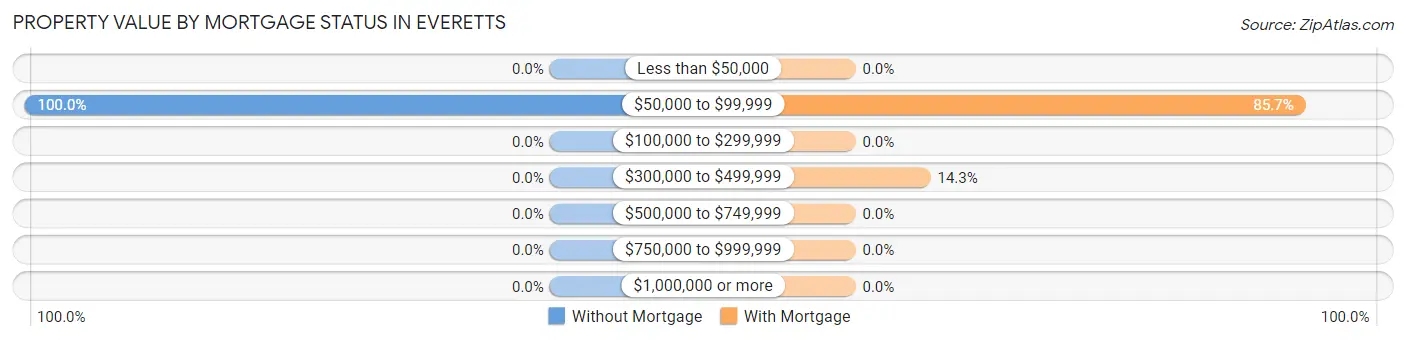
| Property Value | Without Mortgage | With Mortgage |
| Less than $50,000 | 0 (0.0%) | 0 (0.0%) |
| $50,000 to $99,999 | 19 (100.0%) | 12 (85.7%) |
| $100,000 to $299,999 | 0 (0.0%) | 0 (0.0%) |
| $300,000 to $499,999 | 0 (0.0%) | 2 (14.3%) |
| $500,000 to $749,999 | 0 (0.0%) | 0 (0.0%) |
| $750,000 to $999,999 | 0 (0.0%) | 0 (0.0%) |
| $1,000,000 or more | 0 (0.0%) | 0 (0.0%) |
| Total | 19 (100.0%) | 14 (100.0%) |
Household Income by Mortgage Status in Everetts
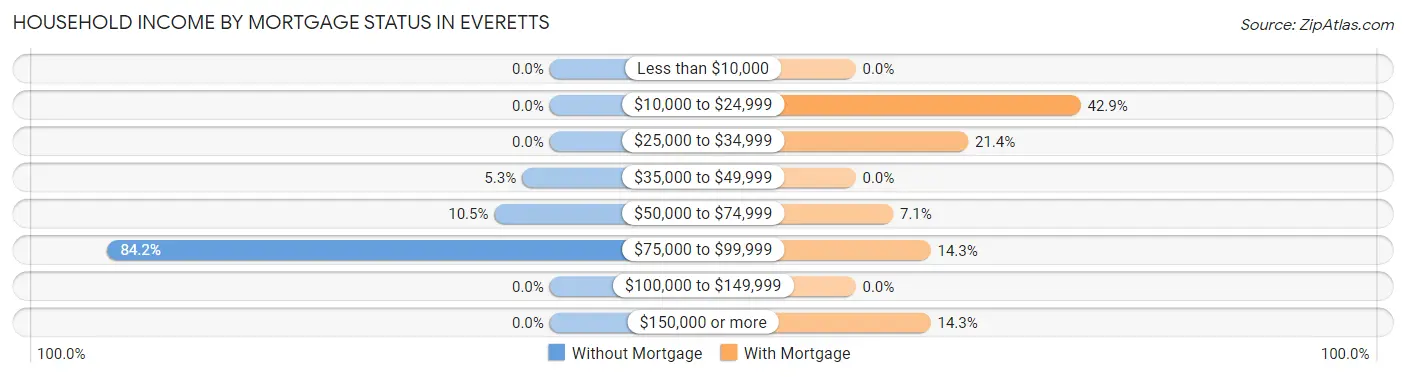
| Household Income | Without Mortgage | With Mortgage |
| Less than $10,000 | 0 (0.0%) | 0 (0.0%) |
| $10,000 to $24,999 | 0 (0.0%) | 6 (42.9%) |
| $25,000 to $34,999 | 0 (0.0%) | 3 (21.4%) |
| $35,000 to $49,999 | 1 (5.3%) | 0 (0.0%) |
| $50,000 to $74,999 | 2 (10.5%) | 1 (7.1%) |
| $75,000 to $99,999 | 16 (84.2%) | 2 (14.3%) |
| $100,000 to $149,999 | 0 (0.0%) | 0 (0.0%) |
| $150,000 or more | 0 (0.0%) | 2 (14.3%) |
| Total | 19 (100.0%) | 14 (100.0%) |
Property Value to Household Income Ratio in Everetts
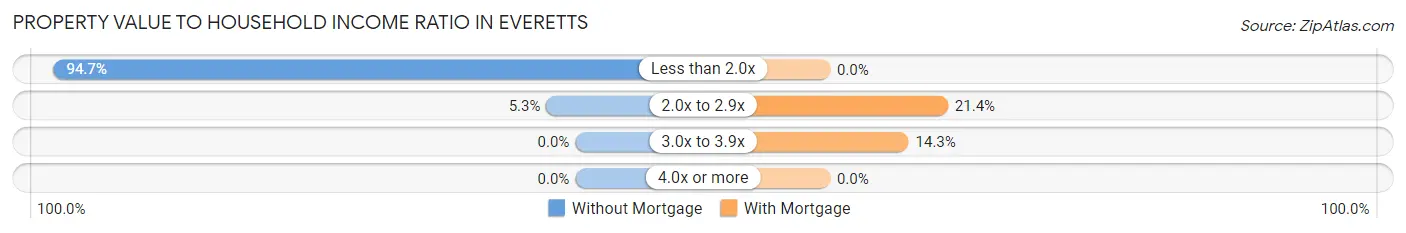
| Value-to-Income Ratio | Without Mortgage | With Mortgage |
| Less than 2.0x | 18 (94.7%) | 0 (0.0%) |
| 2.0x to 2.9x | 1 (5.3%) | 3 (21.4%) |
| 3.0x to 3.9x | 0 (0.0%) | 2 (14.3%) |
| 4.0x or more | 0 (0.0%) | 0 (0.0%) |
| Total | 19 (100.0%) | 14 (100.0%) |
Real Estate Taxes by Mortgage Status in Everetts
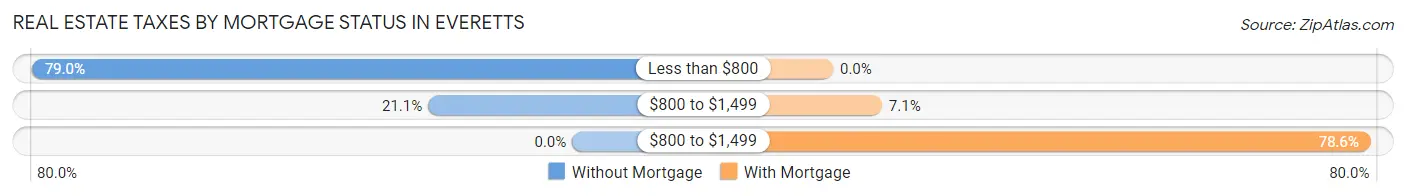
| Property Taxes | Without Mortgage | With Mortgage |
| Less than $800 | 15 (78.9%) | 0 (0.0%) |
| $800 to $1,499 | 4 (21.0%) | 1 (7.1%) |
| $800 to $1,499 | 0 (0.0%) | 11 (78.6%) |
| Total | 19 (100.0%) | 14 (100.0%) |
Health & Disability in Everetts
Health Insurance Coverage by Age in Everetts
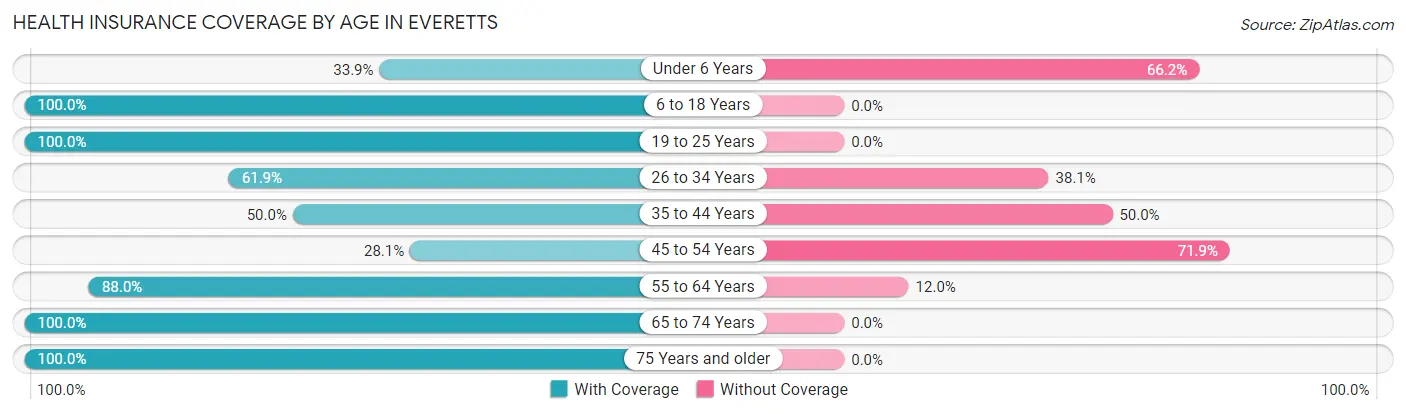
| Age Bracket | With Coverage | Without Coverage |
| Under 6 Years | 22 (33.9%) | 43 (66.1%) |
| 6 to 18 Years | 16 (100.0%) | 0 (0.0%) |
| 19 to 25 Years | 57 (100.0%) | 0 (0.0%) |
| 26 to 34 Years | 26 (61.9%) | 16 (38.1%) |
| 35 to 44 Years | 8 (50.0%) | 8 (50.0%) |
| 45 to 54 Years | 9 (28.1%) | 23 (71.9%) |
| 55 to 64 Years | 22 (88.0%) | 3 (12.0%) |
| 65 to 74 Years | 13 (100.0%) | 0 (0.0%) |
| 75 Years and older | 3 (100.0%) | 0 (0.0%) |
| Total | 176 (65.4%) | 93 (34.6%) |
Health Insurance Coverage by Citizenship Status in Everetts
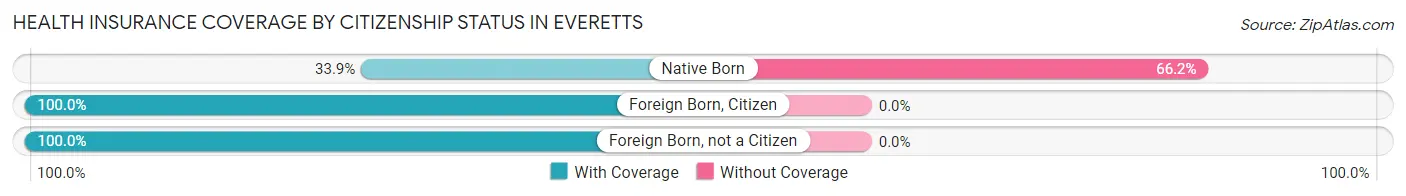
| Citizenship Status | With Coverage | Without Coverage |
| Native Born | 22 (33.9%) | 43 (66.1%) |
| Foreign Born, Citizen | 16 (100.0%) | 0 (0.0%) |
| Foreign Born, not a Citizen | 57 (100.0%) | 0 (0.0%) |
Health Insurance Coverage by Household Income in Everetts
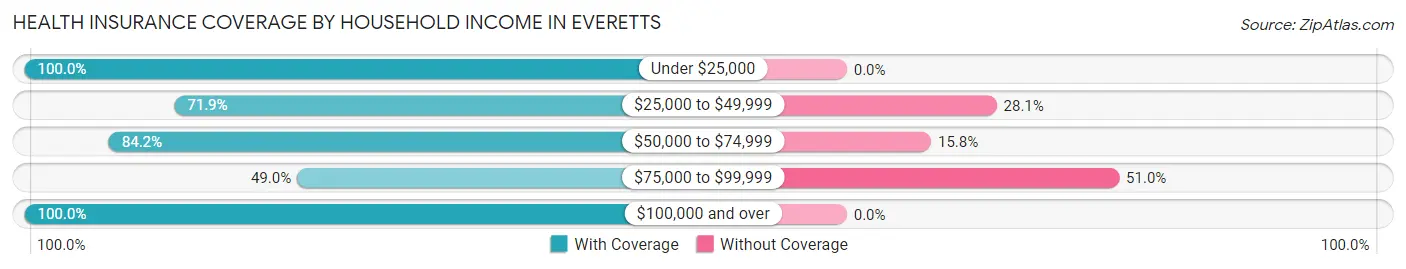
| Household Income | With Coverage | Without Coverage |
| Under $25,000 | 10 (100.0%) | 0 (0.0%) |
| $25,000 to $49,999 | 41 (71.9%) | 16 (28.1%) |
| $50,000 to $74,999 | 16 (84.2%) | 3 (15.8%) |
| $75,000 to $99,999 | 71 (49.0%) | 74 (51.0%) |
| $100,000 and over | 38 (100.0%) | 0 (0.0%) |
Public vs Private Health Insurance Coverage by Age in Everetts
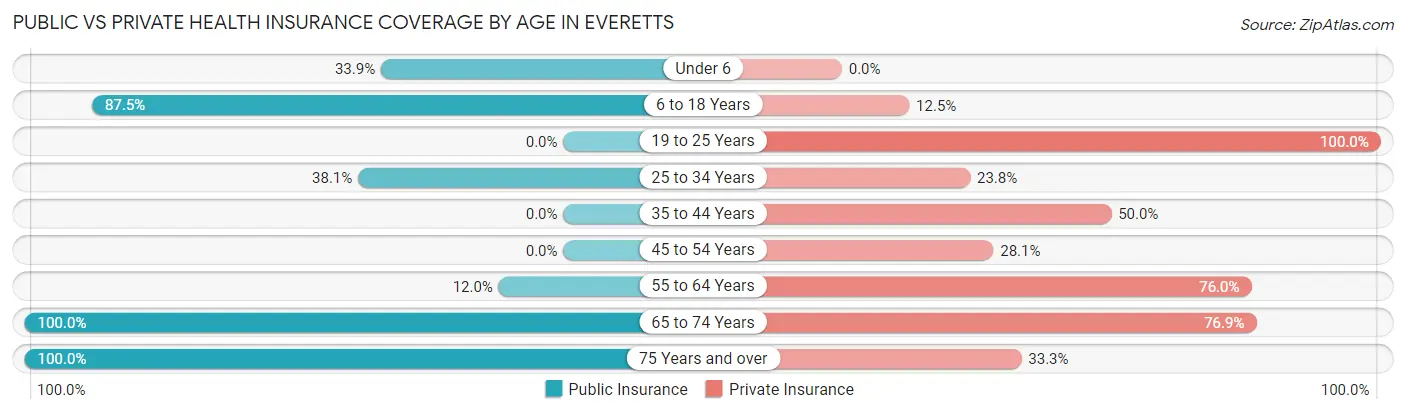
| Age Bracket | Public Insurance | Private Insurance |
| Under 6 | 22 (33.9%) | 0 (0.0%) |
| 6 to 18 Years | 14 (87.5%) | 2 (12.5%) |
| 19 to 25 Years | 0 (0.0%) | 57 (100.0%) |
| 25 to 34 Years | 16 (38.1%) | 10 (23.8%) |
| 35 to 44 Years | 0 (0.0%) | 8 (50.0%) |
| 45 to 54 Years | 0 (0.0%) | 9 (28.1%) |
| 55 to 64 Years | 3 (12.0%) | 19 (76.0%) |
| 65 to 74 Years | 13 (100.0%) | 10 (76.9%) |
| 75 Years and over | 3 (100.0%) | 1 (33.3%) |
| Total | 71 (26.4%) | 116 (43.1%) |
Disability Status by Sex by Age in Everetts
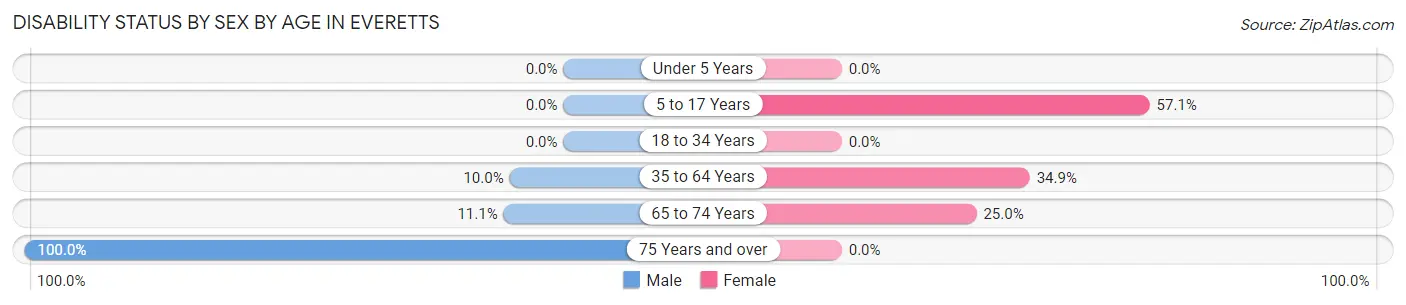
| Age Bracket | Male | Female |
| Under 5 Years | 0 (0.0%) | 0 (0.0%) |
| 5 to 17 Years | 0 (0.0%) | 8 (57.1%) |
| 18 to 34 Years | 0 (0.0%) | 0 (0.0%) |
| 35 to 64 Years | 3 (10.0%) | 15 (34.9%) |
| 65 to 74 Years | 1 (11.1%) | 1 (25.0%) |
| 75 Years and over | 2 (100.0%) | 0 (0.0%) |
Disability Class by Sex by Age in Everetts
Disability Class: Hearing Difficulty
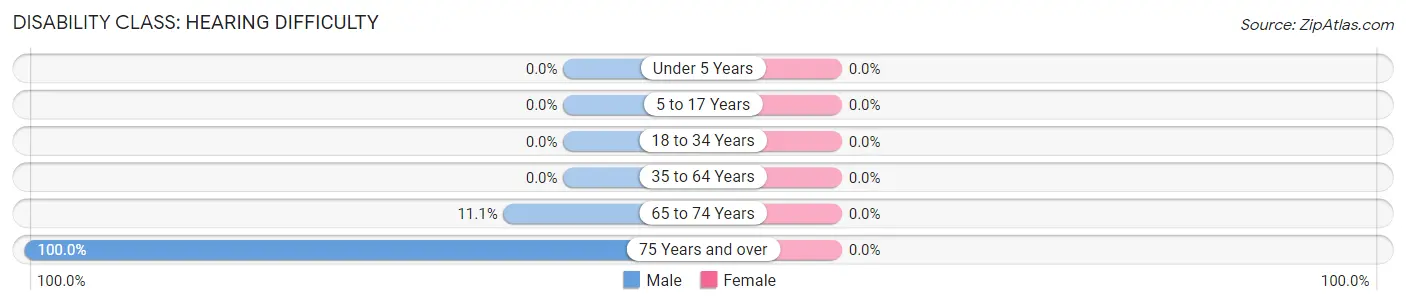
| Age Bracket | Male | Female |
| Under 5 Years | 0 (0.0%) | 0 (0.0%) |
| 5 to 17 Years | 0 (0.0%) | 0 (0.0%) |
| 18 to 34 Years | 0 (0.0%) | 0 (0.0%) |
| 35 to 64 Years | 0 (0.0%) | 0 (0.0%) |
| 65 to 74 Years | 1 (11.1%) | 0 (0.0%) |
| 75 Years and over | 2 (100.0%) | 0 (0.0%) |
Disability Class: Vision Difficulty
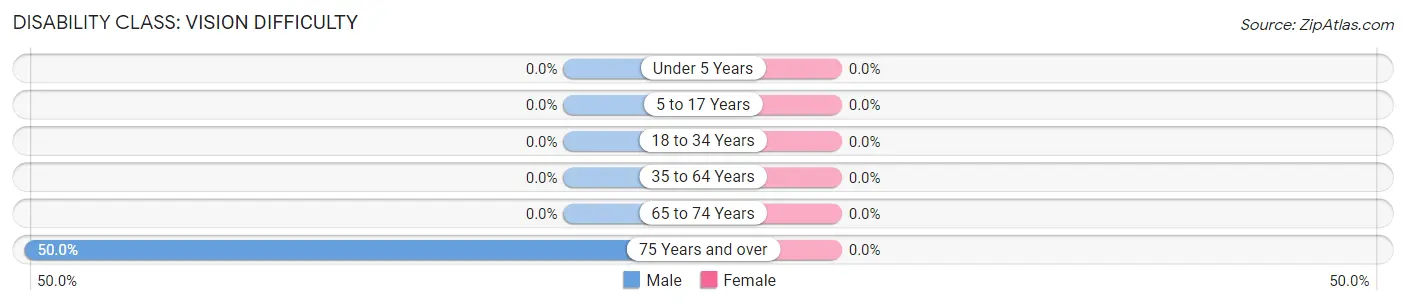
| Age Bracket | Male | Female |
| Under 5 Years | 0 (0.0%) | 0 (0.0%) |
| 5 to 17 Years | 0 (0.0%) | 0 (0.0%) |
| 18 to 34 Years | 0 (0.0%) | 0 (0.0%) |
| 35 to 64 Years | 0 (0.0%) | 0 (0.0%) |
| 65 to 74 Years | 0 (0.0%) | 0 (0.0%) |
| 75 Years and over | 1 (50.0%) | 0 (0.0%) |
Disability Class: Cognitive Difficulty
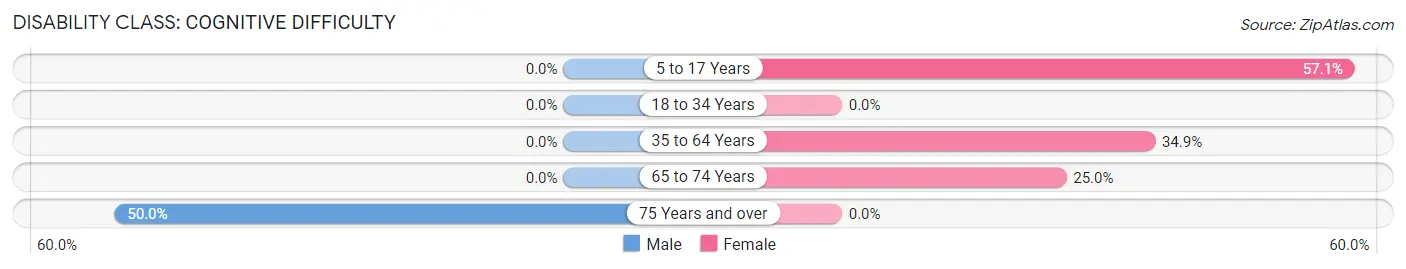
| Age Bracket | Male | Female |
| 5 to 17 Years | 0 (0.0%) | 8 (57.1%) |
| 18 to 34 Years | 0 (0.0%) | 0 (0.0%) |
| 35 to 64 Years | 0 (0.0%) | 15 (34.9%) |
| 65 to 74 Years | 0 (0.0%) | 1 (25.0%) |
| 75 Years and over | 1 (50.0%) | 0 (0.0%) |
Disability Class: Ambulatory Difficulty
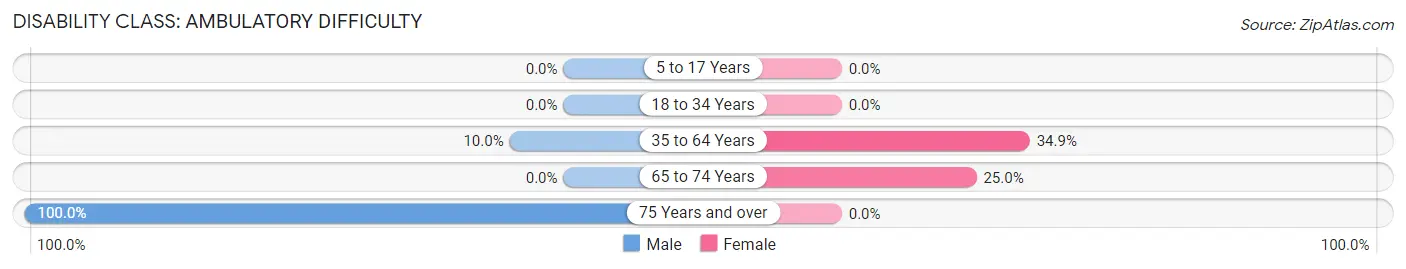
| Age Bracket | Male | Female |
| 5 to 17 Years | 0 (0.0%) | 0 (0.0%) |
| 18 to 34 Years | 0 (0.0%) | 0 (0.0%) |
| 35 to 64 Years | 3 (10.0%) | 15 (34.9%) |
| 65 to 74 Years | 0 (0.0%) | 1 (25.0%) |
| 75 Years and over | 2 (100.0%) | 0 (0.0%) |
Disability Class: Self-Care Difficulty
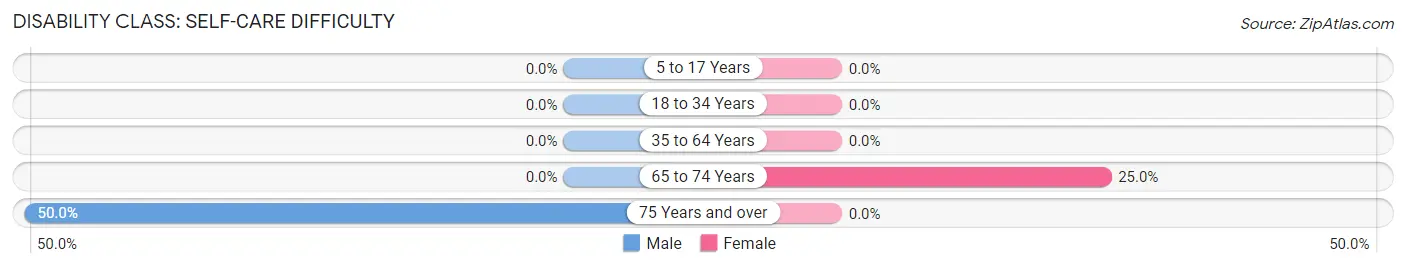
| Age Bracket | Male | Female |
| 5 to 17 Years | 0 (0.0%) | 0 (0.0%) |
| 18 to 34 Years | 0 (0.0%) | 0 (0.0%) |
| 35 to 64 Years | 0 (0.0%) | 0 (0.0%) |
| 65 to 74 Years | 0 (0.0%) | 1 (25.0%) |
| 75 Years and over | 1 (50.0%) | 0 (0.0%) |
Technology Access in Everetts
Computing Device Access in Everetts
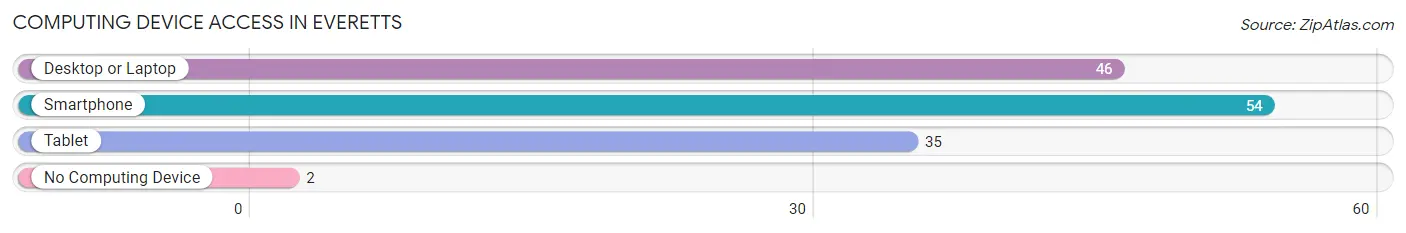
| Device Type | # Households | % Households |
| Desktop or Laptop | 46 | 74.2% |
| Smartphone | 54 | 87.1% |
| Tablet | 35 | 56.5% |
| No Computing Device | 2 | 3.2% |
| Total | 62 | 100.0% |
Internet Access in Everetts
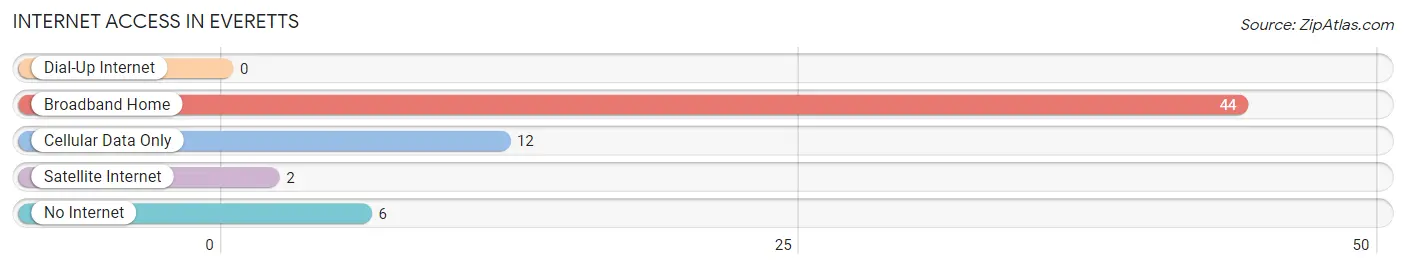
| Internet Type | # Households | % Households |
| Dial-Up Internet | 0 | 0.0% |
| Broadband Home | 44 | 71.0% |
| Cellular Data Only | 12 | 19.4% |
| Satellite Internet | 2 | 3.2% |
| No Internet | 6 | 9.7% |
| Total | 62 | 100.0% |
Everetts Summary
Everetts is a small town located in Martin County, North Carolina. It is situated in the northeastern part of the state, about 30 miles from the coast. The town has a population of approximately 1,000 people and is part of the Greenville Metropolitan Statistical Area.
Geography
Everetts is located in the Coastal Plain region of North Carolina. The town is situated on the Roanoke River, which is a major tributary of the Albemarle Sound. The town is surrounded by a number of small towns and rural communities, including Williamston, Robersonville, and Oak City. The town is located in a predominantly agricultural area, with the majority of the land being used for farming and timber production. The town is also located near the Roanoke River National Wildlife Refuge, which is a popular destination for birdwatchers and nature enthusiasts.
Economy
Everetts is a small, rural town with a limited economy. The majority of the town’s residents are employed in the agricultural sector, with many working in the timber industry. The town also has a few small businesses, including a grocery store, a hardware store, and a few restaurants. The town is also home to a few small manufacturing companies, which produce a variety of products, including furniture and clothing.
Demographics
As of the 2010 census, the population of Everetts was 1,000 people. The racial makeup of the town was 95.2% White, 2.2% African American, 0.2% Native American, 0.2% Asian, 0.2% from other races, and 1.2% from two or more races. The median household income in the town was $30,000, and the median family income was $35,000.
History
Everetts was founded in the late 19th century by a group of settlers from Virginia. The town was named after the family of William Everett, who was one of the original settlers. The town grew slowly over the years, and by the early 20th century, it had become a small farming community. The town was also home to a number of small businesses, including a general store, a blacksmith shop, and a sawmill.
In the mid-20th century, the town began to experience a period of growth and development. The town was connected to the nearby towns of Williamston and Robersonville by a new highway, and the town began to attract new businesses and residents. The town also began to attract tourists, who were drawn to the town’s rural charm and its proximity to the Roanoke River.
Today, Everetts is a small, rural town with a limited economy. The town is home to a few small businesses, and the majority of the town’s residents are employed in the agricultural sector. The town is also home to a number of small manufacturing companies, which produce a variety of products. The town is also a popular destination for birdwatchers and nature enthusiasts, due to its proximity to the Roanoke River National Wildlife Refuge.
Common Questions
What is the Total Population of Everetts?
Total Population of Everetts is 269.
What is the Total Male Population of Everetts?
Total Male Population of Everetts is 119.
What is the Total Female Population of Everetts?
Total Female Population of Everetts is 150.
What is the Ratio of Males per 100 Females in Everetts?
There are 79.33 Males per 100 Females in Everetts.
What is the Ratio of Females per 100 Males in Everetts?
There are 126.05 Females per 100 Males in Everetts.
What is the Median Population Age in Everetts?
Median Population Age in Everetts is 24.8 Years.
What is the Average Family Size in Everetts
Average Family Size in Everetts is 4.9 People.
What is the Average Household Size in Everetts
Average Household Size in Everetts is 4.3 People.
What is Per Capita Income in Everetts?
Per Capita income in Everetts is $16,597.
What is the Median Family Income in Everetts?
Median Family Income in Everetts is $76,250.
What is the Median Household income in Everetts?
Median Household Income in Everetts is $55,000.
What is Inequality or Gini Index in Everetts?
Inequality or Gini Index in Everetts is 0.35.
How Large is the Labor Force in Everetts?
There are 130 People in the Labor Forcein in Everetts.
What is the Percentage of People in the Labor Force in Everetts?
67.4% of People are in the Labor Force in Everetts.