Spindale, NC
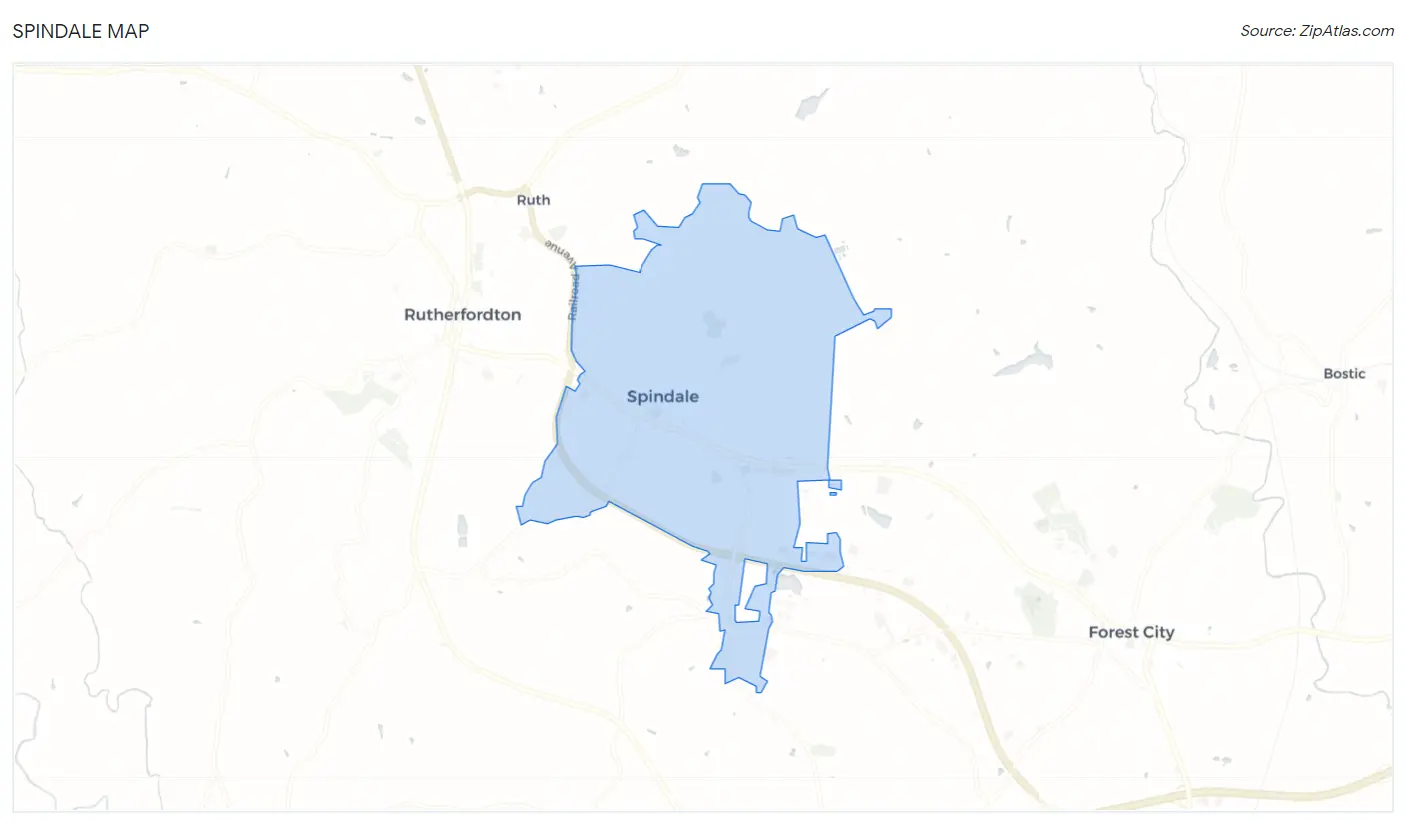
Spindale Map
Spindale Overview
4,218
TOTAL POPULATION
2,089
MALE POPULATION
2,129
FEMALE POPULATION
98.12
MALES / 100 FEMALES
101.91
FEMALES / 100 MALES
50.0
MEDIAN AGE
2.7
AVG FAMILY SIZE
1.9
AVG HOUSEHOLD SIZE
$28,662
PER CAPITA INCOME
$59,375
AVG FAMILY INCOME
$38,857
AVG HOUSEHOLD INCOME
25.7%
WAGE / INCOME GAP [ % ]
74.3¢/ $1
WAGE / INCOME GAP [ $ ]
0.48
INEQUALITY / GINI INDEX
1,965
LABOR FORCE [ PEOPLE ]
50.3%
PERCENT IN LABOR FORCE
8.5%
UNEMPLOYMENT RATE
Spindale Zip Codes
Spindale Area Codes
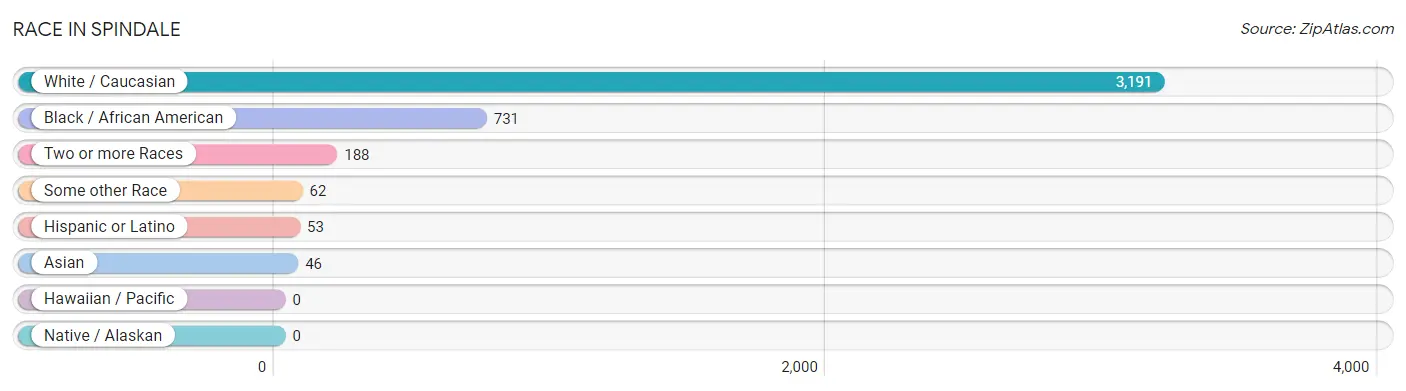
Race in Spindale
The most populous races in Spindale are White / Caucasian (3,191 | 75.6%), Black / African American (731 | 17.3%), and Two or more Races (188 | 4.5%).
| Race | # Population | % Population |
| Asian | 46 | 1.1% |
| Black / African American | 731 | 17.3% |
| Hawaiian / Pacific | 0 | 0.0% |
| Hispanic or Latino | 53 | 1.3% |
| Native / Alaskan | 0 | 0.0% |
| White / Caucasian | 3,191 | 75.6% |
| Two or more Races | 188 | 4.5% |
| Some other Race | 62 | 1.5% |
| Total | 4,218 | 100.0% |
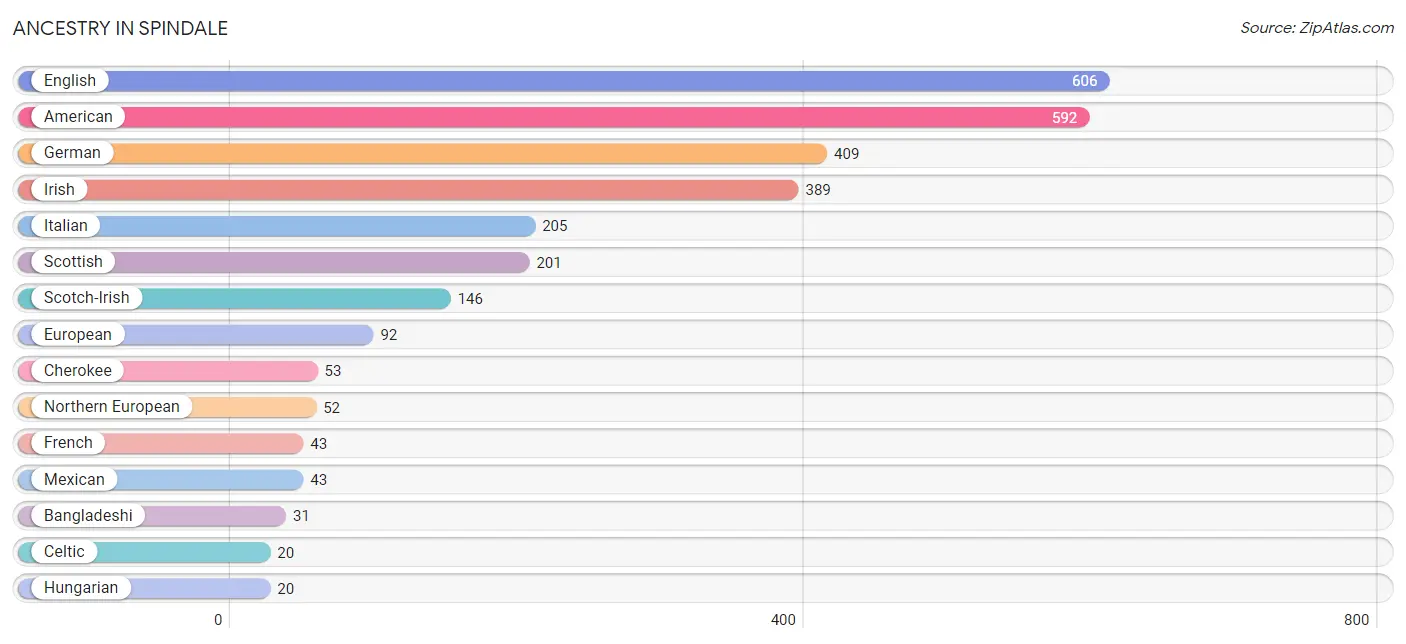
Ancestry in Spindale
The most populous ancestries reported in Spindale are English (606 | 14.4%), American (592 | 14.0%), German (409 | 9.7%), Irish (389 | 9.2%), and Italian (205 | 4.9%), together accounting for 52.2% of all Spindale residents.
| Ancestry | # Population | % Population |
| American | 592 | 14.0% |
| Bangladeshi | 31 | 0.7% |
| Burmese | 15 | 0.4% |
| Canadian | 15 | 0.4% |
| Celtic | 20 | 0.5% |
| Central American | 2 | 0.1% |
| Cherokee | 53 | 1.3% |
| Cuban | 2 | 0.1% |
| Dutch | 14 | 0.3% |
| English | 606 | 14.4% |
| European | 92 | 2.2% |
| French | 43 | 1.0% |
| German | 409 | 9.7% |
| Greek | 13 | 0.3% |
| Guatemalan | 2 | 0.1% |
| Haitian | 2 | 0.1% |
| Hungarian | 20 | 0.5% |
| Irish | 389 | 9.2% |
| Italian | 205 | 4.9% |
| Mexican | 43 | 1.0% |
| Native Hawaiian | 20 | 0.5% |
| Northern European | 52 | 1.2% |
| Russian | 6 | 0.1% |
| Scotch-Irish | 146 | 3.5% |
| Scottish | 201 | 4.8% |
| Spaniard | 6 | 0.1% |
| Ukrainian | 6 | 0.1% | View All 27 Rows |
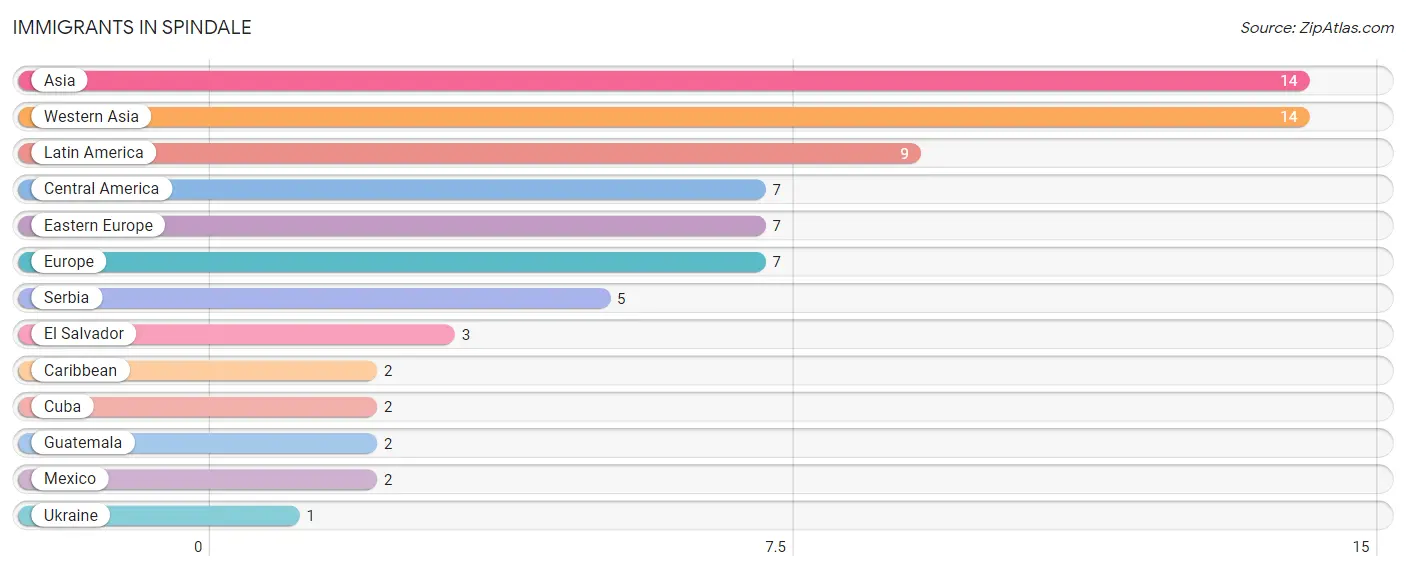
Immigrants in Spindale
The most numerous immigrant groups reported in Spindale came from Asia (14 | 0.3%), Western Asia (14 | 0.3%), Latin America (9 | 0.2%), Central America (7 | 0.2%), and Eastern Europe (7 | 0.2%), together accounting for 1.2% of all Spindale residents.
| Immigration Origin | # Population | % Population |
| Asia | 14 | 0.3% |
| Caribbean | 2 | 0.1% |
| Central America | 7 | 0.2% |
| Cuba | 2 | 0.1% |
| Eastern Europe | 7 | 0.2% |
| El Salvador | 3 | 0.1% |
| Europe | 7 | 0.2% |
| Guatemala | 2 | 0.1% |
| Latin America | 9 | 0.2% |
| Mexico | 2 | 0.1% |
| Serbia | 5 | 0.1% |
| Ukraine | 1 | 0.0% |
| Western Asia | 14 | 0.3% | View All 13 Rows |
Sex and Age in Spindale
Sex and Age in Spindale
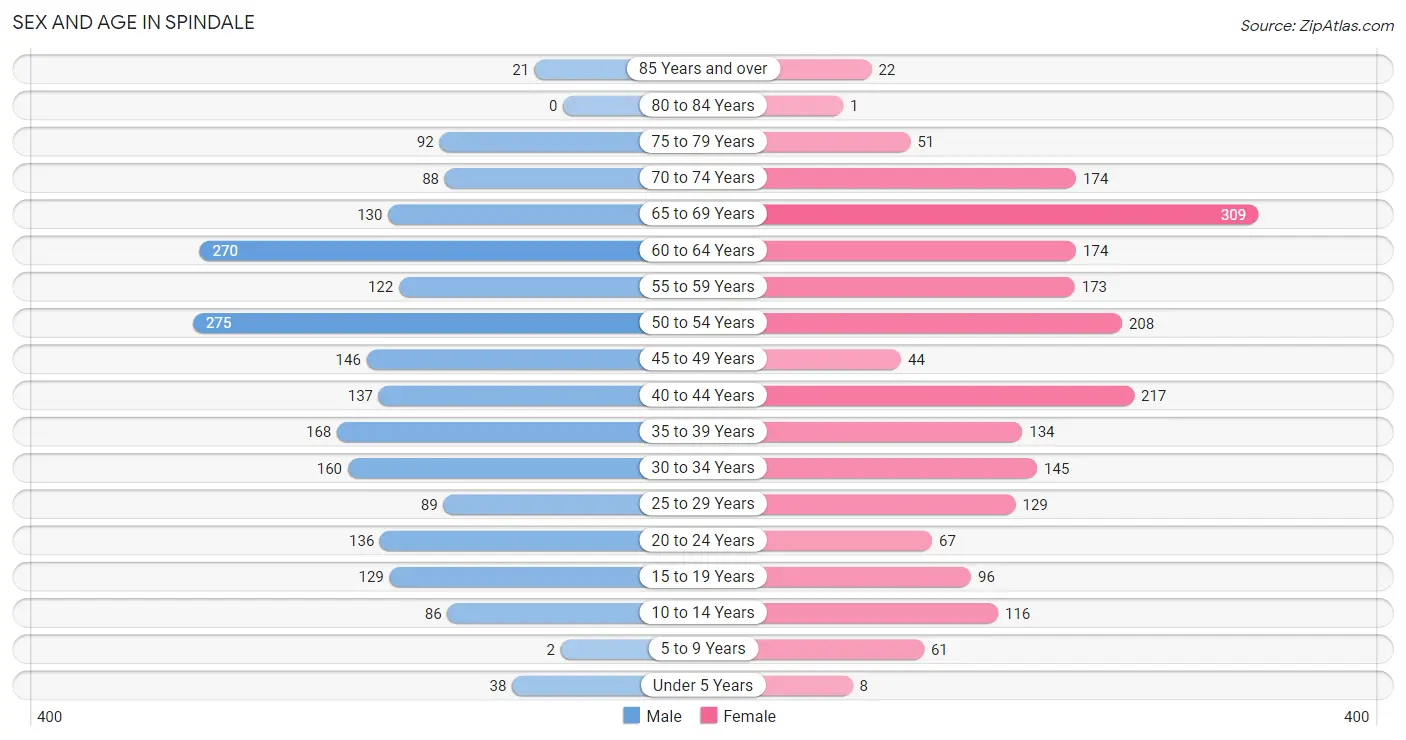
The most populous age groups in Spindale are 50 to 54 Years (275 | 13.2%) for men and 65 to 69 Years (309 | 14.5%) for women.
| Age Bracket | Male | Female |
| Under 5 Years | 38 (1.8%) | 8 (0.4%) |
| 5 to 9 Years | 2 (0.1%) | 61 (2.9%) |
| 10 to 14 Years | 86 (4.1%) | 116 (5.4%) |
| 15 to 19 Years | 129 (6.2%) | 96 (4.5%) |
| 20 to 24 Years | 136 (6.5%) | 67 (3.2%) |
| 25 to 29 Years | 89 (4.3%) | 129 (6.1%) |
| 30 to 34 Years | 160 (7.7%) | 145 (6.8%) |
| 35 to 39 Years | 168 (8.0%) | 134 (6.3%) |
| 40 to 44 Years | 137 (6.6%) | 217 (10.2%) |
| 45 to 49 Years | 146 (7.0%) | 44 (2.1%) |
| 50 to 54 Years | 275 (13.2%) | 208 (9.8%) |
| 55 to 59 Years | 122 (5.8%) | 173 (8.1%) |
| 60 to 64 Years | 270 (12.9%) | 174 (8.2%) |
| 65 to 69 Years | 130 (6.2%) | 309 (14.5%) |
| 70 to 74 Years | 88 (4.2%) | 174 (8.2%) |
| 75 to 79 Years | 92 (4.4%) | 51 (2.4%) |
| 80 to 84 Years | 0 (0.0%) | 1 (0.1%) |
| 85 Years and over | 21 (1.0%) | 22 (1.0%) |
| Total | 2,089 (100.0%) | 2,129 (100.0%) |
Families and Households in Spindale
Median Family Size in Spindale
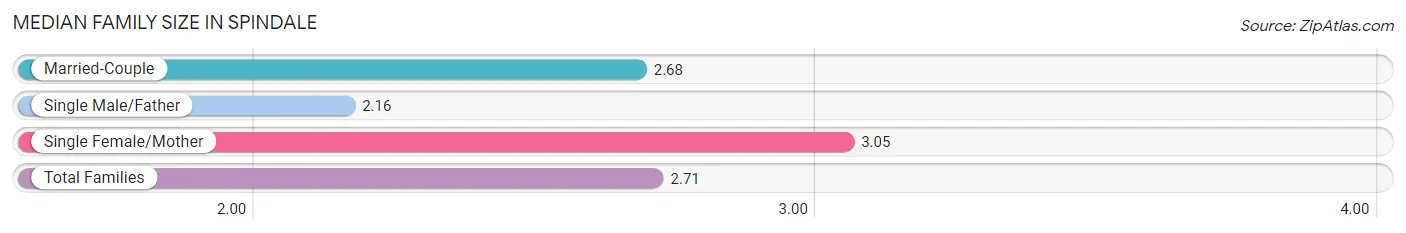
The median family size in Spindale is 2.71 persons per family, with single female/mother families (175 | 18.3%) accounting for the largest median family size of 3.05 persons per family. On the other hand, single male/father families (68 | 7.1%) represent the smallest median family size with 2.16 persons per family.
| Family Type | # Families | Family Size |
| Married-Couple | 715 (74.6%) | 2.68 |
| Single Male/Father | 68 (7.1%) | 2.16 |
| Single Female/Mother | 175 (18.3%) | 3.05 |
| Total Families | 958 (100.0%) | 2.71 |
Median Household Size in Spindale
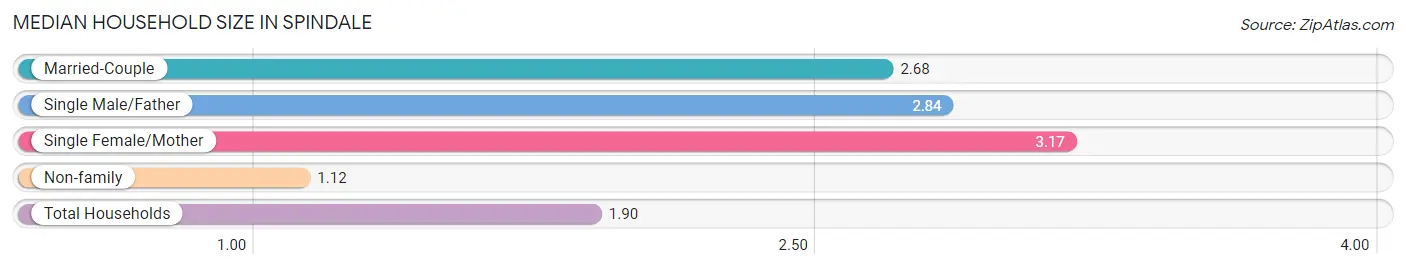
The median household size in Spindale is 1.90 persons per household, with single female/mother households (175 | 8.6%) accounting for the largest median household size of 3.17 persons per household. non-family households (1,088 | 53.2%) represent the smallest median household size with 1.12 persons per household.
| Household Type | # Households | Household Size |
| Married-Couple | 715 (34.9%) | 2.68 |
| Single Male/Father | 68 (3.3%) | 2.84 |
| Single Female/Mother | 175 (8.6%) | 3.17 |
| Non-family | 1,088 (53.2%) | 1.12 |
| Total Households | 2,046 (100.0%) | 1.90 |
Household Size by Marriage Status in Spindale
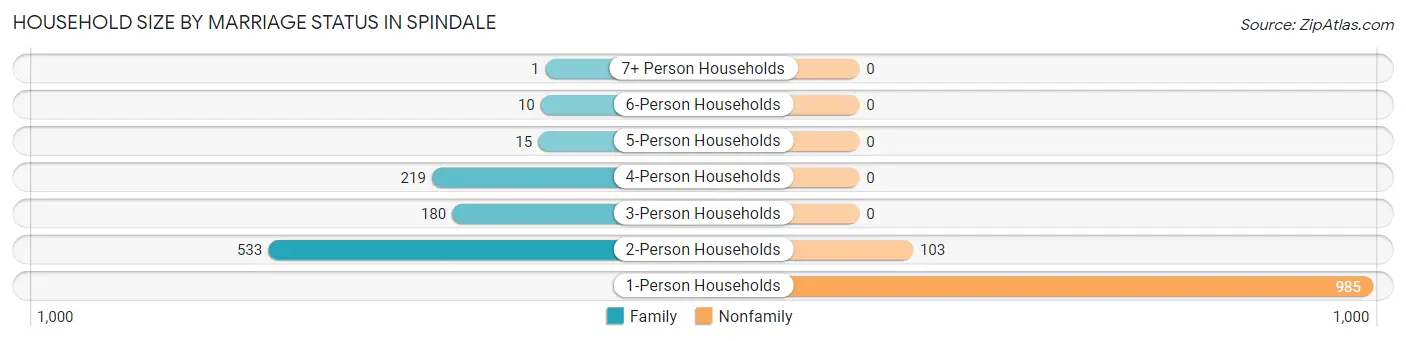
Out of a total of 2,046 households in Spindale, 958 (46.8%) are family households, while 1,088 (53.2%) are nonfamily households. The most numerous type of family households are 2-person households, comprising 533, and the most common type of nonfamily households are 1-person households, comprising 985.
| Household Size | Family Households | Nonfamily Households |
| 1-Person Households | - | 985 (48.1%) |
| 2-Person Households | 533 (26.1%) | 103 (5.0%) |
| 3-Person Households | 180 (8.8%) | 0 (0.0%) |
| 4-Person Households | 219 (10.7%) | 0 (0.0%) |
| 5-Person Households | 15 (0.7%) | 0 (0.0%) |
| 6-Person Households | 10 (0.5%) | 0 (0.0%) |
| 7+ Person Households | 1 (0.1%) | 0 (0.0%) |
| Total | 958 (46.8%) | 1,088 (53.2%) |
Female Fertility in Spindale
Fertility by Age in Spindale
| Age Bracket | Women with Births | Births / 1,000 Women |
| 15 to 19 years | 0 (0.0%) | 0.0 |
| 20 to 34 years | 0 (0.0%) | 0.0 |
| 35 to 50 years | 0 (0.0%) | 0.0 |
| Total | 0 (0.0%) | 0.0 |
Fertility by Age by Marriage Status in Spindale
| Age Bracket | Married | Unmarried |
| 15 to 19 years | 0 (0.0%) | 0 (0.0%) |
| 20 to 34 years | 0 (0.0%) | 0 (0.0%) |
| 35 to 50 years | 0 (0.0%) | 0 (0.0%) |
| Total | 0 (0.0%) | 0 (0.0%) |
Fertility by Education in Spindale
| Educational Attainment | Women with Births | Births / 1,000 Women |
| Less than High School | 0 (0.0%) | 0.0 |
| High School Diploma | 0 (0.0%) | 0.0 |
| College or Associate's Degree | 0 (0.0%) | 0.0 |
| Bachelor's Degree | 0 (0.0%) | 0.0 |
| Graduate Degree | 0 (0.0%) | 0.0 |
| Total | 0 (0.0%) | 0.0 |
Fertility by Education by Marriage Status in Spindale
| Educational Attainment | Married | Unmarried |
| Less than High School | 0 (0.0%) | 0 (0.0%) |
| High School Diploma | 0 (0.0%) | 0 (0.0%) |
| College or Associate's Degree | 0 (0.0%) | 0 (0.0%) |
| Bachelor's Degree | 0 (0.0%) | 0 (0.0%) |
| Graduate Degree | 0 (0.0%) | 0 (0.0%) |
| Total | 0 (0.0%) | 0 (0.0%) |
Income in Spindale
Income Overview in Spindale
Per Capita Income in Spindale is $28,662, while median incomes of families and households are $59,375 and $38,857 respectively.
| Characteristic | Number | Measure |
| Per Capita Income | 4,218 | $28,662 |
| Median Family Income | 958 | $59,375 |
| Mean Family Income | 958 | $81,553 |
| Median Household Income | 2,046 | $38,857 |
| Mean Household Income | 2,046 | $60,020 |
| Income Deficit | 958 | $0 |
| Wage / Income Gap (%) | 4,218 | 25.67% |
| Wage / Income Gap ($) | 4,218 | 74.33¢ per $1 |
| Gini / Inequality Index | 4,218 | 0.48 |
Earnings by Sex in Spindale
Average Earnings in Spindale are $32,500, $37,746 for men and $28,056 for women, a difference of 25.7%.
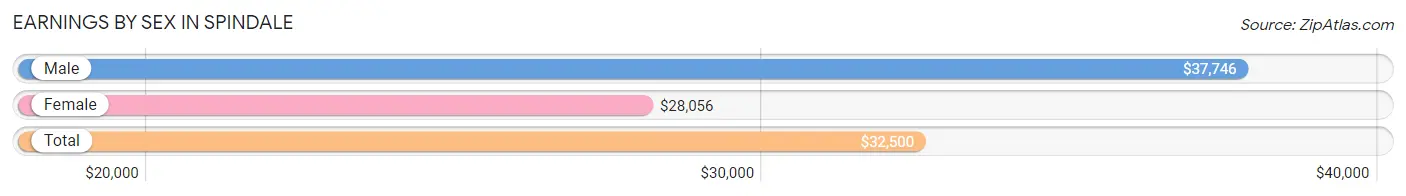
| Sex | Number | Average Earnings |
| Male | 820 (39.6%) | $37,746 |
| Female | 1,252 (60.4%) | $28,056 |
| Total | 2,072 (100.0%) | $32,500 |
Earnings by Sex by Income Bracket in Spindale
The most common earnings brackets in Spindale are $25,000 to $29,999 for men (126 | 15.4%) and $30,000 to $34,999 for women (186 | 14.9%).
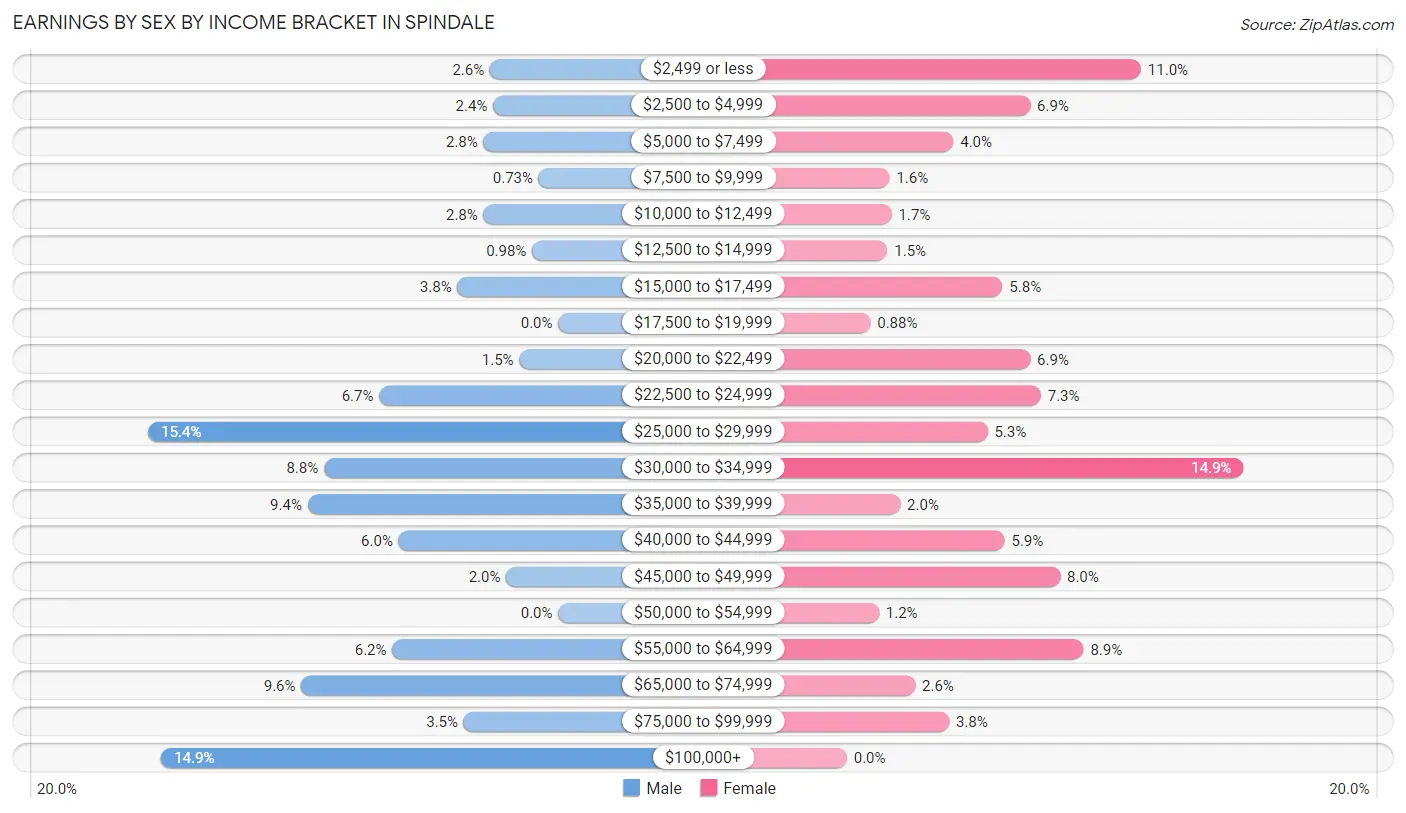
| Income | Male | Female |
| $2,499 or less | 21 (2.6%) | 138 (11.0%) |
| $2,500 to $4,999 | 20 (2.4%) | 86 (6.9%) |
| $5,000 to $7,499 | 23 (2.8%) | 50 (4.0%) |
| $7,500 to $9,999 | 6 (0.7%) | 20 (1.6%) |
| $10,000 to $12,499 | 23 (2.8%) | 21 (1.7%) |
| $12,500 to $14,999 | 8 (1.0%) | 19 (1.5%) |
| $15,000 to $17,499 | 31 (3.8%) | 73 (5.8%) |
| $17,500 to $19,999 | 0 (0.0%) | 11 (0.9%) |
| $20,000 to $22,499 | 12 (1.5%) | 86 (6.9%) |
| $22,500 to $24,999 | 55 (6.7%) | 91 (7.3%) |
| $25,000 to $29,999 | 126 (15.4%) | 66 (5.3%) |
| $30,000 to $34,999 | 72 (8.8%) | 186 (14.9%) |
| $35,000 to $39,999 | 77 (9.4%) | 25 (2.0%) |
| $40,000 to $44,999 | 49 (6.0%) | 74 (5.9%) |
| $45,000 to $49,999 | 16 (1.9%) | 100 (8.0%) |
| $50,000 to $54,999 | 0 (0.0%) | 15 (1.2%) |
| $55,000 to $64,999 | 51 (6.2%) | 111 (8.9%) |
| $65,000 to $74,999 | 79 (9.6%) | 32 (2.6%) |
| $75,000 to $99,999 | 29 (3.5%) | 48 (3.8%) |
| $100,000+ | 122 (14.9%) | 0 (0.0%) |
| Total | 820 (100.0%) | 1,252 (100.0%) |
Earnings by Sex by Educational Attainment in Spindale
Average earnings in Spindale are $39,049 for men and $32,561 for women, a difference of 16.6%. Men with an educational attainment of high school diploma enjoy the highest average annual earnings of $44,280, while those with college or associate's degree education earn the least with $33,194. Women with an educational attainment of graduate degree earn the most with the average annual earnings of $63,125, while those with college or associate's degree education have the smallest earnings of $27,500.
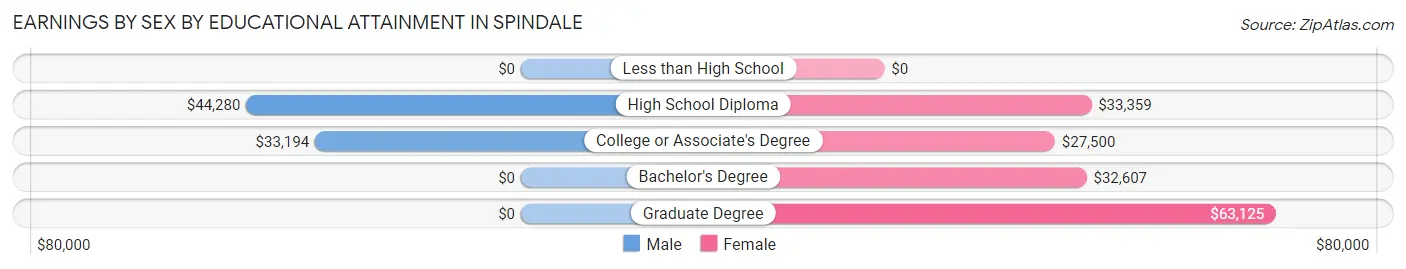
| Educational Attainment | Male Income | Female Income |
| Less than High School | - | - |
| High School Diploma | $44,280 | $33,359 |
| College or Associate's Degree | $33,194 | $27,500 |
| Bachelor's Degree | - | - |
| Graduate Degree | - | - |
| Total | $39,049 | $32,561 |
Family Income in Spindale
Family Income Brackets in Spindale
According to the Spindale family income data, there are 213 families falling into the $50,000 to $74,999 income range, which is the most common income bracket and makes up 22.2% of all families. Conversely, the $10,000 to $14,999 income bracket is the least frequent group with only 14 families (1.5%) belonging to this category.
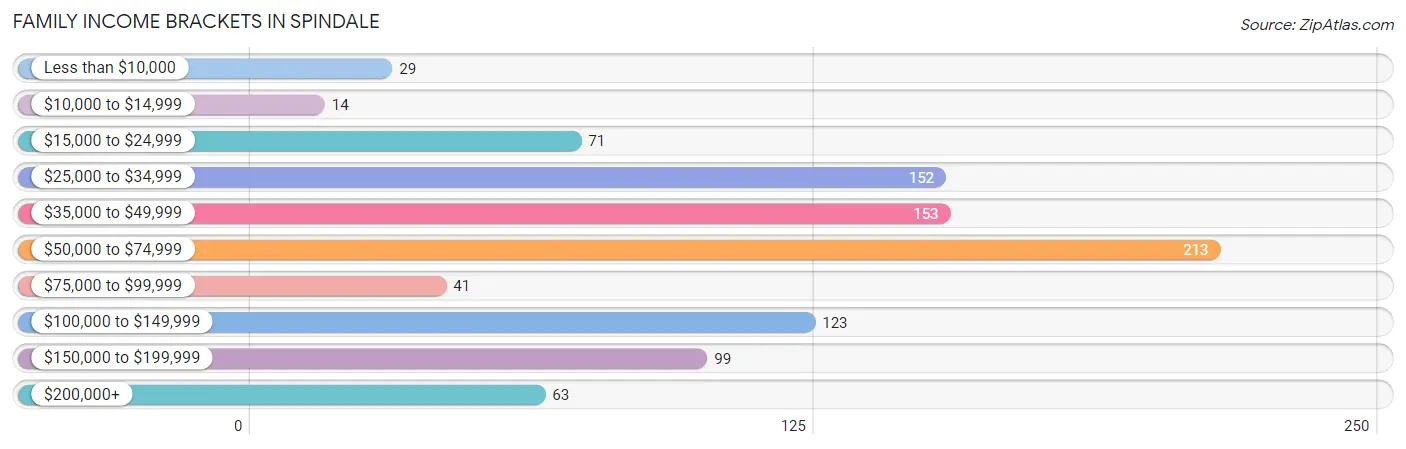
| Income Bracket | # Families | % Families |
| Less than $10,000 | 29 | 3.0% |
| $10,000 to $14,999 | 14 | 1.5% |
| $15,000 to $24,999 | 71 | 7.4% |
| $25,000 to $34,999 | 152 | 15.9% |
| $35,000 to $49,999 | 153 | 16.0% |
| $50,000 to $74,999 | 213 | 22.2% |
| $75,000 to $99,999 | 41 | 4.3% |
| $100,000 to $149,999 | 123 | 12.8% |
| $150,000 to $199,999 | 99 | 10.3% |
| $200,000+ | 63 | 6.6% |
Family Income by Famaliy Size in Spindale
3-person families (153 | 16.0%) account for the highest median family income in Spindale with $59,180 per family, while 2-person families (570 | 59.5%) have the highest median income of $25,700 per family member.
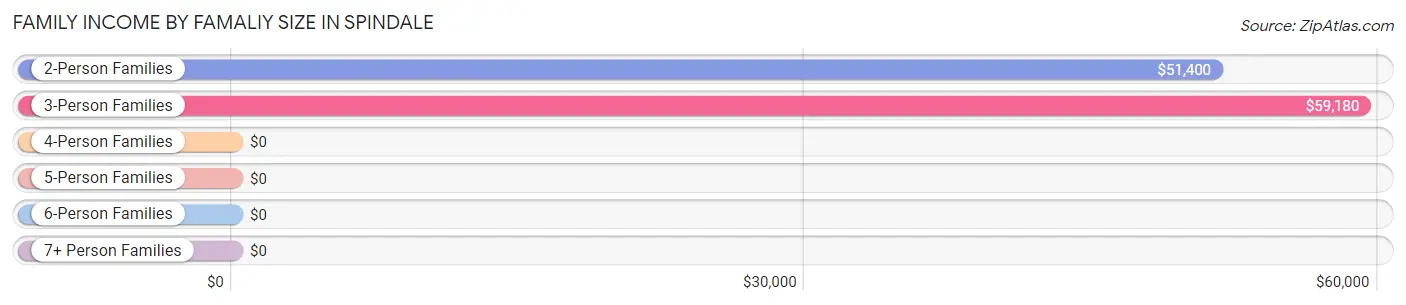
| Income Bracket | # Families | Median Income |
| 2-Person Families | 570 (59.5%) | $51,400 |
| 3-Person Families | 153 (16.0%) | $59,180 |
| 4-Person Families | 219 (22.9%) | $0 |
| 5-Person Families | 15 (1.6%) | $0 |
| 6-Person Families | 0 (0.0%) | $0 |
| 7+ Person Families | 1 (0.1%) | $0 |
| Total | 958 (100.0%) | $59,375 |
Family Income by Number of Earners in Spindale
The median family income in Spindale is $59,375, with families comprising 3+ earners (160) having the highest median family income of $138,571, while families with 1 earner (358) have the lowest median family income of $31,304, accounting for 16.7% and 37.4% of families, respectively.
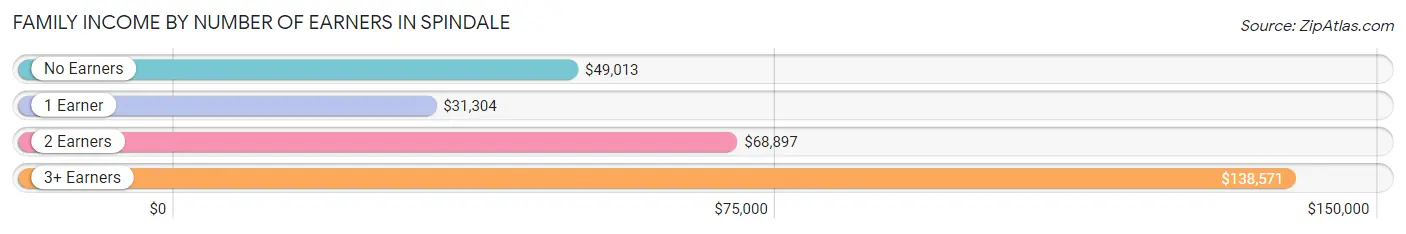
| Number of Earners | # Families | Median Income |
| No Earners | 163 (17.0%) | $49,013 |
| 1 Earner | 358 (37.4%) | $31,304 |
| 2 Earners | 277 (28.9%) | $68,897 |
| 3+ Earners | 160 (16.7%) | $138,571 |
| Total | 958 (100.0%) | $59,375 |
Household Income in Spindale
Household Income Brackets in Spindale
With 389 households falling in the category, the $50,000 to $74,999 income range is the most frequent in Spindale, accounting for 19.0% of all households. In contrast, only 68 households (3.3%) fall into the $75,000 to $99,999 income bracket, making it the least populous group.
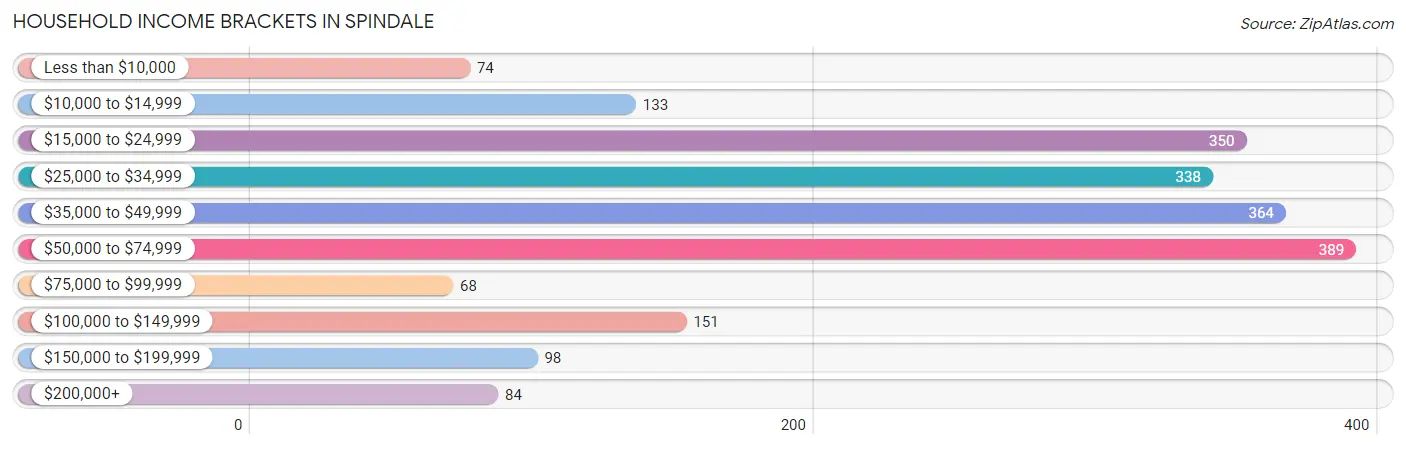
| Income Bracket | # Households | % Households |
| Less than $10,000 | 74 | 3.6% |
| $10,000 to $14,999 | 133 | 6.5% |
| $15,000 to $24,999 | 350 | 17.1% |
| $25,000 to $34,999 | 338 | 16.5% |
| $35,000 to $49,999 | 364 | 17.8% |
| $50,000 to $74,999 | 389 | 19.0% |
| $75,000 to $99,999 | 68 | 3.3% |
| $100,000 to $149,999 | 151 | 7.4% |
| $150,000 to $199,999 | 98 | 4.8% |
| $200,000+ | 84 | 4.1% |
Household Income by Householder Age in Spindale
The median household income in Spindale is $38,857, with the highest median household income of $43,939 found in the 45 to 64 years age bracket for the primary householder. A total of 754 households (36.8%) fall into this category.
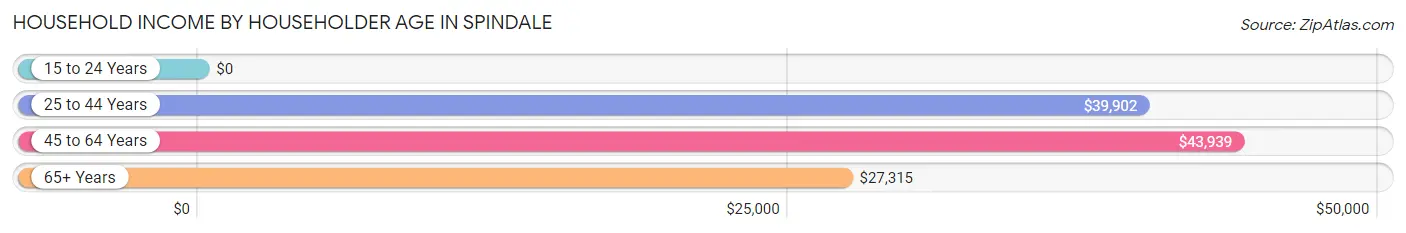
| Income Bracket | # Households | Median Income |
| 15 to 24 Years | 0 (0.0%) | $0 |
| 25 to 44 Years | 640 (31.3%) | $39,902 |
| 45 to 64 Years | 754 (36.8%) | $43,939 |
| 65+ Years | 652 (31.9%) | $27,315 |
| Total | 2,046 (100.0%) | $38,857 |
Poverty in Spindale
Income Below Poverty by Sex and Age in Spindale
With 14.0% poverty level for males and 15.3% for females among the residents of Spindale, 16 and 17 year old males and 16 and 17 year old females are the most vulnerable to poverty, with 30 males (44.8%) and 10 females (41.7%) in their respective age groups living below the poverty level.
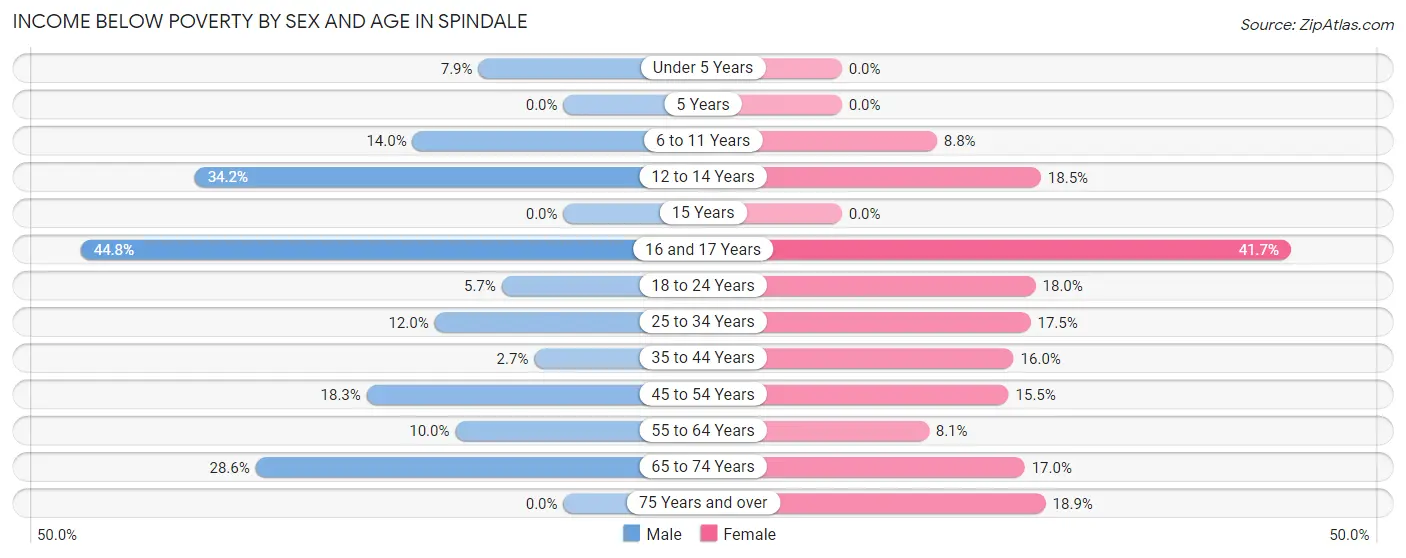
| Age Bracket | Male | Female |
| Under 5 Years | 3 (7.9%) | 0 (0.0%) |
| 5 Years | 0 (0.0%) | 0 (0.0%) |
| 6 to 11 Years | 7 (14.0%) | 6 (8.8%) |
| 12 to 14 Years | 13 (34.2%) | 17 (18.5%) |
| 15 Years | 0 (0.0%) | 0 (0.0%) |
| 16 and 17 Years | 30 (44.8%) | 10 (41.7%) |
| 18 to 24 Years | 9 (5.7%) | 25 (18.0%) |
| 25 to 34 Years | 22 (12.0%) | 48 (17.5%) |
| 35 to 44 Years | 6 (2.7%) | 56 (16.0%) |
| 45 to 54 Years | 61 (18.3%) | 39 (15.5%) |
| 55 to 64 Years | 34 (10.0%) | 28 (8.1%) |
| 65 to 74 Years | 60 (28.6%) | 82 (17.0%) |
| 75 Years and over | 0 (0.0%) | 14 (18.9%) |
| Total | 245 (14.0%) | 325 (15.3%) |
Income Above Poverty by Sex and Age in Spindale
According to the poverty statistics in Spindale, males aged 75 years and over and females aged under 5 years are the age groups that are most secure financially, with 100.0% of males and 100.0% of females in these age groups living above the poverty line.
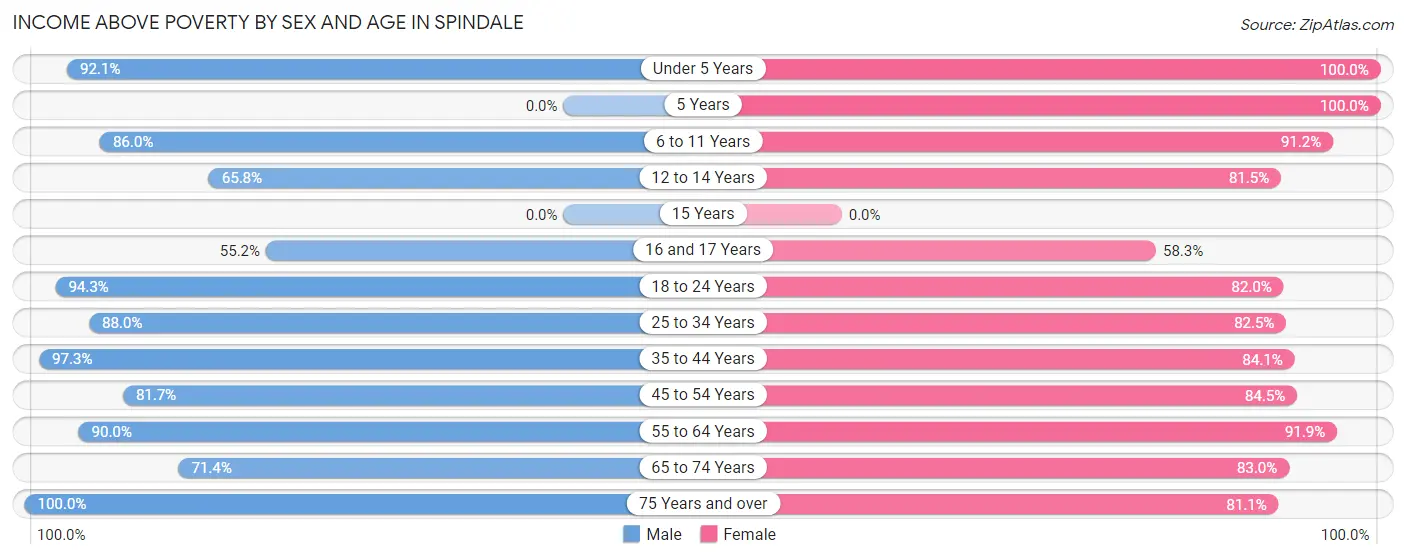
| Age Bracket | Male | Female |
| Under 5 Years | 35 (92.1%) | 8 (100.0%) |
| 5 Years | 0 (0.0%) | 7 (100.0%) |
| 6 to 11 Years | 43 (86.0%) | 62 (91.2%) |
| 12 to 14 Years | 25 (65.8%) | 75 (81.5%) |
| 15 Years | 0 (0.0%) | 0 (0.0%) |
| 16 and 17 Years | 37 (55.2%) | 14 (58.3%) |
| 18 to 24 Years | 148 (94.3%) | 114 (82.0%) |
| 25 to 34 Years | 162 (88.0%) | 226 (82.5%) |
| 35 to 44 Years | 216 (97.3%) | 295 (84.1%) |
| 45 to 54 Years | 273 (81.7%) | 213 (84.5%) |
| 55 to 64 Years | 305 (90.0%) | 319 (91.9%) |
| 65 to 74 Years | 150 (71.4%) | 401 (83.0%) |
| 75 Years and over | 113 (100.0%) | 60 (81.1%) |
| Total | 1,507 (86.0%) | 1,794 (84.7%) |
Income Below Poverty Among Married-Couple Families in Spindale
The poverty statistics for married-couple families in Spindale show that 11.7% or 84 of the total 715 families live below the poverty line. Families with 1 or 2 children have the highest poverty rate of 27.6%, comprising of 50 families. On the other hand, families with 3 or 4 children have the lowest poverty rate of 0.0%, which includes 0 families.
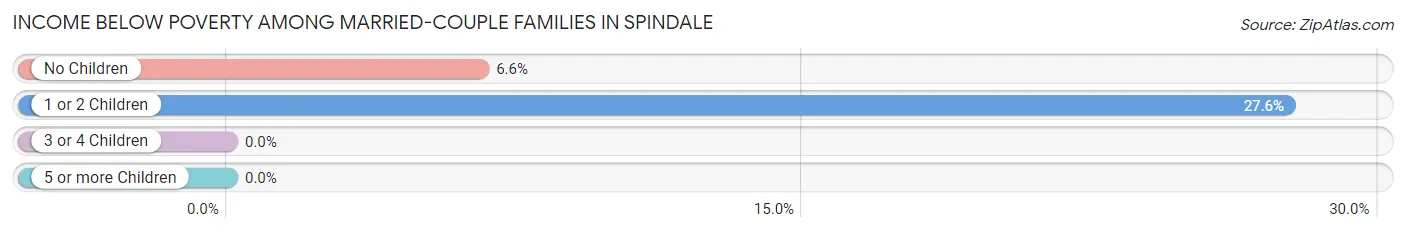
| Children | Above Poverty | Below Poverty |
| No Children | 484 (93.4%) | 34 (6.6%) |
| 1 or 2 Children | 131 (72.4%) | 50 (27.6%) |
| 3 or 4 Children | 15 (100.0%) | 0 (0.0%) |
| 5 or more Children | 1 (100.0%) | 0 (0.0%) |
| Total | 631 (88.2%) | 84 (11.7%) |
Income Below Poverty Among Single-Parent Households in Spindale
According to the poverty data in Spindale, 11.8% or 8 single-father households and 12.6% or 22 single-mother households are living below the poverty line. Among single-father households, those with 1 or 2 children have the highest poverty rate, with 8 households (47.1%) experiencing poverty. Likewise, among single-mother households, those with 1 or 2 children have the highest poverty rate, with 22 households (31.9%) falling below the poverty line.
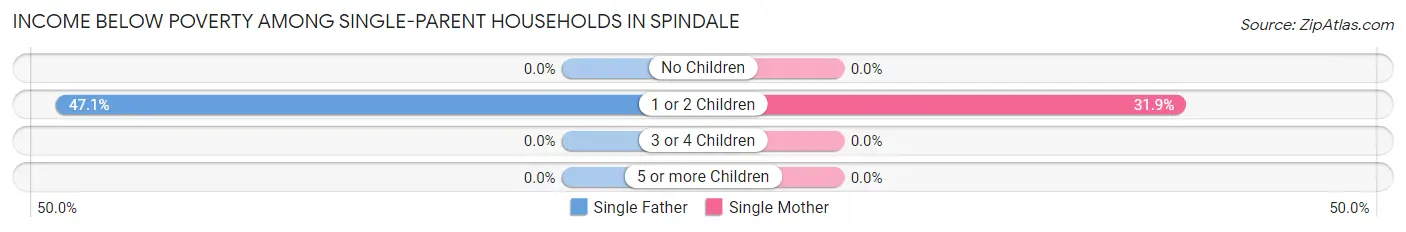
| Children | Single Father | Single Mother |
| No Children | 0 (0.0%) | 0 (0.0%) |
| 1 or 2 Children | 8 (47.1%) | 22 (31.9%) |
| 3 or 4 Children | 0 (0.0%) | 0 (0.0%) |
| 5 or more Children | 0 (0.0%) | 0 (0.0%) |
| Total | 8 (11.8%) | 22 (12.6%) |
Income Below Poverty Among Married-Couple vs Single-Parent Households in Spindale
The poverty data for Spindale shows that 84 of the married-couple family households (11.7%) and 30 of the single-parent households (12.3%) are living below the poverty level. Within the married-couple family households, those with 1 or 2 children have the highest poverty rate, with 50 households (27.6%) falling below the poverty line. Among the single-parent households, those with 1 or 2 children have the highest poverty rate, with 30 household (34.9%) living below poverty.
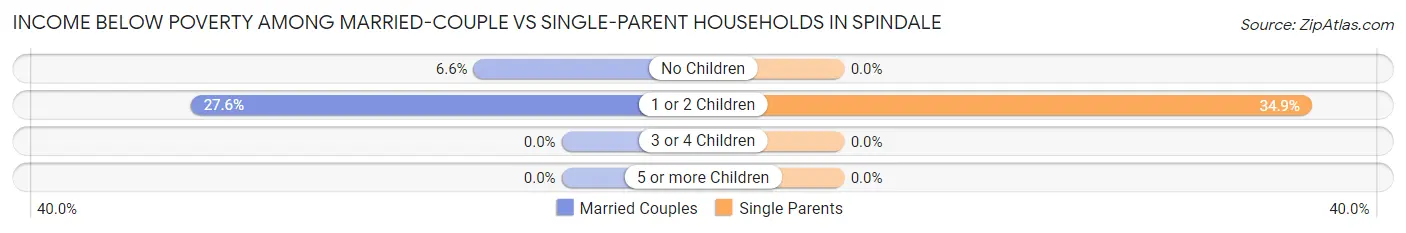
| Children | Married-Couple Families | Single-Parent Households |
| No Children | 34 (6.6%) | 0 (0.0%) |
| 1 or 2 Children | 50 (27.6%) | 30 (34.9%) |
| 3 or 4 Children | 0 (0.0%) | 0 (0.0%) |
| 5 or more Children | 0 (0.0%) | 0 (0.0%) |
| Total | 84 (11.7%) | 30 (12.3%) |
Employment Characteristics in Spindale
Employment by Class of Employer in Spindale
Among the 1,628 employed individuals in Spindale, private company employees (1,184 | 72.7%), not-for-profit organizations (134 | 8.2%), and self-employed (not incorporated) (84 | 5.2%) make up the most common classes of employment.
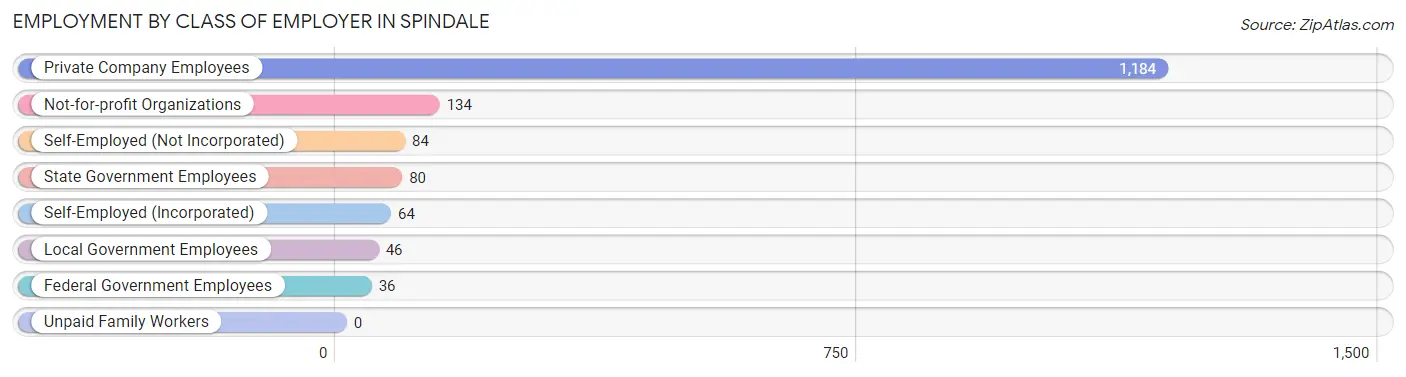
| Employer Class | # Employees | % Employees |
| Private Company Employees | 1,184 | 72.7% |
| Self-Employed (Incorporated) | 64 | 3.9% |
| Self-Employed (Not Incorporated) | 84 | 5.2% |
| Not-for-profit Organizations | 134 | 8.2% |
| Local Government Employees | 46 | 2.8% |
| State Government Employees | 80 | 4.9% |
| Federal Government Employees | 36 | 2.2% |
| Unpaid Family Workers | 0 | 0.0% |
| Total | 1,628 | 100.0% |
Employment Status by Age in Spindale
According to the labor force statistics for Spindale, out of the total population over 16 years of age (3,907), 50.3% or 1,965 individuals are in the labor force, with 8.5% or 167 of them unemployed. The age group with the highest labor force participation rate is 25 to 29 years, with 83.0% or 181 individuals in the labor force. Within the labor force, the 20 to 24 years age range has the highest percentage of unemployed individuals, with 35.2% or 57 of them being unemployed.
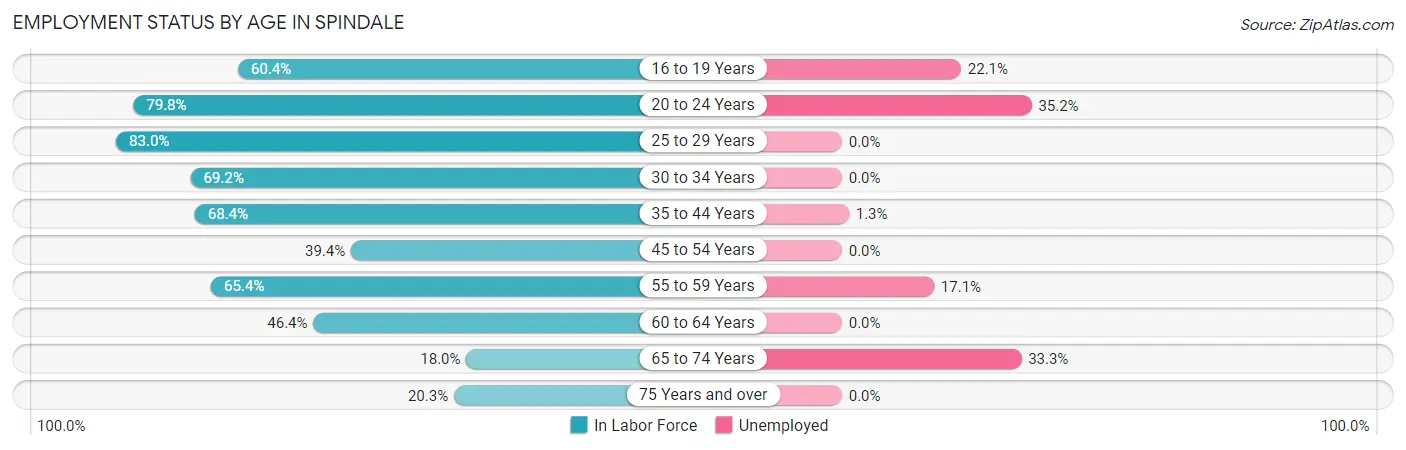
| Age Bracket | In Labor Force | Unemployed |
| 16 to 19 Years | 136 (60.4%) | 30 (22.1%) |
| 20 to 24 Years | 162 (79.8%) | 57 (35.2%) |
| 25 to 29 Years | 181 (83.0%) | 0 (0.0%) |
| 30 to 34 Years | 211 (69.2%) | 0 (0.0%) |
| 35 to 44 Years | 449 (68.4%) | 6 (1.3%) |
| 45 to 54 Years | 265 (39.4%) | 0 (0.0%) |
| 55 to 59 Years | 193 (65.4%) | 33 (17.1%) |
| 60 to 64 Years | 206 (46.4%) | 0 (0.0%) |
| 65 to 74 Years | 126 (18.0%) | 42 (33.3%) |
| 75 Years and over | 38 (20.3%) | 0 (0.0%) |
| Total | 1,965 (50.3%) | 167 (8.5%) |
Employment Status by Educational Attainment in Spindale
According to labor force statistics for Spindale, 58.1% of individuals (1,505) out of the total population between 25 and 64 years of age (2,591) are in the labor force, with 2.6% or 39 of them being unemployed. The group with the highest labor force participation rate are those with the educational attainment of bachelor's degree or higher, with 92.3% or 457 individuals in the labor force. Within the labor force, individuals with bachelor's degree or higher education have the highest percentage of unemployment, with 7.2% or 33 of them being unemployed.
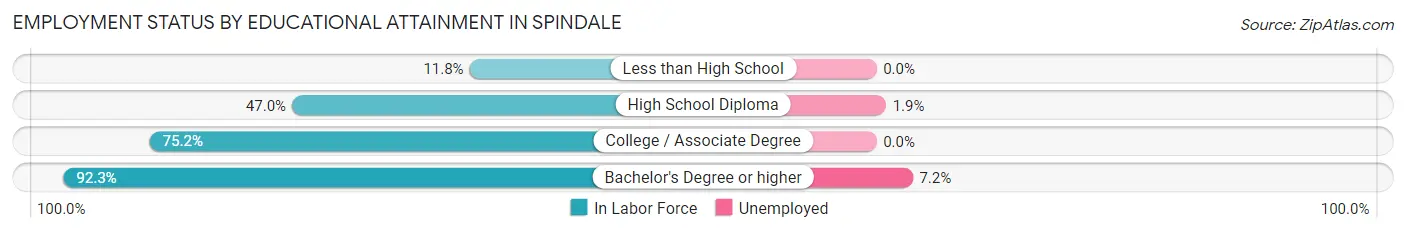
| Educational Attainment | In Labor Force | Unemployed |
| Less than High School | 63 (11.8%) | 0 (0.0%) |
| High School Diploma | 315 (47.0%) | 13 (1.9%) |
| College / Associate Degree | 670 (75.2%) | 0 (0.0%) |
| Bachelor's Degree or higher | 457 (92.3%) | 36 (7.2%) |
| Total | 1,505 (58.1%) | 67 (2.6%) |
Employment Occupations by Sex in Spindale
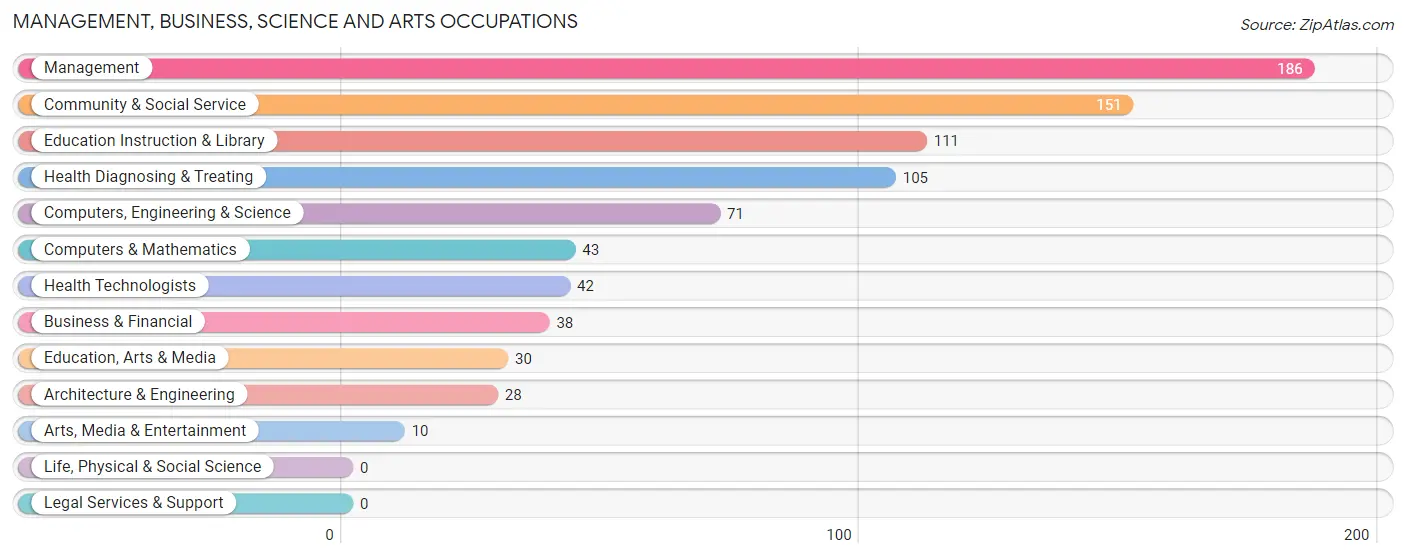
Management, Business, Science and Arts Occupations
The most common Management, Business, Science and Arts occupations in Spindale are Management (186 | 10.3%), Community & Social Service (151 | 8.4%), Education Instruction & Library (111 | 6.2%), Health Diagnosing & Treating (105 | 5.8%), and Computers, Engineering & Science (71 | 4.0%).
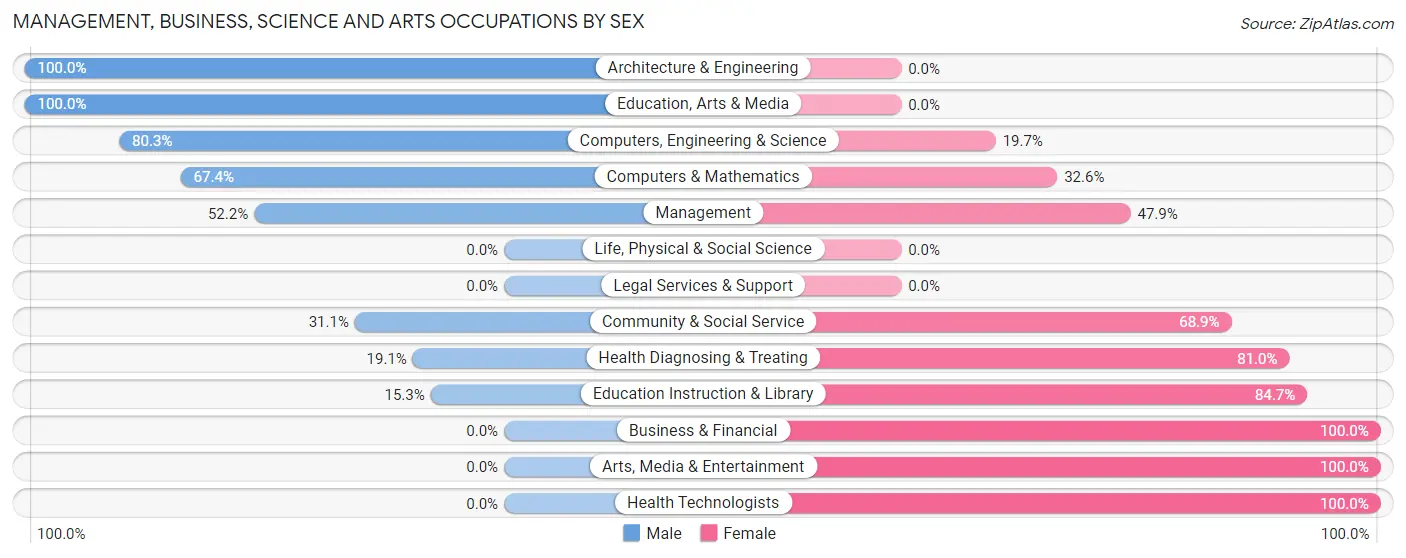
Management, Business, Science and Arts Occupations by Sex
Within the Management, Business, Science and Arts occupations in Spindale, the most male-oriented occupations are Architecture & Engineering (100.0%), Education, Arts & Media (100.0%), and Computers, Engineering & Science (80.3%), while the most female-oriented occupations are Business & Financial (100.0%), Arts, Media & Entertainment (100.0%), and Health Technologists (100.0%).
| Occupation | Male | Female |
| Management | 97 (52.1%) | 89 (47.8%) |
| Business & Financial | 0 (0.0%) | 38 (100.0%) |
| Computers, Engineering & Science | 57 (80.3%) | 14 (19.7%) |
| Computers & Mathematics | 29 (67.4%) | 14 (32.6%) |
| Architecture & Engineering | 28 (100.0%) | 0 (0.0%) |
| Life, Physical & Social Science | 0 (0.0%) | 0 (0.0%) |
| Community & Social Service | 47 (31.1%) | 104 (68.9%) |
| Education, Arts & Media | 30 (100.0%) | 0 (0.0%) |
| Legal Services & Support | 0 (0.0%) | 0 (0.0%) |
| Education Instruction & Library | 17 (15.3%) | 94 (84.7%) |
| Arts, Media & Entertainment | 0 (0.0%) | 10 (100.0%) |
| Health Diagnosing & Treating | 20 (19.1%) | 85 (80.9%) |
| Health Technologists | 0 (0.0%) | 42 (100.0%) |
| Total (Category) | 221 (40.1%) | 330 (59.9%) |
| Total (Overall) | 756 (42.0%) | 1,043 (58.0%) |
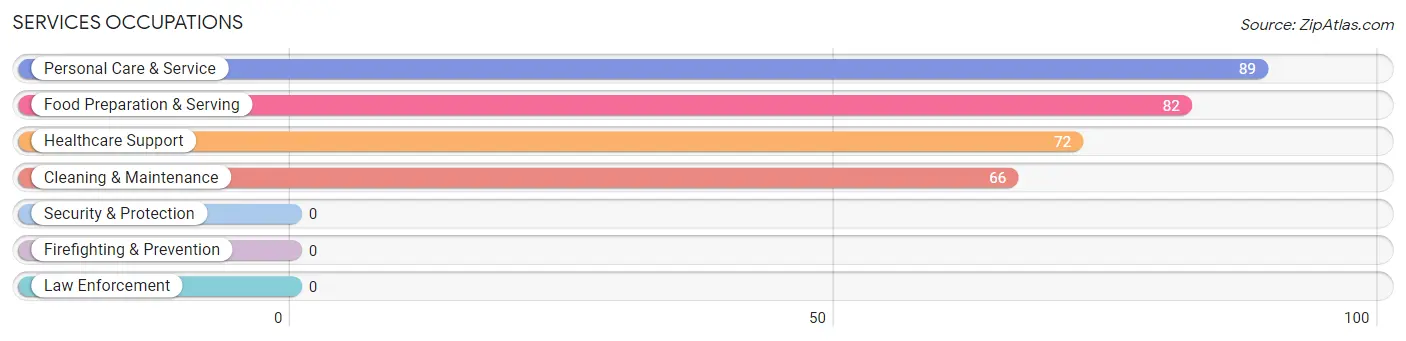
Services Occupations
The most common Services occupations in Spindale are Personal Care & Service (89 | 5.0%), Food Preparation & Serving (82 | 4.6%), Healthcare Support (72 | 4.0%), and Cleaning & Maintenance (66 | 3.7%).
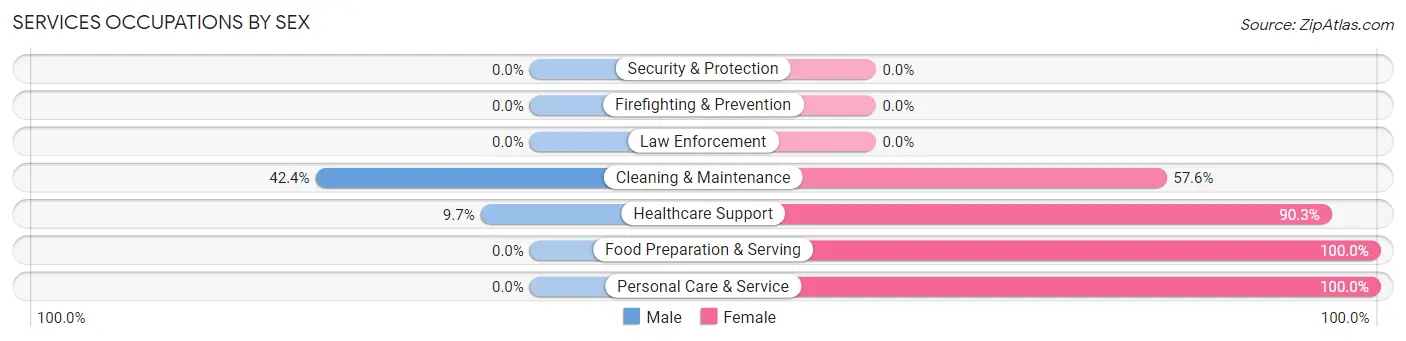
Services Occupations by Sex
Within the Services occupations in Spindale, the most male-oriented occupations are Cleaning & Maintenance (42.4%), and Healthcare Support (9.7%), while the most female-oriented occupations are Food Preparation & Serving (100.0%), Personal Care & Service (100.0%), and Healthcare Support (90.3%).
| Occupation | Male | Female |
| Healthcare Support | 7 (9.7%) | 65 (90.3%) |
| Security & Protection | 0 (0.0%) | 0 (0.0%) |
| Firefighting & Prevention | 0 (0.0%) | 0 (0.0%) |
| Law Enforcement | 0 (0.0%) | 0 (0.0%) |
| Food Preparation & Serving | 0 (0.0%) | 82 (100.0%) |
| Cleaning & Maintenance | 28 (42.4%) | 38 (57.6%) |
| Personal Care & Service | 0 (0.0%) | 89 (100.0%) |
| Total (Category) | 35 (11.3%) | 274 (88.7%) |
| Total (Overall) | 756 (42.0%) | 1,043 (58.0%) |
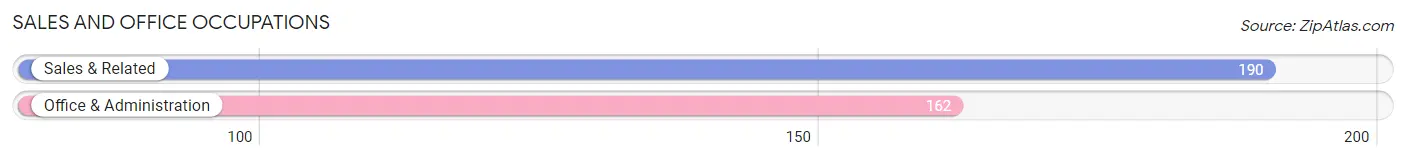
Sales and Office Occupations
The most common Sales and Office occupations in Spindale are Sales & Related (190 | 10.6%), and Office & Administration (162 | 9.0%).
Sales and Office Occupations by Sex
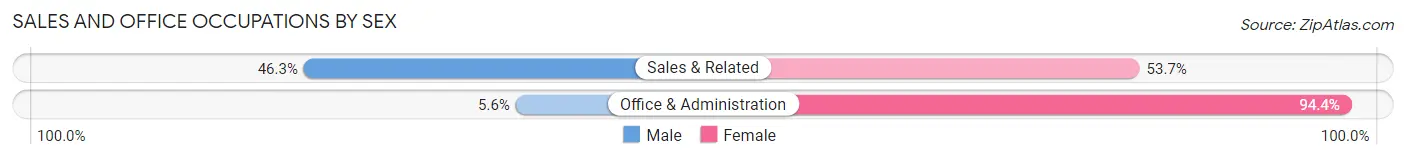
| Occupation | Male | Female |
| Sales & Related | 88 (46.3%) | 102 (53.7%) |
| Office & Administration | 9 (5.6%) | 153 (94.4%) |
| Total (Category) | 97 (27.6%) | 255 (72.4%) |
| Total (Overall) | 756 (42.0%) | 1,043 (58.0%) |
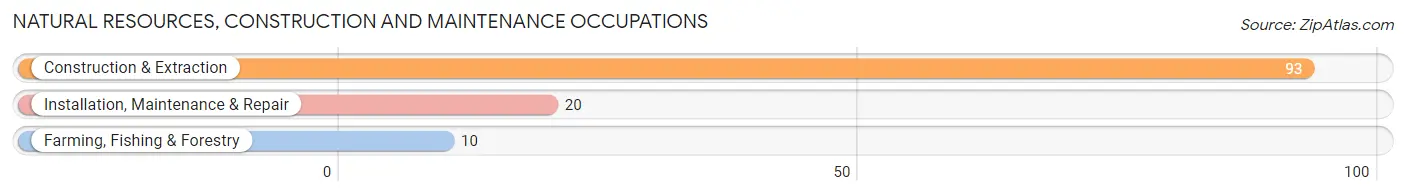
Natural Resources, Construction and Maintenance Occupations
The most common Natural Resources, Construction and Maintenance occupations in Spindale are Construction & Extraction (93 | 5.2%), Installation, Maintenance & Repair (20 | 1.1%), and Farming, Fishing & Forestry (10 | 0.6%).
Natural Resources, Construction and Maintenance Occupations by Sex
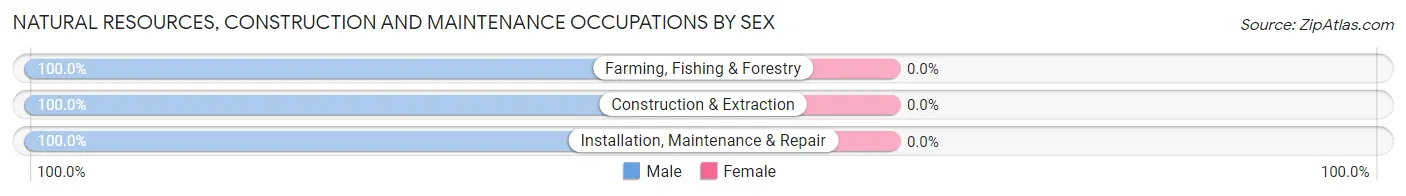
| Occupation | Male | Female |
| Farming, Fishing & Forestry | 10 (100.0%) | 0 (0.0%) |
| Construction & Extraction | 93 (100.0%) | 0 (0.0%) |
| Installation, Maintenance & Repair | 20 (100.0%) | 0 (0.0%) |
| Total (Category) | 123 (100.0%) | 0 (0.0%) |
| Total (Overall) | 756 (42.0%) | 1,043 (58.0%) |
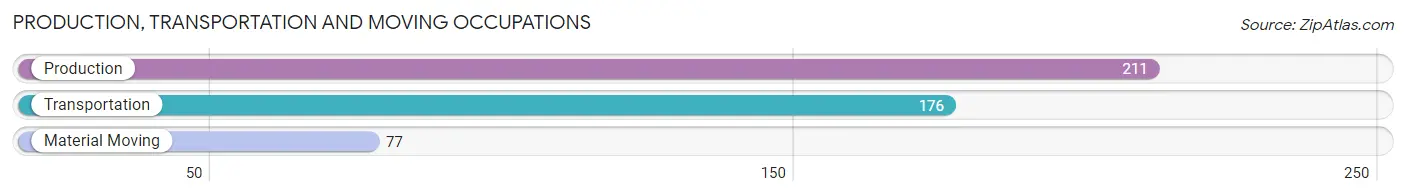
Production, Transportation and Moving Occupations
The most common Production, Transportation and Moving occupations in Spindale are Production (211 | 11.7%), Transportation (176 | 9.8%), and Material Moving (77 | 4.3%).
Production, Transportation and Moving Occupations by Sex
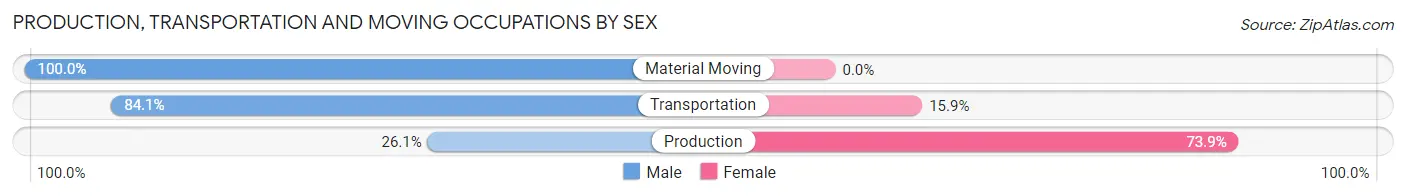
| Occupation | Male | Female |
| Production | 55 (26.1%) | 156 (73.9%) |
| Transportation | 148 (84.1%) | 28 (15.9%) |
| Material Moving | 77 (100.0%) | 0 (0.0%) |
| Total (Category) | 280 (60.3%) | 184 (39.7%) |
| Total (Overall) | 756 (42.0%) | 1,043 (58.0%) |
Employment Industries by Sex in Spindale
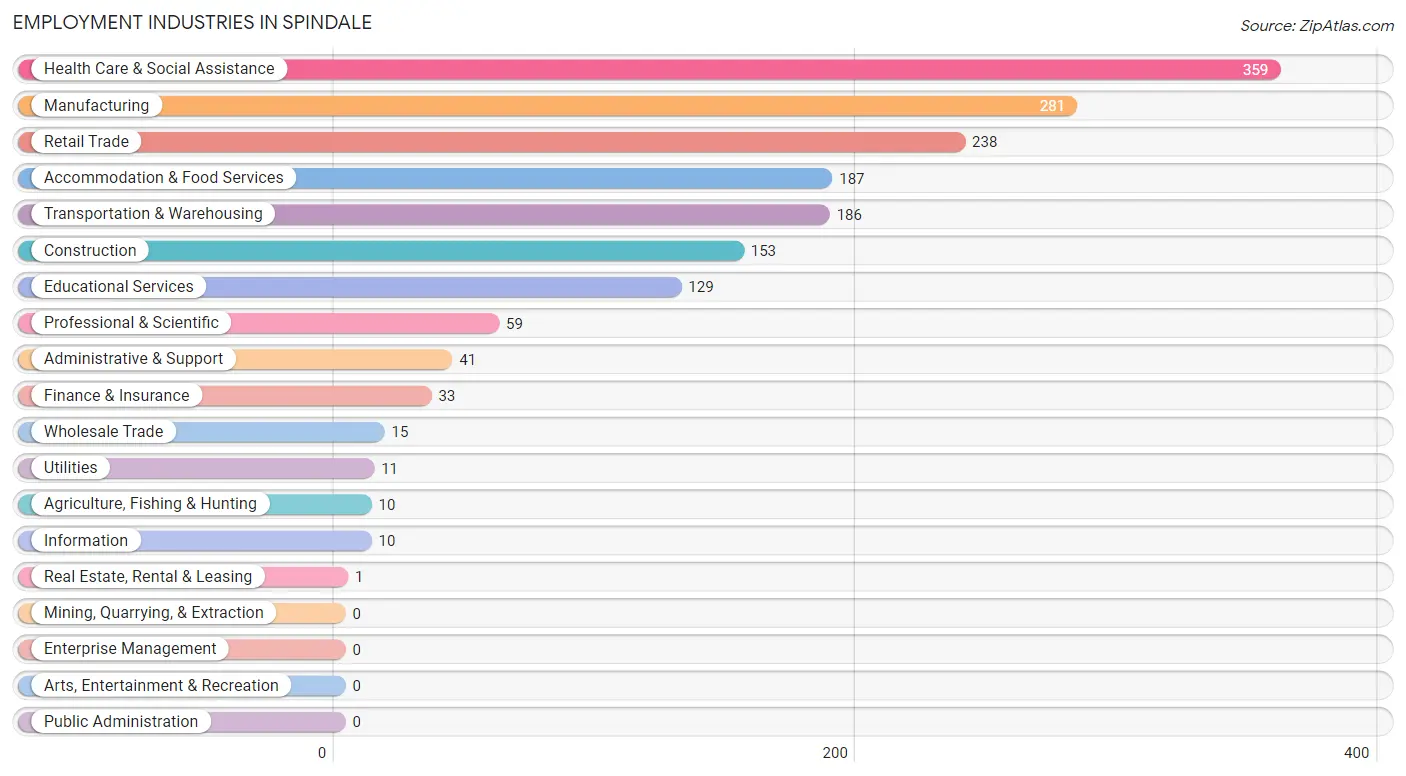
Employment Industries in Spindale
The major employment industries in Spindale include Health Care & Social Assistance (359 | 20.0%), Manufacturing (281 | 15.6%), Retail Trade (238 | 13.2%), Accommodation & Food Services (187 | 10.4%), and Transportation & Warehousing (186 | 10.3%).
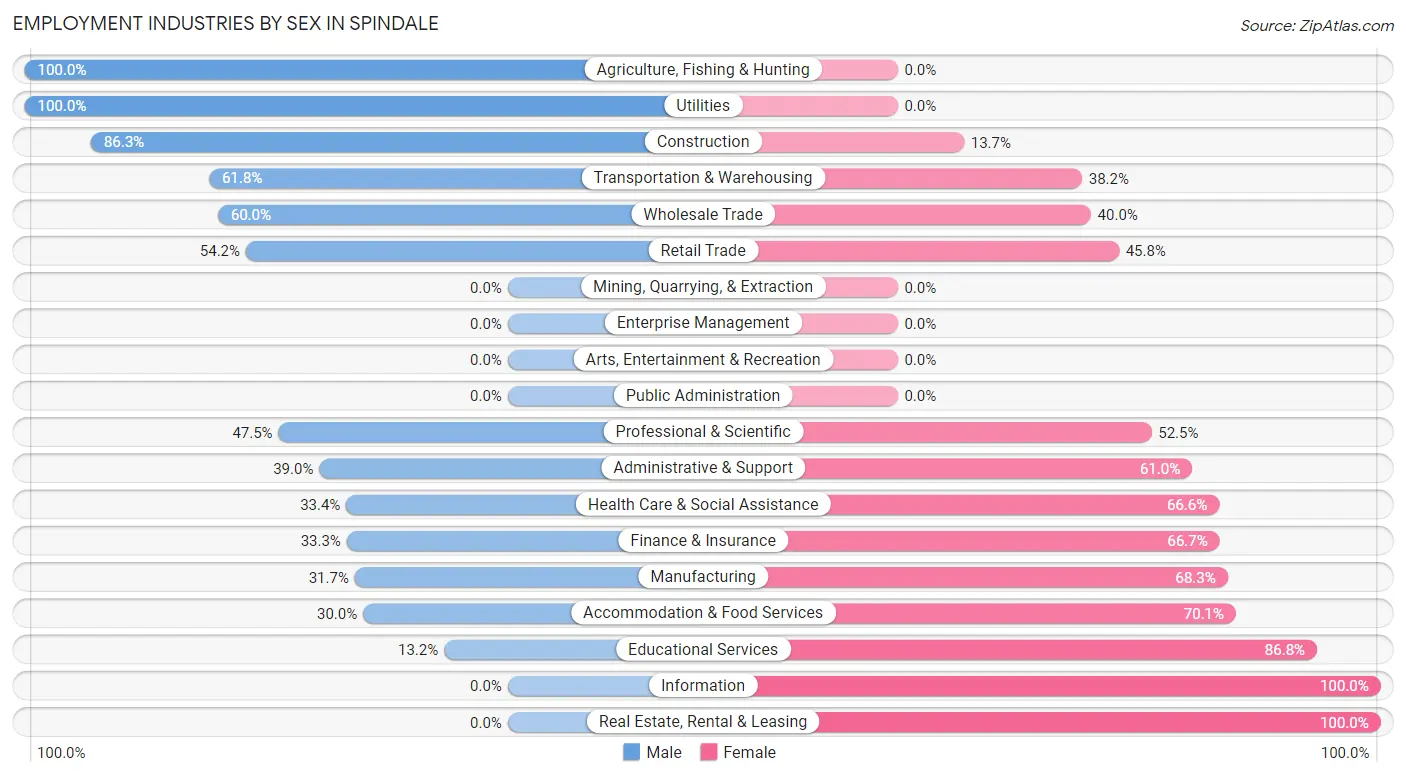
Employment Industries by Sex in Spindale
The Spindale industries that see more men than women are Agriculture, Fishing & Hunting (100.0%), Utilities (100.0%), and Construction (86.3%), whereas the industries that tend to have a higher number of women are Information (100.0%), Real Estate, Rental & Leasing (100.0%), and Educational Services (86.8%).
| Industry | Male | Female |
| Agriculture, Fishing & Hunting | 10 (100.0%) | 0 (0.0%) |
| Mining, Quarrying, & Extraction | 0 (0.0%) | 0 (0.0%) |
| Construction | 132 (86.3%) | 21 (13.7%) |
| Manufacturing | 89 (31.7%) | 192 (68.3%) |
| Wholesale Trade | 9 (60.0%) | 6 (40.0%) |
| Retail Trade | 129 (54.2%) | 109 (45.8%) |
| Transportation & Warehousing | 115 (61.8%) | 71 (38.2%) |
| Utilities | 11 (100.0%) | 0 (0.0%) |
| Information | 0 (0.0%) | 10 (100.0%) |
| Finance & Insurance | 11 (33.3%) | 22 (66.7%) |
| Real Estate, Rental & Leasing | 0 (0.0%) | 1 (100.0%) |
| Professional & Scientific | 28 (47.5%) | 31 (52.5%) |
| Enterprise Management | 0 (0.0%) | 0 (0.0%) |
| Administrative & Support | 16 (39.0%) | 25 (61.0%) |
| Educational Services | 17 (13.2%) | 112 (86.8%) |
| Health Care & Social Assistance | 120 (33.4%) | 239 (66.6%) |
| Arts, Entertainment & Recreation | 0 (0.0%) | 0 (0.0%) |
| Accommodation & Food Services | 56 (29.9%) | 131 (70.1%) |
| Public Administration | 0 (0.0%) | 0 (0.0%) |
| Total | 756 (42.0%) | 1,043 (58.0%) |
Education in Spindale
School Enrollment in Spindale
The most common levels of schooling among the 483 students in Spindale are middle school (188 | 38.9%), high school (93 | 19.3%), and graduate / professional (59 | 12.2%).
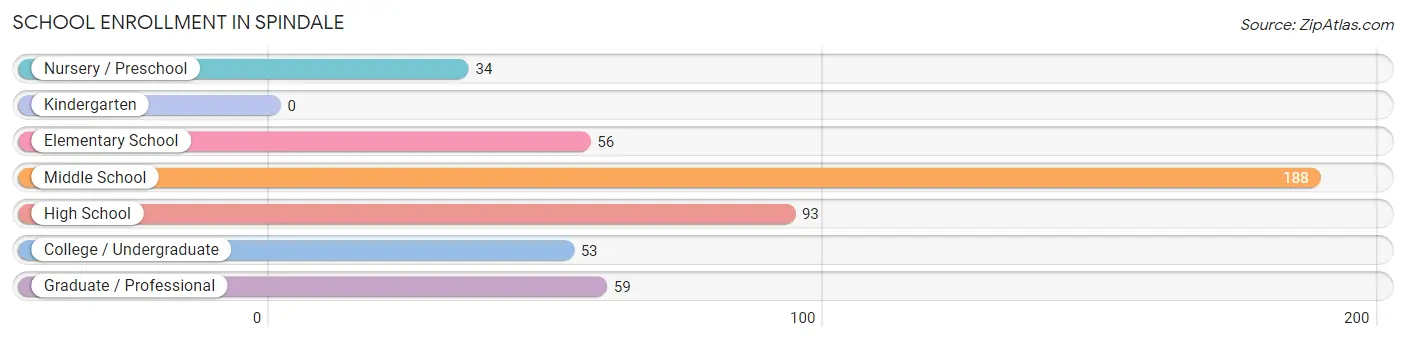
| School Level | # Students | % Students |
| Nursery / Preschool | 34 | 7.0% |
| Kindergarten | 0 | 0.0% |
| Elementary School | 56 | 11.6% |
| Middle School | 188 | 38.9% |
| High School | 93 | 19.3% |
| College / Undergraduate | 53 | 11.0% |
| Graduate / Professional | 59 | 12.2% |
| Total | 483 | 100.0% |
School Enrollment by Age by Funding Source in Spindale
Out of a total of 483 students who are enrolled in schools in Spindale, 101 (20.9%) attend a private institution, while the remaining 382 (79.1%) are enrolled in public schools. The age group of 10 to 14 year olds has the highest likelihood of being enrolled in private schools, with 71 (37.8% in the age bracket) enrolled. Conversely, the age group of 3 to 4 year olds has the lowest likelihood of being enrolled in a private school, with 34 (100.0% in the age bracket) attending a public institution.
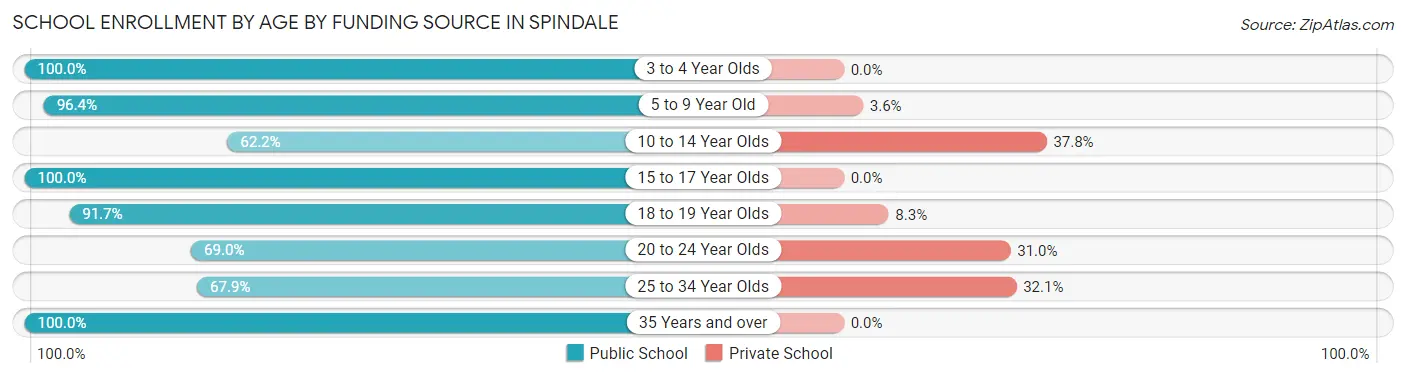
| Age Bracket | Public School | Private School |
| 3 to 4 Year Olds | 34 (100.0%) | 0 (0.0%) |
| 5 to 9 Year Old | 54 (96.4%) | 2 (3.6%) |
| 10 to 14 Year Olds | 117 (62.2%) | 71 (37.8%) |
| 15 to 17 Year Olds | 91 (100.0%) | 0 (0.0%) |
| 18 to 19 Year Olds | 11 (91.7%) | 1 (8.3%) |
| 20 to 24 Year Olds | 20 (69.0%) | 9 (31.0%) |
| 25 to 34 Year Olds | 38 (67.9%) | 18 (32.1%) |
| 35 Years and over | 17 (100.0%) | 0 (0.0%) |
| Total | 382 (79.1%) | 101 (20.9%) |
Educational Attainment by Field of Study in Spindale
Business (128 | 17.1%), education (121 | 16.2%), communications (93 | 12.4%), psychology (79 | 10.5%), and literature & languages (79 | 10.5%) are the most common fields of study among 749 individuals in Spindale who have obtained a bachelor's degree or higher.
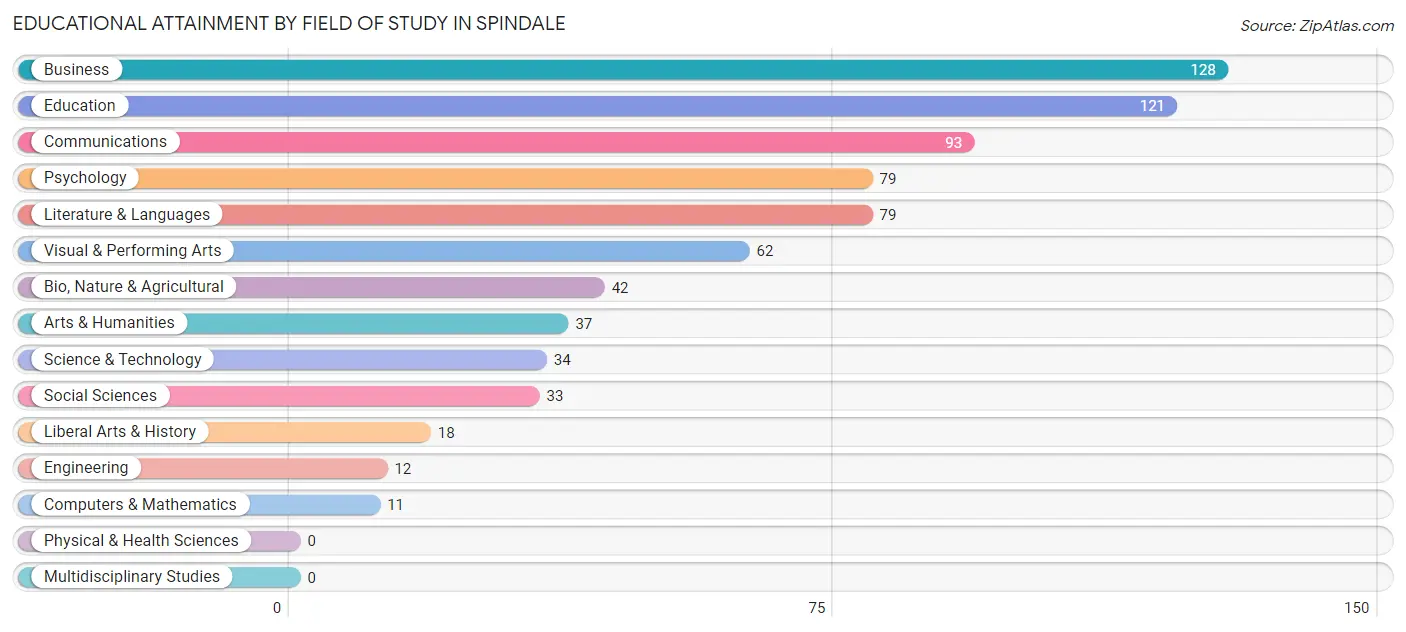
| Field of Study | # Graduates | % Graduates |
| Computers & Mathematics | 11 | 1.5% |
| Bio, Nature & Agricultural | 42 | 5.6% |
| Physical & Health Sciences | 0 | 0.0% |
| Psychology | 79 | 10.5% |
| Social Sciences | 33 | 4.4% |
| Engineering | 12 | 1.6% |
| Multidisciplinary Studies | 0 | 0.0% |
| Science & Technology | 34 | 4.5% |
| Business | 128 | 17.1% |
| Education | 121 | 16.2% |
| Literature & Languages | 79 | 10.5% |
| Liberal Arts & History | 18 | 2.4% |
| Visual & Performing Arts | 62 | 8.3% |
| Communications | 93 | 12.4% |
| Arts & Humanities | 37 | 4.9% |
| Total | 749 | 100.0% |
Transportation & Commute in Spindale
Vehicle Availability by Sex in Spindale
The most prevalent vehicle ownership categories in Spindale are males with 2 vehicles (345, accounting for 47.1%) and females with 2 vehicles (381, making up 38.6%).
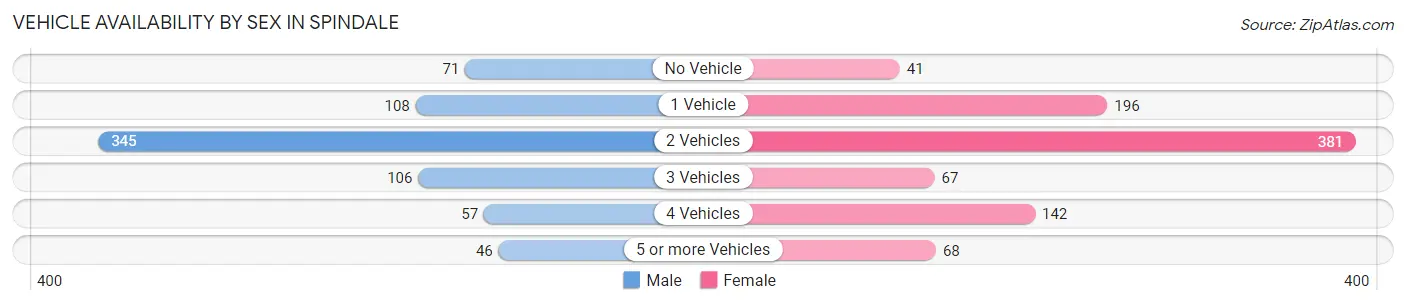
| Vehicles Available | Male | Female |
| No Vehicle | 71 (9.7%) | 41 (4.6%) |
| 1 Vehicle | 108 (14.7%) | 196 (21.9%) |
| 2 Vehicles | 345 (47.1%) | 381 (42.6%) |
| 3 Vehicles | 106 (14.5%) | 67 (7.5%) |
| 4 Vehicles | 57 (7.8%) | 142 (15.9%) |
| 5 or more Vehicles | 46 (6.3%) | 68 (7.6%) |
| Total | 733 (100.0%) | 895 (100.0%) |
Commute Time in Spindale
The most frequently occuring commute durations in Spindale are 10 to 14 minutes (365 commuters, 24.1%), 5 to 9 minutes (311 commuters, 20.5%), and 45 to 59 minutes (173 commuters, 11.4%).
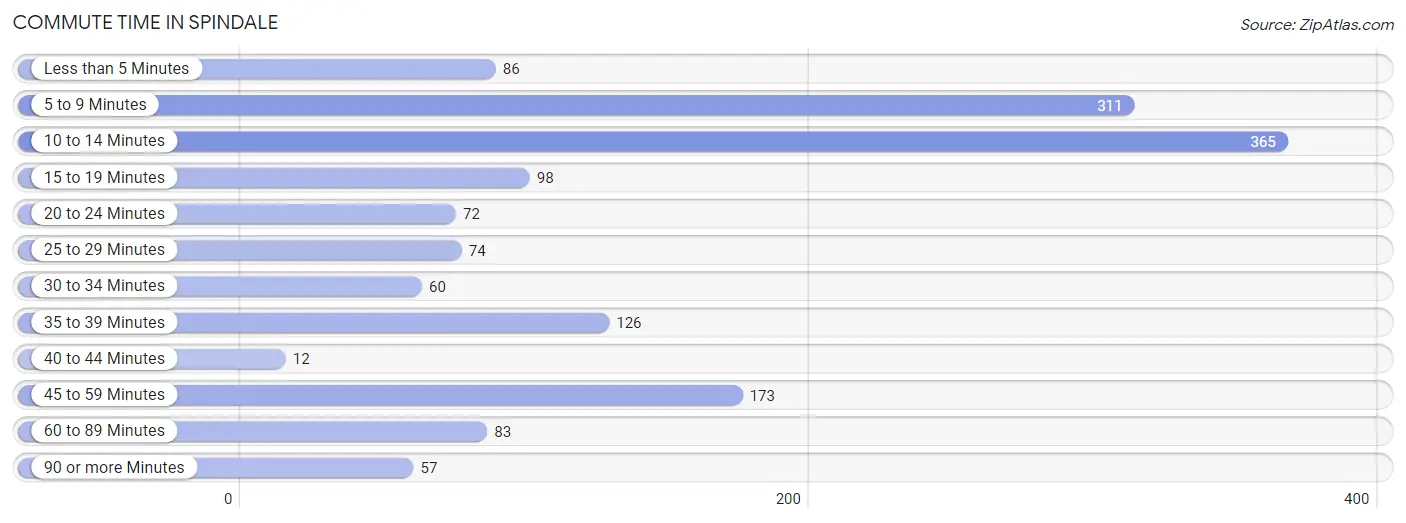
| Commute Time | # Commuters | % Commuters |
| Less than 5 Minutes | 86 | 5.7% |
| 5 to 9 Minutes | 311 | 20.5% |
| 10 to 14 Minutes | 365 | 24.1% |
| 15 to 19 Minutes | 98 | 6.5% |
| 20 to 24 Minutes | 72 | 4.8% |
| 25 to 29 Minutes | 74 | 4.9% |
| 30 to 34 Minutes | 60 | 4.0% |
| 35 to 39 Minutes | 126 | 8.3% |
| 40 to 44 Minutes | 12 | 0.8% |
| 45 to 59 Minutes | 173 | 11.4% |
| 60 to 89 Minutes | 83 | 5.5% |
| 90 or more Minutes | 57 | 3.8% |
Commute Time by Sex in Spindale
The most common commute times in Spindale are 5 to 9 minutes (152 commuters, 21.9%) for males and 10 to 14 minutes (241 commuters, 29.2%) for females.
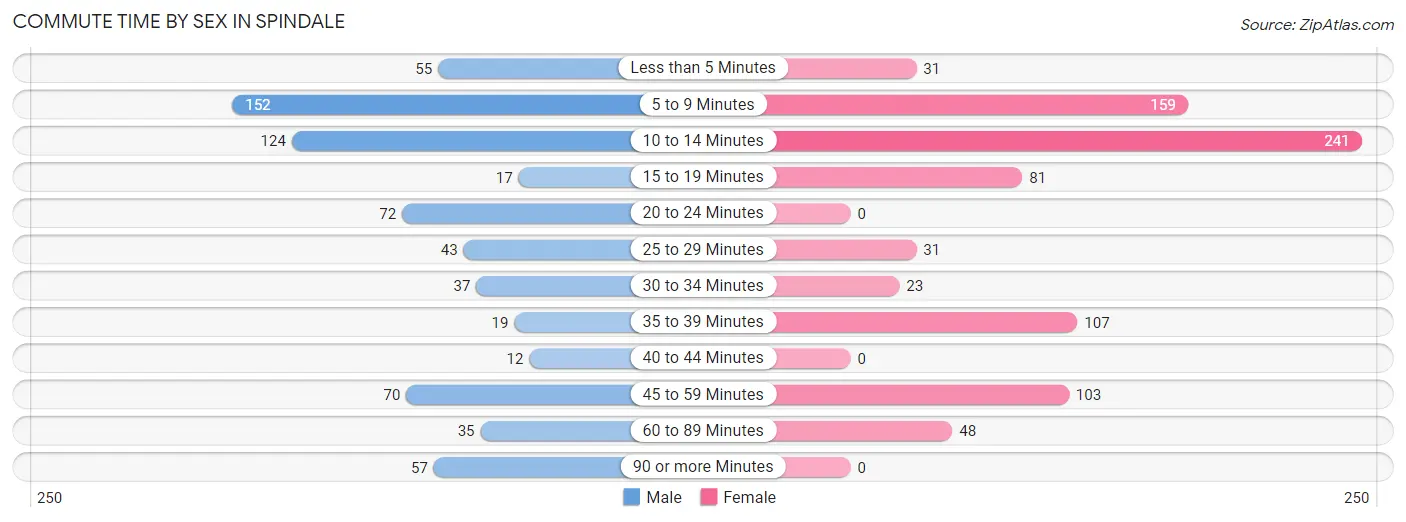
| Commute Time | Male | Female |
| Less than 5 Minutes | 55 (7.9%) | 31 (3.8%) |
| 5 to 9 Minutes | 152 (21.9%) | 159 (19.3%) |
| 10 to 14 Minutes | 124 (17.9%) | 241 (29.2%) |
| 15 to 19 Minutes | 17 (2.5%) | 81 (9.8%) |
| 20 to 24 Minutes | 72 (10.4%) | 0 (0.0%) |
| 25 to 29 Minutes | 43 (6.2%) | 31 (3.8%) |
| 30 to 34 Minutes | 37 (5.3%) | 23 (2.8%) |
| 35 to 39 Minutes | 19 (2.7%) | 107 (13.0%) |
| 40 to 44 Minutes | 12 (1.7%) | 0 (0.0%) |
| 45 to 59 Minutes | 70 (10.1%) | 103 (12.5%) |
| 60 to 89 Minutes | 35 (5.1%) | 48 (5.8%) |
| 90 or more Minutes | 57 (8.2%) | 0 (0.0%) |
Time of Departure to Work by Sex in Spindale
The most frequent times of departure to work in Spindale are 7:00 AM to 7:29 AM (113, 16.3%) for males and 8:00 AM to 8:29 AM (173, 21.0%) for females.
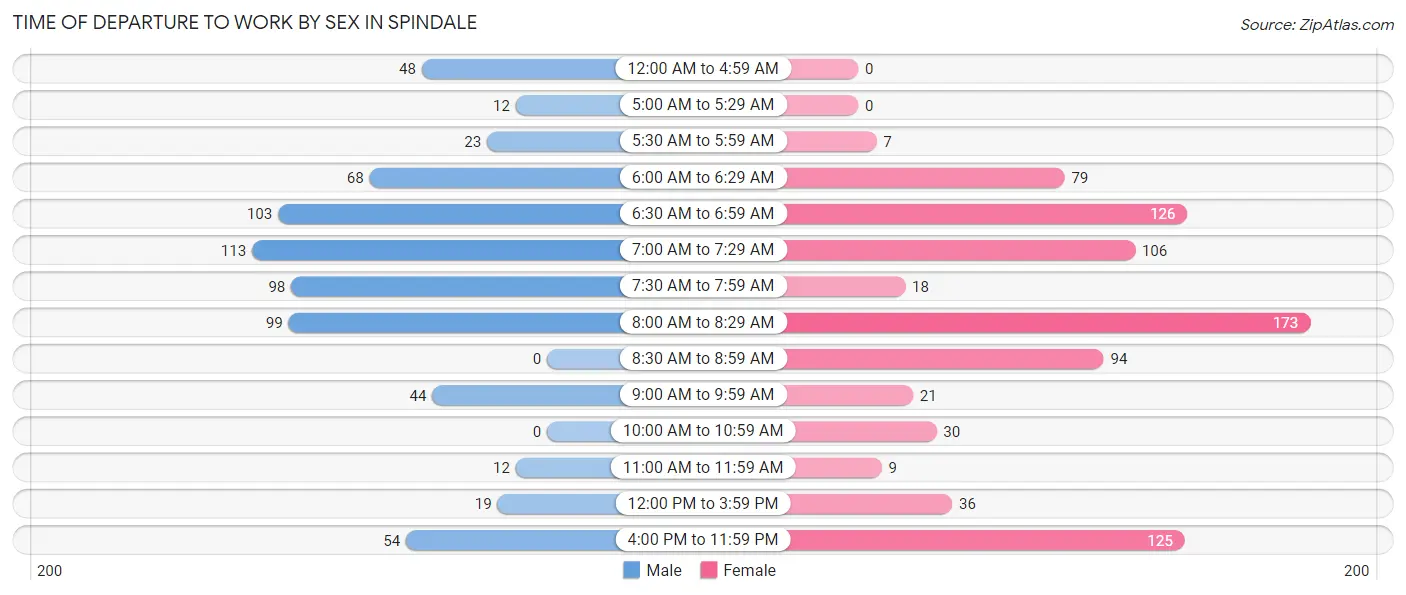
| Time of Departure | Male | Female |
| 12:00 AM to 4:59 AM | 48 (6.9%) | 0 (0.0%) |
| 5:00 AM to 5:29 AM | 12 (1.7%) | 0 (0.0%) |
| 5:30 AM to 5:59 AM | 23 (3.3%) | 7 (0.9%) |
| 6:00 AM to 6:29 AM | 68 (9.8%) | 79 (9.6%) |
| 6:30 AM to 6:59 AM | 103 (14.9%) | 126 (15.3%) |
| 7:00 AM to 7:29 AM | 113 (16.3%) | 106 (12.9%) |
| 7:30 AM to 7:59 AM | 98 (14.1%) | 18 (2.2%) |
| 8:00 AM to 8:29 AM | 99 (14.3%) | 173 (21.0%) |
| 8:30 AM to 8:59 AM | 0 (0.0%) | 94 (11.4%) |
| 9:00 AM to 9:59 AM | 44 (6.4%) | 21 (2.5%) |
| 10:00 AM to 10:59 AM | 0 (0.0%) | 30 (3.6%) |
| 11:00 AM to 11:59 AM | 12 (1.7%) | 9 (1.1%) |
| 12:00 PM to 3:59 PM | 19 (2.7%) | 36 (4.4%) |
| 4:00 PM to 11:59 PM | 54 (7.8%) | 125 (15.2%) |
| Total | 693 (100.0%) | 824 (100.0%) |
Housing Occupancy in Spindale
Occupancy by Ownership in Spindale
Of the total 2,046 dwellings in Spindale, owner-occupied units account for 928 (45.4%), while renter-occupied units make up 1,118 (54.6%).
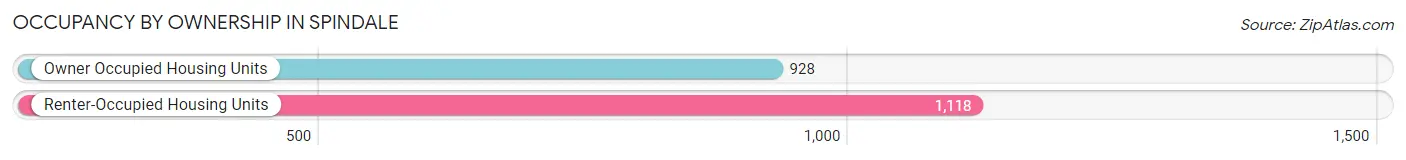
| Occupancy | # Housing Units | % Housing Units |
| Owner Occupied Housing Units | 928 | 45.4% |
| Renter-Occupied Housing Units | 1,118 | 54.6% |
| Total Occupied Housing Units | 2,046 | 100.0% |
Occupancy by Household Size in Spindale
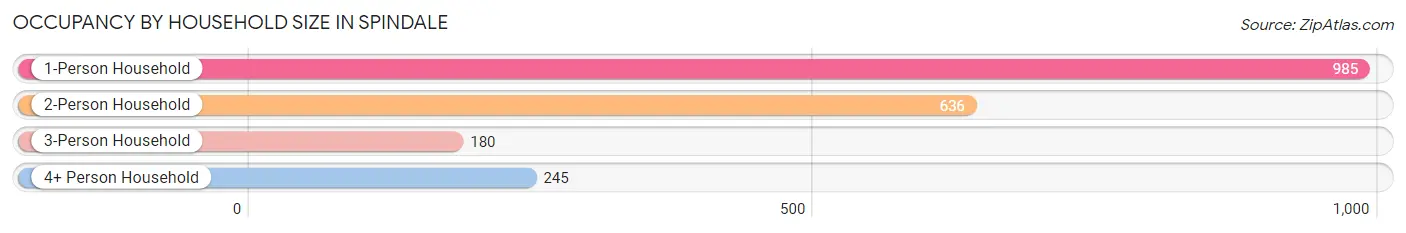
| Household Size | # Housing Units | % Housing Units |
| 1-Person Household | 985 | 48.1% |
| 2-Person Household | 636 | 31.1% |
| 3-Person Household | 180 | 8.8% |
| 4+ Person Household | 245 | 12.0% |
| Total Housing Units | 2,046 | 100.0% |
Occupancy by Ownership by Household Size in Spindale
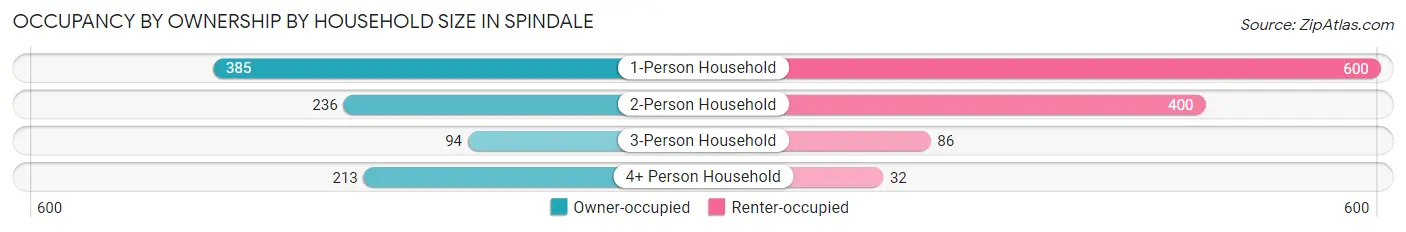
| Household Size | Owner-occupied | Renter-occupied |
| 1-Person Household | 385 (39.1%) | 600 (60.9%) |
| 2-Person Household | 236 (37.1%) | 400 (62.9%) |
| 3-Person Household | 94 (52.2%) | 86 (47.8%) |
| 4+ Person Household | 213 (86.9%) | 32 (13.1%) |
| Total Housing Units | 928 (45.4%) | 1,118 (54.6%) |
Occupancy by Educational Attainment in Spindale
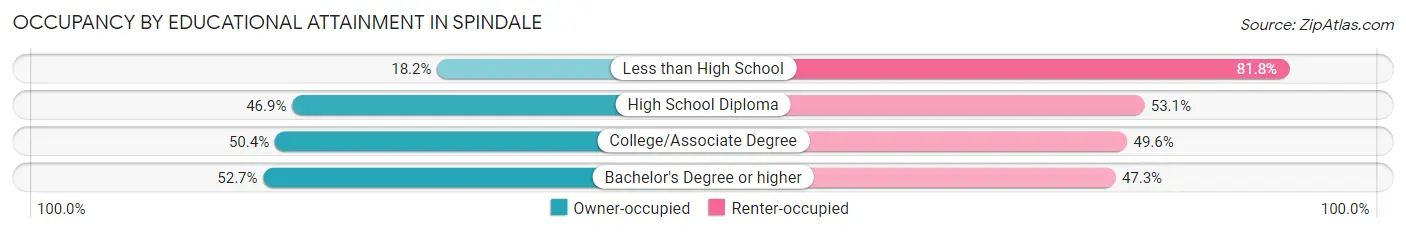
| Household Size | Owner-occupied | Renter-occupied |
| Less than High School | 54 (18.2%) | 243 (81.8%) |
| High School Diploma | 253 (46.9%) | 286 (53.1%) |
| College/Associate Degree | 354 (50.4%) | 349 (49.6%) |
| Bachelor's Degree or higher | 267 (52.7%) | 240 (47.3%) |
Occupancy by Age of Householder in Spindale
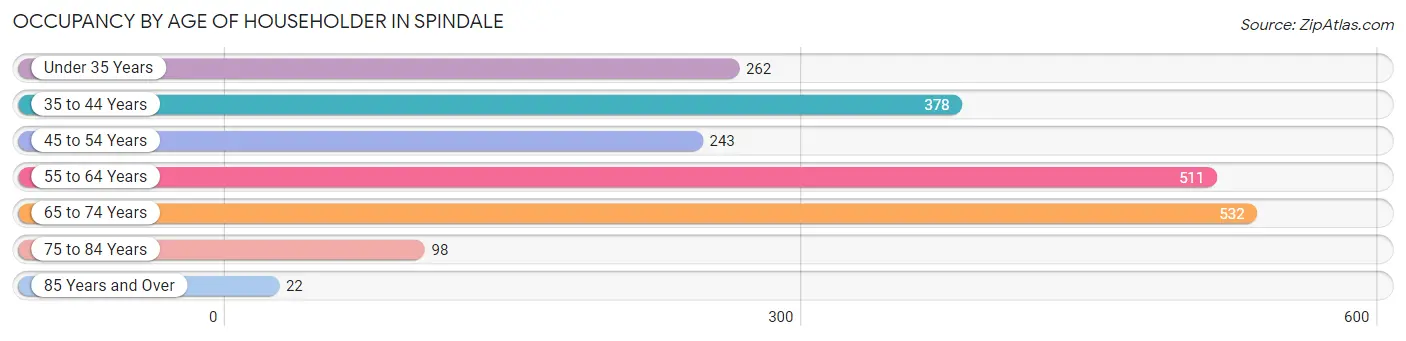
| Age Bracket | # Households | % Households |
| Under 35 Years | 262 | 12.8% |
| 35 to 44 Years | 378 | 18.5% |
| 45 to 54 Years | 243 | 11.9% |
| 55 to 64 Years | 511 | 25.0% |
| 65 to 74 Years | 532 | 26.0% |
| 75 to 84 Years | 98 | 4.8% |
| 85 Years and Over | 22 | 1.1% |
| Total | 2,046 | 100.0% |
Housing Finances in Spindale
Median Income by Occupancy in Spindale
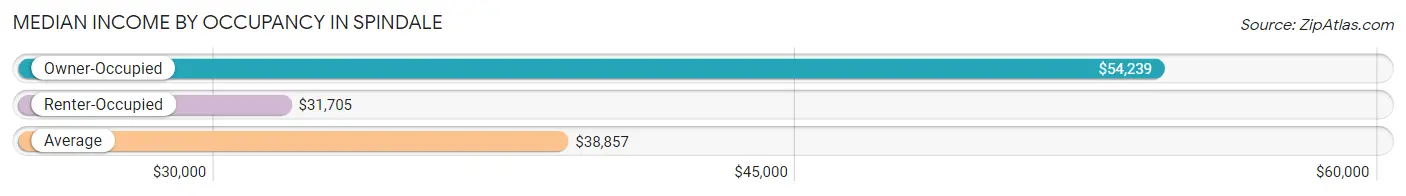
| Occupancy Type | # Households | Median Income |
| Owner-Occupied | 928 (45.4%) | $54,239 |
| Renter-Occupied | 1,118 (54.6%) | $31,705 |
| Average | 2,046 (100.0%) | $38,857 |
Occupancy by Householder Income Bracket in Spindale
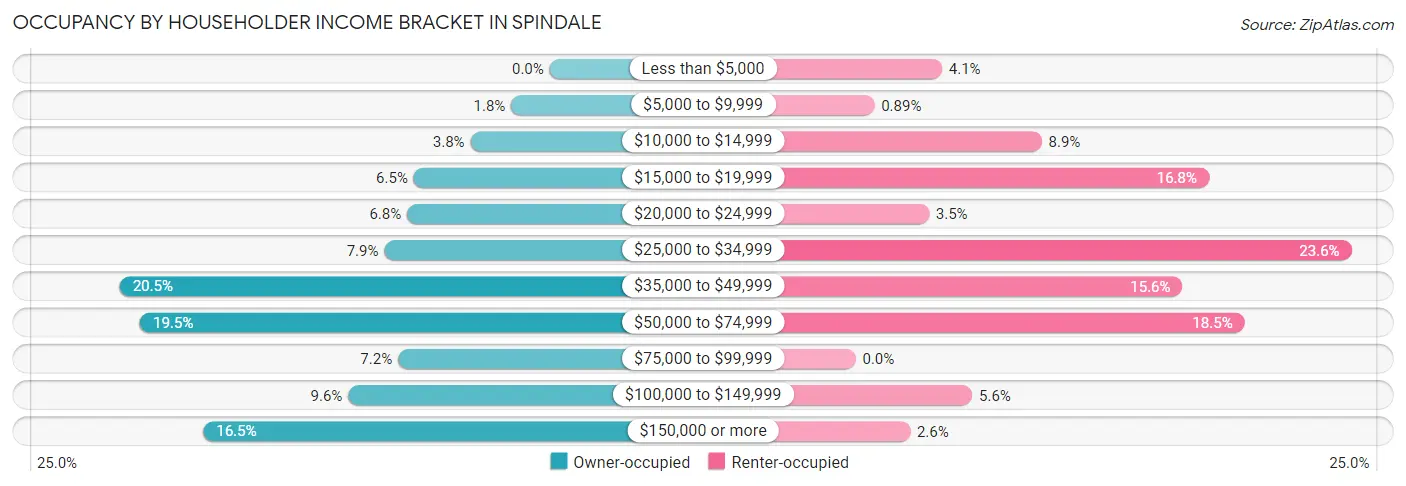
| Income Bracket | Owner-occupied | Renter-occupied |
| Less than $5,000 | 0 (0.0%) | 46 (4.1%) |
| $5,000 to $9,999 | 17 (1.8%) | 10 (0.9%) |
| $10,000 to $14,999 | 35 (3.8%) | 99 (8.9%) |
| $15,000 to $19,999 | 60 (6.5%) | 188 (16.8%) |
| $20,000 to $24,999 | 63 (6.8%) | 39 (3.5%) |
| $25,000 to $34,999 | 73 (7.9%) | 264 (23.6%) |
| $35,000 to $49,999 | 190 (20.5%) | 174 (15.6%) |
| $50,000 to $74,999 | 181 (19.5%) | 207 (18.5%) |
| $75,000 to $99,999 | 67 (7.2%) | 0 (0.0%) |
| $100,000 to $149,999 | 89 (9.6%) | 62 (5.6%) |
| $150,000 or more | 153 (16.5%) | 29 (2.6%) |
| Total | 928 (100.0%) | 1,118 (100.0%) |
Monthly Housing Cost Tiers in Spindale
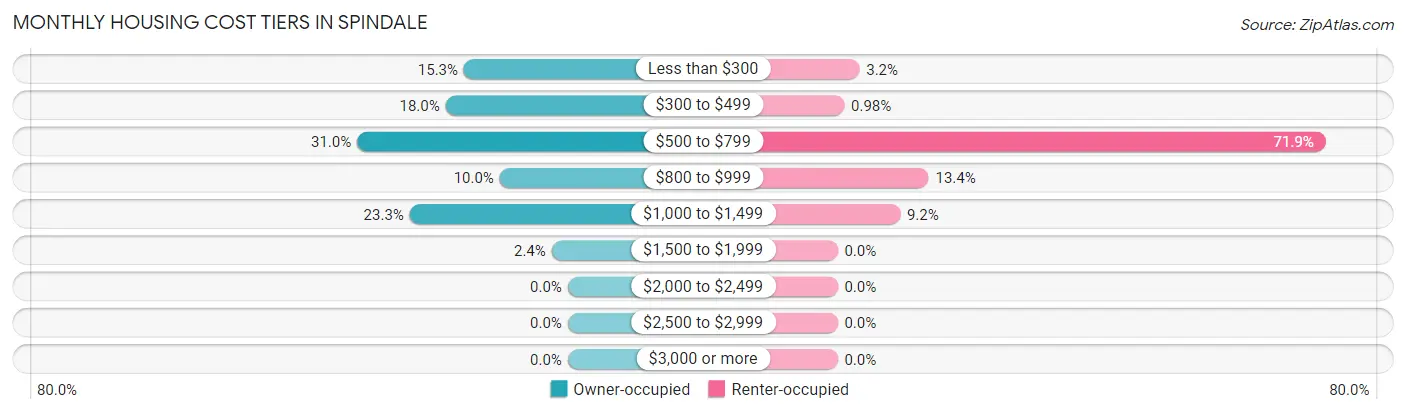
| Monthly Cost | Owner-occupied | Renter-occupied |
| Less than $300 | 142 (15.3%) | 36 (3.2%) |
| $300 to $499 | 167 (18.0%) | 11 (1.0%) |
| $500 to $799 | 288 (31.0%) | 804 (71.9%) |
| $800 to $999 | 93 (10.0%) | 150 (13.4%) |
| $1,000 to $1,499 | 216 (23.3%) | 103 (9.2%) |
| $1,500 to $1,999 | 22 (2.4%) | 0 (0.0%) |
| $2,000 to $2,499 | 0 (0.0%) | 0 (0.0%) |
| $2,500 to $2,999 | 0 (0.0%) | 0 (0.0%) |
| $3,000 or more | 0 (0.0%) | 0 (0.0%) |
| Total | 928 (100.0%) | 1,118 (100.0%) |
Physical Housing Characteristics in Spindale
Housing Structures in Spindale
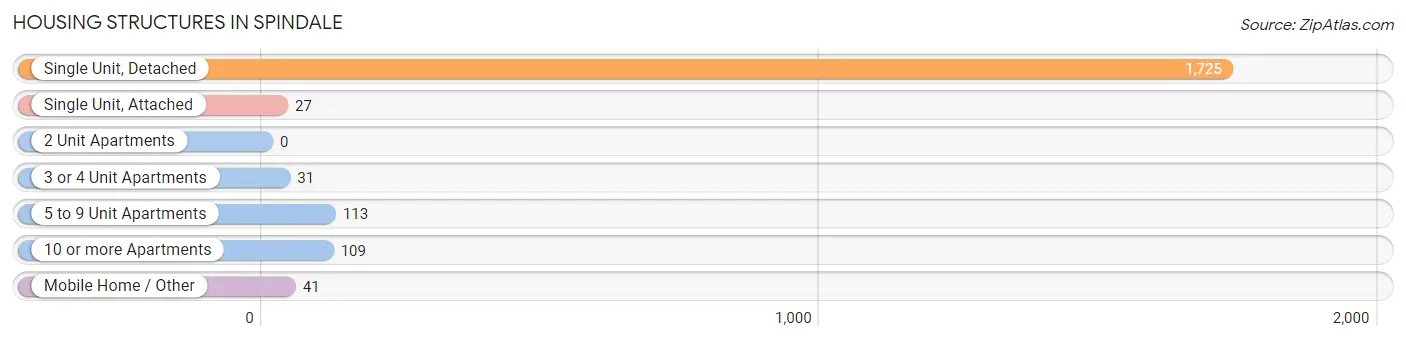
| Structure Type | # Housing Units | % Housing Units |
| Single Unit, Detached | 1,725 | 84.3% |
| Single Unit, Attached | 27 | 1.3% |
| 2 Unit Apartments | 0 | 0.0% |
| 3 or 4 Unit Apartments | 31 | 1.5% |
| 5 to 9 Unit Apartments | 113 | 5.5% |
| 10 or more Apartments | 109 | 5.3% |
| Mobile Home / Other | 41 | 2.0% |
| Total | 2,046 | 100.0% |
Housing Structures by Occupancy in Spindale
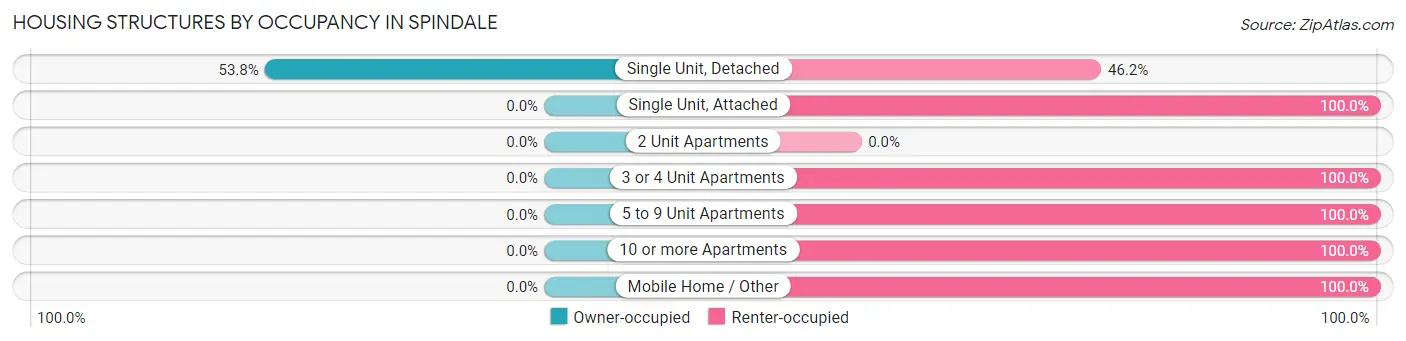
| Structure Type | Owner-occupied | Renter-occupied |
| Single Unit, Detached | 928 (53.8%) | 797 (46.2%) |
| Single Unit, Attached | 0 (0.0%) | 27 (100.0%) |
| 2 Unit Apartments | 0 (0.0%) | 0 (0.0%) |
| 3 or 4 Unit Apartments | 0 (0.0%) | 31 (100.0%) |
| 5 to 9 Unit Apartments | 0 (0.0%) | 113 (100.0%) |
| 10 or more Apartments | 0 (0.0%) | 109 (100.0%) |
| Mobile Home / Other | 0 (0.0%) | 41 (100.0%) |
| Total | 928 (45.4%) | 1,118 (54.6%) |
Housing Structures by Number of Rooms in Spindale
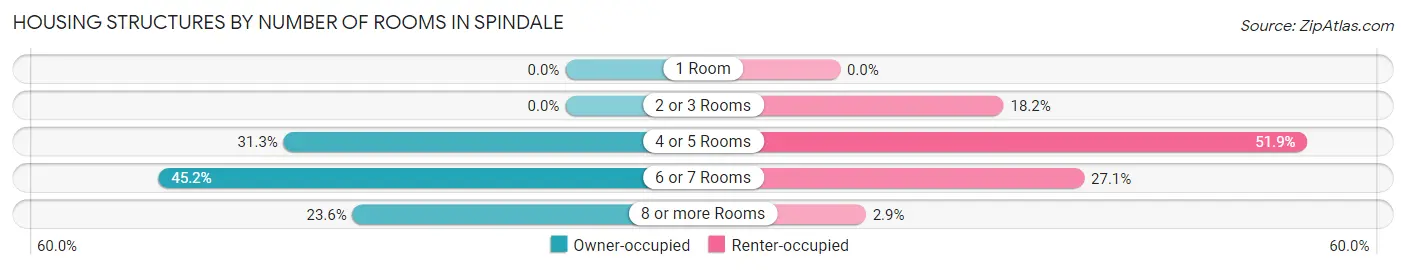
| Number of Rooms | Owner-occupied | Renter-occupied |
| 1 Room | 0 (0.0%) | 0 (0.0%) |
| 2 or 3 Rooms | 0 (0.0%) | 203 (18.2%) |
| 4 or 5 Rooms | 290 (31.2%) | 580 (51.9%) |
| 6 or 7 Rooms | 419 (45.2%) | 303 (27.1%) |
| 8 or more Rooms | 219 (23.6%) | 32 (2.9%) |
| Total | 928 (100.0%) | 1,118 (100.0%) |
Housing Structure by Heating Type in Spindale
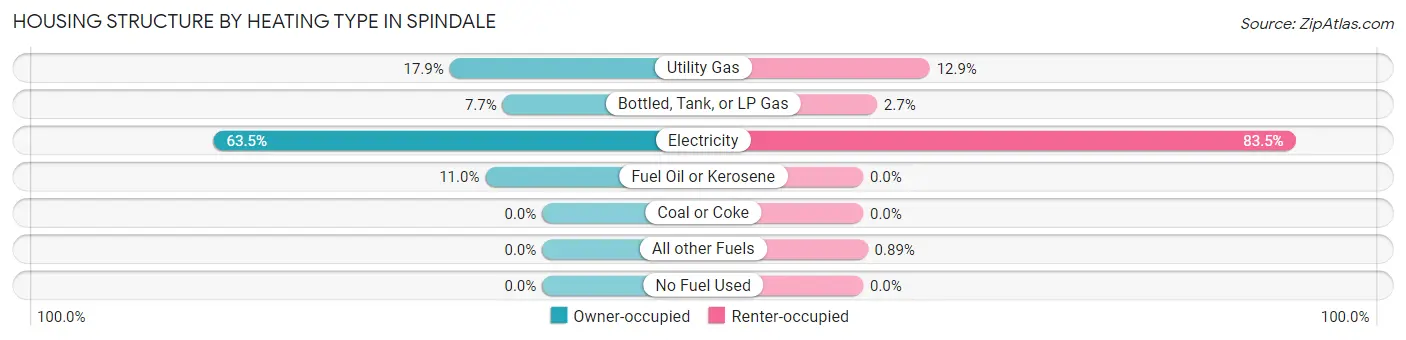
| Heating Type | Owner-occupied | Renter-occupied |
| Utility Gas | 166 (17.9%) | 144 (12.9%) |
| Bottled, Tank, or LP Gas | 71 (7.6%) | 30 (2.7%) |
| Electricity | 589 (63.5%) | 934 (83.5%) |
| Fuel Oil or Kerosene | 102 (11.0%) | 0 (0.0%) |
| Coal or Coke | 0 (0.0%) | 0 (0.0%) |
| All other Fuels | 0 (0.0%) | 10 (0.9%) |
| No Fuel Used | 0 (0.0%) | 0 (0.0%) |
| Total | 928 (100.0%) | 1,118 (100.0%) |
Household Vehicle Usage in Spindale
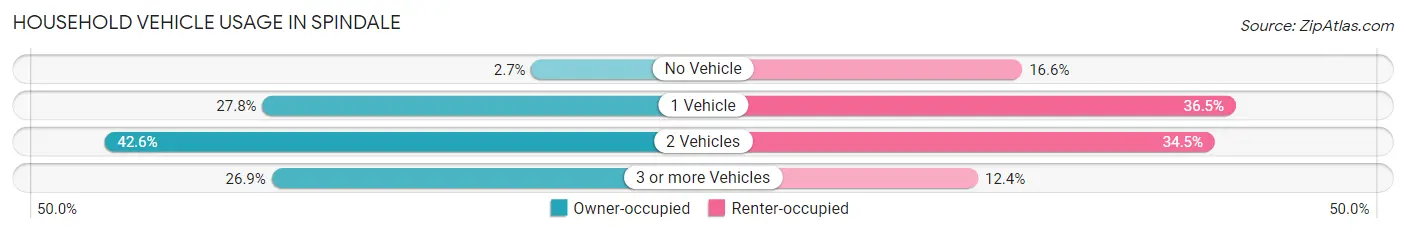
| Vehicles per Household | Owner-occupied | Renter-occupied |
| No Vehicle | 25 (2.7%) | 185 (16.6%) |
| 1 Vehicle | 258 (27.8%) | 408 (36.5%) |
| 2 Vehicles | 395 (42.6%) | 386 (34.5%) |
| 3 or more Vehicles | 250 (26.9%) | 139 (12.4%) |
| Total | 928 (100.0%) | 1,118 (100.0%) |
Real Estate & Mortgages in Spindale
Real Estate and Mortgage Overview in Spindale
| Characteristic | Without Mortgage | With Mortgage |
| Housing Units | 450 | 478 |
| Median Property Value | $90,600 | $150,000 |
| Median Household Income | $48,750 | $119 |
| Monthly Housing Costs | $422 | $0 |
| Real Estate Taxes | $955 | $44 |
Property Value by Mortgage Status in Spindale
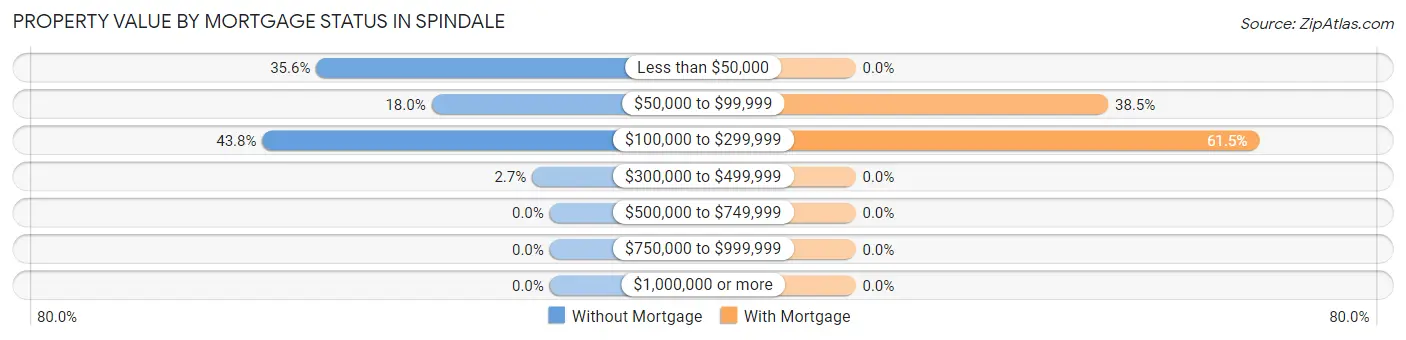
| Property Value | Without Mortgage | With Mortgage |
| Less than $50,000 | 160 (35.6%) | 0 (0.0%) |
| $50,000 to $99,999 | 81 (18.0%) | 184 (38.5%) |
| $100,000 to $299,999 | 197 (43.8%) | 294 (61.5%) |
| $300,000 to $499,999 | 12 (2.7%) | 0 (0.0%) |
| $500,000 to $749,999 | 0 (0.0%) | 0 (0.0%) |
| $750,000 to $999,999 | 0 (0.0%) | 0 (0.0%) |
| $1,000,000 or more | 0 (0.0%) | 0 (0.0%) |
| Total | 450 (100.0%) | 478 (100.0%) |
Household Income by Mortgage Status in Spindale
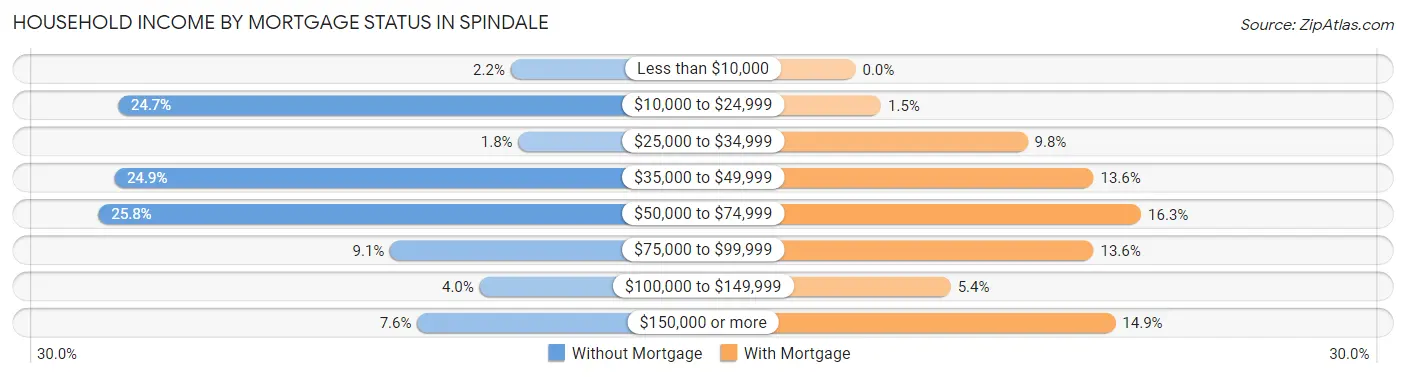
| Household Income | Without Mortgage | With Mortgage |
| Less than $10,000 | 10 (2.2%) | 0 (0.0%) |
| $10,000 to $24,999 | 111 (24.7%) | 7 (1.5%) |
| $25,000 to $34,999 | 8 (1.8%) | 47 (9.8%) |
| $35,000 to $49,999 | 112 (24.9%) | 65 (13.6%) |
| $50,000 to $74,999 | 116 (25.8%) | 78 (16.3%) |
| $75,000 to $99,999 | 41 (9.1%) | 65 (13.6%) |
| $100,000 to $149,999 | 18 (4.0%) | 26 (5.4%) |
| $150,000 or more | 34 (7.6%) | 71 (14.8%) |
| Total | 450 (100.0%) | 478 (100.0%) |
Property Value to Household Income Ratio in Spindale
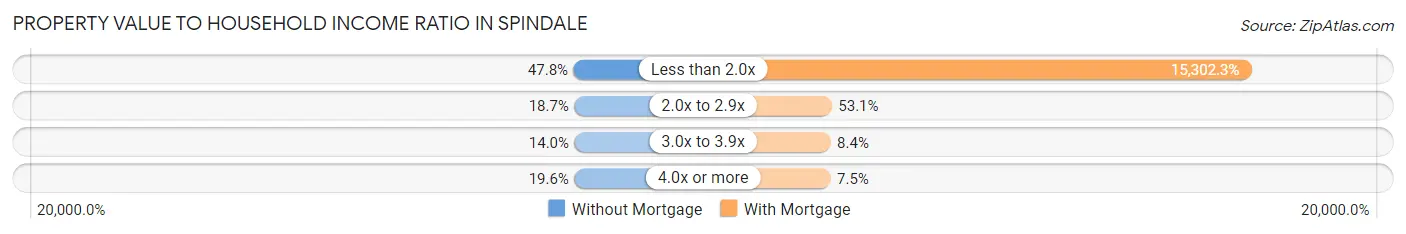
| Value-to-Income Ratio | Without Mortgage | With Mortgage |
| Less than 2.0x | 215 (47.8%) | 73,145 (15,302.3%) |
| 2.0x to 2.9x | 84 (18.7%) | 254 (53.1%) |
| 3.0x to 3.9x | 63 (14.0%) | 40 (8.4%) |
| 4.0x or more | 88 (19.6%) | 36 (7.5%) |
| Total | 450 (100.0%) | 478 (100.0%) |
Real Estate Taxes by Mortgage Status in Spindale
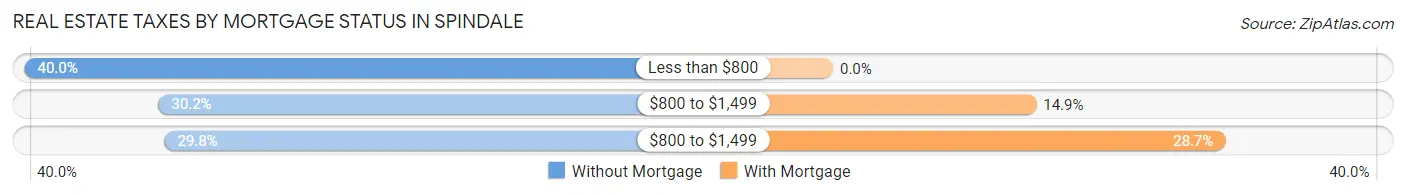
| Property Taxes | Without Mortgage | With Mortgage |
| Less than $800 | 180 (40.0%) | 0 (0.0%) |
| $800 to $1,499 | 136 (30.2%) | 71 (14.8%) |
| $800 to $1,499 | 134 (29.8%) | 137 (28.7%) |
| Total | 450 (100.0%) | 478 (100.0%) |
Health & Disability in Spindale
Health Insurance Coverage by Age in Spindale
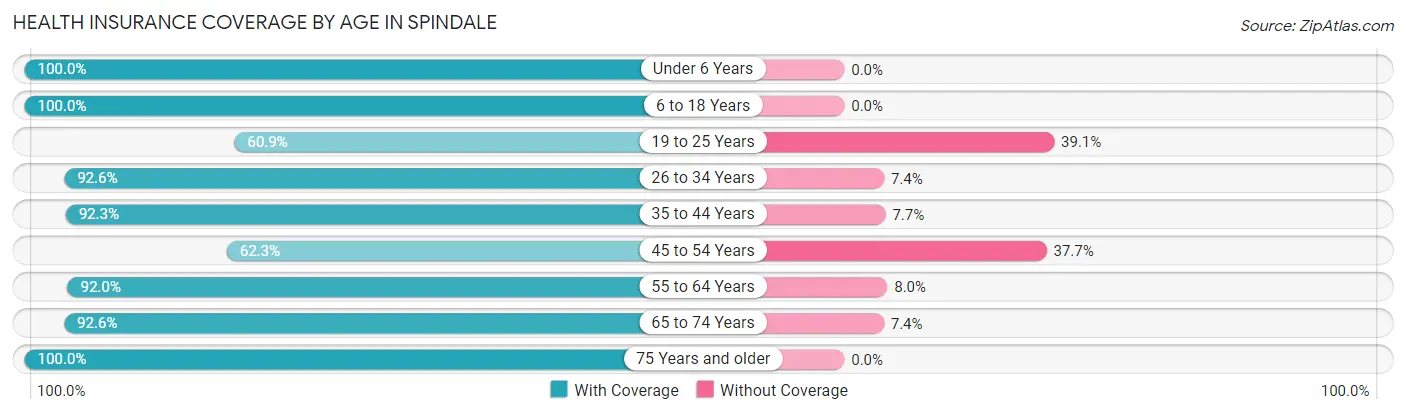
| Age Bracket | With Coverage | Without Coverage |
| Under 6 Years | 53 (100.0%) | 0 (0.0%) |
| 6 to 18 Years | 427 (100.0%) | 0 (0.0%) |
| 19 to 25 Years | 140 (60.9%) | 90 (39.1%) |
| 26 to 34 Years | 413 (92.6%) | 33 (7.4%) |
| 35 to 44 Years | 529 (92.3%) | 44 (7.7%) |
| 45 to 54 Years | 365 (62.3%) | 221 (37.7%) |
| 55 to 64 Years | 631 (92.0%) | 55 (8.0%) |
| 65 to 74 Years | 642 (92.6%) | 51 (7.4%) |
| 75 Years and older | 187 (100.0%) | 0 (0.0%) |
| Total | 3,387 (87.3%) | 494 (12.7%) |
Health Insurance Coverage by Citizenship Status in Spindale
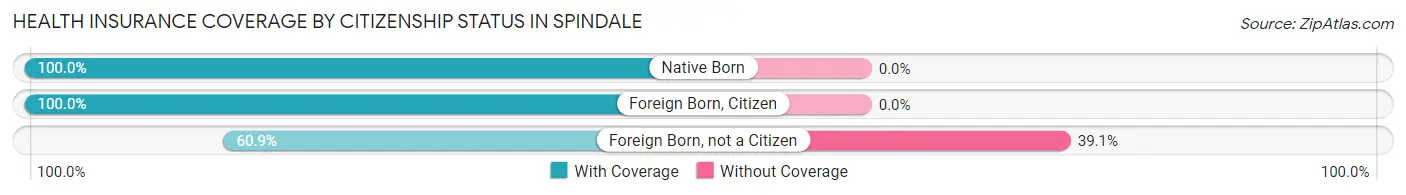
| Citizenship Status | With Coverage | Without Coverage |
| Native Born | 53 (100.0%) | 0 (0.0%) |
| Foreign Born, Citizen | 427 (100.0%) | 0 (0.0%) |
| Foreign Born, not a Citizen | 140 (60.9%) | 90 (39.1%) |
Health Insurance Coverage by Household Income in Spindale
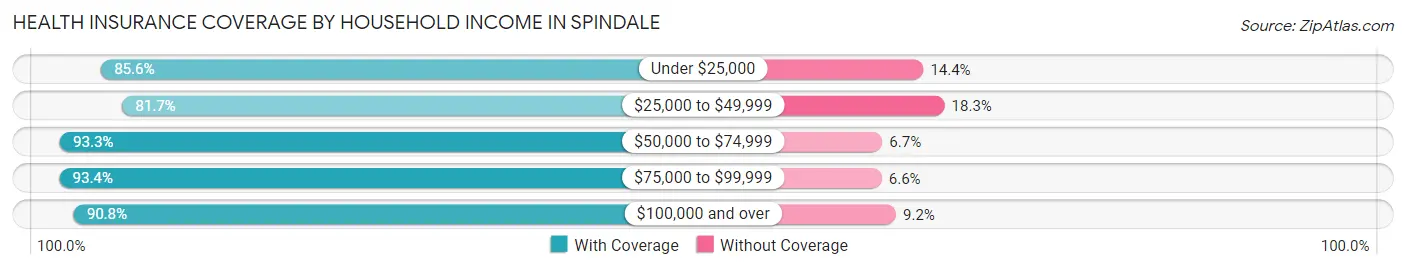
| Household Income | With Coverage | Without Coverage |
| Under $25,000 | 644 (85.6%) | 108 (14.4%) |
| $25,000 to $49,999 | 1,105 (81.7%) | 248 (18.3%) |
| $50,000 to $74,999 | 812 (93.3%) | 58 (6.7%) |
| $75,000 to $99,999 | 128 (93.4%) | 9 (6.6%) |
| $100,000 and over | 698 (90.8%) | 71 (9.2%) |
Public vs Private Health Insurance Coverage by Age in Spindale
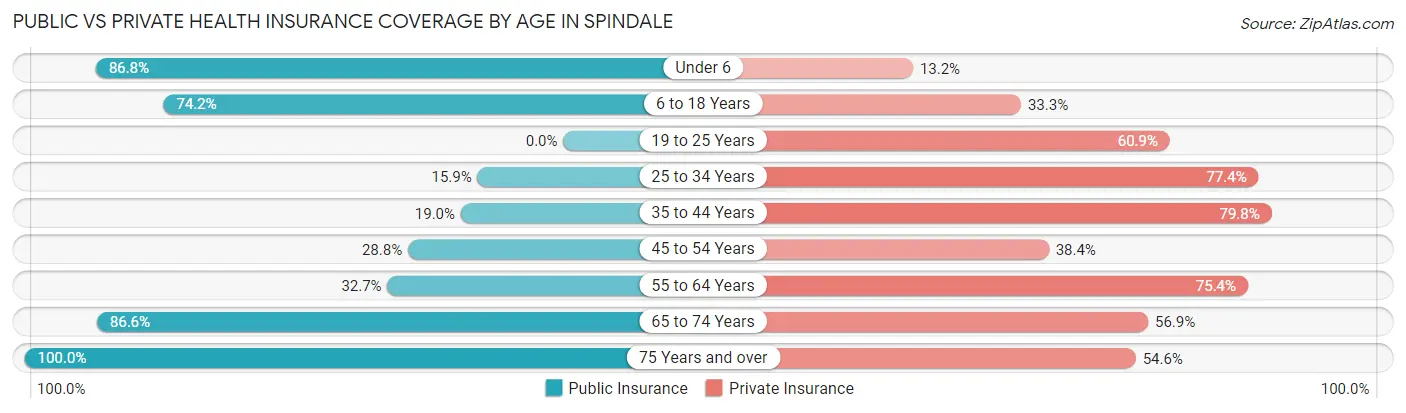
| Age Bracket | Public Insurance | Private Insurance |
| Under 6 | 46 (86.8%) | 7 (13.2%) |
| 6 to 18 Years | 317 (74.2%) | 142 (33.3%) |
| 19 to 25 Years | 0 (0.0%) | 140 (60.9%) |
| 25 to 34 Years | 71 (15.9%) | 345 (77.3%) |
| 35 to 44 Years | 109 (19.0%) | 457 (79.8%) |
| 45 to 54 Years | 169 (28.8%) | 225 (38.4%) |
| 55 to 64 Years | 224 (32.7%) | 517 (75.4%) |
| 65 to 74 Years | 600 (86.6%) | 394 (56.9%) |
| 75 Years and over | 187 (100.0%) | 102 (54.5%) |
| Total | 1,723 (44.4%) | 2,329 (60.0%) |
Disability Status by Sex by Age in Spindale
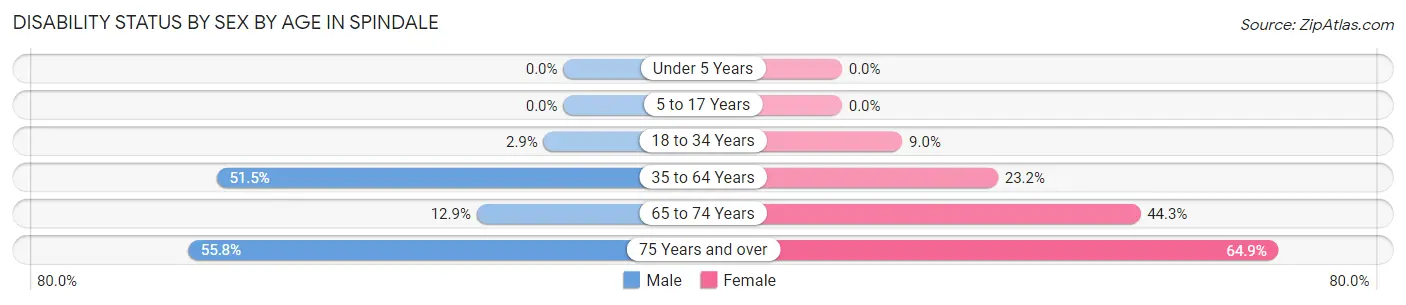
| Age Bracket | Male | Female |
| Under 5 Years | 0 (0.0%) | 0 (0.0%) |
| 5 to 17 Years | 0 (0.0%) | 0 (0.0%) |
| 18 to 34 Years | 10 (2.9%) | 37 (9.0%) |
| 35 to 64 Years | 461 (51.5%) | 220 (23.2%) |
| 65 to 74 Years | 27 (12.9%) | 214 (44.3%) |
| 75 Years and over | 63 (55.7%) | 48 (64.9%) |
Disability Class by Sex by Age in Spindale
Disability Class: Hearing Difficulty
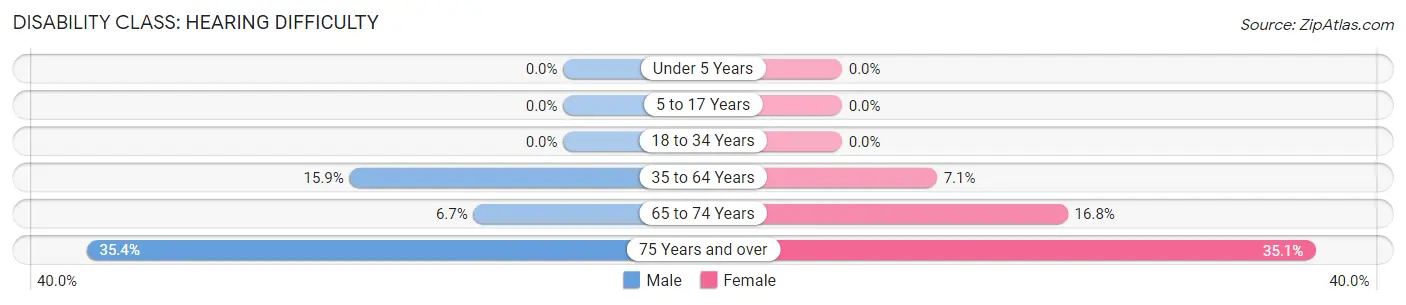
| Age Bracket | Male | Female |
| Under 5 Years | 0 (0.0%) | 0 (0.0%) |
| 5 to 17 Years | 0 (0.0%) | 0 (0.0%) |
| 18 to 34 Years | 0 (0.0%) | 0 (0.0%) |
| 35 to 64 Years | 142 (15.9%) | 67 (7.0%) |
| 65 to 74 Years | 14 (6.7%) | 81 (16.8%) |
| 75 Years and over | 40 (35.4%) | 26 (35.1%) |
Disability Class: Vision Difficulty
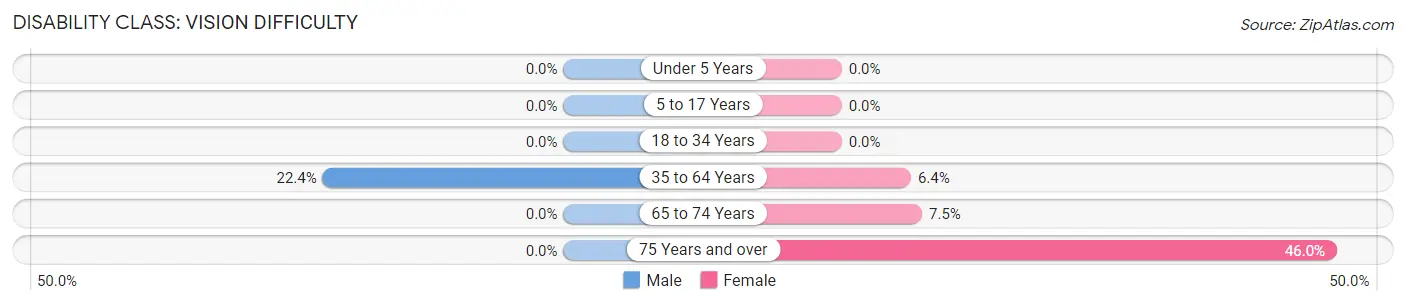
| Age Bracket | Male | Female |
| Under 5 Years | 0 (0.0%) | 0 (0.0%) |
| 5 to 17 Years | 0 (0.0%) | 0 (0.0%) |
| 18 to 34 Years | 0 (0.0%) | 0 (0.0%) |
| 35 to 64 Years | 200 (22.4%) | 61 (6.4%) |
| 65 to 74 Years | 0 (0.0%) | 36 (7.4%) |
| 75 Years and over | 0 (0.0%) | 34 (46.0%) |
Disability Class: Cognitive Difficulty
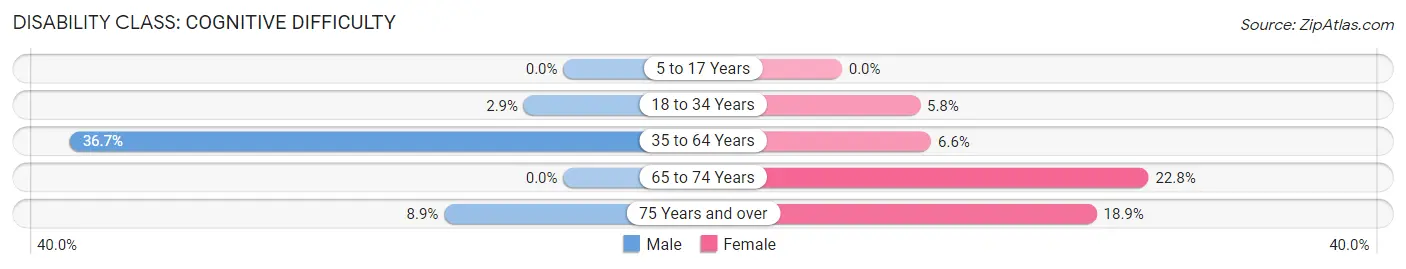
| Age Bracket | Male | Female |
| 5 to 17 Years | 0 (0.0%) | 0 (0.0%) |
| 18 to 34 Years | 10 (2.9%) | 24 (5.8%) |
| 35 to 64 Years | 328 (36.6%) | 63 (6.6%) |
| 65 to 74 Years | 0 (0.0%) | 110 (22.8%) |
| 75 Years and over | 10 (8.8%) | 14 (18.9%) |
Disability Class: Ambulatory Difficulty
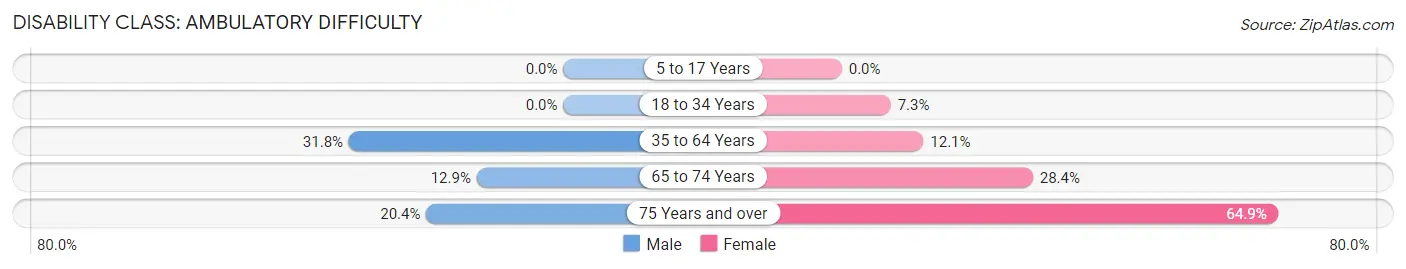
| Age Bracket | Male | Female |
| 5 to 17 Years | 0 (0.0%) | 0 (0.0%) |
| 18 to 34 Years | 0 (0.0%) | 30 (7.3%) |
| 35 to 64 Years | 285 (31.8%) | 115 (12.1%) |
| 65 to 74 Years | 27 (12.9%) | 137 (28.4%) |
| 75 Years and over | 23 (20.3%) | 48 (64.9%) |
Disability Class: Self-Care Difficulty
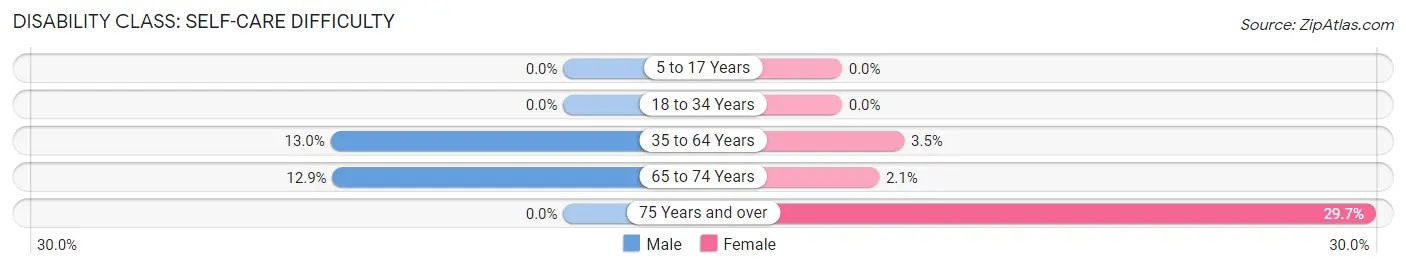
| Age Bracket | Male | Female |
| 5 to 17 Years | 0 (0.0%) | 0 (0.0%) |
| 18 to 34 Years | 0 (0.0%) | 0 (0.0%) |
| 35 to 64 Years | 116 (13.0%) | 33 (3.5%) |
| 65 to 74 Years | 27 (12.9%) | 10 (2.1%) |
| 75 Years and over | 0 (0.0%) | 22 (29.7%) |
Technology Access in Spindale
Computing Device Access in Spindale
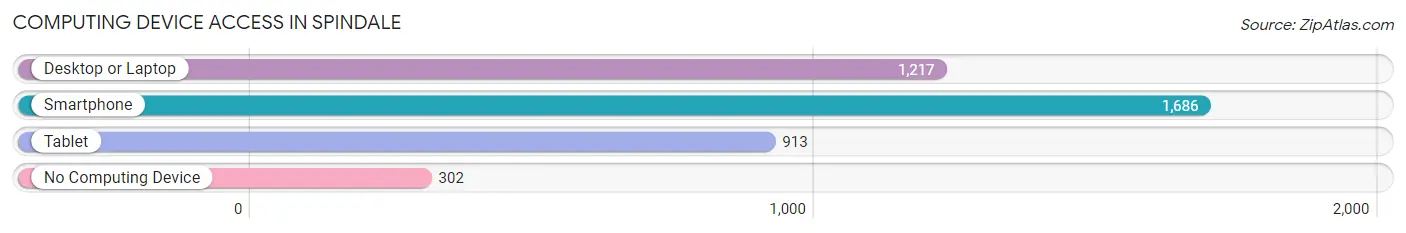
| Device Type | # Households | % Households |
| Desktop or Laptop | 1,217 | 59.5% |
| Smartphone | 1,686 | 82.4% |
| Tablet | 913 | 44.6% |
| No Computing Device | 302 | 14.8% |
| Total | 2,046 | 100.0% |
Internet Access in Spindale
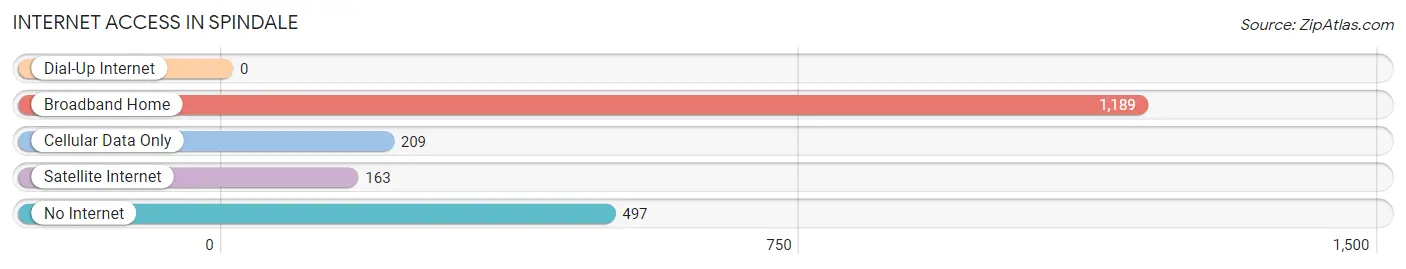
| Internet Type | # Households | % Households |
| Dial-Up Internet | 0 | 0.0% |
| Broadband Home | 1,189 | 58.1% |
| Cellular Data Only | 209 | 10.2% |
| Satellite Internet | 163 | 8.0% |
| No Internet | 497 | 24.3% |
| Total | 2,046 | 100.0% |
Spindale Summary
Spindale, North Carolina is a small town located in the foothills of the Blue Ridge Mountains in Rutherford County. It is situated about 25 miles southeast of Asheville and is part of the Hickory-Lenoir-Morganton Metropolitan Statistical Area. The town has a population of approximately 4,000 people and is known for its small-town charm and friendly atmosphere.
History
The area that is now Spindale was first settled in the late 1700s by a group of German immigrants. The town was originally known as “Spindle”, named after the spinning wheel used by the settlers to make cloth. In 1887, the town was officially incorporated and renamed Spindale.
The town grew slowly over the years, but it was not until the early 1900s that it began to experience significant growth. This was due to the arrival of the railroad, which connected Spindale to the larger cities of Asheville and Charlotte. The railroad also brought with it a number of new businesses, including a cotton mill, a furniture factory, and a brickyard.
The town continued to grow throughout the 20th century, and by the 1950s it had become a thriving community. The town was home to a number of businesses, including a movie theater, a bowling alley, and a variety of shops and restaurants.
Geography
Spindale is located in the foothills of the Blue Ridge Mountains in western North Carolina. The town is situated at an elevation of 1,000 feet and is surrounded by rolling hills and lush forests. The town is located about 25 miles southeast of Asheville and is part of the Hickory-Lenoir-Morganton Metropolitan Statistical Area.
The town is located along the Broad River, which flows through the center of town. The river is a popular spot for fishing, canoeing, and kayaking. The town is also home to a number of parks, including the Spindale City Park, which features a playground, picnic areas, and a walking trail.
Economy
The economy of Spindale is largely based on manufacturing and agriculture. The town is home to a number of factories, including a furniture factory, a brickyard, and a cotton mill. The town is also home to a number of farms, which produce a variety of crops, including corn, soybeans, and tobacco.
The town is also home to a number of small businesses, including restaurants, shops, and other services. The town is also home to a number of tourist attractions, including the Spindale House Museum, which features a variety of artifacts from the town’s history.
Demographics
As of the 2010 census, the population of Spindale was 4,068. The town has a population that is predominantly white (90.2%), with a small percentage of African Americans (4.3%), Hispanics (2.7%), and Asians (1.2%). The median household income in the town is $35,945, and the median age is 41.
Conclusion
Spindale, North Carolina is a small town located in the foothills of the Blue Ridge Mountains in Rutherford County. It is known for its small-town charm and friendly atmosphere, and it has a population of approximately 4,000 people. The town’s economy is largely based on manufacturing and agriculture, and it is home to a number of small businesses, including restaurants, shops, and other services. The town has a predominantly white population, with a small percentage of African Americans, Hispanics, and Asians.
Common Questions
What is the Total Population of Spindale?
Total Population of Spindale is 4,218.
What is the Total Male Population of Spindale?
Total Male Population of Spindale is 2,089.
What is the Total Female Population of Spindale?
Total Female Population of Spindale is 2,129.
What is the Ratio of Males per 100 Females in Spindale?
There are 98.12 Males per 100 Females in Spindale.
What is the Ratio of Females per 100 Males in Spindale?
There are 101.91 Females per 100 Males in Spindale.
What is the Median Population Age in Spindale?
Median Population Age in Spindale is 50.0 Years.
What is the Average Family Size in Spindale
Average Family Size in Spindale is 2.7 People.
What is the Average Household Size in Spindale
Average Household Size in Spindale is 1.9 People.
What is Per Capita Income in Spindale?
Per Capita income in Spindale is $28,662.
What is the Median Family Income in Spindale?
Median Family Income in Spindale is $59,375.
What is the Median Household income in Spindale?
Median Household Income in Spindale is $38,857.
What is Income or Wage Gap in Spindale?
Income or Wage Gap in Spindale is 25.7%.
Women in Spindale earn 74.3 cents for every dollar earned by a man.
What is Inequality or Gini Index in Spindale?
Inequality or Gini Index in Spindale is 0.48.
How Large is the Labor Force in Spindale?
There are 1,965 People in the Labor Forcein in Spindale.
What is the Percentage of People in the Labor Force in Spindale?
50.3% of People are in the Labor Force in Spindale.
What is the Unemployment Rate in Spindale?
Unemployment Rate in Spindale is 8.5%.