Fairplains, NC
Fairplains Map
Fairplains Overview
1,709
TOTAL POPULATION
849
MALE POPULATION
860
FEMALE POPULATION
98.72
MALES / 100 FEMALES
101.30
FEMALES / 100 MALES
53.6
MEDIAN AGE
2.9
AVG FAMILY SIZE
2.2
AVG HOUSEHOLD SIZE
$19,972
PER CAPITA INCOME
$46,092
AVG FAMILY INCOME
$37,261
AVG HOUSEHOLD INCOME
0.43
INEQUALITY / GINI INDEX
554
LABOR FORCE [ PEOPLE ]
38.2%
PERCENT IN LABOR FORCE
19.5%
UNEMPLOYMENT RATE
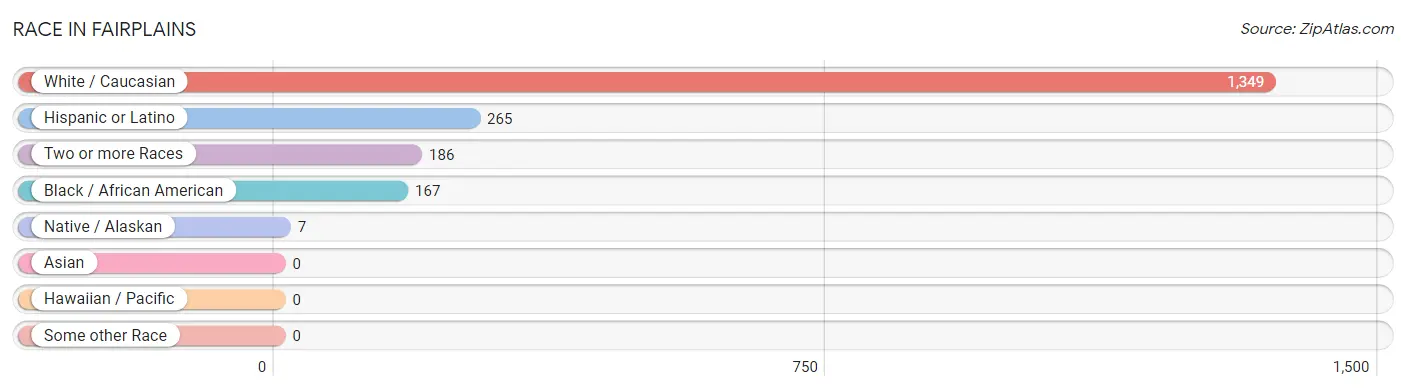
Race in Fairplains
The most populous races in Fairplains are White / Caucasian (1,349 | 78.9%), Hispanic or Latino (265 | 15.5%), and Two or more Races (186 | 10.9%).
| Race | # Population | % Population |
| Asian | 0 | 0.0% |
| Black / African American | 167 | 9.8% |
| Hawaiian / Pacific | 0 | 0.0% |
| Hispanic or Latino | 265 | 15.5% |
| Native / Alaskan | 7 | 0.4% |
| White / Caucasian | 1,349 | 78.9% |
| Two or more Races | 186 | 10.9% |
| Some other Race | 0 | 0.0% |
| Total | 1,709 | 100.0% |
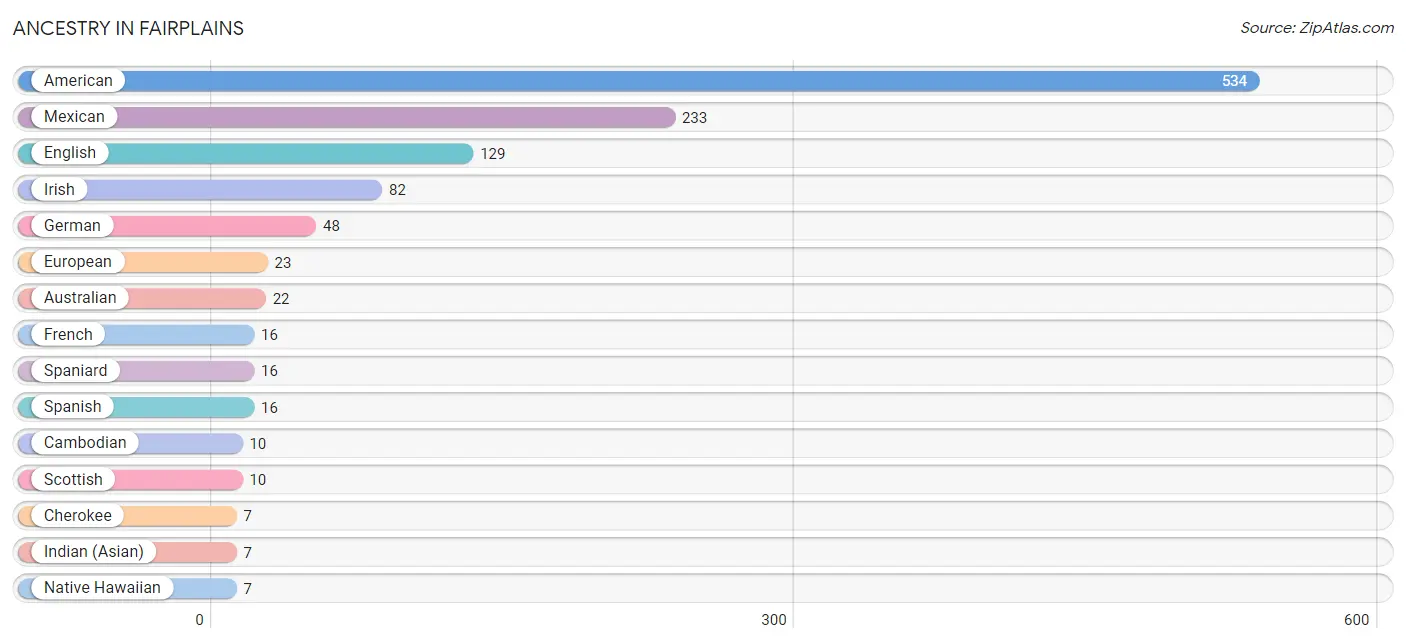
Ancestry in Fairplains
The most populous ancestries reported in Fairplains are American (534 | 31.2%), Mexican (233 | 13.6%), English (129 | 7.5%), Irish (82 | 4.8%), and German (48 | 2.8%), together accounting for 60.0% of all Fairplains residents.
| Ancestry | # Population | % Population |
| African | 1 | 0.1% |
| American | 534 | 31.2% |
| Australian | 22 | 1.3% |
| Cambodian | 10 | 0.6% |
| Cherokee | 7 | 0.4% |
| English | 129 | 7.5% |
| European | 23 | 1.3% |
| French | 16 | 0.9% |
| German | 48 | 2.8% |
| Indian (Asian) | 7 | 0.4% |
| Irish | 82 | 4.8% |
| Mexican | 233 | 13.6% |
| Native Hawaiian | 7 | 0.4% |
| Scottish | 10 | 0.6% |
| Spaniard | 16 | 0.9% |
| Spanish | 16 | 0.9% |
| Subsaharan African | 1 | 0.1% | View All 17 Rows |
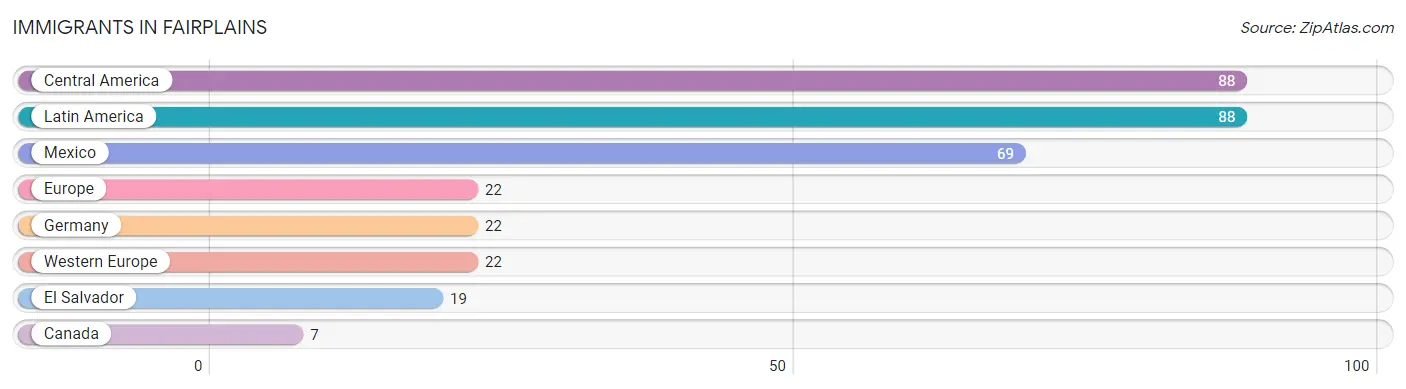
Immigrants in Fairplains
The most numerous immigrant groups reported in Fairplains came from Central America (88 | 5.1%), Latin America (88 | 5.1%), Mexico (69 | 4.0%), Europe (22 | 1.3%), and Germany (22 | 1.3%), together accounting for 16.9% of all Fairplains residents.
| Immigration Origin | # Population | % Population |
| Canada | 7 | 0.4% |
| Central America | 88 | 5.1% |
| El Salvador | 19 | 1.1% |
| Europe | 22 | 1.3% |
| Germany | 22 | 1.3% |
| Latin America | 88 | 5.1% |
| Mexico | 69 | 4.0% |
| Western Europe | 22 | 1.3% | View All 8 Rows |
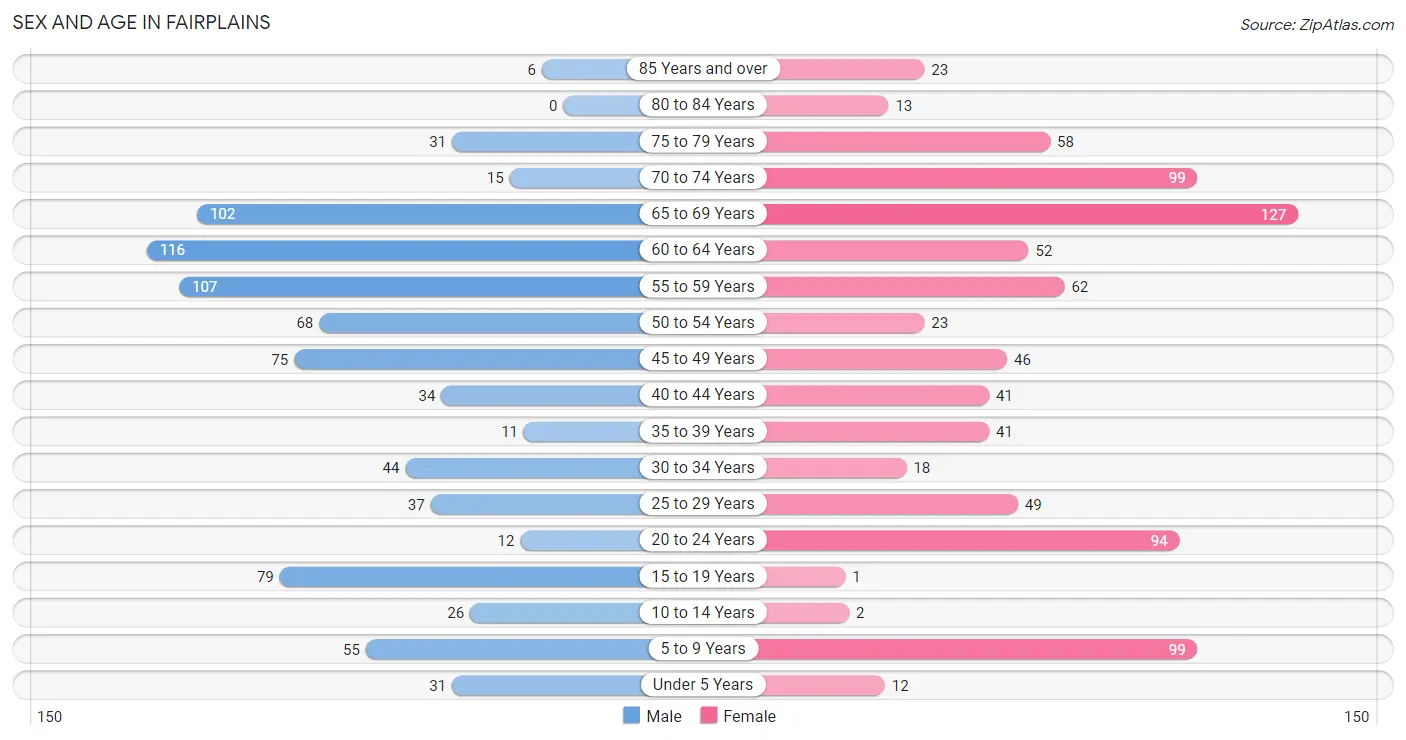
Sex and Age in Fairplains
Sex and Age in Fairplains
The most populous age groups in Fairplains are 60 to 64 Years (116 | 13.7%) for men and 65 to 69 Years (127 | 14.8%) for women.
| Age Bracket | Male | Female |
| Under 5 Years | 31 (3.6%) | 12 (1.4%) |
| 5 to 9 Years | 55 (6.5%) | 99 (11.5%) |
| 10 to 14 Years | 26 (3.1%) | 2 (0.2%) |
| 15 to 19 Years | 79 (9.3%) | 1 (0.1%) |
| 20 to 24 Years | 12 (1.4%) | 94 (10.9%) |
| 25 to 29 Years | 37 (4.4%) | 49 (5.7%) |
| 30 to 34 Years | 44 (5.2%) | 18 (2.1%) |
| 35 to 39 Years | 11 (1.3%) | 41 (4.8%) |
| 40 to 44 Years | 34 (4.0%) | 41 (4.8%) |
| 45 to 49 Years | 75 (8.8%) | 46 (5.3%) |
| 50 to 54 Years | 68 (8.0%) | 23 (2.7%) |
| 55 to 59 Years | 107 (12.6%) | 62 (7.2%) |
| 60 to 64 Years | 116 (13.7%) | 52 (6.0%) |
| 65 to 69 Years | 102 (12.0%) | 127 (14.8%) |
| 70 to 74 Years | 15 (1.8%) | 99 (11.5%) |
| 75 to 79 Years | 31 (3.6%) | 58 (6.7%) |
| 80 to 84 Years | 0 (0.0%) | 13 (1.5%) |
| 85 Years and over | 6 (0.7%) | 23 (2.7%) |
| Total | 849 (100.0%) | 860 (100.0%) |
Families and Households in Fairplains
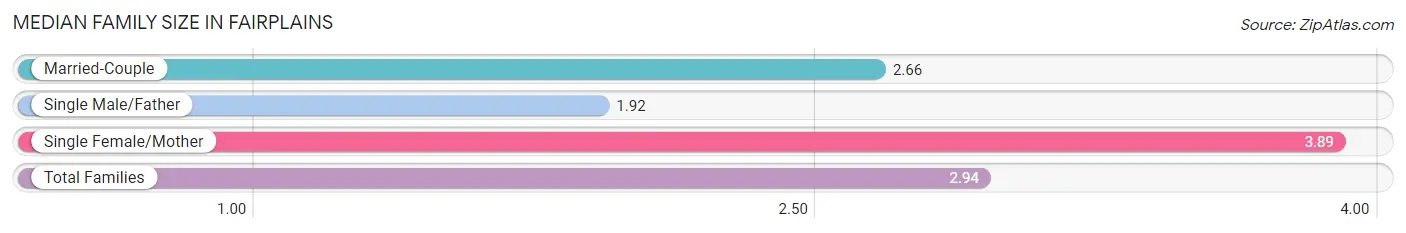
Median Family Size in Fairplains
The median family size in Fairplains is 2.94 persons per family, with single female/mother families (97 | 24.8%) accounting for the largest median family size of 3.89 persons per family. On the other hand, single male/father families (12 | 3.1%) represent the smallest median family size with 1.92 persons per family.
| Family Type | # Families | Family Size |
| Married-Couple | 282 (72.1%) | 2.66 |
| Single Male/Father | 12 (3.1%) | 1.92 |
| Single Female/Mother | 97 (24.8%) | 3.89 |
| Total Families | 391 (100.0%) | 2.94 |
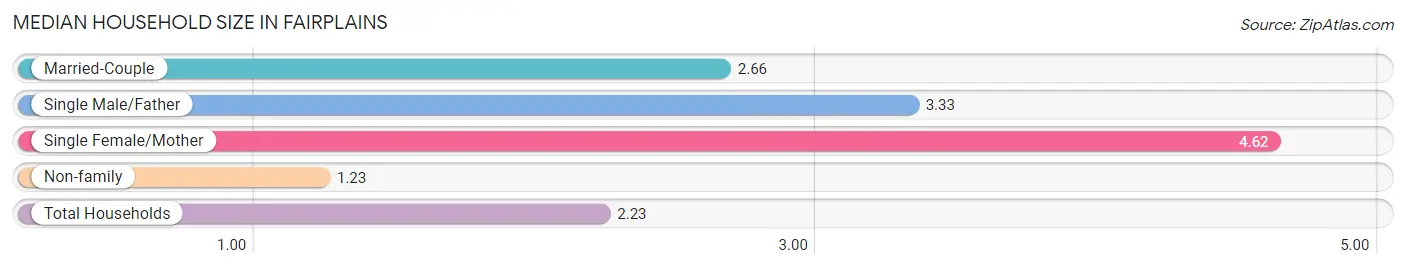
Median Household Size in Fairplains
The median household size in Fairplains is 2.23 persons per household, with single female/mother households (97 | 12.8%) accounting for the largest median household size of 4.62 persons per household. non-family households (368 | 48.5%) represent the smallest median household size with 1.23 persons per household.
| Household Type | # Households | Household Size |
| Married-Couple | 282 (37.1%) | 2.66 |
| Single Male/Father | 12 (1.6%) | 3.33 |
| Single Female/Mother | 97 (12.8%) | 4.62 |
| Non-family | 368 (48.5%) | 1.23 |
| Total Households | 759 (100.0%) | 2.23 |
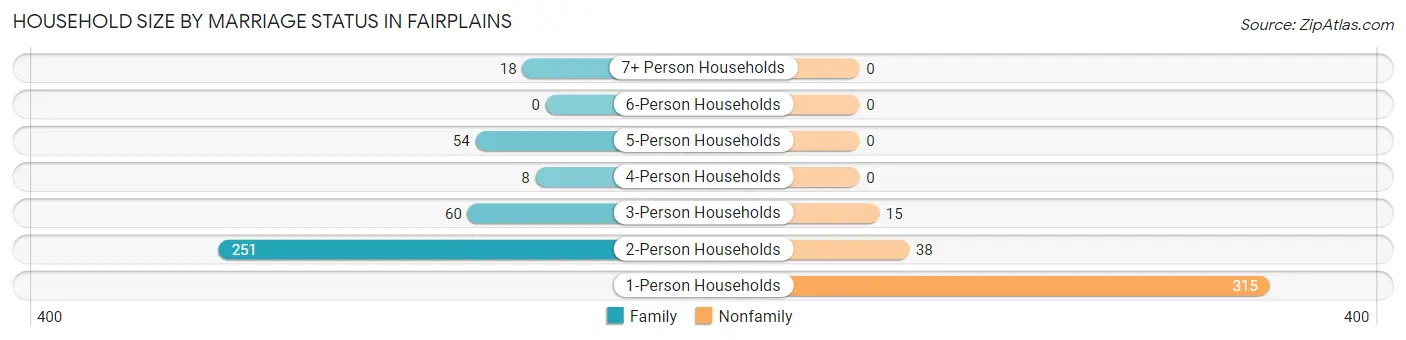
Household Size by Marriage Status in Fairplains
Out of a total of 759 households in Fairplains, 391 (51.5%) are family households, while 368 (48.5%) are nonfamily households. The most numerous type of family households are 2-person households, comprising 251, and the most common type of nonfamily households are 1-person households, comprising 315.
| Household Size | Family Households | Nonfamily Households |
| 1-Person Households | - | 315 (41.5%) |
| 2-Person Households | 251 (33.1%) | 38 (5.0%) |
| 3-Person Households | 60 (7.9%) | 15 (2.0%) |
| 4-Person Households | 8 (1.1%) | 0 (0.0%) |
| 5-Person Households | 54 (7.1%) | 0 (0.0%) |
| 6-Person Households | 0 (0.0%) | 0 (0.0%) |
| 7+ Person Households | 18 (2.4%) | 0 (0.0%) |
| Total | 391 (51.5%) | 368 (48.5%) |
Female Fertility in Fairplains
Fertility by Age in Fairplains
| Age Bracket | Women with Births | Births / 1,000 Women |
| 15 to 19 years | 0 (0.0%) | 0.0 |
| 20 to 34 years | 0 (0.0%) | 0.0 |
| 35 to 50 years | 0 (0.0%) | 0.0 |
| Total | 0 (0.0%) | 0.0 |
Fertility by Age by Marriage Status in Fairplains
| Age Bracket | Married | Unmarried |
| 15 to 19 years | 0 (0.0%) | 0 (0.0%) |
| 20 to 34 years | 0 (0.0%) | 0 (0.0%) |
| 35 to 50 years | 0 (0.0%) | 0 (0.0%) |
| Total | 0 (0.0%) | 0 (0.0%) |
Fertility by Education in Fairplains
| Educational Attainment | Women with Births | Births / 1,000 Women |
| Less than High School | 0 (0.0%) | 0.0 |
| High School Diploma | 0 (0.0%) | 0.0 |
| College or Associate's Degree | 0 (0.0%) | 0.0 |
| Bachelor's Degree | 0 (0.0%) | 0.0 |
| Graduate Degree | 0 (0.0%) | 0.0 |
| Total | 0 (0.0%) | 0.0 |
Fertility by Education by Marriage Status in Fairplains
| Educational Attainment | Married | Unmarried |
| Less than High School | 0 (0.0%) | 0 (0.0%) |
| High School Diploma | 0 (0.0%) | 0 (0.0%) |
| College or Associate's Degree | 0 (0.0%) | 0 (0.0%) |
| Bachelor's Degree | 0 (0.0%) | 0 (0.0%) |
| Graduate Degree | 0 (0.0%) | 0 (0.0%) |
| Total | 0 (0.0%) | 0 (0.0%) |
Income in Fairplains
Income Overview in Fairplains
Per Capita Income in Fairplains is $19,972, while median incomes of families and households are $46,092 and $37,261 respectively.
| Characteristic | Number | Measure |
| Per Capita Income | 1,709 | $19,972 |
| Median Family Income | 391 | $46,092 |
| Mean Family Income | 391 | $51,506 |
| Median Household Income | 759 | $37,261 |
| Mean Household Income | 759 | $43,201 |
| Income Deficit | 391 | $0 |
| Wage / Income Gap (%) | 1,709 | 0.00% |
| Wage / Income Gap ($) | 1,709 | 100.00¢ per $1 |
| Gini / Inequality Index | 1,709 | 0.43 |
Earnings by Sex in Fairplains
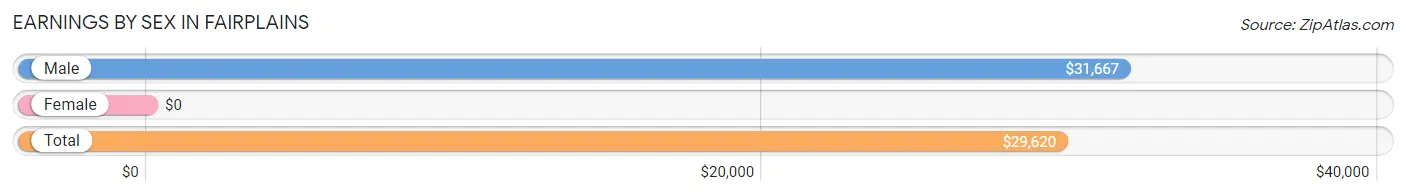
| Sex | Number | Average Earnings |
| Male | 316 (56.5%) | $31,667 |
| Female | 243 (43.5%) | $0 |
| Total | 559 (100.0%) | $29,620 |
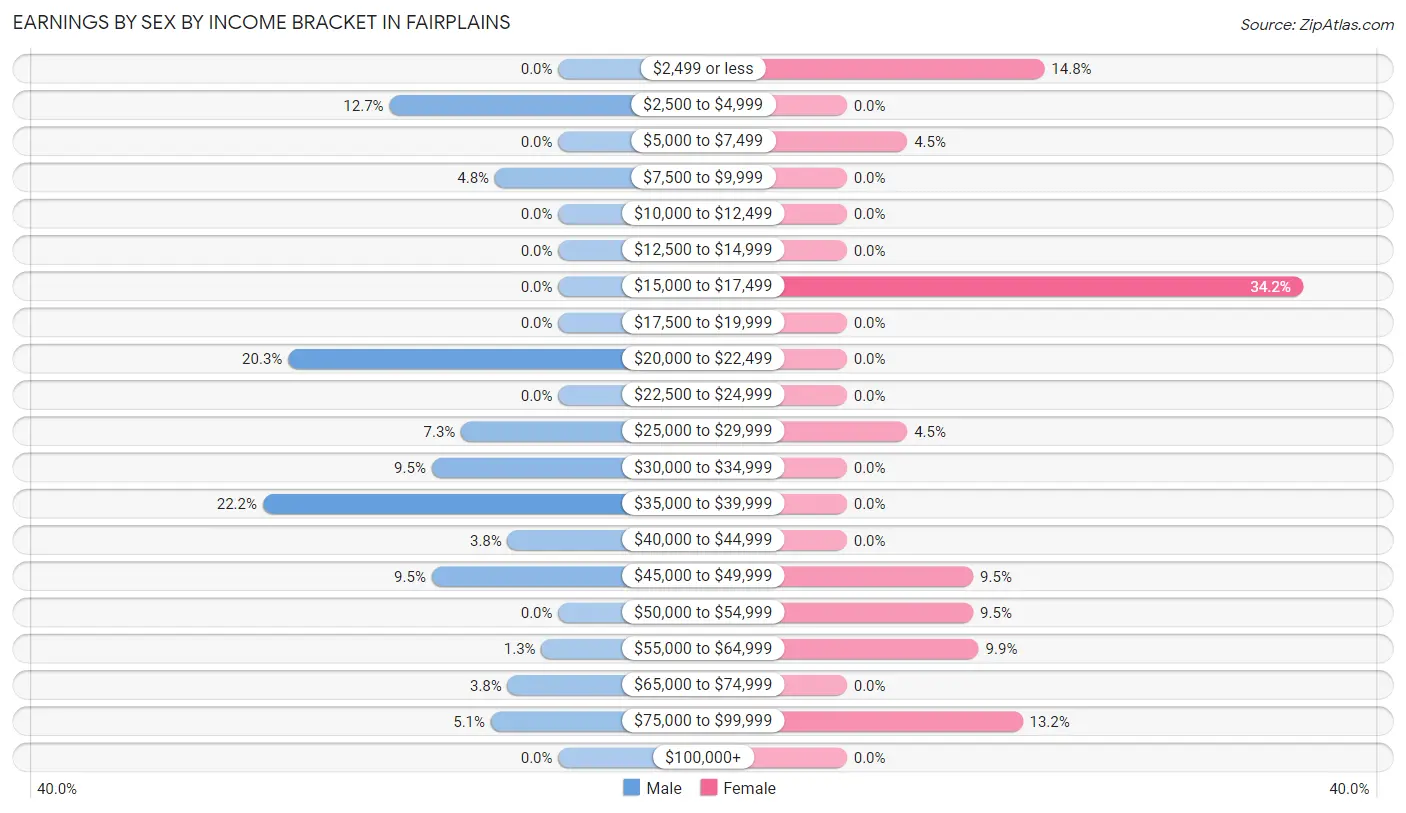
Earnings by Sex by Income Bracket in Fairplains
The most common earnings brackets in Fairplains are $35,000 to $39,999 for men (70 | 22.2%) and $15,000 to $17,499 for women (83 | 34.2%).
| Income | Male | Female |
| $2,499 or less | 0 (0.0%) | 36 (14.8%) |
| $2,500 to $4,999 | 40 (12.7%) | 0 (0.0%) |
| $5,000 to $7,499 | 0 (0.0%) | 11 (4.5%) |
| $7,500 to $9,999 | 15 (4.8%) | 0 (0.0%) |
| $10,000 to $12,499 | 0 (0.0%) | 0 (0.0%) |
| $12,500 to $14,999 | 0 (0.0%) | 0 (0.0%) |
| $15,000 to $17,499 | 0 (0.0%) | 83 (34.2%) |
| $17,500 to $19,999 | 0 (0.0%) | 0 (0.0%) |
| $20,000 to $22,499 | 64 (20.3%) | 0 (0.0%) |
| $22,500 to $24,999 | 0 (0.0%) | 0 (0.0%) |
| $25,000 to $29,999 | 23 (7.3%) | 11 (4.5%) |
| $30,000 to $34,999 | 30 (9.5%) | 0 (0.0%) |
| $35,000 to $39,999 | 70 (22.2%) | 0 (0.0%) |
| $40,000 to $44,999 | 12 (3.8%) | 0 (0.0%) |
| $45,000 to $49,999 | 30 (9.5%) | 23 (9.5%) |
| $50,000 to $54,999 | 0 (0.0%) | 23 (9.5%) |
| $55,000 to $64,999 | 4 (1.3%) | 24 (9.9%) |
| $65,000 to $74,999 | 12 (3.8%) | 0 (0.0%) |
| $75,000 to $99,999 | 16 (5.1%) | 32 (13.2%) |
| $100,000+ | 0 (0.0%) | 0 (0.0%) |
| Total | 316 (100.0%) | 243 (100.0%) |
Earnings by Sex by Educational Attainment in Fairplains
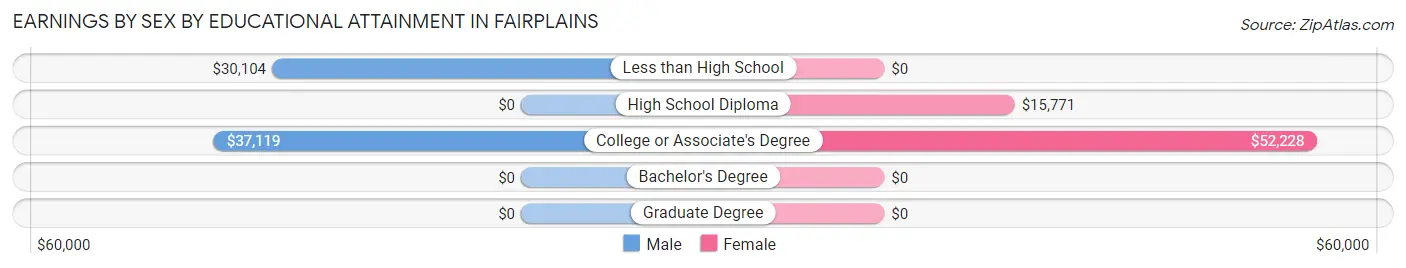
| Educational Attainment | Male Income | Female Income |
| Less than High School | $30,104 | $0 |
| High School Diploma | - | - |
| College or Associate's Degree | $37,119 | $52,228 |
| Bachelor's Degree | - | - |
| Graduate Degree | - | - |
| Total | $35,268 | $0 |
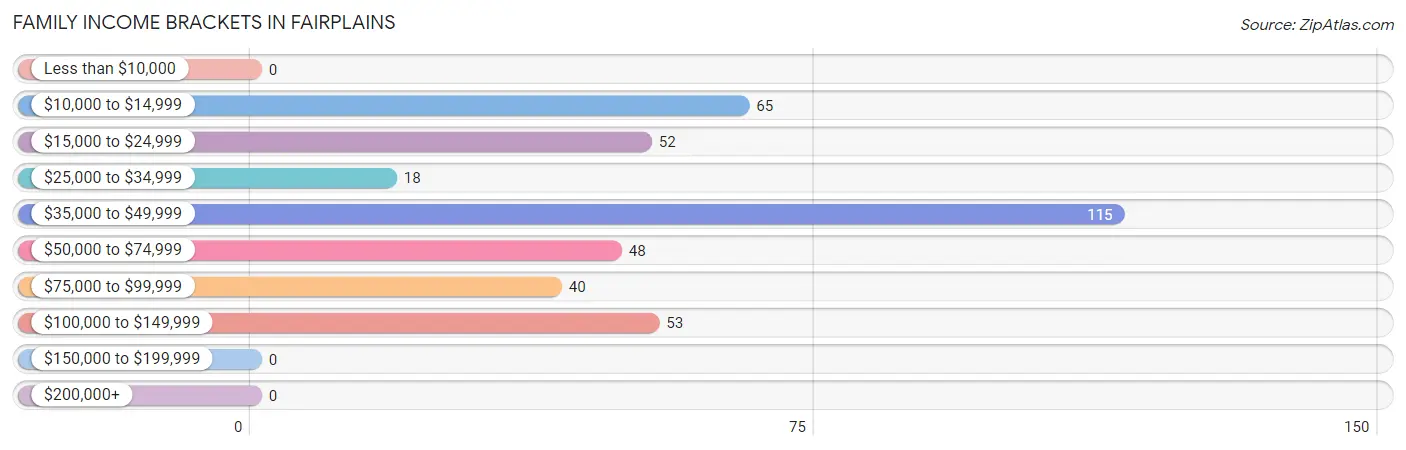
Family Income in Fairplains
Family Income Brackets in Fairplains
According to the Fairplains family income data, there are 115 families falling into the $35,000 to $49,999 income range, which is the most common income bracket and makes up 29.4% of all families.
| Income Bracket | # Families | % Families |
| Less than $10,000 | 0 | 0.0% |
| $10,000 to $14,999 | 65 | 16.6% |
| $15,000 to $24,999 | 52 | 13.3% |
| $25,000 to $34,999 | 18 | 4.6% |
| $35,000 to $49,999 | 115 | 29.4% |
| $50,000 to $74,999 | 48 | 12.3% |
| $75,000 to $99,999 | 40 | 10.2% |
| $100,000 to $149,999 | 53 | 13.6% |
| $150,000 to $199,999 | 0 | 0.0% |
| $200,000+ | 0 | 0.0% |
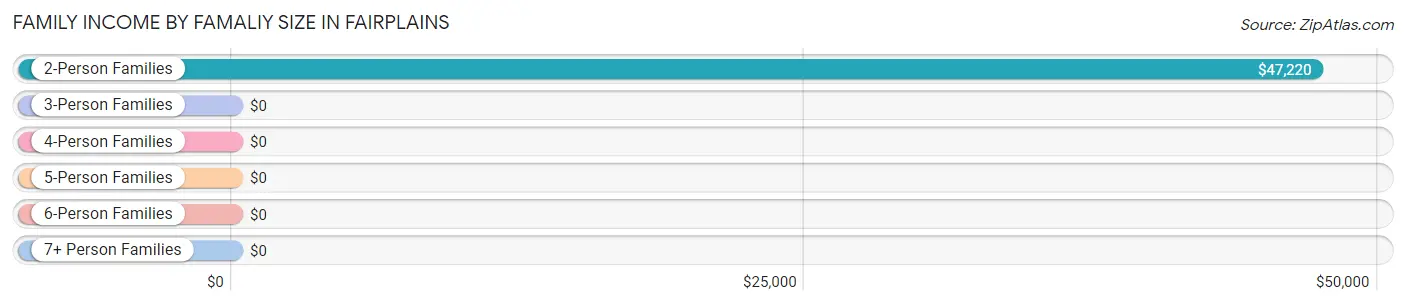
Family Income by Famaliy Size in Fairplains
2-person families (263 | 67.3%) account for the highest median family income in Fairplains with $47,220 per family, while 2-person families (263 | 67.3%) have the highest median income of $23,610 per family member.
| Income Bracket | # Families | Median Income |
| 2-Person Families | 263 (67.3%) | $47,220 |
| 3-Person Families | 84 (21.5%) | $0 |
| 4-Person Families | 8 (2.1%) | $0 |
| 5-Person Families | 18 (4.6%) | $0 |
| 6-Person Families | 0 (0.0%) | $0 |
| 7+ Person Families | 18 (4.6%) | $0 |
| Total | 391 (100.0%) | $46,092 |
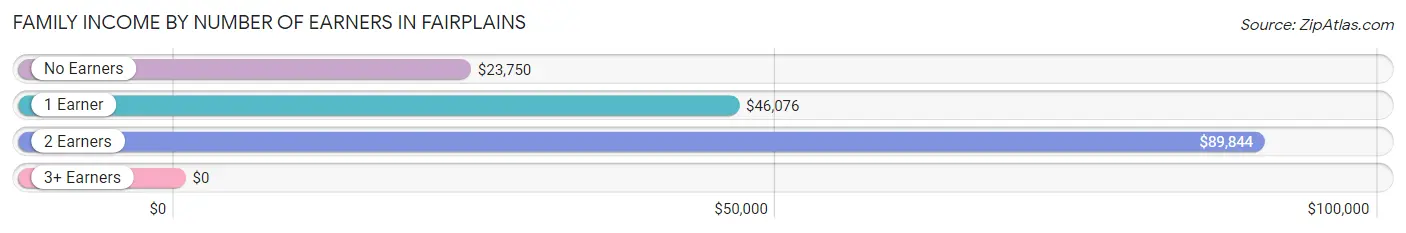
Family Income by Number of Earners in Fairplains
| Number of Earners | # Families | Median Income |
| No Earners | 164 (41.9%) | $23,750 |
| 1 Earner | 160 (40.9%) | $46,076 |
| 2 Earners | 61 (15.6%) | $89,844 |
| 3+ Earners | 6 (1.5%) | $0 |
| Total | 391 (100.0%) | $46,092 |
Household Income in Fairplains
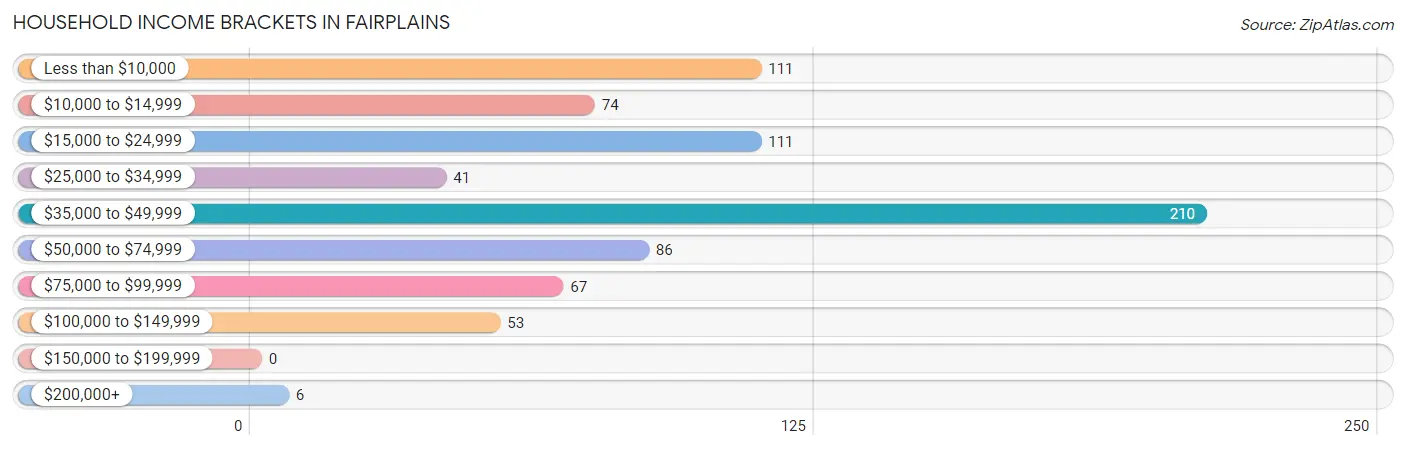
Household Income Brackets in Fairplains
With 210 households falling in the category, the $35,000 to $49,999 income range is the most frequent in Fairplains, accounting for 27.7% of all households.
| Income Bracket | # Households | % Households |
| Less than $10,000 | 111 | 14.6% |
| $10,000 to $14,999 | 74 | 9.7% |
| $15,000 to $24,999 | 111 | 14.6% |
| $25,000 to $34,999 | 41 | 5.4% |
| $35,000 to $49,999 | 210 | 27.7% |
| $50,000 to $74,999 | 86 | 11.3% |
| $75,000 to $99,999 | 67 | 8.8% |
| $100,000 to $149,999 | 53 | 7.0% |
| $150,000 to $199,999 | 0 | 0.0% |
| $200,000+ | 6 | 0.8% |
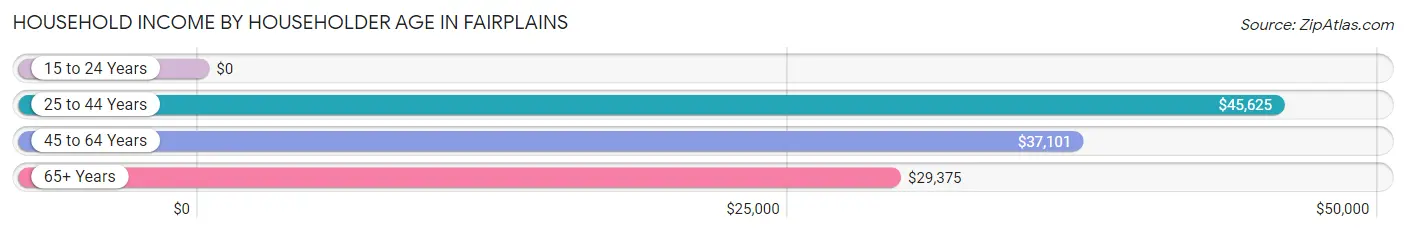
Household Income by Householder Age in Fairplains
The median household income in Fairplains is $37,261, with the highest median household income of $45,625 found in the 25 to 44 years age bracket for the primary householder. A total of 126 households (16.6%) fall into this category. Meanwhile, the 15 to 24 years age bracket for the primary householder has the lowest median household income of $0, with 25 households (3.3%) in this group.
| Income Bracket | # Households | Median Income |
| 15 to 24 Years | 25 (3.3%) | $0 |
| 25 to 44 Years | 126 (16.6%) | $45,625 |
| 45 to 64 Years | 305 (40.2%) | $37,101 |
| 65+ Years | 303 (39.9%) | $29,375 |
| Total | 759 (100.0%) | $37,261 |
Poverty in Fairplains
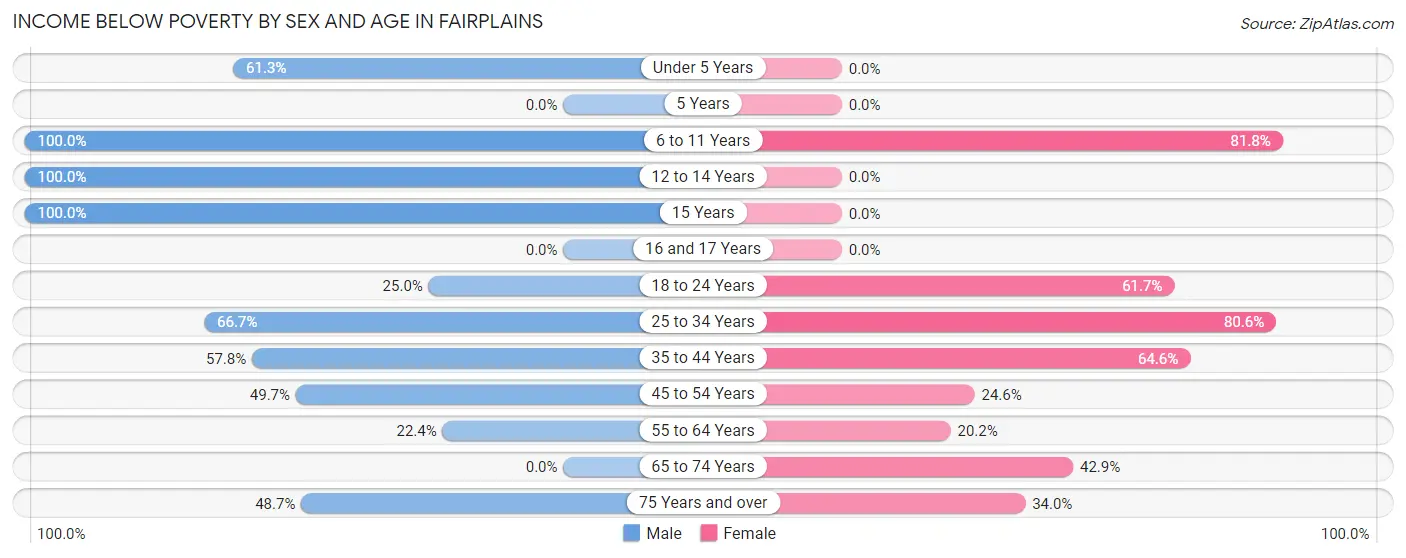
Income Below Poverty by Sex and Age in Fairplains
With 43.0% poverty level for males and 48.4% for females among the residents of Fairplains, 6 to 11 year old males and 6 to 11 year old females are the most vulnerable to poverty, with 55 males (100.0%) and 81 females (81.8%) in their respective age groups living below the poverty level.
| Age Bracket | Male | Female |
| Under 5 Years | 19 (61.3%) | 0 (0.0%) |
| 5 Years | 0 (0.0%) | 0 (0.0%) |
| 6 to 11 Years | 55 (100.0%) | 81 (81.8%) |
| 12 to 14 Years | 26 (100.0%) | 0 (0.0%) |
| 15 Years | 33 (100.0%) | 0 (0.0%) |
| 16 and 17 Years | 0 (0.0%) | 0 (0.0%) |
| 18 to 24 Years | 12 (25.0%) | 58 (61.7%) |
| 25 to 34 Years | 54 (66.7%) | 54 (80.6%) |
| 35 to 44 Years | 26 (57.8%) | 53 (64.6%) |
| 45 to 54 Years | 71 (49.6%) | 17 (24.6%) |
| 55 to 64 Years | 50 (22.4%) | 23 (20.2%) |
| 65 to 74 Years | 0 (0.0%) | 97 (42.9%) |
| 75 Years and over | 18 (48.6%) | 32 (34.0%) |
| Total | 364 (43.0%) | 415 (48.4%) |
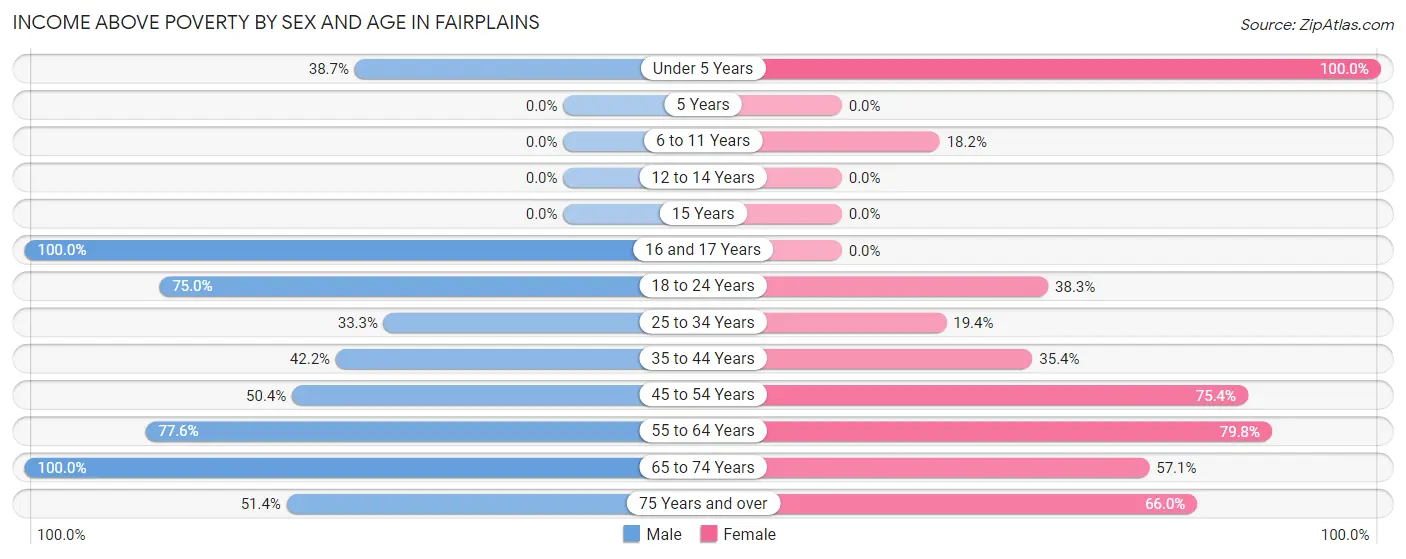
Income Above Poverty by Sex and Age in Fairplains
According to the poverty statistics in Fairplains, males aged 16 and 17 years and females aged under 5 years are the age groups that are most secure financially, with 100.0% of males and 100.0% of females in these age groups living above the poverty line.
| Age Bracket | Male | Female |
| Under 5 Years | 12 (38.7%) | 12 (100.0%) |
| 5 Years | 0 (0.0%) | 0 (0.0%) |
| 6 to 11 Years | 0 (0.0%) | 18 (18.2%) |
| 12 to 14 Years | 0 (0.0%) | 0 (0.0%) |
| 15 Years | 0 (0.0%) | 0 (0.0%) |
| 16 and 17 Years | 7 (100.0%) | 0 (0.0%) |
| 18 to 24 Years | 36 (75.0%) | 36 (38.3%) |
| 25 to 34 Years | 27 (33.3%) | 13 (19.4%) |
| 35 to 44 Years | 19 (42.2%) | 29 (35.4%) |
| 45 to 54 Years | 72 (50.3%) | 52 (75.4%) |
| 55 to 64 Years | 173 (77.6%) | 91 (79.8%) |
| 65 to 74 Years | 117 (100.0%) | 129 (57.1%) |
| 75 Years and over | 19 (51.3%) | 62 (66.0%) |
| Total | 482 (57.0%) | 442 (51.6%) |
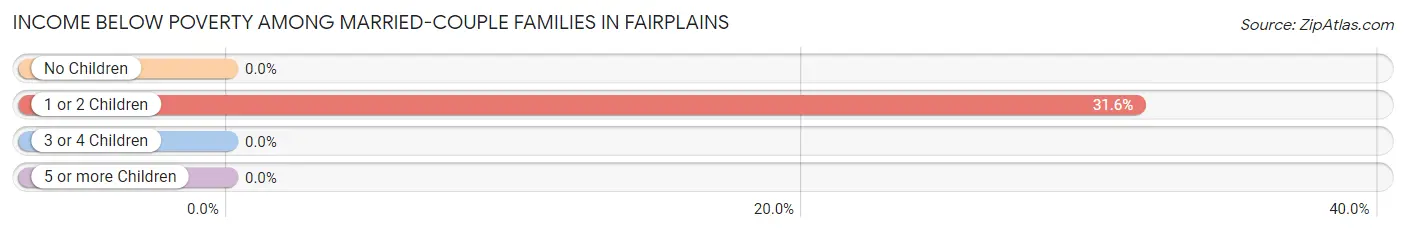
Income Below Poverty Among Married-Couple Families in Fairplains
The poverty statistics for married-couple families in Fairplains show that 6.4% or 18 of the total 282 families live below the poverty line. Families with 1 or 2 children have the highest poverty rate of 31.6%, comprising of 18 families. On the other hand, families with no children have the lowest poverty rate of 0.0%, which includes 0 families.
| Children | Above Poverty | Below Poverty |
| No Children | 225 (100.0%) | 0 (0.0%) |
| 1 or 2 Children | 39 (68.4%) | 18 (31.6%) |
| 3 or 4 Children | 0 (0.0%) | 0 (0.0%) |
| 5 or more Children | 0 (0.0%) | 0 (0.0%) |
| Total | 264 (93.6%) | 18 (6.4%) |
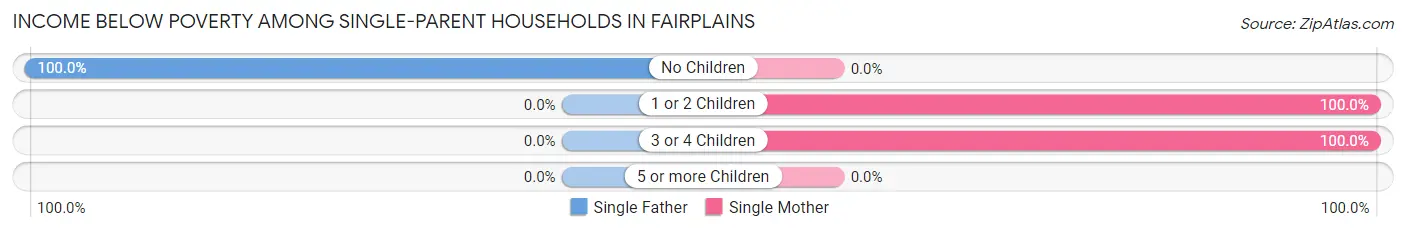
Income Below Poverty Among Single-Parent Households in Fairplains
According to the poverty data in Fairplains, 100.0% or 12 single-father households and 73.2% or 71 single-mother households are living below the poverty line. Among single-father households, those with no children have the highest poverty rate, with 12 households (100.0%) experiencing poverty. Likewise, among single-mother households, those with 1 or 2 children have the highest poverty rate, with 53 households (100.0%) falling below the poverty line.
| Children | Single Father | Single Mother |
| No Children | 12 (100.0%) | 0 (0.0%) |
| 1 or 2 Children | 0 (0.0%) | 53 (100.0%) |
| 3 or 4 Children | 0 (0.0%) | 18 (100.0%) |
| 5 or more Children | 0 (0.0%) | 0 (0.0%) |
| Total | 12 (100.0%) | 71 (73.2%) |
Income Below Poverty Among Married-Couple vs Single-Parent Households in Fairplains
The poverty data for Fairplains shows that 18 of the married-couple family households (6.4%) and 83 of the single-parent households (76.1%) are living below the poverty level. Within the married-couple family households, those with 1 or 2 children have the highest poverty rate, with 18 households (31.6%) falling below the poverty line. Among the single-parent households, those with 1 or 2 children have the highest poverty rate, with 53 household (100.0%) living below poverty.
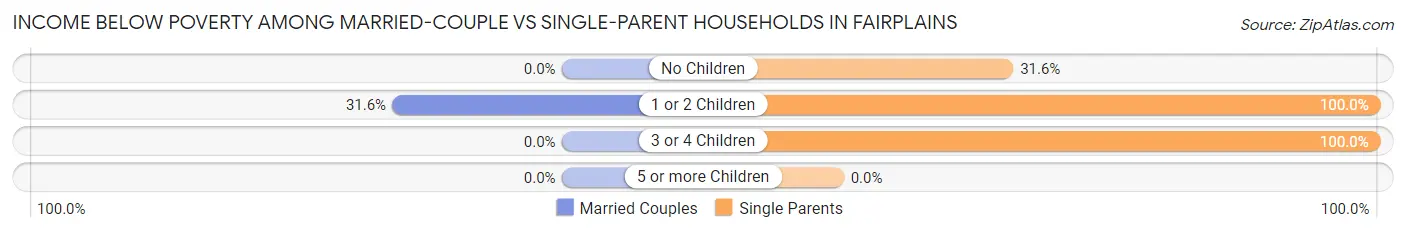
| Children | Married-Couple Families | Single-Parent Households |
| No Children | 0 (0.0%) | 12 (31.6%) |
| 1 or 2 Children | 18 (31.6%) | 53 (100.0%) |
| 3 or 4 Children | 0 (0.0%) | 18 (100.0%) |
| 5 or more Children | 0 (0.0%) | 0 (0.0%) |
| Total | 18 (6.4%) | 83 (76.1%) |
Employment Characteristics in Fairplains
Employment by Class of Employer in Fairplains
Among the 430 employed individuals in Fairplains, private company employees (302 | 70.2%), federal government employees (47 | 10.9%), and self-employed (not incorporated) (29 | 6.7%) make up the most common classes of employment.
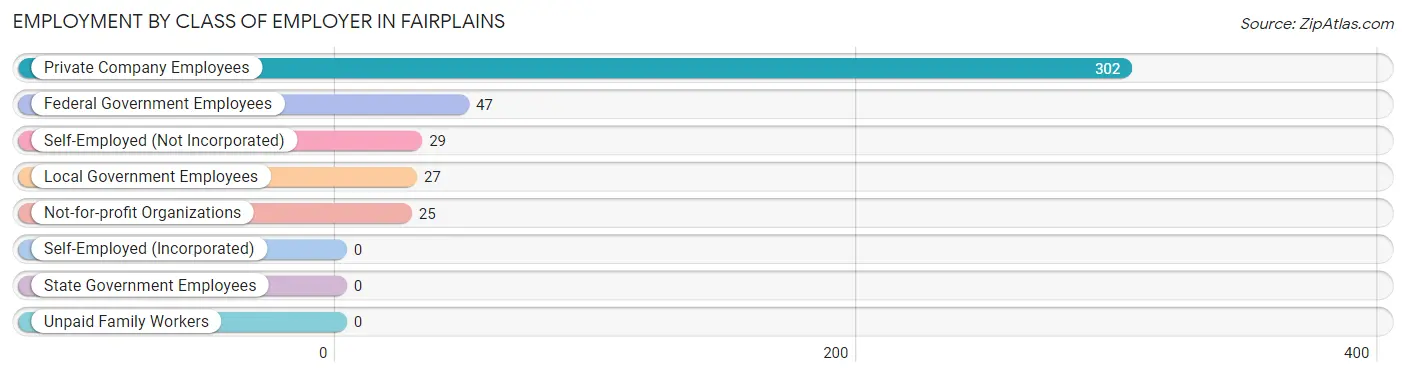
| Employer Class | # Employees | % Employees |
| Private Company Employees | 302 | 70.2% |
| Self-Employed (Incorporated) | 0 | 0.0% |
| Self-Employed (Not Incorporated) | 29 | 6.7% |
| Not-for-profit Organizations | 25 | 5.8% |
| Local Government Employees | 27 | 6.3% |
| State Government Employees | 0 | 0.0% |
| Federal Government Employees | 47 | 10.9% |
| Unpaid Family Workers | 0 | 0.0% |
| Total | 430 | 100.0% |
Employment Status by Age in Fairplains
According to the labor force statistics for Fairplains, out of the total population over 16 years of age (1,451), 38.2% or 554 individuals are in the labor force, with 19.5% or 108 of them unemployed. The age group with the highest labor force participation rate is 16 to 19 years, with 91.5% or 43 individuals in the labor force. Within the labor force, the 25 to 29 years age range has the highest percentage of unemployed individuals, with 100.0% or 2 of them being unemployed.
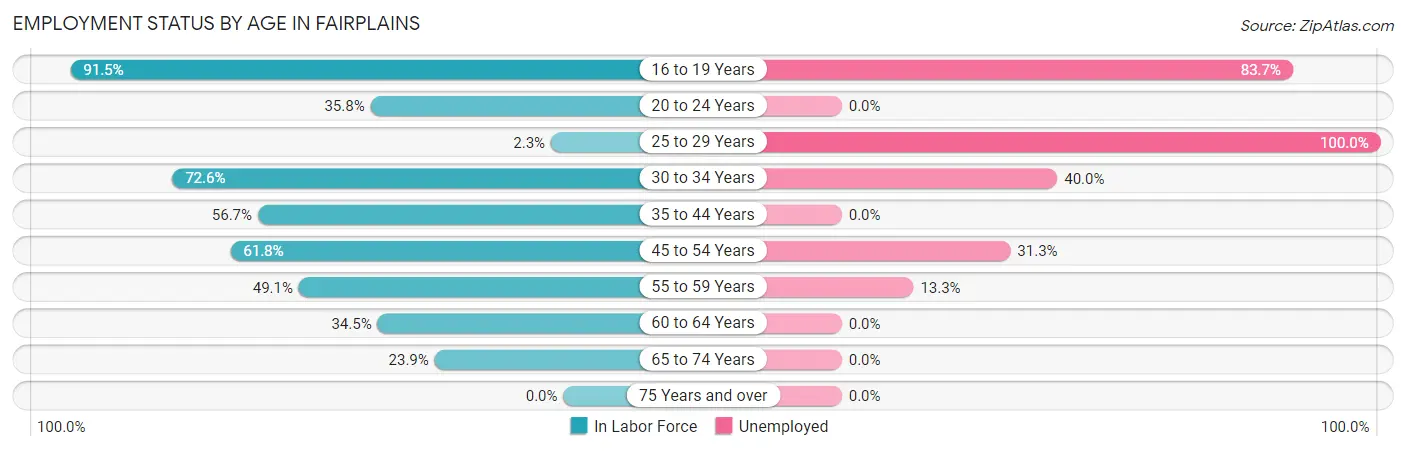
| Age Bracket | In Labor Force | Unemployed |
| 16 to 19 Years | 43 (91.5%) | 36 (83.7%) |
| 20 to 24 Years | 38 (35.8%) | 0 (0.0%) |
| 25 to 29 Years | 2 (2.3%) | 2 (100.0%) |
| 30 to 34 Years | 45 (72.6%) | 18 (40.0%) |
| 35 to 44 Years | 72 (56.7%) | 0 (0.0%) |
| 45 to 54 Years | 131 (61.8%) | 41 (31.3%) |
| 55 to 59 Years | 83 (49.1%) | 11 (13.3%) |
| 60 to 64 Years | 58 (34.5%) | 0 (0.0%) |
| 65 to 74 Years | 82 (23.9%) | 0 (0.0%) |
| 75 Years and over | 0 (0.0%) | 0 (0.0%) |
| Total | 554 (38.2%) | 108 (19.5%) |
Employment Status by Educational Attainment in Fairplains
According to labor force statistics for Fairplains, 47.5% of individuals (391) out of the total population between 25 and 64 years of age (824) are in the labor force, with 18.4% or 72 of them being unemployed. The group with the highest labor force participation rate are those with the educational attainment of college / associate degree, with 82.0% or 169 individuals in the labor force. Within the labor force, individuals with high school diploma education have the highest percentage of unemployment, with 53.9% or 41 of them being unemployed.
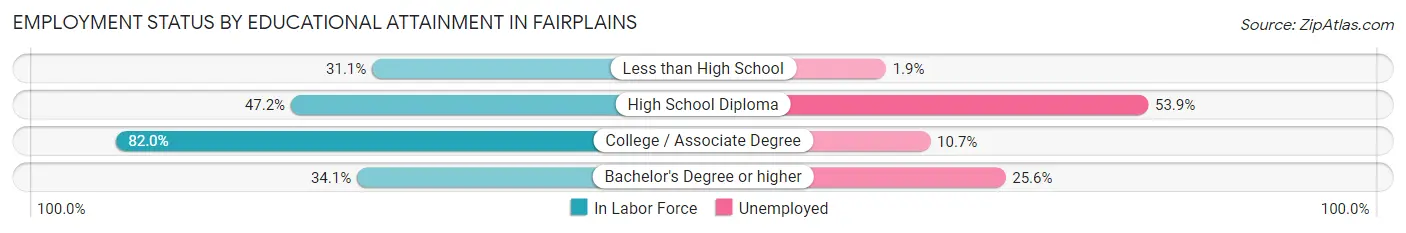
| Educational Attainment | In Labor Force | Unemployed |
| Less than High School | 103 (31.1%) | 6 (1.9%) |
| High School Diploma | 76 (47.2%) | 87 (53.9%) |
| College / Associate Degree | 169 (82.0%) | 22 (10.7%) |
| Bachelor's Degree or higher | 43 (34.1%) | 32 (25.6%) |
| Total | 391 (47.5%) | 152 (18.4%) |
Employment Occupations by Sex in Fairplains
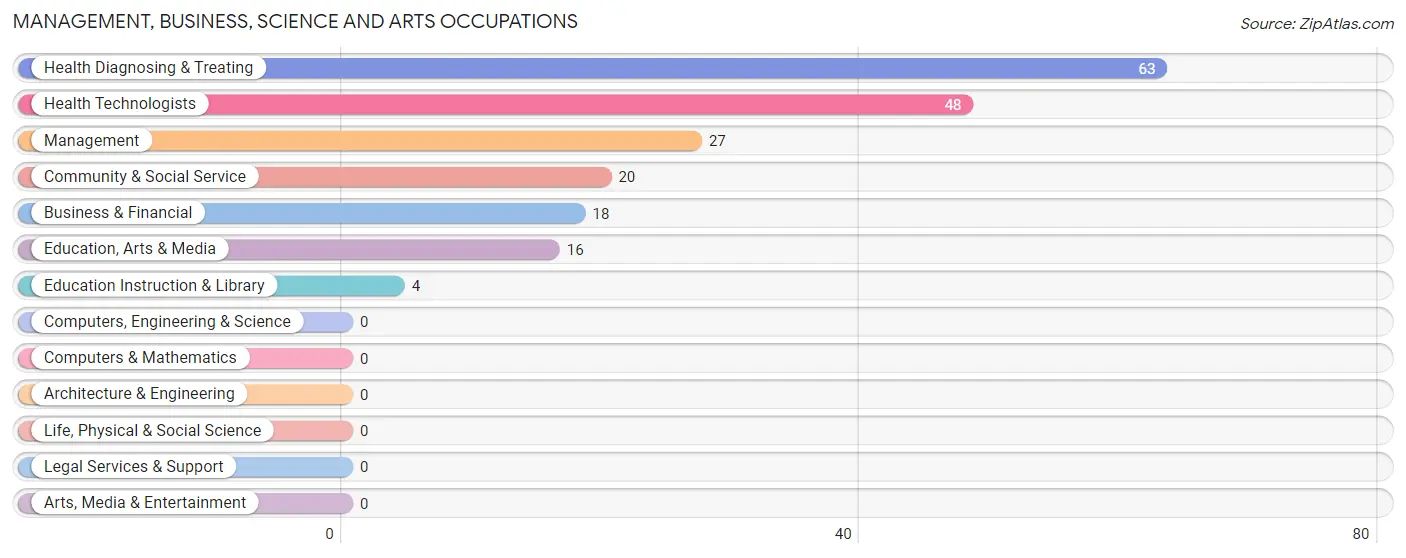
Management, Business, Science and Arts Occupations
The most common Management, Business, Science and Arts occupations in Fairplains are Health Diagnosing & Treating (63 | 14.1%), Health Technologists (48 | 10.8%), Management (27 | 6.0%), Community & Social Service (20 | 4.5%), and Business & Financial (18 | 4.0%).
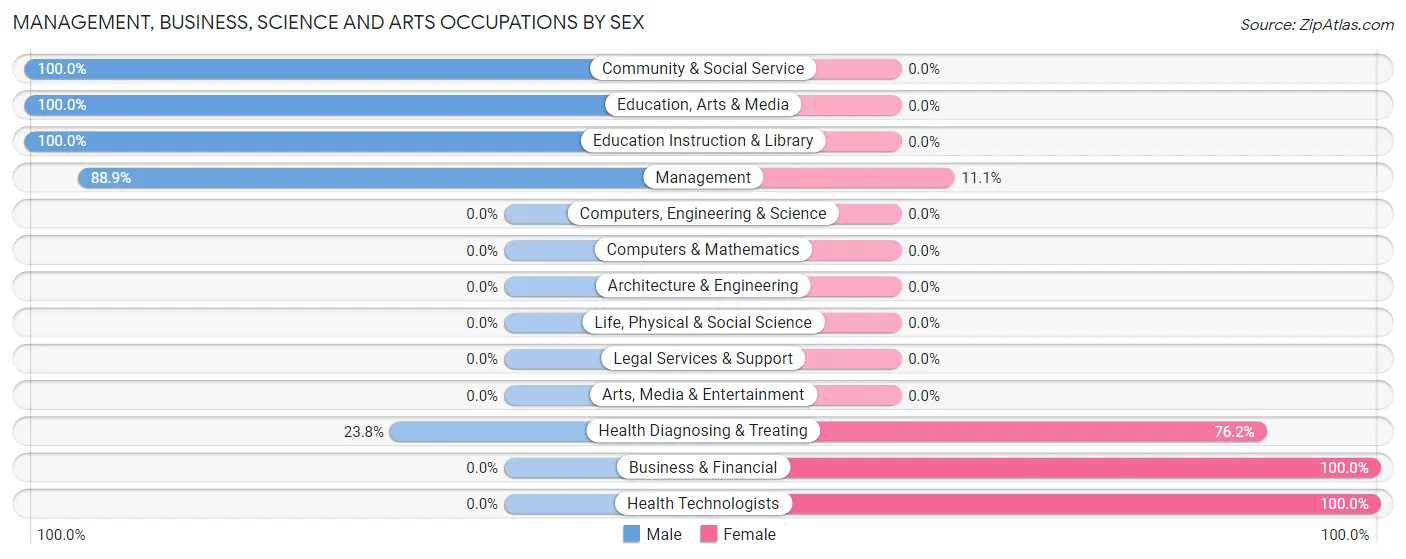
Management, Business, Science and Arts Occupations by Sex
Within the Management, Business, Science and Arts occupations in Fairplains, the most male-oriented occupations are Community & Social Service (100.0%), Education, Arts & Media (100.0%), and Education Instruction & Library (100.0%), while the most female-oriented occupations are Business & Financial (100.0%), Health Technologists (100.0%), and Health Diagnosing & Treating (76.2%).
| Occupation | Male | Female |
| Management | 24 (88.9%) | 3 (11.1%) |
| Business & Financial | 0 (0.0%) | 18 (100.0%) |
| Computers, Engineering & Science | 0 (0.0%) | 0 (0.0%) |
| Computers & Mathematics | 0 (0.0%) | 0 (0.0%) |
| Architecture & Engineering | 0 (0.0%) | 0 (0.0%) |
| Life, Physical & Social Science | 0 (0.0%) | 0 (0.0%) |
| Community & Social Service | 20 (100.0%) | 0 (0.0%) |
| Education, Arts & Media | 16 (100.0%) | 0 (0.0%) |
| Legal Services & Support | 0 (0.0%) | 0 (0.0%) |
| Education Instruction & Library | 4 (100.0%) | 0 (0.0%) |
| Arts, Media & Entertainment | 0 (0.0%) | 0 (0.0%) |
| Health Diagnosing & Treating | 15 (23.8%) | 48 (76.2%) |
| Health Technologists | 0 (0.0%) | 48 (100.0%) |
| Total (Category) | 59 (46.1%) | 69 (53.9%) |
| Total (Overall) | 237 (53.1%) | 209 (46.9%) |
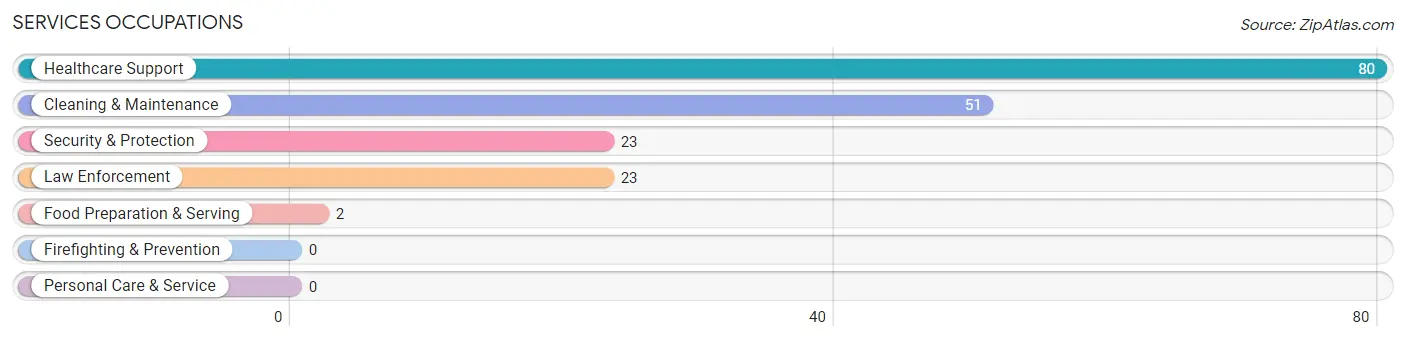
Services Occupations
The most common Services occupations in Fairplains are Healthcare Support (80 | 17.9%), Cleaning & Maintenance (51 | 11.4%), Security & Protection (23 | 5.2%), Law Enforcement (23 | 5.2%), and Food Preparation & Serving (2 | 0.4%).
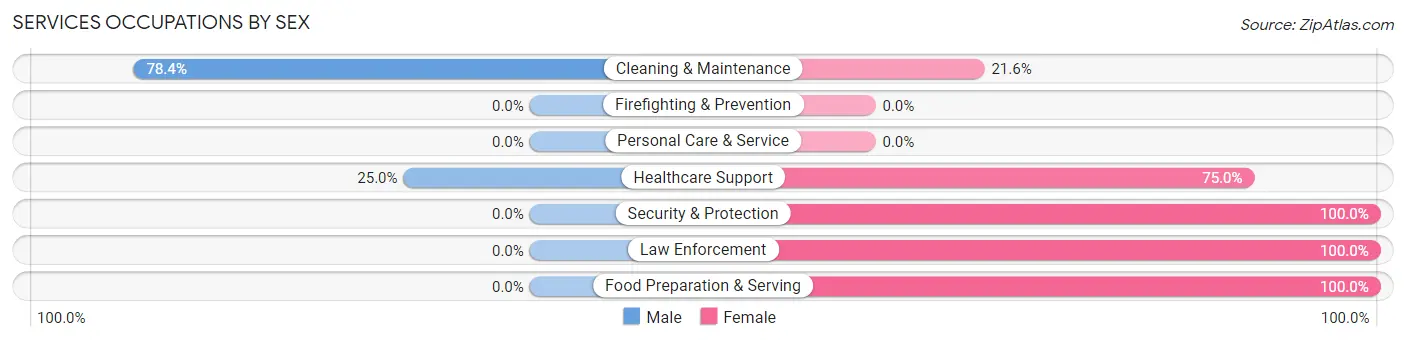
Services Occupations by Sex
Within the Services occupations in Fairplains, the most male-oriented occupations are Cleaning & Maintenance (78.4%), and Healthcare Support (25.0%), while the most female-oriented occupations are Security & Protection (100.0%), Law Enforcement (100.0%), and Food Preparation & Serving (100.0%).
| Occupation | Male | Female |
| Healthcare Support | 20 (25.0%) | 60 (75.0%) |
| Security & Protection | 0 (0.0%) | 23 (100.0%) |
| Firefighting & Prevention | 0 (0.0%) | 0 (0.0%) |
| Law Enforcement | 0 (0.0%) | 23 (100.0%) |
| Food Preparation & Serving | 0 (0.0%) | 2 (100.0%) |
| Cleaning & Maintenance | 40 (78.4%) | 11 (21.6%) |
| Personal Care & Service | 0 (0.0%) | 0 (0.0%) |
| Total (Category) | 60 (38.5%) | 96 (61.5%) |
| Total (Overall) | 237 (53.1%) | 209 (46.9%) |
Sales and Office Occupations
The most common Sales and Office occupations in Fairplains are Sales & Related (34 | 7.6%), and Office & Administration (30 | 6.7%).
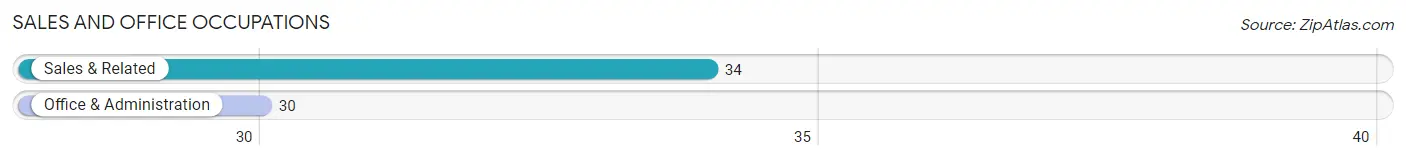
Sales and Office Occupations by Sex
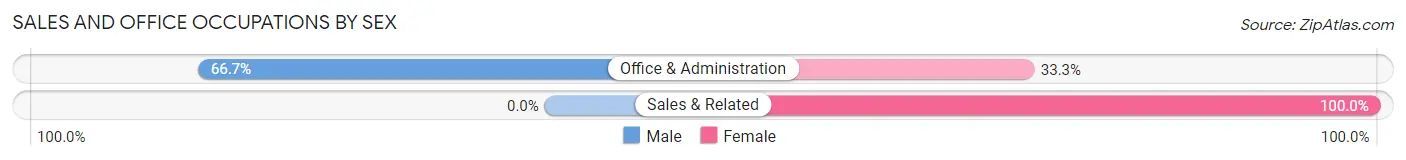
| Occupation | Male | Female |
| Sales & Related | 0 (0.0%) | 34 (100.0%) |
| Office & Administration | 20 (66.7%) | 10 (33.3%) |
| Total (Category) | 20 (31.2%) | 44 (68.8%) |
| Total (Overall) | 237 (53.1%) | 209 (46.9%) |
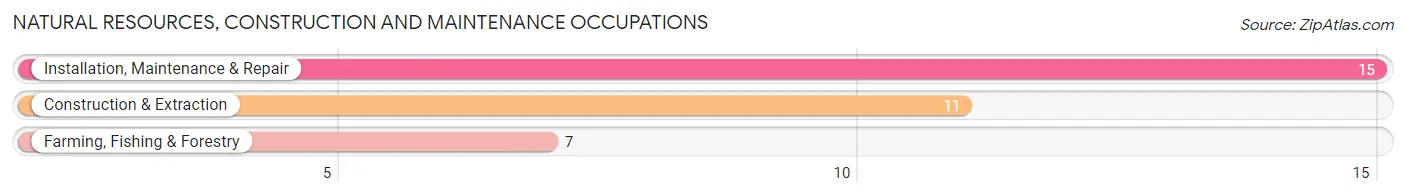
Natural Resources, Construction and Maintenance Occupations
The most common Natural Resources, Construction and Maintenance occupations in Fairplains are Installation, Maintenance & Repair (15 | 3.4%), Construction & Extraction (11 | 2.5%), and Farming, Fishing & Forestry (7 | 1.6%).
Natural Resources, Construction and Maintenance Occupations by Sex
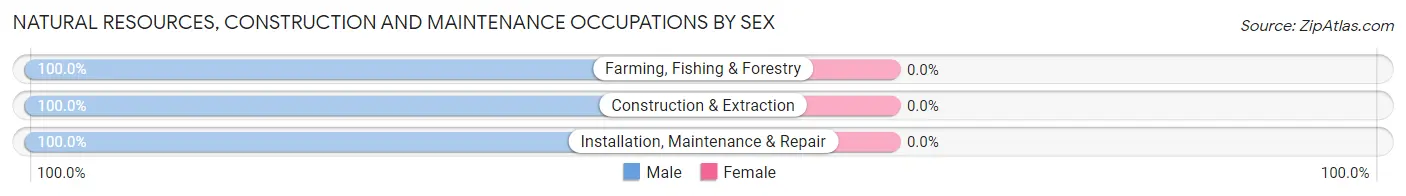
| Occupation | Male | Female |
| Farming, Fishing & Forestry | 7 (100.0%) | 0 (0.0%) |
| Construction & Extraction | 11 (100.0%) | 0 (0.0%) |
| Installation, Maintenance & Repair | 15 (100.0%) | 0 (0.0%) |
| Total (Category) | 33 (100.0%) | 0 (0.0%) |
| Total (Overall) | 237 (53.1%) | 209 (46.9%) |
Production, Transportation and Moving Occupations
The most common Production, Transportation and Moving occupations in Fairplains are Production (59 | 13.2%), and Material Moving (6 | 1.3%).
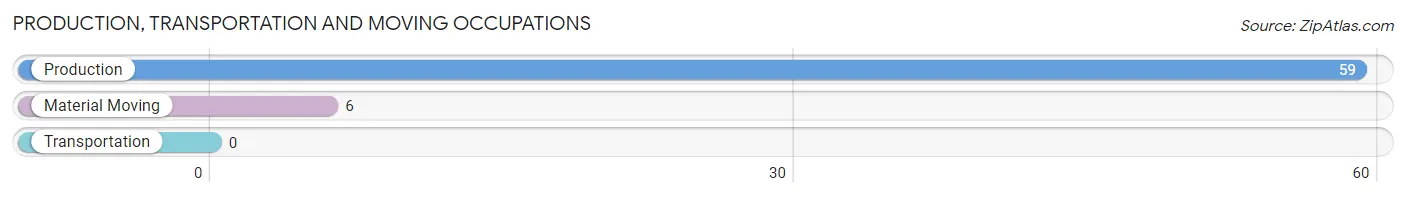
Production, Transportation and Moving Occupations by Sex
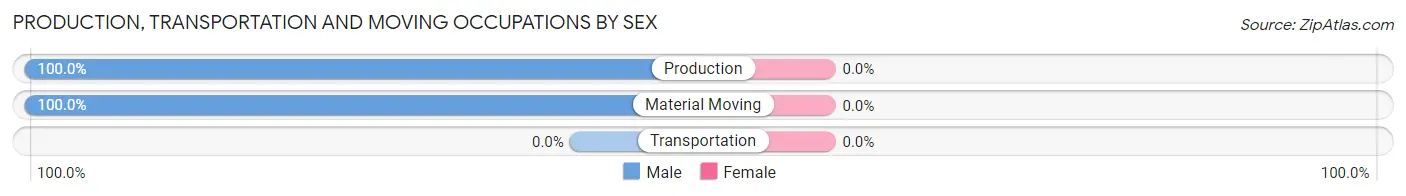
| Occupation | Male | Female |
| Production | 59 (100.0%) | 0 (0.0%) |
| Transportation | 0 (0.0%) | 0 (0.0%) |
| Material Moving | 6 (100.0%) | 0 (0.0%) |
| Total (Category) | 65 (100.0%) | 0 (0.0%) |
| Total (Overall) | 237 (53.1%) | 209 (46.9%) |
Employment Industries by Sex in Fairplains
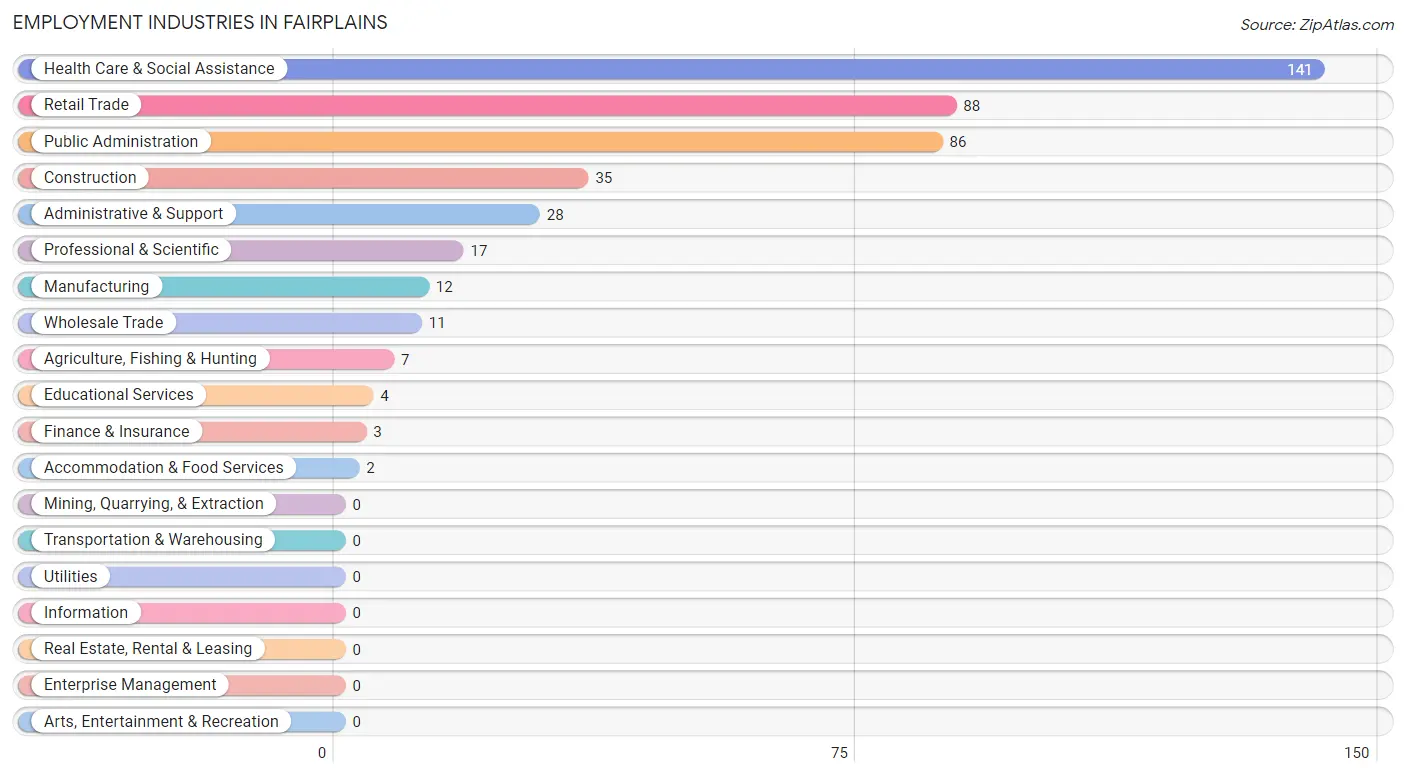
Employment Industries in Fairplains
The major employment industries in Fairplains include Health Care & Social Assistance (141 | 31.6%), Retail Trade (88 | 19.7%), Public Administration (86 | 19.3%), Construction (35 | 7.9%), and Administrative & Support (28 | 6.3%).
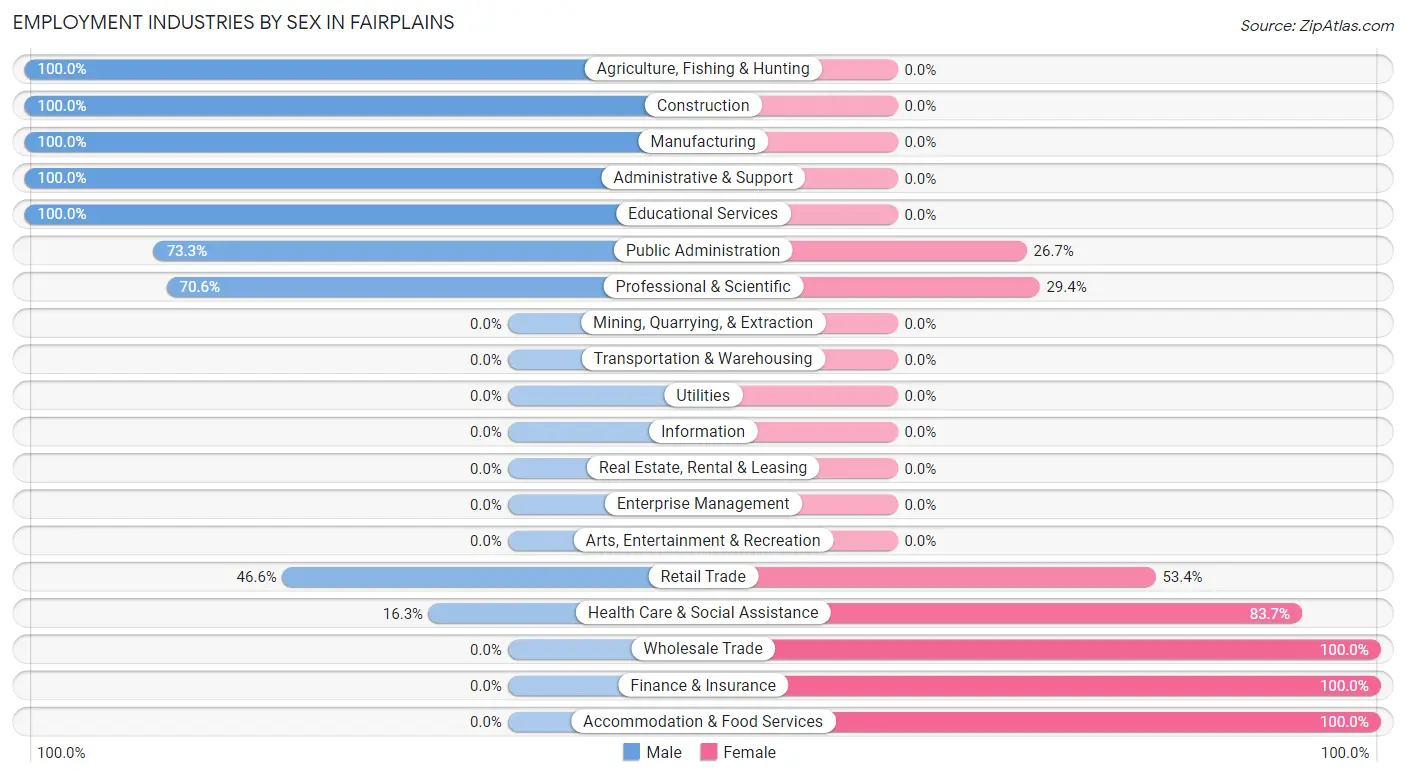
Employment Industries by Sex in Fairplains
The Fairplains industries that see more men than women are Agriculture, Fishing & Hunting (100.0%), Construction (100.0%), and Manufacturing (100.0%), whereas the industries that tend to have a higher number of women are Wholesale Trade (100.0%), Finance & Insurance (100.0%), and Accommodation & Food Services (100.0%).
| Industry | Male | Female |
| Agriculture, Fishing & Hunting | 7 (100.0%) | 0 (0.0%) |
| Mining, Quarrying, & Extraction | 0 (0.0%) | 0 (0.0%) |
| Construction | 35 (100.0%) | 0 (0.0%) |
| Manufacturing | 12 (100.0%) | 0 (0.0%) |
| Wholesale Trade | 0 (0.0%) | 11 (100.0%) |
| Retail Trade | 41 (46.6%) | 47 (53.4%) |
| Transportation & Warehousing | 0 (0.0%) | 0 (0.0%) |
| Utilities | 0 (0.0%) | 0 (0.0%) |
| Information | 0 (0.0%) | 0 (0.0%) |
| Finance & Insurance | 0 (0.0%) | 3 (100.0%) |
| Real Estate, Rental & Leasing | 0 (0.0%) | 0 (0.0%) |
| Professional & Scientific | 12 (70.6%) | 5 (29.4%) |
| Enterprise Management | 0 (0.0%) | 0 (0.0%) |
| Administrative & Support | 28 (100.0%) | 0 (0.0%) |
| Educational Services | 4 (100.0%) | 0 (0.0%) |
| Health Care & Social Assistance | 23 (16.3%) | 118 (83.7%) |
| Arts, Entertainment & Recreation | 0 (0.0%) | 0 (0.0%) |
| Accommodation & Food Services | 0 (0.0%) | 2 (100.0%) |
| Public Administration | 63 (73.3%) | 23 (26.7%) |
| Total | 237 (53.1%) | 209 (46.9%) |
Education in Fairplains
School Enrollment in Fairplains
The most common levels of schooling among the 256 students in Fairplains are elementary school (126 | 49.2%), high school (44 | 17.2%), and college / undergraduate (31 | 12.1%).
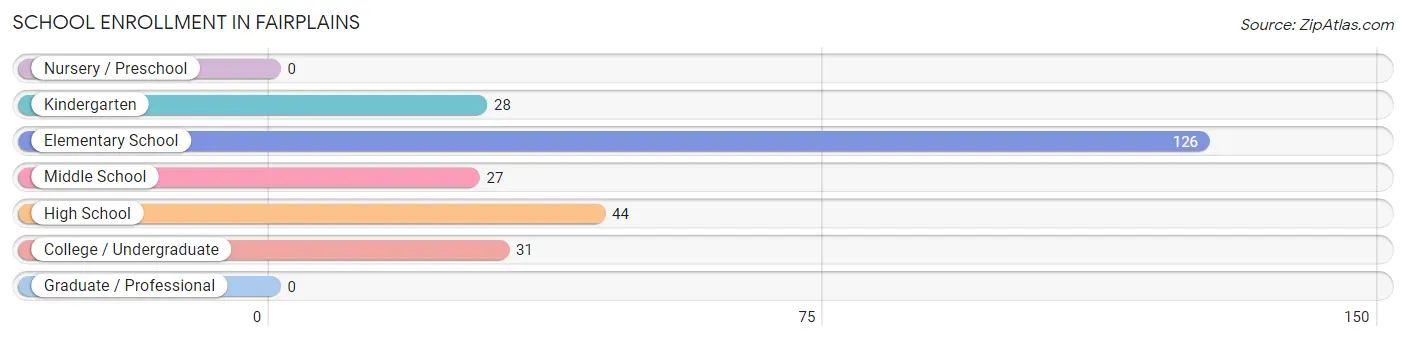
| School Level | # Students | % Students |
| Nursery / Preschool | 0 | 0.0% |
| Kindergarten | 28 | 10.9% |
| Elementary School | 126 | 49.2% |
| Middle School | 27 | 10.5% |
| High School | 44 | 17.2% |
| College / Undergraduate | 31 | 12.1% |
| Graduate / Professional | 0 | 0.0% |
| Total | 256 | 100.0% |
School Enrollment by Age by Funding Source in Fairplains
Out of a total of 256 students who are enrolled in schools in Fairplains, 28 (10.9%) attend a private institution, while the remaining 228 (89.1%) are enrolled in public schools. The age group of 5 to 9 year old has the highest likelihood of being enrolled in private schools, with 27 (17.5% in the age bracket) enrolled. Conversely, the age group of 10 to 14 year olds has the lowest likelihood of being enrolled in a private school, with 28 (100.0% in the age bracket) attending a public institution.
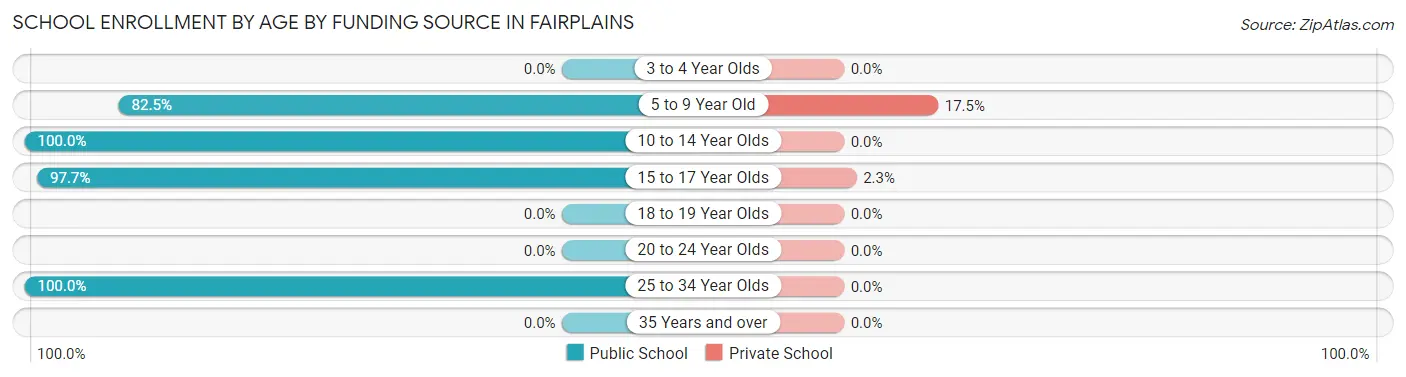
| Age Bracket | Public School | Private School |
| 3 to 4 Year Olds | 0 (0.0%) | 0 (0.0%) |
| 5 to 9 Year Old | 127 (82.5%) | 27 (17.5%) |
| 10 to 14 Year Olds | 28 (100.0%) | 0 (0.0%) |
| 15 to 17 Year Olds | 42 (97.7%) | 1 (2.3%) |
| 18 to 19 Year Olds | 0 (0.0%) | 0 (0.0%) |
| 20 to 24 Year Olds | 0 (0.0%) | 0 (0.0%) |
| 25 to 34 Year Olds | 31 (100.0%) | 0 (0.0%) |
| 35 Years and over | 0 (0.0%) | 0 (0.0%) |
| Total | 228 (89.1%) | 28 (10.9%) |
Educational Attainment by Field of Study in Fairplains
Business (43 | 29.0%), bio, nature & agricultural (40 | 27.0%), science & technology (22 | 14.9%), computers & mathematics (13 | 8.8%), and arts & humanities (12 | 8.1%) are the most common fields of study among 148 individuals in Fairplains who have obtained a bachelor's degree or higher.
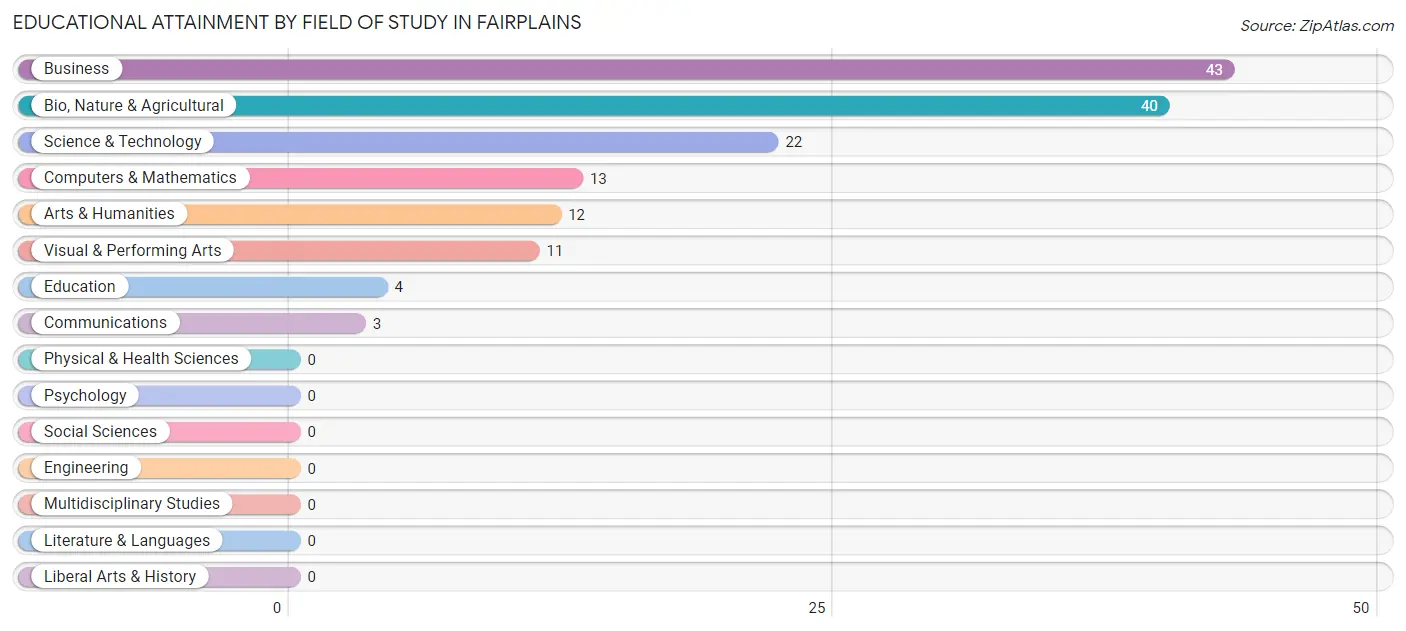
| Field of Study | # Graduates | % Graduates |
| Computers & Mathematics | 13 | 8.8% |
| Bio, Nature & Agricultural | 40 | 27.0% |
| Physical & Health Sciences | 0 | 0.0% |
| Psychology | 0 | 0.0% |
| Social Sciences | 0 | 0.0% |
| Engineering | 0 | 0.0% |
| Multidisciplinary Studies | 0 | 0.0% |
| Science & Technology | 22 | 14.9% |
| Business | 43 | 29.0% |
| Education | 4 | 2.7% |
| Literature & Languages | 0 | 0.0% |
| Liberal Arts & History | 0 | 0.0% |
| Visual & Performing Arts | 11 | 7.4% |
| Communications | 3 | 2.0% |
| Arts & Humanities | 12 | 8.1% |
| Total | 148 | 100.0% |
Transportation & Commute in Fairplains
Vehicle Availability by Sex in Fairplains
The most prevalent vehicle ownership categories in Fairplains are males with 2 vehicles (93, accounting for 42.1%) and females with 2 vehicles (51, making up 44.9%).
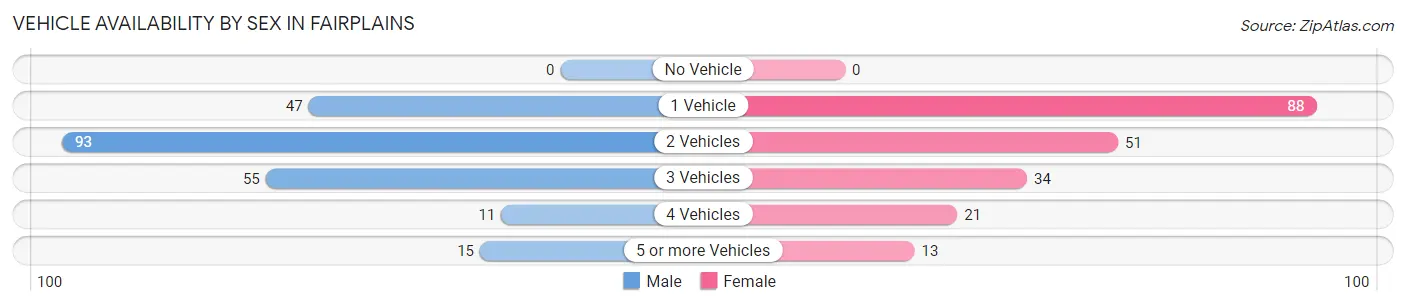
| Vehicles Available | Male | Female |
| No Vehicle | 0 (0.0%) | 0 (0.0%) |
| 1 Vehicle | 47 (21.3%) | 88 (42.5%) |
| 2 Vehicles | 93 (42.1%) | 51 (24.6%) |
| 3 Vehicles | 55 (24.9%) | 34 (16.4%) |
| 4 Vehicles | 11 (5.0%) | 21 (10.1%) |
| 5 or more Vehicles | 15 (6.8%) | 13 (6.3%) |
| Total | 221 (100.0%) | 207 (100.0%) |
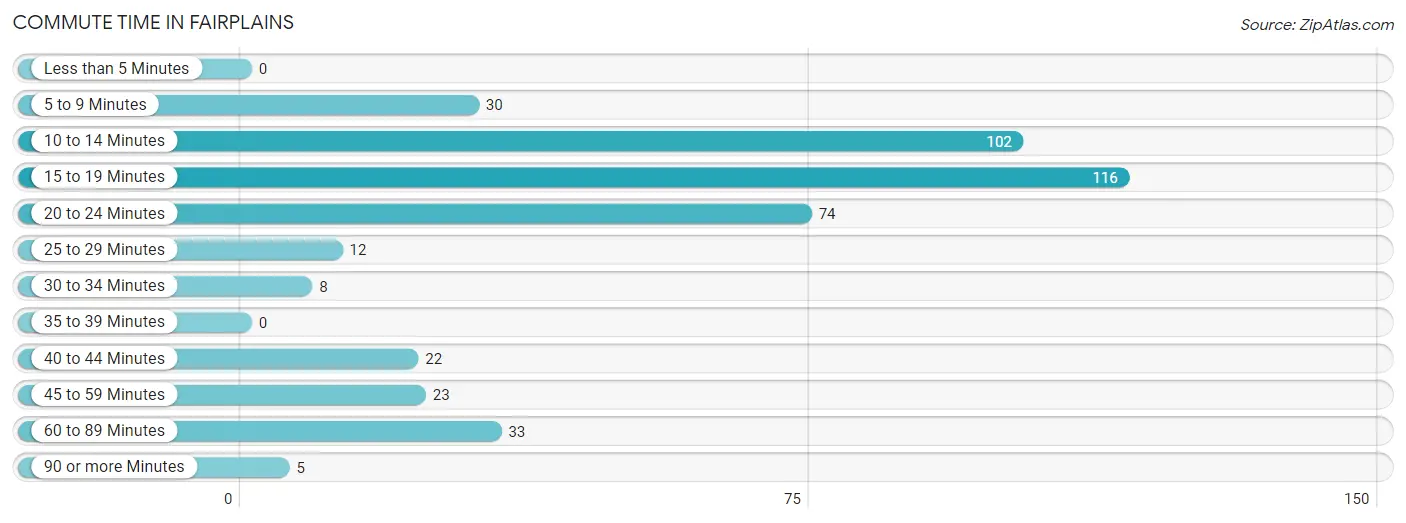
Commute Time in Fairplains
The most frequently occuring commute durations in Fairplains are 15 to 19 minutes (116 commuters, 27.3%), 10 to 14 minutes (102 commuters, 24.0%), and 20 to 24 minutes (74 commuters, 17.4%).
| Commute Time | # Commuters | % Commuters |
| Less than 5 Minutes | 0 | 0.0% |
| 5 to 9 Minutes | 30 | 7.1% |
| 10 to 14 Minutes | 102 | 24.0% |
| 15 to 19 Minutes | 116 | 27.3% |
| 20 to 24 Minutes | 74 | 17.4% |
| 25 to 29 Minutes | 12 | 2.8% |
| 30 to 34 Minutes | 8 | 1.9% |
| 35 to 39 Minutes | 0 | 0.0% |
| 40 to 44 Minutes | 22 | 5.2% |
| 45 to 59 Minutes | 23 | 5.4% |
| 60 to 89 Minutes | 33 | 7.8% |
| 90 or more Minutes | 5 | 1.2% |
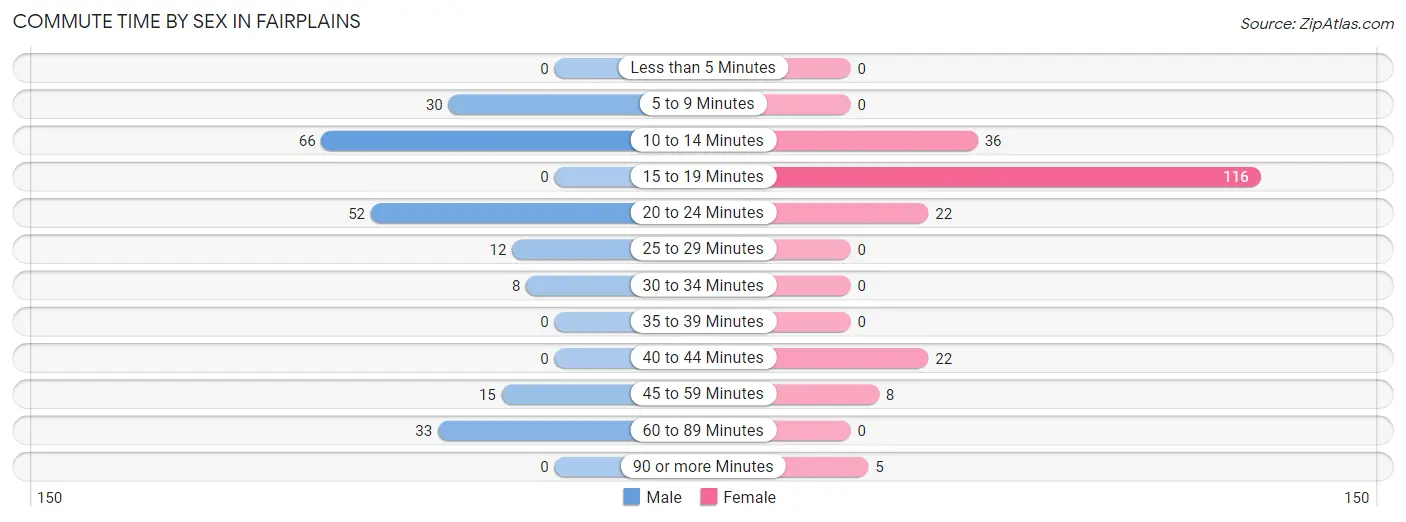
Commute Time by Sex in Fairplains
The most common commute times in Fairplains are 10 to 14 minutes (66 commuters, 30.6%) for males and 15 to 19 minutes (116 commuters, 55.5%) for females.
| Commute Time | Male | Female |
| Less than 5 Minutes | 0 (0.0%) | 0 (0.0%) |
| 5 to 9 Minutes | 30 (13.9%) | 0 (0.0%) |
| 10 to 14 Minutes | 66 (30.6%) | 36 (17.2%) |
| 15 to 19 Minutes | 0 (0.0%) | 116 (55.5%) |
| 20 to 24 Minutes | 52 (24.1%) | 22 (10.5%) |
| 25 to 29 Minutes | 12 (5.6%) | 0 (0.0%) |
| 30 to 34 Minutes | 8 (3.7%) | 0 (0.0%) |
| 35 to 39 Minutes | 0 (0.0%) | 0 (0.0%) |
| 40 to 44 Minutes | 0 (0.0%) | 22 (10.5%) |
| 45 to 59 Minutes | 15 (6.9%) | 8 (3.8%) |
| 60 to 89 Minutes | 33 (15.3%) | 0 (0.0%) |
| 90 or more Minutes | 0 (0.0%) | 5 (2.4%) |
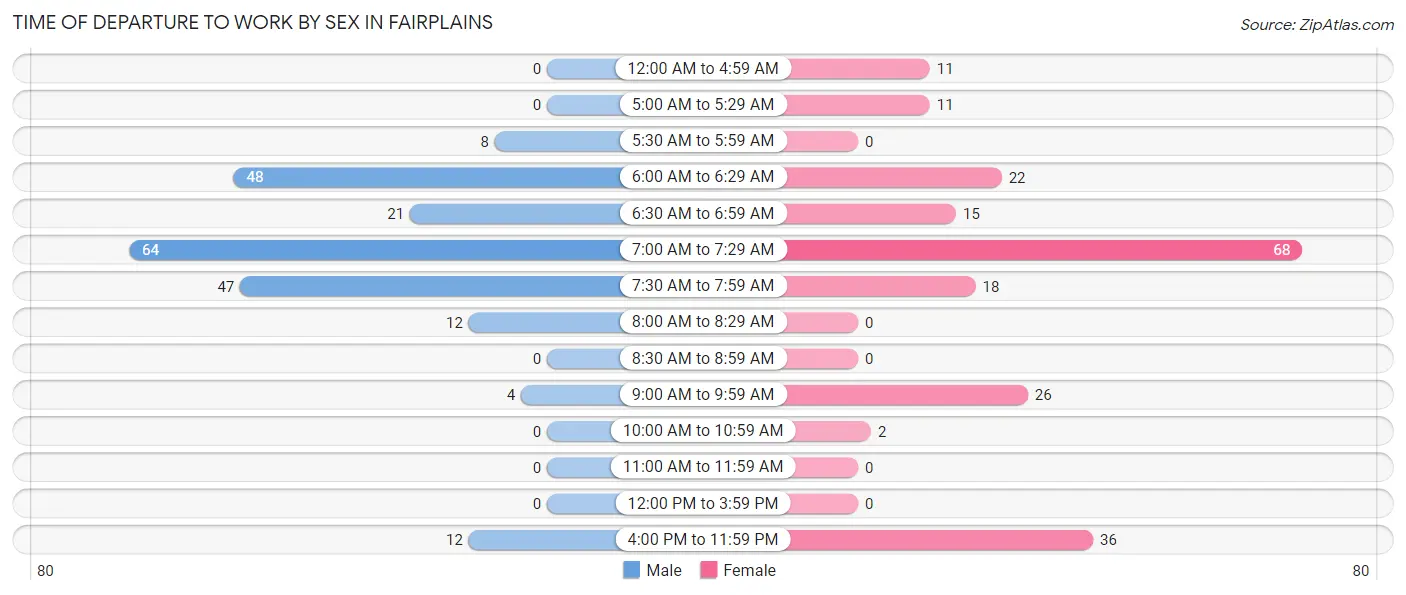
Time of Departure to Work by Sex in Fairplains
The most frequent times of departure to work in Fairplains are 7:00 AM to 7:29 AM (64, 29.6%) for males and 7:00 AM to 7:29 AM (68, 32.5%) for females.
| Time of Departure | Male | Female |
| 12:00 AM to 4:59 AM | 0 (0.0%) | 11 (5.3%) |
| 5:00 AM to 5:29 AM | 0 (0.0%) | 11 (5.3%) |
| 5:30 AM to 5:59 AM | 8 (3.7%) | 0 (0.0%) |
| 6:00 AM to 6:29 AM | 48 (22.2%) | 22 (10.5%) |
| 6:30 AM to 6:59 AM | 21 (9.7%) | 15 (7.2%) |
| 7:00 AM to 7:29 AM | 64 (29.6%) | 68 (32.5%) |
| 7:30 AM to 7:59 AM | 47 (21.8%) | 18 (8.6%) |
| 8:00 AM to 8:29 AM | 12 (5.6%) | 0 (0.0%) |
| 8:30 AM to 8:59 AM | 0 (0.0%) | 0 (0.0%) |
| 9:00 AM to 9:59 AM | 4 (1.8%) | 26 (12.4%) |
| 10:00 AM to 10:59 AM | 0 (0.0%) | 2 (1.0%) |
| 11:00 AM to 11:59 AM | 0 (0.0%) | 0 (0.0%) |
| 12:00 PM to 3:59 PM | 0 (0.0%) | 0 (0.0%) |
| 4:00 PM to 11:59 PM | 12 (5.6%) | 36 (17.2%) |
| Total | 216 (100.0%) | 209 (100.0%) |
Housing Occupancy in Fairplains
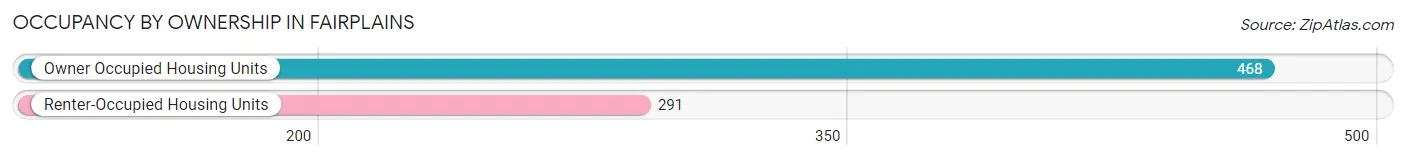
Occupancy by Ownership in Fairplains
Of the total 759 dwellings in Fairplains, owner-occupied units account for 468 (61.7%), while renter-occupied units make up 291 (38.3%).
| Occupancy | # Housing Units | % Housing Units |
| Owner Occupied Housing Units | 468 | 61.7% |
| Renter-Occupied Housing Units | 291 | 38.3% |
| Total Occupied Housing Units | 759 | 100.0% |
Occupancy by Household Size in Fairplains
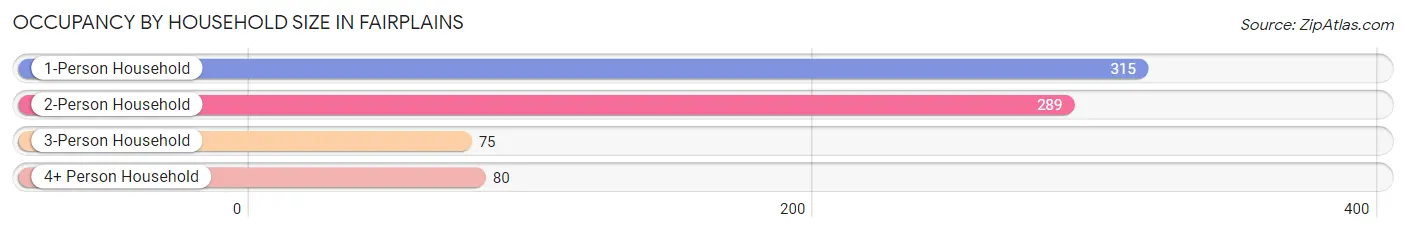
| Household Size | # Housing Units | % Housing Units |
| 1-Person Household | 315 | 41.5% |
| 2-Person Household | 289 | 38.1% |
| 3-Person Household | 75 | 9.9% |
| 4+ Person Household | 80 | 10.5% |
| Total Housing Units | 759 | 100.0% |
Occupancy by Ownership by Household Size in Fairplains
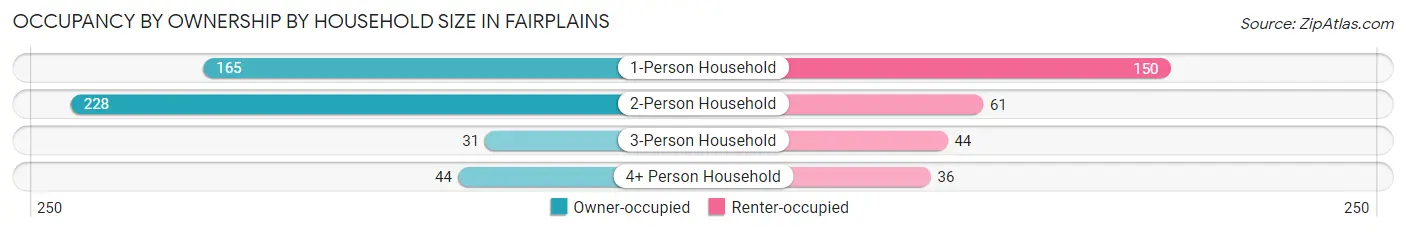
| Household Size | Owner-occupied | Renter-occupied |
| 1-Person Household | 165 (52.4%) | 150 (47.6%) |
| 2-Person Household | 228 (78.9%) | 61 (21.1%) |
| 3-Person Household | 31 (41.3%) | 44 (58.7%) |
| 4+ Person Household | 44 (55.0%) | 36 (45.0%) |
| Total Housing Units | 468 (61.7%) | 291 (38.3%) |
Occupancy by Educational Attainment in Fairplains
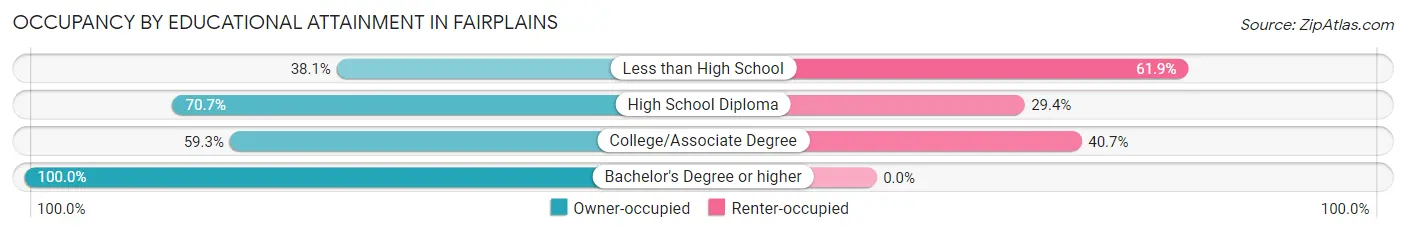
| Household Size | Owner-occupied | Renter-occupied |
| Less than High School | 77 (38.1%) | 125 (61.9%) |
| High School Diploma | 195 (70.7%) | 81 (29.3%) |
| College/Associate Degree | 124 (59.3%) | 85 (40.7%) |
| Bachelor's Degree or higher | 72 (100.0%) | 0 (0.0%) |
Occupancy by Age of Householder in Fairplains
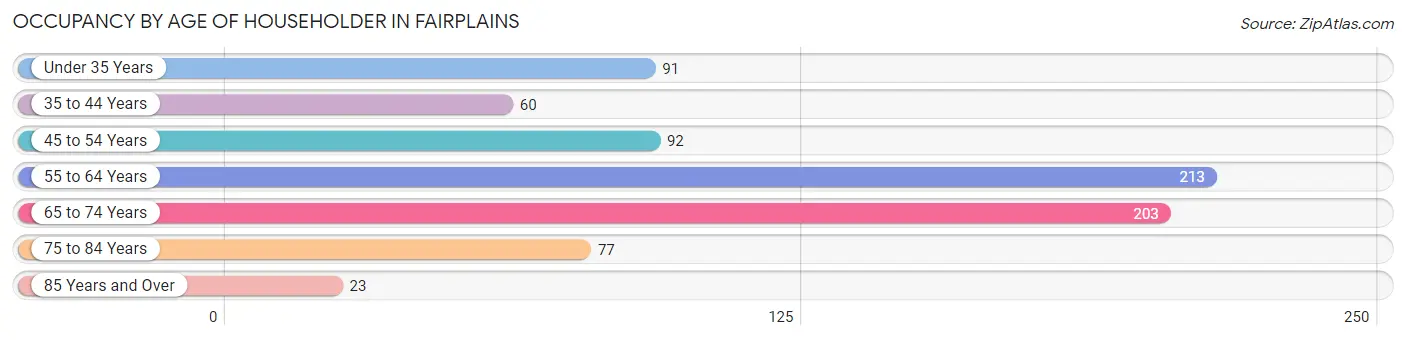
| Age Bracket | # Households | % Households |
| Under 35 Years | 91 | 12.0% |
| 35 to 44 Years | 60 | 7.9% |
| 45 to 54 Years | 92 | 12.1% |
| 55 to 64 Years | 213 | 28.1% |
| 65 to 74 Years | 203 | 26.8% |
| 75 to 84 Years | 77 | 10.1% |
| 85 Years and Over | 23 | 3.0% |
| Total | 759 | 100.0% |
Housing Finances in Fairplains
Median Income by Occupancy in Fairplains
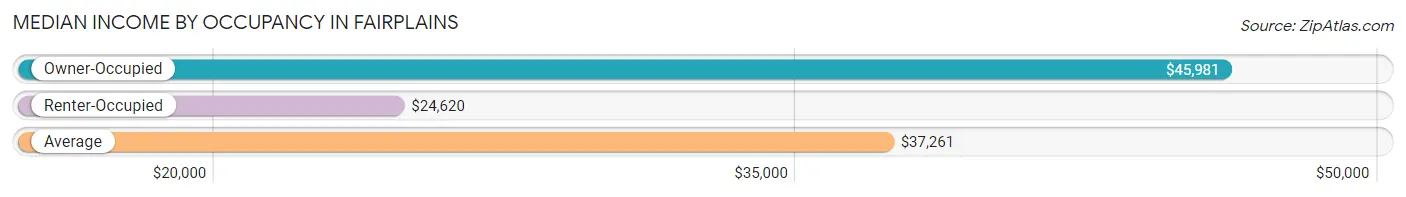
| Occupancy Type | # Households | Median Income |
| Owner-Occupied | 468 (61.7%) | $45,981 |
| Renter-Occupied | 291 (38.3%) | $24,620 |
| Average | 759 (100.0%) | $37,261 |
Occupancy by Householder Income Bracket in Fairplains
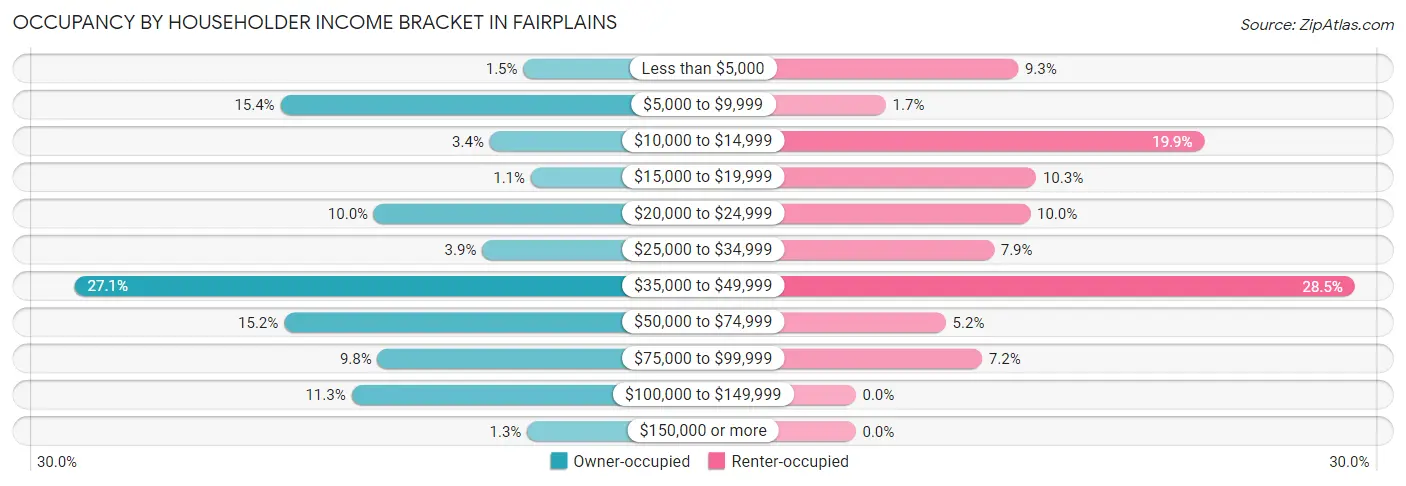
| Income Bracket | Owner-occupied | Renter-occupied |
| Less than $5,000 | 7 (1.5%) | 27 (9.3%) |
| $5,000 to $9,999 | 72 (15.4%) | 5 (1.7%) |
| $10,000 to $14,999 | 16 (3.4%) | 58 (19.9%) |
| $15,000 to $19,999 | 5 (1.1%) | 30 (10.3%) |
| $20,000 to $24,999 | 47 (10.0%) | 29 (10.0%) |
| $25,000 to $34,999 | 18 (3.8%) | 23 (7.9%) |
| $35,000 to $49,999 | 127 (27.1%) | 83 (28.5%) |
| $50,000 to $74,999 | 71 (15.2%) | 15 (5.1%) |
| $75,000 to $99,999 | 46 (9.8%) | 21 (7.2%) |
| $100,000 to $149,999 | 53 (11.3%) | 0 (0.0%) |
| $150,000 or more | 6 (1.3%) | 0 (0.0%) |
| Total | 468 (100.0%) | 291 (100.0%) |
Monthly Housing Cost Tiers in Fairplains
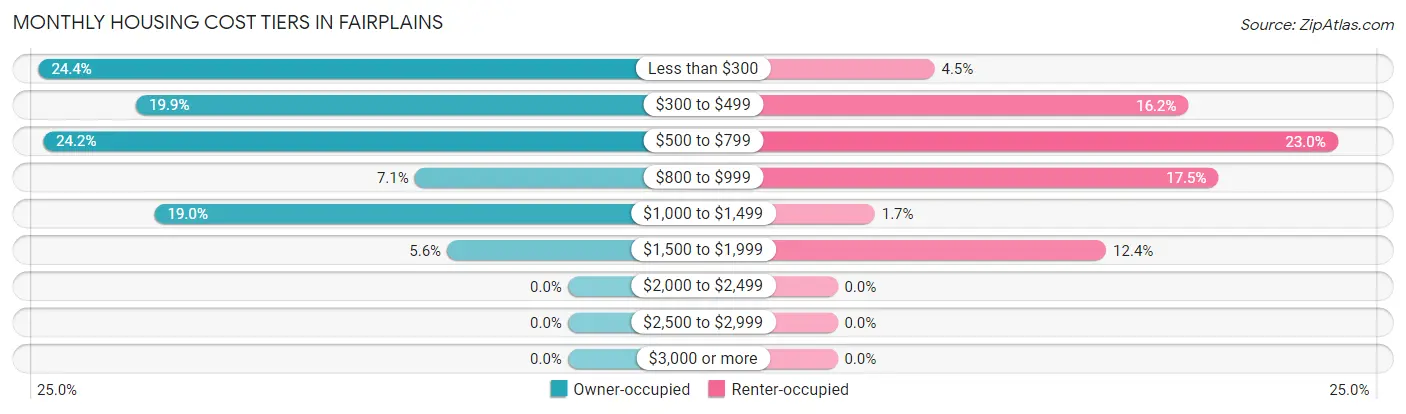
| Monthly Cost | Owner-occupied | Renter-occupied |
| Less than $300 | 114 (24.4%) | 13 (4.5%) |
| $300 to $499 | 93 (19.9%) | 47 (16.2%) |
| $500 to $799 | 113 (24.1%) | 67 (23.0%) |
| $800 to $999 | 33 (7.0%) | 51 (17.5%) |
| $1,000 to $1,499 | 89 (19.0%) | 5 (1.7%) |
| $1,500 to $1,999 | 26 (5.6%) | 36 (12.4%) |
| $2,000 to $2,499 | 0 (0.0%) | 0 (0.0%) |
| $2,500 to $2,999 | 0 (0.0%) | 0 (0.0%) |
| $3,000 or more | 0 (0.0%) | 0 (0.0%) |
| Total | 468 (100.0%) | 291 (100.0%) |
Physical Housing Characteristics in Fairplains
Housing Structures in Fairplains
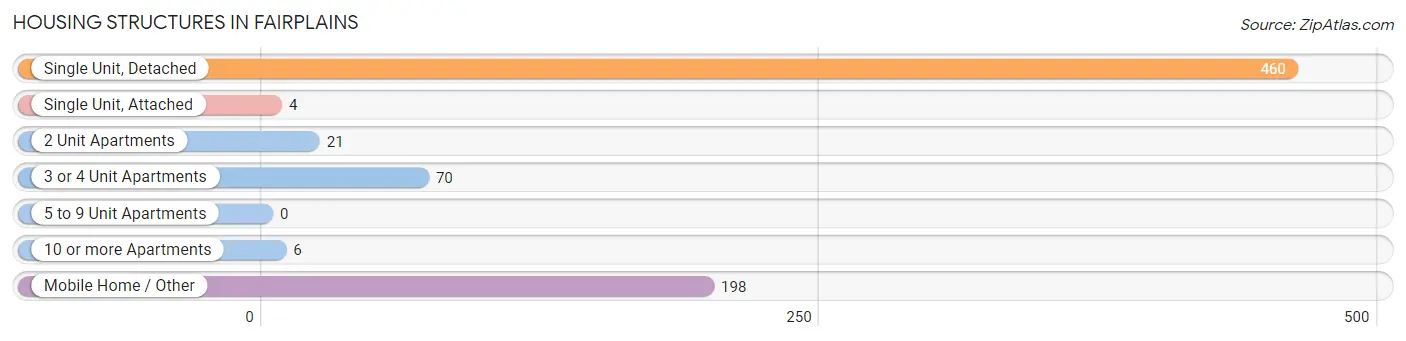
| Structure Type | # Housing Units | % Housing Units |
| Single Unit, Detached | 460 | 60.6% |
| Single Unit, Attached | 4 | 0.5% |
| 2 Unit Apartments | 21 | 2.8% |
| 3 or 4 Unit Apartments | 70 | 9.2% |
| 5 to 9 Unit Apartments | 0 | 0.0% |
| 10 or more Apartments | 6 | 0.8% |
| Mobile Home / Other | 198 | 26.1% |
| Total | 759 | 100.0% |
Housing Structures by Occupancy in Fairplains
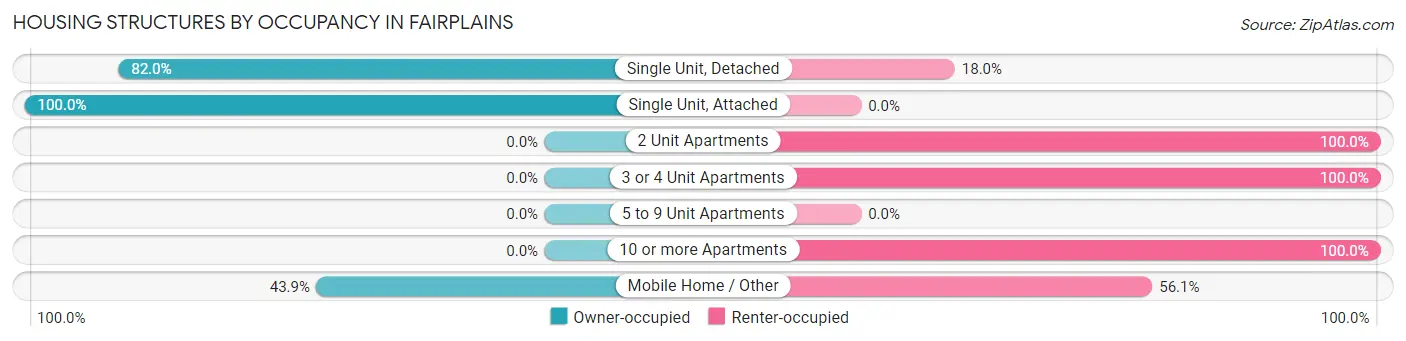
| Structure Type | Owner-occupied | Renter-occupied |
| Single Unit, Detached | 377 (82.0%) | 83 (18.0%) |
| Single Unit, Attached | 4 (100.0%) | 0 (0.0%) |
| 2 Unit Apartments | 0 (0.0%) | 21 (100.0%) |
| 3 or 4 Unit Apartments | 0 (0.0%) | 70 (100.0%) |
| 5 to 9 Unit Apartments | 0 (0.0%) | 0 (0.0%) |
| 10 or more Apartments | 0 (0.0%) | 6 (100.0%) |
| Mobile Home / Other | 87 (43.9%) | 111 (56.1%) |
| Total | 468 (61.7%) | 291 (38.3%) |
Housing Structures by Number of Rooms in Fairplains
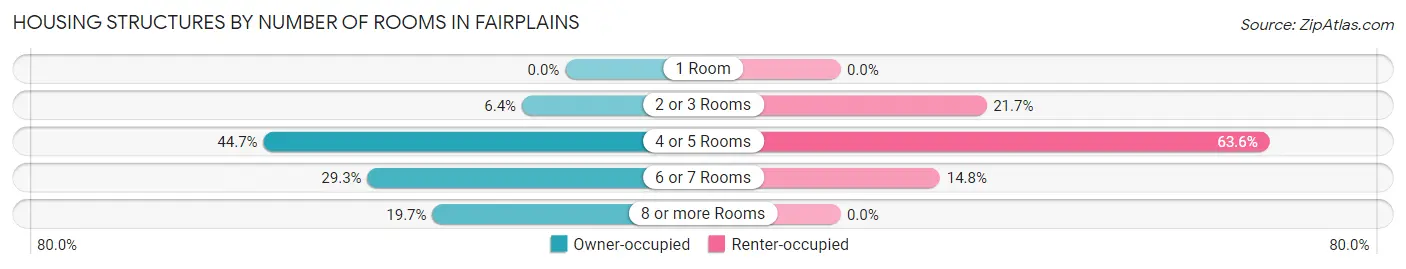
| Number of Rooms | Owner-occupied | Renter-occupied |
| 1 Room | 0 (0.0%) | 0 (0.0%) |
| 2 or 3 Rooms | 30 (6.4%) | 63 (21.6%) |
| 4 or 5 Rooms | 209 (44.7%) | 185 (63.6%) |
| 6 or 7 Rooms | 137 (29.3%) | 43 (14.8%) |
| 8 or more Rooms | 92 (19.7%) | 0 (0.0%) |
| Total | 468 (100.0%) | 291 (100.0%) |
Housing Structure by Heating Type in Fairplains
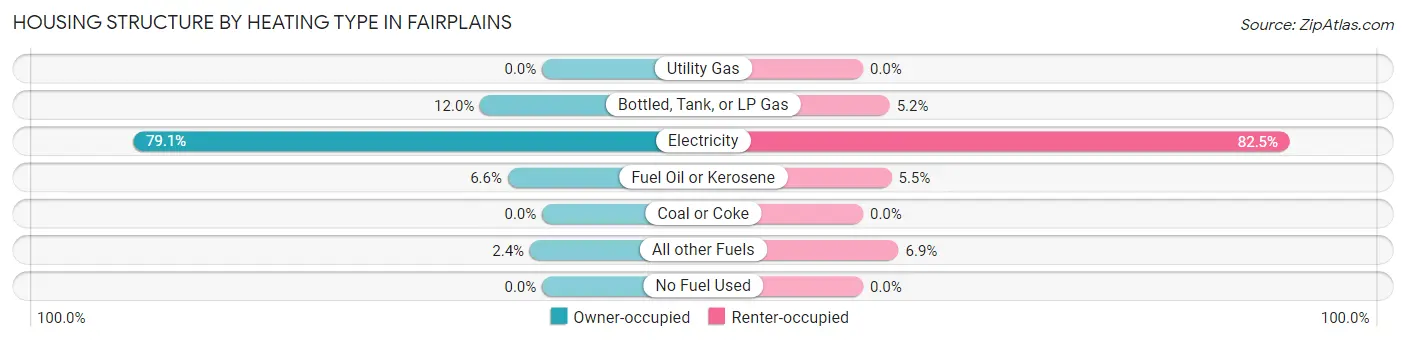
| Heating Type | Owner-occupied | Renter-occupied |
| Utility Gas | 0 (0.0%) | 0 (0.0%) |
| Bottled, Tank, or LP Gas | 56 (12.0%) | 15 (5.1%) |
| Electricity | 370 (79.1%) | 240 (82.5%) |
| Fuel Oil or Kerosene | 31 (6.6%) | 16 (5.5%) |
| Coal or Coke | 0 (0.0%) | 0 (0.0%) |
| All other Fuels | 11 (2.4%) | 20 (6.9%) |
| No Fuel Used | 0 (0.0%) | 0 (0.0%) |
| Total | 468 (100.0%) | 291 (100.0%) |
Household Vehicle Usage in Fairplains
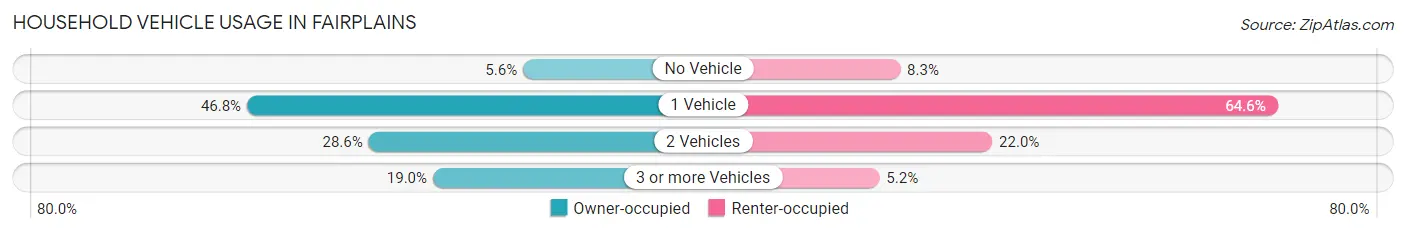
| Vehicles per Household | Owner-occupied | Renter-occupied |
| No Vehicle | 26 (5.6%) | 24 (8.3%) |
| 1 Vehicle | 219 (46.8%) | 188 (64.6%) |
| 2 Vehicles | 134 (28.6%) | 64 (22.0%) |
| 3 or more Vehicles | 89 (19.0%) | 15 (5.1%) |
| Total | 468 (100.0%) | 291 (100.0%) |
Real Estate & Mortgages in Fairplains
Real Estate and Mortgage Overview in Fairplains
| Characteristic | Without Mortgage | With Mortgage |
| Housing Units | 239 | 229 |
| Median Property Value | $128,100 | $123,600 |
| Median Household Income | $42,292 | $0 |
| Monthly Housing Costs | $310 | $0 |
| Real Estate Taxes | $589 | $0 |
Property Value by Mortgage Status in Fairplains
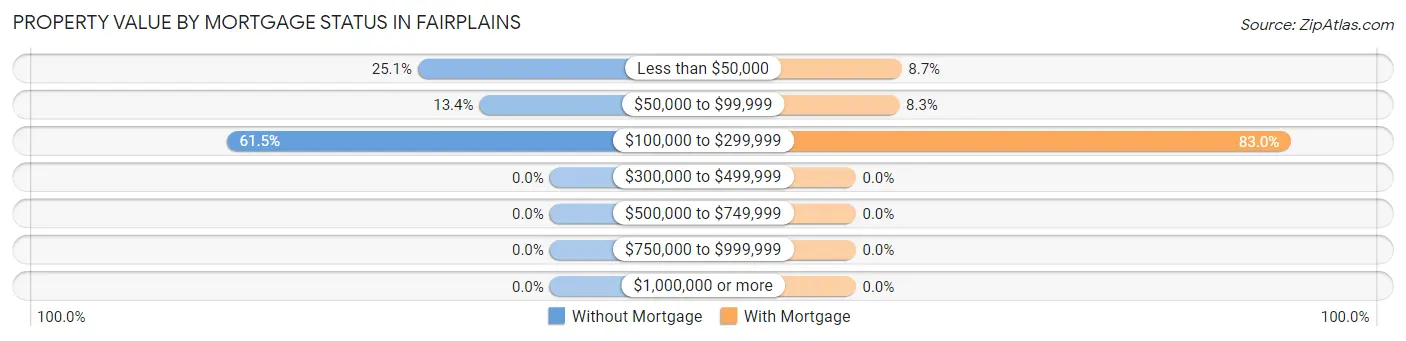
| Property Value | Without Mortgage | With Mortgage |
| Less than $50,000 | 60 (25.1%) | 20 (8.7%) |
| $50,000 to $99,999 | 32 (13.4%) | 19 (8.3%) |
| $100,000 to $299,999 | 147 (61.5%) | 190 (83.0%) |
| $300,000 to $499,999 | 0 (0.0%) | 0 (0.0%) |
| $500,000 to $749,999 | 0 (0.0%) | 0 (0.0%) |
| $750,000 to $999,999 | 0 (0.0%) | 0 (0.0%) |
| $1,000,000 or more | 0 (0.0%) | 0 (0.0%) |
| Total | 239 (100.0%) | 229 (100.0%) |
Household Income by Mortgage Status in Fairplains
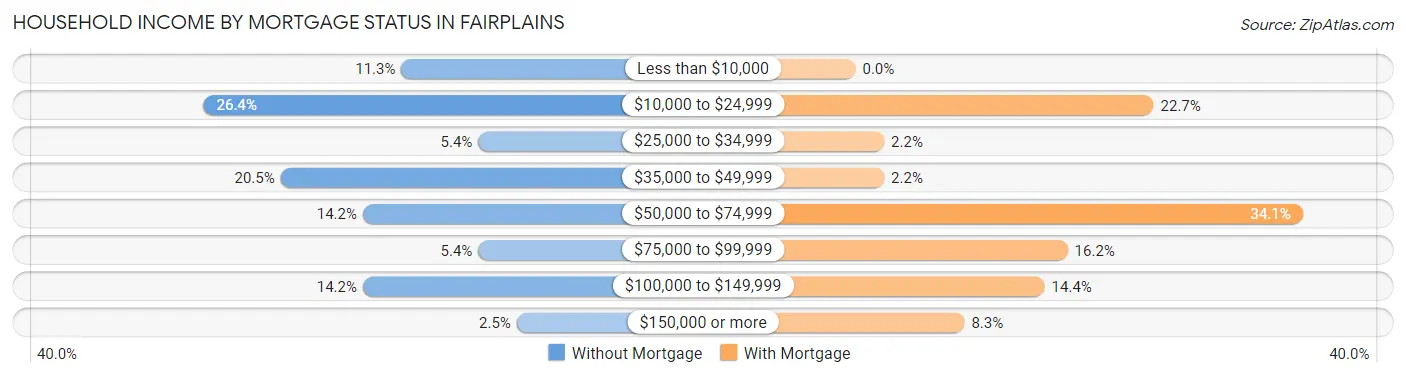
| Household Income | Without Mortgage | With Mortgage |
| Less than $10,000 | 27 (11.3%) | 0 (0.0%) |
| $10,000 to $24,999 | 63 (26.4%) | 52 (22.7%) |
| $25,000 to $34,999 | 13 (5.4%) | 5 (2.2%) |
| $35,000 to $49,999 | 49 (20.5%) | 5 (2.2%) |
| $50,000 to $74,999 | 34 (14.2%) | 78 (34.1%) |
| $75,000 to $99,999 | 13 (5.4%) | 37 (16.2%) |
| $100,000 to $149,999 | 34 (14.2%) | 33 (14.4%) |
| $150,000 or more | 6 (2.5%) | 19 (8.3%) |
| Total | 239 (100.0%) | 229 (100.0%) |
Property Value to Household Income Ratio in Fairplains
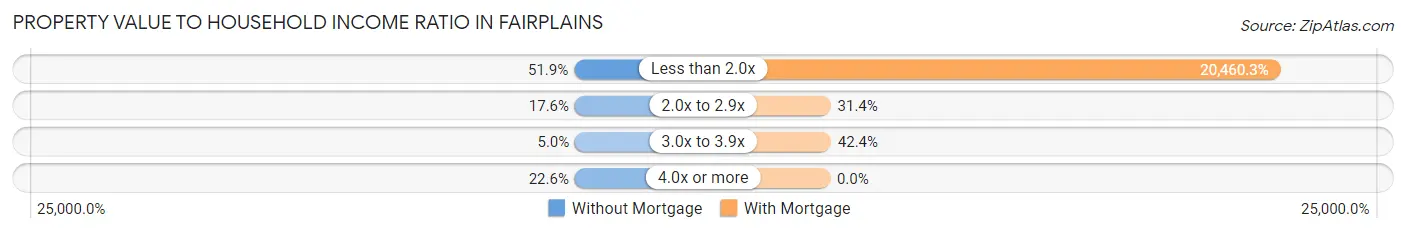
| Value-to-Income Ratio | Without Mortgage | With Mortgage |
| Less than 2.0x | 124 (51.9%) | 46,854 (20,460.3%) |
| 2.0x to 2.9x | 42 (17.6%) | 72 (31.4%) |
| 3.0x to 3.9x | 12 (5.0%) | 97 (42.4%) |
| 4.0x or more | 54 (22.6%) | 0 (0.0%) |
| Total | 239 (100.0%) | 229 (100.0%) |
Real Estate Taxes by Mortgage Status in Fairplains
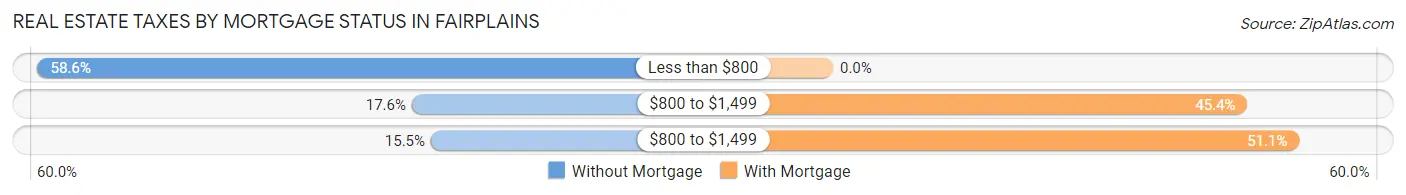
| Property Taxes | Without Mortgage | With Mortgage |
| Less than $800 | 140 (58.6%) | 0 (0.0%) |
| $800 to $1,499 | 42 (17.6%) | 104 (45.4%) |
| $800 to $1,499 | 37 (15.5%) | 117 (51.1%) |
| Total | 239 (100.0%) | 229 (100.0%) |
Health & Disability in Fairplains
Health Insurance Coverage by Age in Fairplains
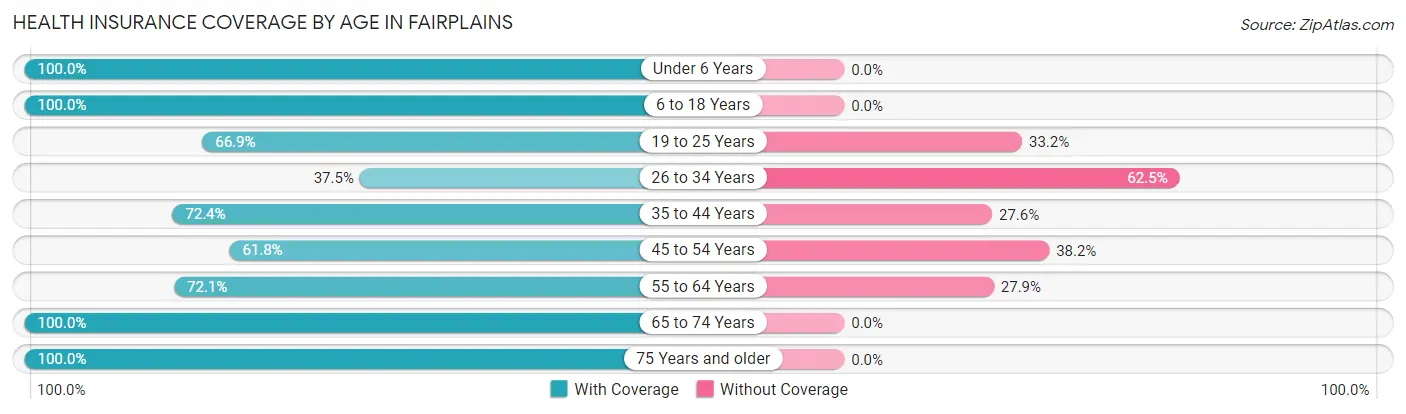
| Age Bracket | With Coverage | Without Coverage |
| Under 6 Years | 43 (100.0%) | 0 (0.0%) |
| 6 to 18 Years | 220 (100.0%) | 0 (0.0%) |
| 19 to 25 Years | 119 (66.8%) | 59 (33.2%) |
| 26 to 34 Years | 42 (37.5%) | 70 (62.5%) |
| 35 to 44 Years | 92 (72.4%) | 35 (27.6%) |
| 45 to 54 Years | 131 (61.8%) | 81 (38.2%) |
| 55 to 64 Years | 243 (72.1%) | 94 (27.9%) |
| 65 to 74 Years | 343 (100.0%) | 0 (0.0%) |
| 75 Years and older | 131 (100.0%) | 0 (0.0%) |
| Total | 1,364 (80.1%) | 339 (19.9%) |
Health Insurance Coverage by Citizenship Status in Fairplains
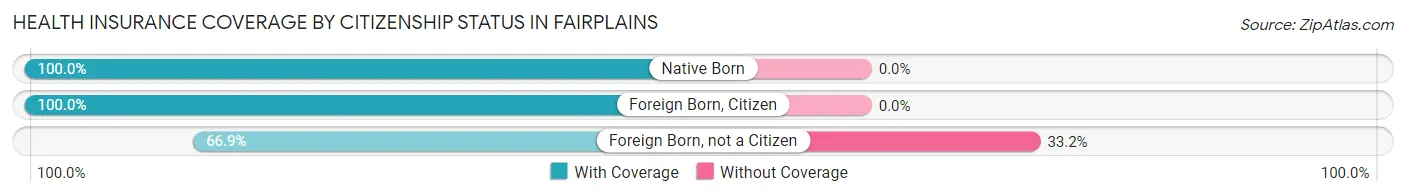
| Citizenship Status | With Coverage | Without Coverage |
| Native Born | 43 (100.0%) | 0 (0.0%) |
| Foreign Born, Citizen | 220 (100.0%) | 0 (0.0%) |
| Foreign Born, not a Citizen | 119 (66.8%) | 59 (33.2%) |
Health Insurance Coverage by Household Income in Fairplains
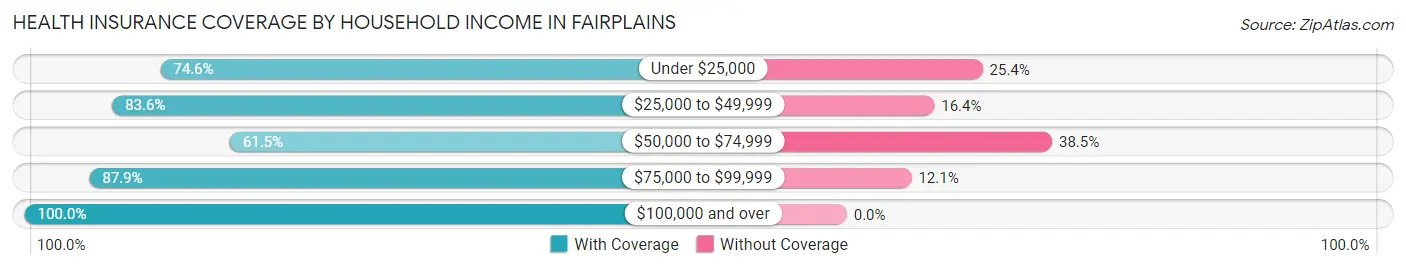
| Household Income | With Coverage | Without Coverage |
| Under $25,000 | 422 (74.6%) | 144 (25.4%) |
| $25,000 to $49,999 | 581 (83.6%) | 114 (16.4%) |
| $50,000 to $74,999 | 104 (61.5%) | 65 (38.5%) |
| $75,000 to $99,999 | 116 (87.9%) | 16 (12.1%) |
| $100,000 and over | 131 (100.0%) | 0 (0.0%) |
Public vs Private Health Insurance Coverage by Age in Fairplains
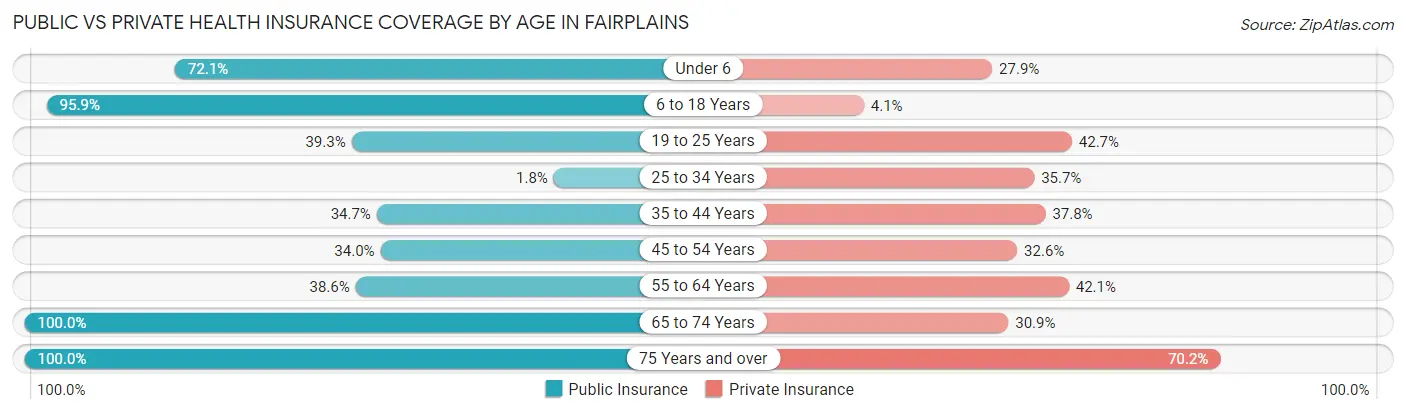
| Age Bracket | Public Insurance | Private Insurance |
| Under 6 | 31 (72.1%) | 12 (27.9%) |
| 6 to 18 Years | 211 (95.9%) | 9 (4.1%) |
| 19 to 25 Years | 70 (39.3%) | 76 (42.7%) |
| 25 to 34 Years | 2 (1.8%) | 40 (35.7%) |
| 35 to 44 Years | 44 (34.6%) | 48 (37.8%) |
| 45 to 54 Years | 72 (34.0%) | 69 (32.6%) |
| 55 to 64 Years | 130 (38.6%) | 142 (42.1%) |
| 65 to 74 Years | 343 (100.0%) | 106 (30.9%) |
| 75 Years and over | 131 (100.0%) | 92 (70.2%) |
| Total | 1,034 (60.7%) | 594 (34.9%) |
Disability Status by Sex by Age in Fairplains
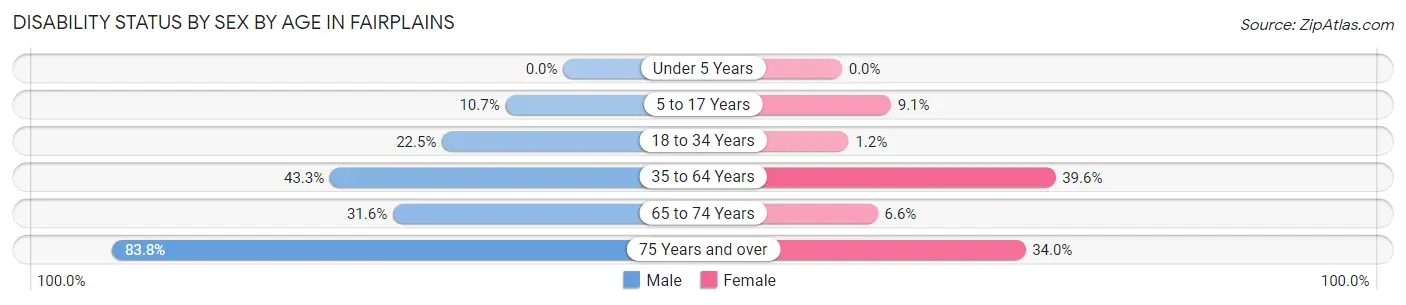
| Age Bracket | Male | Female |
| Under 5 Years | 0 (0.0%) | 0 (0.0%) |
| 5 to 17 Years | 13 (10.7%) | 9 (9.1%) |
| 18 to 34 Years | 29 (22.5%) | 2 (1.2%) |
| 35 to 64 Years | 178 (43.3%) | 105 (39.6%) |
| 65 to 74 Years | 37 (31.6%) | 15 (6.6%) |
| 75 Years and over | 31 (83.8%) | 32 (34.0%) |
Disability Class by Sex by Age in Fairplains
Disability Class: Hearing Difficulty
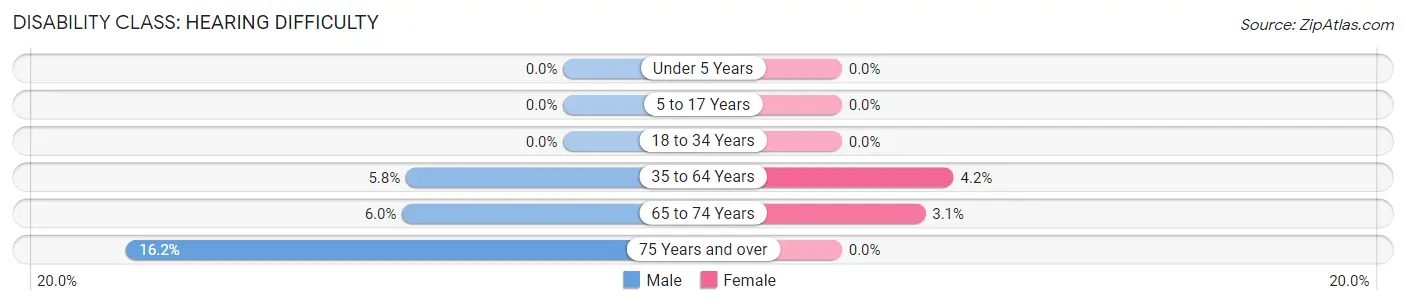
| Age Bracket | Male | Female |
| Under 5 Years | 0 (0.0%) | 0 (0.0%) |
| 5 to 17 Years | 0 (0.0%) | 0 (0.0%) |
| 18 to 34 Years | 0 (0.0%) | 0 (0.0%) |
| 35 to 64 Years | 24 (5.8%) | 11 (4.2%) |
| 65 to 74 Years | 7 (6.0%) | 7 (3.1%) |
| 75 Years and over | 6 (16.2%) | 0 (0.0%) |
Disability Class: Vision Difficulty
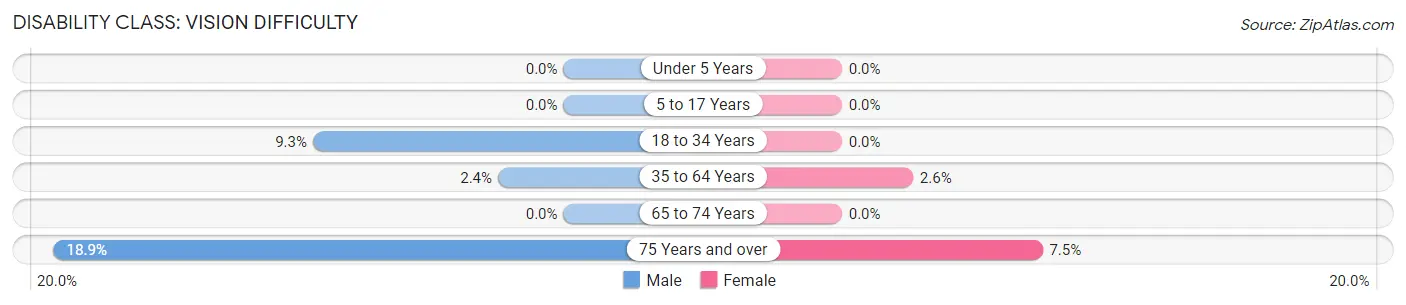
| Age Bracket | Male | Female |
| Under 5 Years | 0 (0.0%) | 0 (0.0%) |
| 5 to 17 Years | 0 (0.0%) | 0 (0.0%) |
| 18 to 34 Years | 12 (9.3%) | 0 (0.0%) |
| 35 to 64 Years | 10 (2.4%) | 7 (2.6%) |
| 65 to 74 Years | 0 (0.0%) | 0 (0.0%) |
| 75 Years and over | 7 (18.9%) | 7 (7.4%) |
Disability Class: Cognitive Difficulty
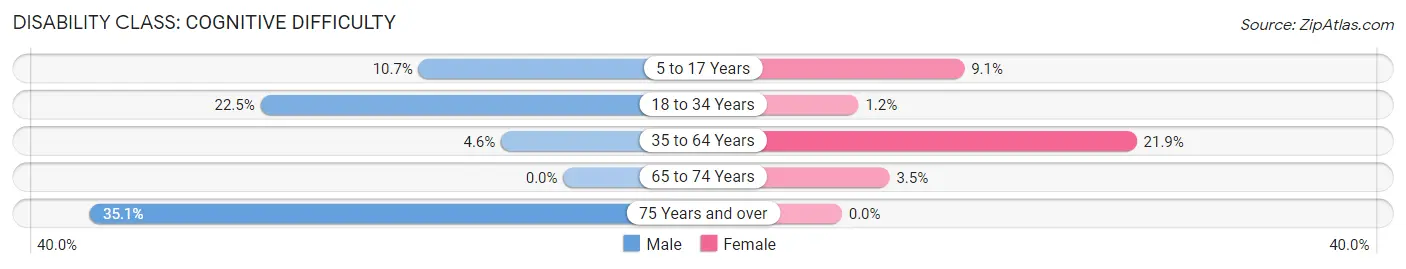
| Age Bracket | Male | Female |
| 5 to 17 Years | 13 (10.7%) | 9 (9.1%) |
| 18 to 34 Years | 29 (22.5%) | 2 (1.2%) |
| 35 to 64 Years | 19 (4.6%) | 58 (21.9%) |
| 65 to 74 Years | 0 (0.0%) | 8 (3.5%) |
| 75 Years and over | 13 (35.1%) | 0 (0.0%) |
Disability Class: Ambulatory Difficulty
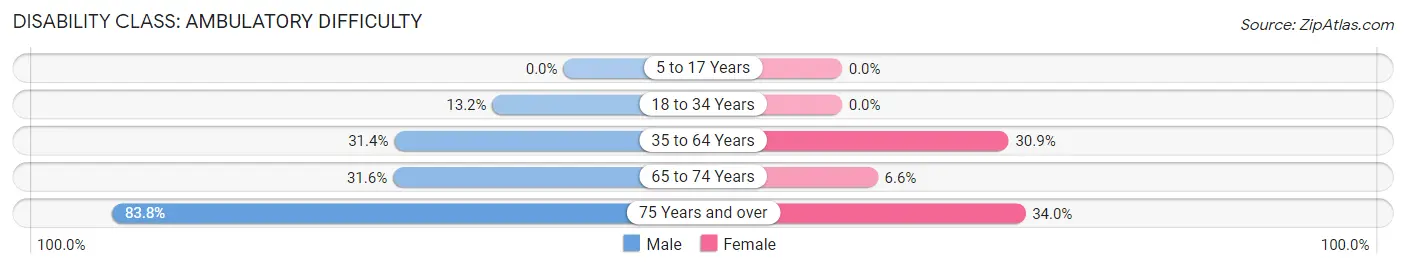
| Age Bracket | Male | Female |
| 5 to 17 Years | 0 (0.0%) | 0 (0.0%) |
| 18 to 34 Years | 17 (13.2%) | 0 (0.0%) |
| 35 to 64 Years | 129 (31.4%) | 82 (30.9%) |
| 65 to 74 Years | 37 (31.6%) | 15 (6.6%) |
| 75 Years and over | 31 (83.8%) | 32 (34.0%) |
Disability Class: Self-Care Difficulty
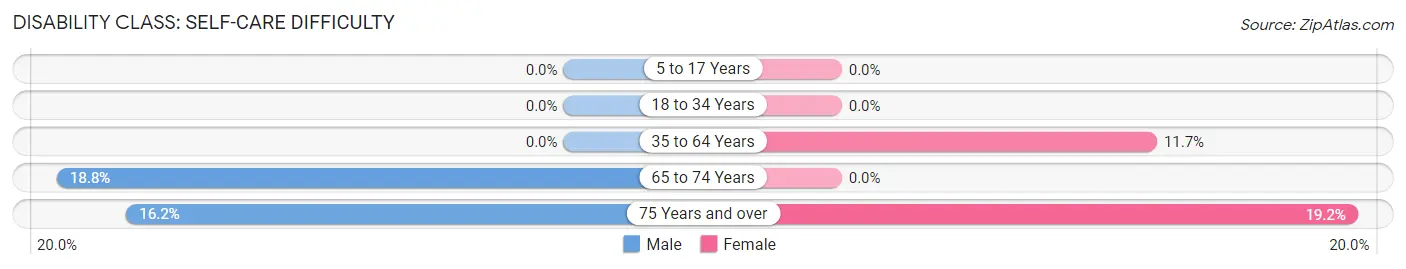
| Age Bracket | Male | Female |
| 5 to 17 Years | 0 (0.0%) | 0 (0.0%) |
| 18 to 34 Years | 0 (0.0%) | 0 (0.0%) |
| 35 to 64 Years | 0 (0.0%) | 31 (11.7%) |
| 65 to 74 Years | 22 (18.8%) | 0 (0.0%) |
| 75 Years and over | 6 (16.2%) | 18 (19.2%) |
Technology Access in Fairplains
Computing Device Access in Fairplains
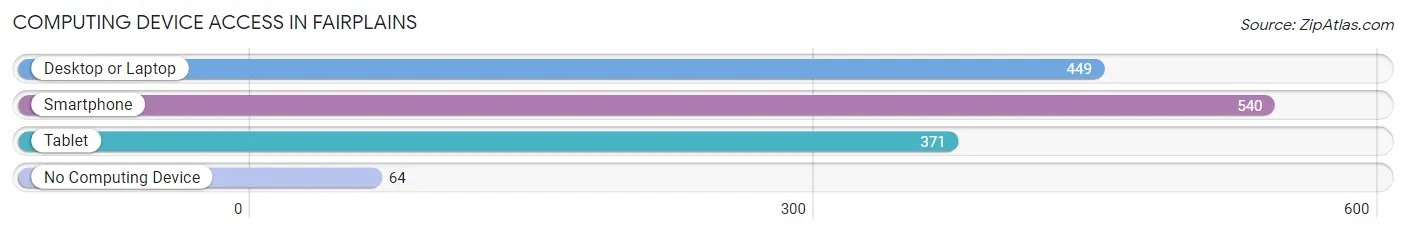
| Device Type | # Households | % Households |
| Desktop or Laptop | 449 | 59.2% |
| Smartphone | 540 | 71.2% |
| Tablet | 371 | 48.9% |
| No Computing Device | 64 | 8.4% |
| Total | 759 | 100.0% |
Internet Access in Fairplains
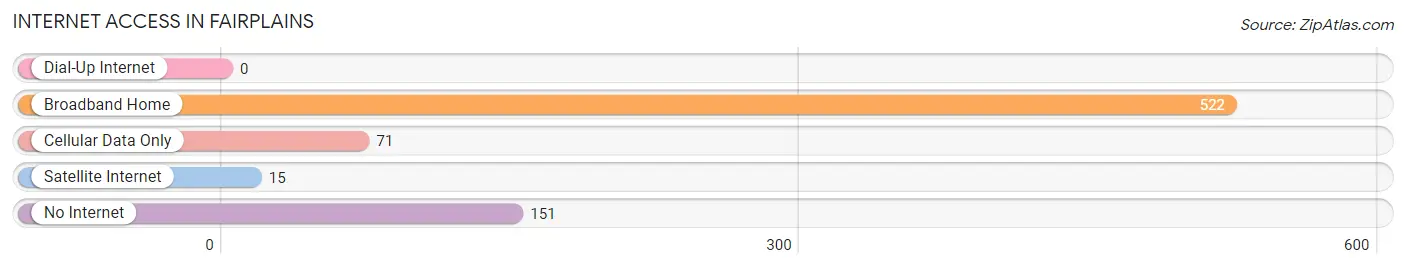
| Internet Type | # Households | % Households |
| Dial-Up Internet | 0 | 0.0% |
| Broadband Home | 522 | 68.8% |
| Cellular Data Only | 71 | 9.3% |
| Satellite Internet | 15 | 2.0% |
| No Internet | 151 | 19.9% |
| Total | 759 | 100.0% |
Fairplains Summary
Fairplains is a small town located in the state of North Carolina. It is situated in the foothills of the Blue Ridge Mountains, about an hour’s drive from the state capital of Raleigh. The town has a population of just over 1,000 people, and is known for its rural charm and friendly atmosphere.
History
Fairplains was first settled in the late 1700s by a group of settlers from Pennsylvania. The town was originally known as “Fairplains Crossroads”, and was a stop on the stagecoach route between Raleigh and Asheville. The town was officially incorporated in 1887, and the name was changed to Fairplains.
The town grew slowly over the years, and by the early 1900s, it had become a popular destination for tourists. The town was known for its scenic beauty, and many visitors came to enjoy the mountain views and the peaceful atmosphere.
In the 1950s, the town began to experience a period of growth and development. The population increased, and new businesses began to open. The town also became a popular destination for retirees, who were attracted by the mild climate and the low cost of living.
Geography
Fairplains is located in the foothills of the Blue Ridge Mountains, about an hour’s drive from Raleigh. The town is situated in a valley, surrounded by rolling hills and lush forests. The town is located at an elevation of 1,000 feet, and the climate is mild and temperate.
The town is located near several major highways, including Interstate 40 and US Highway 64. The nearest major airport is located in Raleigh, about an hour away.
Economy
The economy of Fairplains is largely based on tourism and agriculture. The town is home to several small businesses, including restaurants, shops, and bed and breakfasts. The town is also home to several farms, which produce a variety of crops, including corn, soybeans, and tobacco.
The town is also home to several manufacturing companies, which produce a variety of products, including furniture, textiles, and electronics.
Demographics
As of the 2010 census, the population of Fairplains was 1,072. The racial makeup of the town was 95.3% White, 1.7% African American, 0.3% Native American, 0.7% Asian, and 2.0% from other races. The median household income was $37,500, and the median age was 44.
The town is home to several churches, including the Fairplains United Methodist Church, the Fairplains Baptist Church, and the Fairplains Presbyterian Church. The town is also home to several schools, including Fairplains Elementary School, Fairplains Middle School, and Fairplains High School.
Conclusion
Fairplains is a small town located in the foothills of the Blue Ridge Mountains in North Carolina. The town has a population of just over 1,000 people, and is known for its rural charm and friendly atmosphere. The economy of Fairplains is largely based on tourism and agriculture, and the town is home to several small businesses, farms, and manufacturing companies. The racial makeup of the town is predominantly White, with a small percentage of African American, Native American, and Asian residents. The town is home to several churches and schools, and is a popular destination for retirees.
Common Questions
What is the Total Population of Fairplains?
Total Population of Fairplains is 1,709.
What is the Total Male Population of Fairplains?
Total Male Population of Fairplains is 849.
What is the Total Female Population of Fairplains?
Total Female Population of Fairplains is 860.
What is the Ratio of Males per 100 Females in Fairplains?
There are 98.72 Males per 100 Females in Fairplains.
What is the Ratio of Females per 100 Males in Fairplains?
There are 101.30 Females per 100 Males in Fairplains.
What is the Median Population Age in Fairplains?
Median Population Age in Fairplains is 53.6 Years.
What is the Average Family Size in Fairplains
Average Family Size in Fairplains is 2.9 People.
What is the Average Household Size in Fairplains
Average Household Size in Fairplains is 2.2 People.
What is Per Capita Income in Fairplains?
Per Capita income in Fairplains is $19,972.
What is the Median Family Income in Fairplains?
Median Family Income in Fairplains is $46,092.
What is the Median Household income in Fairplains?
Median Household Income in Fairplains is $37,261.
What is Inequality or Gini Index in Fairplains?
Inequality or Gini Index in Fairplains is 0.43.
How Large is the Labor Force in Fairplains?
There are 554 People in the Labor Forcein in Fairplains.
What is the Percentage of People in the Labor Force in Fairplains?
38.2% of People are in the Labor Force in Fairplains.
What is the Unemployment Rate in Fairplains?
Unemployment Rate in Fairplains is 19.5%.