Foscoe, NC
Foscoe Map
Foscoe Overview
1,411
TOTAL POPULATION
687
MALE POPULATION
724
FEMALE POPULATION
94.89
MALES / 100 FEMALES
105.39
FEMALES / 100 MALES
40.9
MEDIAN AGE
3.0
AVG FAMILY SIZE
2.2
AVG HOUSEHOLD SIZE
$30,320
PER CAPITA INCOME
$77,833
AVG FAMILY INCOME
$53,382
AVG HOUSEHOLD INCOME
14.2%
WAGE / INCOME GAP [ % ]
85.8¢/ $1
WAGE / INCOME GAP [ $ ]
0.38
INEQUALITY / GINI INDEX
715
LABOR FORCE [ PEOPLE ]
62.3%
PERCENT IN LABOR FORCE
4.3%
UNEMPLOYMENT RATE
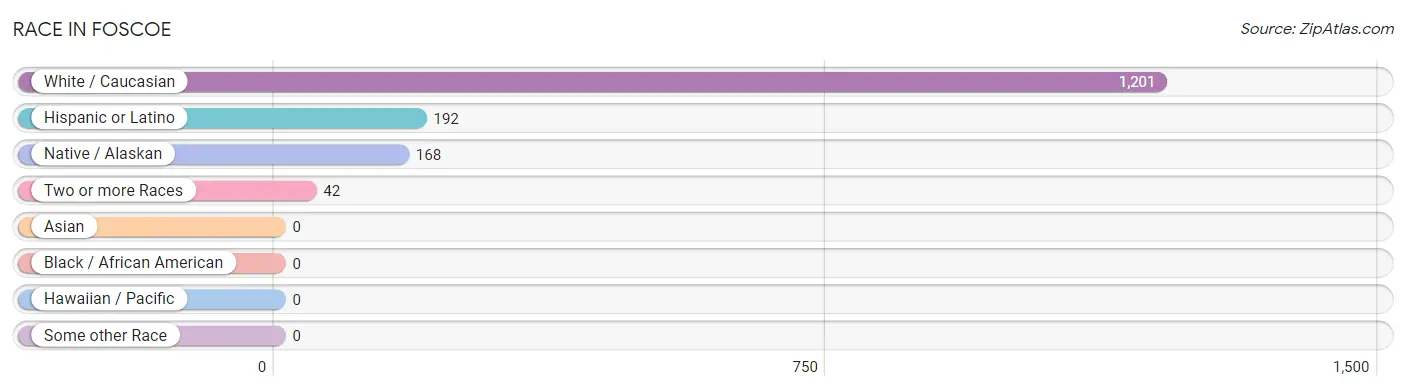
Race in Foscoe
The most populous races in Foscoe are White / Caucasian (1,201 | 85.1%), Hispanic or Latino (192 | 13.6%), and Native / Alaskan (168 | 11.9%).
| Race | # Population | % Population |
| Asian | 0 | 0.0% |
| Black / African American | 0 | 0.0% |
| Hawaiian / Pacific | 0 | 0.0% |
| Hispanic or Latino | 192 | 13.6% |
| Native / Alaskan | 168 | 11.9% |
| White / Caucasian | 1,201 | 85.1% |
| Two or more Races | 42 | 3.0% |
| Some other Race | 0 | 0.0% |
| Total | 1,411 | 100.0% |
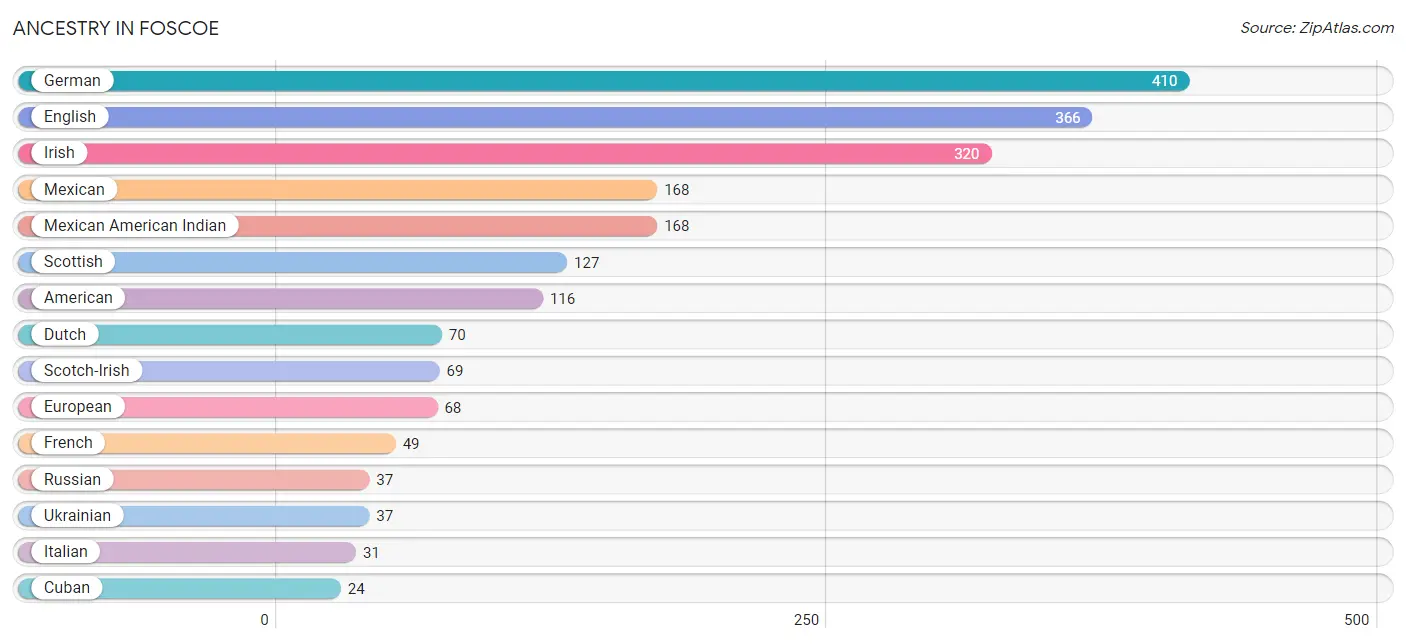
Ancestry in Foscoe
The most populous ancestries reported in Foscoe are German (410 | 29.1%), English (366 | 25.9%), Irish (320 | 22.7%), Mexican (168 | 11.9%), and Mexican American Indian (168 | 11.9%), together accounting for 101.5% of all Foscoe residents.
| Ancestry | # Population | % Population |
| American | 116 | 8.2% |
| Cherokee | 11 | 0.8% |
| Cuban | 24 | 1.7% |
| Dutch | 70 | 5.0% |
| English | 366 | 25.9% |
| European | 68 | 4.8% |
| French | 49 | 3.5% |
| French American Indian | 2 | 0.1% |
| German | 410 | 29.1% |
| Irish | 320 | 22.7% |
| Italian | 31 | 2.2% |
| Kiowa | 5 | 0.4% |
| Mexican | 168 | 11.9% |
| Mexican American Indian | 168 | 11.9% |
| Russian | 37 | 2.6% |
| Scotch-Irish | 69 | 4.9% |
| Scottish | 127 | 9.0% |
| Turkish | 15 | 1.1% |
| Ukrainian | 37 | 2.6% | View All 19 Rows |
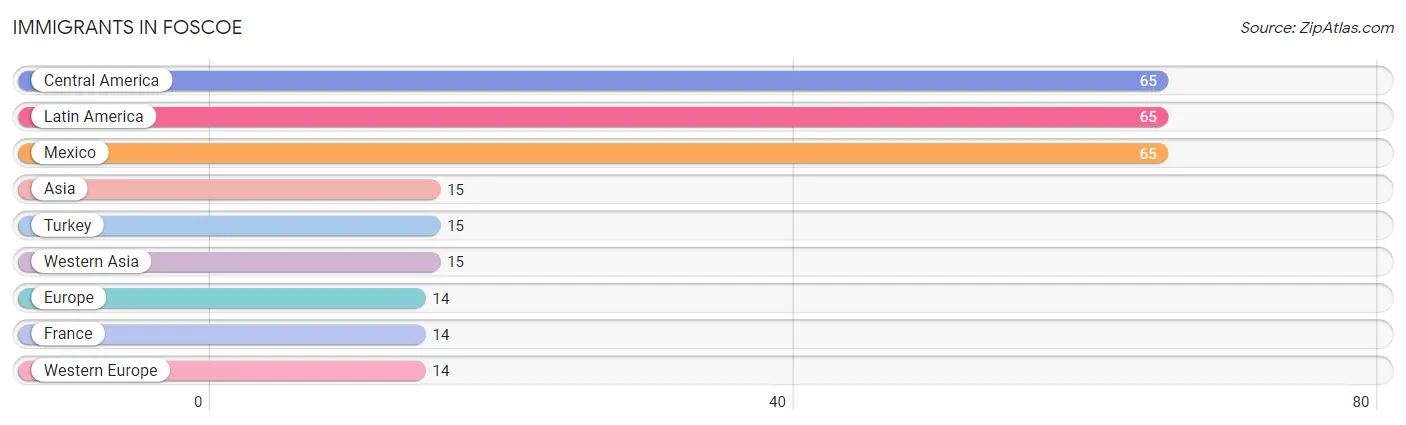
Immigrants in Foscoe
The most numerous immigrant groups reported in Foscoe came from Central America (65 | 4.6%), Latin America (65 | 4.6%), Mexico (65 | 4.6%), Asia (15 | 1.1%), and Turkey (15 | 1.1%), together accounting for 16.0% of all Foscoe residents.
| Immigration Origin | # Population | % Population |
| Asia | 15 | 1.1% |
| Central America | 65 | 4.6% |
| Europe | 14 | 1.0% |
| France | 14 | 1.0% |
| Latin America | 65 | 4.6% |
| Mexico | 65 | 4.6% |
| Turkey | 15 | 1.1% |
| Western Asia | 15 | 1.1% |
| Western Europe | 14 | 1.0% | View All 9 Rows |
Sex and Age in Foscoe
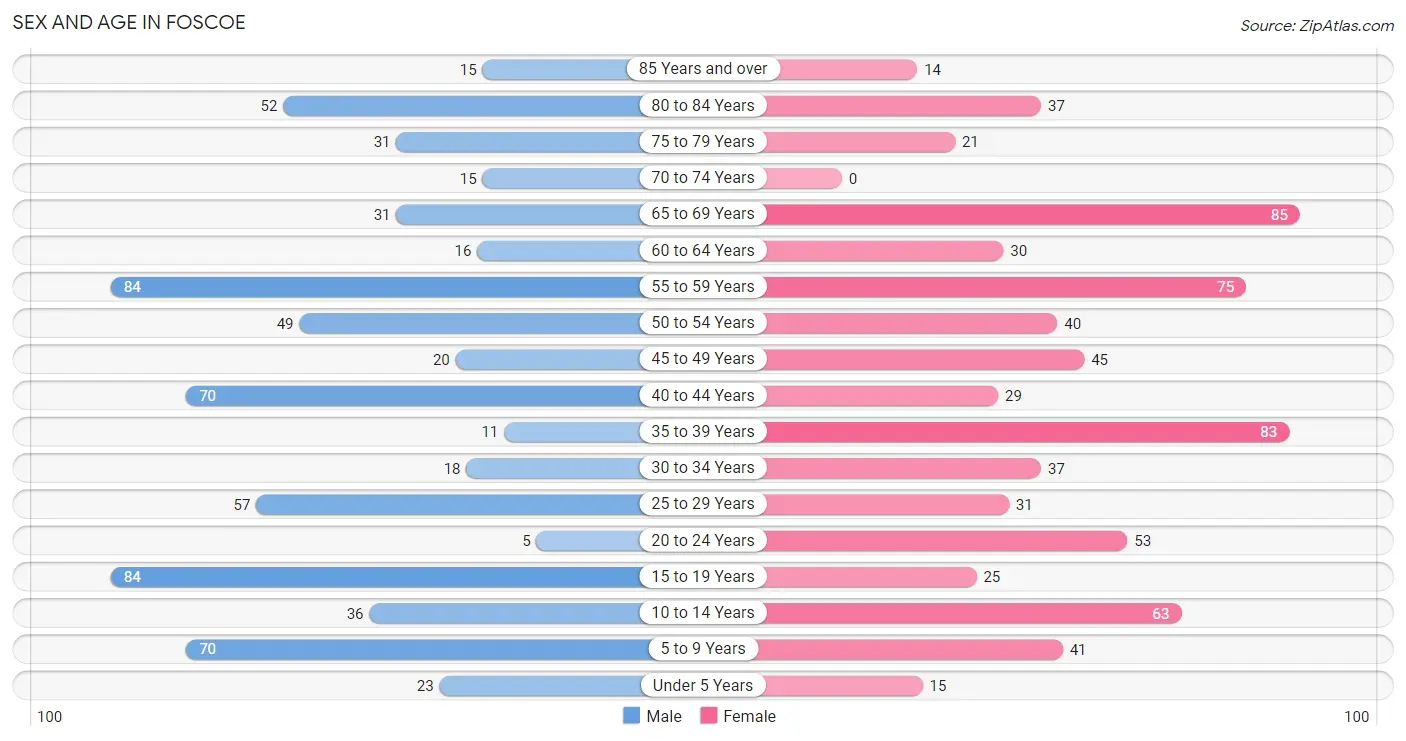
Sex and Age in Foscoe
The most populous age groups in Foscoe are 15 to 19 Years (84 | 12.2%) for men and 65 to 69 Years (85 | 11.7%) for women.
| Age Bracket | Male | Female |
| Under 5 Years | 23 (3.4%) | 15 (2.1%) |
| 5 to 9 Years | 70 (10.2%) | 41 (5.7%) |
| 10 to 14 Years | 36 (5.2%) | 63 (8.7%) |
| 15 to 19 Years | 84 (12.2%) | 25 (3.5%) |
| 20 to 24 Years | 5 (0.7%) | 53 (7.3%) |
| 25 to 29 Years | 57 (8.3%) | 31 (4.3%) |
| 30 to 34 Years | 18 (2.6%) | 37 (5.1%) |
| 35 to 39 Years | 11 (1.6%) | 83 (11.5%) |
| 40 to 44 Years | 70 (10.2%) | 29 (4.0%) |
| 45 to 49 Years | 20 (2.9%) | 45 (6.2%) |
| 50 to 54 Years | 49 (7.1%) | 40 (5.5%) |
| 55 to 59 Years | 84 (12.2%) | 75 (10.4%) |
| 60 to 64 Years | 16 (2.3%) | 30 (4.1%) |
| 65 to 69 Years | 31 (4.5%) | 85 (11.7%) |
| 70 to 74 Years | 15 (2.2%) | 0 (0.0%) |
| 75 to 79 Years | 31 (4.5%) | 21 (2.9%) |
| 80 to 84 Years | 52 (7.6%) | 37 (5.1%) |
| 85 Years and over | 15 (2.2%) | 14 (1.9%) |
| Total | 687 (100.0%) | 724 (100.0%) |
Families and Households in Foscoe
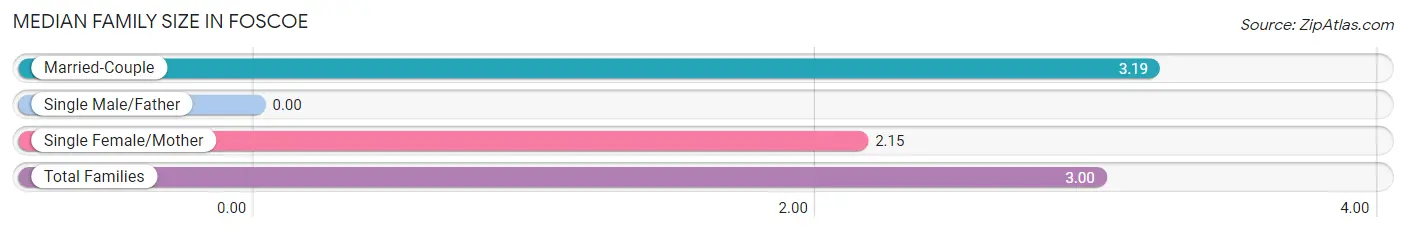
Median Family Size in Foscoe
| Family Type | # Families | Family Size |
| Married-Couple | 275 (81.9%) | 3.19 |
| Single Male/Father | 0 (0.0%) | - |
| Single Female/Mother | 61 (18.1%) | 2.15 |
| Total Families | 336 (100.0%) | 3.00 |
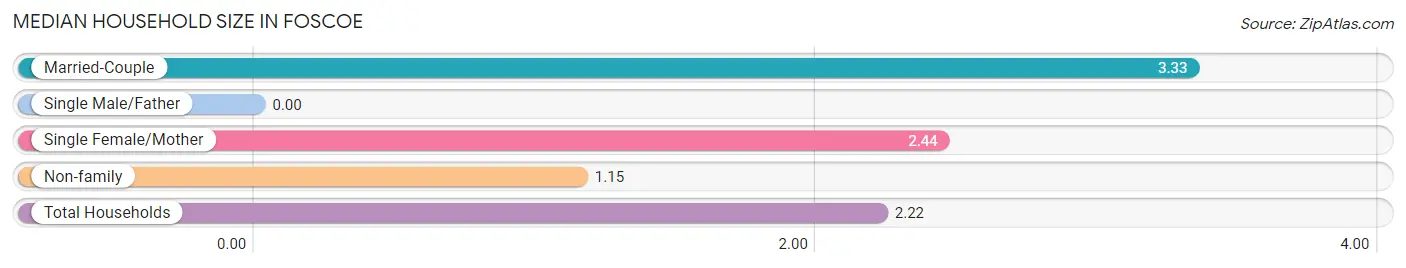
Median Household Size in Foscoe
| Household Type | # Households | Household Size |
| Married-Couple | 275 (43.2%) | 3.33 |
| Single Male/Father | 0 (0.0%) | - |
| Single Female/Mother | 61 (9.6%) | 2.44 |
| Non-family | 300 (47.2%) | 1.15 |
| Total Households | 636 (100.0%) | 2.22 |
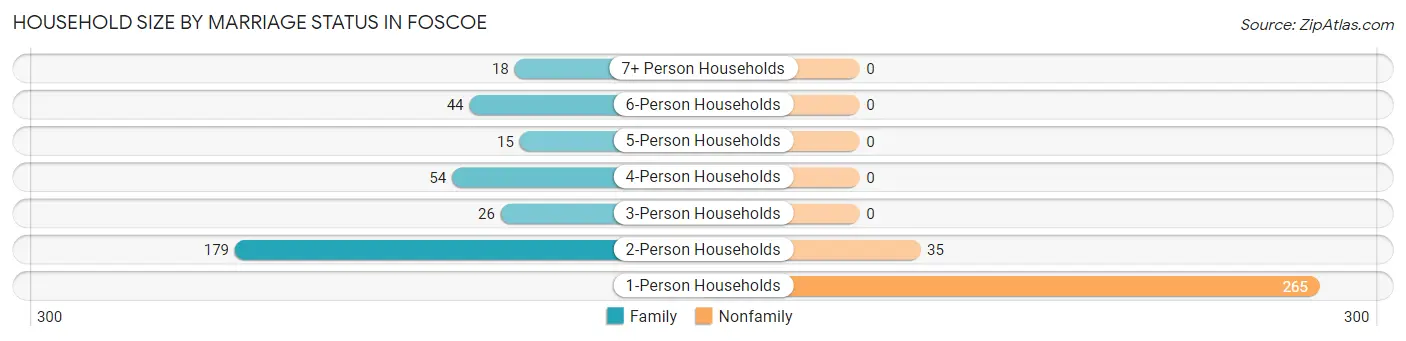
Household Size by Marriage Status in Foscoe
Out of a total of 636 households in Foscoe, 336 (52.8%) are family households, while 300 (47.2%) are nonfamily households. The most numerous type of family households are 2-person households, comprising 179, and the most common type of nonfamily households are 1-person households, comprising 265.
| Household Size | Family Households | Nonfamily Households |
| 1-Person Households | - | 265 (41.7%) |
| 2-Person Households | 179 (28.1%) | 35 (5.5%) |
| 3-Person Households | 26 (4.1%) | 0 (0.0%) |
| 4-Person Households | 54 (8.5%) | 0 (0.0%) |
| 5-Person Households | 15 (2.4%) | 0 (0.0%) |
| 6-Person Households | 44 (6.9%) | 0 (0.0%) |
| 7+ Person Households | 18 (2.8%) | 0 (0.0%) |
| Total | 336 (52.8%) | 300 (47.2%) |
Female Fertility in Foscoe
Fertility by Age in Foscoe
| Age Bracket | Women with Births | Births / 1,000 Women |
| 15 to 19 years | 0 (0.0%) | 0.0 |
| 20 to 34 years | 0 (0.0%) | 0.0 |
| 35 to 50 years | 0 (0.0%) | 0.0 |
| Total | 0 (0.0%) | 0.0 |
Fertility by Age by Marriage Status in Foscoe
| Age Bracket | Married | Unmarried |
| 15 to 19 years | 0 (0.0%) | 0 (0.0%) |
| 20 to 34 years | 0 (0.0%) | 0 (0.0%) |
| 35 to 50 years | 0 (0.0%) | 0 (0.0%) |
| Total | 0 (0.0%) | 0 (0.0%) |
Fertility by Education in Foscoe
| Educational Attainment | Women with Births | Births / 1,000 Women |
| Less than High School | 0 (0.0%) | 0.0 |
| High School Diploma | 0 (0.0%) | 0.0 |
| College or Associate's Degree | 0 (0.0%) | 0.0 |
| Bachelor's Degree | 0 (0.0%) | 0.0 |
| Graduate Degree | 0 (0.0%) | 0.0 |
| Total | 0 (0.0%) | 0.0 |
Fertility by Education by Marriage Status in Foscoe
| Educational Attainment | Married | Unmarried |
| Less than High School | 0 (0.0%) | 0 (0.0%) |
| High School Diploma | 0 (0.0%) | 0 (0.0%) |
| College or Associate's Degree | 0 (0.0%) | 0 (0.0%) |
| Bachelor's Degree | 0 (0.0%) | 0 (0.0%) |
| Graduate Degree | 0 (0.0%) | 0 (0.0%) |
| Total | 0 (0.0%) | 0 (0.0%) |
Income in Foscoe
Income Overview in Foscoe
Per Capita Income in Foscoe is $30,320, while median incomes of families and households are $77,833 and $53,382 respectively.
| Characteristic | Number | Measure |
| Per Capita Income | 1,411 | $30,320 |
| Median Family Income | 336 | $77,833 |
| Mean Family Income | 336 | $86,993 |
| Median Household Income | 636 | $53,382 |
| Mean Household Income | 636 | $67,670 |
| Income Deficit | 336 | $0 |
| Wage / Income Gap (%) | 1,411 | 14.25% |
| Wage / Income Gap ($) | 1,411 | 85.75¢ per $1 |
| Gini / Inequality Index | 1,411 | 0.38 |
Earnings by Sex in Foscoe
Average Earnings in Foscoe are $32,460, $36,292 for men and $31,121 for women, a difference of 14.2%.
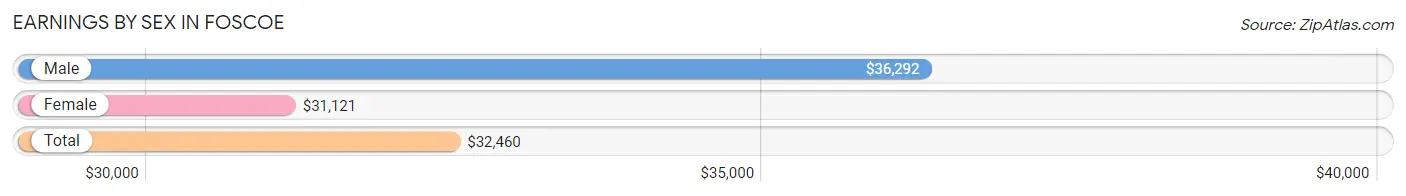
| Sex | Number | Average Earnings |
| Male | 368 (53.0%) | $36,292 |
| Female | 326 (47.0%) | $31,121 |
| Total | 694 (100.0%) | $32,460 |
Earnings by Sex by Income Bracket in Foscoe
The most common earnings brackets in Foscoe are $35,000 to $39,999 for men (101 | 27.5%) and $20,000 to $22,499 for women (58 | 17.8%).
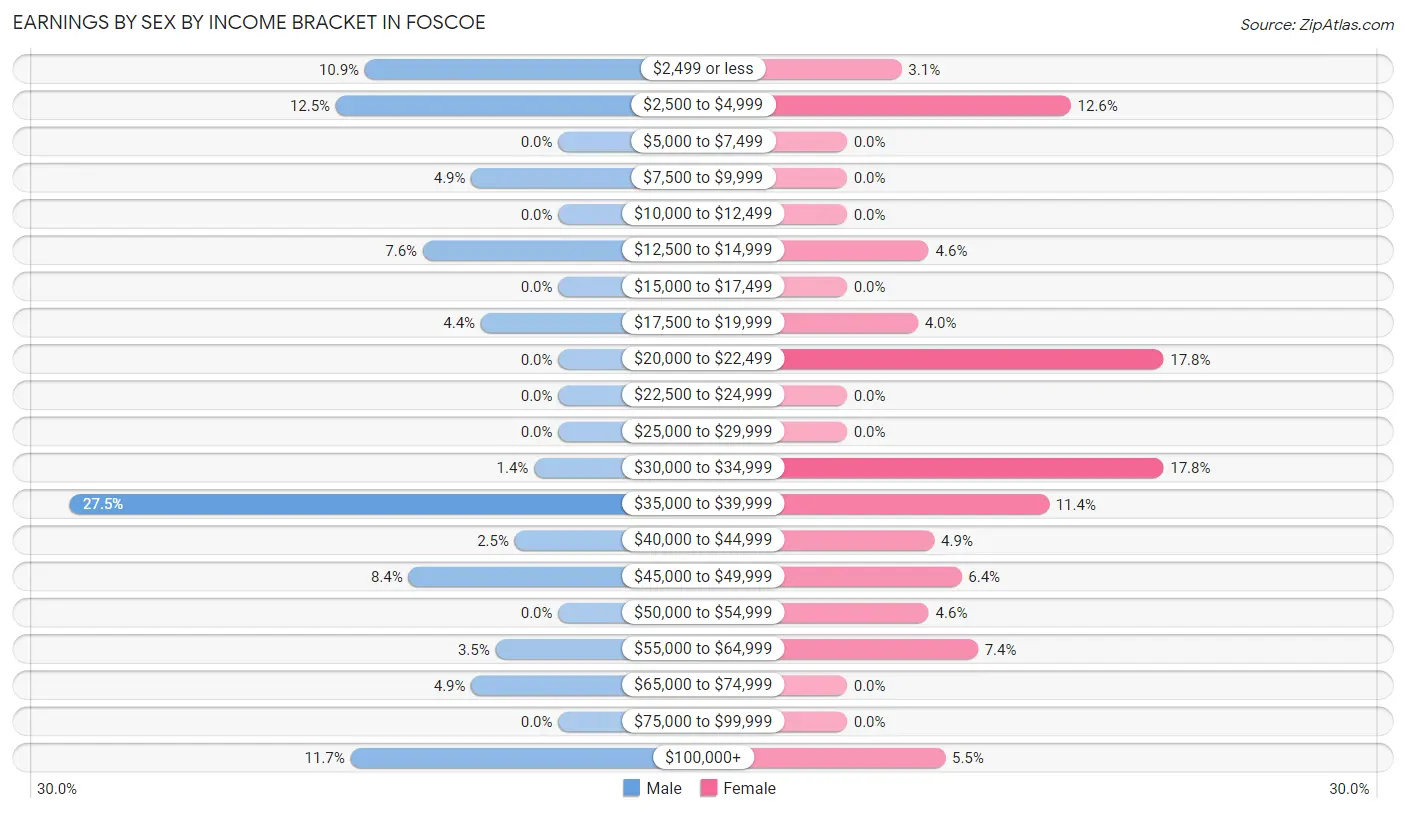
| Income | Male | Female |
| $2,499 or less | 40 (10.9%) | 10 (3.1%) |
| $2,500 to $4,999 | 46 (12.5%) | 41 (12.6%) |
| $5,000 to $7,499 | 0 (0.0%) | 0 (0.0%) |
| $7,500 to $9,999 | 18 (4.9%) | 0 (0.0%) |
| $10,000 to $12,499 | 0 (0.0%) | 0 (0.0%) |
| $12,500 to $14,999 | 28 (7.6%) | 15 (4.6%) |
| $15,000 to $17,499 | 0 (0.0%) | 0 (0.0%) |
| $17,500 to $19,999 | 16 (4.3%) | 13 (4.0%) |
| $20,000 to $22,499 | 0 (0.0%) | 58 (17.8%) |
| $22,500 to $24,999 | 0 (0.0%) | 0 (0.0%) |
| $25,000 to $29,999 | 0 (0.0%) | 0 (0.0%) |
| $30,000 to $34,999 | 5 (1.4%) | 58 (17.8%) |
| $35,000 to $39,999 | 101 (27.5%) | 37 (11.4%) |
| $40,000 to $44,999 | 9 (2.5%) | 16 (4.9%) |
| $45,000 to $49,999 | 31 (8.4%) | 21 (6.4%) |
| $50,000 to $54,999 | 0 (0.0%) | 15 (4.6%) |
| $55,000 to $64,999 | 13 (3.5%) | 24 (7.4%) |
| $65,000 to $74,999 | 18 (4.9%) | 0 (0.0%) |
| $75,000 to $99,999 | 0 (0.0%) | 0 (0.0%) |
| $100,000+ | 43 (11.7%) | 18 (5.5%) |
| Total | 368 (100.0%) | 326 (100.0%) |
Earnings by Sex by Educational Attainment in Foscoe
Average earnings in Foscoe are $38,445 for men and $32,263 for women, a difference of 16.1%. Men with an educational attainment of college or associate's degree enjoy the highest average annual earnings of $65,764, while those with high school diploma education earn the least with $35,542. Women with an educational attainment of graduate degree earn the most with the average annual earnings of $31,422, while those with graduate degree education have the smallest earnings of $31,422.
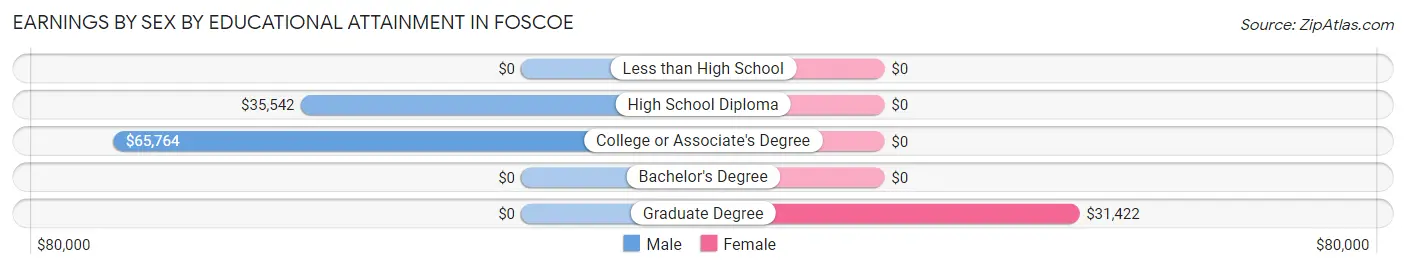
| Educational Attainment | Male Income | Female Income |
| Less than High School | - | - |
| High School Diploma | $35,542 | $0 |
| College or Associate's Degree | $65,764 | $0 |
| Bachelor's Degree | - | - |
| Graduate Degree | - | - |
| Total | $38,445 | $32,263 |
Family Income in Foscoe
Family Income Brackets in Foscoe
According to the Foscoe family income data, there are 79 families falling into the $75,000 to $99,999 income range, which is the most common income bracket and makes up 23.5% of all families.
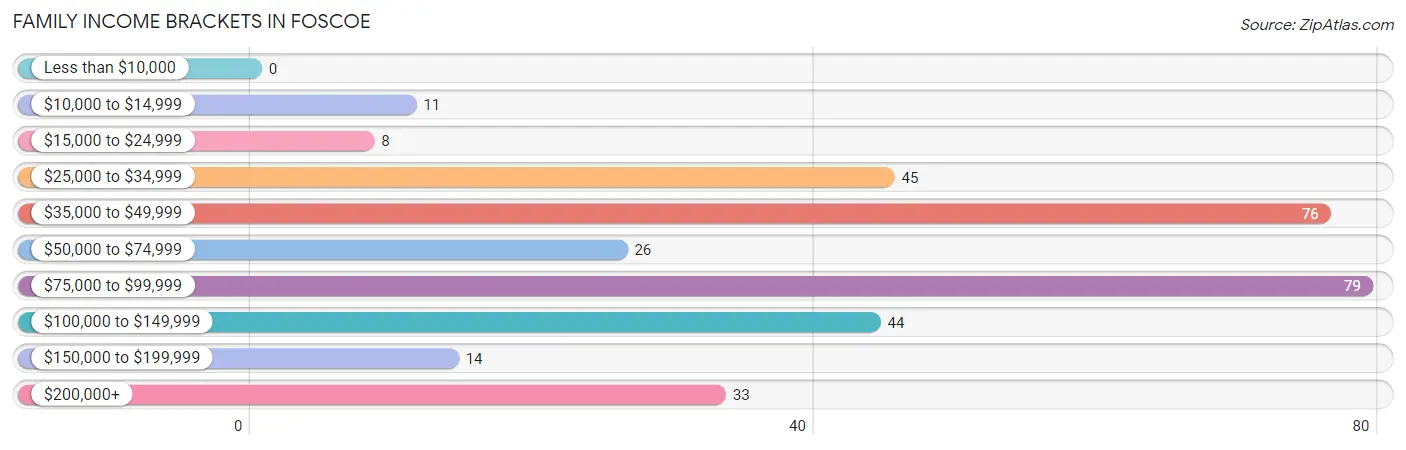
| Income Bracket | # Families | % Families |
| Less than $10,000 | 0 | 0.0% |
| $10,000 to $14,999 | 11 | 3.3% |
| $15,000 to $24,999 | 8 | 2.4% |
| $25,000 to $34,999 | 45 | 13.4% |
| $35,000 to $49,999 | 76 | 22.6% |
| $50,000 to $74,999 | 26 | 7.7% |
| $75,000 to $99,999 | 79 | 23.5% |
| $100,000 to $149,999 | 44 | 13.1% |
| $150,000 to $199,999 | 14 | 4.2% |
| $200,000+ | 33 | 9.8% |
Family Income by Famaliy Size in Foscoe
2-person families (187 | 55.6%) account for the highest median family income in Foscoe with $88,047 per family, while 2-person families (187 | 55.6%) have the highest median income of $44,024 per family member.
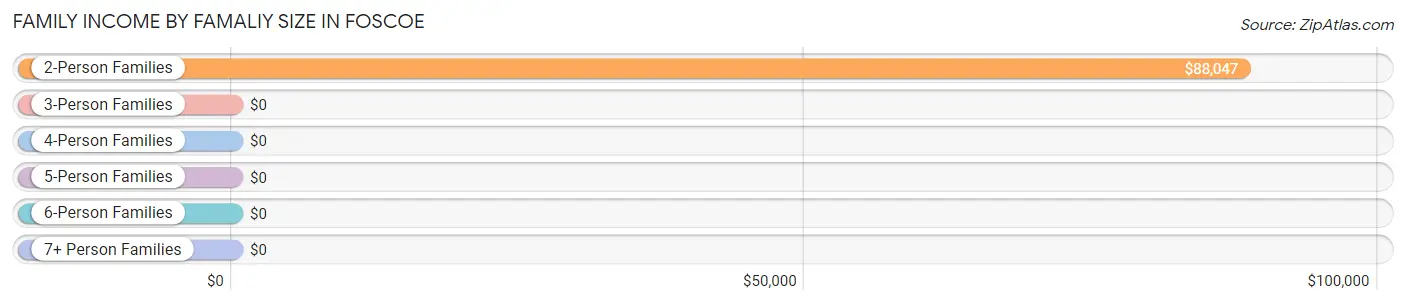
| Income Bracket | # Families | Median Income |
| 2-Person Families | 187 (55.6%) | $88,047 |
| 3-Person Families | 63 (18.8%) | $0 |
| 4-Person Families | 9 (2.7%) | $0 |
| 5-Person Families | 15 (4.5%) | $0 |
| 6-Person Families | 44 (13.1%) | $0 |
| 7+ Person Families | 18 (5.4%) | $0 |
| Total | 336 (100.0%) | $77,833 |
Family Income by Number of Earners in Foscoe
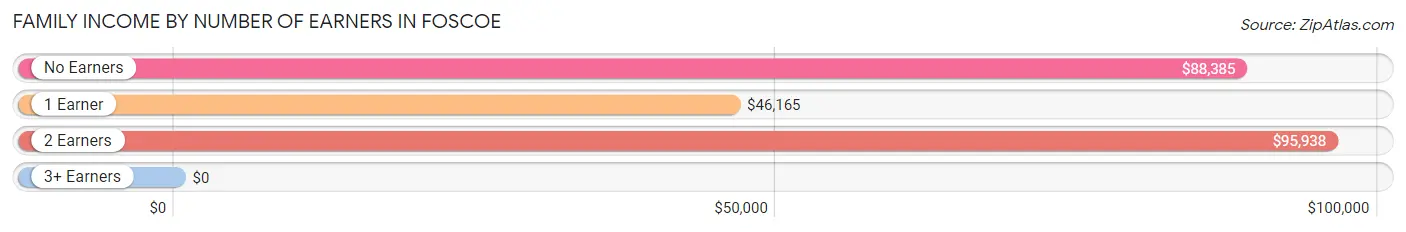
| Number of Earners | # Families | Median Income |
| No Earners | 62 (18.4%) | $88,385 |
| 1 Earner | 205 (61.0%) | $46,165 |
| 2 Earners | 42 (12.5%) | $95,938 |
| 3+ Earners | 27 (8.0%) | $0 |
| Total | 336 (100.0%) | $77,833 |
Household Income in Foscoe
Household Income Brackets in Foscoe
With 185 households falling in the category, the $35,000 to $49,999 income range is the most frequent in Foscoe, accounting for 29.1% of all households.
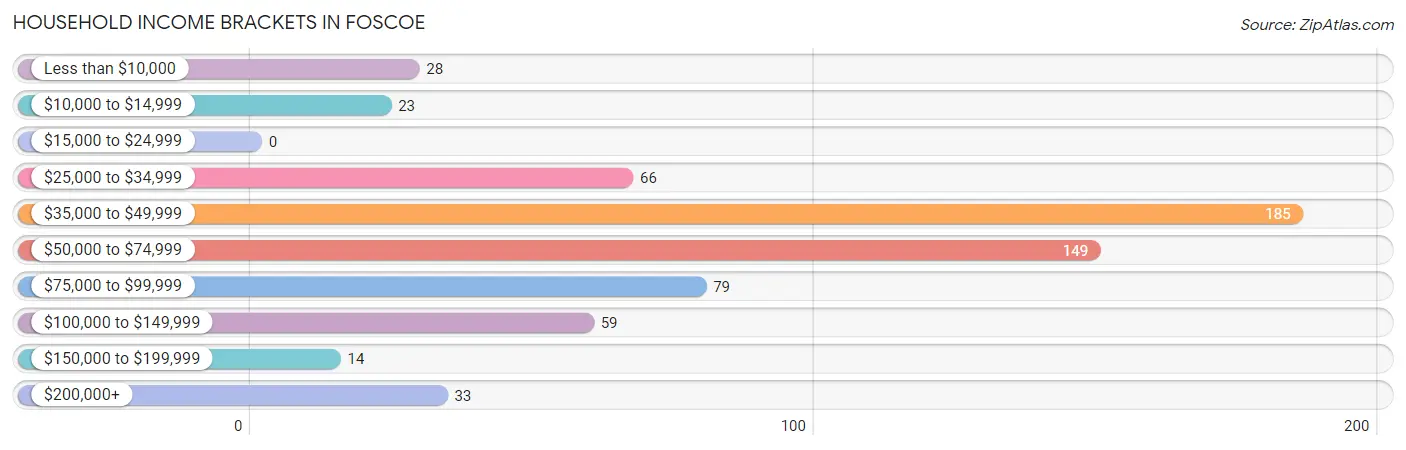
| Income Bracket | # Households | % Households |
| Less than $10,000 | 28 | 4.4% |
| $10,000 to $14,999 | 23 | 3.6% |
| $15,000 to $24,999 | 0 | 0.0% |
| $25,000 to $34,999 | 66 | 10.4% |
| $35,000 to $49,999 | 185 | 29.1% |
| $50,000 to $74,999 | 149 | 23.4% |
| $75,000 to $99,999 | 79 | 12.4% |
| $100,000 to $149,999 | 59 | 9.3% |
| $150,000 to $199,999 | 14 | 2.2% |
| $200,000+ | 33 | 5.2% |
Household Income by Householder Age in Foscoe
The median household income in Foscoe is $53,382, with the highest median household income of $87,813 found in the 65+ years age bracket for the primary householder. A total of 208 households (32.7%) fall into this category. Meanwhile, the 25 to 44 years age bracket for the primary householder has the lowest median household income of $37,569, with 171 households (26.9%) in this group.
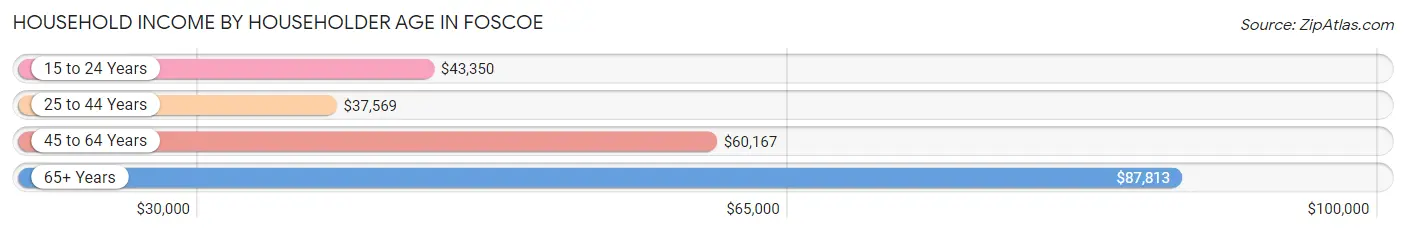
| Income Bracket | # Households | Median Income |
| 15 to 24 Years | 53 (8.3%) | $43,350 |
| 25 to 44 Years | 171 (26.9%) | $37,569 |
| 45 to 64 Years | 204 (32.1%) | $60,167 |
| 65+ Years | 208 (32.7%) | $87,813 |
| Total | 636 (100.0%) | $53,382 |
Poverty in Foscoe
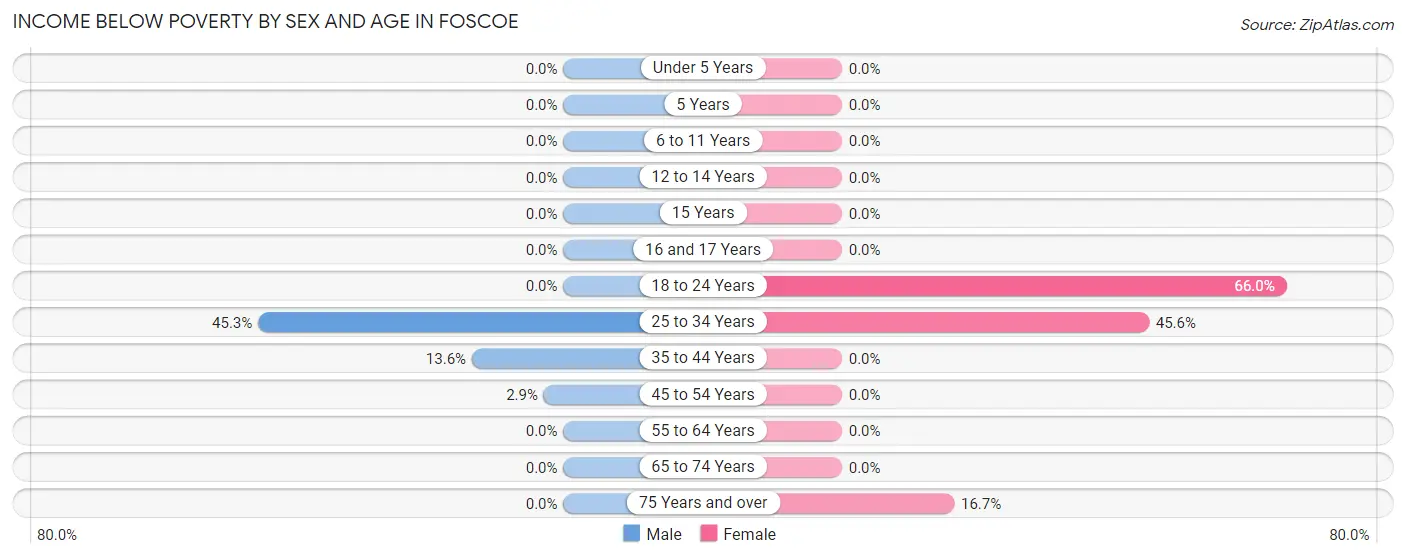
Income Below Poverty by Sex and Age in Foscoe
With 6.8% poverty level for males and 10.8% for females among the residents of Foscoe, 25 to 34 year old males and 18 to 24 year old females are the most vulnerable to poverty, with 34 males (45.3%) and 35 females (66.0%) in their respective age groups living below the poverty level.
| Age Bracket | Male | Female |
| Under 5 Years | 0 (0.0%) | 0 (0.0%) |
| 5 Years | 0 (0.0%) | 0 (0.0%) |
| 6 to 11 Years | 0 (0.0%) | 0 (0.0%) |
| 12 to 14 Years | 0 (0.0%) | 0 (0.0%) |
| 15 Years | 0 (0.0%) | 0 (0.0%) |
| 16 and 17 Years | 0 (0.0%) | 0 (0.0%) |
| 18 to 24 Years | 0 (0.0%) | 35 (66.0%) |
| 25 to 34 Years | 34 (45.3%) | 31 (45.6%) |
| 35 to 44 Years | 11 (13.6%) | 0 (0.0%) |
| 45 to 54 Years | 2 (2.9%) | 0 (0.0%) |
| 55 to 64 Years | 0 (0.0%) | 0 (0.0%) |
| 65 to 74 Years | 0 (0.0%) | 0 (0.0%) |
| 75 Years and over | 0 (0.0%) | 12 (16.7%) |
| Total | 47 (6.8%) | 78 (10.8%) |
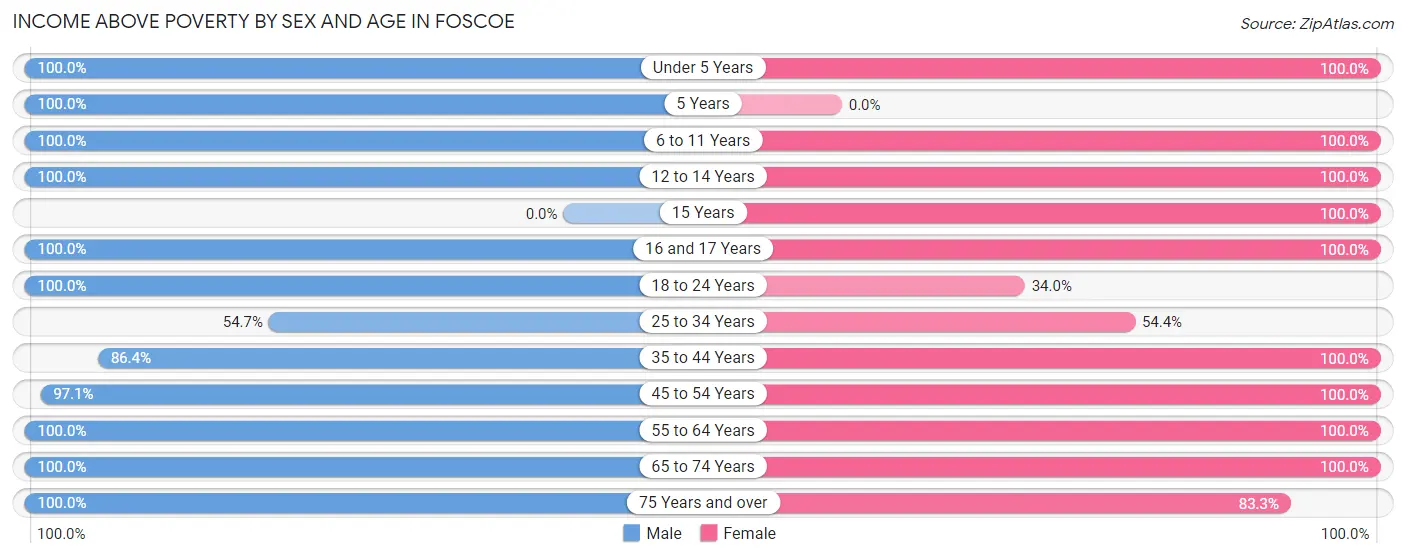
Income Above Poverty by Sex and Age in Foscoe
According to the poverty statistics in Foscoe, males aged under 5 years and females aged under 5 years are the age groups that are most secure financially, with 100.0% of males and 100.0% of females in these age groups living above the poverty line.
| Age Bracket | Male | Female |
| Under 5 Years | 23 (100.0%) | 15 (100.0%) |
| 5 Years | 34 (100.0%) | 0 (0.0%) |
| 6 to 11 Years | 54 (100.0%) | 41 (100.0%) |
| 12 to 14 Years | 18 (100.0%) | 63 (100.0%) |
| 15 Years | 0 (0.0%) | 16 (100.0%) |
| 16 and 17 Years | 84 (100.0%) | 9 (100.0%) |
| 18 to 24 Years | 5 (100.0%) | 18 (34.0%) |
| 25 to 34 Years | 41 (54.7%) | 37 (54.4%) |
| 35 to 44 Years | 70 (86.4%) | 112 (100.0%) |
| 45 to 54 Years | 67 (97.1%) | 85 (100.0%) |
| 55 to 64 Years | 100 (100.0%) | 105 (100.0%) |
| 65 to 74 Years | 46 (100.0%) | 85 (100.0%) |
| 75 Years and over | 98 (100.0%) | 60 (83.3%) |
| Total | 640 (93.2%) | 646 (89.2%) |
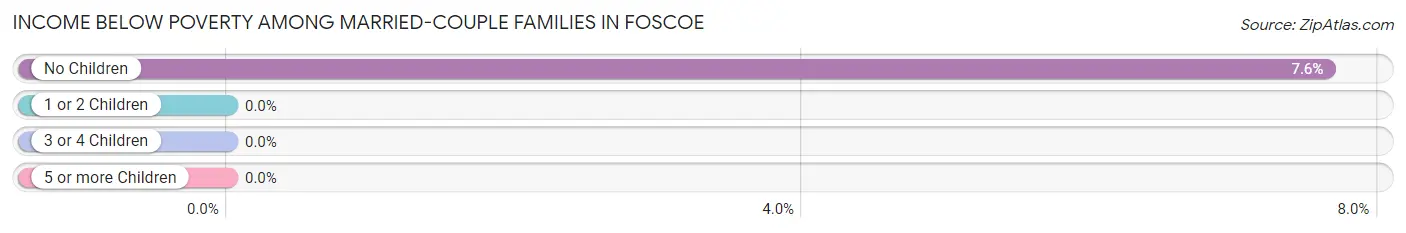
Income Below Poverty Among Married-Couple Families in Foscoe
The poverty statistics for married-couple families in Foscoe show that 4.0% or 11 of the total 275 families live below the poverty line. Families with no children have the highest poverty rate of 7.6%, comprising of 11 families. On the other hand, families with 1 or 2 children have the lowest poverty rate of 0.0%, which includes 0 families.
| Children | Above Poverty | Below Poverty |
| No Children | 133 (92.4%) | 11 (7.6%) |
| 1 or 2 Children | 54 (100.0%) | 0 (0.0%) |
| 3 or 4 Children | 59 (100.0%) | 0 (0.0%) |
| 5 or more Children | 18 (100.0%) | 0 (0.0%) |
| Total | 264 (96.0%) | 11 (4.0%) |
Income Below Poverty Among Single-Parent Households in Foscoe
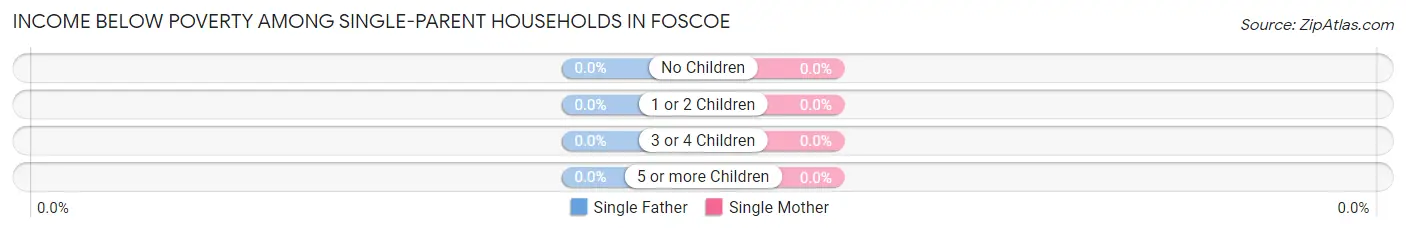
| Children | Single Father | Single Mother |
| No Children | 0 (0.0%) | 0 (0.0%) |
| 1 or 2 Children | 0 (0.0%) | 0 (0.0%) |
| 3 or 4 Children | 0 (0.0%) | 0 (0.0%) |
| 5 or more Children | 0 (0.0%) | 0 (0.0%) |
| Total | 0 (0.0%) | 0 (0.0%) |
Income Below Poverty Among Married-Couple vs Single-Parent Households in Foscoe
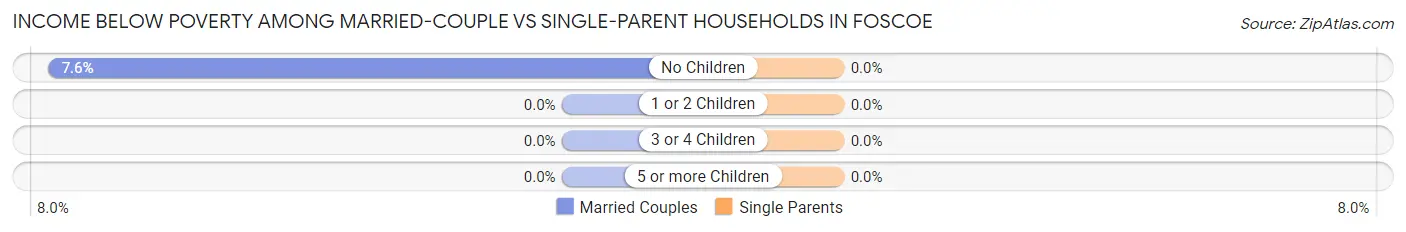
| Children | Married-Couple Families | Single-Parent Households |
| No Children | 11 (7.6%) | 0 (0.0%) |
| 1 or 2 Children | 0 (0.0%) | 0 (0.0%) |
| 3 or 4 Children | 0 (0.0%) | 0 (0.0%) |
| 5 or more Children | 0 (0.0%) | 0 (0.0%) |
| Total | 11 (4.0%) | 0 (0.0%) |
Employment Characteristics in Foscoe
Employment by Class of Employer in Foscoe
Among the 673 employed individuals in Foscoe, private company employees (338 | 50.2%), state government employees (113 | 16.8%), and self-employed (not incorporated) (88 | 13.1%) make up the most common classes of employment.
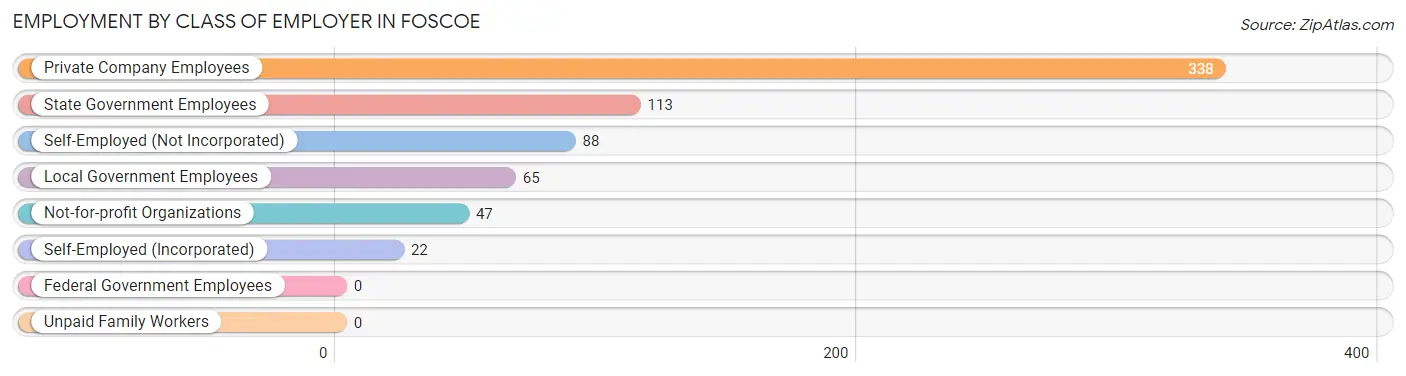
| Employer Class | # Employees | % Employees |
| Private Company Employees | 338 | 50.2% |
| Self-Employed (Incorporated) | 22 | 3.3% |
| Self-Employed (Not Incorporated) | 88 | 13.1% |
| Not-for-profit Organizations | 47 | 7.0% |
| Local Government Employees | 65 | 9.7% |
| State Government Employees | 113 | 16.8% |
| Federal Government Employees | 0 | 0.0% |
| Unpaid Family Workers | 0 | 0.0% |
| Total | 673 | 100.0% |
Employment Status by Age in Foscoe
According to the labor force statistics for Foscoe, out of the total population over 16 years of age (1,147), 62.3% or 715 individuals are in the labor force, with 4.3% or 31 of them unemployed. The age group with the highest labor force participation rate is 30 to 34 years, with 100.0% or 55 individuals in the labor force. Within the labor force, the 25 to 29 years age range has the highest percentage of unemployed individuals, with 43.1% or 31 of them being unemployed.
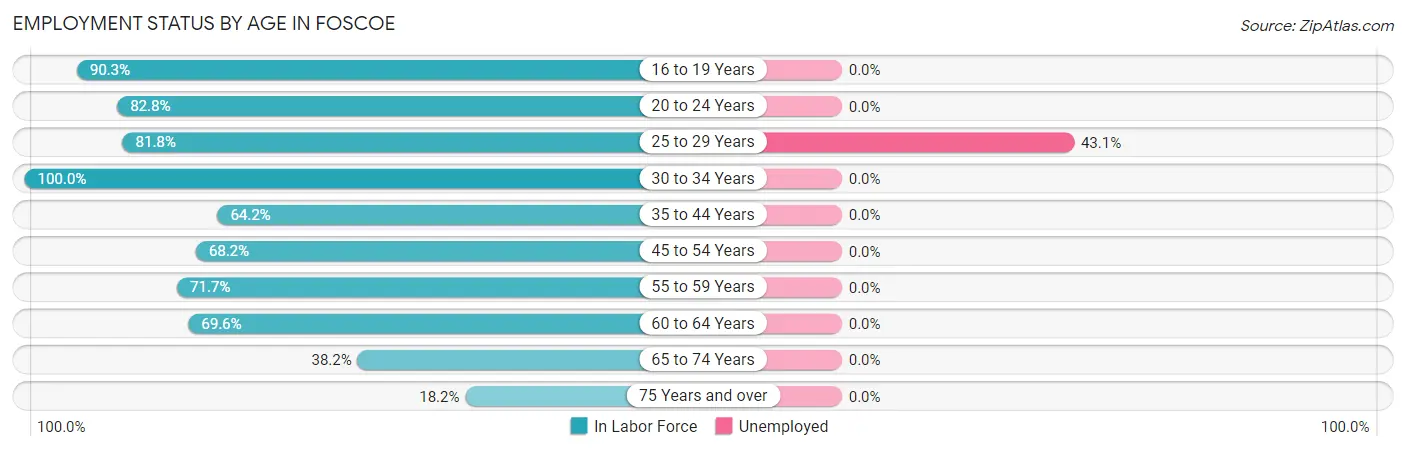
| Age Bracket | In Labor Force | Unemployed |
| 16 to 19 Years | 84 (90.3%) | 0 (0.0%) |
| 20 to 24 Years | 48 (82.8%) | 0 (0.0%) |
| 25 to 29 Years | 72 (81.8%) | 31 (43.1%) |
| 30 to 34 Years | 55 (100.0%) | 0 (0.0%) |
| 35 to 44 Years | 124 (64.2%) | 0 (0.0%) |
| 45 to 54 Years | 105 (68.2%) | 0 (0.0%) |
| 55 to 59 Years | 114 (71.7%) | 0 (0.0%) |
| 60 to 64 Years | 32 (69.6%) | 0 (0.0%) |
| 65 to 74 Years | 50 (38.2%) | 0 (0.0%) |
| 75 Years and over | 31 (18.2%) | 0 (0.0%) |
| Total | 715 (62.3%) | 31 (4.3%) |
Employment Status by Educational Attainment in Foscoe
According to labor force statistics for Foscoe, 72.2% of individuals (502) out of the total population between 25 and 64 years of age (695) are in the labor force, with 6.2% or 31 of them being unemployed. The group with the highest labor force participation rate are those with the educational attainment of high school diploma, with 87.9% or 109 individuals in the labor force. Within the labor force, individuals with college / associate degree education have the highest percentage of unemployment, with 17.5% or 31 of them being unemployed.
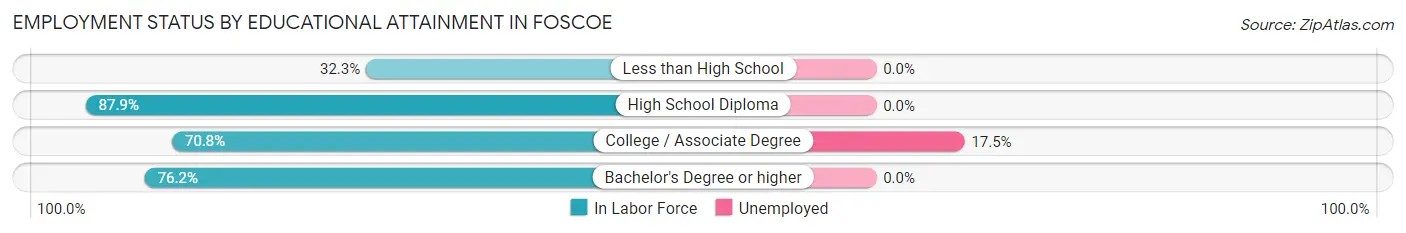
| Educational Attainment | In Labor Force | Unemployed |
| Less than High School | 21 (32.3%) | 0 (0.0%) |
| High School Diploma | 109 (87.9%) | 0 (0.0%) |
| College / Associate Degree | 177 (70.8%) | 44 (17.5%) |
| Bachelor's Degree or higher | 195 (76.2%) | 0 (0.0%) |
| Total | 502 (72.2%) | 43 (6.2%) |
Employment Occupations by Sex in Foscoe
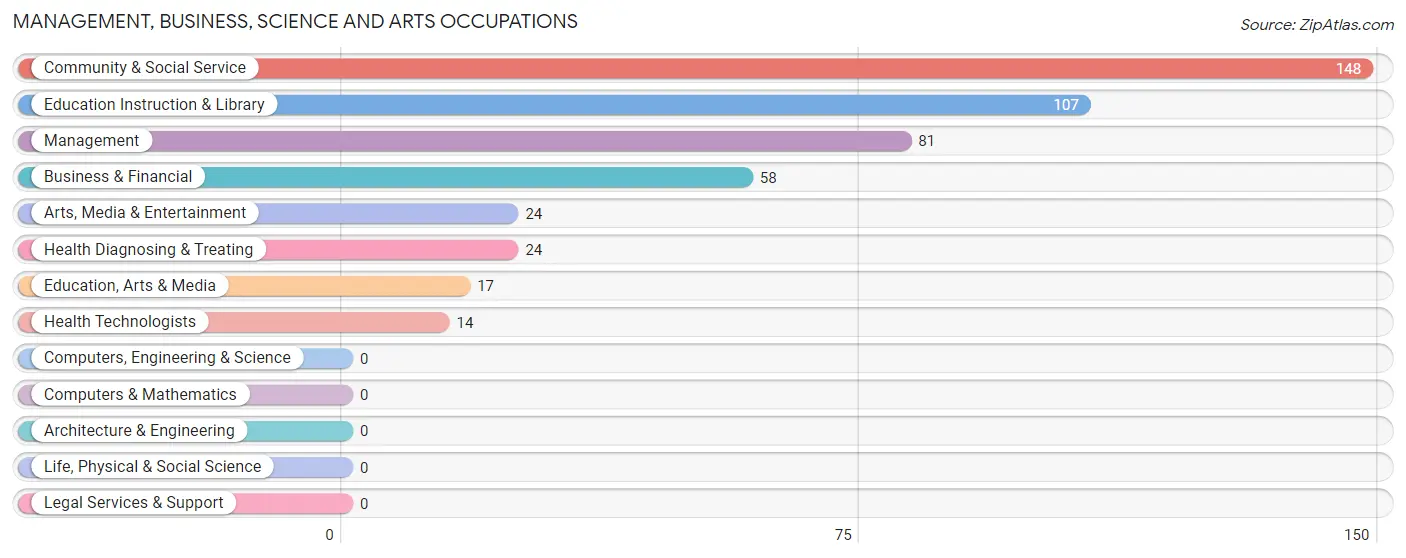
Management, Business, Science and Arts Occupations
The most common Management, Business, Science and Arts occupations in Foscoe are Community & Social Service (148 | 21.6%), Education Instruction & Library (107 | 15.6%), Management (81 | 11.8%), Business & Financial (58 | 8.5%), and Arts, Media & Entertainment (24 | 3.5%).
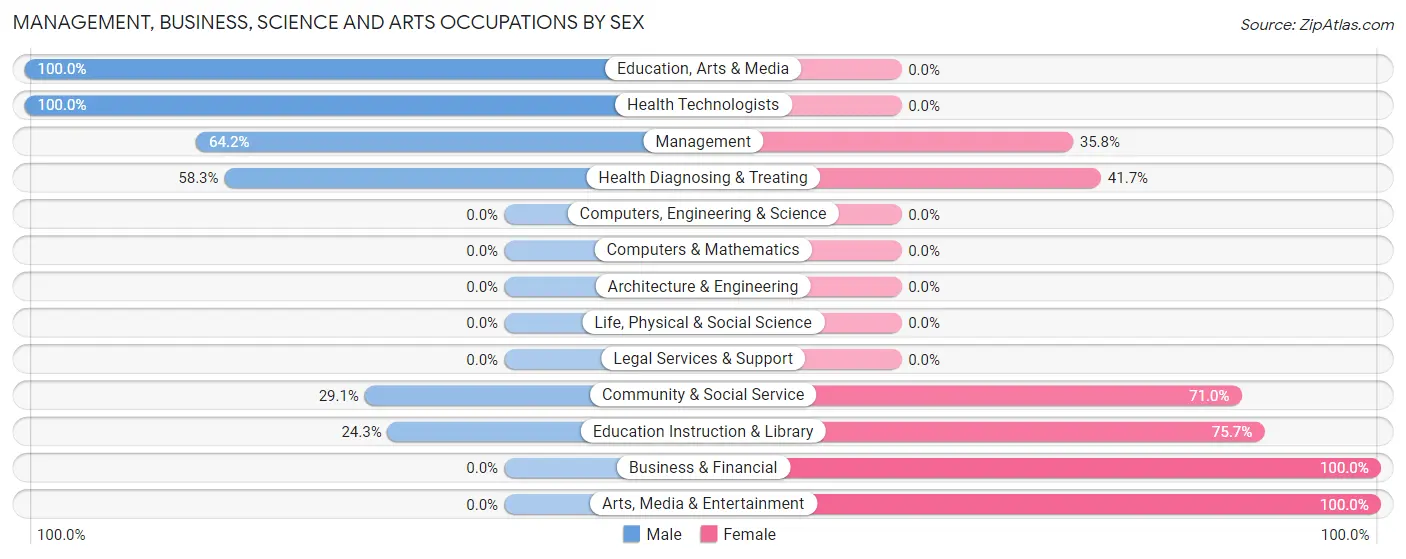
Management, Business, Science and Arts Occupations by Sex
Within the Management, Business, Science and Arts occupations in Foscoe, the most male-oriented occupations are Education, Arts & Media (100.0%), Health Technologists (100.0%), and Management (64.2%), while the most female-oriented occupations are Business & Financial (100.0%), Arts, Media & Entertainment (100.0%), and Education Instruction & Library (75.7%).
| Occupation | Male | Female |
| Management | 52 (64.2%) | 29 (35.8%) |
| Business & Financial | 0 (0.0%) | 58 (100.0%) |
| Computers, Engineering & Science | 0 (0.0%) | 0 (0.0%) |
| Computers & Mathematics | 0 (0.0%) | 0 (0.0%) |
| Architecture & Engineering | 0 (0.0%) | 0 (0.0%) |
| Life, Physical & Social Science | 0 (0.0%) | 0 (0.0%) |
| Community & Social Service | 43 (29.0%) | 105 (71.0%) |
| Education, Arts & Media | 17 (100.0%) | 0 (0.0%) |
| Legal Services & Support | 0 (0.0%) | 0 (0.0%) |
| Education Instruction & Library | 26 (24.3%) | 81 (75.7%) |
| Arts, Media & Entertainment | 0 (0.0%) | 24 (100.0%) |
| Health Diagnosing & Treating | 14 (58.3%) | 10 (41.7%) |
| Health Technologists | 14 (100.0%) | 0 (0.0%) |
| Total (Category) | 109 (35.0%) | 202 (64.9%) |
| Total (Overall) | 368 (53.8%) | 316 (46.2%) |
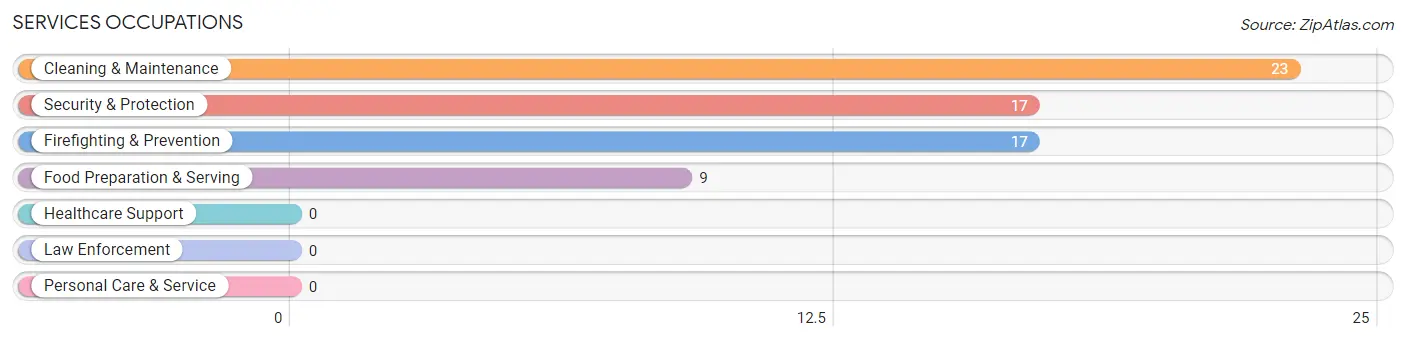
Services Occupations
The most common Services occupations in Foscoe are Cleaning & Maintenance (23 | 3.4%), Security & Protection (17 | 2.5%), Firefighting & Prevention (17 | 2.5%), and Food Preparation & Serving (9 | 1.3%).
Services Occupations by Sex
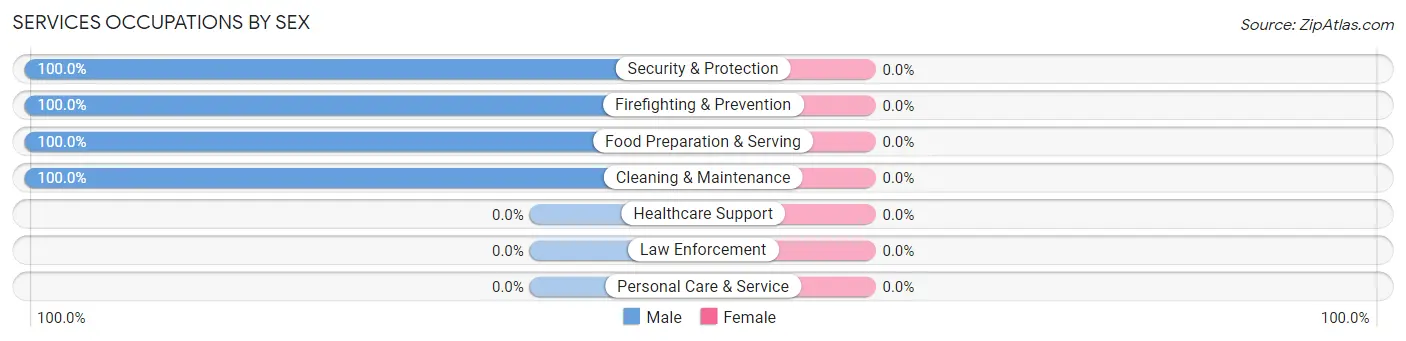
| Occupation | Male | Female |
| Healthcare Support | 0 (0.0%) | 0 (0.0%) |
| Security & Protection | 17 (100.0%) | 0 (0.0%) |
| Firefighting & Prevention | 17 (100.0%) | 0 (0.0%) |
| Law Enforcement | 0 (0.0%) | 0 (0.0%) |
| Food Preparation & Serving | 9 (100.0%) | 0 (0.0%) |
| Cleaning & Maintenance | 23 (100.0%) | 0 (0.0%) |
| Personal Care & Service | 0 (0.0%) | 0 (0.0%) |
| Total (Category) | 49 (100.0%) | 0 (0.0%) |
| Total (Overall) | 368 (53.8%) | 316 (46.2%) |
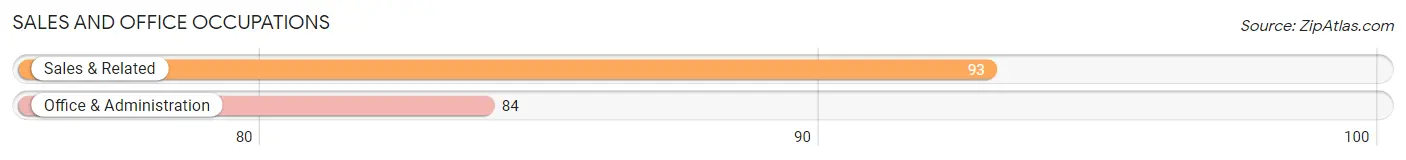
Sales and Office Occupations
The most common Sales and Office occupations in Foscoe are Sales & Related (93 | 13.6%), and Office & Administration (84 | 12.3%).
Sales and Office Occupations by Sex
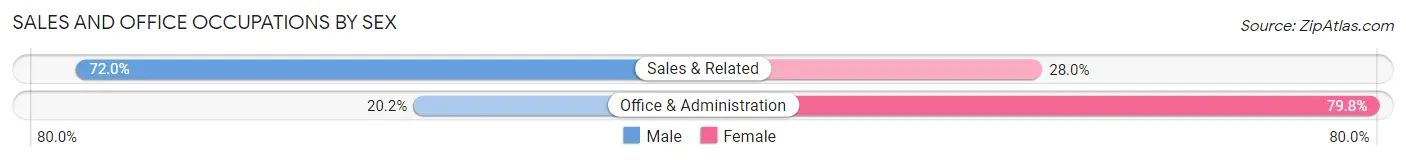
| Occupation | Male | Female |
| Sales & Related | 67 (72.0%) | 26 (28.0%) |
| Office & Administration | 17 (20.2%) | 67 (79.8%) |
| Total (Category) | 84 (47.5%) | 93 (52.5%) |
| Total (Overall) | 368 (53.8%) | 316 (46.2%) |
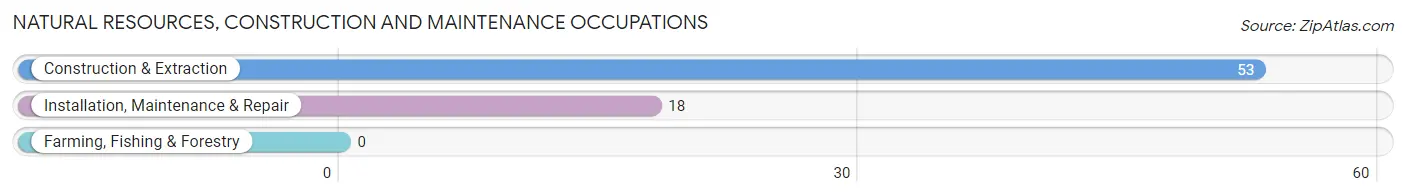
Natural Resources, Construction and Maintenance Occupations
The most common Natural Resources, Construction and Maintenance occupations in Foscoe are Construction & Extraction (53 | 7.7%), and Installation, Maintenance & Repair (18 | 2.6%).
Natural Resources, Construction and Maintenance Occupations by Sex
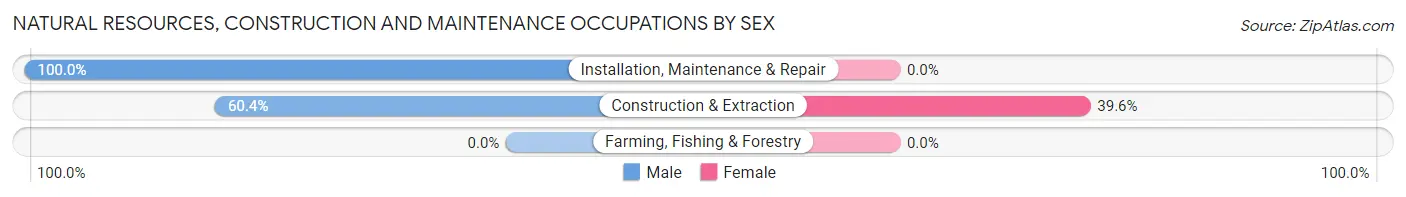
| Occupation | Male | Female |
| Farming, Fishing & Forestry | 0 (0.0%) | 0 (0.0%) |
| Construction & Extraction | 32 (60.4%) | 21 (39.6%) |
| Installation, Maintenance & Repair | 18 (100.0%) | 0 (0.0%) |
| Total (Category) | 50 (70.4%) | 21 (29.6%) |
| Total (Overall) | 368 (53.8%) | 316 (46.2%) |
Production, Transportation and Moving Occupations
The most common Production, Transportation and Moving occupations in Foscoe are , and Material Moving (76 | 11.1%).
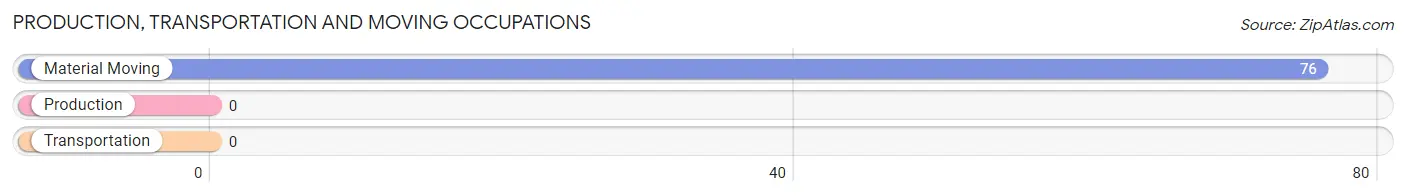
Production, Transportation and Moving Occupations by Sex
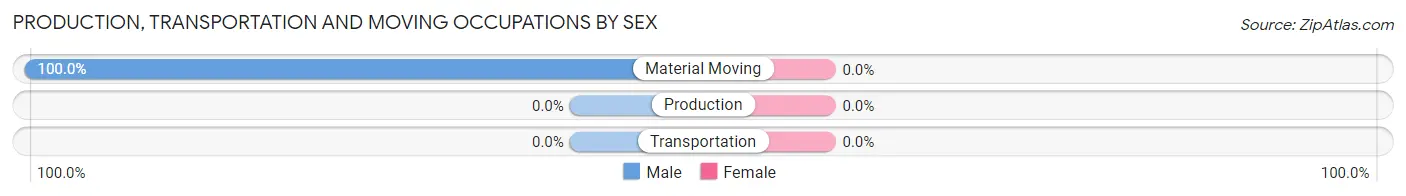
| Occupation | Male | Female |
| Production | 0 (0.0%) | 0 (0.0%) |
| Transportation | 0 (0.0%) | 0 (0.0%) |
| Material Moving | 76 (100.0%) | 0 (0.0%) |
| Total (Category) | 76 (100.0%) | 0 (0.0%) |
| Total (Overall) | 368 (53.8%) | 316 (46.2%) |
Employment Industries by Sex in Foscoe
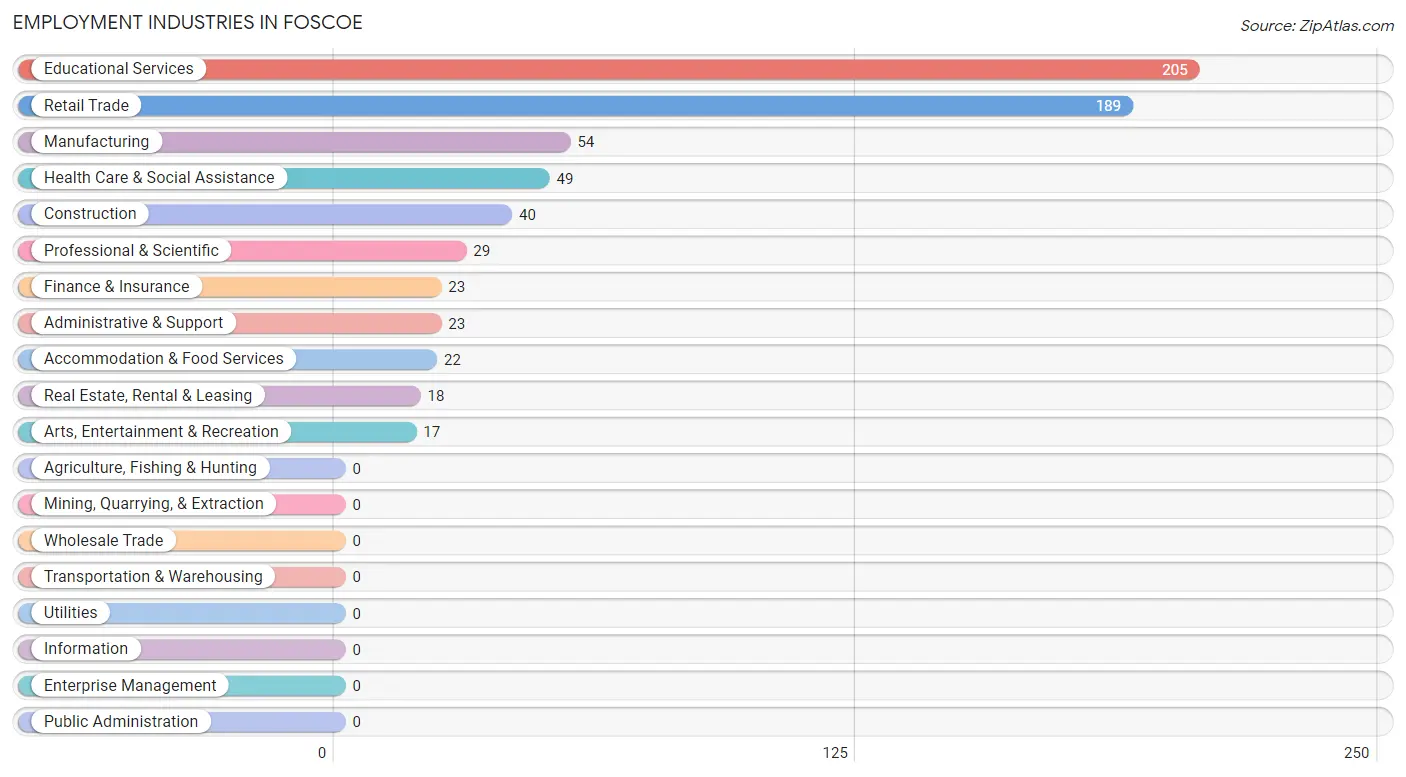
Employment Industries in Foscoe
The major employment industries in Foscoe include Educational Services (205 | 30.0%), Retail Trade (189 | 27.6%), Manufacturing (54 | 7.9%), Health Care & Social Assistance (49 | 7.2%), and Construction (40 | 5.9%).
Employment Industries by Sex in Foscoe
The Foscoe industries that see more men than women are Manufacturing (100.0%), Retail Trade (100.0%), and Administrative & Support (100.0%), whereas the industries that tend to have a higher number of women are Finance & Insurance (100.0%), Real Estate, Rental & Leasing (100.0%), and Professional & Scientific (100.0%).
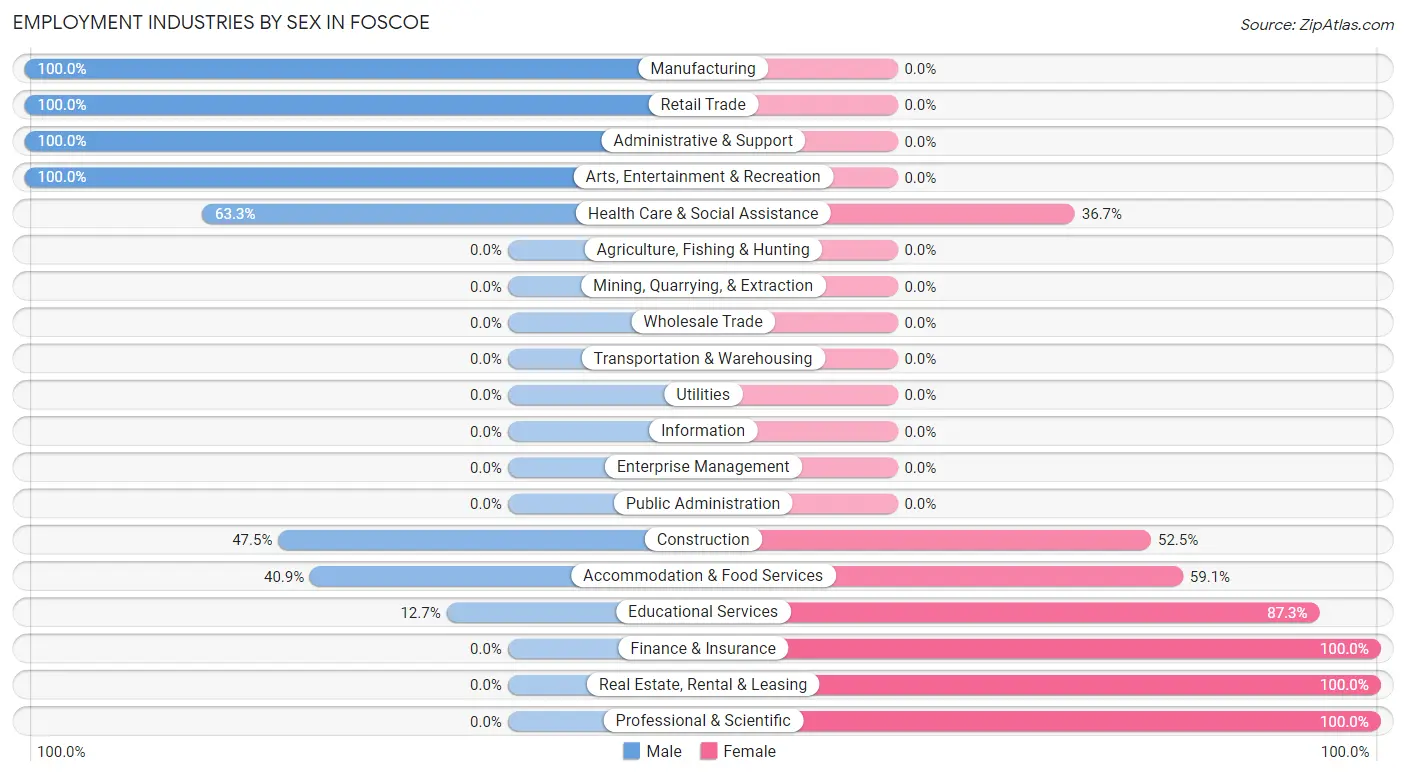
| Industry | Male | Female |
| Agriculture, Fishing & Hunting | 0 (0.0%) | 0 (0.0%) |
| Mining, Quarrying, & Extraction | 0 (0.0%) | 0 (0.0%) |
| Construction | 19 (47.5%) | 21 (52.5%) |
| Manufacturing | 54 (100.0%) | 0 (0.0%) |
| Wholesale Trade | 0 (0.0%) | 0 (0.0%) |
| Retail Trade | 189 (100.0%) | 0 (0.0%) |
| Transportation & Warehousing | 0 (0.0%) | 0 (0.0%) |
| Utilities | 0 (0.0%) | 0 (0.0%) |
| Information | 0 (0.0%) | 0 (0.0%) |
| Finance & Insurance | 0 (0.0%) | 23 (100.0%) |
| Real Estate, Rental & Leasing | 0 (0.0%) | 18 (100.0%) |
| Professional & Scientific | 0 (0.0%) | 29 (100.0%) |
| Enterprise Management | 0 (0.0%) | 0 (0.0%) |
| Administrative & Support | 23 (100.0%) | 0 (0.0%) |
| Educational Services | 26 (12.7%) | 179 (87.3%) |
| Health Care & Social Assistance | 31 (63.3%) | 18 (36.7%) |
| Arts, Entertainment & Recreation | 17 (100.0%) | 0 (0.0%) |
| Accommodation & Food Services | 9 (40.9%) | 13 (59.1%) |
| Public Administration | 0 (0.0%) | 0 (0.0%) |
| Total | 368 (53.8%) | 316 (46.2%) |
Education in Foscoe
School Enrollment in Foscoe
The most common levels of schooling among the 541 students in Foscoe are high school (123 | 22.7%), graduate / professional (100 | 18.5%), and college / undergraduate (99 | 18.3%).
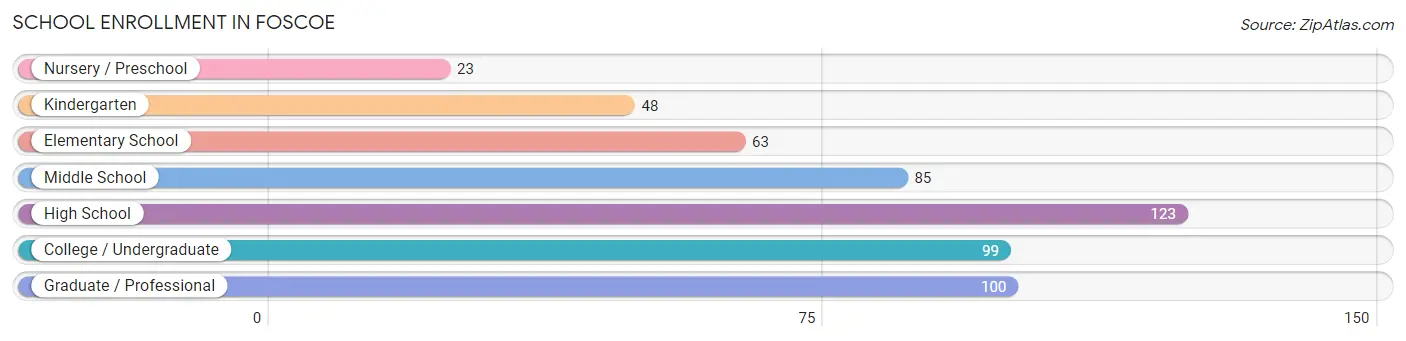
| School Level | # Students | % Students |
| Nursery / Preschool | 23 | 4.3% |
| Kindergarten | 48 | 8.9% |
| Elementary School | 63 | 11.7% |
| Middle School | 85 | 15.7% |
| High School | 123 | 22.7% |
| College / Undergraduate | 99 | 18.3% |
| Graduate / Professional | 100 | 18.5% |
| Total | 541 | 100.0% |
School Enrollment by Age by Funding Source in Foscoe
Out of a total of 541 students who are enrolled in schools in Foscoe, 14 (2.6%) attend a private institution, while the remaining 527 (97.4%) are enrolled in public schools. The age group of 5 to 9 year old has the highest likelihood of being enrolled in private schools, with 14 (12.6% in the age bracket) enrolled. Conversely, the age group of 3 to 4 year olds has the lowest likelihood of being enrolled in a private school, with 23 (100.0% in the age bracket) attending a public institution.
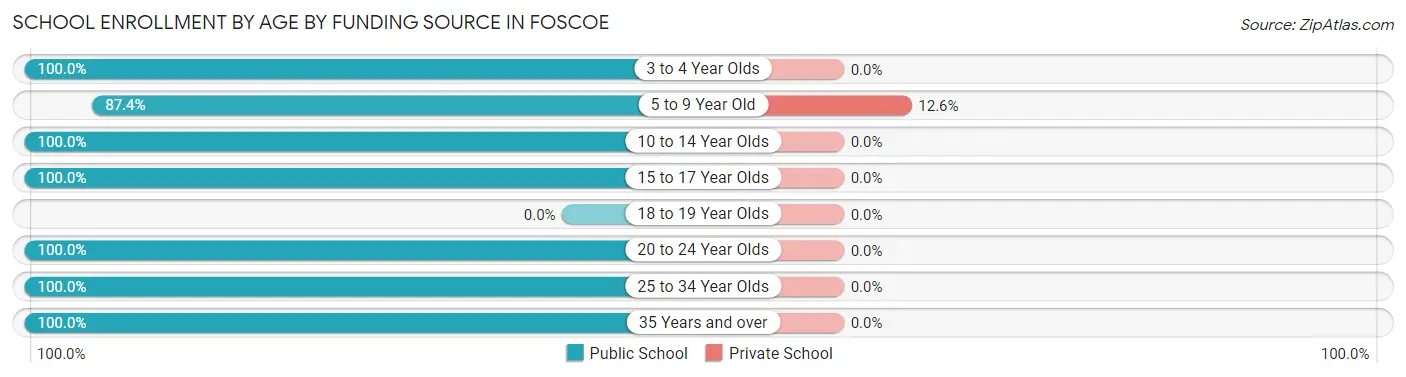
| Age Bracket | Public School | Private School |
| 3 to 4 Year Olds | 23 (100.0%) | 0 (0.0%) |
| 5 to 9 Year Old | 97 (87.4%) | 14 (12.6%) |
| 10 to 14 Year Olds | 99 (100.0%) | 0 (0.0%) |
| 15 to 17 Year Olds | 109 (100.0%) | 0 (0.0%) |
| 18 to 19 Year Olds | 0 (0.0%) | 0 (0.0%) |
| 20 to 24 Year Olds | 50 (100.0%) | 0 (0.0%) |
| 25 to 34 Year Olds | 47 (100.0%) | 0 (0.0%) |
| 35 Years and over | 102 (100.0%) | 0 (0.0%) |
| Total | 527 (97.4%) | 14 (2.6%) |
Educational Attainment by Field of Study in Foscoe
Education (89 | 18.6%), physical & health sciences (77 | 16.1%), visual & performing arts (76 | 15.9%), literature & languages (58 | 12.1%), and science & technology (45 | 9.4%) are the most common fields of study among 478 individuals in Foscoe who have obtained a bachelor's degree or higher.
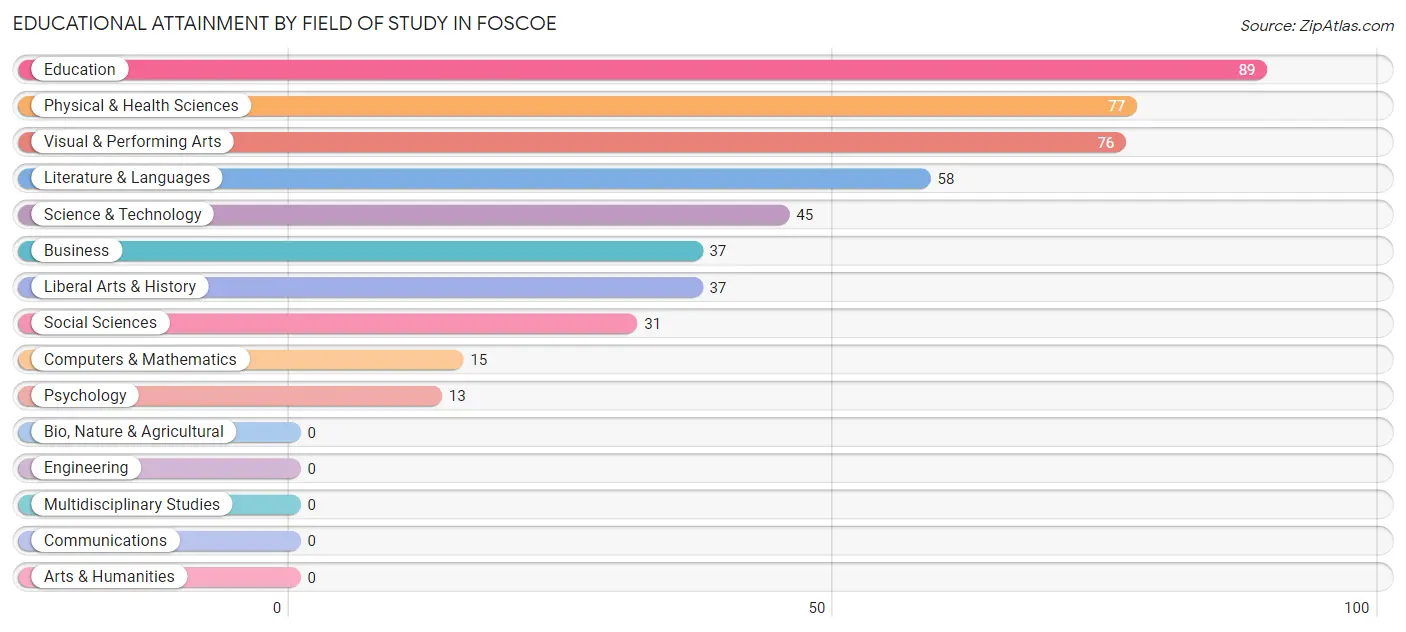
| Field of Study | # Graduates | % Graduates |
| Computers & Mathematics | 15 | 3.1% |
| Bio, Nature & Agricultural | 0 | 0.0% |
| Physical & Health Sciences | 77 | 16.1% |
| Psychology | 13 | 2.7% |
| Social Sciences | 31 | 6.5% |
| Engineering | 0 | 0.0% |
| Multidisciplinary Studies | 0 | 0.0% |
| Science & Technology | 45 | 9.4% |
| Business | 37 | 7.7% |
| Education | 89 | 18.6% |
| Literature & Languages | 58 | 12.1% |
| Liberal Arts & History | 37 | 7.7% |
| Visual & Performing Arts | 76 | 15.9% |
| Communications | 0 | 0.0% |
| Arts & Humanities | 0 | 0.0% |
| Total | 478 | 100.0% |
Transportation & Commute in Foscoe
Vehicle Availability by Sex in Foscoe
The most prevalent vehicle ownership categories in Foscoe are males with 1 vehicle (119, accounting for 33.3%) and females with 1 vehicle (105, making up 37.7%).
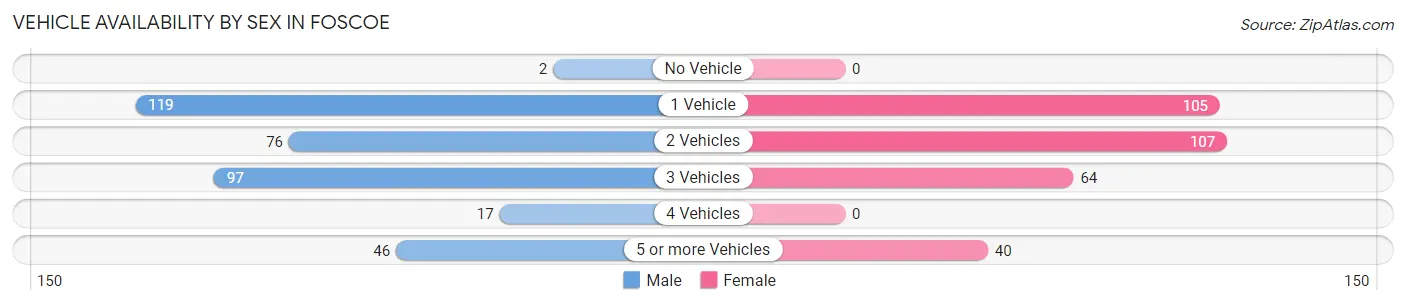
| Vehicles Available | Male | Female |
| No Vehicle | 2 (0.6%) | 0 (0.0%) |
| 1 Vehicle | 119 (33.3%) | 105 (33.2%) |
| 2 Vehicles | 76 (21.3%) | 107 (33.9%) |
| 3 Vehicles | 97 (27.2%) | 64 (20.3%) |
| 4 Vehicles | 17 (4.8%) | 0 (0.0%) |
| 5 or more Vehicles | 46 (12.9%) | 40 (12.7%) |
| Total | 357 (100.0%) | 316 (100.0%) |
Commute Time in Foscoe
The most frequently occuring commute durations in Foscoe are 20 to 24 minutes (260 commuters, 41.2%), 15 to 19 minutes (159 commuters, 25.2%), and 30 to 34 minutes (43 commuters, 6.8%).
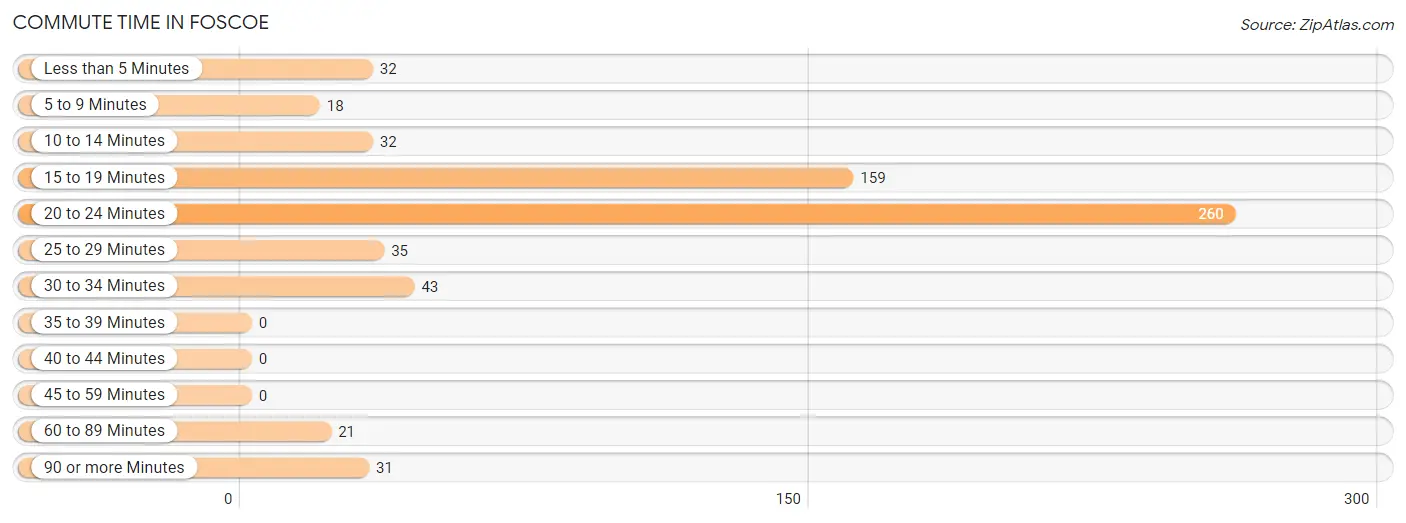
| Commute Time | # Commuters | % Commuters |
| Less than 5 Minutes | 32 | 5.1% |
| 5 to 9 Minutes | 18 | 2.9% |
| 10 to 14 Minutes | 32 | 5.1% |
| 15 to 19 Minutes | 159 | 25.2% |
| 20 to 24 Minutes | 260 | 41.2% |
| 25 to 29 Minutes | 35 | 5.6% |
| 30 to 34 Minutes | 43 | 6.8% |
| 35 to 39 Minutes | 0 | 0.0% |
| 40 to 44 Minutes | 0 | 0.0% |
| 45 to 59 Minutes | 0 | 0.0% |
| 60 to 89 Minutes | 21 | 3.3% |
| 90 or more Minutes | 31 | 4.9% |
Commute Time by Sex in Foscoe
The most common commute times in Foscoe are 15 to 19 minutes (131 commuters, 38.6%) for males and 20 to 24 minutes (168 commuters, 57.5%) for females.
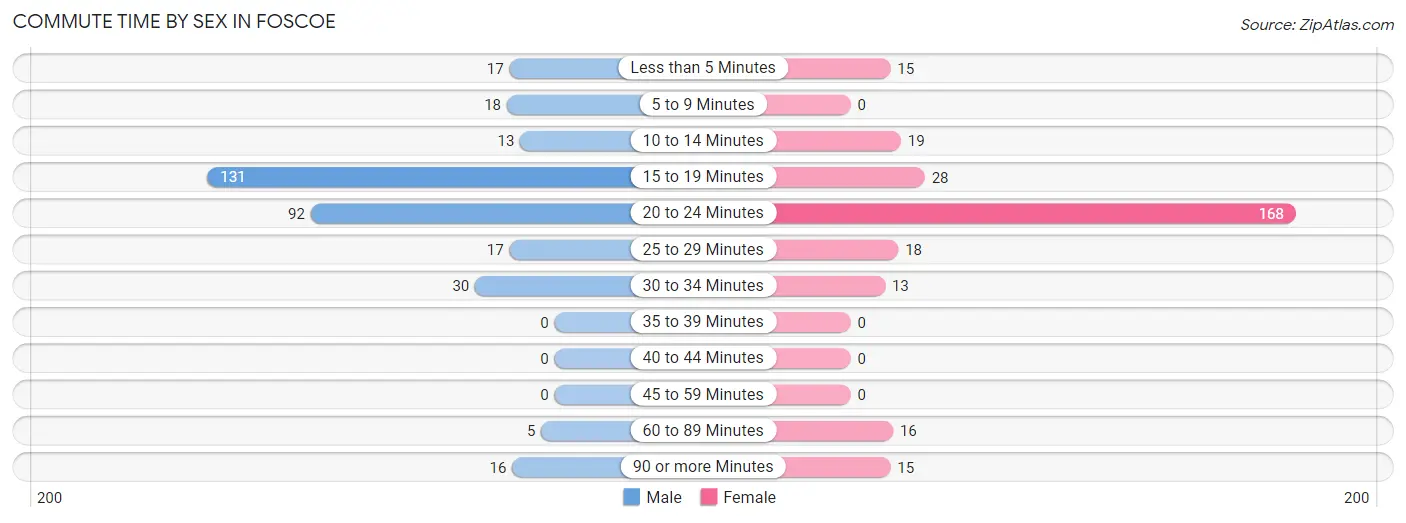
| Commute Time | Male | Female |
| Less than 5 Minutes | 17 (5.0%) | 15 (5.1%) |
| 5 to 9 Minutes | 18 (5.3%) | 0 (0.0%) |
| 10 to 14 Minutes | 13 (3.8%) | 19 (6.5%) |
| 15 to 19 Minutes | 131 (38.6%) | 28 (9.6%) |
| 20 to 24 Minutes | 92 (27.1%) | 168 (57.5%) |
| 25 to 29 Minutes | 17 (5.0%) | 18 (6.2%) |
| 30 to 34 Minutes | 30 (8.8%) | 13 (4.4%) |
| 35 to 39 Minutes | 0 (0.0%) | 0 (0.0%) |
| 40 to 44 Minutes | 0 (0.0%) | 0 (0.0%) |
| 45 to 59 Minutes | 0 (0.0%) | 0 (0.0%) |
| 60 to 89 Minutes | 5 (1.5%) | 16 (5.5%) |
| 90 or more Minutes | 16 (4.7%) | 15 (5.1%) |
Time of Departure to Work by Sex in Foscoe
The most frequent times of departure to work in Foscoe are 7:00 AM to 7:29 AM (80, 23.6%) for males and 7:30 AM to 7:59 AM (101, 34.6%) for females.
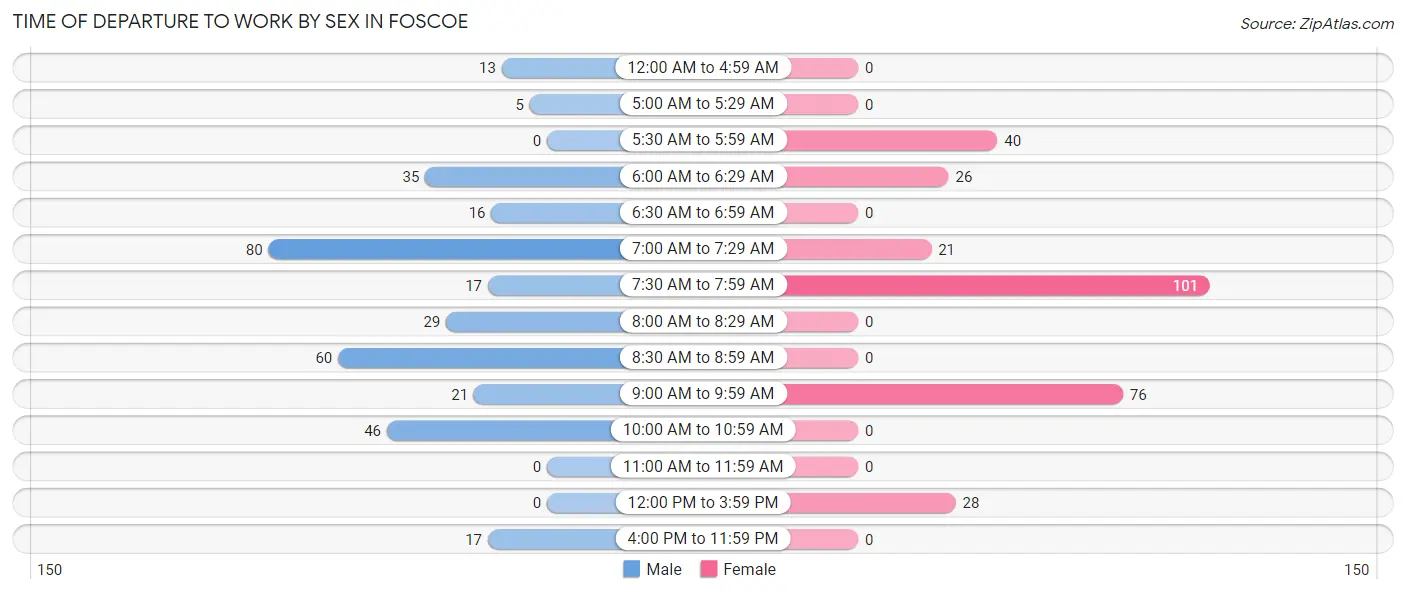
| Time of Departure | Male | Female |
| 12:00 AM to 4:59 AM | 13 (3.8%) | 0 (0.0%) |
| 5:00 AM to 5:29 AM | 5 (1.5%) | 0 (0.0%) |
| 5:30 AM to 5:59 AM | 0 (0.0%) | 40 (13.7%) |
| 6:00 AM to 6:29 AM | 35 (10.3%) | 26 (8.9%) |
| 6:30 AM to 6:59 AM | 16 (4.7%) | 0 (0.0%) |
| 7:00 AM to 7:29 AM | 80 (23.6%) | 21 (7.2%) |
| 7:30 AM to 7:59 AM | 17 (5.0%) | 101 (34.6%) |
| 8:00 AM to 8:29 AM | 29 (8.6%) | 0 (0.0%) |
| 8:30 AM to 8:59 AM | 60 (17.7%) | 0 (0.0%) |
| 9:00 AM to 9:59 AM | 21 (6.2%) | 76 (26.0%) |
| 10:00 AM to 10:59 AM | 46 (13.6%) | 0 (0.0%) |
| 11:00 AM to 11:59 AM | 0 (0.0%) | 0 (0.0%) |
| 12:00 PM to 3:59 PM | 0 (0.0%) | 28 (9.6%) |
| 4:00 PM to 11:59 PM | 17 (5.0%) | 0 (0.0%) |
| Total | 339 (100.0%) | 292 (100.0%) |
Housing Occupancy in Foscoe
Occupancy by Ownership in Foscoe
Of the total 636 dwellings in Foscoe, owner-occupied units account for 360 (56.6%), while renter-occupied units make up 276 (43.4%).
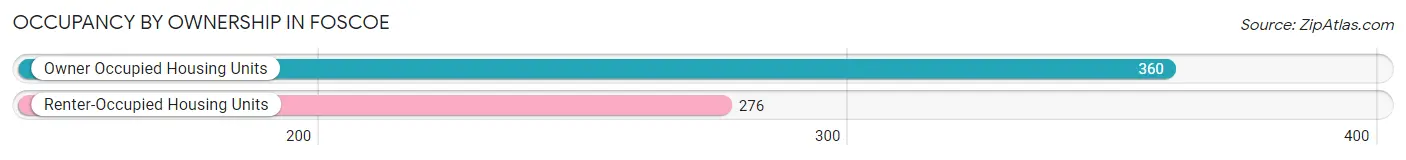
| Occupancy | # Housing Units | % Housing Units |
| Owner Occupied Housing Units | 360 | 56.6% |
| Renter-Occupied Housing Units | 276 | 43.4% |
| Total Occupied Housing Units | 636 | 100.0% |
Occupancy by Household Size in Foscoe
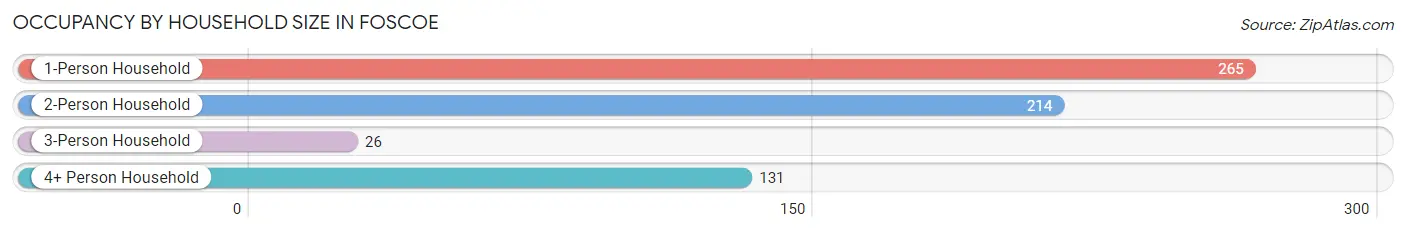
| Household Size | # Housing Units | % Housing Units |
| 1-Person Household | 265 | 41.7% |
| 2-Person Household | 214 | 33.7% |
| 3-Person Household | 26 | 4.1% |
| 4+ Person Household | 131 | 20.6% |
| Total Housing Units | 636 | 100.0% |
Occupancy by Ownership by Household Size in Foscoe
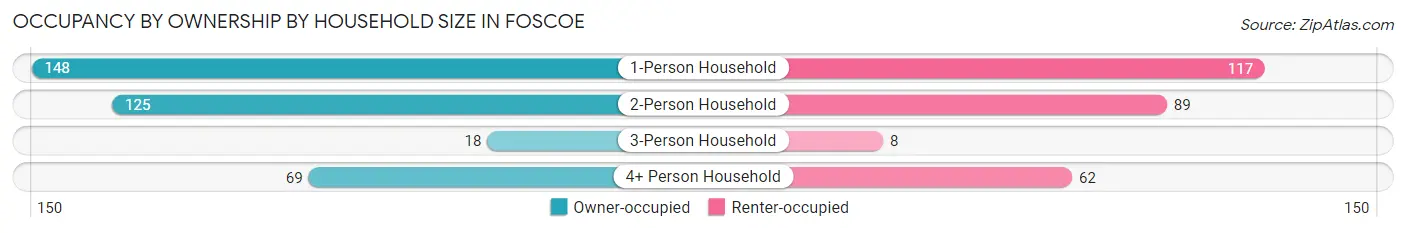
| Household Size | Owner-occupied | Renter-occupied |
| 1-Person Household | 148 (55.8%) | 117 (44.2%) |
| 2-Person Household | 125 (58.4%) | 89 (41.6%) |
| 3-Person Household | 18 (69.2%) | 8 (30.8%) |
| 4+ Person Household | 69 (52.7%) | 62 (47.3%) |
| Total Housing Units | 360 (56.6%) | 276 (43.4%) |
Occupancy by Educational Attainment in Foscoe
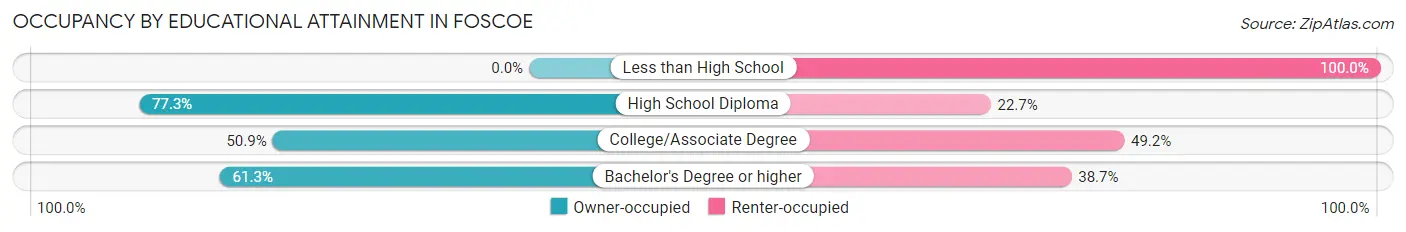
| Household Size | Owner-occupied | Renter-occupied |
| Less than High School | 0 (0.0%) | 44 (100.0%) |
| High School Diploma | 75 (77.3%) | 22 (22.7%) |
| College/Associate Degree | 90 (50.8%) | 87 (49.1%) |
| Bachelor's Degree or higher | 195 (61.3%) | 123 (38.7%) |
Occupancy by Age of Householder in Foscoe
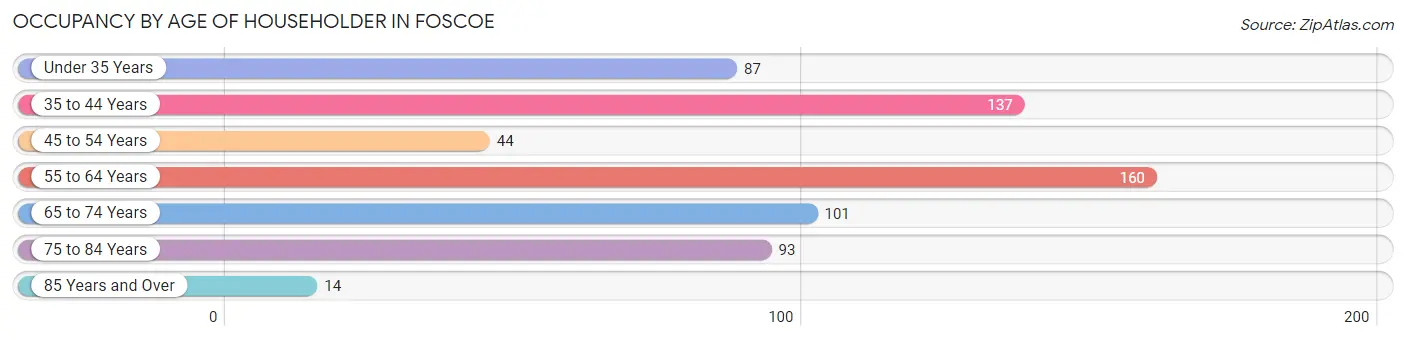
| Age Bracket | # Households | % Households |
| Under 35 Years | 87 | 13.7% |
| 35 to 44 Years | 137 | 21.5% |
| 45 to 54 Years | 44 | 6.9% |
| 55 to 64 Years | 160 | 25.2% |
| 65 to 74 Years | 101 | 15.9% |
| 75 to 84 Years | 93 | 14.6% |
| 85 Years and Over | 14 | 2.2% |
| Total | 636 | 100.0% |
Housing Finances in Foscoe
Median Income by Occupancy in Foscoe
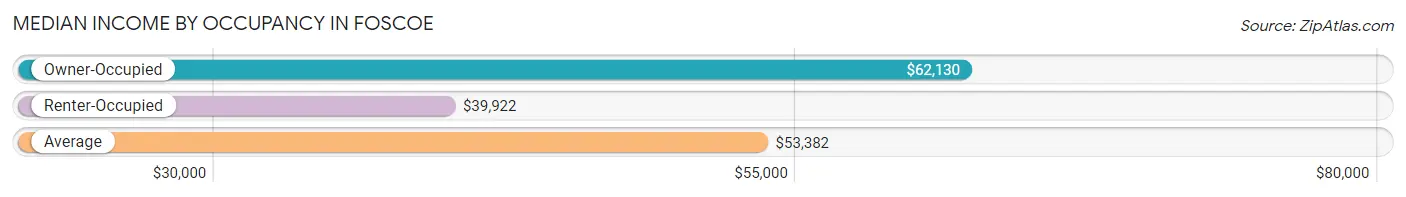
| Occupancy Type | # Households | Median Income |
| Owner-Occupied | 360 (56.6%) | $62,130 |
| Renter-Occupied | 276 (43.4%) | $39,922 |
| Average | 636 (100.0%) | $53,382 |
Occupancy by Householder Income Bracket in Foscoe
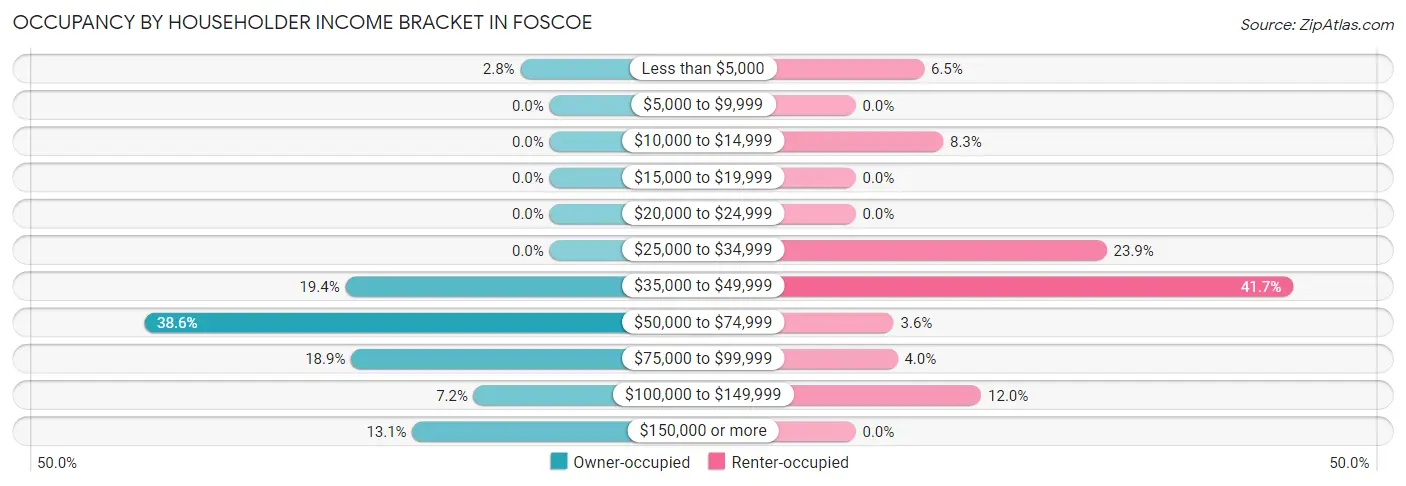
| Income Bracket | Owner-occupied | Renter-occupied |
| Less than $5,000 | 10 (2.8%) | 18 (6.5%) |
| $5,000 to $9,999 | 0 (0.0%) | 0 (0.0%) |
| $10,000 to $14,999 | 0 (0.0%) | 23 (8.3%) |
| $15,000 to $19,999 | 0 (0.0%) | 0 (0.0%) |
| $20,000 to $24,999 | 0 (0.0%) | 0 (0.0%) |
| $25,000 to $34,999 | 0 (0.0%) | 66 (23.9%) |
| $35,000 to $49,999 | 70 (19.4%) | 115 (41.7%) |
| $50,000 to $74,999 | 139 (38.6%) | 10 (3.6%) |
| $75,000 to $99,999 | 68 (18.9%) | 11 (4.0%) |
| $100,000 to $149,999 | 26 (7.2%) | 33 (12.0%) |
| $150,000 or more | 47 (13.1%) | 0 (0.0%) |
| Total | 360 (100.0%) | 276 (100.0%) |
Monthly Housing Cost Tiers in Foscoe
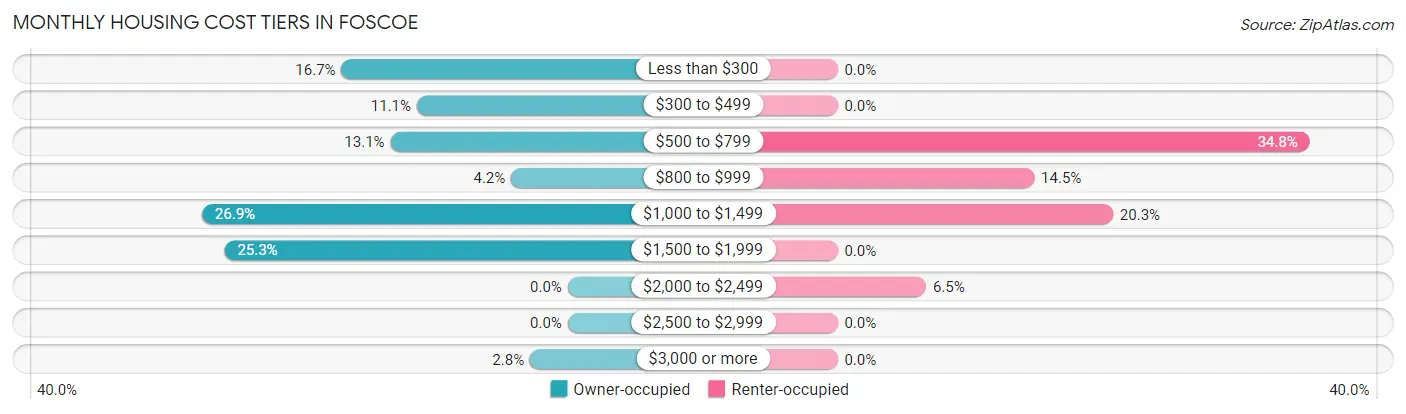
| Monthly Cost | Owner-occupied | Renter-occupied |
| Less than $300 | 60 (16.7%) | 0 (0.0%) |
| $300 to $499 | 40 (11.1%) | 0 (0.0%) |
| $500 to $799 | 47 (13.1%) | 96 (34.8%) |
| $800 to $999 | 15 (4.2%) | 40 (14.5%) |
| $1,000 to $1,499 | 97 (26.9%) | 56 (20.3%) |
| $1,500 to $1,999 | 91 (25.3%) | 0 (0.0%) |
| $2,000 to $2,499 | 0 (0.0%) | 18 (6.5%) |
| $2,500 to $2,999 | 0 (0.0%) | 0 (0.0%) |
| $3,000 or more | 10 (2.8%) | 0 (0.0%) |
| Total | 360 (100.0%) | 276 (100.0%) |
Physical Housing Characteristics in Foscoe
Housing Structures in Foscoe
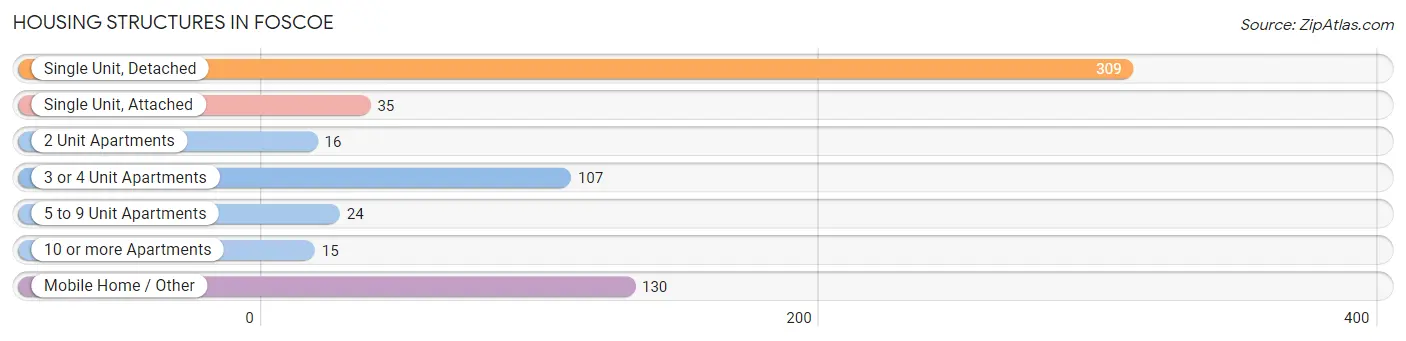
| Structure Type | # Housing Units | % Housing Units |
| Single Unit, Detached | 309 | 48.6% |
| Single Unit, Attached | 35 | 5.5% |
| 2 Unit Apartments | 16 | 2.5% |
| 3 or 4 Unit Apartments | 107 | 16.8% |
| 5 to 9 Unit Apartments | 24 | 3.8% |
| 10 or more Apartments | 15 | 2.4% |
| Mobile Home / Other | 130 | 20.4% |
| Total | 636 | 100.0% |
Housing Structures by Occupancy in Foscoe
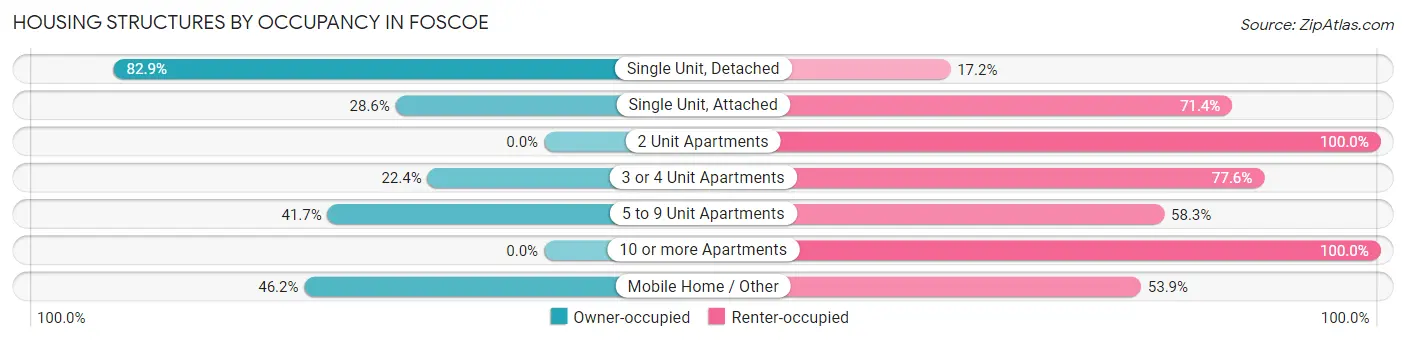
| Structure Type | Owner-occupied | Renter-occupied |
| Single Unit, Detached | 256 (82.9%) | 53 (17.2%) |
| Single Unit, Attached | 10 (28.6%) | 25 (71.4%) |
| 2 Unit Apartments | 0 (0.0%) | 16 (100.0%) |
| 3 or 4 Unit Apartments | 24 (22.4%) | 83 (77.6%) |
| 5 to 9 Unit Apartments | 10 (41.7%) | 14 (58.3%) |
| 10 or more Apartments | 0 (0.0%) | 15 (100.0%) |
| Mobile Home / Other | 60 (46.2%) | 70 (53.8%) |
| Total | 360 (56.6%) | 276 (43.4%) |
Housing Structures by Number of Rooms in Foscoe
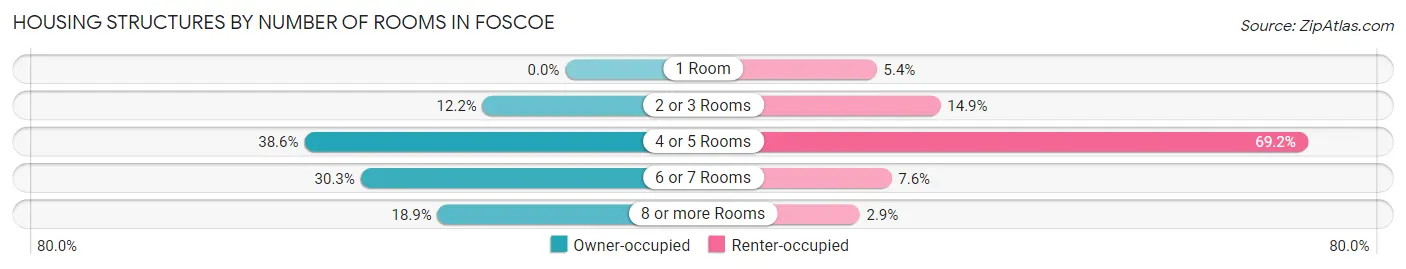
| Number of Rooms | Owner-occupied | Renter-occupied |
| 1 Room | 0 (0.0%) | 15 (5.4%) |
| 2 or 3 Rooms | 44 (12.2%) | 41 (14.9%) |
| 4 or 5 Rooms | 139 (38.6%) | 191 (69.2%) |
| 6 or 7 Rooms | 109 (30.3%) | 21 (7.6%) |
| 8 or more Rooms | 68 (18.9%) | 8 (2.9%) |
| Total | 360 (100.0%) | 276 (100.0%) |
Housing Structure by Heating Type in Foscoe
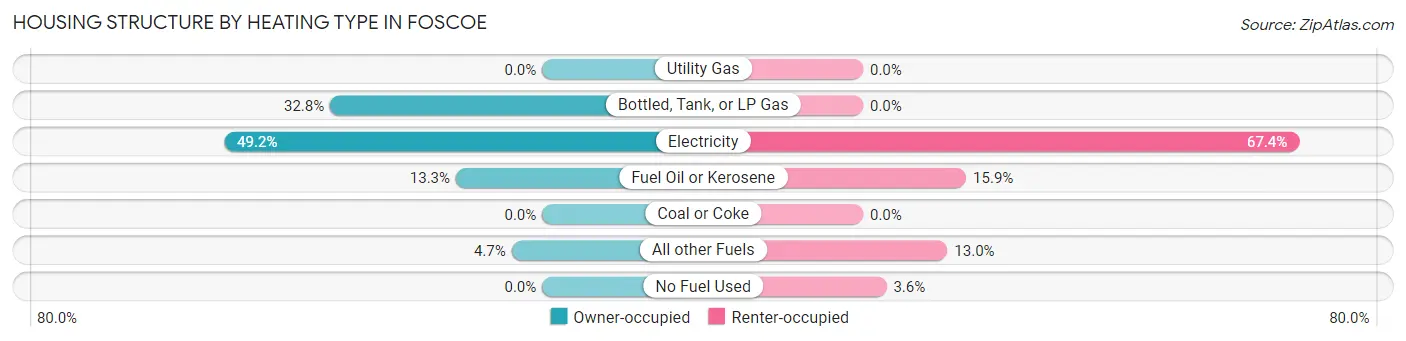
| Heating Type | Owner-occupied | Renter-occupied |
| Utility Gas | 0 (0.0%) | 0 (0.0%) |
| Bottled, Tank, or LP Gas | 118 (32.8%) | 0 (0.0%) |
| Electricity | 177 (49.2%) | 186 (67.4%) |
| Fuel Oil or Kerosene | 48 (13.3%) | 44 (15.9%) |
| Coal or Coke | 0 (0.0%) | 0 (0.0%) |
| All other Fuels | 17 (4.7%) | 36 (13.0%) |
| No Fuel Used | 0 (0.0%) | 10 (3.6%) |
| Total | 360 (100.0%) | 276 (100.0%) |
Household Vehicle Usage in Foscoe
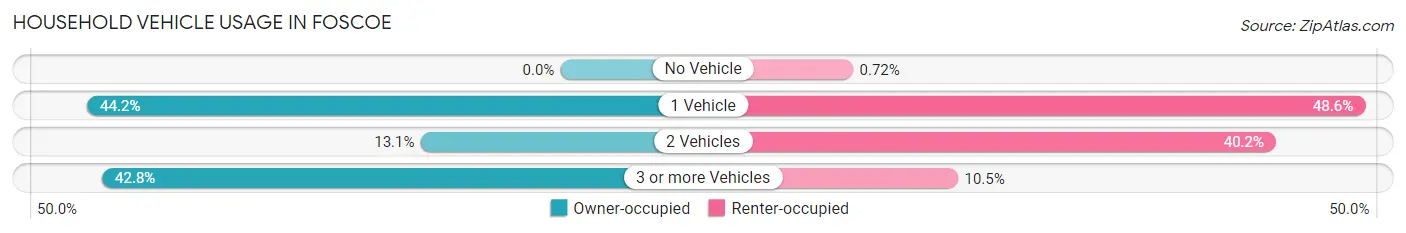
| Vehicles per Household | Owner-occupied | Renter-occupied |
| No Vehicle | 0 (0.0%) | 2 (0.7%) |
| 1 Vehicle | 159 (44.2%) | 134 (48.5%) |
| 2 Vehicles | 47 (13.1%) | 111 (40.2%) |
| 3 or more Vehicles | 154 (42.8%) | 29 (10.5%) |
| Total | 360 (100.0%) | 276 (100.0%) |
Real Estate & Mortgages in Foscoe
Real Estate and Mortgage Overview in Foscoe
| Characteristic | Without Mortgage | With Mortgage |
| Housing Units | 164 | 196 |
| Median Property Value | - | - |
| Median Household Income | $63,468 | $32 |
| Monthly Housing Costs | $438 | $10 |
| Real Estate Taxes | - | - |
Property Value by Mortgage Status in Foscoe
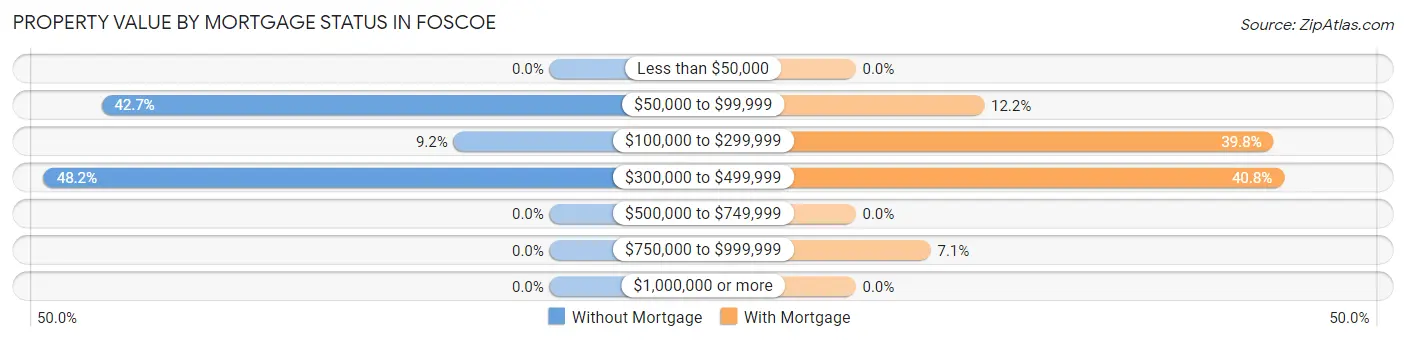
| Property Value | Without Mortgage | With Mortgage |
| Less than $50,000 | 0 (0.0%) | 0 (0.0%) |
| $50,000 to $99,999 | 70 (42.7%) | 24 (12.2%) |
| $100,000 to $299,999 | 15 (9.1%) | 78 (39.8%) |
| $300,000 to $499,999 | 79 (48.2%) | 80 (40.8%) |
| $500,000 to $749,999 | 0 (0.0%) | 0 (0.0%) |
| $750,000 to $999,999 | 0 (0.0%) | 14 (7.1%) |
| $1,000,000 or more | 0 (0.0%) | 0 (0.0%) |
| Total | 164 (100.0%) | 196 (100.0%) |
Household Income by Mortgage Status in Foscoe
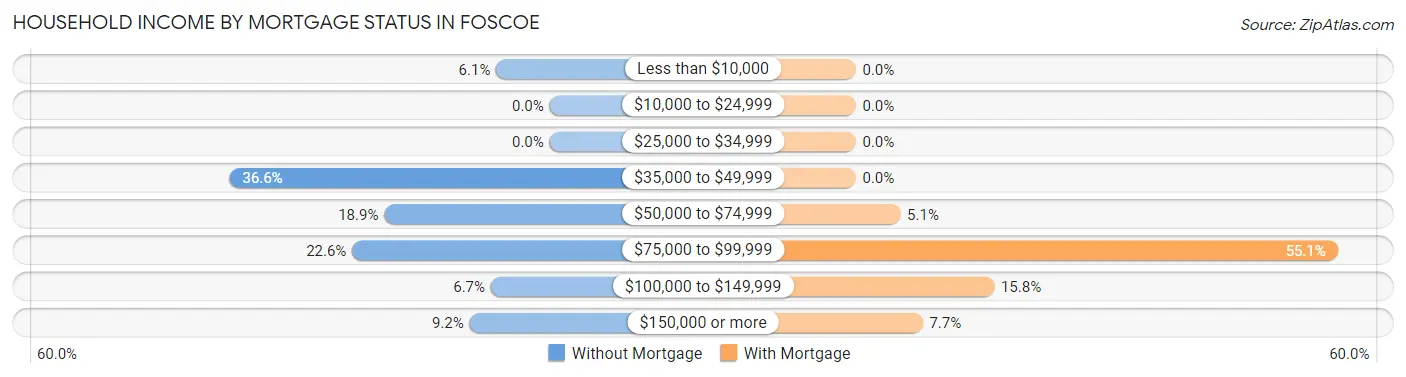
| Household Income | Without Mortgage | With Mortgage |
| Less than $10,000 | 10 (6.1%) | 0 (0.0%) |
| $10,000 to $24,999 | 0 (0.0%) | 0 (0.0%) |
| $25,000 to $34,999 | 0 (0.0%) | 0 (0.0%) |
| $35,000 to $49,999 | 60 (36.6%) | 0 (0.0%) |
| $50,000 to $74,999 | 31 (18.9%) | 10 (5.1%) |
| $75,000 to $99,999 | 37 (22.6%) | 108 (55.1%) |
| $100,000 to $149,999 | 11 (6.7%) | 31 (15.8%) |
| $150,000 or more | 15 (9.1%) | 15 (7.6%) |
| Total | 164 (100.0%) | 196 (100.0%) |
Property Value to Household Income Ratio in Foscoe
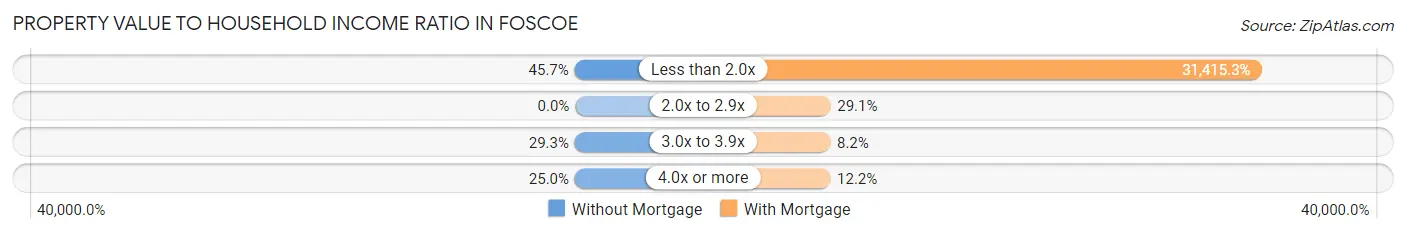
| Value-to-Income Ratio | Without Mortgage | With Mortgage |
| Less than 2.0x | 75 (45.7%) | 61,574 (31,415.3%) |
| 2.0x to 2.9x | 0 (0.0%) | 57 (29.1%) |
| 3.0x to 3.9x | 48 (29.3%) | 16 (8.2%) |
| 4.0x or more | 41 (25.0%) | 24 (12.2%) |
| Total | 164 (100.0%) | 196 (100.0%) |
Real Estate Taxes by Mortgage Status in Foscoe
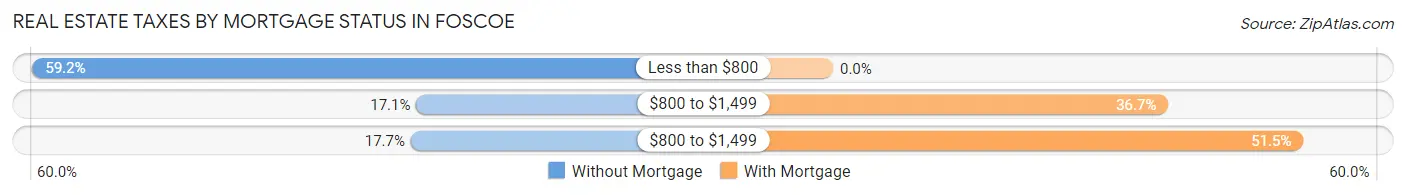
| Property Taxes | Without Mortgage | With Mortgage |
| Less than $800 | 97 (59.2%) | 0 (0.0%) |
| $800 to $1,499 | 28 (17.1%) | 72 (36.7%) |
| $800 to $1,499 | 29 (17.7%) | 101 (51.5%) |
| Total | 164 (100.0%) | 196 (100.0%) |
Health & Disability in Foscoe
Health Insurance Coverage by Age in Foscoe
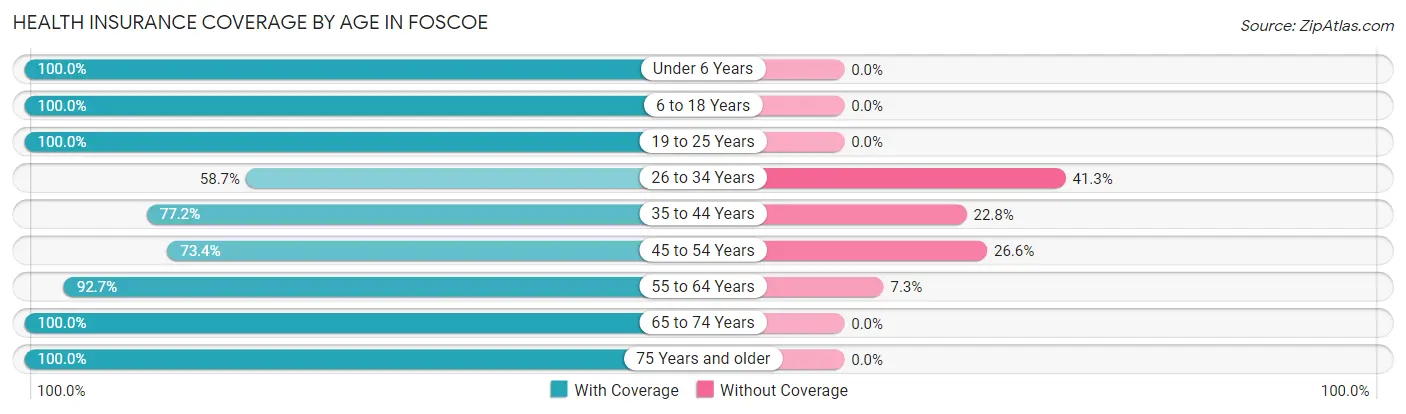
| Age Bracket | With Coverage | Without Coverage |
| Under 6 Years | 72 (100.0%) | 0 (0.0%) |
| 6 to 18 Years | 285 (100.0%) | 0 (0.0%) |
| 19 to 25 Years | 58 (100.0%) | 0 (0.0%) |
| 26 to 34 Years | 84 (58.7%) | 59 (41.3%) |
| 35 to 44 Years | 149 (77.2%) | 44 (22.8%) |
| 45 to 54 Years | 113 (73.4%) | 41 (26.6%) |
| 55 to 64 Years | 190 (92.7%) | 15 (7.3%) |
| 65 to 74 Years | 131 (100.0%) | 0 (0.0%) |
| 75 Years and older | 170 (100.0%) | 0 (0.0%) |
| Total | 1,252 (88.7%) | 159 (11.3%) |
Health Insurance Coverage by Citizenship Status in Foscoe
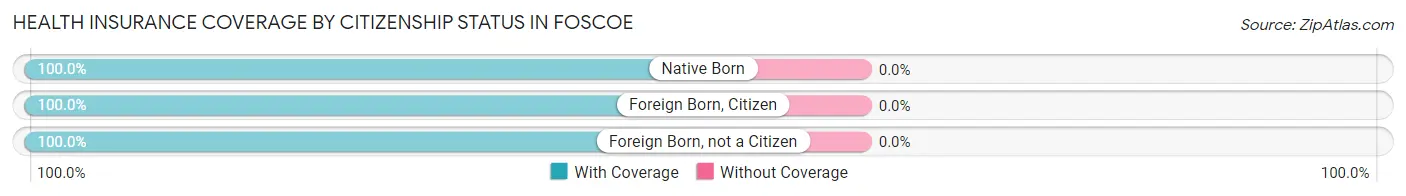
| Citizenship Status | With Coverage | Without Coverage |
| Native Born | 72 (100.0%) | 0 (0.0%) |
| Foreign Born, Citizen | 285 (100.0%) | 0 (0.0%) |
| Foreign Born, not a Citizen | 58 (100.0%) | 0 (0.0%) |
Health Insurance Coverage by Household Income in Foscoe
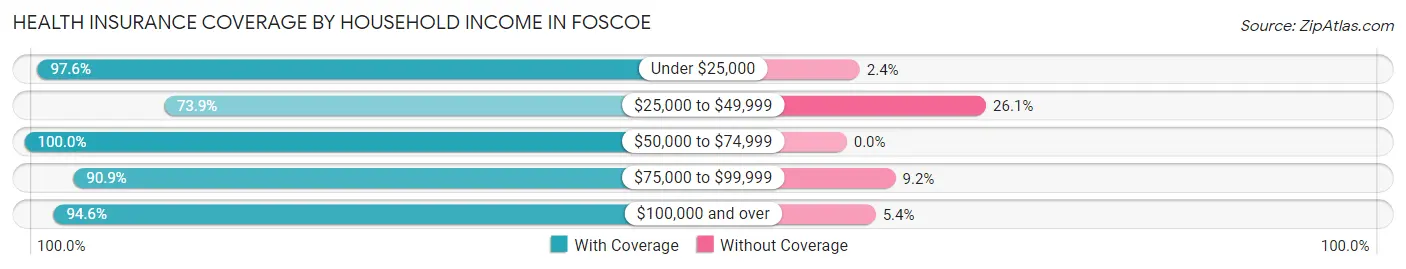
| Household Income | With Coverage | Without Coverage |
| Under $25,000 | 80 (97.6%) | 2 (2.4%) |
| $25,000 to $49,999 | 351 (73.9%) | 124 (26.1%) |
| $50,000 to $74,999 | 358 (100.0%) | 0 (0.0%) |
| $75,000 to $99,999 | 149 (90.8%) | 15 (9.1%) |
| $100,000 and over | 314 (94.6%) | 18 (5.4%) |
Public vs Private Health Insurance Coverage by Age in Foscoe
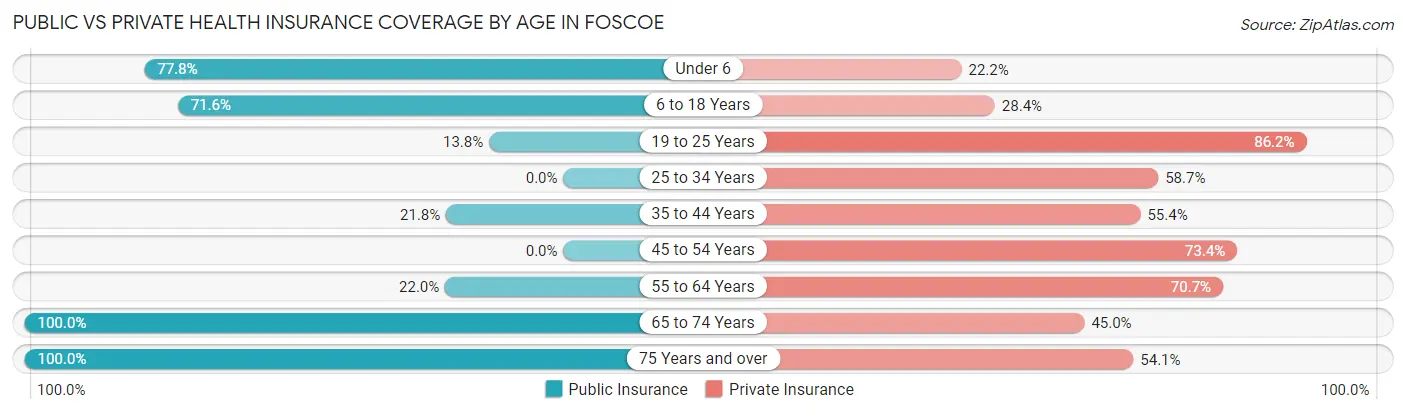
| Age Bracket | Public Insurance | Private Insurance |
| Under 6 | 56 (77.8%) | 16 (22.2%) |
| 6 to 18 Years | 204 (71.6%) | 81 (28.4%) |
| 19 to 25 Years | 8 (13.8%) | 50 (86.2%) |
| 25 to 34 Years | 0 (0.0%) | 84 (58.7%) |
| 35 to 44 Years | 42 (21.8%) | 107 (55.4%) |
| 45 to 54 Years | 0 (0.0%) | 113 (73.4%) |
| 55 to 64 Years | 45 (22.0%) | 145 (70.7%) |
| 65 to 74 Years | 131 (100.0%) | 59 (45.0%) |
| 75 Years and over | 170 (100.0%) | 92 (54.1%) |
| Total | 656 (46.5%) | 747 (52.9%) |
Disability Status by Sex by Age in Foscoe
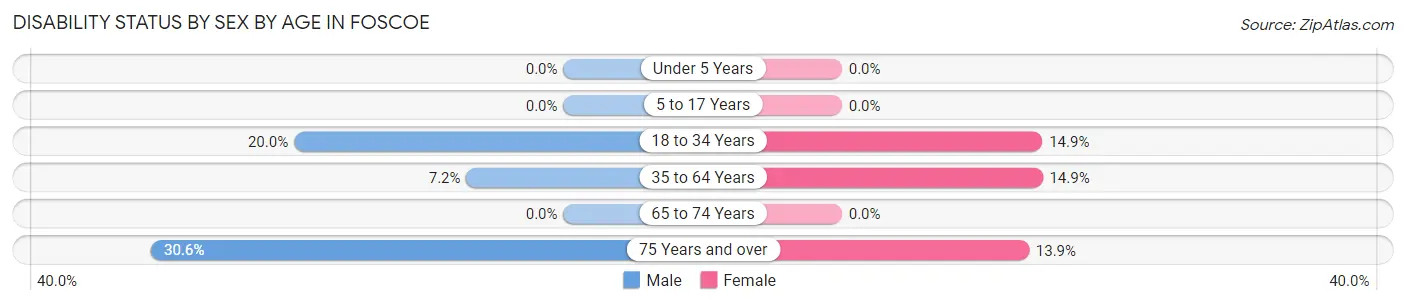
| Age Bracket | Male | Female |
| Under 5 Years | 0 (0.0%) | 0 (0.0%) |
| 5 to 17 Years | 0 (0.0%) | 0 (0.0%) |
| 18 to 34 Years | 16 (20.0%) | 18 (14.9%) |
| 35 to 64 Years | 18 (7.2%) | 45 (14.9%) |
| 65 to 74 Years | 0 (0.0%) | 0 (0.0%) |
| 75 Years and over | 30 (30.6%) | 10 (13.9%) |
Disability Class by Sex by Age in Foscoe
Disability Class: Hearing Difficulty
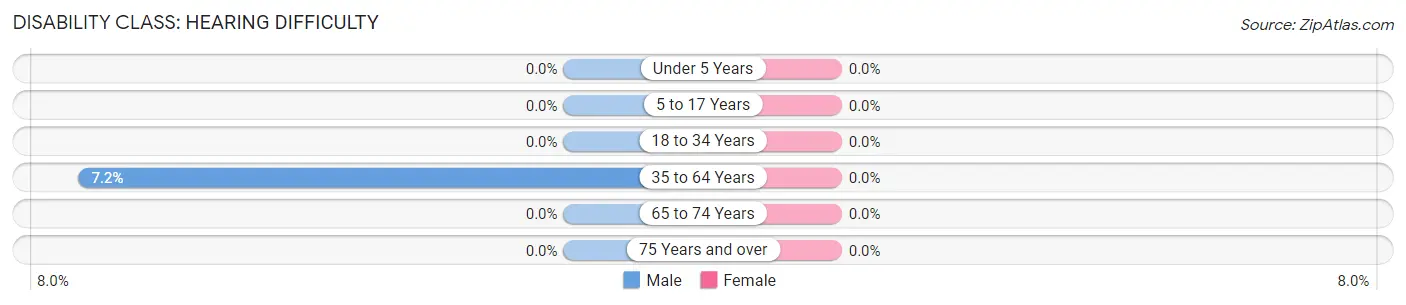
| Age Bracket | Male | Female |
| Under 5 Years | 0 (0.0%) | 0 (0.0%) |
| 5 to 17 Years | 0 (0.0%) | 0 (0.0%) |
| 18 to 34 Years | 0 (0.0%) | 0 (0.0%) |
| 35 to 64 Years | 18 (7.2%) | 0 (0.0%) |
| 65 to 74 Years | 0 (0.0%) | 0 (0.0%) |
| 75 Years and over | 0 (0.0%) | 0 (0.0%) |
Disability Class: Vision Difficulty
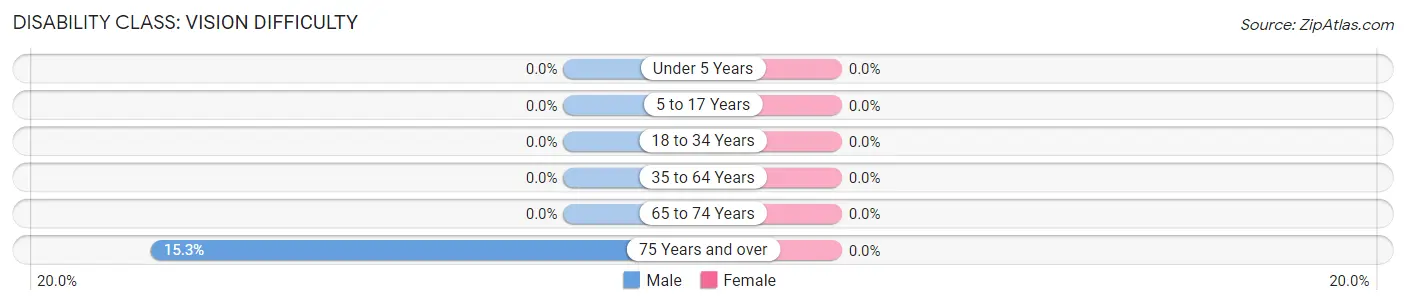
| Age Bracket | Male | Female |
| Under 5 Years | 0 (0.0%) | 0 (0.0%) |
| 5 to 17 Years | 0 (0.0%) | 0 (0.0%) |
| 18 to 34 Years | 0 (0.0%) | 0 (0.0%) |
| 35 to 64 Years | 0 (0.0%) | 0 (0.0%) |
| 65 to 74 Years | 0 (0.0%) | 0 (0.0%) |
| 75 Years and over | 15 (15.3%) | 0 (0.0%) |
Disability Class: Cognitive Difficulty
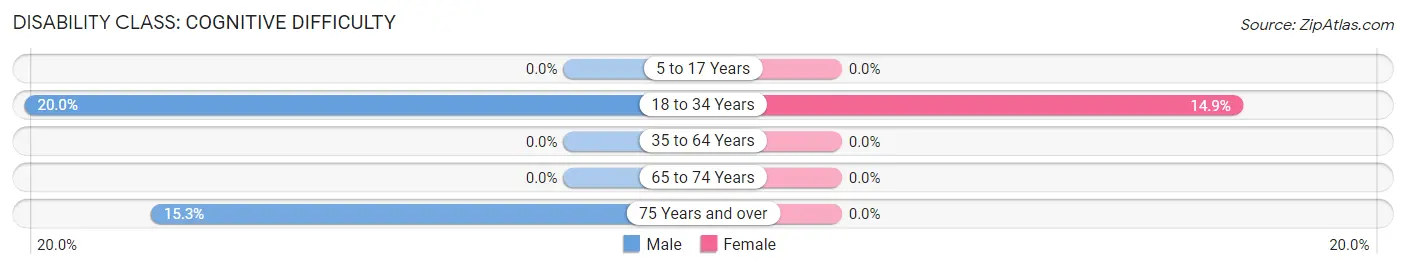
| Age Bracket | Male | Female |
| 5 to 17 Years | 0 (0.0%) | 0 (0.0%) |
| 18 to 34 Years | 16 (20.0%) | 18 (14.9%) |
| 35 to 64 Years | 0 (0.0%) | 0 (0.0%) |
| 65 to 74 Years | 0 (0.0%) | 0 (0.0%) |
| 75 Years and over | 15 (15.3%) | 0 (0.0%) |
Disability Class: Ambulatory Difficulty
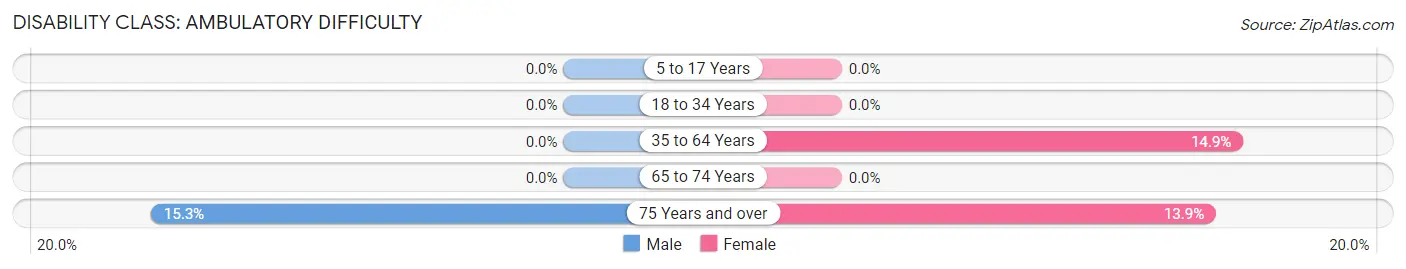
| Age Bracket | Male | Female |
| 5 to 17 Years | 0 (0.0%) | 0 (0.0%) |
| 18 to 34 Years | 0 (0.0%) | 0 (0.0%) |
| 35 to 64 Years | 0 (0.0%) | 45 (14.9%) |
| 65 to 74 Years | 0 (0.0%) | 0 (0.0%) |
| 75 Years and over | 15 (15.3%) | 10 (13.9%) |
Disability Class: Self-Care Difficulty
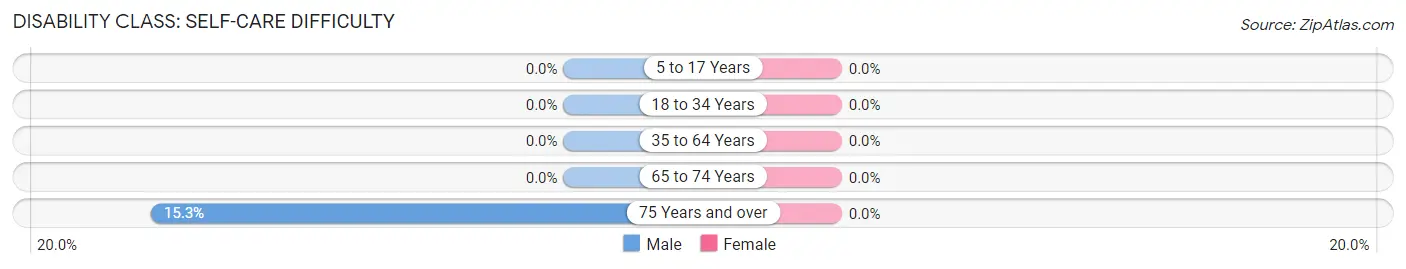
| Age Bracket | Male | Female |
| 5 to 17 Years | 0 (0.0%) | 0 (0.0%) |
| 18 to 34 Years | 0 (0.0%) | 0 (0.0%) |
| 35 to 64 Years | 0 (0.0%) | 0 (0.0%) |
| 65 to 74 Years | 0 (0.0%) | 0 (0.0%) |
| 75 Years and over | 15 (15.3%) | 0 (0.0%) |
Technology Access in Foscoe
Computing Device Access in Foscoe
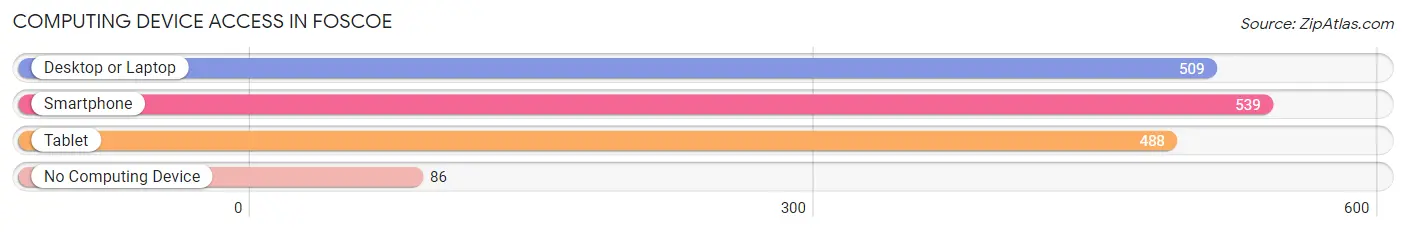
| Device Type | # Households | % Households |
| Desktop or Laptop | 509 | 80.0% |
| Smartphone | 539 | 84.8% |
| Tablet | 488 | 76.7% |
| No Computing Device | 86 | 13.5% |
| Total | 636 | 100.0% |
Internet Access in Foscoe
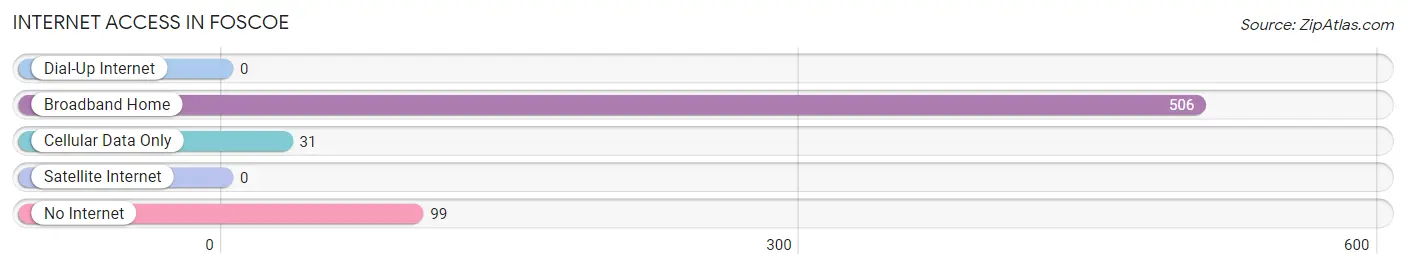
| Internet Type | # Households | % Households |
| Dial-Up Internet | 0 | 0.0% |
| Broadband Home | 506 | 79.6% |
| Cellular Data Only | 31 | 4.9% |
| Satellite Internet | 0 | 0.0% |
| No Internet | 99 | 15.6% |
| Total | 636 | 100.0% |
Foscoe Summary
Foscoe is an unincorporated community located in Watauga County, North Carolina. It is situated in the Blue Ridge Mountains, approximately 8 miles east of Boone and 8 miles west of Blowing Rock. The community is named after the Foscoe Creek, which runs through the area.
History
The area that is now Foscoe was originally inhabited by the Cherokee Indians. The first European settlers arrived in the late 1700s and early 1800s. The first post office in the area was established in 1883. The community was named after the Foscoe Creek, which runs through the area.
In the early 1900s, the area was a popular tourist destination. The Foscoe Inn was built in the 1920s and was a popular destination for visitors. The inn was destroyed by fire in the 1950s.
Geography
Foscoe is located in the Blue Ridge Mountains of western North Carolina. The community is situated at an elevation of 2,890 feet. The area is surrounded by the Pisgah National Forest and is home to numerous hiking trails and outdoor activities.
The climate in Foscoe is mild and temperate. Summers are warm and humid, while winters are cold and snowy. The average annual temperature is around 50 degrees Fahrenheit.
Economy
The economy of Foscoe is largely based on tourism. The area is home to numerous outdoor activities, such as hiking, fishing, and camping. The nearby ski resorts of Beech Mountain and Sugar Mountain attract visitors from all over the country.
The community is also home to several small businesses, including restaurants, shops, and lodging. The Foscoe Country Store is a popular destination for locals and visitors alike.
Demographics
As of the 2010 census, the population of Foscoe was 1,092. The racial makeup of the community was 97.3% White, 0.7% African American, 0.3% Native American, 0.2% Asian, and 1.5% from other races.
The median household income in Foscoe was $37,917, and the median family income was $45,000. The per capita income was $20,945. The unemployment rate was 5.2%.
Foscoe is a small, rural community with a strong sense of community. The area is home to numerous outdoor activities and is a popular destination for tourists. The community is also home to several small businesses, which provide employment opportunities for locals.
Common Questions
What is the Total Population of Foscoe?
Total Population of Foscoe is 1,411.
What is the Total Male Population of Foscoe?
Total Male Population of Foscoe is 687.
What is the Total Female Population of Foscoe?
Total Female Population of Foscoe is 724.
What is the Ratio of Males per 100 Females in Foscoe?
There are 94.89 Males per 100 Females in Foscoe.
What is the Ratio of Females per 100 Males in Foscoe?
There are 105.39 Females per 100 Males in Foscoe.
What is the Median Population Age in Foscoe?
Median Population Age in Foscoe is 40.9 Years.
What is the Average Family Size in Foscoe
Average Family Size in Foscoe is 3.0 People.
What is the Average Household Size in Foscoe
Average Household Size in Foscoe is 2.2 People.
What is Per Capita Income in Foscoe?
Per Capita income in Foscoe is $30,320.
What is the Median Family Income in Foscoe?
Median Family Income in Foscoe is $77,833.
What is the Median Household income in Foscoe?
Median Household Income in Foscoe is $53,382.
What is Income or Wage Gap in Foscoe?
Income or Wage Gap in Foscoe is 14.2%.
Women in Foscoe earn 85.8 cents for every dollar earned by a man.
What is Inequality or Gini Index in Foscoe?
Inequality or Gini Index in Foscoe is 0.38.
How Large is the Labor Force in Foscoe?
There are 715 People in the Labor Forcein in Foscoe.
What is the Percentage of People in the Labor Force in Foscoe?
62.3% of People are in the Labor Force in Foscoe.
What is the Unemployment Rate in Foscoe?
Unemployment Rate in Foscoe is 4.3%.