Pollocksville, NC
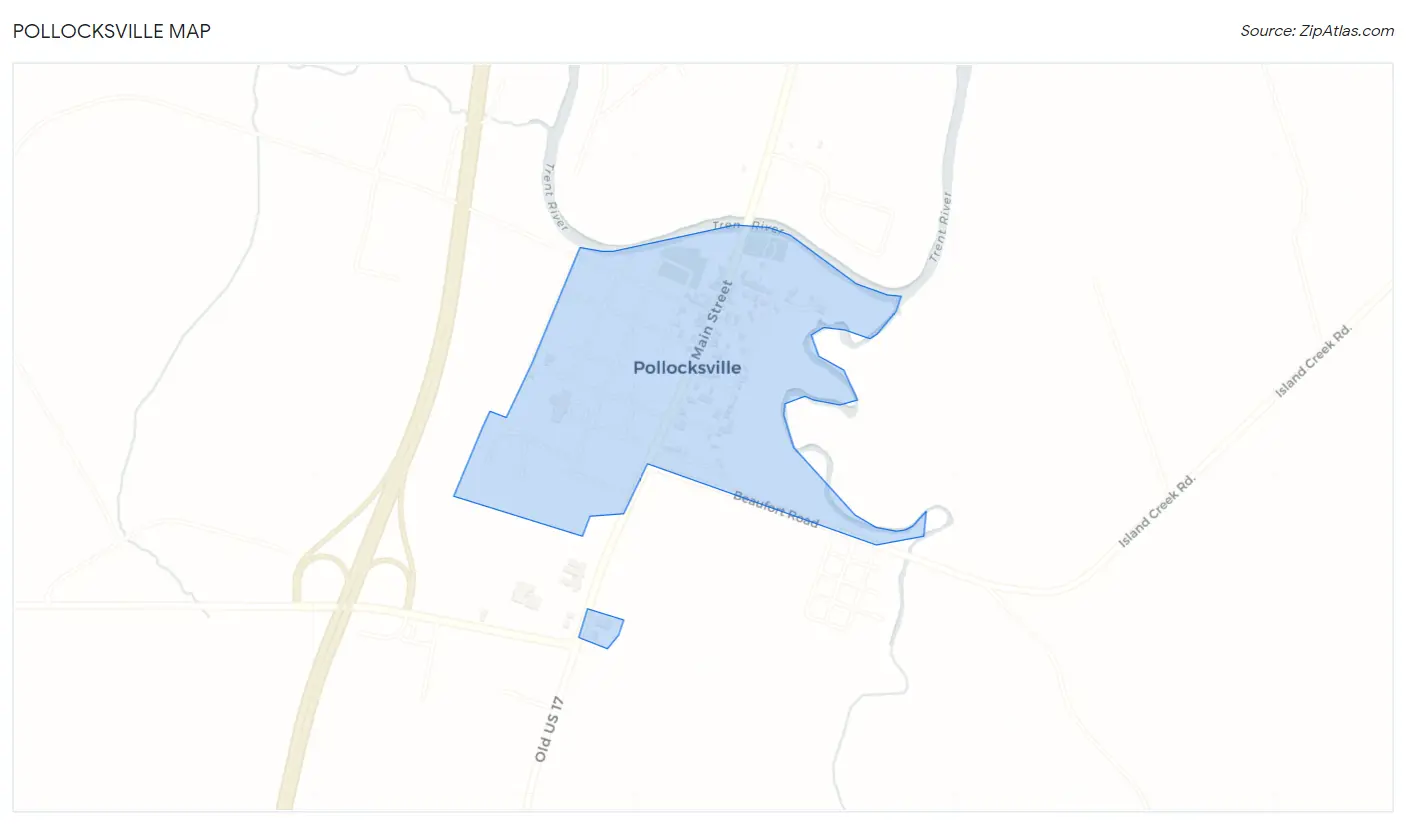
Pollocksville Map
Pollocksville Overview
342
TOTAL POPULATION
158
MALE POPULATION
184
FEMALE POPULATION
85.87
MALES / 100 FEMALES
116.46
FEMALES / 100 MALES
30.2
MEDIAN AGE
3.9
AVG FAMILY SIZE
3.0
AVG HOUSEHOLD SIZE
$20,994
PER CAPITA INCOME
$60,694
AVG FAMILY INCOME
$44,615
AVG HOUSEHOLD INCOME
0.43
INEQUALITY / GINI INDEX
185
LABOR FORCE [ PEOPLE ]
66.8%
PERCENT IN LABOR FORCE
3.8%
UNEMPLOYMENT RATE
Pollocksville Zip Codes
Pollocksville Area Codes
Race in Pollocksville
The most populous races in Pollocksville are White / Caucasian (177 | 51.7%), Black / African American (78 | 22.8%), and Two or more Races (66 | 19.3%).
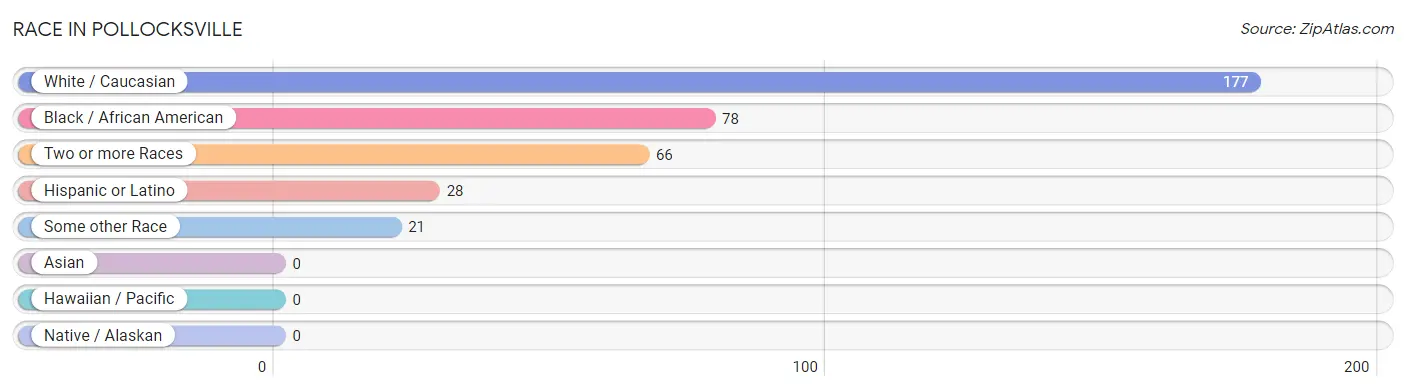
| Race | # Population | % Population |
| Asian | 0 | 0.0% |
| Black / African American | 78 | 22.8% |
| Hawaiian / Pacific | 0 | 0.0% |
| Hispanic or Latino | 28 | 8.2% |
| Native / Alaskan | 0 | 0.0% |
| White / Caucasian | 177 | 51.7% |
| Two or more Races | 66 | 19.3% |
| Some other Race | 21 | 6.1% |
| Total | 342 | 100.0% |
Ancestry in Pollocksville
The most populous ancestries reported in Pollocksville are American (31 | 9.1%), Mexican (27 | 7.9%), English (18 | 5.3%), German (15 | 4.4%), and European (14 | 4.1%), together accounting for 30.7% of all Pollocksville residents.
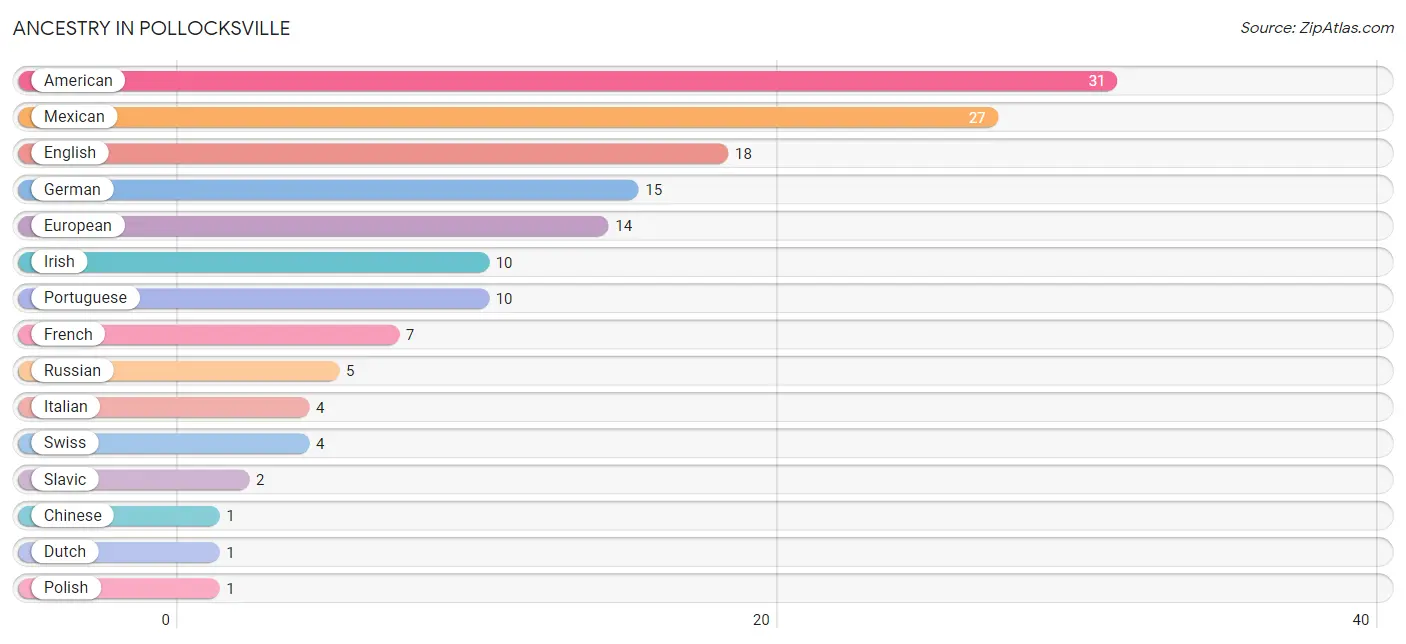
| Ancestry | # Population | % Population |
| American | 31 | 9.1% |
| Chinese | 1 | 0.3% |
| Dutch | 1 | 0.3% |
| English | 18 | 5.3% |
| European | 14 | 4.1% |
| French | 7 | 2.1% |
| German | 15 | 4.4% |
| Irish | 10 | 2.9% |
| Italian | 4 | 1.2% |
| Mexican | 27 | 7.9% |
| Polish | 1 | 0.3% |
| Portuguese | 10 | 2.9% |
| Puerto Rican | 1 | 0.3% |
| Russian | 5 | 1.5% |
| Scottish | 1 | 0.3% |
| Slavic | 2 | 0.6% |
| Swiss | 4 | 1.2% | View All 17 Rows |
Immigrants in Pollocksville
The most numerous immigrant groups reported in Pollocksville came from Europe (4 | 1.2%), Switzerland (4 | 1.2%), Western Europe (4 | 1.2%), Asia (2 | 0.6%), and Western Asia (2 | 0.6%), together accounting for 4.7% of all Pollocksville residents.
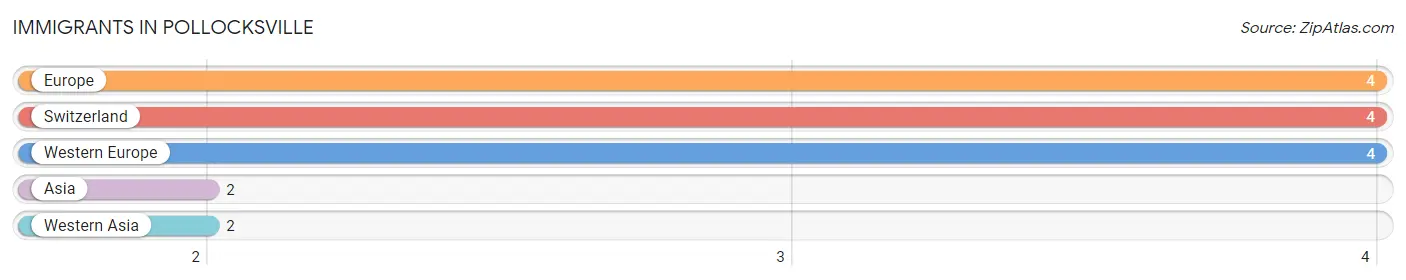
| Immigration Origin | # Population | % Population |
| Asia | 2 | 0.6% |
| Europe | 4 | 1.2% |
| Switzerland | 4 | 1.2% |
| Western Asia | 2 | 0.6% |
| Western Europe | 4 | 1.2% | View All 5 Rows |
Sex and Age in Pollocksville
Sex and Age in Pollocksville
The most populous age groups in Pollocksville are 5 to 9 Years (29 | 18.3%) for men and 20 to 24 Years (60 | 32.6%) for women.
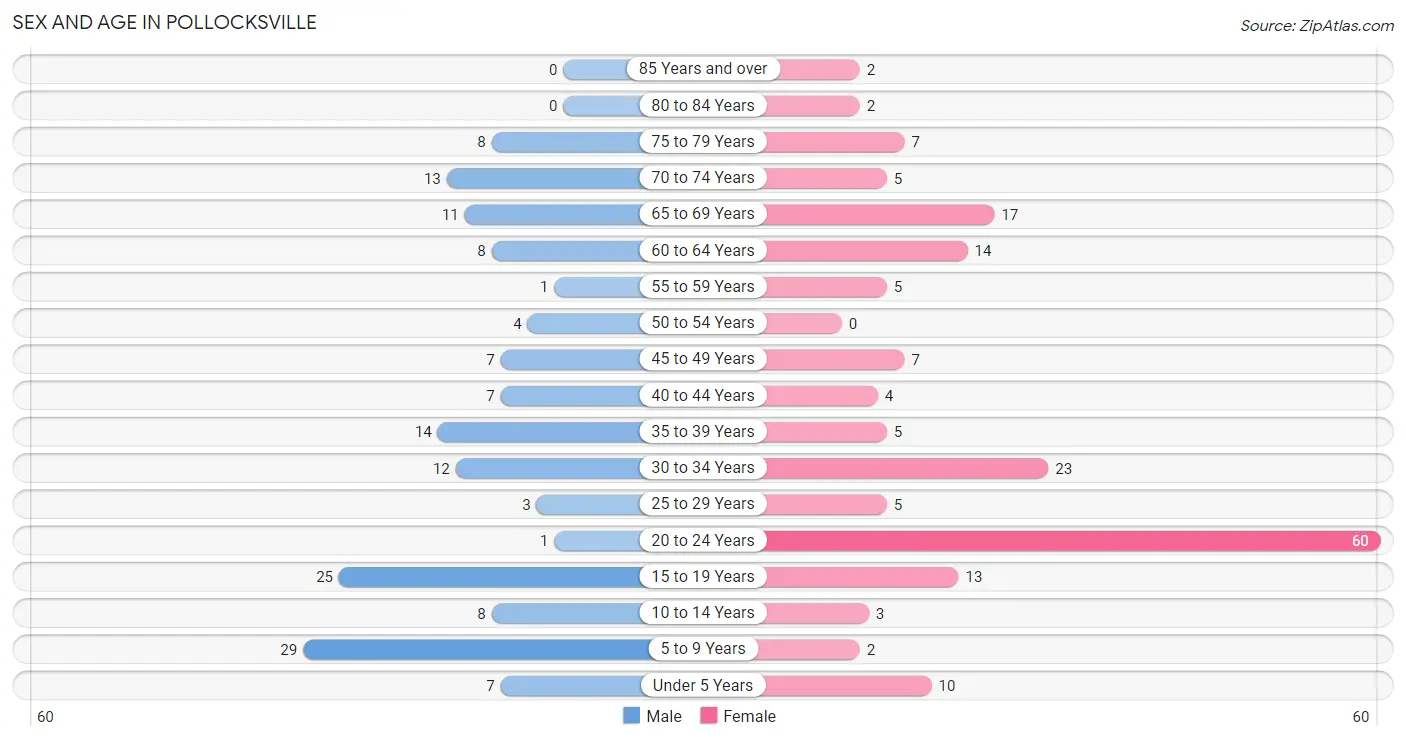
| Age Bracket | Male | Female |
| Under 5 Years | 7 (4.4%) | 10 (5.4%) |
| 5 to 9 Years | 29 (18.3%) | 2 (1.1%) |
| 10 to 14 Years | 8 (5.1%) | 3 (1.6%) |
| 15 to 19 Years | 25 (15.8%) | 13 (7.1%) |
| 20 to 24 Years | 1 (0.6%) | 60 (32.6%) |
| 25 to 29 Years | 3 (1.9%) | 5 (2.7%) |
| 30 to 34 Years | 12 (7.6%) | 23 (12.5%) |
| 35 to 39 Years | 14 (8.9%) | 5 (2.7%) |
| 40 to 44 Years | 7 (4.4%) | 4 (2.2%) |
| 45 to 49 Years | 7 (4.4%) | 7 (3.8%) |
| 50 to 54 Years | 4 (2.5%) | 0 (0.0%) |
| 55 to 59 Years | 1 (0.6%) | 5 (2.7%) |
| 60 to 64 Years | 8 (5.1%) | 14 (7.6%) |
| 65 to 69 Years | 11 (7.0%) | 17 (9.2%) |
| 70 to 74 Years | 13 (8.2%) | 5 (2.7%) |
| 75 to 79 Years | 8 (5.1%) | 7 (3.8%) |
| 80 to 84 Years | 0 (0.0%) | 2 (1.1%) |
| 85 Years and over | 0 (0.0%) | 2 (1.1%) |
| Total | 158 (100.0%) | 184 (100.0%) |
Families and Households in Pollocksville
Median Family Size in Pollocksville
The median family size in Pollocksville is 3.90 persons per family, with single female/mother families (15 | 19.5%) accounting for the largest median family size of 4.6 persons per family. On the other hand, single male/father families (3 | 3.9%) represent the smallest median family size with 2.00 persons per family.
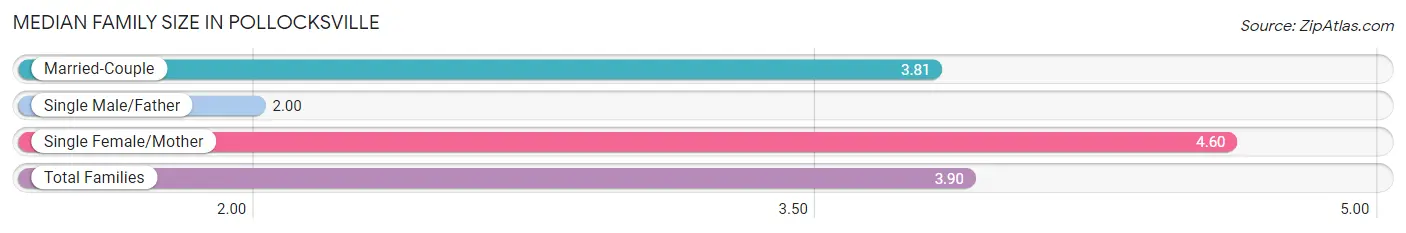
| Family Type | # Families | Family Size |
| Married-Couple | 59 (76.6%) | 3.81 |
| Single Male/Father | 3 (3.9%) | 2.00 |
| Single Female/Mother | 15 (19.5%) | 4.60 |
| Total Families | 77 (100.0%) | 3.90 |
Median Household Size in Pollocksville
The median household size in Pollocksville is 3.00 persons per household, with single female/mother households (15 | 13.2%) accounting for the largest median household size of 4.6 persons per household. non-family households (37 | 32.5%) represent the smallest median household size with 1.14 persons per household.
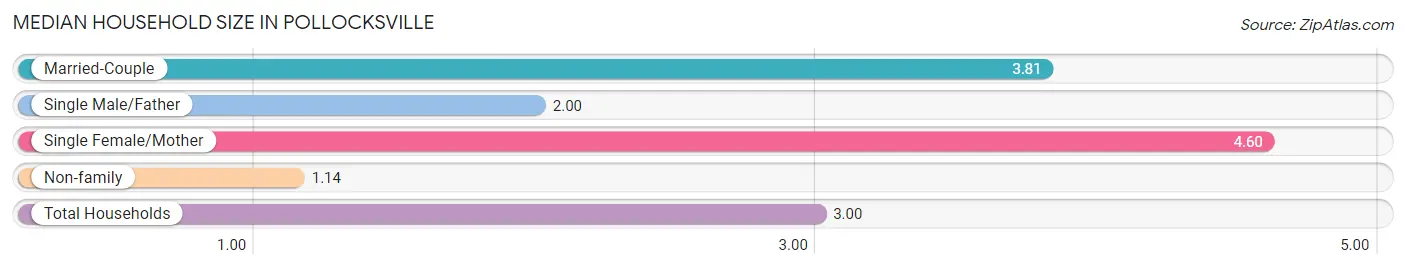
| Household Type | # Households | Household Size |
| Married-Couple | 59 (51.7%) | 3.81 |
| Single Male/Father | 3 (2.6%) | 2.00 |
| Single Female/Mother | 15 (13.2%) | 4.60 |
| Non-family | 37 (32.5%) | 1.14 |
| Total Households | 114 (100.0%) | 3.00 |
Household Size by Marriage Status in Pollocksville
Out of a total of 114 households in Pollocksville, 77 (67.5%) are family households, while 37 (32.5%) are nonfamily households. The most numerous type of family households are 2-person households, comprising 29, and the most common type of nonfamily households are 1-person households, comprising 32.
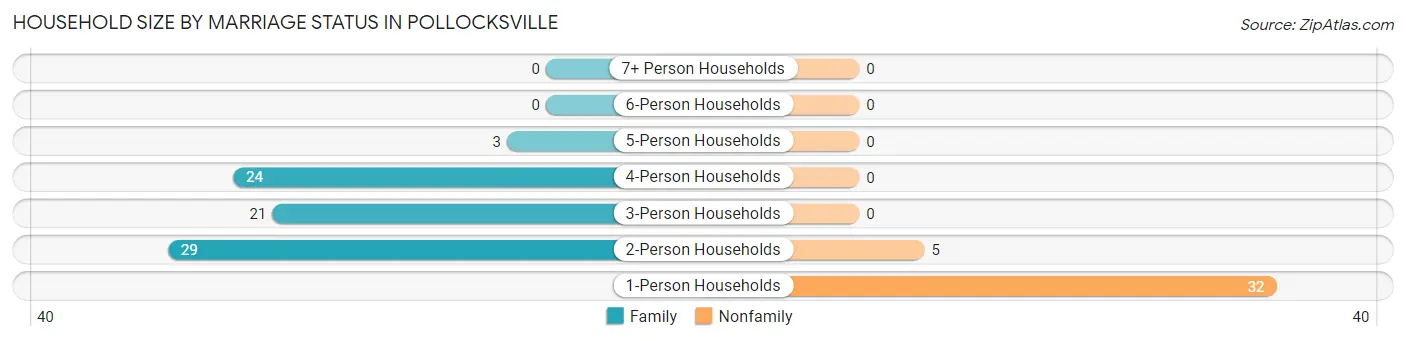
| Household Size | Family Households | Nonfamily Households |
| 1-Person Households | - | 32 (28.1%) |
| 2-Person Households | 29 (25.4%) | 5 (4.4%) |
| 3-Person Households | 21 (18.4%) | 0 (0.0%) |
| 4-Person Households | 24 (21.0%) | 0 (0.0%) |
| 5-Person Households | 3 (2.6%) | 0 (0.0%) |
| 6-Person Households | 0 (0.0%) | 0 (0.0%) |
| 7+ Person Households | 0 (0.0%) | 0 (0.0%) |
| Total | 77 (67.5%) | 37 (32.5%) |
Female Fertility in Pollocksville
Fertility by Age in Pollocksville
Average fertility rate in Pollocksville is 43.0 births per 1,000 women. Women in the age bracket of 20 to 34 years have the highest fertility rate with 57.0 births per 1,000 women. Women in the age bracket of 20 to 34 years acount for 100.0% of all women with births.
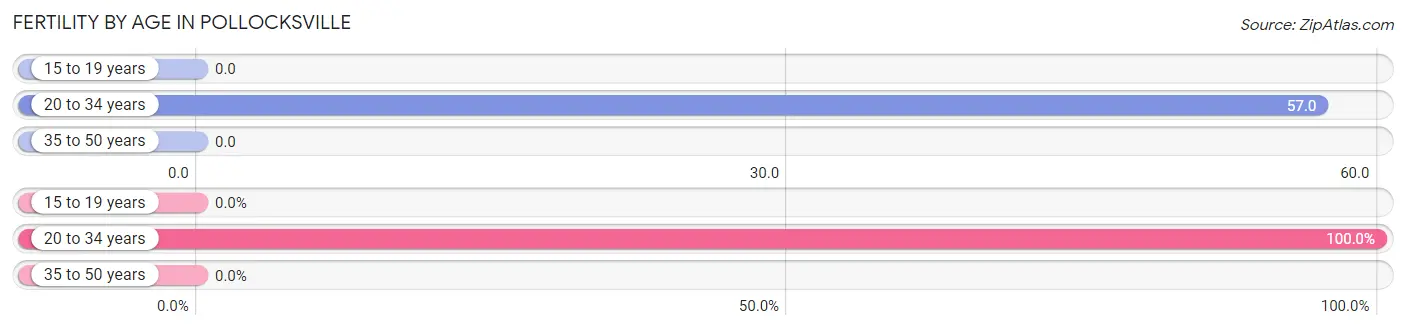
| Age Bracket | Women with Births | Births / 1,000 Women |
| 15 to 19 years | 0 (0.0%) | 0.0 |
| 20 to 34 years | 5 (100.0%) | 57.0 |
| 35 to 50 years | 0 (0.0%) | 0.0 |
| Total | 5 (100.0%) | 43.0 |
Fertility by Age by Marriage Status in Pollocksville
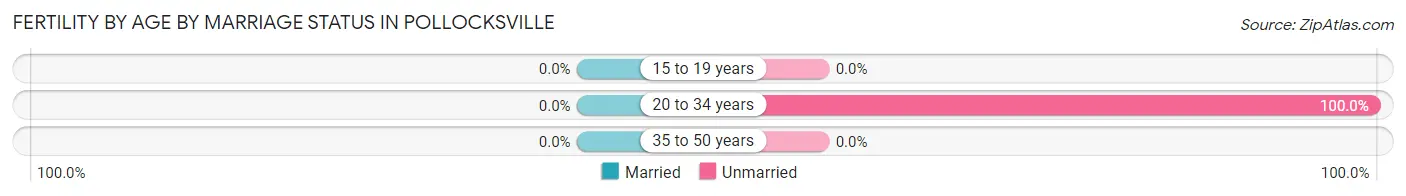
| Age Bracket | Married | Unmarried |
| 15 to 19 years | 0 (0.0%) | 0 (0.0%) |
| 20 to 34 years | 0 (0.0%) | 5 (100.0%) |
| 35 to 50 years | 0 (0.0%) | 0 (0.0%) |
| Total | 0 (0.0%) | 5 (100.0%) |
Fertility by Education in Pollocksville
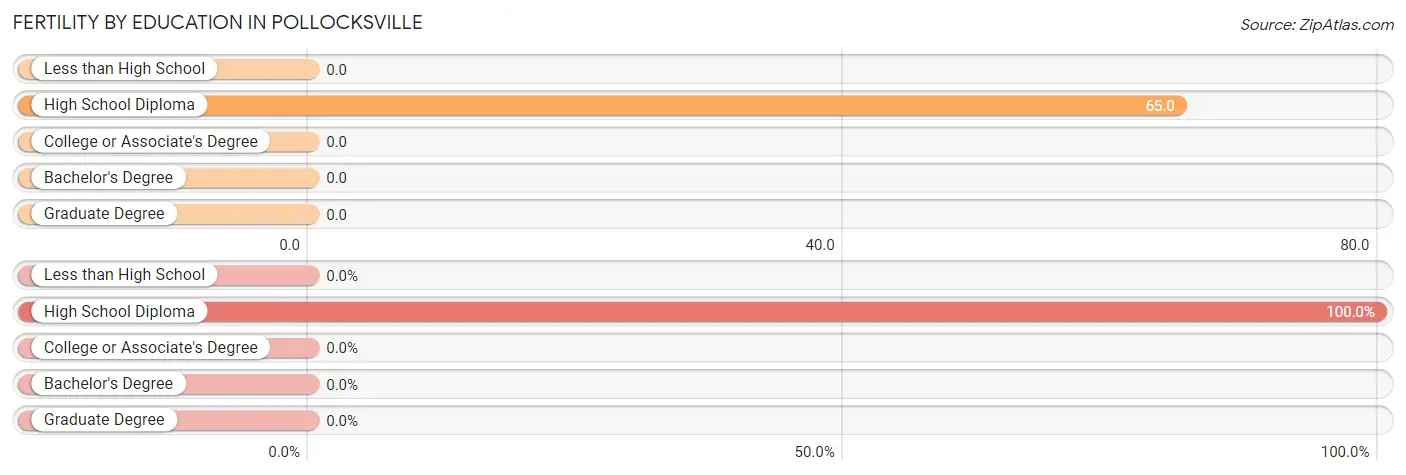
| Educational Attainment | Women with Births | Births / 1,000 Women |
| Less than High School | 0 (0.0%) | 0.0 |
| High School Diploma | 5 (100.0%) | 65.0 |
| College or Associate's Degree | 0 (0.0%) | 0.0 |
| Bachelor's Degree | 0 (0.0%) | 0.0 |
| Graduate Degree | 0 (0.0%) | 0.0 |
| Total | 5 (100.0%) | 43.0 |
Fertility by Education by Marriage Status in Pollocksville
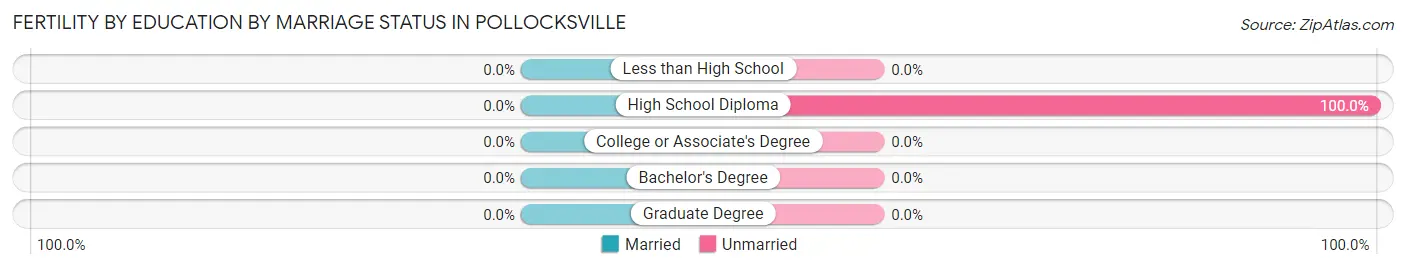
| Educational Attainment | Married | Unmarried |
| Less than High School | 0 (0.0%) | 0 (0.0%) |
| High School Diploma | 0 (0.0%) | 5 (100.0%) |
| College or Associate's Degree | 0 (0.0%) | 0 (0.0%) |
| Bachelor's Degree | 0 (0.0%) | 0 (0.0%) |
| Graduate Degree | 0 (0.0%) | 0 (0.0%) |
| Total | 0 (0.0%) | 5 (100.0%) |
Income in Pollocksville
Income Overview in Pollocksville
Per Capita Income in Pollocksville is $20,994, while median incomes of families and households are $60,694 and $44,615 respectively.
| Characteristic | Number | Measure |
| Per Capita Income | 342 | $20,994 |
| Median Family Income | 77 | $60,694 |
| Mean Family Income | 77 | $72,692 |
| Median Household Income | 114 | $44,615 |
| Mean Household Income | 114 | $60,403 |
| Income Deficit | 77 | $0 |
| Wage / Income Gap (%) | 342 | 0.00% |
| Wage / Income Gap ($) | 342 | 100.00¢ per $1 |
| Gini / Inequality Index | 342 | 0.43 |
Earnings by Sex in Pollocksville
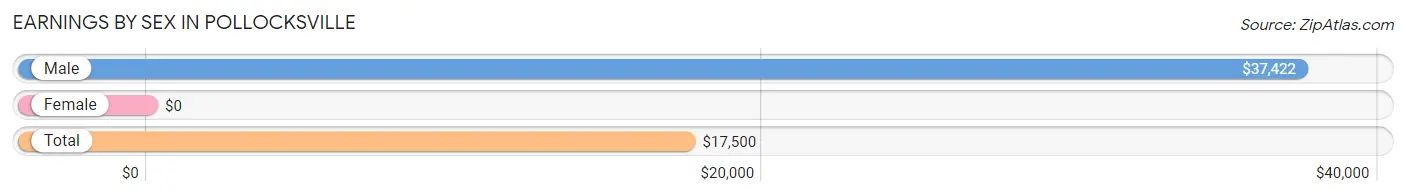
| Sex | Number | Average Earnings |
| Male | 73 (38.4%) | $37,422 |
| Female | 117 (61.6%) | $0 |
| Total | 190 (100.0%) | $17,500 |
Earnings by Sex by Income Bracket in Pollocksville
The most common earnings brackets in Pollocksville are $35,000 to $39,999 for men (19 | 26.0%) and $5,000 to $7,499 for women (55 | 47.0%).
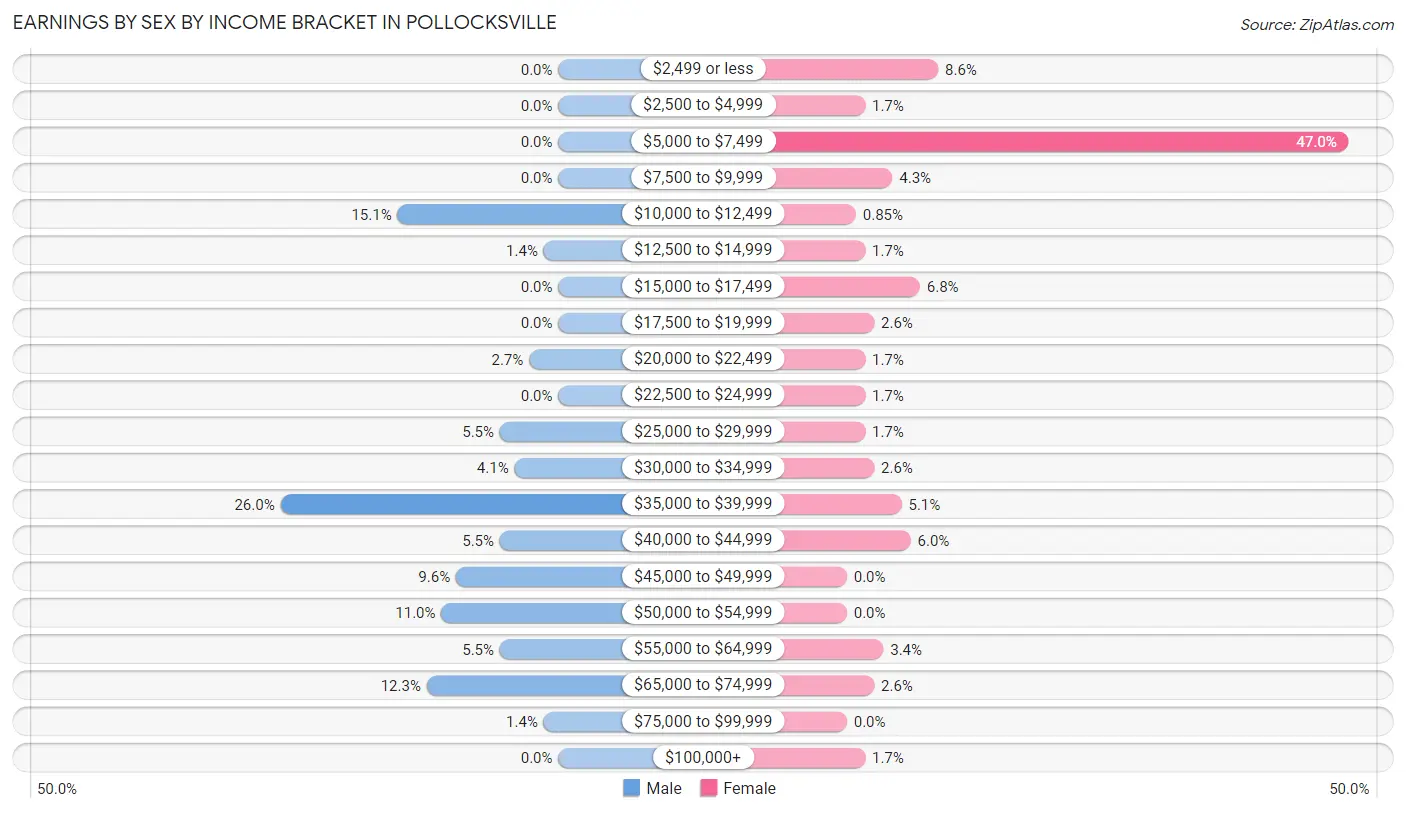
| Income | Male | Female |
| $2,499 or less | 0 (0.0%) | 10 (8.6%) |
| $2,500 to $4,999 | 0 (0.0%) | 2 (1.7%) |
| $5,000 to $7,499 | 0 (0.0%) | 55 (47.0%) |
| $7,500 to $9,999 | 0 (0.0%) | 5 (4.3%) |
| $10,000 to $12,499 | 11 (15.1%) | 1 (0.9%) |
| $12,500 to $14,999 | 1 (1.4%) | 2 (1.7%) |
| $15,000 to $17,499 | 0 (0.0%) | 8 (6.8%) |
| $17,500 to $19,999 | 0 (0.0%) | 3 (2.6%) |
| $20,000 to $22,499 | 2 (2.7%) | 2 (1.7%) |
| $22,500 to $24,999 | 0 (0.0%) | 2 (1.7%) |
| $25,000 to $29,999 | 4 (5.5%) | 2 (1.7%) |
| $30,000 to $34,999 | 3 (4.1%) | 3 (2.6%) |
| $35,000 to $39,999 | 19 (26.0%) | 6 (5.1%) |
| $40,000 to $44,999 | 4 (5.5%) | 7 (6.0%) |
| $45,000 to $49,999 | 7 (9.6%) | 0 (0.0%) |
| $50,000 to $54,999 | 8 (11.0%) | 0 (0.0%) |
| $55,000 to $64,999 | 4 (5.5%) | 4 (3.4%) |
| $65,000 to $74,999 | 9 (12.3%) | 3 (2.6%) |
| $75,000 to $99,999 | 1 (1.4%) | 0 (0.0%) |
| $100,000+ | 0 (0.0%) | 2 (1.7%) |
| Total | 73 (100.0%) | 117 (100.0%) |
Earnings by Sex by Educational Attainment in Pollocksville
Average earnings in Pollocksville are $37,500 for men and $30,000 for women, a difference of 20.0%. Men with an educational attainment of bachelor's degree enjoy the highest average annual earnings of $51,250, while those with high school diploma education earn the least with $36,172. Women with an educational attainment of bachelor's degree earn the most with the average annual earnings of $44,464, while those with high school diploma education have the smallest earnings of $16,250.
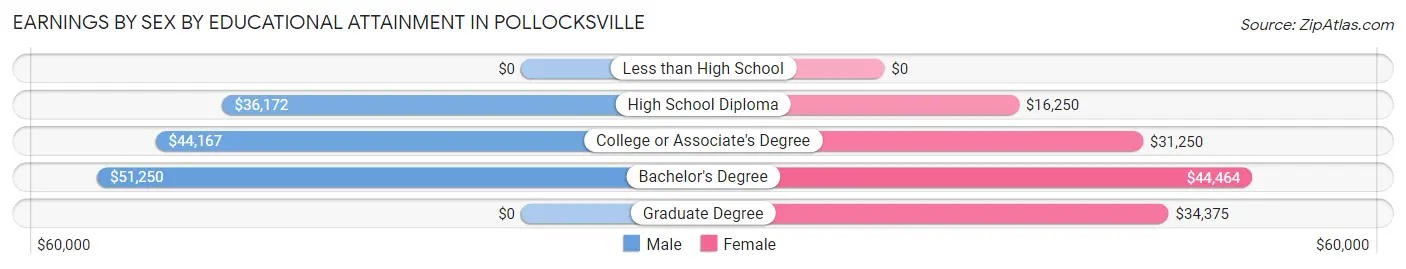
| Educational Attainment | Male Income | Female Income |
| Less than High School | - | - |
| High School Diploma | $36,172 | $16,250 |
| College or Associate's Degree | $44,167 | $31,250 |
| Bachelor's Degree | $51,250 | $44,464 |
| Graduate Degree | - | - |
| Total | $37,500 | $30,000 |
Family Income in Pollocksville
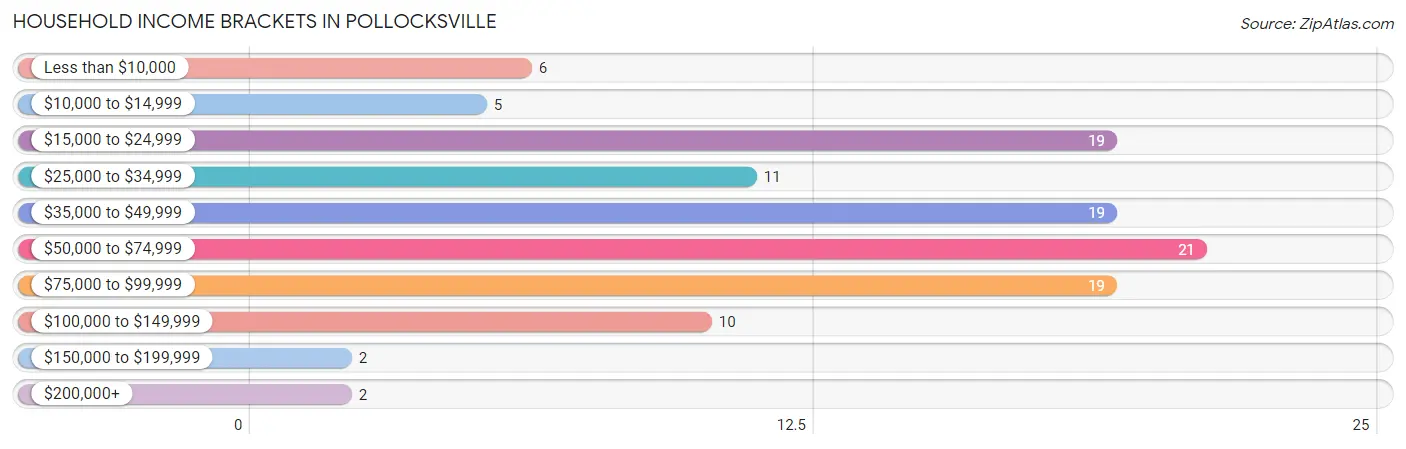
Family Income Brackets in Pollocksville
According to the Pollocksville family income data, there are 16 families falling into the $50,000 to $74,999 income range, which is the most common income bracket and makes up 20.8% of all families. Conversely, the less than $10,000 income bracket is the least frequent group with only 1 families (1.3%) belonging to this category.
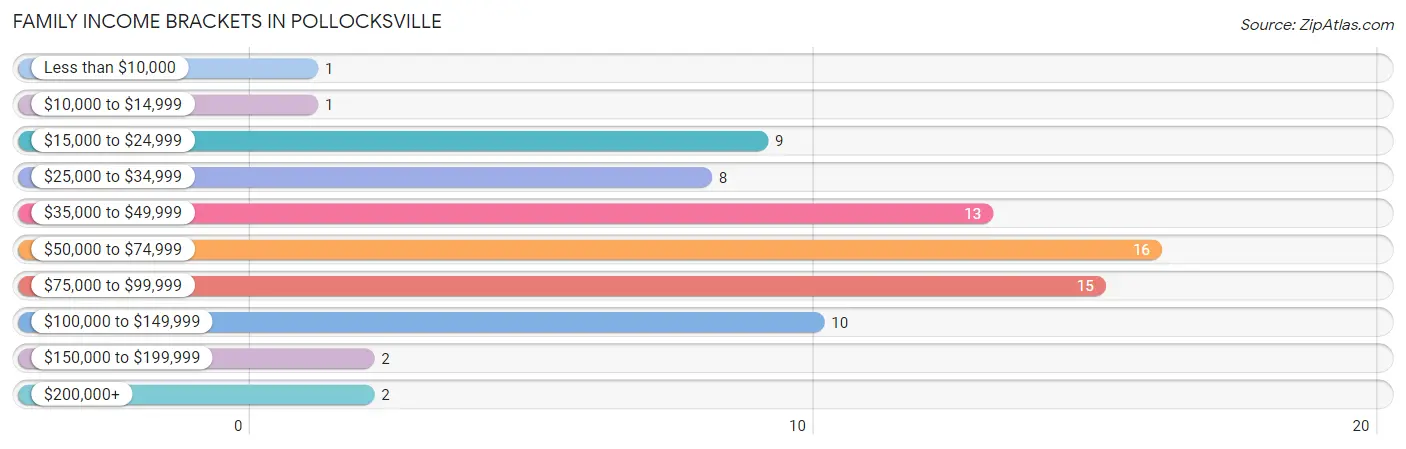
| Income Bracket | # Families | % Families |
| Less than $10,000 | 1 | 1.3% |
| $10,000 to $14,999 | 1 | 1.3% |
| $15,000 to $24,999 | 9 | 11.7% |
| $25,000 to $34,999 | 8 | 10.4% |
| $35,000 to $49,999 | 13 | 16.9% |
| $50,000 to $74,999 | 16 | 20.8% |
| $75,000 to $99,999 | 15 | 19.5% |
| $100,000 to $149,999 | 10 | 13.0% |
| $150,000 to $199,999 | 2 | 2.6% |
| $200,000+ | 2 | 2.6% |
Family Income by Famaliy Size in Pollocksville
2-person families (29 | 37.7%) account for the highest median family income in Pollocksville with $87,917 per family, while 2-person families (29 | 37.7%) have the highest median income of $43,958 per family member.
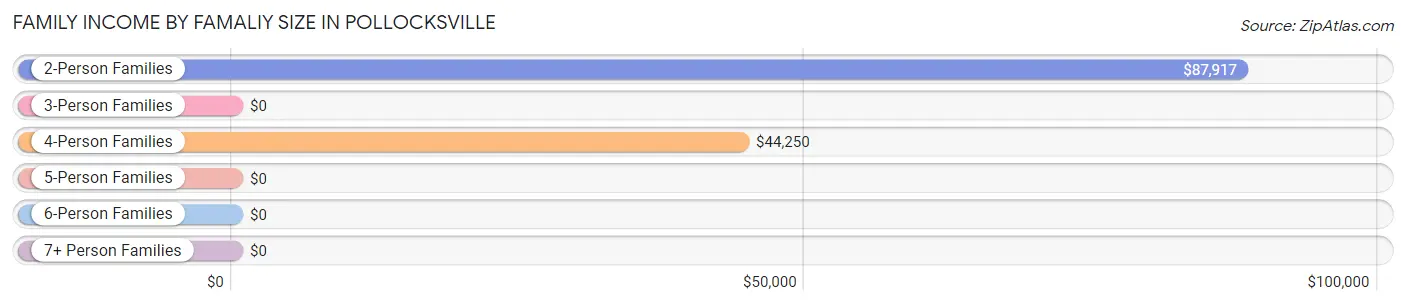
| Income Bracket | # Families | Median Income |
| 2-Person Families | 29 (37.7%) | $87,917 |
| 3-Person Families | 21 (27.3%) | $0 |
| 4-Person Families | 24 (31.2%) | $44,250 |
| 5-Person Families | 3 (3.9%) | $0 |
| 6-Person Families | 0 (0.0%) | $0 |
| 7+ Person Families | 0 (0.0%) | $0 |
| Total | 77 (100.0%) | $60,694 |
Family Income by Number of Earners in Pollocksville
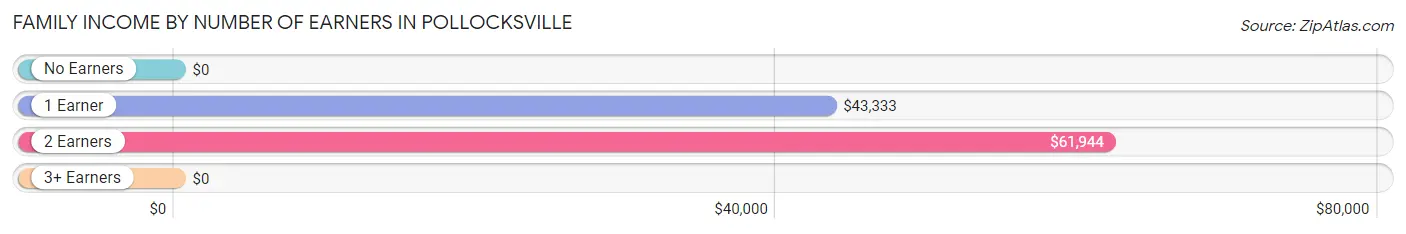
| Number of Earners | # Families | Median Income |
| No Earners | 2 (2.6%) | $0 |
| 1 Earner | 32 (41.6%) | $43,333 |
| 2 Earners | 42 (54.5%) | $61,944 |
| 3+ Earners | 1 (1.3%) | $0 |
| Total | 77 (100.0%) | $60,694 |
Household Income in Pollocksville
Household Income Brackets in Pollocksville
With 21 households falling in the category, the $50,000 to $74,999 income range is the most frequent in Pollocksville, accounting for 18.4% of all households. In contrast, only 2 households (1.8%) fall into the $150,000 to $199,999 income bracket, making it the least populous group.
| Income Bracket | # Households | % Households |
| Less than $10,000 | 6 | 5.3% |
| $10,000 to $14,999 | 5 | 4.4% |
| $15,000 to $24,999 | 19 | 16.7% |
| $25,000 to $34,999 | 11 | 9.6% |
| $35,000 to $49,999 | 19 | 16.7% |
| $50,000 to $74,999 | 21 | 18.4% |
| $75,000 to $99,999 | 19 | 16.7% |
| $100,000 to $149,999 | 10 | 8.8% |
| $150,000 to $199,999 | 2 | 1.8% |
| $200,000+ | 2 | 1.8% |
Household Income by Householder Age in Pollocksville
The median household income in Pollocksville is $44,615, with the highest median household income of $72,500 found in the 25 to 44 years age bracket for the primary householder. A total of 40 households (35.1%) fall into this category. Meanwhile, the 15 to 24 years age bracket for the primary householder has the lowest median household income of $0, with 1 households (0.9%) in this group.
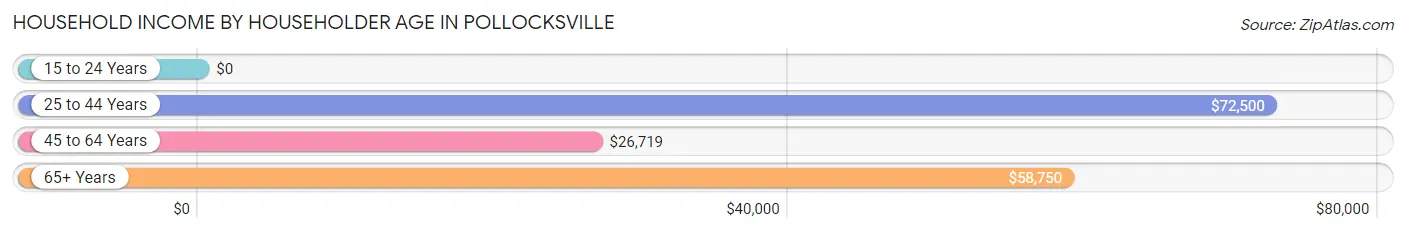
| Income Bracket | # Households | Median Income |
| 15 to 24 Years | 1 (0.9%) | $0 |
| 25 to 44 Years | 40 (35.1%) | $72,500 |
| 45 to 64 Years | 25 (21.9%) | $26,719 |
| 65+ Years | 48 (42.1%) | $58,750 |
| Total | 114 (100.0%) | $44,615 |
Poverty in Pollocksville
Income Below Poverty by Sex and Age in Pollocksville
With 24.0% poverty level for males and 20.1% for females among the residents of Pollocksville, 5 year old males and 16 and 17 year old females are the most vulnerable to poverty, with 21 males (100.0%) and 4 females (66.7%) in their respective age groups living below the poverty level.
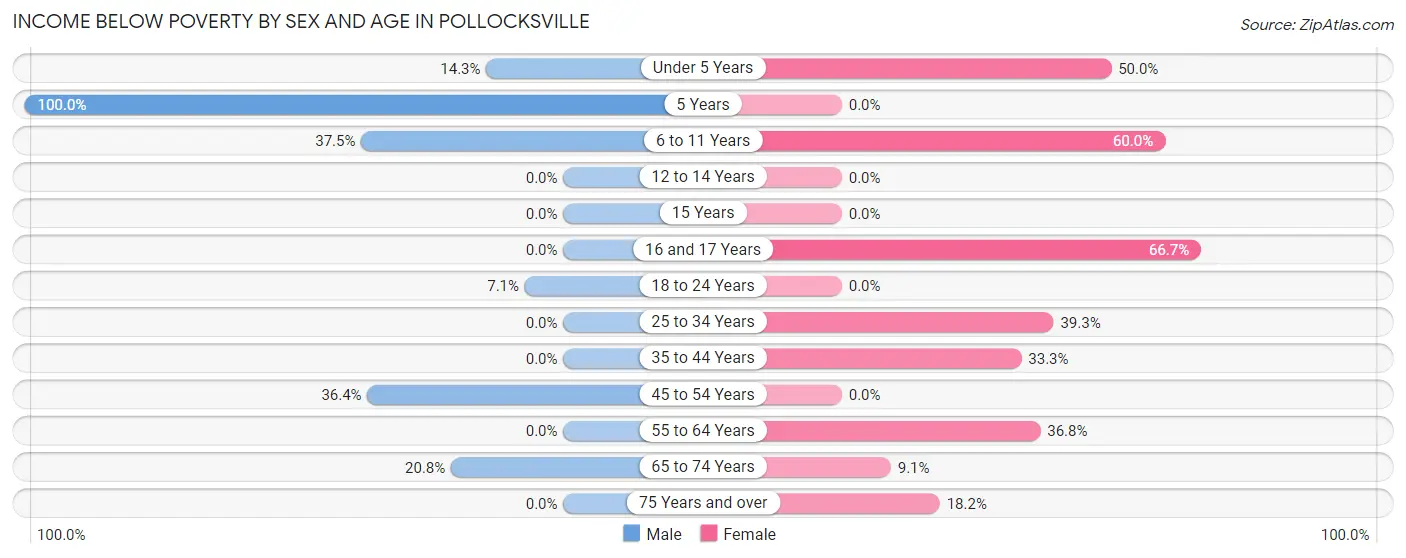
| Age Bracket | Male | Female |
| Under 5 Years | 1 (14.3%) | 5 (50.0%) |
| 5 Years | 21 (100.0%) | 0 (0.0%) |
| 6 to 11 Years | 6 (37.5%) | 3 (60.0%) |
| 12 to 14 Years | 0 (0.0%) | 0 (0.0%) |
| 15 Years | 0 (0.0%) | 0 (0.0%) |
| 16 and 17 Years | 0 (0.0%) | 4 (66.7%) |
| 18 to 24 Years | 1 (7.1%) | 0 (0.0%) |
| 25 to 34 Years | 0 (0.0%) | 11 (39.3%) |
| 35 to 44 Years | 0 (0.0%) | 3 (33.3%) |
| 45 to 54 Years | 4 (36.4%) | 0 (0.0%) |
| 55 to 64 Years | 0 (0.0%) | 7 (36.8%) |
| 65 to 74 Years | 5 (20.8%) | 2 (9.1%) |
| 75 Years and over | 0 (0.0%) | 2 (18.2%) |
| Total | 38 (24.0%) | 37 (20.1%) |
Income Above Poverty by Sex and Age in Pollocksville
According to the poverty statistics in Pollocksville, males aged 16 and 17 years and females aged 15 years are the age groups that are most secure financially, with 100.0% of males and 100.0% of females in these age groups living above the poverty line.
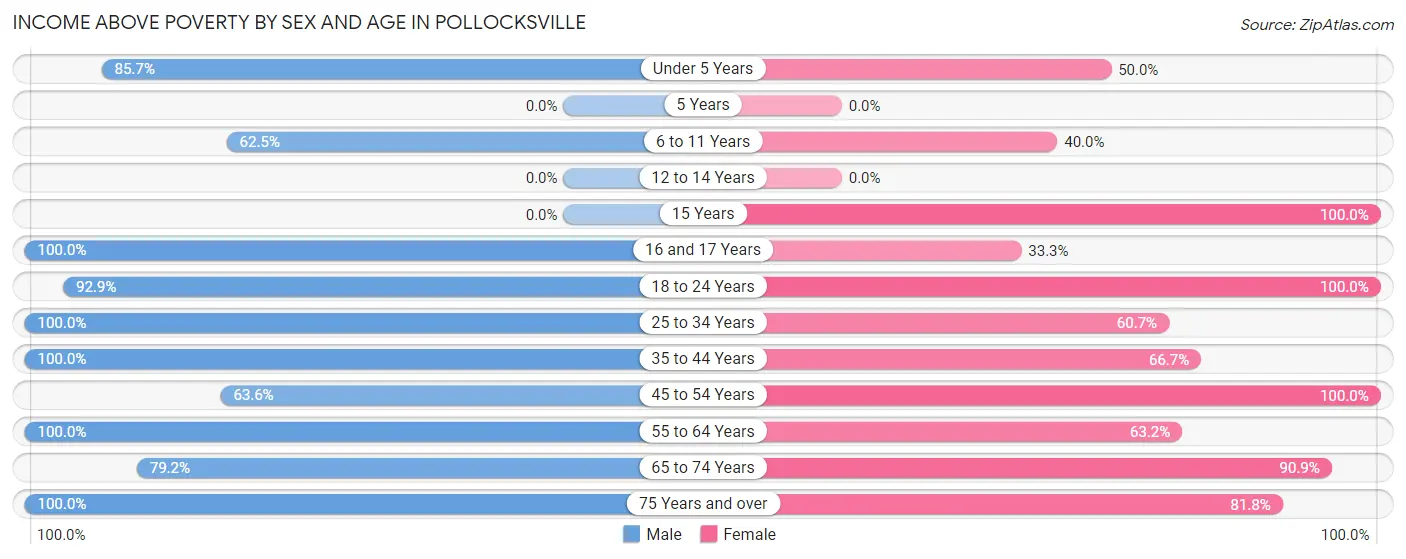
| Age Bracket | Male | Female |
| Under 5 Years | 6 (85.7%) | 5 (50.0%) |
| 5 Years | 0 (0.0%) | 0 (0.0%) |
| 6 to 11 Years | 10 (62.5%) | 2 (40.0%) |
| 12 to 14 Years | 0 (0.0%) | 0 (0.0%) |
| 15 Years | 0 (0.0%) | 6 (100.0%) |
| 16 and 17 Years | 12 (100.0%) | 2 (33.3%) |
| 18 to 24 Years | 13 (92.9%) | 61 (100.0%) |
| 25 to 34 Years | 15 (100.0%) | 17 (60.7%) |
| 35 to 44 Years | 21 (100.0%) | 6 (66.7%) |
| 45 to 54 Years | 7 (63.6%) | 7 (100.0%) |
| 55 to 64 Years | 9 (100.0%) | 12 (63.2%) |
| 65 to 74 Years | 19 (79.2%) | 20 (90.9%) |
| 75 Years and over | 8 (100.0%) | 9 (81.8%) |
| Total | 120 (75.9%) | 147 (79.9%) |
Income Below Poverty Among Married-Couple Families in Pollocksville
The poverty statistics for married-couple families in Pollocksville show that 11.9% or 7 of the total 59 families live below the poverty line. Families with 1 or 2 children have the highest poverty rate of 20.0%, comprising of 5 families. On the other hand, families with 3 or 4 children have the lowest poverty rate of 0.0%, which includes 0 families.
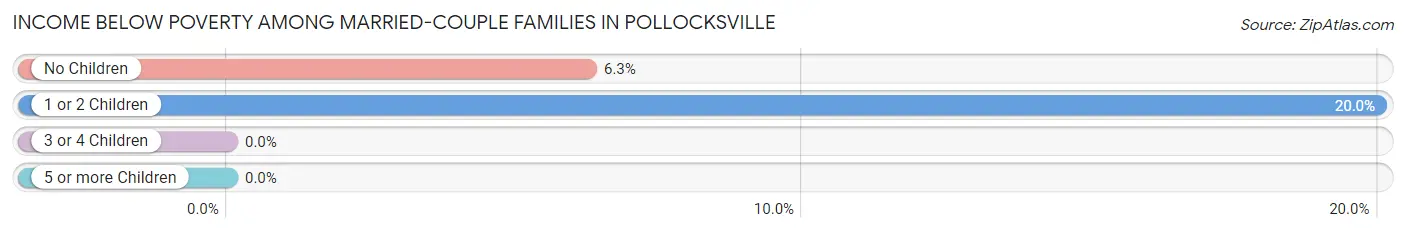
| Children | Above Poverty | Below Poverty |
| No Children | 30 (93.8%) | 2 (6.2%) |
| 1 or 2 Children | 20 (80.0%) | 5 (20.0%) |
| 3 or 4 Children | 2 (100.0%) | 0 (0.0%) |
| 5 or more Children | 0 (0.0%) | 0 (0.0%) |
| Total | 52 (88.1%) | 7 (11.9%) |
Income Below Poverty Among Single-Parent Households in Pollocksville
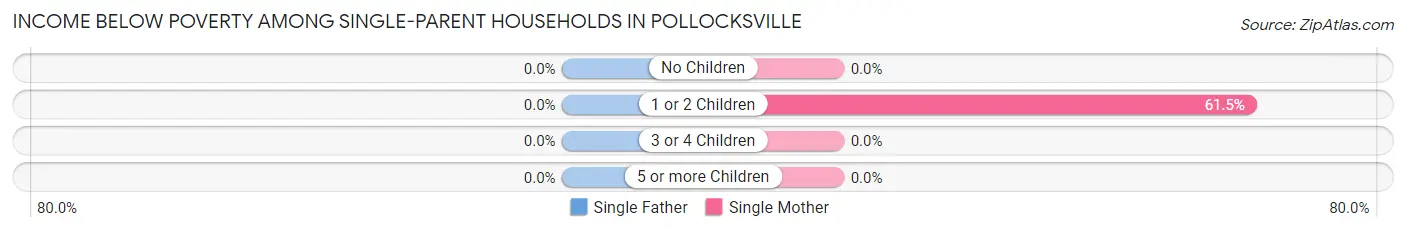
| Children | Single Father | Single Mother |
| No Children | 0 (0.0%) | 0 (0.0%) |
| 1 or 2 Children | 0 (0.0%) | 8 (61.5%) |
| 3 or 4 Children | 0 (0.0%) | 0 (0.0%) |
| 5 or more Children | 0 (0.0%) | 0 (0.0%) |
| Total | 0 (0.0%) | 8 (53.3%) |
Income Below Poverty Among Married-Couple vs Single-Parent Households in Pollocksville
The poverty data for Pollocksville shows that 7 of the married-couple family households (11.9%) and 8 of the single-parent households (44.4%) are living below the poverty level. Within the married-couple family households, those with 1 or 2 children have the highest poverty rate, with 5 households (20.0%) falling below the poverty line. Among the single-parent households, those with 1 or 2 children have the highest poverty rate, with 8 household (50.0%) living below poverty.
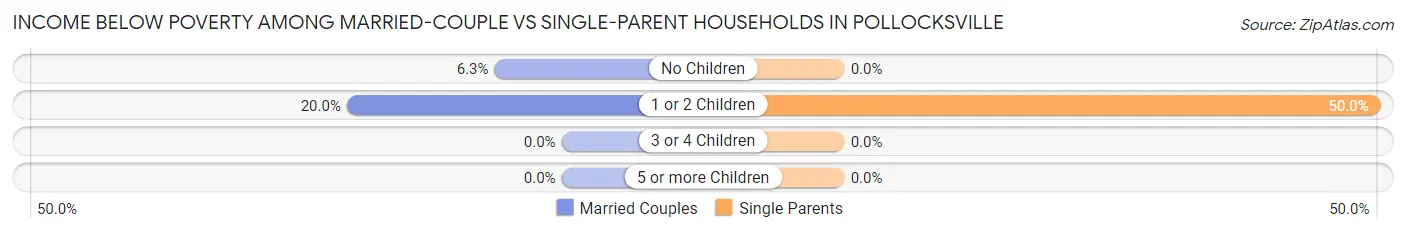
| Children | Married-Couple Families | Single-Parent Households |
| No Children | 2 (6.2%) | 0 (0.0%) |
| 1 or 2 Children | 5 (20.0%) | 8 (50.0%) |
| 3 or 4 Children | 0 (0.0%) | 0 (0.0%) |
| 5 or more Children | 0 (0.0%) | 0 (0.0%) |
| Total | 7 (11.9%) | 8 (44.4%) |
Employment Characteristics in Pollocksville
Employment by Class of Employer in Pollocksville
Among the 174 employed individuals in Pollocksville, private company employees (137 | 78.7%), self-employed (not incorporated) (13 | 7.5%), and local government employees (9 | 5.2%) make up the most common classes of employment.
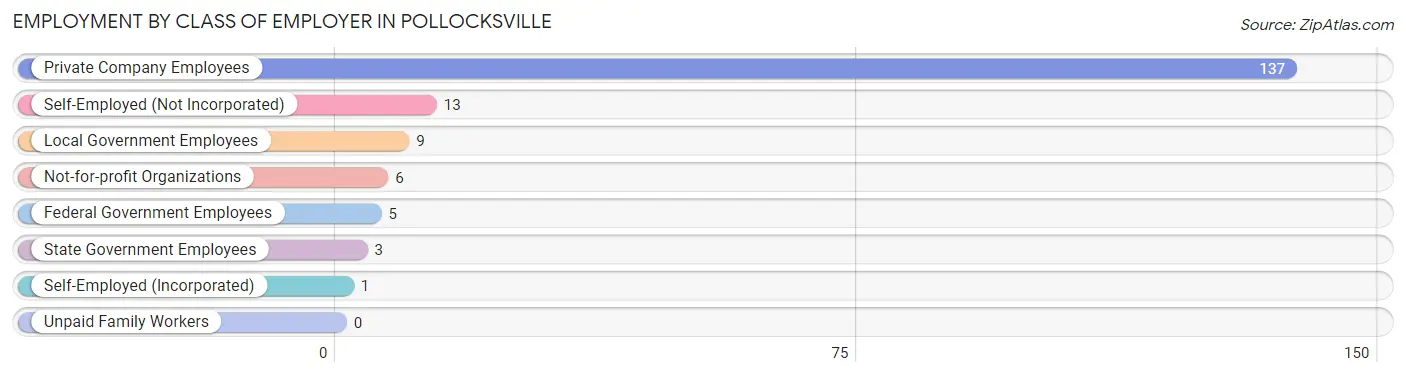
| Employer Class | # Employees | % Employees |
| Private Company Employees | 137 | 78.7% |
| Self-Employed (Incorporated) | 1 | 0.6% |
| Self-Employed (Not Incorporated) | 13 | 7.5% |
| Not-for-profit Organizations | 6 | 3.5% |
| Local Government Employees | 9 | 5.2% |
| State Government Employees | 3 | 1.7% |
| Federal Government Employees | 5 | 2.9% |
| Unpaid Family Workers | 0 | 0.0% |
| Total | 174 | 100.0% |
Employment Status by Age in Pollocksville
According to the labor force statistics for Pollocksville, out of the total population over 16 years of age (277), 66.8% or 185 individuals are in the labor force, with 3.8% or 7 of them unemployed. The age group with the highest labor force participation rate is 35 to 44 years, with 100.0% or 30 individuals in the labor force. Within the labor force, the 16 to 19 years age range has the highest percentage of unemployed individuals, with 57.1% or 4 of them being unemployed.
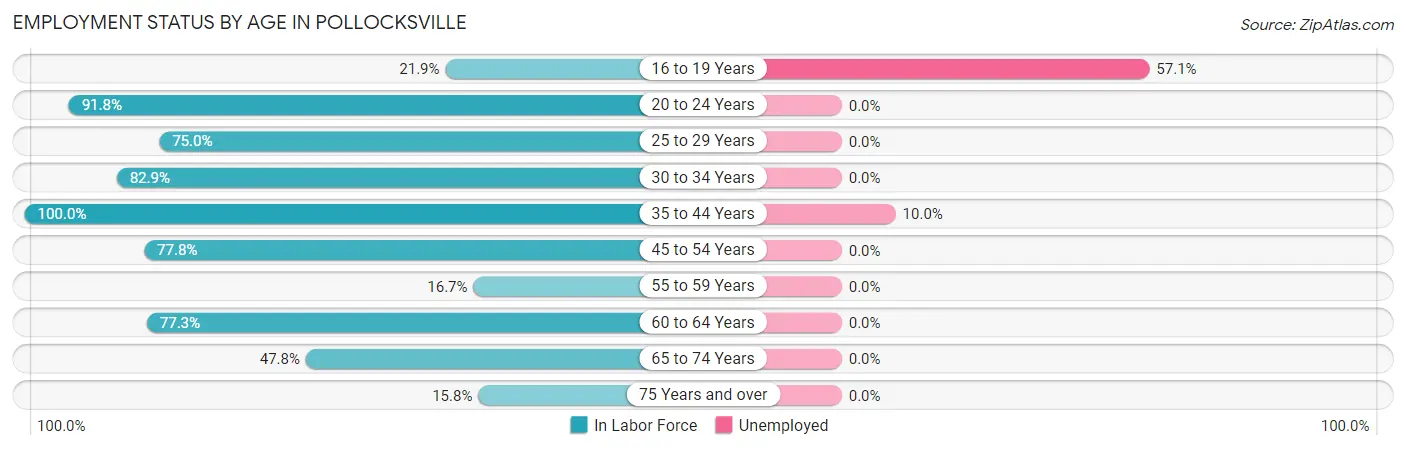
| Age Bracket | In Labor Force | Unemployed |
| 16 to 19 Years | 7 (21.9%) | 4 (57.1%) |
| 20 to 24 Years | 56 (91.8%) | 0 (0.0%) |
| 25 to 29 Years | 6 (75.0%) | 0 (0.0%) |
| 30 to 34 Years | 29 (82.9%) | 0 (0.0%) |
| 35 to 44 Years | 30 (100.0%) | 3 (10.0%) |
| 45 to 54 Years | 14 (77.8%) | 0 (0.0%) |
| 55 to 59 Years | 1 (16.7%) | 0 (0.0%) |
| 60 to 64 Years | 17 (77.3%) | 0 (0.0%) |
| 65 to 74 Years | 22 (47.8%) | 0 (0.0%) |
| 75 Years and over | 3 (15.8%) | 0 (0.0%) |
| Total | 185 (66.8%) | 7 (3.8%) |
Employment Status by Educational Attainment in Pollocksville
According to labor force statistics for Pollocksville, 81.5% of individuals (97) out of the total population between 25 and 64 years of age (119) are in the labor force, with 3.1% or 3 of them being unemployed. The group with the highest labor force participation rate are those with the educational attainment of less than high school, with 100.0% or 1 individuals in the labor force. Within the labor force, individuals with high school diploma education have the highest percentage of unemployment, with 9.4% or 3 of them being unemployed.
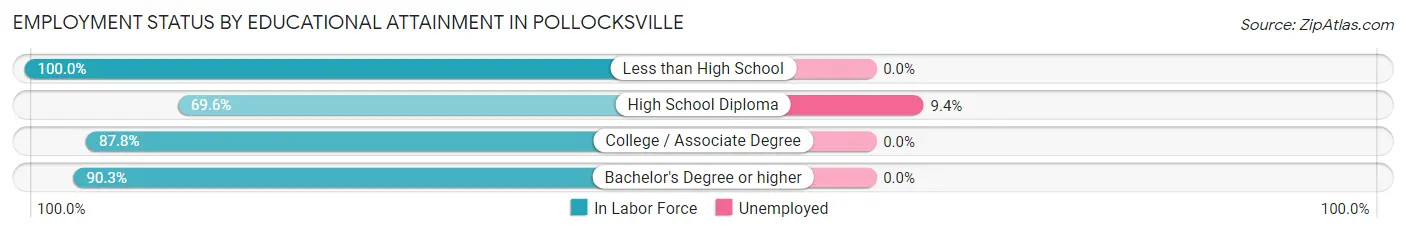
| Educational Attainment | In Labor Force | Unemployed |
| Less than High School | 1 (100.0%) | 0 (0.0%) |
| High School Diploma | 32 (69.6%) | 4 (9.4%) |
| College / Associate Degree | 36 (87.8%) | 0 (0.0%) |
| Bachelor's Degree or higher | 28 (90.3%) | 0 (0.0%) |
| Total | 97 (81.5%) | 4 (3.1%) |
Employment Occupations by Sex in Pollocksville
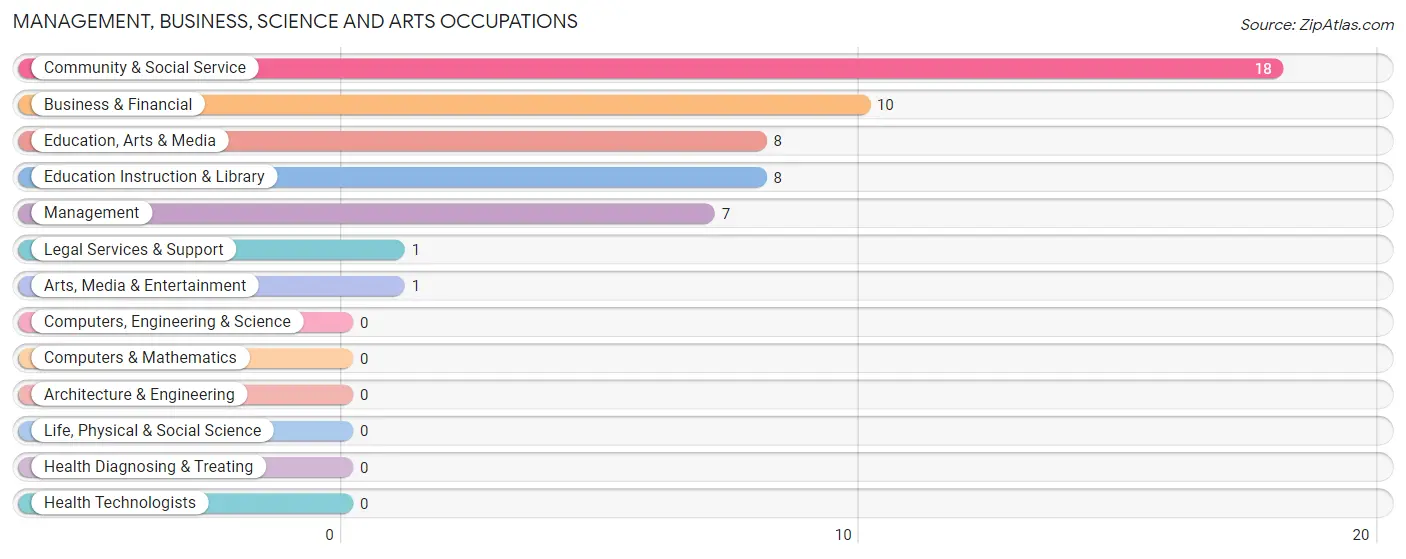
Management, Business, Science and Arts Occupations
The most common Management, Business, Science and Arts occupations in Pollocksville are Community & Social Service (18 | 10.1%), Business & Financial (10 | 5.6%), Education, Arts & Media (8 | 4.5%), Education Instruction & Library (8 | 4.5%), and Management (7 | 3.9%).
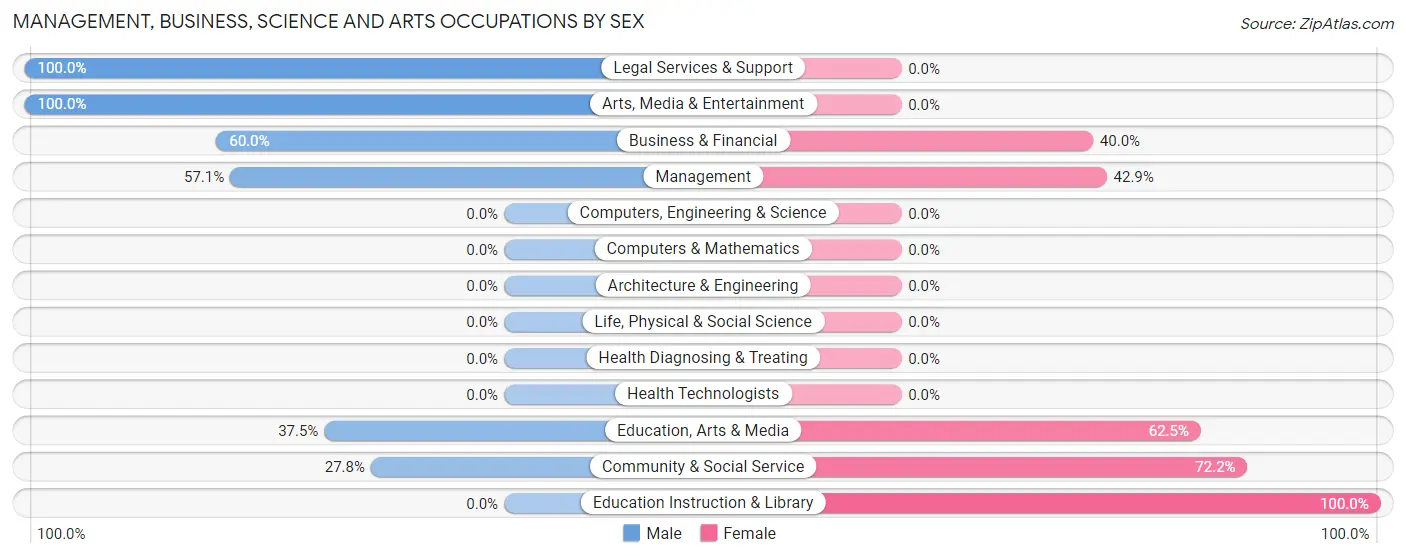
Management, Business, Science and Arts Occupations by Sex
Within the Management, Business, Science and Arts occupations in Pollocksville, the most male-oriented occupations are Legal Services & Support (100.0%), Arts, Media & Entertainment (100.0%), and Business & Financial (60.0%), while the most female-oriented occupations are Education Instruction & Library (100.0%), Community & Social Service (72.2%), and Education, Arts & Media (62.5%).
| Occupation | Male | Female |
| Management | 4 (57.1%) | 3 (42.9%) |
| Business & Financial | 6 (60.0%) | 4 (40.0%) |
| Computers, Engineering & Science | 0 (0.0%) | 0 (0.0%) |
| Computers & Mathematics | 0 (0.0%) | 0 (0.0%) |
| Architecture & Engineering | 0 (0.0%) | 0 (0.0%) |
| Life, Physical & Social Science | 0 (0.0%) | 0 (0.0%) |
| Community & Social Service | 5 (27.8%) | 13 (72.2%) |
| Education, Arts & Media | 3 (37.5%) | 5 (62.5%) |
| Legal Services & Support | 1 (100.0%) | 0 (0.0%) |
| Education Instruction & Library | 0 (0.0%) | 8 (100.0%) |
| Arts, Media & Entertainment | 1 (100.0%) | 0 (0.0%) |
| Health Diagnosing & Treating | 0 (0.0%) | 0 (0.0%) |
| Health Technologists | 0 (0.0%) | 0 (0.0%) |
| Total (Category) | 15 (42.9%) | 20 (57.1%) |
| Total (Overall) | 73 (41.0%) | 105 (59.0%) |
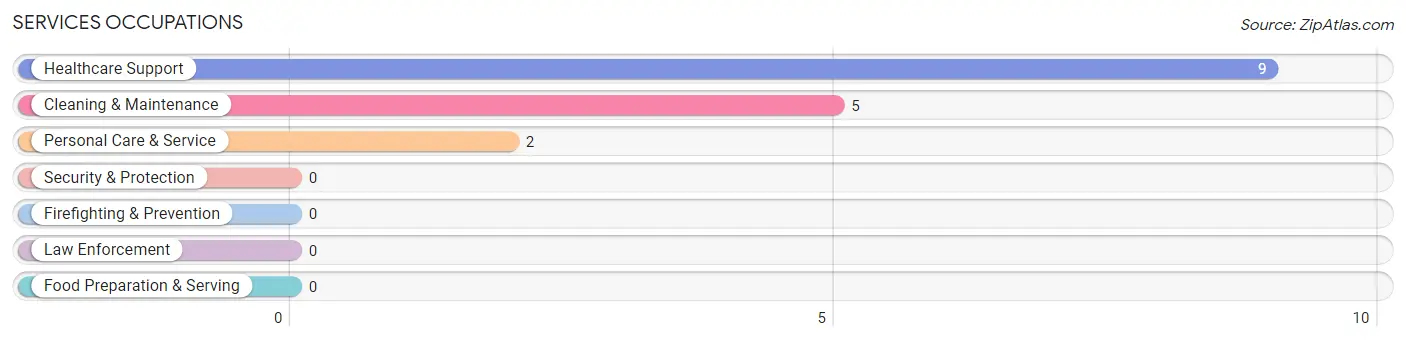
Services Occupations
The most common Services occupations in Pollocksville are Healthcare Support (9 | 5.1%), Cleaning & Maintenance (5 | 2.8%), and Personal Care & Service (2 | 1.1%).
Services Occupations by Sex
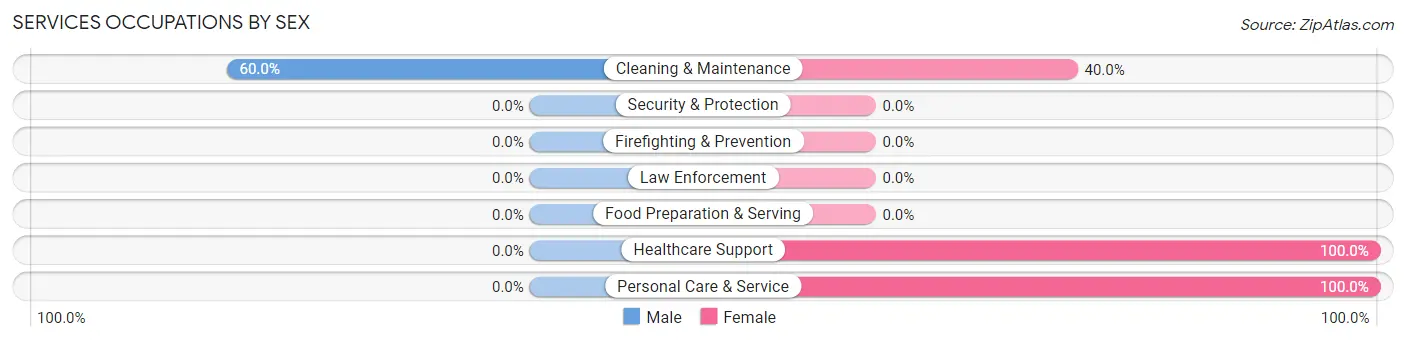
| Occupation | Male | Female |
| Healthcare Support | 0 (0.0%) | 9 (100.0%) |
| Security & Protection | 0 (0.0%) | 0 (0.0%) |
| Firefighting & Prevention | 0 (0.0%) | 0 (0.0%) |
| Law Enforcement | 0 (0.0%) | 0 (0.0%) |
| Food Preparation & Serving | 0 (0.0%) | 0 (0.0%) |
| Cleaning & Maintenance | 3 (60.0%) | 2 (40.0%) |
| Personal Care & Service | 0 (0.0%) | 2 (100.0%) |
| Total (Category) | 3 (18.8%) | 13 (81.2%) |
| Total (Overall) | 73 (41.0%) | 105 (59.0%) |
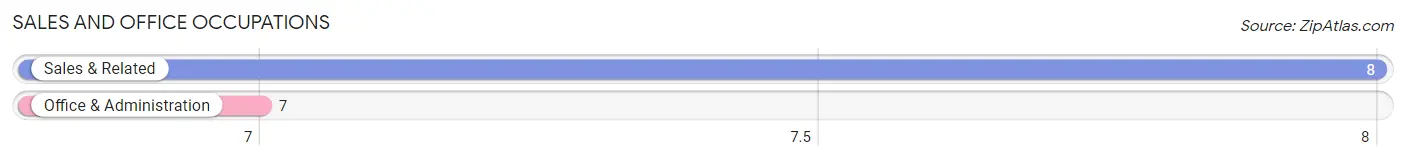
Sales and Office Occupations
The most common Sales and Office occupations in Pollocksville are Sales & Related (8 | 4.5%), and Office & Administration (7 | 3.9%).
Sales and Office Occupations by Sex
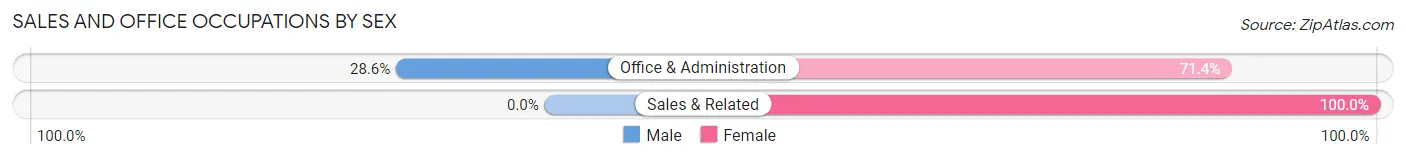
| Occupation | Male | Female |
| Sales & Related | 0 (0.0%) | 8 (100.0%) |
| Office & Administration | 2 (28.6%) | 5 (71.4%) |
| Total (Category) | 2 (13.3%) | 13 (86.7%) |
| Total (Overall) | 73 (41.0%) | 105 (59.0%) |
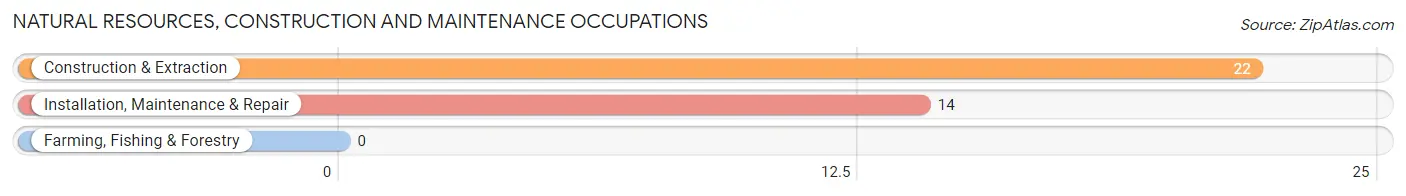
Natural Resources, Construction and Maintenance Occupations
The most common Natural Resources, Construction and Maintenance occupations in Pollocksville are Construction & Extraction (22 | 12.4%), and Installation, Maintenance & Repair (14 | 7.9%).
Natural Resources, Construction and Maintenance Occupations by Sex
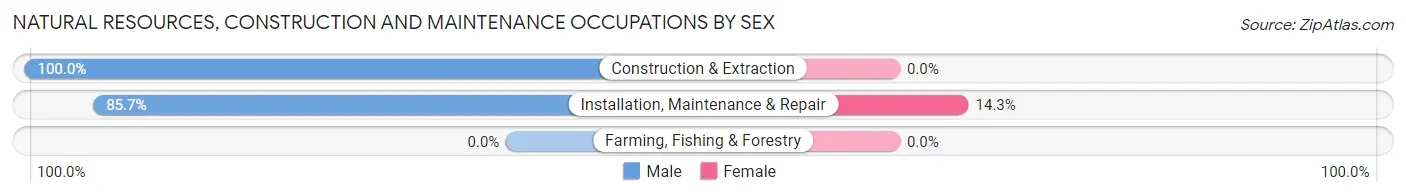
| Occupation | Male | Female |
| Farming, Fishing & Forestry | 0 (0.0%) | 0 (0.0%) |
| Construction & Extraction | 22 (100.0%) | 0 (0.0%) |
| Installation, Maintenance & Repair | 12 (85.7%) | 2 (14.3%) |
| Total (Category) | 34 (94.4%) | 2 (5.6%) |
| Total (Overall) | 73 (41.0%) | 105 (59.0%) |
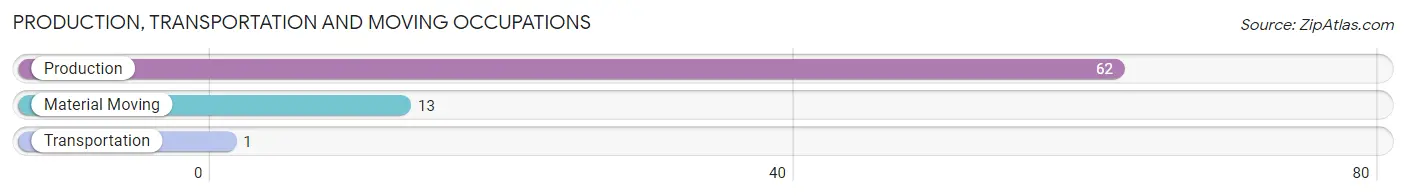
Production, Transportation and Moving Occupations
The most common Production, Transportation and Moving occupations in Pollocksville are Production (62 | 34.8%), Material Moving (13 | 7.3%), and Transportation (1 | 0.6%).
Production, Transportation and Moving Occupations by Sex
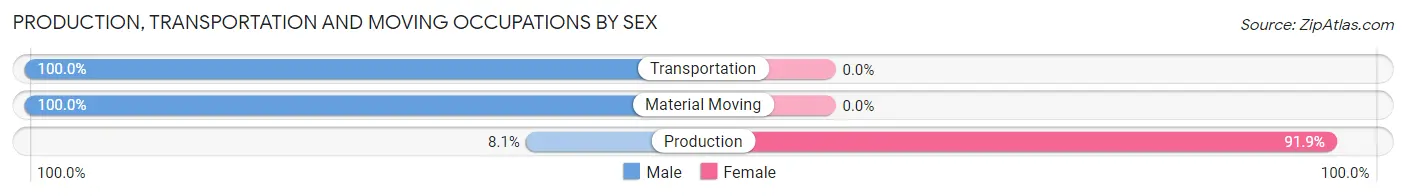
| Occupation | Male | Female |
| Production | 5 (8.1%) | 57 (91.9%) |
| Transportation | 1 (100.0%) | 0 (0.0%) |
| Material Moving | 13 (100.0%) | 0 (0.0%) |
| Total (Category) | 19 (25.0%) | 57 (75.0%) |
| Total (Overall) | 73 (41.0%) | 105 (59.0%) |
Employment Industries by Sex in Pollocksville
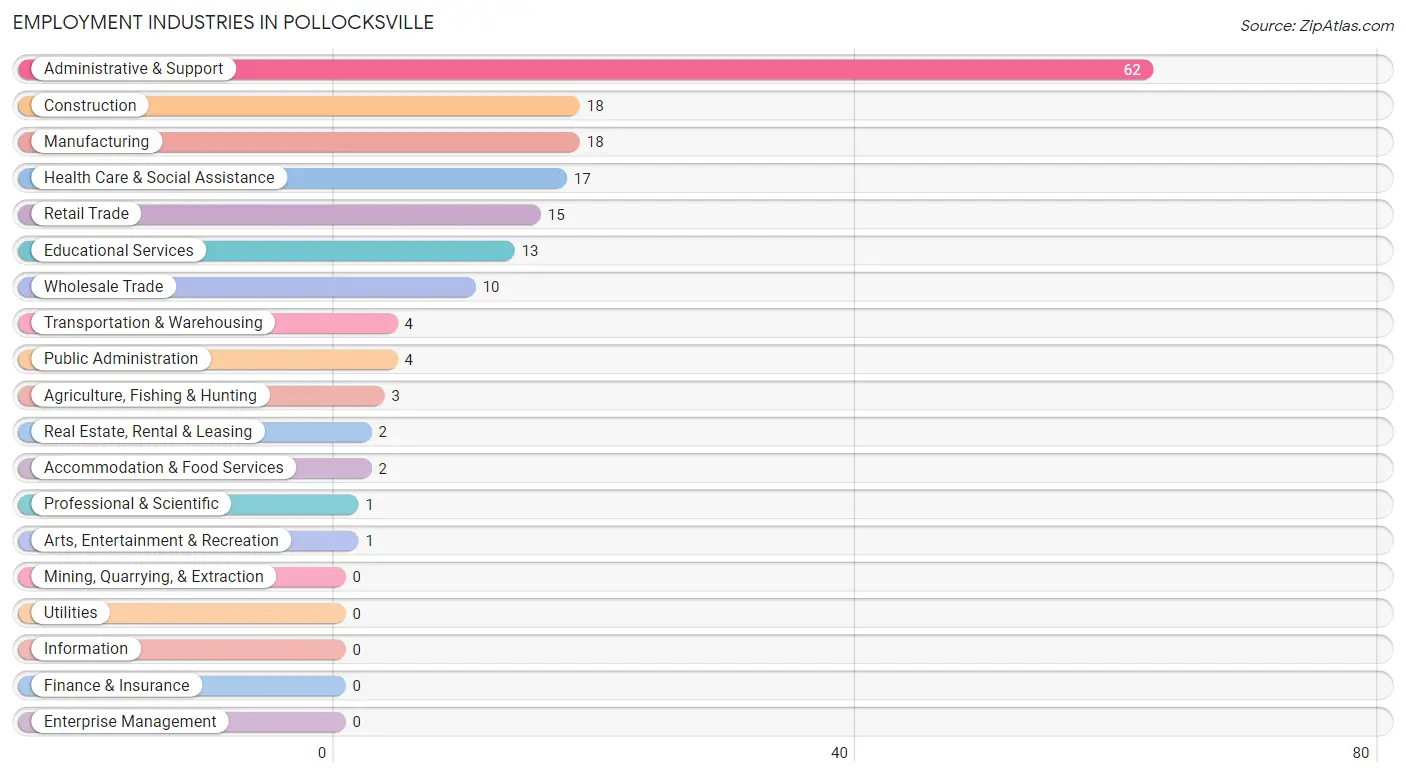
Employment Industries in Pollocksville
The major employment industries in Pollocksville include Administrative & Support (62 | 34.8%), Construction (18 | 10.1%), Manufacturing (18 | 10.1%), Health Care & Social Assistance (17 | 9.6%), and Retail Trade (15 | 8.4%).
Employment Industries by Sex in Pollocksville
The Pollocksville industries that see more men than women are Wholesale Trade (100.0%), Transportation & Warehousing (100.0%), and Professional & Scientific (100.0%), whereas the industries that tend to have a higher number of women are Agriculture, Fishing & Hunting (100.0%), Real Estate, Rental & Leasing (100.0%), and Health Care & Social Assistance (100.0%).
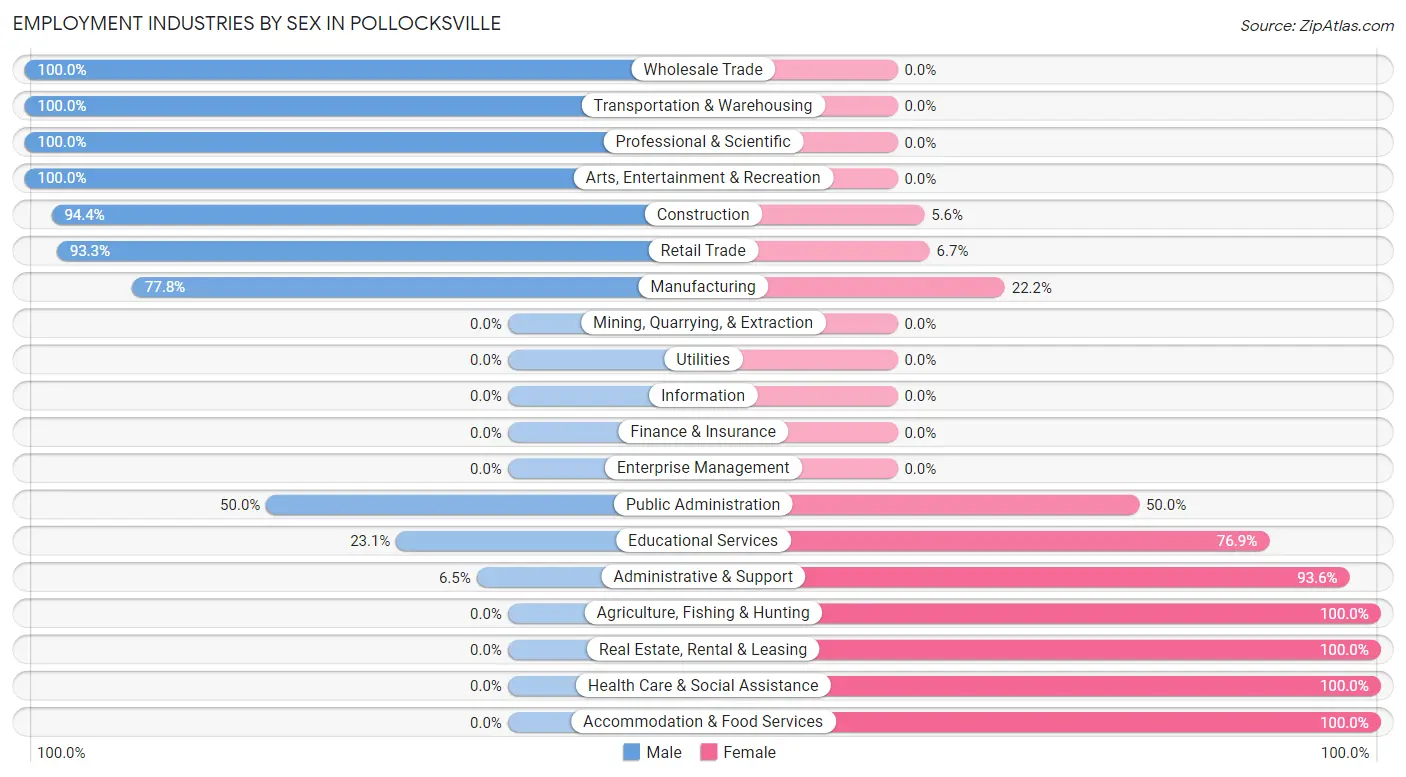
| Industry | Male | Female |
| Agriculture, Fishing & Hunting | 0 (0.0%) | 3 (100.0%) |
| Mining, Quarrying, & Extraction | 0 (0.0%) | 0 (0.0%) |
| Construction | 17 (94.4%) | 1 (5.6%) |
| Manufacturing | 14 (77.8%) | 4 (22.2%) |
| Wholesale Trade | 10 (100.0%) | 0 (0.0%) |
| Retail Trade | 14 (93.3%) | 1 (6.7%) |
| Transportation & Warehousing | 4 (100.0%) | 0 (0.0%) |
| Utilities | 0 (0.0%) | 0 (0.0%) |
| Information | 0 (0.0%) | 0 (0.0%) |
| Finance & Insurance | 0 (0.0%) | 0 (0.0%) |
| Real Estate, Rental & Leasing | 0 (0.0%) | 2 (100.0%) |
| Professional & Scientific | 1 (100.0%) | 0 (0.0%) |
| Enterprise Management | 0 (0.0%) | 0 (0.0%) |
| Administrative & Support | 4 (6.5%) | 58 (93.5%) |
| Educational Services | 3 (23.1%) | 10 (76.9%) |
| Health Care & Social Assistance | 0 (0.0%) | 17 (100.0%) |
| Arts, Entertainment & Recreation | 1 (100.0%) | 0 (0.0%) |
| Accommodation & Food Services | 0 (0.0%) | 2 (100.0%) |
| Public Administration | 2 (50.0%) | 2 (50.0%) |
| Total | 73 (41.0%) | 105 (59.0%) |
Education in Pollocksville
School Enrollment in Pollocksville
The most common levels of schooling among the 91 students in Pollocksville are high school (26 | 28.6%), kindergarten (21 | 23.1%), and college / undergraduate (19 | 20.9%).
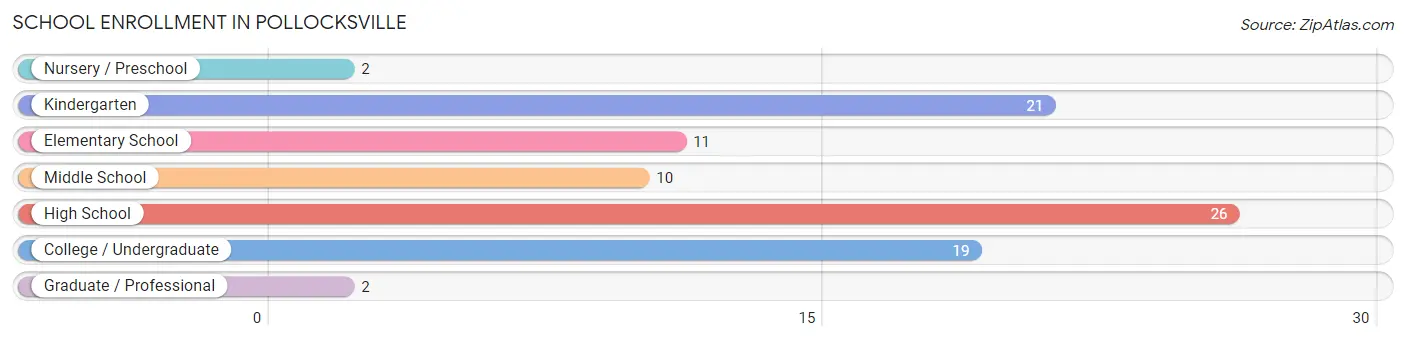
| School Level | # Students | % Students |
| Nursery / Preschool | 2 | 2.2% |
| Kindergarten | 21 | 23.1% |
| Elementary School | 11 | 12.1% |
| Middle School | 10 | 11.0% |
| High School | 26 | 28.6% |
| College / Undergraduate | 19 | 20.9% |
| Graduate / Professional | 2 | 2.2% |
| Total | 91 | 100.0% |
School Enrollment by Age by Funding Source in Pollocksville
Out of a total of 91 students who are enrolled in schools in Pollocksville, 9 (9.9%) attend a private institution, while the remaining 82 (90.1%) are enrolled in public schools. The age group of 3 to 4 year olds has the highest likelihood of being enrolled in private schools, with 1 (50.0% in the age bracket) enrolled. Conversely, the age group of 18 to 19 year olds has the lowest likelihood of being enrolled in a private school, with 14 (100.0% in the age bracket) attending a public institution.
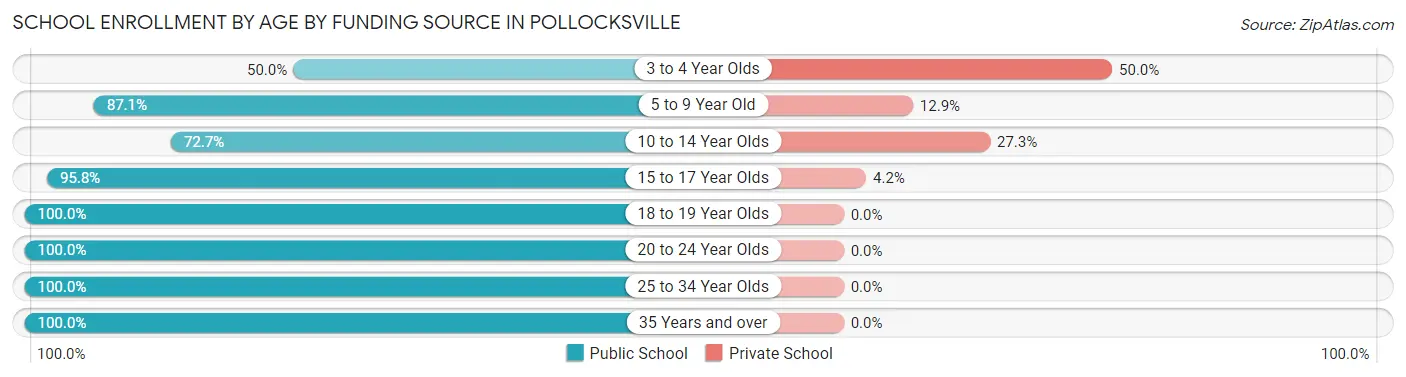
| Age Bracket | Public School | Private School |
| 3 to 4 Year Olds | 1 (50.0%) | 1 (50.0%) |
| 5 to 9 Year Old | 27 (87.1%) | 4 (12.9%) |
| 10 to 14 Year Olds | 8 (72.7%) | 3 (27.3%) |
| 15 to 17 Year Olds | 23 (95.8%) | 1 (4.2%) |
| 18 to 19 Year Olds | 14 (100.0%) | 0 (0.0%) |
| 20 to 24 Year Olds | 5 (100.0%) | 0 (0.0%) |
| 25 to 34 Year Olds | 2 (100.0%) | 0 (0.0%) |
| 35 Years and over | 2 (100.0%) | 0 (0.0%) |
| Total | 82 (90.1%) | 9 (9.9%) |
Educational Attainment by Field of Study in Pollocksville
Education (12 | 24.5%), science & technology (11 | 22.5%), business (7 | 14.3%), visual & performing arts (7 | 14.3%), and liberal arts & history (6 | 12.2%) are the most common fields of study among 49 individuals in Pollocksville who have obtained a bachelor's degree or higher.
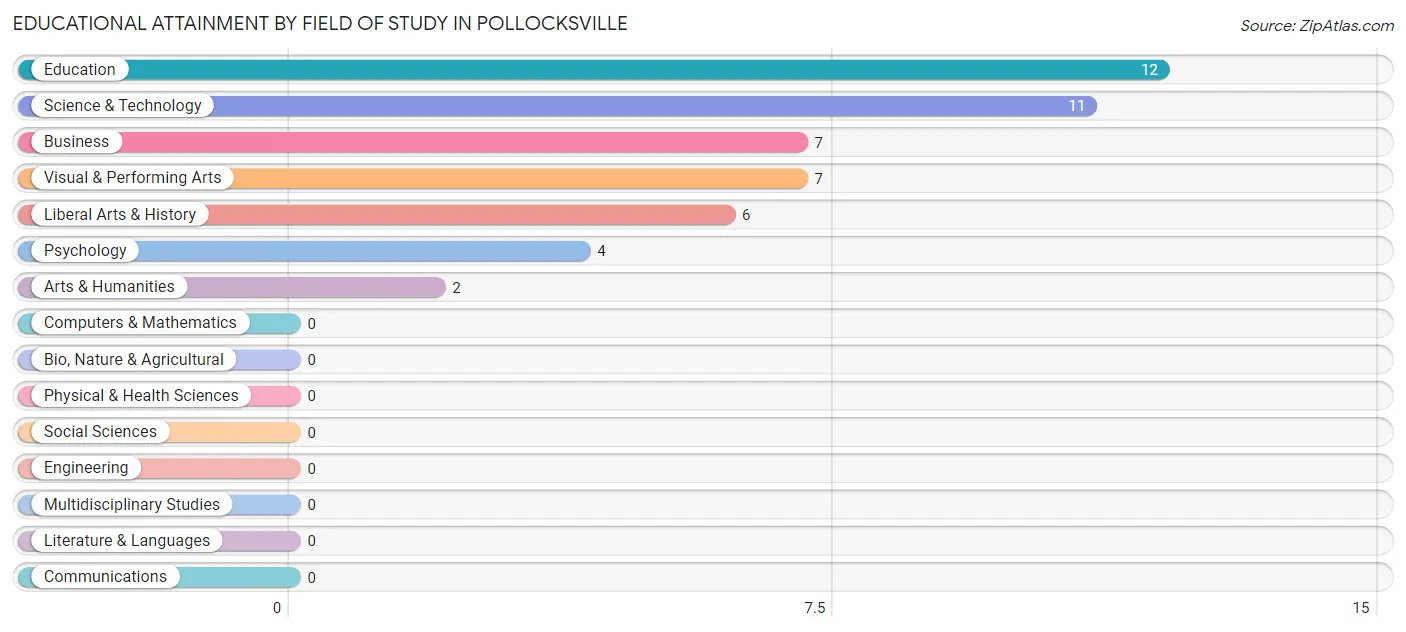
| Field of Study | # Graduates | % Graduates |
| Computers & Mathematics | 0 | 0.0% |
| Bio, Nature & Agricultural | 0 | 0.0% |
| Physical & Health Sciences | 0 | 0.0% |
| Psychology | 4 | 8.2% |
| Social Sciences | 0 | 0.0% |
| Engineering | 0 | 0.0% |
| Multidisciplinary Studies | 0 | 0.0% |
| Science & Technology | 11 | 22.5% |
| Business | 7 | 14.3% |
| Education | 12 | 24.5% |
| Literature & Languages | 0 | 0.0% |
| Liberal Arts & History | 6 | 12.2% |
| Visual & Performing Arts | 7 | 14.3% |
| Communications | 0 | 0.0% |
| Arts & Humanities | 2 | 4.1% |
| Total | 49 | 100.0% |
Transportation & Commute in Pollocksville
Vehicle Availability by Sex in Pollocksville
The most prevalent vehicle ownership categories in Pollocksville are males with 2 vehicles (28, accounting for 38.4%) and females with 2 vehicles (18, making up 27.7%).
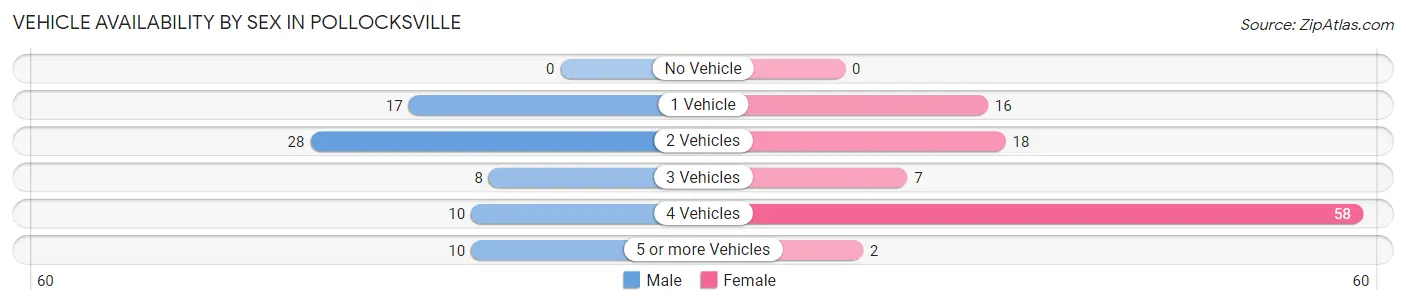
| Vehicles Available | Male | Female |
| No Vehicle | 0 (0.0%) | 0 (0.0%) |
| 1 Vehicle | 17 (23.3%) | 16 (15.8%) |
| 2 Vehicles | 28 (38.4%) | 18 (17.8%) |
| 3 Vehicles | 8 (11.0%) | 7 (6.9%) |
| 4 Vehicles | 10 (13.7%) | 58 (57.4%) |
| 5 or more Vehicles | 10 (13.7%) | 2 (2.0%) |
| Total | 73 (100.0%) | 101 (100.0%) |
Commute Time in Pollocksville
The most frequently occuring commute durations in Pollocksville are 10 to 14 minutes (57 commuters, 33.3%), less than 5 minutes (18 commuters, 10.5%), and 15 to 19 minutes (16 commuters, 9.4%).
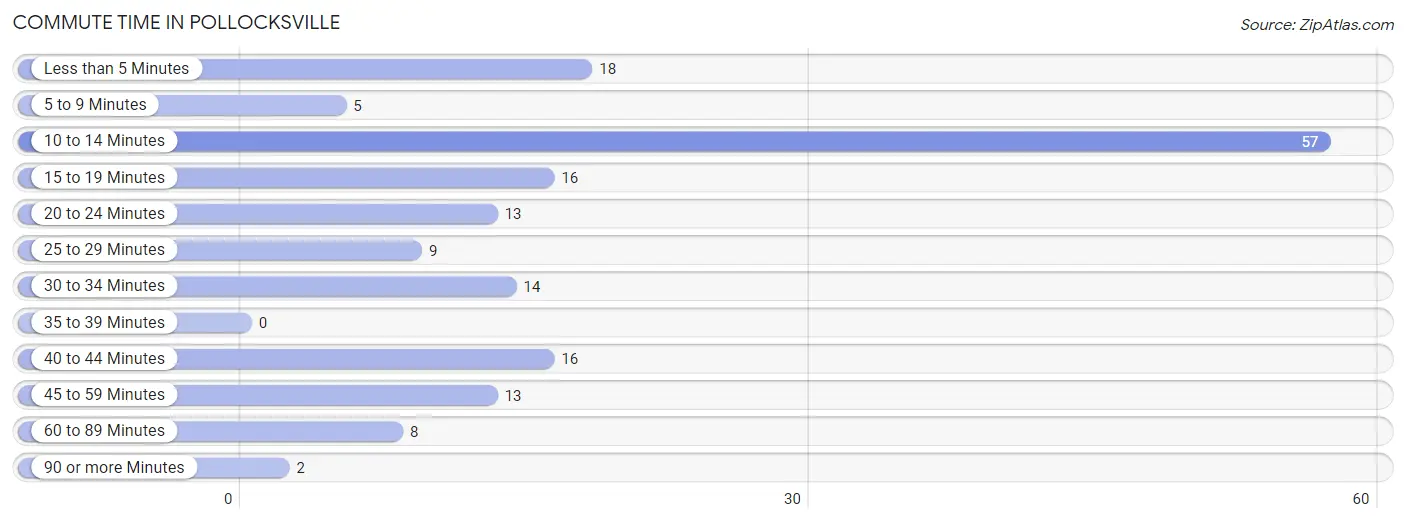
| Commute Time | # Commuters | % Commuters |
| Less than 5 Minutes | 18 | 10.5% |
| 5 to 9 Minutes | 5 | 2.9% |
| 10 to 14 Minutes | 57 | 33.3% |
| 15 to 19 Minutes | 16 | 9.4% |
| 20 to 24 Minutes | 13 | 7.6% |
| 25 to 29 Minutes | 9 | 5.3% |
| 30 to 34 Minutes | 14 | 8.2% |
| 35 to 39 Minutes | 0 | 0.0% |
| 40 to 44 Minutes | 16 | 9.4% |
| 45 to 59 Minutes | 13 | 7.6% |
| 60 to 89 Minutes | 8 | 4.7% |
| 90 or more Minutes | 2 | 1.2% |
Commute Time by Sex in Pollocksville
The most common commute times in Pollocksville are 40 to 44 minutes (16 commuters, 22.2%) for males and 10 to 14 minutes (57 commuters, 57.6%) for females.
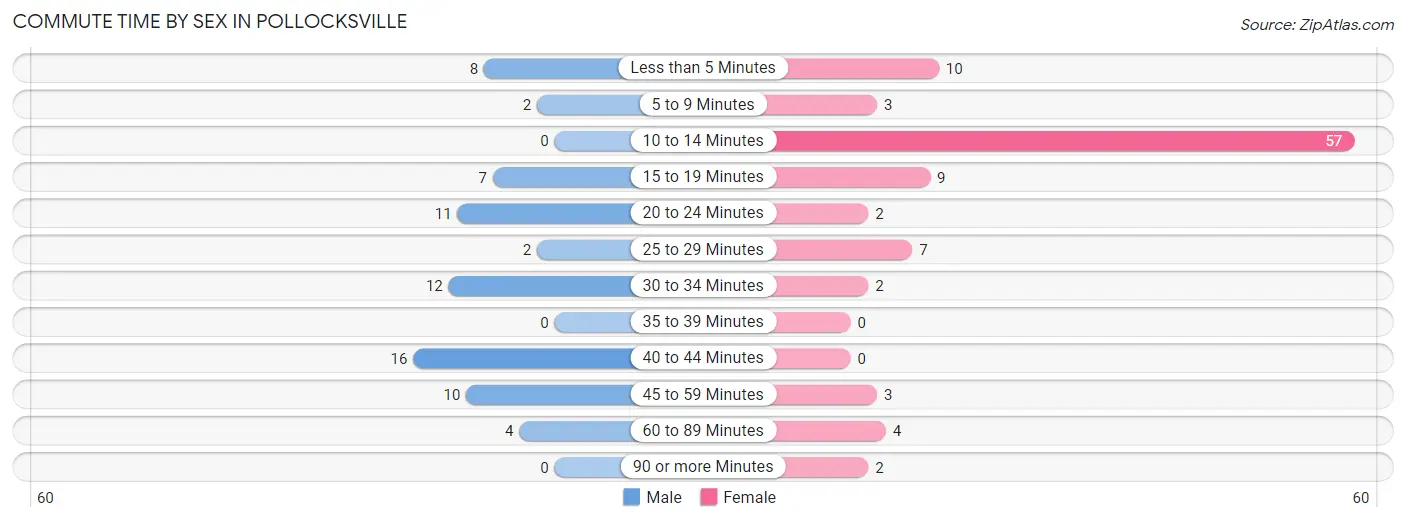
| Commute Time | Male | Female |
| Less than 5 Minutes | 8 (11.1%) | 10 (10.1%) |
| 5 to 9 Minutes | 2 (2.8%) | 3 (3.0%) |
| 10 to 14 Minutes | 0 (0.0%) | 57 (57.6%) |
| 15 to 19 Minutes | 7 (9.7%) | 9 (9.1%) |
| 20 to 24 Minutes | 11 (15.3%) | 2 (2.0%) |
| 25 to 29 Minutes | 2 (2.8%) | 7 (7.1%) |
| 30 to 34 Minutes | 12 (16.7%) | 2 (2.0%) |
| 35 to 39 Minutes | 0 (0.0%) | 0 (0.0%) |
| 40 to 44 Minutes | 16 (22.2%) | 0 (0.0%) |
| 45 to 59 Minutes | 10 (13.9%) | 3 (3.0%) |
| 60 to 89 Minutes | 4 (5.6%) | 4 (4.0%) |
| 90 or more Minutes | 0 (0.0%) | 2 (2.0%) |
Time of Departure to Work by Sex in Pollocksville
The most frequent times of departure to work in Pollocksville are 8:00 AM to 8:29 AM (22, 30.6%) for males and 7:00 AM to 7:29 AM (70, 70.7%) for females.
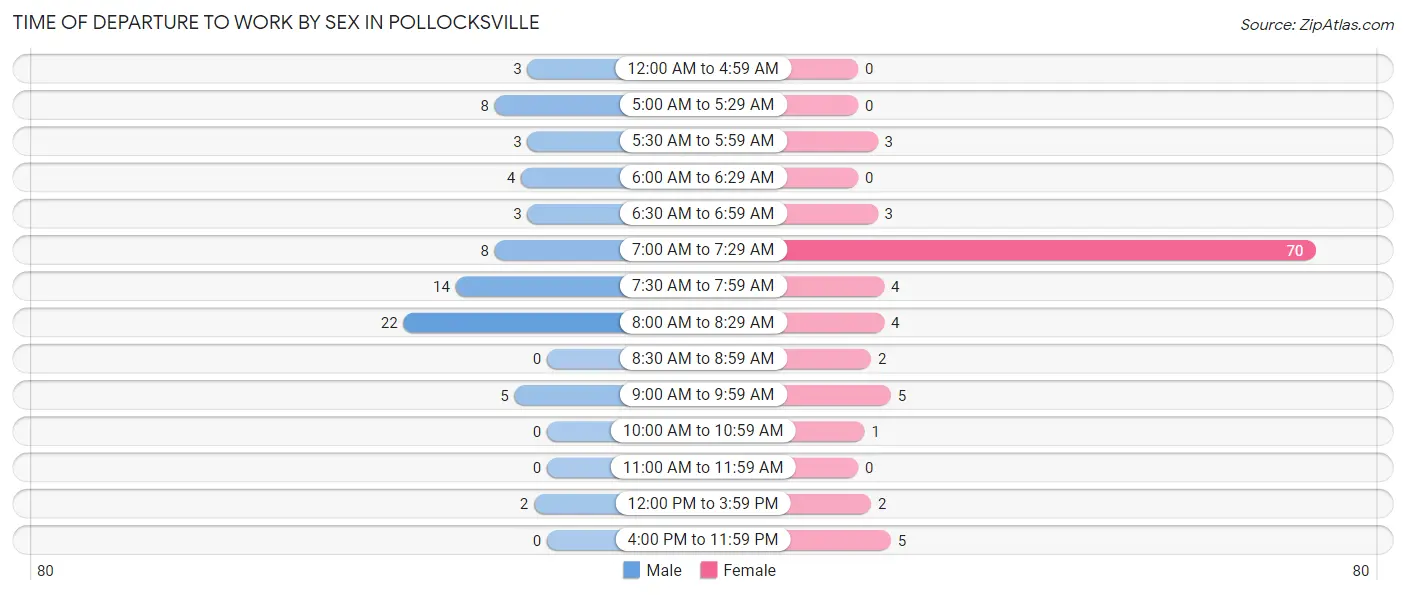
| Time of Departure | Male | Female |
| 12:00 AM to 4:59 AM | 3 (4.2%) | 0 (0.0%) |
| 5:00 AM to 5:29 AM | 8 (11.1%) | 0 (0.0%) |
| 5:30 AM to 5:59 AM | 3 (4.2%) | 3 (3.0%) |
| 6:00 AM to 6:29 AM | 4 (5.6%) | 0 (0.0%) |
| 6:30 AM to 6:59 AM | 3 (4.2%) | 3 (3.0%) |
| 7:00 AM to 7:29 AM | 8 (11.1%) | 70 (70.7%) |
| 7:30 AM to 7:59 AM | 14 (19.4%) | 4 (4.0%) |
| 8:00 AM to 8:29 AM | 22 (30.6%) | 4 (4.0%) |
| 8:30 AM to 8:59 AM | 0 (0.0%) | 2 (2.0%) |
| 9:00 AM to 9:59 AM | 5 (6.9%) | 5 (5.1%) |
| 10:00 AM to 10:59 AM | 0 (0.0%) | 1 (1.0%) |
| 11:00 AM to 11:59 AM | 0 (0.0%) | 0 (0.0%) |
| 12:00 PM to 3:59 PM | 2 (2.8%) | 2 (2.0%) |
| 4:00 PM to 11:59 PM | 0 (0.0%) | 5 (5.1%) |
| Total | 72 (100.0%) | 99 (100.0%) |
Housing Occupancy in Pollocksville
Occupancy by Ownership in Pollocksville
Of the total 114 dwellings in Pollocksville, owner-occupied units account for 80 (70.2%), while renter-occupied units make up 34 (29.8%).
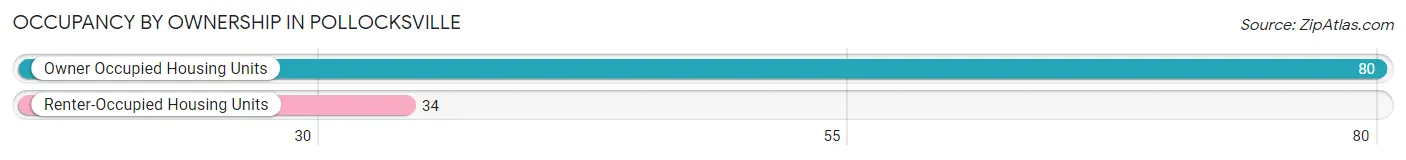
| Occupancy | # Housing Units | % Housing Units |
| Owner Occupied Housing Units | 80 | 70.2% |
| Renter-Occupied Housing Units | 34 | 29.8% |
| Total Occupied Housing Units | 114 | 100.0% |
Occupancy by Household Size in Pollocksville
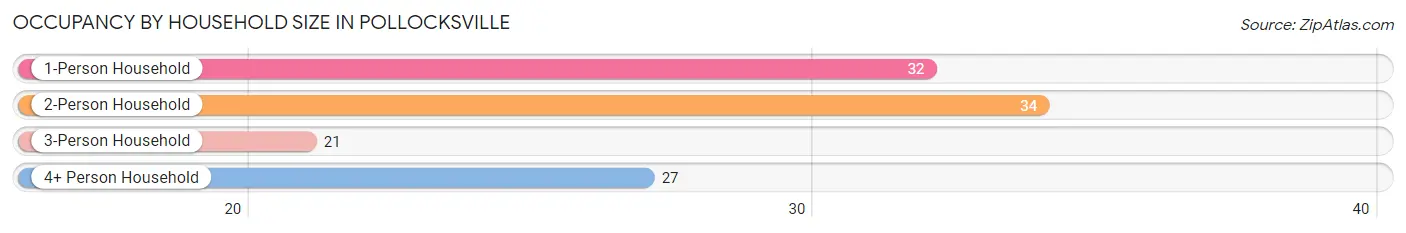
| Household Size | # Housing Units | % Housing Units |
| 1-Person Household | 32 | 28.1% |
| 2-Person Household | 34 | 29.8% |
| 3-Person Household | 21 | 18.4% |
| 4+ Person Household | 27 | 23.7% |
| Total Housing Units | 114 | 100.0% |
Occupancy by Ownership by Household Size in Pollocksville
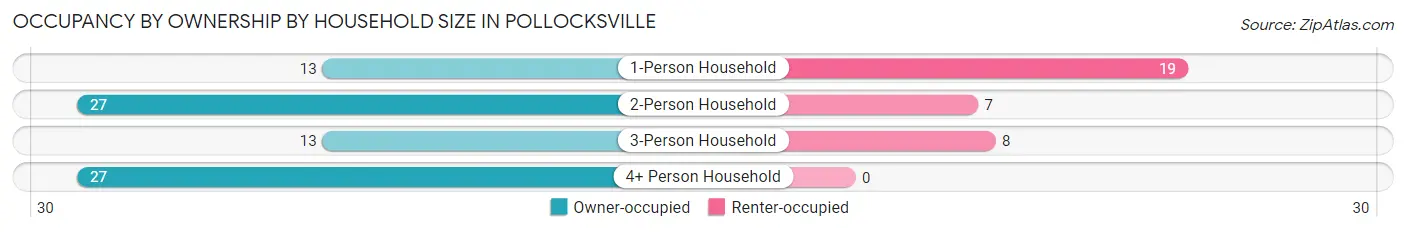
| Household Size | Owner-occupied | Renter-occupied |
| 1-Person Household | 13 (40.6%) | 19 (59.4%) |
| 2-Person Household | 27 (79.4%) | 7 (20.6%) |
| 3-Person Household | 13 (61.9%) | 8 (38.1%) |
| 4+ Person Household | 27 (100.0%) | 0 (0.0%) |
| Total Housing Units | 80 (70.2%) | 34 (29.8%) |
Occupancy by Educational Attainment in Pollocksville
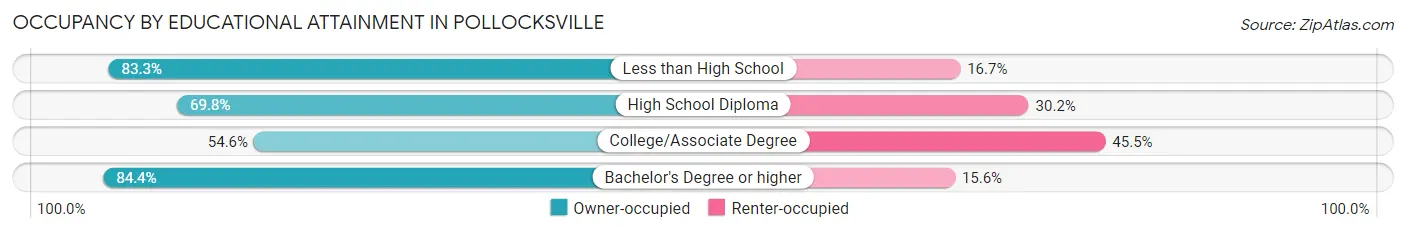
| Household Size | Owner-occupied | Renter-occupied |
| Less than High School | 5 (83.3%) | 1 (16.7%) |
| High School Diploma | 30 (69.8%) | 13 (30.2%) |
| College/Associate Degree | 18 (54.5%) | 15 (45.5%) |
| Bachelor's Degree or higher | 27 (84.4%) | 5 (15.6%) |
Occupancy by Age of Householder in Pollocksville
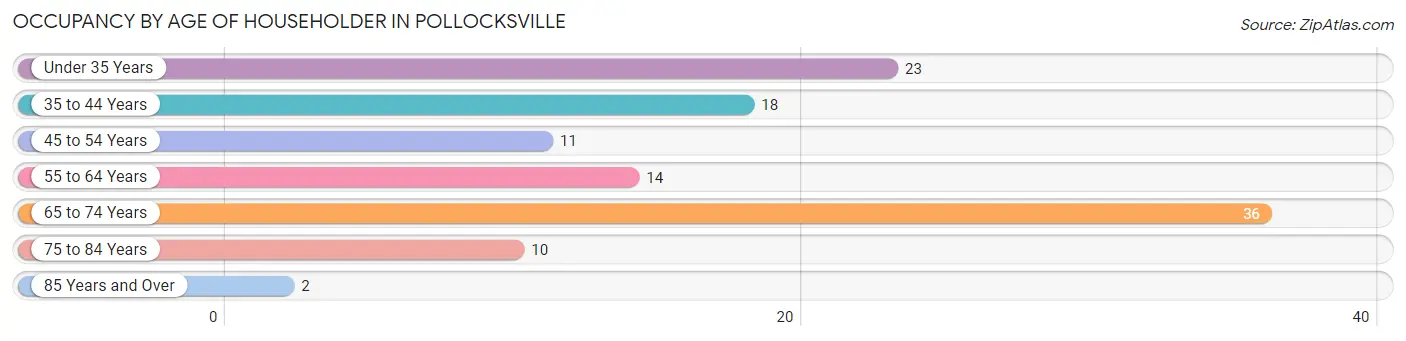
| Age Bracket | # Households | % Households |
| Under 35 Years | 23 | 20.2% |
| 35 to 44 Years | 18 | 15.8% |
| 45 to 54 Years | 11 | 9.7% |
| 55 to 64 Years | 14 | 12.3% |
| 65 to 74 Years | 36 | 31.6% |
| 75 to 84 Years | 10 | 8.8% |
| 85 Years and Over | 2 | 1.8% |
| Total | 114 | 100.0% |
Housing Finances in Pollocksville
Median Income by Occupancy in Pollocksville
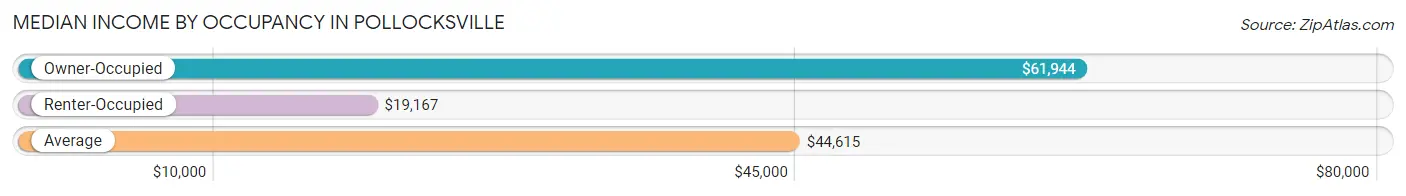
| Occupancy Type | # Households | Median Income |
| Owner-Occupied | 80 (70.2%) | $61,944 |
| Renter-Occupied | 34 (29.8%) | $19,167 |
| Average | 114 (100.0%) | $44,615 |
Occupancy by Householder Income Bracket in Pollocksville
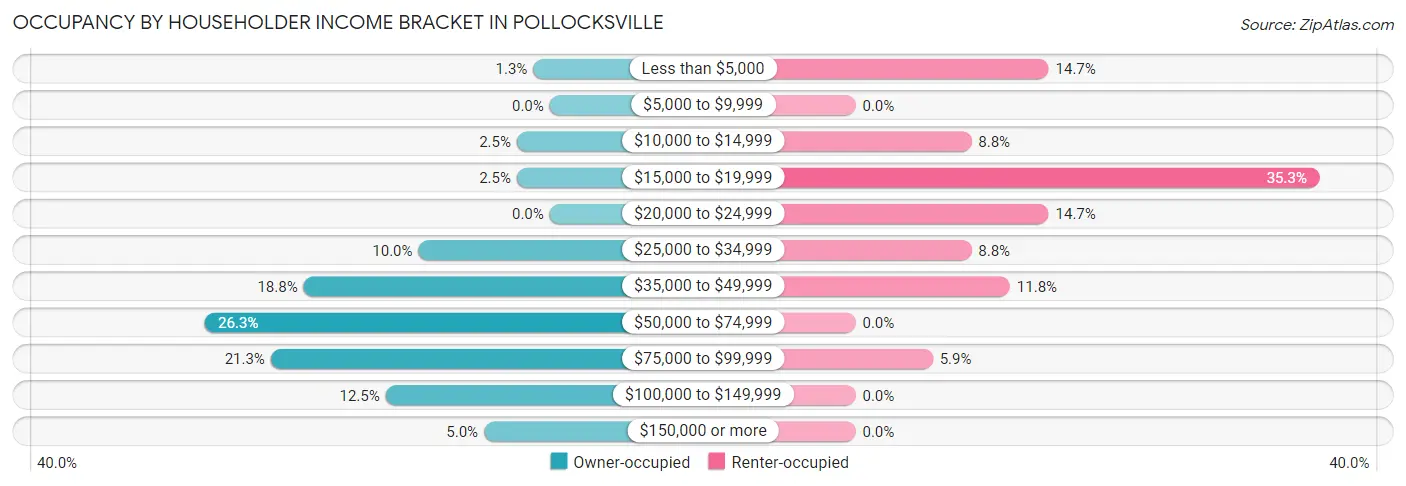
| Income Bracket | Owner-occupied | Renter-occupied |
| Less than $5,000 | 1 (1.3%) | 5 (14.7%) |
| $5,000 to $9,999 | 0 (0.0%) | 0 (0.0%) |
| $10,000 to $14,999 | 2 (2.5%) | 3 (8.8%) |
| $15,000 to $19,999 | 2 (2.5%) | 12 (35.3%) |
| $20,000 to $24,999 | 0 (0.0%) | 5 (14.7%) |
| $25,000 to $34,999 | 8 (10.0%) | 3 (8.8%) |
| $35,000 to $49,999 | 15 (18.8%) | 4 (11.8%) |
| $50,000 to $74,999 | 21 (26.3%) | 0 (0.0%) |
| $75,000 to $99,999 | 17 (21.2%) | 2 (5.9%) |
| $100,000 to $149,999 | 10 (12.5%) | 0 (0.0%) |
| $150,000 or more | 4 (5.0%) | 0 (0.0%) |
| Total | 80 (100.0%) | 34 (100.0%) |
Monthly Housing Cost Tiers in Pollocksville
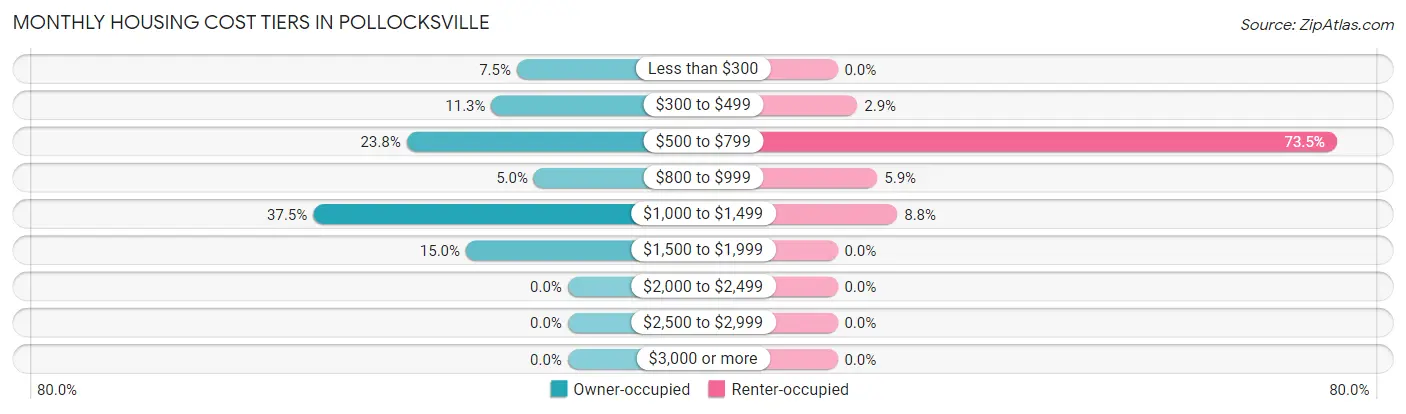
| Monthly Cost | Owner-occupied | Renter-occupied |
| Less than $300 | 6 (7.5%) | 0 (0.0%) |
| $300 to $499 | 9 (11.3%) | 1 (2.9%) |
| $500 to $799 | 19 (23.7%) | 25 (73.5%) |
| $800 to $999 | 4 (5.0%) | 2 (5.9%) |
| $1,000 to $1,499 | 30 (37.5%) | 3 (8.8%) |
| $1,500 to $1,999 | 12 (15.0%) | 0 (0.0%) |
| $2,000 to $2,499 | 0 (0.0%) | 0 (0.0%) |
| $2,500 to $2,999 | 0 (0.0%) | 0 (0.0%) |
| $3,000 or more | 0 (0.0%) | 0 (0.0%) |
| Total | 80 (100.0%) | 34 (100.0%) |
Physical Housing Characteristics in Pollocksville
Housing Structures in Pollocksville
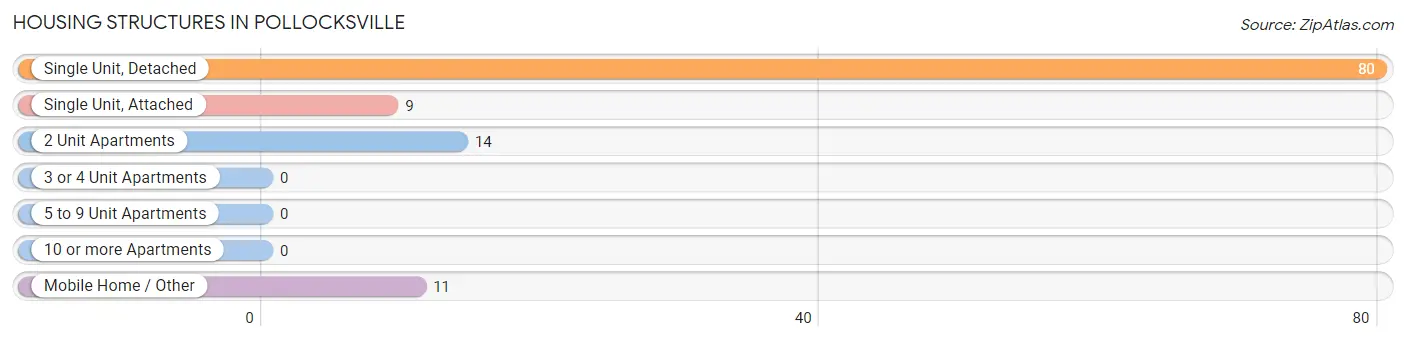
| Structure Type | # Housing Units | % Housing Units |
| Single Unit, Detached | 80 | 70.2% |
| Single Unit, Attached | 9 | 7.9% |
| 2 Unit Apartments | 14 | 12.3% |
| 3 or 4 Unit Apartments | 0 | 0.0% |
| 5 to 9 Unit Apartments | 0 | 0.0% |
| 10 or more Apartments | 0 | 0.0% |
| Mobile Home / Other | 11 | 9.7% |
| Total | 114 | 100.0% |
Housing Structures by Occupancy in Pollocksville
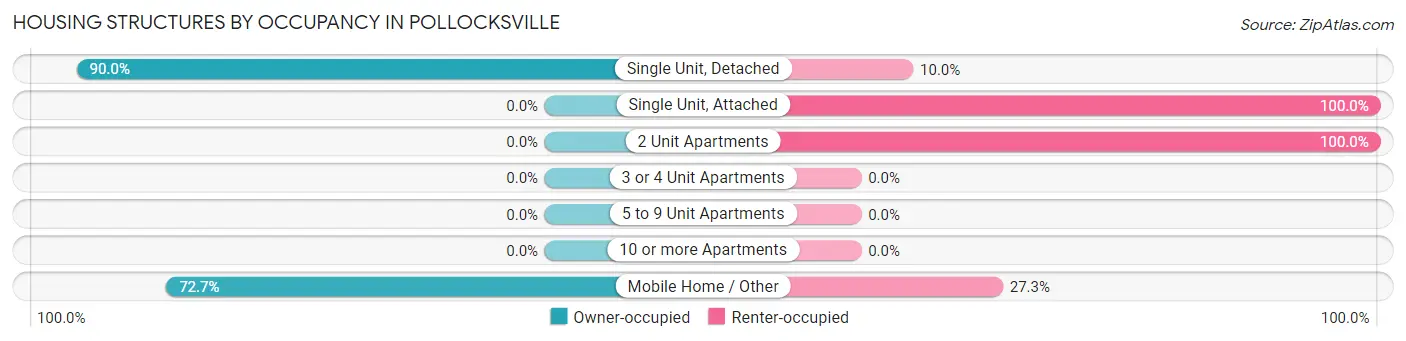
| Structure Type | Owner-occupied | Renter-occupied |
| Single Unit, Detached | 72 (90.0%) | 8 (10.0%) |
| Single Unit, Attached | 0 (0.0%) | 9 (100.0%) |
| 2 Unit Apartments | 0 (0.0%) | 14 (100.0%) |
| 3 or 4 Unit Apartments | 0 (0.0%) | 0 (0.0%) |
| 5 to 9 Unit Apartments | 0 (0.0%) | 0 (0.0%) |
| 10 or more Apartments | 0 (0.0%) | 0 (0.0%) |
| Mobile Home / Other | 8 (72.7%) | 3 (27.3%) |
| Total | 80 (70.2%) | 34 (29.8%) |
Housing Structures by Number of Rooms in Pollocksville
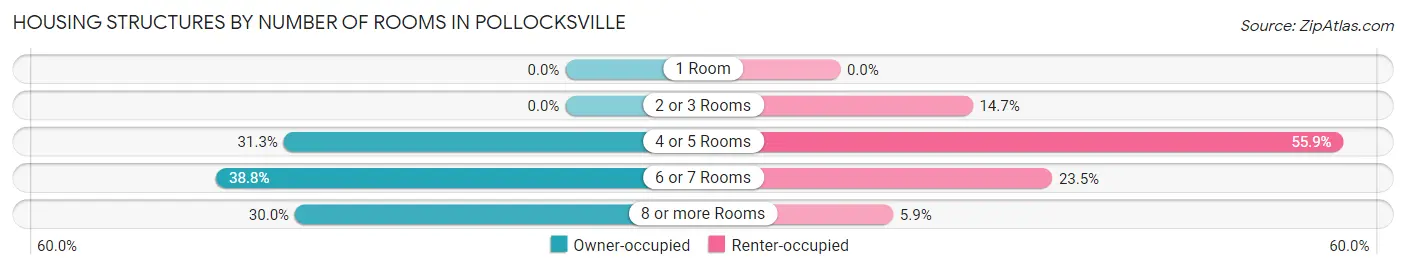
| Number of Rooms | Owner-occupied | Renter-occupied |
| 1 Room | 0 (0.0%) | 0 (0.0%) |
| 2 or 3 Rooms | 0 (0.0%) | 5 (14.7%) |
| 4 or 5 Rooms | 25 (31.2%) | 19 (55.9%) |
| 6 or 7 Rooms | 31 (38.8%) | 8 (23.5%) |
| 8 or more Rooms | 24 (30.0%) | 2 (5.9%) |
| Total | 80 (100.0%) | 34 (100.0%) |
Housing Structure by Heating Type in Pollocksville
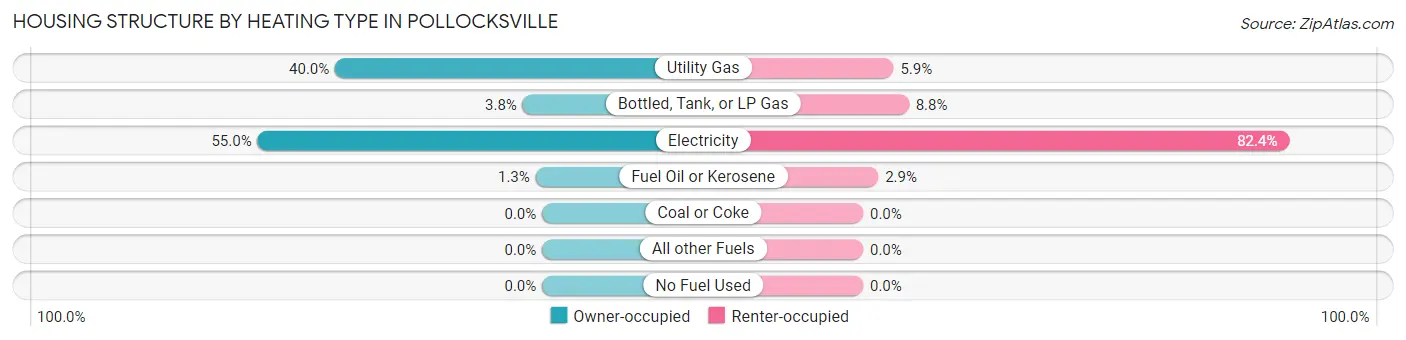
| Heating Type | Owner-occupied | Renter-occupied |
| Utility Gas | 32 (40.0%) | 2 (5.9%) |
| Bottled, Tank, or LP Gas | 3 (3.7%) | 3 (8.8%) |
| Electricity | 44 (55.0%) | 28 (82.4%) |
| Fuel Oil or Kerosene | 1 (1.3%) | 1 (2.9%) |
| Coal or Coke | 0 (0.0%) | 0 (0.0%) |
| All other Fuels | 0 (0.0%) | 0 (0.0%) |
| No Fuel Used | 0 (0.0%) | 0 (0.0%) |
| Total | 80 (100.0%) | 34 (100.0%) |
Household Vehicle Usage in Pollocksville
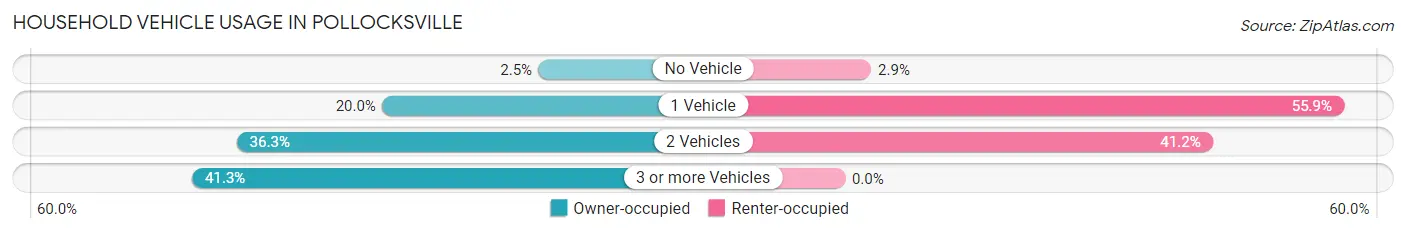
| Vehicles per Household | Owner-occupied | Renter-occupied |
| No Vehicle | 2 (2.5%) | 1 (2.9%) |
| 1 Vehicle | 16 (20.0%) | 19 (55.9%) |
| 2 Vehicles | 29 (36.2%) | 14 (41.2%) |
| 3 or more Vehicles | 33 (41.2%) | 0 (0.0%) |
| Total | 80 (100.0%) | 34 (100.0%) |
Real Estate & Mortgages in Pollocksville
Real Estate and Mortgage Overview in Pollocksville
| Characteristic | Without Mortgage | With Mortgage |
| Housing Units | 26 | 54 |
| Median Property Value | $90,000 | $152,900 |
| Median Household Income | $44,643 | $4 |
| Monthly Housing Costs | $471 | $0 |
| Real Estate Taxes | $880 | $0 |
Property Value by Mortgage Status in Pollocksville
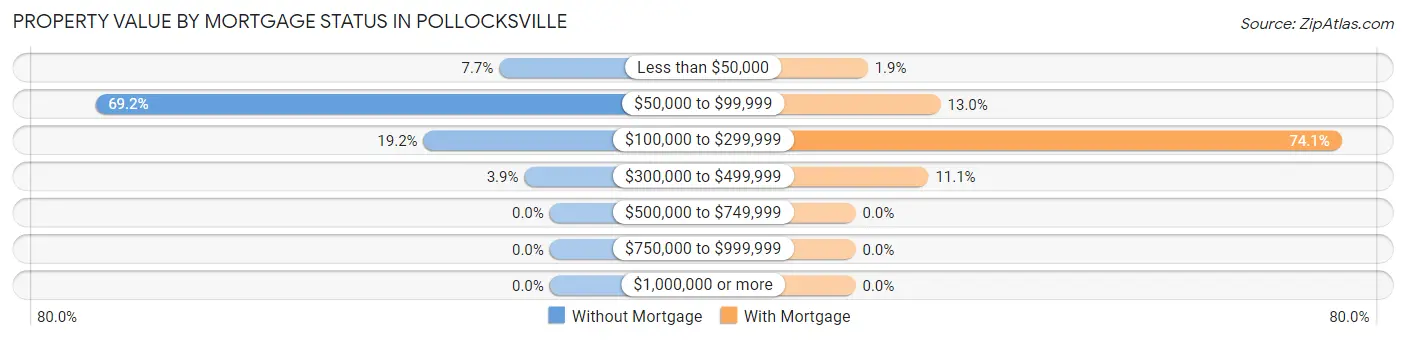
| Property Value | Without Mortgage | With Mortgage |
| Less than $50,000 | 2 (7.7%) | 1 (1.8%) |
| $50,000 to $99,999 | 18 (69.2%) | 7 (13.0%) |
| $100,000 to $299,999 | 5 (19.2%) | 40 (74.1%) |
| $300,000 to $499,999 | 1 (3.8%) | 6 (11.1%) |
| $500,000 to $749,999 | 0 (0.0%) | 0 (0.0%) |
| $750,000 to $999,999 | 0 (0.0%) | 0 (0.0%) |
| $1,000,000 or more | 0 (0.0%) | 0 (0.0%) |
| Total | 26 (100.0%) | 54 (100.0%) |
Household Income by Mortgage Status in Pollocksville
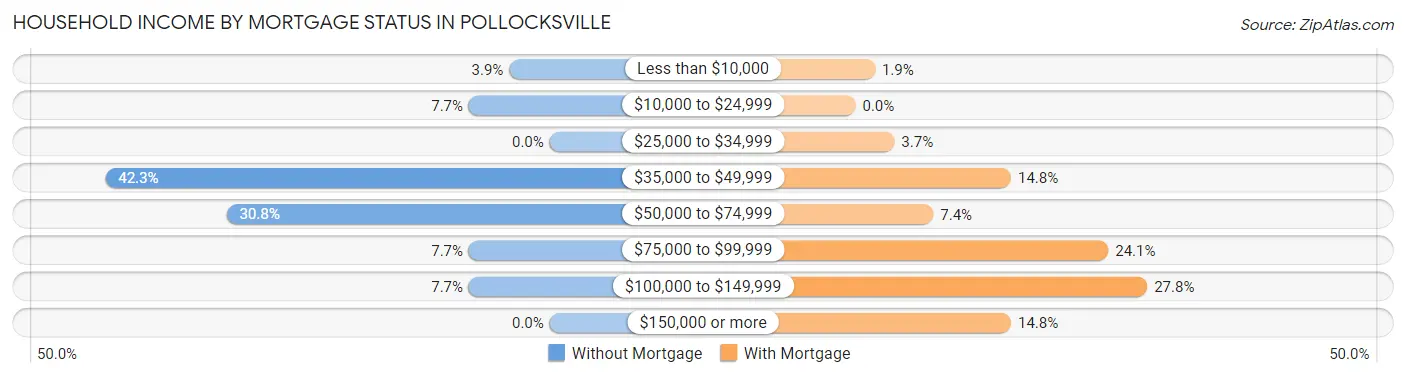
| Household Income | Without Mortgage | With Mortgage |
| Less than $10,000 | 1 (3.8%) | 1 (1.8%) |
| $10,000 to $24,999 | 2 (7.7%) | 0 (0.0%) |
| $25,000 to $34,999 | 0 (0.0%) | 2 (3.7%) |
| $35,000 to $49,999 | 11 (42.3%) | 8 (14.8%) |
| $50,000 to $74,999 | 8 (30.8%) | 4 (7.4%) |
| $75,000 to $99,999 | 2 (7.7%) | 13 (24.1%) |
| $100,000 to $149,999 | 2 (7.7%) | 15 (27.8%) |
| $150,000 or more | 0 (0.0%) | 8 (14.8%) |
| Total | 26 (100.0%) | 54 (100.0%) |
Property Value to Household Income Ratio in Pollocksville
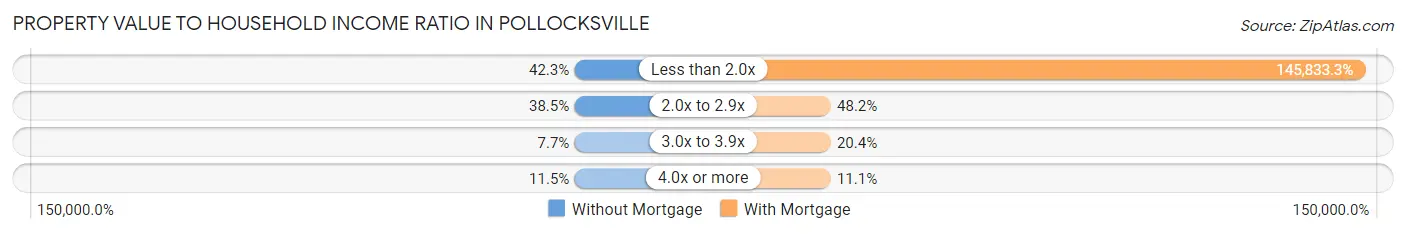
| Value-to-Income Ratio | Without Mortgage | With Mortgage |
| Less than 2.0x | 11 (42.3%) | 78,750 (145,833.3%) |
| 2.0x to 2.9x | 10 (38.5%) | 26 (48.1%) |
| 3.0x to 3.9x | 2 (7.7%) | 11 (20.4%) |
| 4.0x or more | 3 (11.5%) | 6 (11.1%) |
| Total | 26 (100.0%) | 54 (100.0%) |
Real Estate Taxes by Mortgage Status in Pollocksville
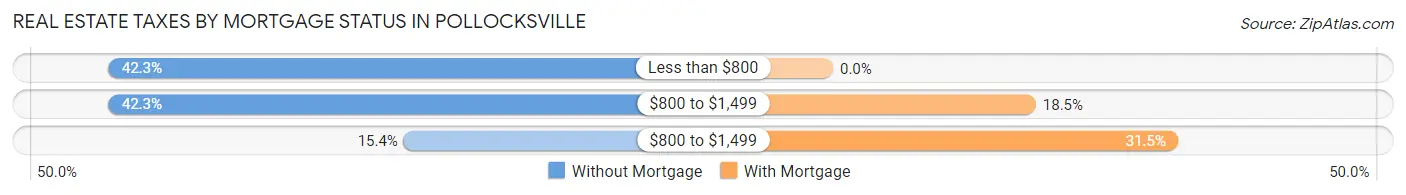
| Property Taxes | Without Mortgage | With Mortgage |
| Less than $800 | 11 (42.3%) | 0 (0.0%) |
| $800 to $1,499 | 11 (42.3%) | 10 (18.5%) |
| $800 to $1,499 | 4 (15.4%) | 17 (31.5%) |
| Total | 26 (100.0%) | 54 (100.0%) |
Health & Disability in Pollocksville
Health Insurance Coverage by Age in Pollocksville
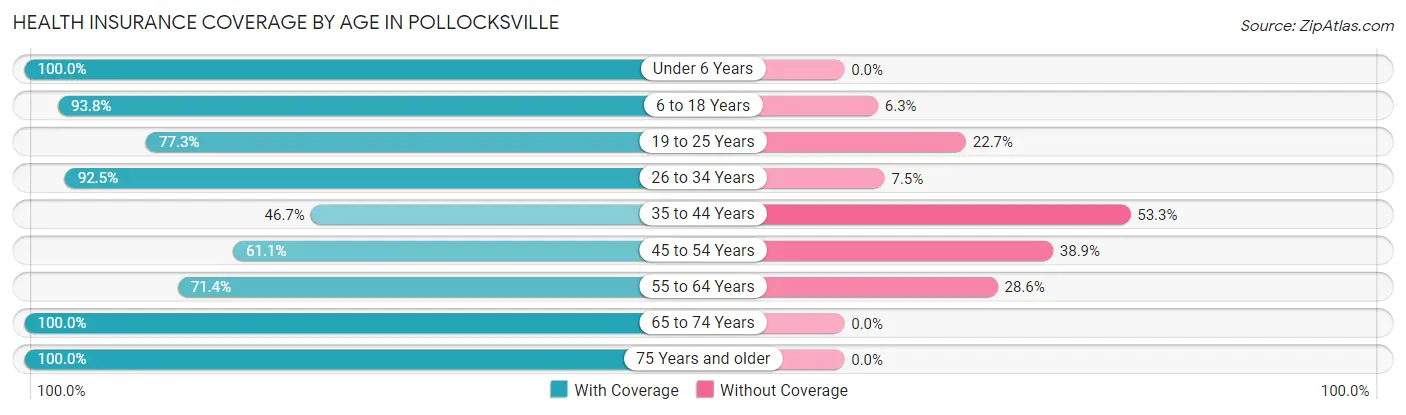
| Age Bracket | With Coverage | Without Coverage |
| Under 6 Years | 38 (100.0%) | 0 (0.0%) |
| 6 to 18 Years | 45 (93.8%) | 3 (6.2%) |
| 19 to 25 Years | 58 (77.3%) | 17 (22.7%) |
| 26 to 34 Years | 37 (92.5%) | 3 (7.5%) |
| 35 to 44 Years | 14 (46.7%) | 16 (53.3%) |
| 45 to 54 Years | 11 (61.1%) | 7 (38.9%) |
| 55 to 64 Years | 20 (71.4%) | 8 (28.6%) |
| 65 to 74 Years | 46 (100.0%) | 0 (0.0%) |
| 75 Years and older | 19 (100.0%) | 0 (0.0%) |
| Total | 288 (84.2%) | 54 (15.8%) |
Health Insurance Coverage by Citizenship Status in Pollocksville
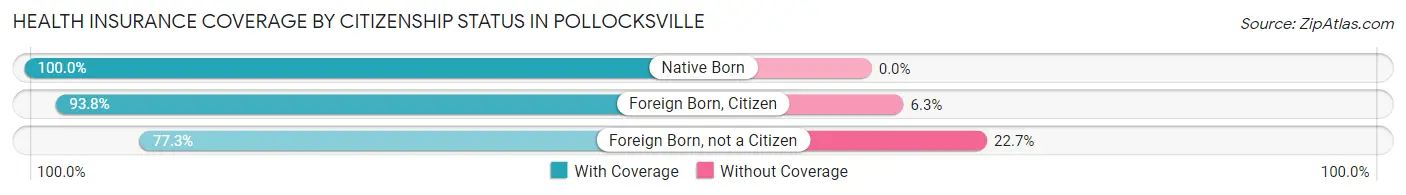
| Citizenship Status | With Coverage | Without Coverage |
| Native Born | 38 (100.0%) | 0 (0.0%) |
| Foreign Born, Citizen | 45 (93.8%) | 3 (6.2%) |
| Foreign Born, not a Citizen | 58 (77.3%) | 17 (22.7%) |
Health Insurance Coverage by Household Income in Pollocksville
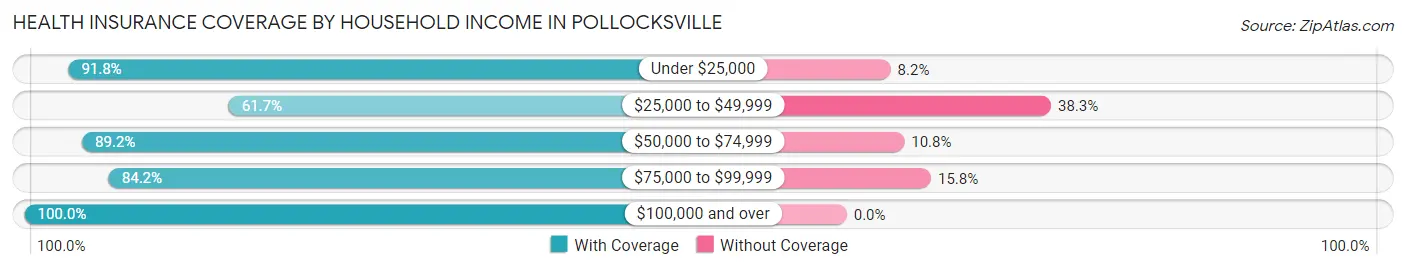
| Household Income | With Coverage | Without Coverage |
| Under $25,000 | 67 (91.8%) | 6 (8.2%) |
| $25,000 to $49,999 | 50 (61.7%) | 31 (38.3%) |
| $50,000 to $74,999 | 91 (89.2%) | 11 (10.8%) |
| $75,000 to $99,999 | 32 (84.2%) | 6 (15.8%) |
| $100,000 and over | 48 (100.0%) | 0 (0.0%) |
Public vs Private Health Insurance Coverage by Age in Pollocksville
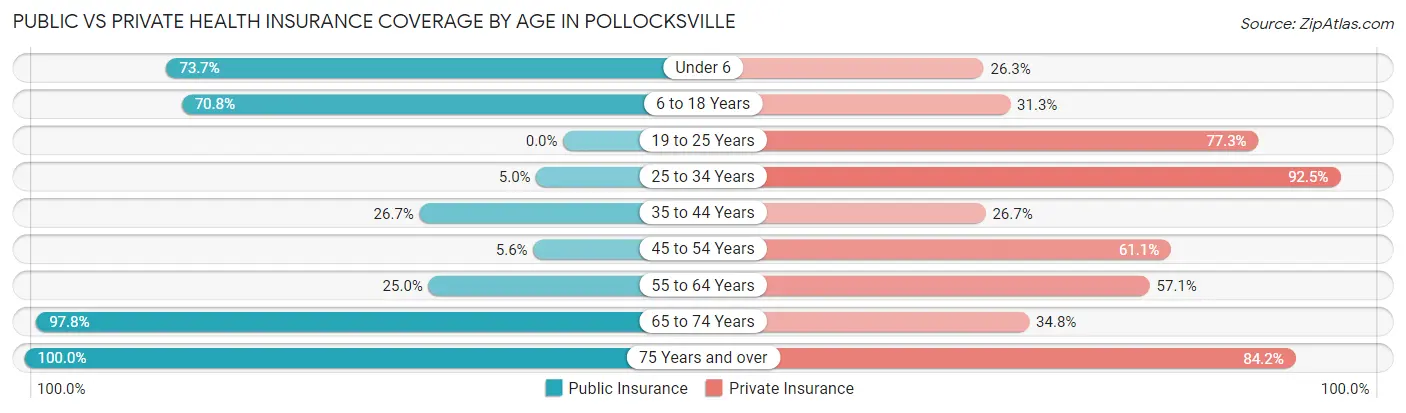
| Age Bracket | Public Insurance | Private Insurance |
| Under 6 | 28 (73.7%) | 10 (26.3%) |
| 6 to 18 Years | 34 (70.8%) | 15 (31.2%) |
| 19 to 25 Years | 0 (0.0%) | 58 (77.3%) |
| 25 to 34 Years | 2 (5.0%) | 37 (92.5%) |
| 35 to 44 Years | 8 (26.7%) | 8 (26.7%) |
| 45 to 54 Years | 1 (5.6%) | 11 (61.1%) |
| 55 to 64 Years | 7 (25.0%) | 16 (57.1%) |
| 65 to 74 Years | 45 (97.8%) | 16 (34.8%) |
| 75 Years and over | 19 (100.0%) | 16 (84.2%) |
| Total | 144 (42.1%) | 187 (54.7%) |
Disability Status by Sex by Age in Pollocksville
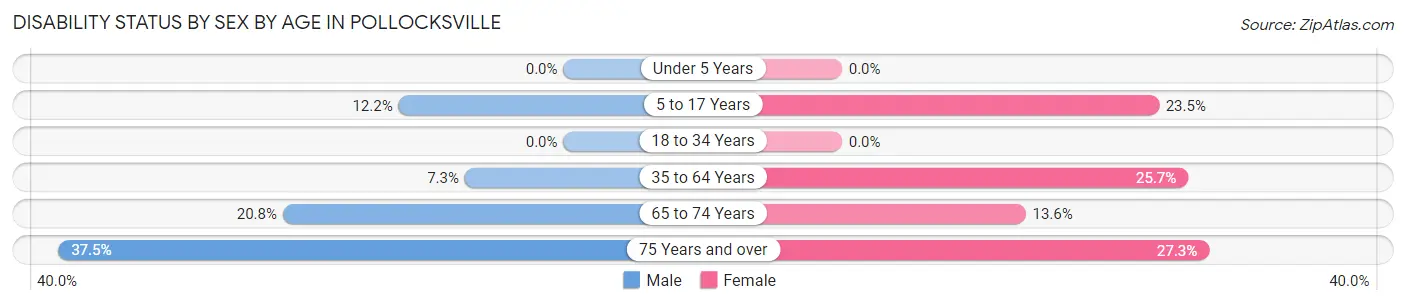
| Age Bracket | Male | Female |
| Under 5 Years | 0 (0.0%) | 0 (0.0%) |
| 5 to 17 Years | 6 (12.2%) | 4 (23.5%) |
| 18 to 34 Years | 0 (0.0%) | 0 (0.0%) |
| 35 to 64 Years | 3 (7.3%) | 9 (25.7%) |
| 65 to 74 Years | 5 (20.8%) | 3 (13.6%) |
| 75 Years and over | 3 (37.5%) | 3 (27.3%) |
Disability Class by Sex by Age in Pollocksville
Disability Class: Hearing Difficulty
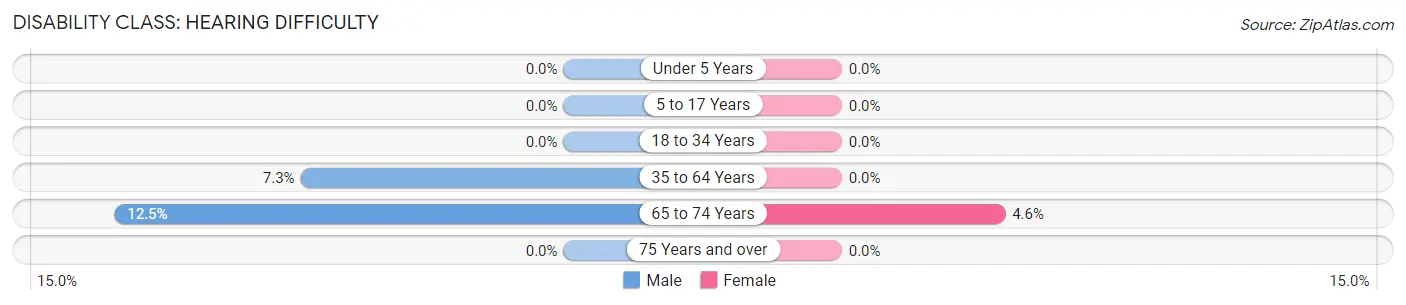
| Age Bracket | Male | Female |
| Under 5 Years | 0 (0.0%) | 0 (0.0%) |
| 5 to 17 Years | 0 (0.0%) | 0 (0.0%) |
| 18 to 34 Years | 0 (0.0%) | 0 (0.0%) |
| 35 to 64 Years | 3 (7.3%) | 0 (0.0%) |
| 65 to 74 Years | 3 (12.5%) | 1 (4.5%) |
| 75 Years and over | 0 (0.0%) | 0 (0.0%) |
Disability Class: Vision Difficulty
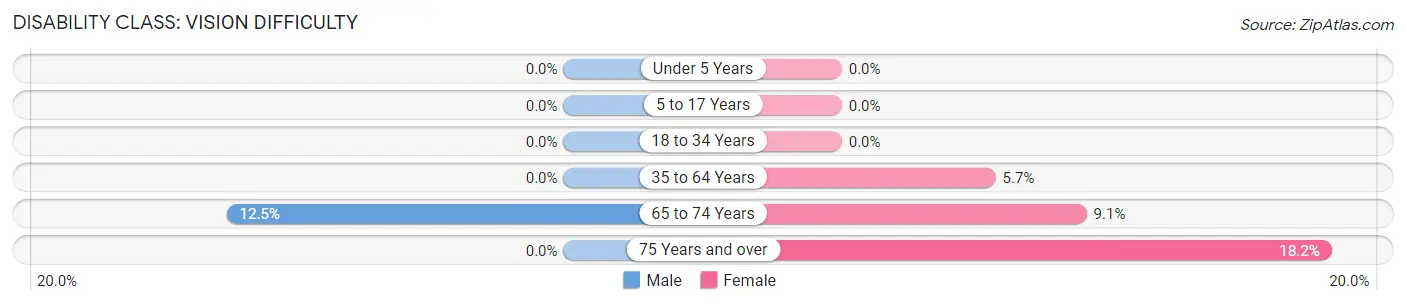
| Age Bracket | Male | Female |
| Under 5 Years | 0 (0.0%) | 0 (0.0%) |
| 5 to 17 Years | 0 (0.0%) | 0 (0.0%) |
| 18 to 34 Years | 0 (0.0%) | 0 (0.0%) |
| 35 to 64 Years | 0 (0.0%) | 2 (5.7%) |
| 65 to 74 Years | 3 (12.5%) | 2 (9.1%) |
| 75 Years and over | 0 (0.0%) | 2 (18.2%) |
Disability Class: Cognitive Difficulty
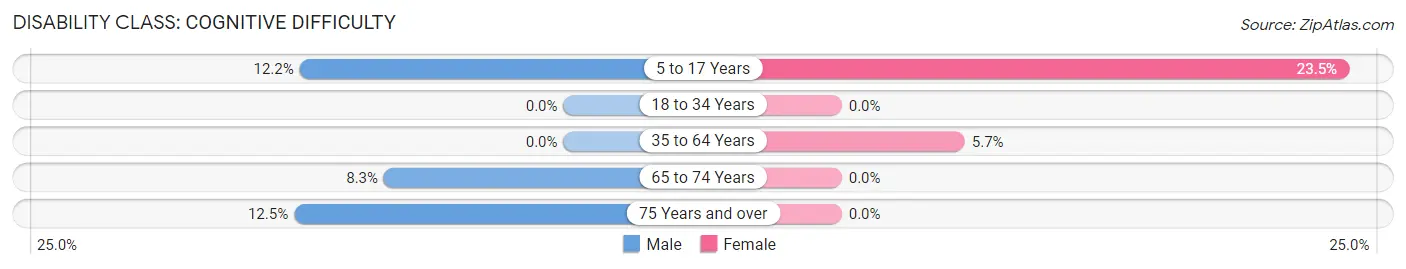
| Age Bracket | Male | Female |
| 5 to 17 Years | 6 (12.2%) | 4 (23.5%) |
| 18 to 34 Years | 0 (0.0%) | 0 (0.0%) |
| 35 to 64 Years | 0 (0.0%) | 2 (5.7%) |
| 65 to 74 Years | 2 (8.3%) | 0 (0.0%) |
| 75 Years and over | 1 (12.5%) | 0 (0.0%) |
Disability Class: Ambulatory Difficulty
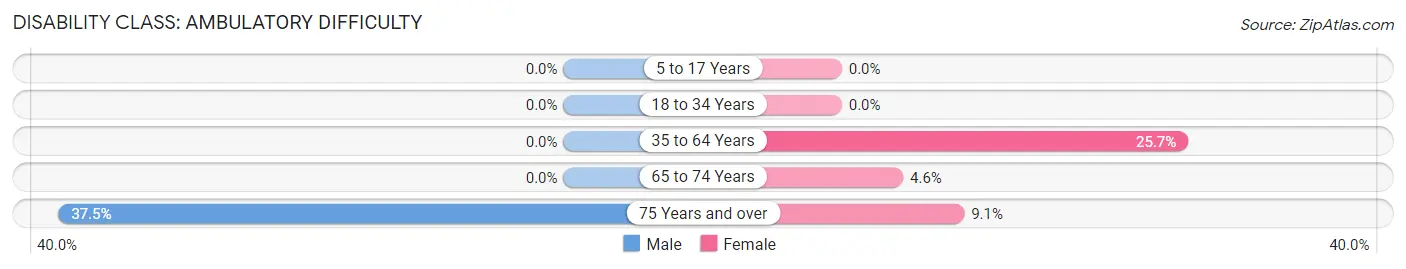
| Age Bracket | Male | Female |
| 5 to 17 Years | 0 (0.0%) | 0 (0.0%) |
| 18 to 34 Years | 0 (0.0%) | 0 (0.0%) |
| 35 to 64 Years | 0 (0.0%) | 9 (25.7%) |
| 65 to 74 Years | 0 (0.0%) | 1 (4.5%) |
| 75 Years and over | 3 (37.5%) | 1 (9.1%) |
Disability Class: Self-Care Difficulty
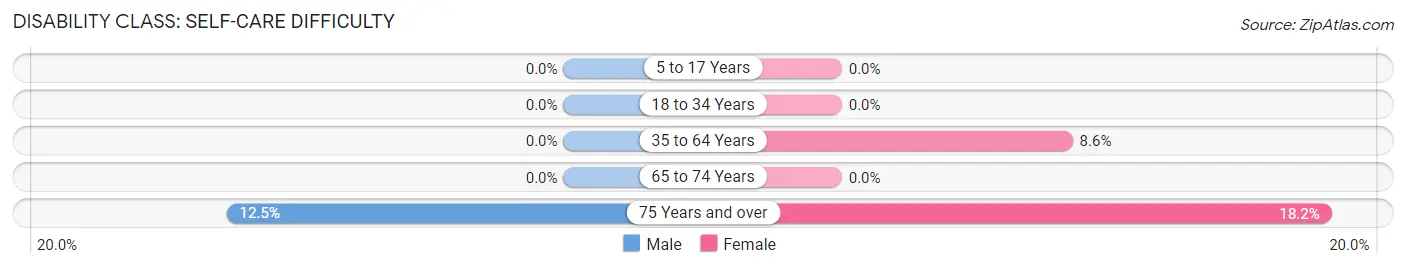
| Age Bracket | Male | Female |
| 5 to 17 Years | 0 (0.0%) | 0 (0.0%) |
| 18 to 34 Years | 0 (0.0%) | 0 (0.0%) |
| 35 to 64 Years | 0 (0.0%) | 3 (8.6%) |
| 65 to 74 Years | 0 (0.0%) | 0 (0.0%) |
| 75 Years and over | 1 (12.5%) | 2 (18.2%) |
Technology Access in Pollocksville
Computing Device Access in Pollocksville
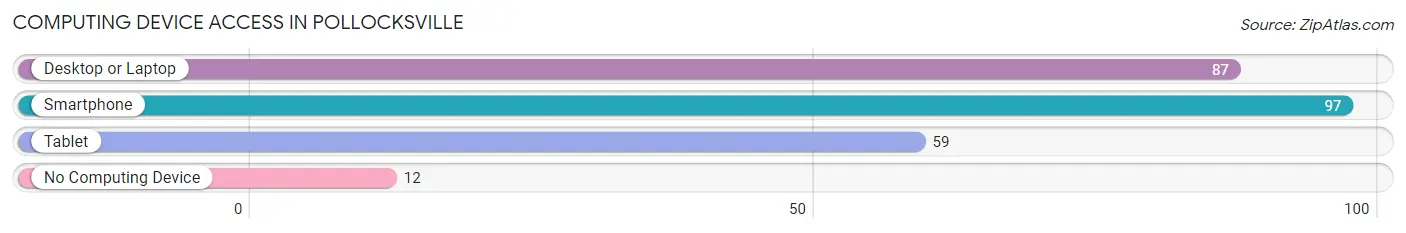
| Device Type | # Households | % Households |
| Desktop or Laptop | 87 | 76.3% |
| Smartphone | 97 | 85.1% |
| Tablet | 59 | 51.7% |
| No Computing Device | 12 | 10.5% |
| Total | 114 | 100.0% |
Internet Access in Pollocksville
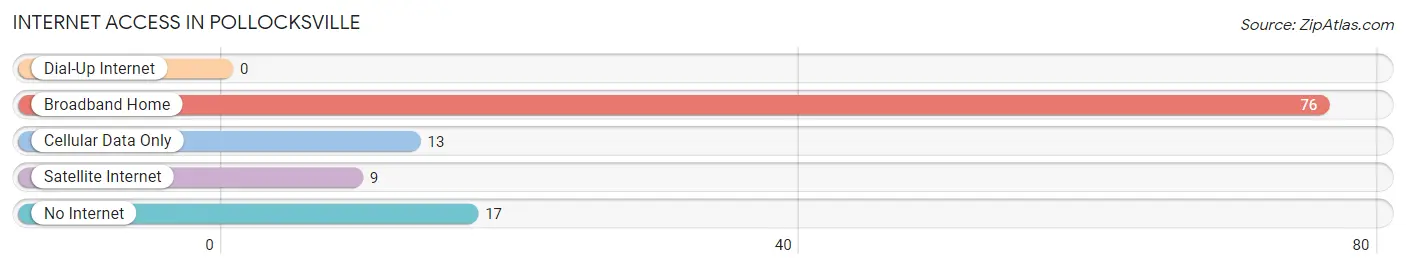
| Internet Type | # Households | % Households |
| Dial-Up Internet | 0 | 0.0% |
| Broadband Home | 76 | 66.7% |
| Cellular Data Only | 13 | 11.4% |
| Satellite Internet | 9 | 7.9% |
| No Internet | 17 | 14.9% |
| Total | 114 | 100.0% |
Pollocksville Summary
History
The town of Pollocksville, North Carolina is located in Jones County, in the eastern part of the state. It is situated on the Trent River, and is the county seat of Jones County. The town was founded in 1790 by William Pollock, a Revolutionary War veteran, and was originally known as Pollock’s Crossroads. The town was officially incorporated in 1872, and the name was changed to Pollocksville.
The town was an important trading center in the 19th century, and was a major stop on the Wilmington and Weldon Railroad. The railroad was a major factor in the town’s growth, and it was also a major factor in the development of the local economy. The railroad allowed for the transportation of goods and services to and from the town, and it also allowed for the transportation of people.
The town was also an important stop on the Underground Railroad, and it was a safe haven for many African Americans who were escaping slavery. The town was also home to a number of prominent African American leaders, including the Reverend Henry Evans, who was a leader in the African Methodist Episcopal Church.
Geography
Pollocksville is located in Jones County, in the eastern part of North Carolina. It is situated on the Trent River, and is the county seat of Jones County. The town is located at an elevation of approximately 30 feet above sea level. The town is located in a rural area, and is surrounded by farmland and forests. The town is located approximately 30 miles from the Atlantic Ocean, and is approximately 50 miles from the state capital of Raleigh.
The climate in Pollocksville is humid subtropical, with hot, humid summers and mild winters. The average annual temperature is around 70 degrees Fahrenheit, and the average annual precipitation is around 45 inches.
Economy
The economy of Pollocksville is largely based on agriculture and forestry. The town is home to a number of farms, and the surrounding area is home to a number of timber companies. The town is also home to a number of small businesses, including restaurants, retail stores, and service providers.
The town is also home to a number of manufacturing companies, including a furniture factory and a paper mill. The town is also home to a number of government offices, including the Jones County Courthouse and the Jones County Sheriff’s Office.
Demographics
As of the 2010 census, the population of Pollocksville was 1,717. The population is predominantly white, with African Americans making up approximately 20% of the population. The median household income is approximately $35,000, and the median home value is approximately $90,000. The town has a poverty rate of approximately 20%, and the unemployment rate is approximately 8%.
Conclusion
Pollocksville, North Carolina is a small town located in Jones County, in the eastern part of the state. The town was founded in 1790, and was an important stop on the Underground Railroad. The town is largely rural, and is home to a number of farms and timber companies. The town is also home to a number of small businesses, and is home to a number of government offices. The population of Pollocksville is predominantly white, with African Americans making up approximately 20% of the population. The median household income is approximately $35,000, and the median home value is approximately $90,000. The town has a poverty rate of approximately 20%, and the unemployment rate is approximately 8%.
Common Questions
What is the Total Population of Pollocksville?
Total Population of Pollocksville is 342.
What is the Total Male Population of Pollocksville?
Total Male Population of Pollocksville is 158.
What is the Total Female Population of Pollocksville?
Total Female Population of Pollocksville is 184.
What is the Ratio of Males per 100 Females in Pollocksville?
There are 85.87 Males per 100 Females in Pollocksville.
What is the Ratio of Females per 100 Males in Pollocksville?
There are 116.46 Females per 100 Males in Pollocksville.
What is the Median Population Age in Pollocksville?
Median Population Age in Pollocksville is 30.2 Years.
What is the Average Family Size in Pollocksville
Average Family Size in Pollocksville is 3.9 People.
What is the Average Household Size in Pollocksville
Average Household Size in Pollocksville is 3.0 People.
What is Per Capita Income in Pollocksville?
Per Capita income in Pollocksville is $20,994.
What is the Median Family Income in Pollocksville?
Median Family Income in Pollocksville is $60,694.
What is the Median Household income in Pollocksville?
Median Household Income in Pollocksville is $44,615.
What is Inequality or Gini Index in Pollocksville?
Inequality or Gini Index in Pollocksville is 0.43.
How Large is the Labor Force in Pollocksville?
There are 185 People in the Labor Forcein in Pollocksville.
What is the Percentage of People in the Labor Force in Pollocksville?
66.8% of People are in the Labor Force in Pollocksville.
What is the Unemployment Rate in Pollocksville?
Unemployment Rate in Pollocksville is 3.8%.