Brogden, NC
Brogden Map
Brogden Overview
2,744
TOTAL POPULATION
1,512
MALE POPULATION
1,232
FEMALE POPULATION
122.73
MALES / 100 FEMALES
81.48
FEMALES / 100 MALES
33.8
MEDIAN AGE
3.0
AVG FAMILY SIZE
2.6
AVG HOUSEHOLD SIZE
$17,501
PER CAPITA INCOME
$50,508
AVG FAMILY INCOME
$32,132
AVG HOUSEHOLD INCOME
0.38
INEQUALITY / GINI INDEX
1,164
LABOR FORCE [ PEOPLE ]
54.9%
PERCENT IN LABOR FORCE
10.5%
UNEMPLOYMENT RATE
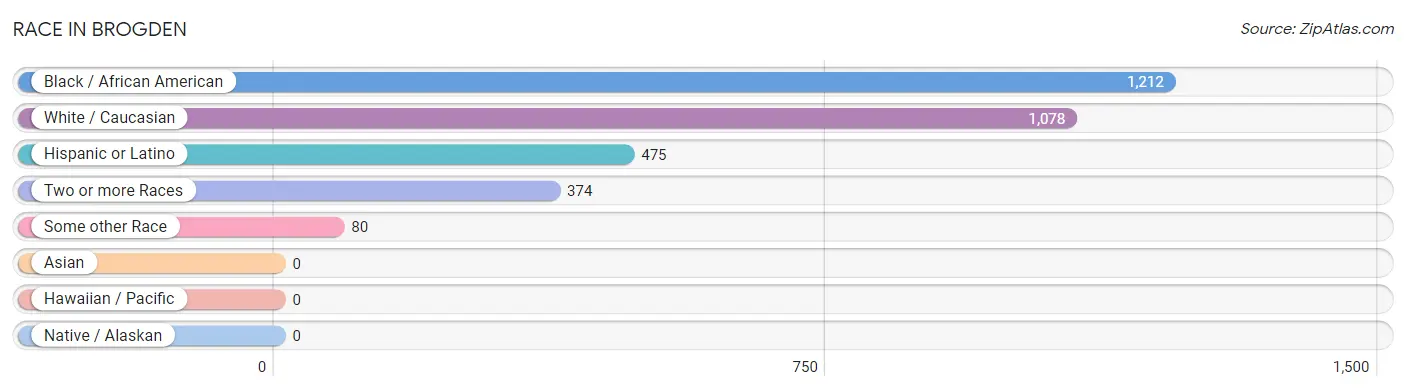
Race in Brogden
The most populous races in Brogden are Black / African American (1,212 | 44.2%), White / Caucasian (1,078 | 39.3%), and Hispanic or Latino (475 | 17.3%).
| Race | # Population | % Population |
| Asian | 0 | 0.0% |
| Black / African American | 1,212 | 44.2% |
| Hawaiian / Pacific | 0 | 0.0% |
| Hispanic or Latino | 475 | 17.3% |
| Native / Alaskan | 0 | 0.0% |
| White / Caucasian | 1,078 | 39.3% |
| Two or more Races | 374 | 13.6% |
| Some other Race | 80 | 2.9% |
| Total | 2,744 | 100.0% |
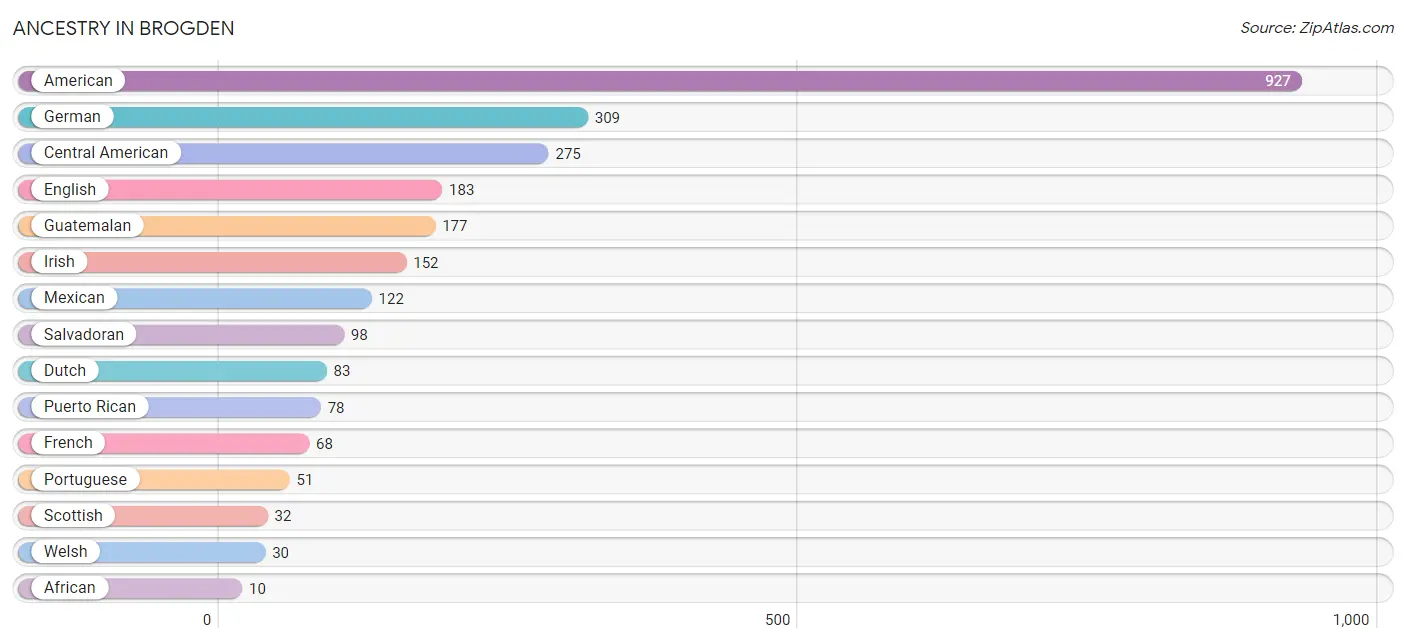
Ancestry in Brogden
The most populous ancestries reported in Brogden are American (927 | 33.8%), German (309 | 11.3%), Central American (275 | 10.0%), English (183 | 6.7%), and Guatemalan (177 | 6.5%), together accounting for 68.2% of all Brogden residents.
| Ancestry | # Population | % Population |
| African | 10 | 0.4% |
| American | 927 | 33.8% |
| Celtic | 9 | 0.3% |
| Central American | 275 | 10.0% |
| Dutch | 83 | 3.0% |
| English | 183 | 6.7% |
| French | 68 | 2.5% |
| German | 309 | 11.3% |
| Guatemalan | 177 | 6.5% |
| Irish | 152 | 5.5% |
| Italian | 9 | 0.3% |
| Mexican | 122 | 4.4% |
| Portuguese | 51 | 1.9% |
| Puerto Rican | 78 | 2.8% |
| Salvadoran | 98 | 3.6% |
| Scottish | 32 | 1.2% |
| Subsaharan African | 10 | 0.4% |
| Welsh | 30 | 1.1% | View All 18 Rows |
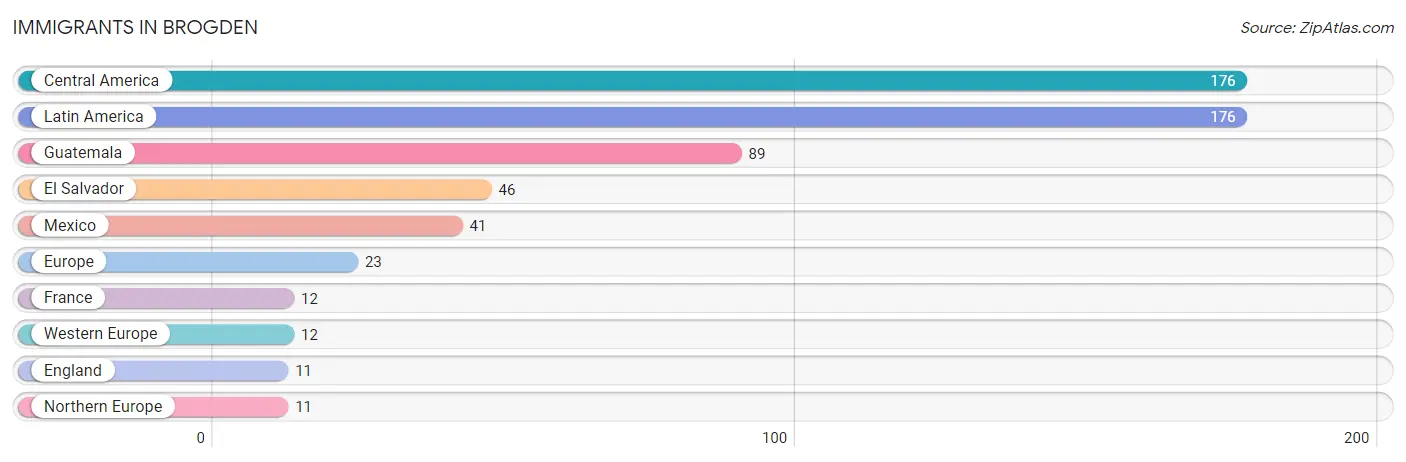
Immigrants in Brogden
The most numerous immigrant groups reported in Brogden came from Central America (176 | 6.4%), Latin America (176 | 6.4%), Guatemala (89 | 3.2%), El Salvador (46 | 1.7%), and Mexico (41 | 1.5%), together accounting for 19.2% of all Brogden residents.
| Immigration Origin | # Population | % Population |
| Central America | 176 | 6.4% |
| El Salvador | 46 | 1.7% |
| England | 11 | 0.4% |
| Europe | 23 | 0.8% |
| France | 12 | 0.4% |
| Guatemala | 89 | 3.2% |
| Latin America | 176 | 6.4% |
| Mexico | 41 | 1.5% |
| Northern Europe | 11 | 0.4% |
| Western Europe | 12 | 0.4% | View All 10 Rows |
Sex and Age in Brogden
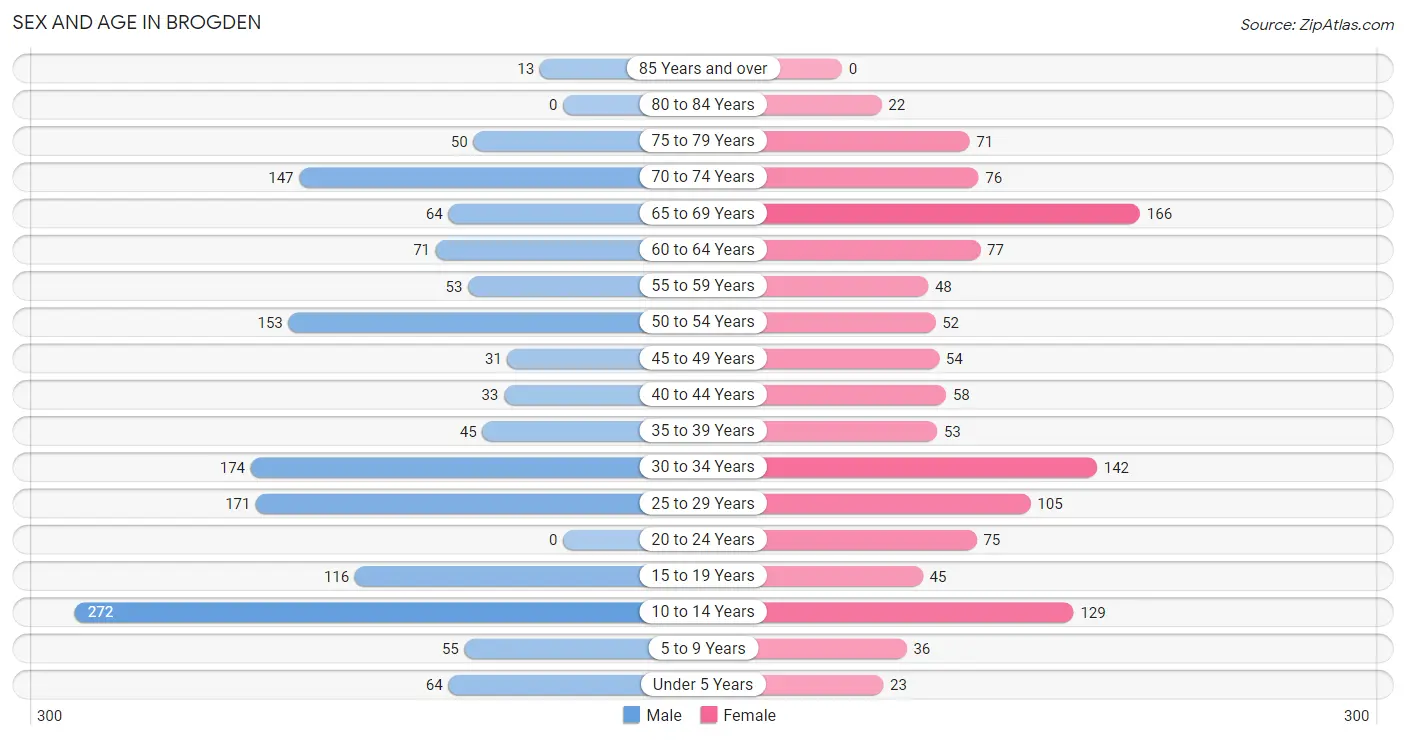
Sex and Age in Brogden
The most populous age groups in Brogden are 10 to 14 Years (272 | 18.0%) for men and 65 to 69 Years (166 | 13.5%) for women.
| Age Bracket | Male | Female |
| Under 5 Years | 64 (4.2%) | 23 (1.9%) |
| 5 to 9 Years | 55 (3.6%) | 36 (2.9%) |
| 10 to 14 Years | 272 (18.0%) | 129 (10.5%) |
| 15 to 19 Years | 116 (7.7%) | 45 (3.6%) |
| 20 to 24 Years | 0 (0.0%) | 75 (6.1%) |
| 25 to 29 Years | 171 (11.3%) | 105 (8.5%) |
| 30 to 34 Years | 174 (11.5%) | 142 (11.5%) |
| 35 to 39 Years | 45 (3.0%) | 53 (4.3%) |
| 40 to 44 Years | 33 (2.2%) | 58 (4.7%) |
| 45 to 49 Years | 31 (2.1%) | 54 (4.4%) |
| 50 to 54 Years | 153 (10.1%) | 52 (4.2%) |
| 55 to 59 Years | 53 (3.5%) | 48 (3.9%) |
| 60 to 64 Years | 71 (4.7%) | 77 (6.2%) |
| 65 to 69 Years | 64 (4.2%) | 166 (13.5%) |
| 70 to 74 Years | 147 (9.7%) | 76 (6.2%) |
| 75 to 79 Years | 50 (3.3%) | 71 (5.8%) |
| 80 to 84 Years | 0 (0.0%) | 22 (1.8%) |
| 85 Years and over | 13 (0.9%) | 0 (0.0%) |
| Total | 1,512 (100.0%) | 1,232 (100.0%) |
Families and Households in Brogden
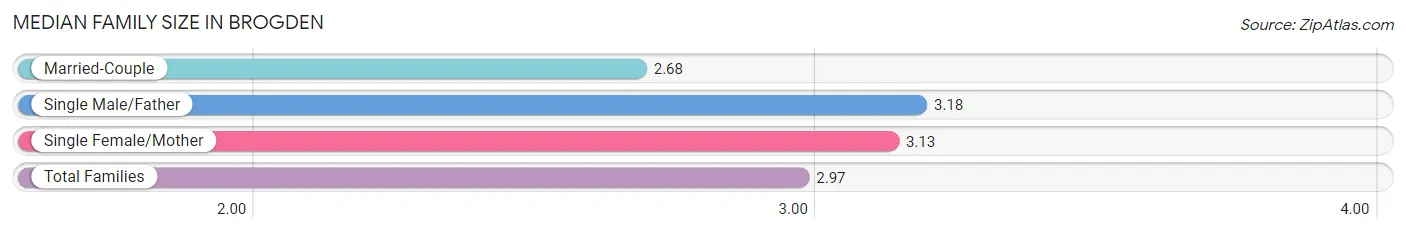
Median Family Size in Brogden
The median family size in Brogden is 2.97 persons per family, with single male/father families (183 | 23.9%) accounting for the largest median family size of 3.18 persons per family. On the other hand, married-couple families (292 | 38.2%) represent the smallest median family size with 2.68 persons per family.
| Family Type | # Families | Family Size |
| Married-Couple | 292 (38.2%) | 2.68 |
| Single Male/Father | 183 (23.9%) | 3.18 |
| Single Female/Mother | 289 (37.8%) | 3.13 |
| Total Families | 764 (100.0%) | 2.97 |
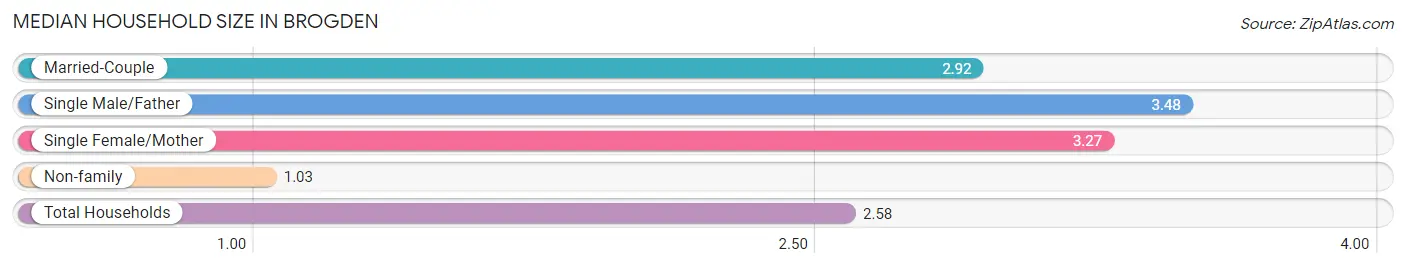
Median Household Size in Brogden
The median household size in Brogden is 2.58 persons per household, with single male/father households (183 | 17.2%) accounting for the largest median household size of 3.48 persons per household. non-family households (298 | 28.1%) represent the smallest median household size with 1.03 persons per household.
| Household Type | # Households | Household Size |
| Married-Couple | 292 (27.5%) | 2.92 |
| Single Male/Father | 183 (17.2%) | 3.48 |
| Single Female/Mother | 289 (27.2%) | 3.27 |
| Non-family | 298 (28.1%) | 1.03 |
| Total Households | 1,062 (100.0%) | 2.58 |
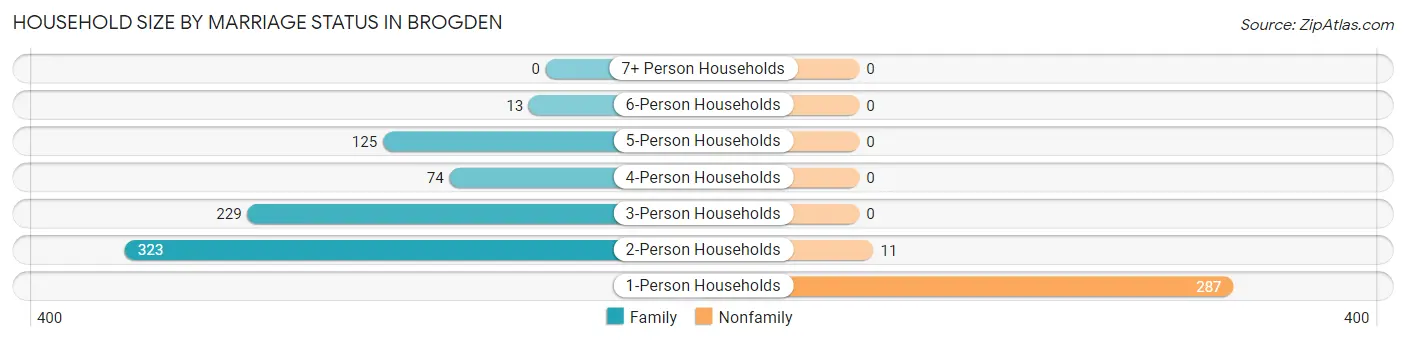
Household Size by Marriage Status in Brogden
Out of a total of 1,062 households in Brogden, 764 (71.9%) are family households, while 298 (28.1%) are nonfamily households. The most numerous type of family households are 2-person households, comprising 323, and the most common type of nonfamily households are 1-person households, comprising 287.
| Household Size | Family Households | Nonfamily Households |
| 1-Person Households | - | 287 (27.0%) |
| 2-Person Households | 323 (30.4%) | 11 (1.0%) |
| 3-Person Households | 229 (21.6%) | 0 (0.0%) |
| 4-Person Households | 74 (7.0%) | 0 (0.0%) |
| 5-Person Households | 125 (11.8%) | 0 (0.0%) |
| 6-Person Households | 13 (1.2%) | 0 (0.0%) |
| 7+ Person Households | 0 (0.0%) | 0 (0.0%) |
| Total | 764 (71.9%) | 298 (28.1%) |
Female Fertility in Brogden
Fertility by Age in Brogden
Average fertility rate in Brogden is 135.0 births per 1,000 women. Women in the age bracket of 20 to 34 years have the highest fertility rate with 224.0 births per 1,000 women. Women in the age bracket of 20 to 34 years acount for 100.0% of all women with births.
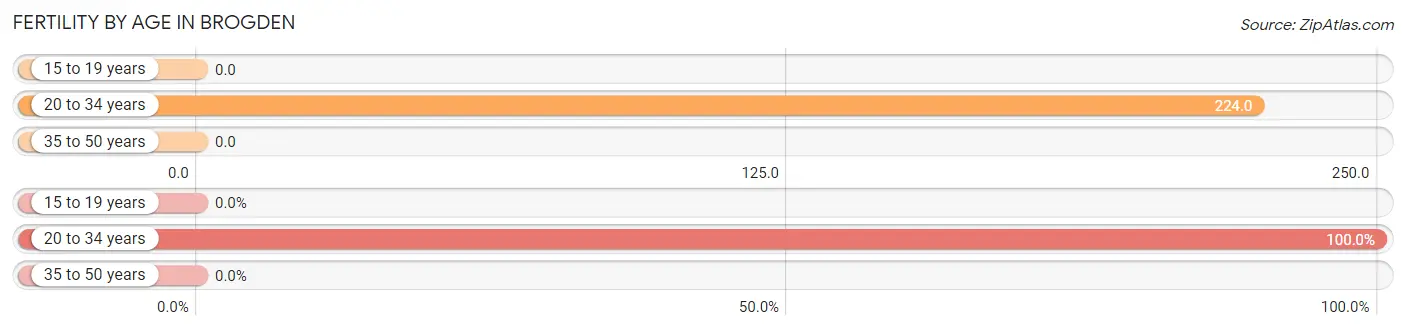
| Age Bracket | Women with Births | Births / 1,000 Women |
| 15 to 19 years | 0 (0.0%) | 0.0 |
| 20 to 34 years | 72 (100.0%) | 224.0 |
| 35 to 50 years | 0 (0.0%) | 0.0 |
| Total | 72 (100.0%) | 135.0 |
Fertility by Age by Marriage Status in Brogden
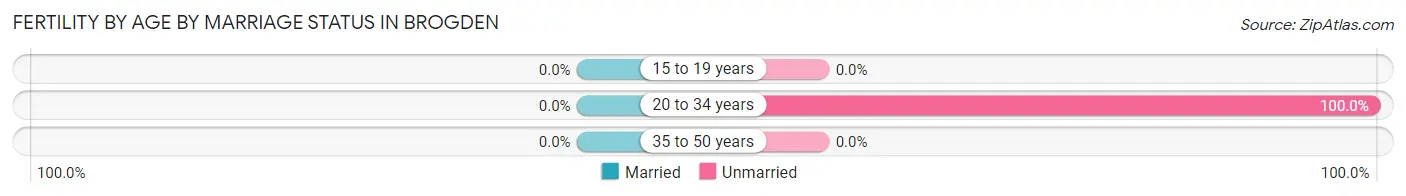
| Age Bracket | Married | Unmarried |
| 15 to 19 years | 0 (0.0%) | 0 (0.0%) |
| 20 to 34 years | 0 (0.0%) | 72 (100.0%) |
| 35 to 50 years | 0 (0.0%) | 0 (0.0%) |
| Total | 0 (0.0%) | 72 (100.0%) |
Fertility by Education in Brogden
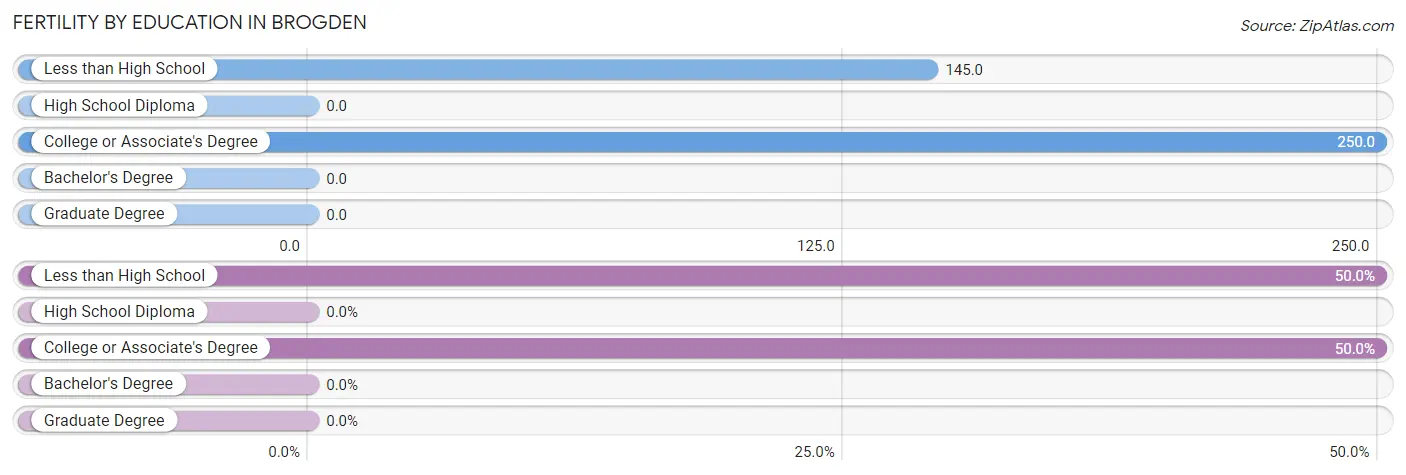
| Educational Attainment | Women with Births | Births / 1,000 Women |
| Less than High School | 36 (50.0%) | 145.0 |
| High School Diploma | 0 (0.0%) | 0.0 |
| College or Associate's Degree | 36 (50.0%) | 250.0 |
| Bachelor's Degree | 0 (0.0%) | 0.0 |
| Graduate Degree | 0 (0.0%) | 0.0 |
| Total | 72 (100.0%) | 135.0 |
Fertility by Education by Marriage Status in Brogden
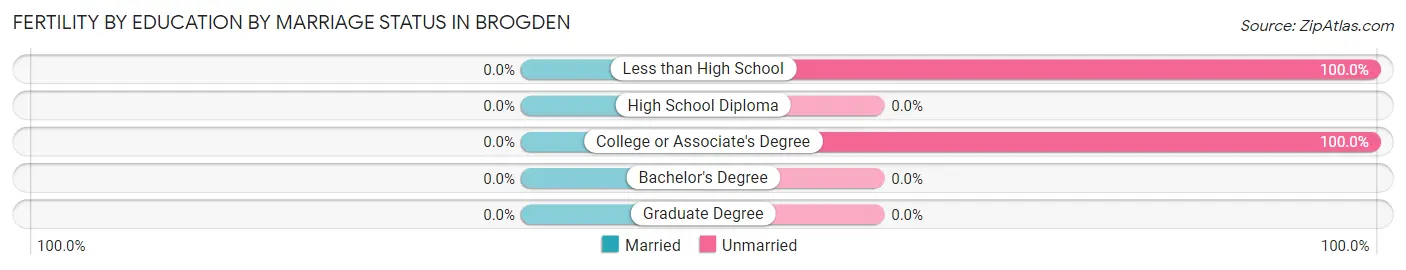
| Educational Attainment | Married | Unmarried |
| Less than High School | 0 (0.0%) | 36 (100.0%) |
| High School Diploma | 0 (0.0%) | 0 (0.0%) |
| College or Associate's Degree | 0 (0.0%) | 36 (100.0%) |
| Bachelor's Degree | 0 (0.0%) | 0 (0.0%) |
| Graduate Degree | 0 (0.0%) | 0 (0.0%) |
| Total | 0 (0.0%) | 72 (100.0%) |
Income in Brogden
Income Overview in Brogden
Per Capita Income in Brogden is $17,501, while median incomes of families and households are $50,508 and $32,132 respectively.
| Characteristic | Number | Measure |
| Per Capita Income | 2,744 | $17,501 |
| Median Family Income | 764 | $50,508 |
| Mean Family Income | 764 | $48,122 |
| Median Household Income | 1,062 | $32,132 |
| Mean Household Income | 1,062 | $43,200 |
| Income Deficit | 764 | $0 |
| Wage / Income Gap (%) | 2,744 | 0.00% |
| Wage / Income Gap ($) | 2,744 | 100.00¢ per $1 |
| Gini / Inequality Index | 2,744 | 0.38 |
Earnings by Sex in Brogden
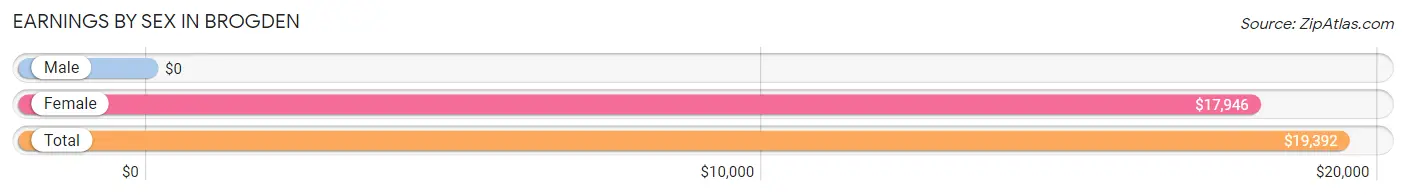
| Sex | Number | Average Earnings |
| Male | 632 (55.1%) | $0 |
| Female | 514 (44.9%) | $17,946 |
| Total | 1,146 (100.0%) | $19,392 |
Earnings by Sex by Income Bracket in Brogden
The most common earnings brackets in Brogden are $17,500 to $19,999 for men (167 | 26.4%) and $17,500 to $19,999 for women (84 | 16.3%).
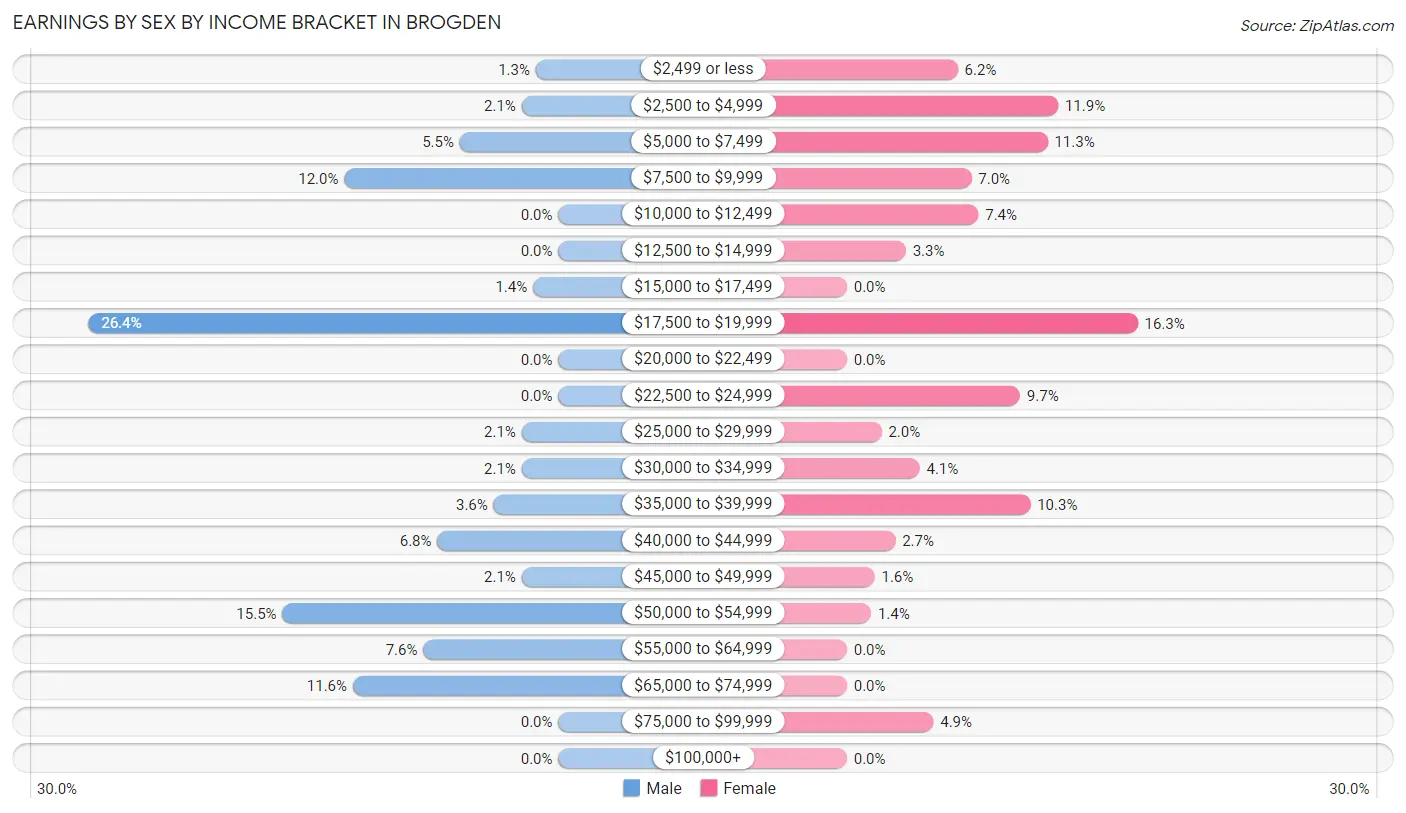
| Income | Male | Female |
| $2,499 or less | 8 (1.3%) | 32 (6.2%) |
| $2,500 to $4,999 | 13 (2.1%) | 61 (11.9%) |
| $5,000 to $7,499 | 35 (5.5%) | 58 (11.3%) |
| $7,500 to $9,999 | 76 (12.0%) | 36 (7.0%) |
| $10,000 to $12,499 | 0 (0.0%) | 38 (7.4%) |
| $12,500 to $14,999 | 0 (0.0%) | 17 (3.3%) |
| $15,000 to $17,499 | 9 (1.4%) | 0 (0.0%) |
| $17,500 to $19,999 | 167 (26.4%) | 84 (16.3%) |
| $20,000 to $22,499 | 0 (0.0%) | 0 (0.0%) |
| $22,500 to $24,999 | 0 (0.0%) | 50 (9.7%) |
| $25,000 to $29,999 | 13 (2.1%) | 10 (1.9%) |
| $30,000 to $34,999 | 13 (2.1%) | 21 (4.1%) |
| $35,000 to $39,999 | 23 (3.6%) | 53 (10.3%) |
| $40,000 to $44,999 | 43 (6.8%) | 14 (2.7%) |
| $45,000 to $49,999 | 13 (2.1%) | 8 (1.6%) |
| $50,000 to $54,999 | 98 (15.5%) | 7 (1.4%) |
| $55,000 to $64,999 | 48 (7.6%) | 0 (0.0%) |
| $65,000 to $74,999 | 73 (11.6%) | 0 (0.0%) |
| $75,000 to $99,999 | 0 (0.0%) | 25 (4.9%) |
| $100,000+ | 0 (0.0%) | 0 (0.0%) |
| Total | 632 (100.0%) | 514 (100.0%) |
Earnings by Sex by Educational Attainment in Brogden
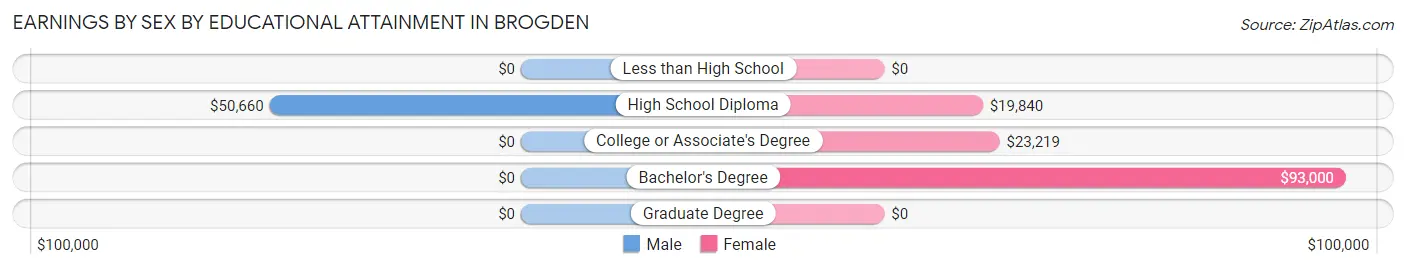
| Educational Attainment | Male Income | Female Income |
| Less than High School | - | - |
| High School Diploma | $50,660 | $19,840 |
| College or Associate's Degree | - | - |
| Bachelor's Degree | - | - |
| Graduate Degree | - | - |
| Total | - | - |
Family Income in Brogden
Family Income Brackets in Brogden
According to the Brogden family income data, there are 271 families falling into the $50,000 to $74,999 income range, which is the most common income bracket and makes up 35.5% of all families.
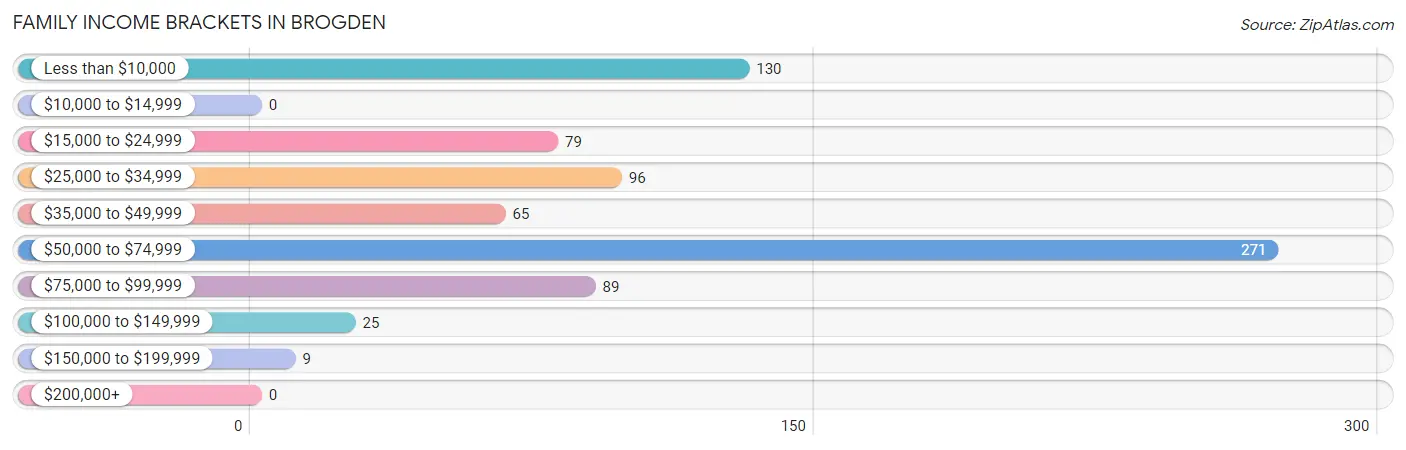
| Income Bracket | # Families | % Families |
| Less than $10,000 | 130 | 17.0% |
| $10,000 to $14,999 | 0 | 0.0% |
| $15,000 to $24,999 | 79 | 10.3% |
| $25,000 to $34,999 | 96 | 12.6% |
| $35,000 to $49,999 | 65 | 8.5% |
| $50,000 to $74,999 | 271 | 35.5% |
| $75,000 to $99,999 | 89 | 11.6% |
| $100,000 to $149,999 | 25 | 3.3% |
| $150,000 to $199,999 | 9 | 1.2% |
| $200,000+ | 0 | 0.0% |
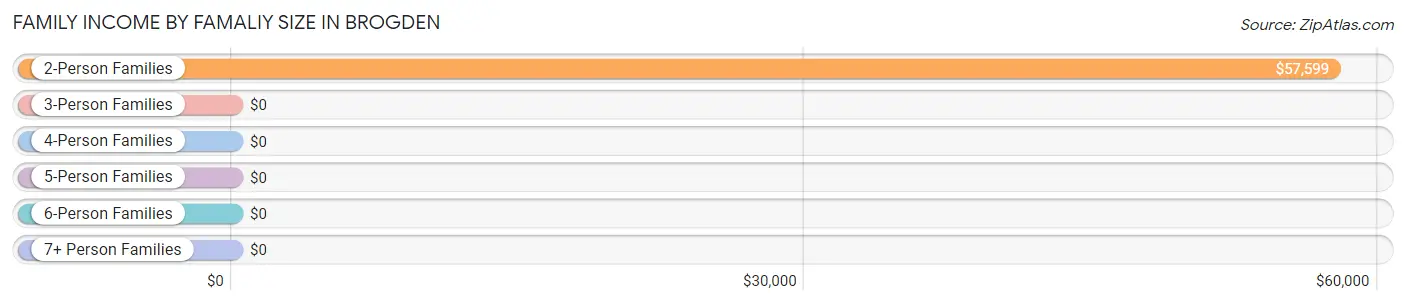
Family Income by Famaliy Size in Brogden
2-person families (375 | 49.1%) account for the highest median family income in Brogden with $57,599 per family, while 2-person families (375 | 49.1%) have the highest median income of $28,800 per family member.
| Income Bracket | # Families | Median Income |
| 2-Person Families | 375 (49.1%) | $57,599 |
| 3-Person Families | 220 (28.8%) | $0 |
| 4-Person Families | 87 (11.4%) | $0 |
| 5-Person Families | 82 (10.7%) | $0 |
| 6-Person Families | 0 (0.0%) | $0 |
| 7+ Person Families | 0 (0.0%) | $0 |
| Total | 764 (100.0%) | $50,508 |
Family Income by Number of Earners in Brogden
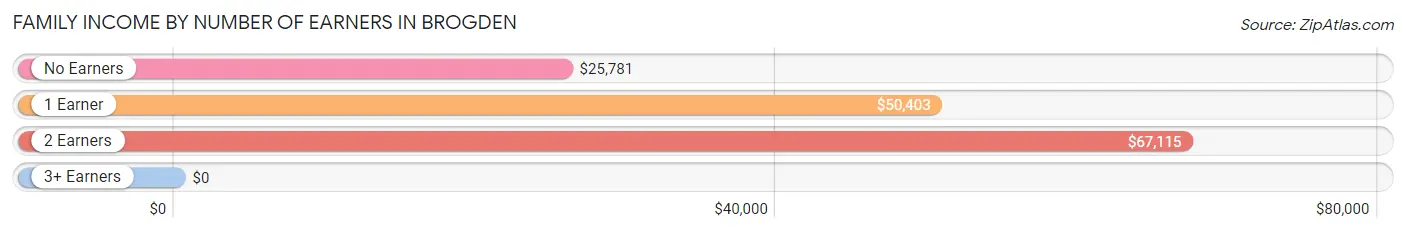
| Number of Earners | # Families | Median Income |
| No Earners | 178 (23.3%) | $25,781 |
| 1 Earner | 401 (52.5%) | $50,403 |
| 2 Earners | 154 (20.2%) | $67,115 |
| 3+ Earners | 31 (4.1%) | $0 |
| Total | 764 (100.0%) | $50,508 |
Household Income in Brogden
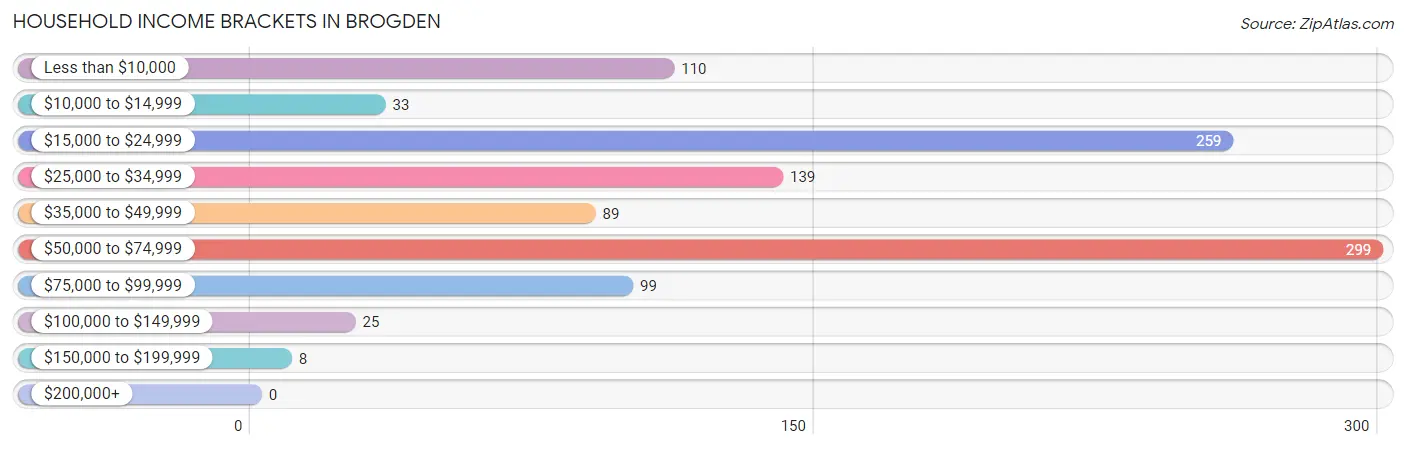
Household Income Brackets in Brogden
With 299 households falling in the category, the $50,000 to $74,999 income range is the most frequent in Brogden, accounting for 28.1% of all households.
| Income Bracket | # Households | % Households |
| Less than $10,000 | 110 | 10.4% |
| $10,000 to $14,999 | 33 | 3.1% |
| $15,000 to $24,999 | 259 | 24.4% |
| $25,000 to $34,999 | 139 | 13.1% |
| $35,000 to $49,999 | 89 | 8.4% |
| $50,000 to $74,999 | 299 | 28.2% |
| $75,000 to $99,999 | 99 | 9.3% |
| $100,000 to $149,999 | 25 | 2.4% |
| $150,000 to $199,999 | 8 | 0.8% |
| $200,000+ | 0 | 0.0% |
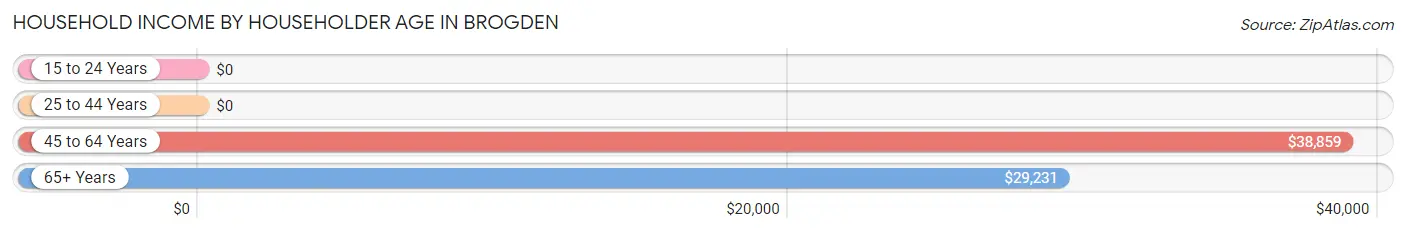
Household Income by Householder Age in Brogden
The median household income in Brogden is $32,132, with the highest median household income of $38,859 found in the 45 to 64 years age bracket for the primary householder. A total of 319 households (30.0%) fall into this category. Meanwhile, the 15 to 24 years age bracket for the primary householder has the lowest median household income of $0, with 11 households (1.0%) in this group.
| Income Bracket | # Households | Median Income |
| 15 to 24 Years | 11 (1.0%) | $0 |
| 25 to 44 Years | 250 (23.5%) | $0 |
| 45 to 64 Years | 319 (30.0%) | $38,859 |
| 65+ Years | 482 (45.4%) | $29,231 |
| Total | 1,062 (100.0%) | $32,132 |
Poverty in Brogden
Income Below Poverty by Sex and Age in Brogden
With 33.4% poverty level for males and 42.2% for females among the residents of Brogden, 18 to 24 year old males and 12 to 14 year old females are the most vulnerable to poverty, with 44 males (100.0%) and 79 females (100.0%) in their respective age groups living below the poverty level.
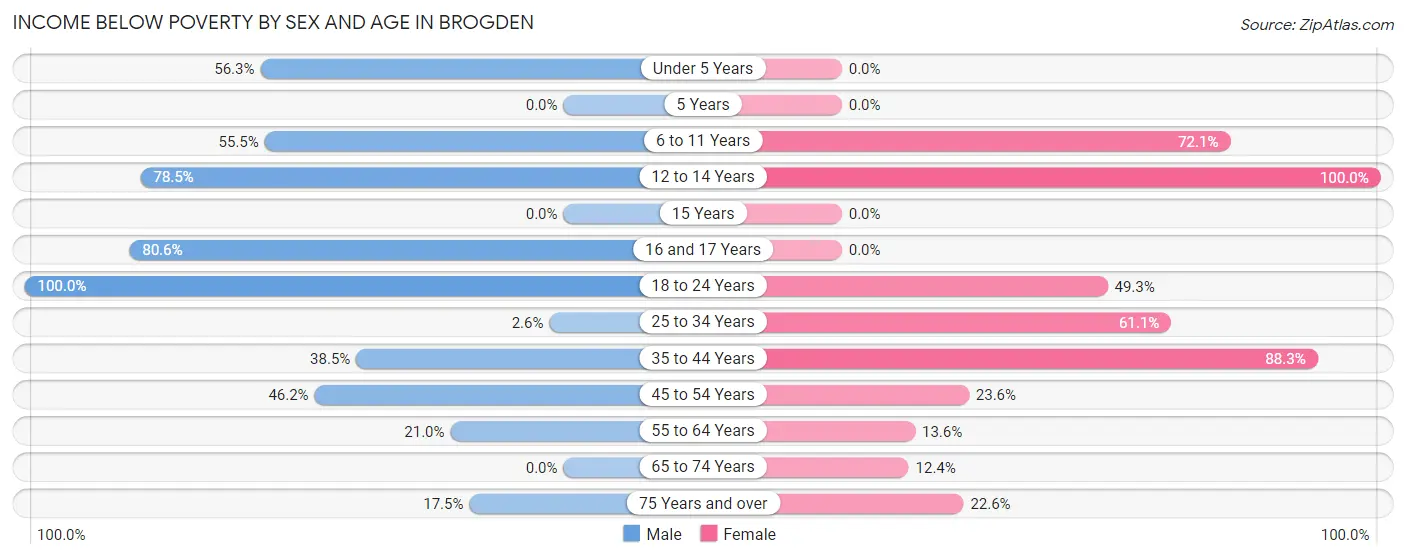
| Age Bracket | Male | Female |
| Under 5 Years | 36 (56.2%) | 0 (0.0%) |
| 5 Years | 0 (0.0%) | 0 (0.0%) |
| 6 to 11 Years | 122 (55.4%) | 62 (72.1%) |
| 12 to 14 Years | 84 (78.5%) | 79 (100.0%) |
| 15 Years | 0 (0.0%) | 0 (0.0%) |
| 16 and 17 Years | 58 (80.6%) | 0 (0.0%) |
| 18 to 24 Years | 44 (100.0%) | 37 (49.3%) |
| 25 to 34 Years | 9 (2.6%) | 151 (61.1%) |
| 35 to 44 Years | 30 (38.5%) | 98 (88.3%) |
| 45 to 54 Years | 85 (46.2%) | 25 (23.6%) |
| 55 to 64 Years | 26 (21.0%) | 17 (13.6%) |
| 65 to 74 Years | 0 (0.0%) | 30 (12.4%) |
| 75 Years and over | 11 (17.5%) | 21 (22.6%) |
| Total | 505 (33.4%) | 520 (42.2%) |
Income Above Poverty by Sex and Age in Brogden
According to the poverty statistics in Brogden, males aged 65 to 74 years and females aged under 5 years are the age groups that are most secure financially, with 100.0% of males and 100.0% of females in these age groups living above the poverty line.
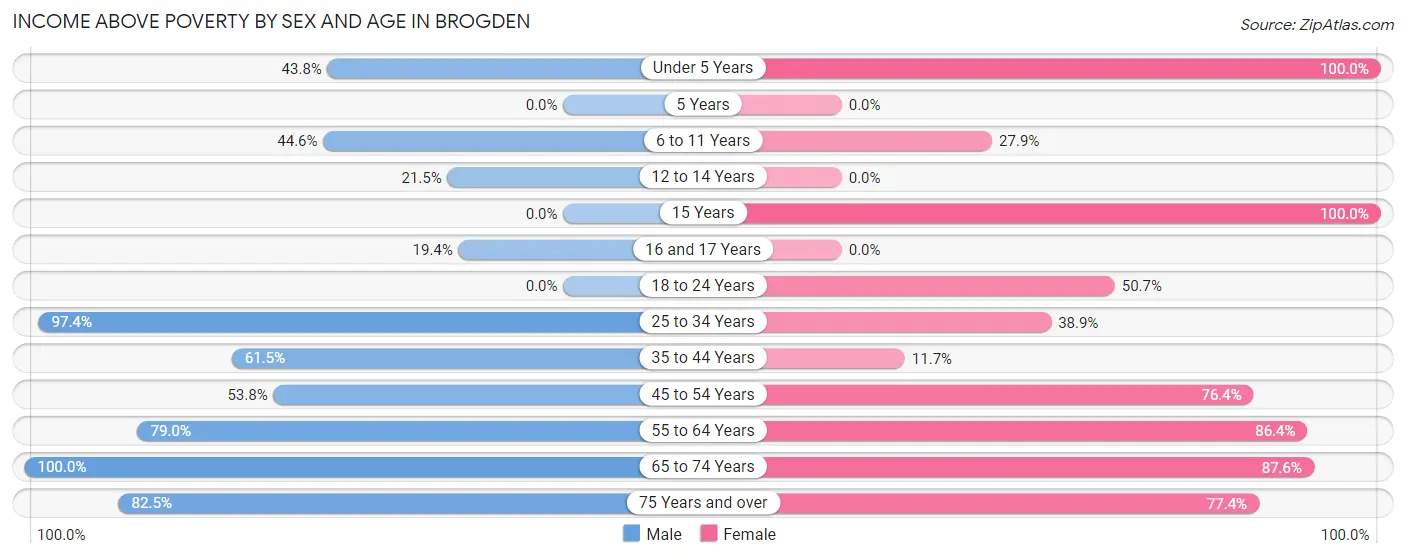
| Age Bracket | Male | Female |
| Under 5 Years | 28 (43.8%) | 23 (100.0%) |
| 5 Years | 0 (0.0%) | 0 (0.0%) |
| 6 to 11 Years | 98 (44.6%) | 24 (27.9%) |
| 12 to 14 Years | 23 (21.5%) | 0 (0.0%) |
| 15 Years | 0 (0.0%) | 45 (100.0%) |
| 16 and 17 Years | 14 (19.4%) | 0 (0.0%) |
| 18 to 24 Years | 0 (0.0%) | 38 (50.7%) |
| 25 to 34 Years | 336 (97.4%) | 96 (38.9%) |
| 35 to 44 Years | 48 (61.5%) | 13 (11.7%) |
| 45 to 54 Years | 99 (53.8%) | 81 (76.4%) |
| 55 to 64 Years | 98 (79.0%) | 108 (86.4%) |
| 65 to 74 Years | 211 (100.0%) | 212 (87.6%) |
| 75 Years and over | 52 (82.5%) | 72 (77.4%) |
| Total | 1,007 (66.6%) | 712 (57.8%) |
Income Below Poverty Among Married-Couple Families in Brogden
The poverty statistics for married-couple families in Brogden show that 5.8% or 17 of the total 292 families live below the poverty line. Families with 1 or 2 children have the highest poverty rate of 20.5%, comprising of 8 families. On the other hand, families with 3 or 4 children have the lowest poverty rate of 0.0%, which includes 0 families.
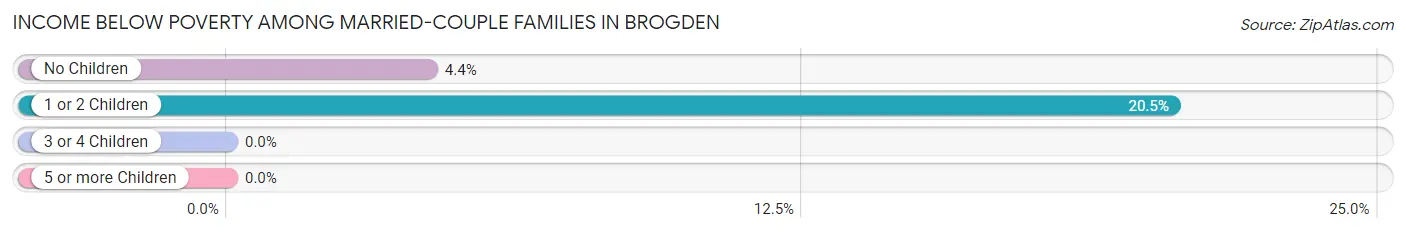
| Children | Above Poverty | Below Poverty |
| No Children | 198 (95.7%) | 9 (4.3%) |
| 1 or 2 Children | 31 (79.5%) | 8 (20.5%) |
| 3 or 4 Children | 46 (100.0%) | 0 (0.0%) |
| 5 or more Children | 0 (0.0%) | 0 (0.0%) |
| Total | 275 (94.2%) | 17 (5.8%) |
Income Below Poverty Among Single-Parent Households in Brogden
According to the poverty data in Brogden, 23.5% or 43 single-father households and 61.9% or 179 single-mother households are living below the poverty line. Among single-father households, those with 1 or 2 children have the highest poverty rate, with 43 households (45.7%) experiencing poverty. Likewise, among single-mother households, those with 3 or 4 children have the highest poverty rate, with 23 households (100.0%) falling below the poverty line.
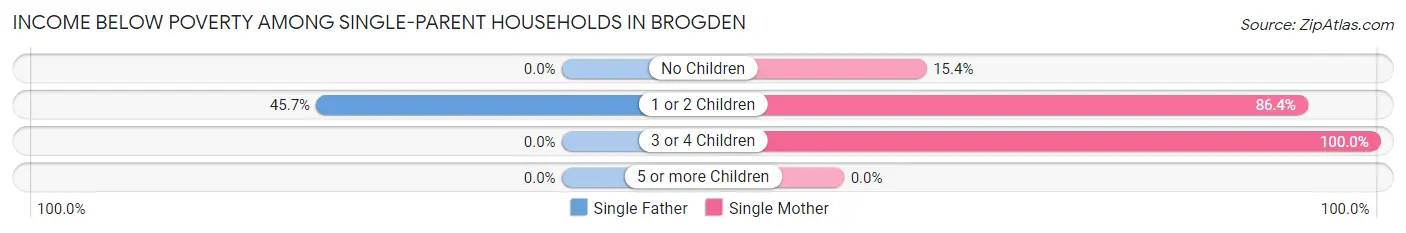
| Children | Single Father | Single Mother |
| No Children | 0 (0.0%) | 16 (15.4%) |
| 1 or 2 Children | 43 (45.7%) | 140 (86.4%) |
| 3 or 4 Children | 0 (0.0%) | 23 (100.0%) |
| 5 or more Children | 0 (0.0%) | 0 (0.0%) |
| Total | 43 (23.5%) | 179 (61.9%) |
Income Below Poverty Among Married-Couple vs Single-Parent Households in Brogden
The poverty data for Brogden shows that 17 of the married-couple family households (5.8%) and 222 of the single-parent households (47.0%) are living below the poverty level. Within the married-couple family households, those with 1 or 2 children have the highest poverty rate, with 8 households (20.5%) falling below the poverty line. Among the single-parent households, those with 3 or 4 children have the highest poverty rate, with 23 household (100.0%) living below poverty.
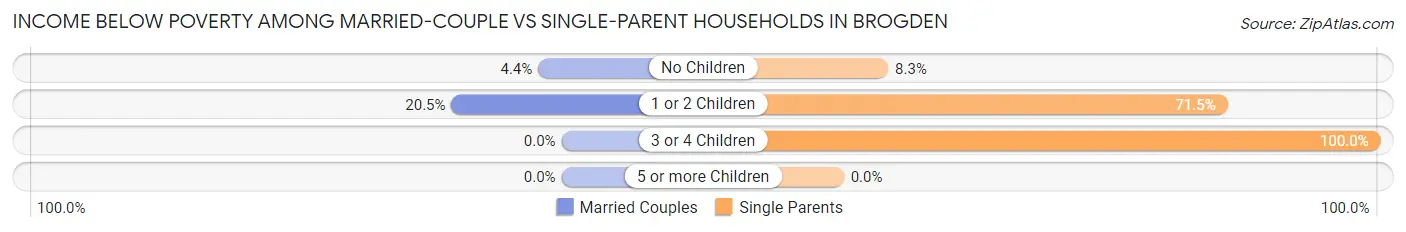
| Children | Married-Couple Families | Single-Parent Households |
| No Children | 9 (4.3%) | 16 (8.3%) |
| 1 or 2 Children | 8 (20.5%) | 183 (71.5%) |
| 3 or 4 Children | 0 (0.0%) | 23 (100.0%) |
| 5 or more Children | 0 (0.0%) | 0 (0.0%) |
| Total | 17 (5.8%) | 222 (47.0%) |
Employment Characteristics in Brogden
Employment by Class of Employer in Brogden
Among the 994 employed individuals in Brogden, private company employees (788 | 79.3%), state government employees (108 | 10.9%), and federal government employees (55 | 5.5%) make up the most common classes of employment.
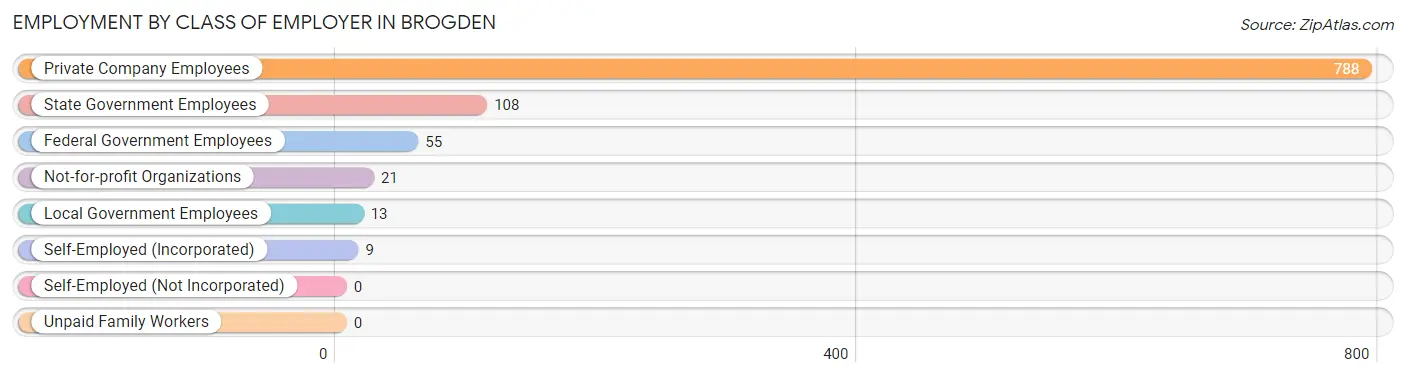
| Employer Class | # Employees | % Employees |
| Private Company Employees | 788 | 79.3% |
| Self-Employed (Incorporated) | 9 | 0.9% |
| Self-Employed (Not Incorporated) | 0 | 0.0% |
| Not-for-profit Organizations | 21 | 2.1% |
| Local Government Employees | 13 | 1.3% |
| State Government Employees | 108 | 10.9% |
| Federal Government Employees | 55 | 5.5% |
| Unpaid Family Workers | 0 | 0.0% |
| Total | 994 | 100.0% |
Employment Status by Age in Brogden
According to the labor force statistics for Brogden, out of the total population over 16 years of age (2,120), 54.9% or 1,164 individuals are in the labor force, with 10.5% or 122 of them unemployed. The age group with the highest labor force participation rate is 25 to 29 years, with 100.0% or 276 individuals in the labor force. Within the labor force, the 75 years and over age range has the highest percentage of unemployed individuals, with 100.0% or 9 of them being unemployed.
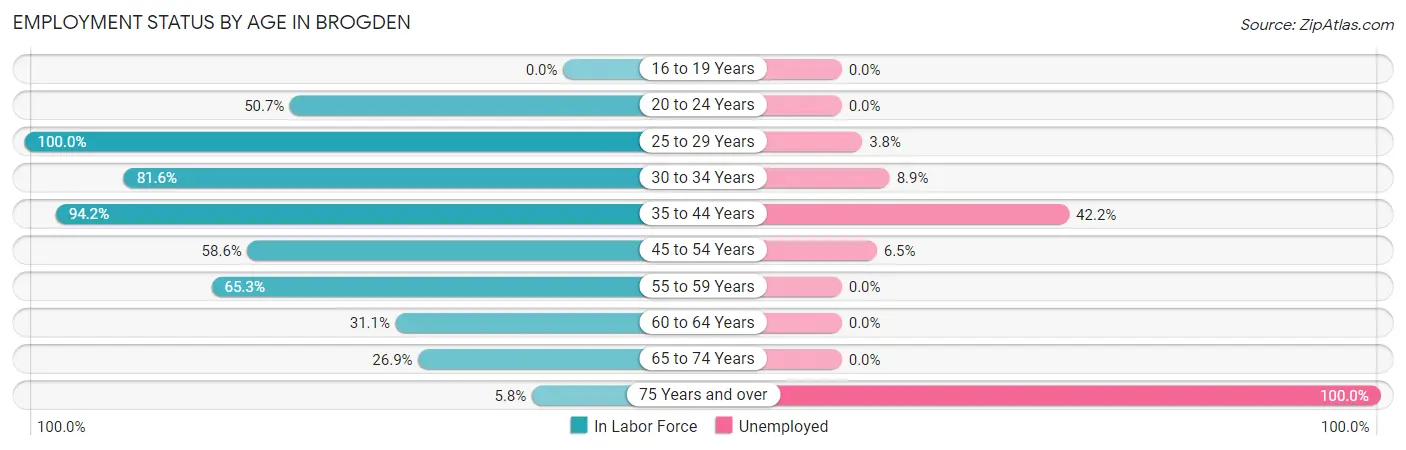
| Age Bracket | In Labor Force | Unemployed |
| 16 to 19 Years | 0 (0.0%) | 0 (0.0%) |
| 20 to 24 Years | 38 (50.7%) | 0 (0.0%) |
| 25 to 29 Years | 276 (100.0%) | 10 (3.8%) |
| 30 to 34 Years | 258 (81.6%) | 23 (8.9%) |
| 35 to 44 Years | 178 (94.2%) | 75 (42.2%) |
| 45 to 54 Years | 170 (58.6%) | 11 (6.5%) |
| 55 to 59 Years | 66 (65.3%) | 0 (0.0%) |
| 60 to 64 Years | 46 (31.1%) | 0 (0.0%) |
| 65 to 74 Years | 122 (26.9%) | 0 (0.0%) |
| 75 Years and over | 9 (5.8%) | 9 (100.0%) |
| Total | 1,164 (54.9%) | 122 (10.5%) |
Employment Status by Educational Attainment in Brogden
According to labor force statistics for Brogden, 75.3% of individuals (994) out of the total population between 25 and 64 years of age (1,320) are in the labor force, with 11.4% or 113 of them being unemployed. The group with the highest labor force participation rate are those with the educational attainment of less than high school, with 90.7% or 263 individuals in the labor force. Within the labor force, individuals with less than high school education have the highest percentage of unemployment, with 30.0% or 79 of them being unemployed.
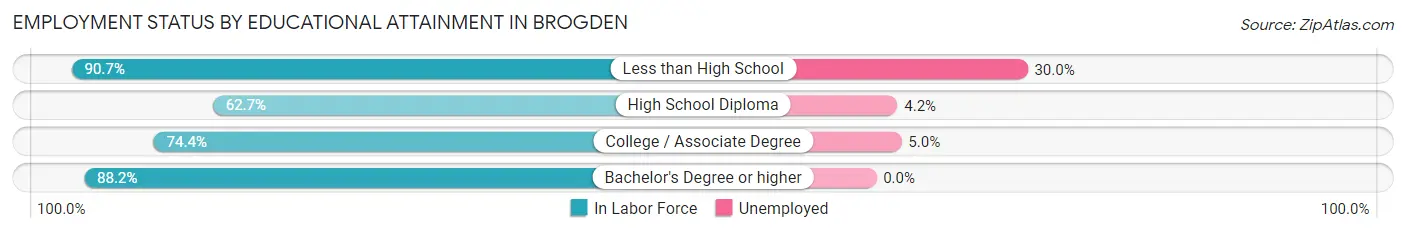
| Educational Attainment | In Labor Force | Unemployed |
| Less than High School | 263 (90.7%) | 87 (30.0%) |
| High School Diploma | 239 (62.7%) | 16 (4.2%) |
| College / Associate Degree | 432 (74.4%) | 29 (5.0%) |
| Bachelor's Degree or higher | 60 (88.2%) | 0 (0.0%) |
| Total | 994 (75.3%) | 150 (11.4%) |
Employment Occupations by Sex in Brogden
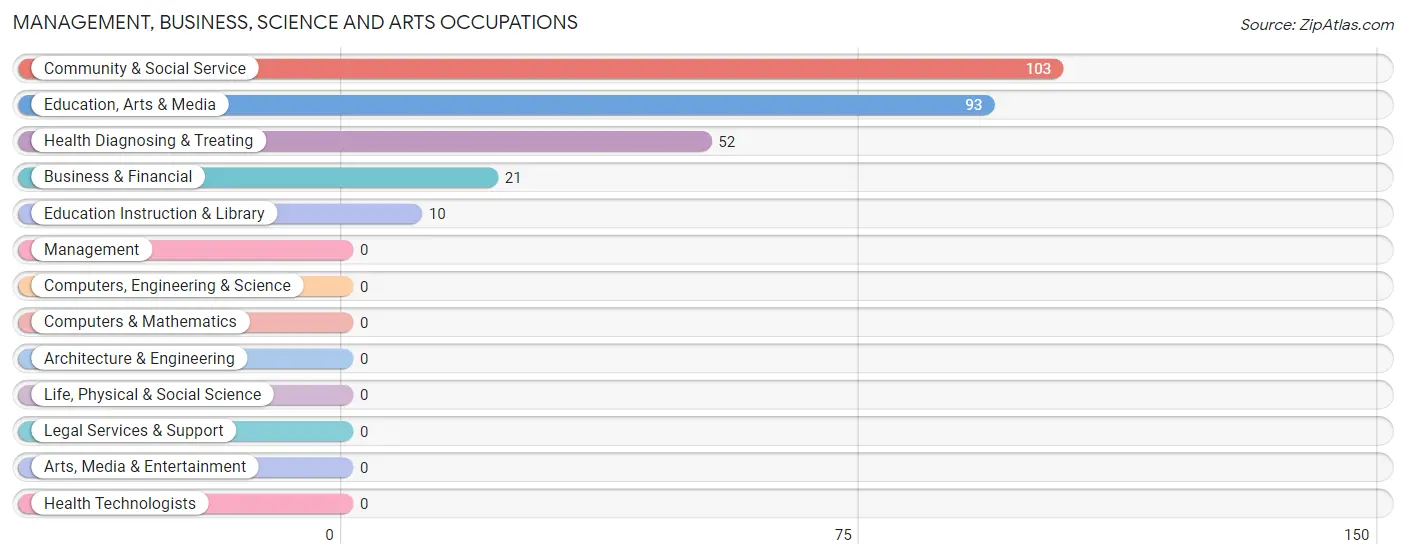
Management, Business, Science and Arts Occupations
The most common Management, Business, Science and Arts occupations in Brogden are Community & Social Service (103 | 10.2%), Education, Arts & Media (93 | 9.2%), Health Diagnosing & Treating (52 | 5.1%), Business & Financial (21 | 2.1%), and Education Instruction & Library (10 | 1.0%).
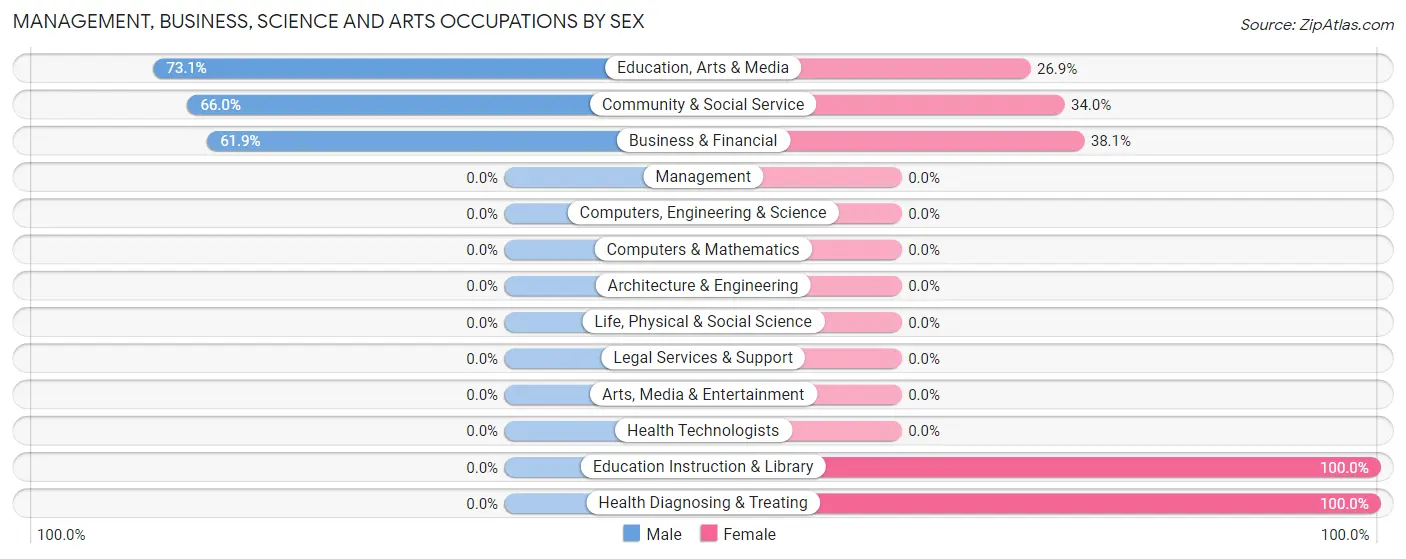
Management, Business, Science and Arts Occupations by Sex
Within the Management, Business, Science and Arts occupations in Brogden, the most male-oriented occupations are Education, Arts & Media (73.1%), Community & Social Service (66.0%), and Business & Financial (61.9%), while the most female-oriented occupations are Education Instruction & Library (100.0%), Health Diagnosing & Treating (100.0%), and Business & Financial (38.1%).
| Occupation | Male | Female |
| Management | 0 (0.0%) | 0 (0.0%) |
| Business & Financial | 13 (61.9%) | 8 (38.1%) |
| Computers, Engineering & Science | 0 (0.0%) | 0 (0.0%) |
| Computers & Mathematics | 0 (0.0%) | 0 (0.0%) |
| Architecture & Engineering | 0 (0.0%) | 0 (0.0%) |
| Life, Physical & Social Science | 0 (0.0%) | 0 (0.0%) |
| Community & Social Service | 68 (66.0%) | 35 (34.0%) |
| Education, Arts & Media | 68 (73.1%) | 25 (26.9%) |
| Legal Services & Support | 0 (0.0%) | 0 (0.0%) |
| Education Instruction & Library | 0 (0.0%) | 10 (100.0%) |
| Arts, Media & Entertainment | 0 (0.0%) | 0 (0.0%) |
| Health Diagnosing & Treating | 0 (0.0%) | 52 (100.0%) |
| Health Technologists | 0 (0.0%) | 0 (0.0%) |
| Total (Category) | 81 (46.0%) | 95 (54.0%) |
| Total (Overall) | 564 (55.8%) | 447 (44.2%) |
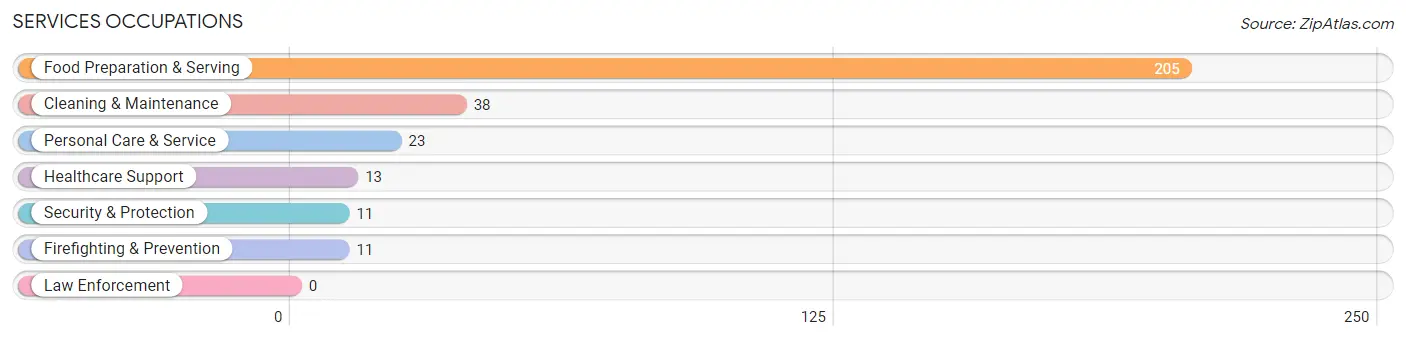
Services Occupations
The most common Services occupations in Brogden are Food Preparation & Serving (205 | 20.3%), Cleaning & Maintenance (38 | 3.8%), Personal Care & Service (23 | 2.3%), Healthcare Support (13 | 1.3%), and Security & Protection (11 | 1.1%).
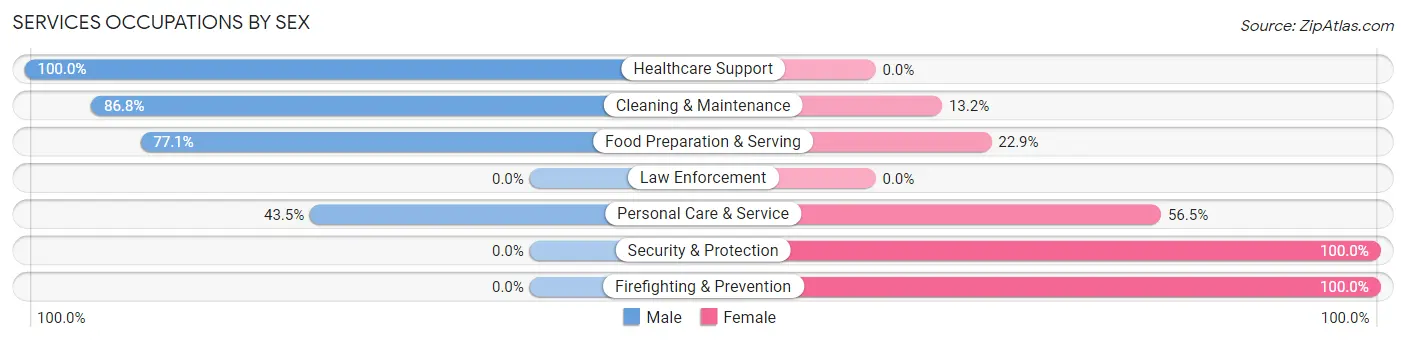
Services Occupations by Sex
Within the Services occupations in Brogden, the most male-oriented occupations are Healthcare Support (100.0%), Cleaning & Maintenance (86.8%), and Food Preparation & Serving (77.1%), while the most female-oriented occupations are Security & Protection (100.0%), Firefighting & Prevention (100.0%), and Personal Care & Service (56.5%).
| Occupation | Male | Female |
| Healthcare Support | 13 (100.0%) | 0 (0.0%) |
| Security & Protection | 0 (0.0%) | 11 (100.0%) |
| Firefighting & Prevention | 0 (0.0%) | 11 (100.0%) |
| Law Enforcement | 0 (0.0%) | 0 (0.0%) |
| Food Preparation & Serving | 158 (77.1%) | 47 (22.9%) |
| Cleaning & Maintenance | 33 (86.8%) | 5 (13.2%) |
| Personal Care & Service | 10 (43.5%) | 13 (56.5%) |
| Total (Category) | 214 (73.8%) | 76 (26.2%) |
| Total (Overall) | 564 (55.8%) | 447 (44.2%) |
Sales and Office Occupations
The most common Sales and Office occupations in Brogden are Office & Administration (79 | 7.8%), and Sales & Related (40 | 4.0%).
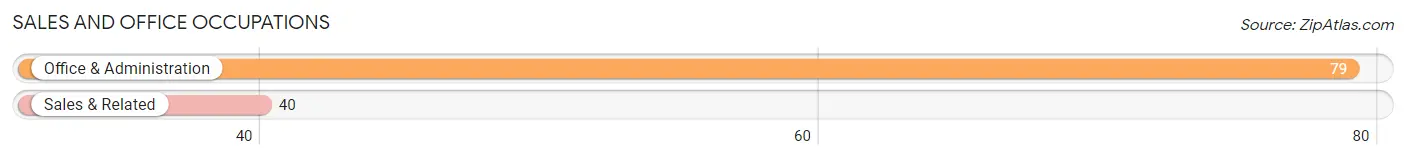
Sales and Office Occupations by Sex
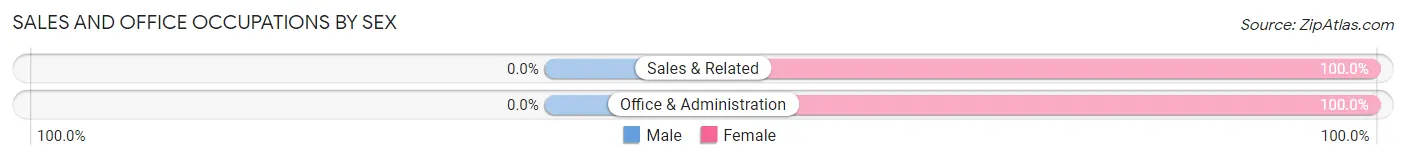
| Occupation | Male | Female |
| Sales & Related | 0 (0.0%) | 40 (100.0%) |
| Office & Administration | 0 (0.0%) | 79 (100.0%) |
| Total (Category) | 0 (0.0%) | 119 (100.0%) |
| Total (Overall) | 564 (55.8%) | 447 (44.2%) |
Natural Resources, Construction and Maintenance Occupations
The most common Natural Resources, Construction and Maintenance occupations in Brogden are Construction & Extraction (79 | 7.8%), Installation, Maintenance & Repair (75 | 7.4%), and Farming, Fishing & Forestry (23 | 2.3%).
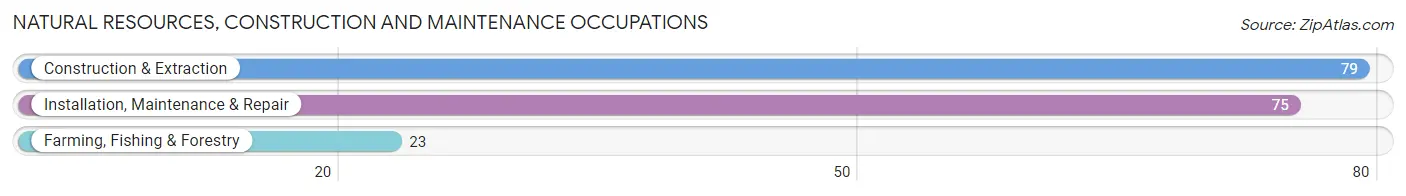
Natural Resources, Construction and Maintenance Occupations by Sex
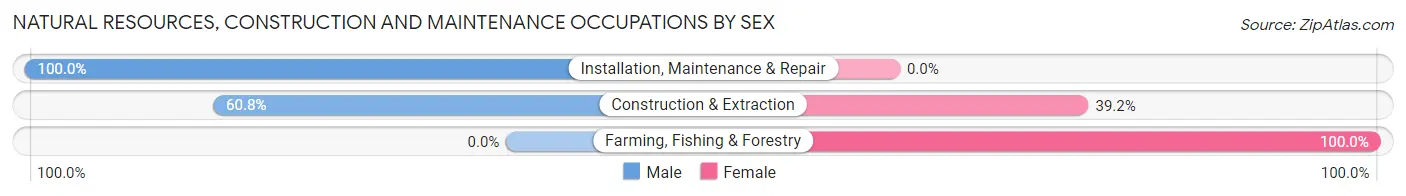
| Occupation | Male | Female |
| Farming, Fishing & Forestry | 0 (0.0%) | 23 (100.0%) |
| Construction & Extraction | 48 (60.8%) | 31 (39.2%) |
| Installation, Maintenance & Repair | 75 (100.0%) | 0 (0.0%) |
| Total (Category) | 123 (69.5%) | 54 (30.5%) |
| Total (Overall) | 564 (55.8%) | 447 (44.2%) |
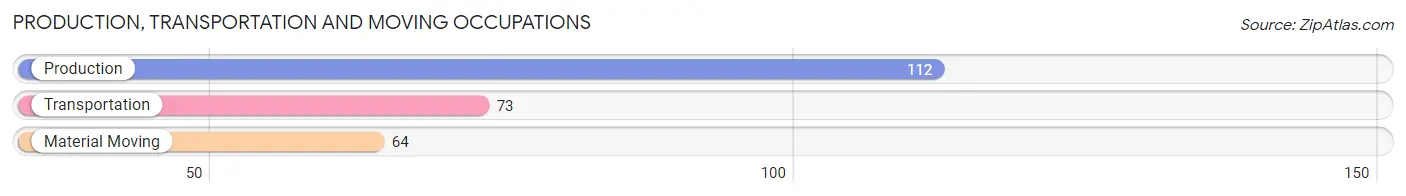
Production, Transportation and Moving Occupations
The most common Production, Transportation and Moving occupations in Brogden are Production (112 | 11.1%), Transportation (73 | 7.2%), and Material Moving (64 | 6.3%).
Production, Transportation and Moving Occupations by Sex
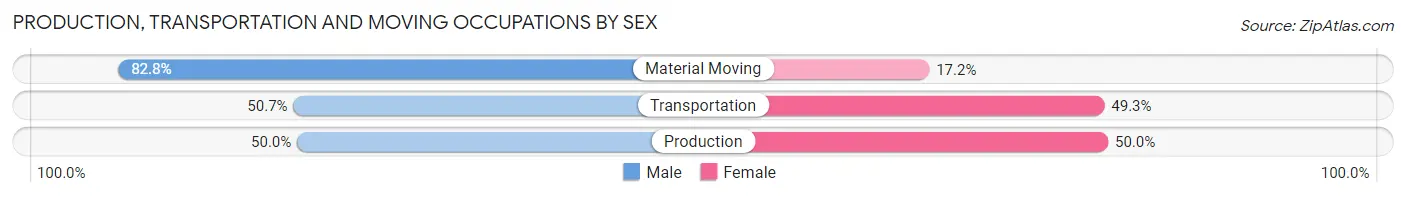
| Occupation | Male | Female |
| Production | 56 (50.0%) | 56 (50.0%) |
| Transportation | 37 (50.7%) | 36 (49.3%) |
| Material Moving | 53 (82.8%) | 11 (17.2%) |
| Total (Category) | 146 (58.6%) | 103 (41.4%) |
| Total (Overall) | 564 (55.8%) | 447 (44.2%) |
Employment Industries by Sex in Brogden
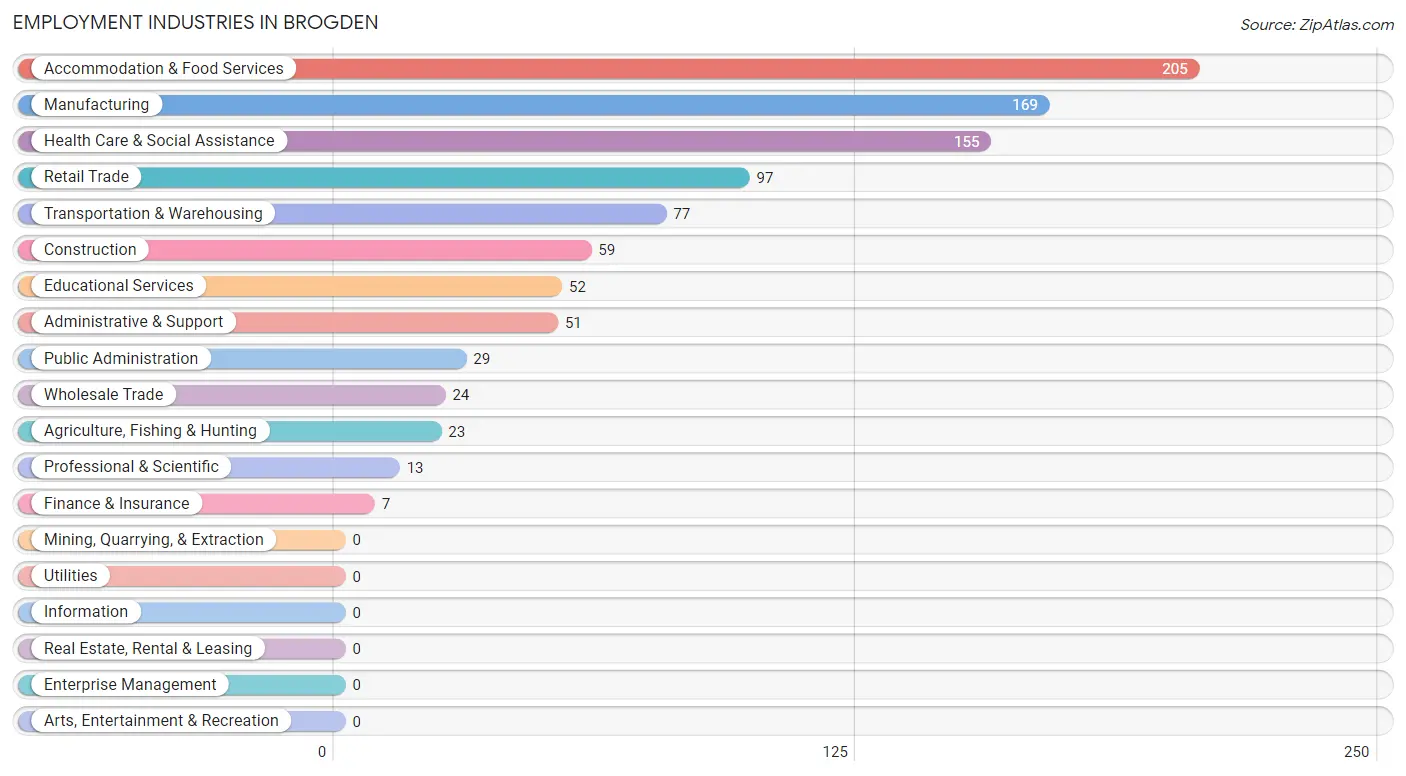
Employment Industries in Brogden
The major employment industries in Brogden include Accommodation & Food Services (205 | 20.3%), Manufacturing (169 | 16.7%), Health Care & Social Assistance (155 | 15.3%), Retail Trade (97 | 9.6%), and Transportation & Warehousing (77 | 7.6%).
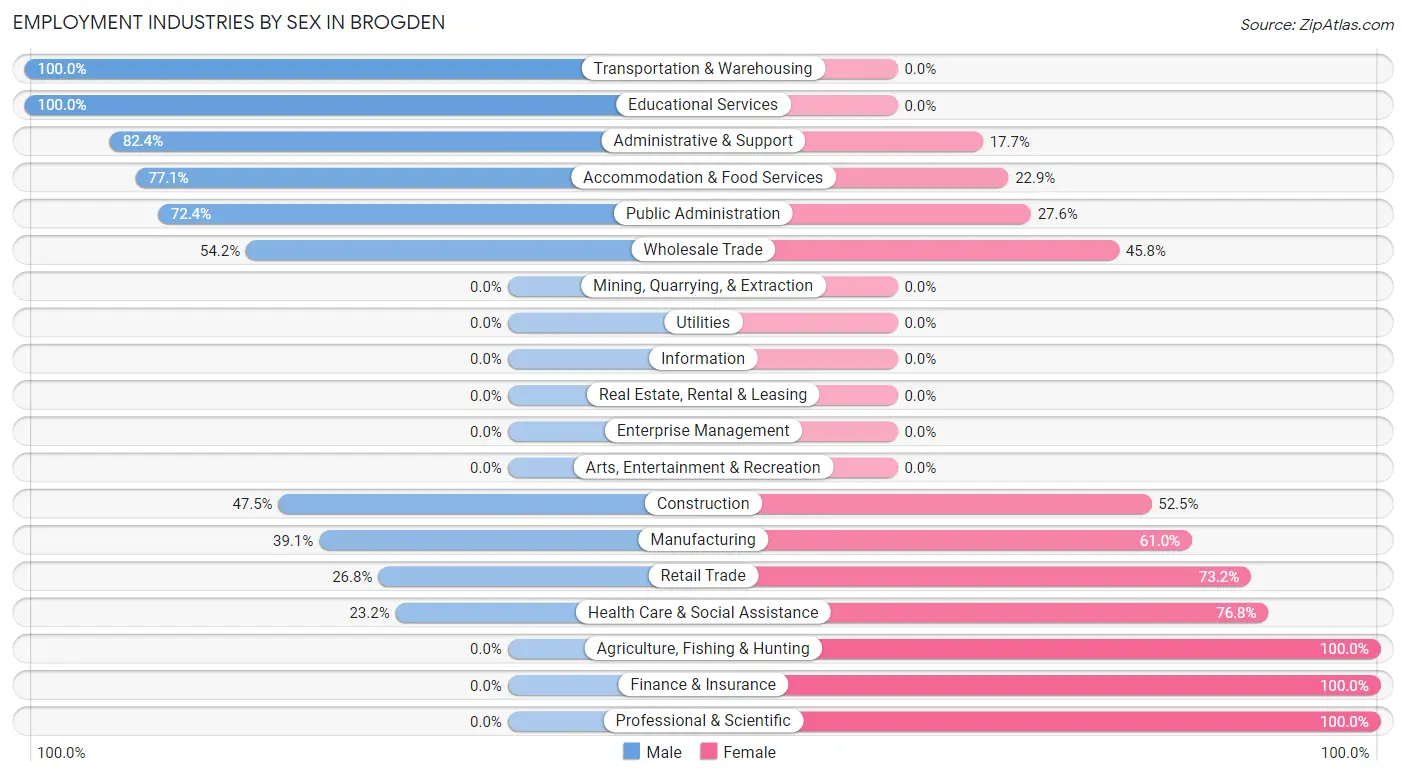
Employment Industries by Sex in Brogden
The Brogden industries that see more men than women are Transportation & Warehousing (100.0%), Educational Services (100.0%), and Administrative & Support (82.4%), whereas the industries that tend to have a higher number of women are Agriculture, Fishing & Hunting (100.0%), Finance & Insurance (100.0%), and Professional & Scientific (100.0%).
| Industry | Male | Female |
| Agriculture, Fishing & Hunting | 0 (0.0%) | 23 (100.0%) |
| Mining, Quarrying, & Extraction | 0 (0.0%) | 0 (0.0%) |
| Construction | 28 (47.5%) | 31 (52.5%) |
| Manufacturing | 66 (39.1%) | 103 (61.0%) |
| Wholesale Trade | 13 (54.2%) | 11 (45.8%) |
| Retail Trade | 26 (26.8%) | 71 (73.2%) |
| Transportation & Warehousing | 77 (100.0%) | 0 (0.0%) |
| Utilities | 0 (0.0%) | 0 (0.0%) |
| Information | 0 (0.0%) | 0 (0.0%) |
| Finance & Insurance | 0 (0.0%) | 7 (100.0%) |
| Real Estate, Rental & Leasing | 0 (0.0%) | 0 (0.0%) |
| Professional & Scientific | 0 (0.0%) | 13 (100.0%) |
| Enterprise Management | 0 (0.0%) | 0 (0.0%) |
| Administrative & Support | 42 (82.4%) | 9 (17.6%) |
| Educational Services | 52 (100.0%) | 0 (0.0%) |
| Health Care & Social Assistance | 36 (23.2%) | 119 (76.8%) |
| Arts, Entertainment & Recreation | 0 (0.0%) | 0 (0.0%) |
| Accommodation & Food Services | 158 (77.1%) | 47 (22.9%) |
| Public Administration | 21 (72.4%) | 8 (27.6%) |
| Total | 564 (55.8%) | 447 (44.2%) |
Education in Brogden
School Enrollment in Brogden
The most common levels of schooling among the 769 students in Brogden are middle school (302 | 39.3%), high school (200 | 26.0%), and college / undergraduate (127 | 16.5%).
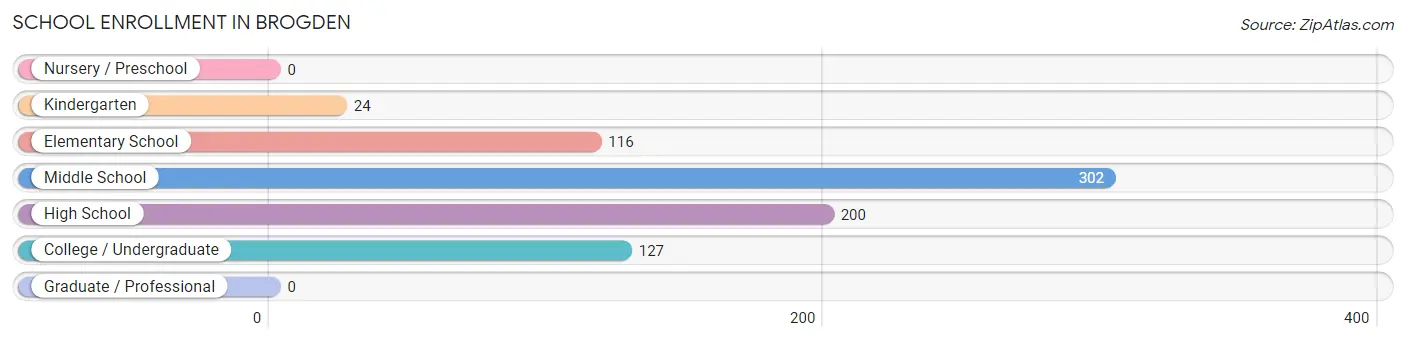
| School Level | # Students | % Students |
| Nursery / Preschool | 0 | 0.0% |
| Kindergarten | 24 | 3.1% |
| Elementary School | 116 | 15.1% |
| Middle School | 302 | 39.3% |
| High School | 200 | 26.0% |
| College / Undergraduate | 127 | 16.5% |
| Graduate / Professional | 0 | 0.0% |
| Total | 769 | 100.0% |
School Enrollment by Age by Funding Source in Brogden
Out of a total of 769 students who are enrolled in schools in Brogden, 31 (4.0%) attend a private institution, while the remaining 738 (96.0%) are enrolled in public schools. The age group of 10 to 14 year olds has the highest likelihood of being enrolled in private schools, with 31 (7.7% in the age bracket) enrolled. Conversely, the age group of 5 to 9 year old has the lowest likelihood of being enrolled in a private school, with 91 (100.0% in the age bracket) attending a public institution.
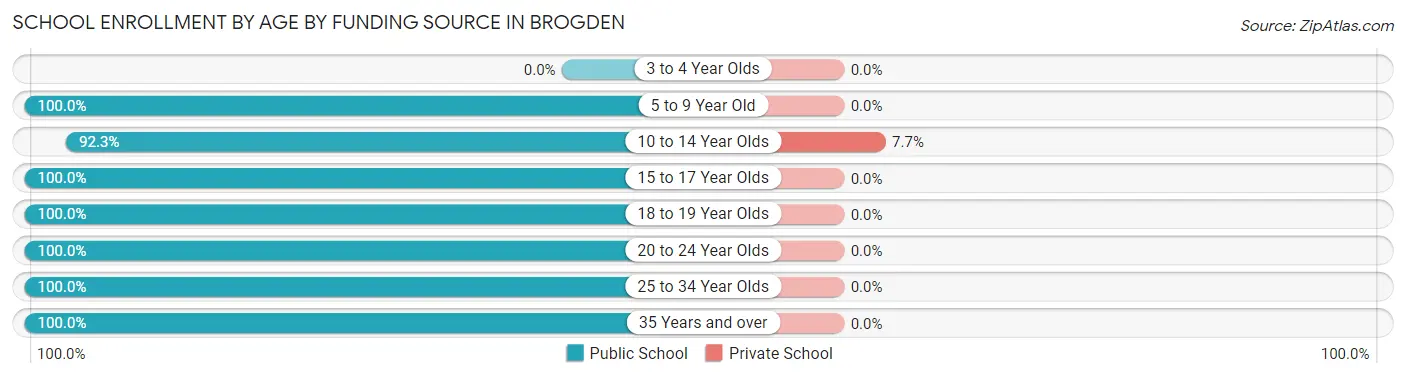
| Age Bracket | Public School | Private School |
| 3 to 4 Year Olds | 0 (0.0%) | 0 (0.0%) |
| 5 to 9 Year Old | 91 (100.0%) | 0 (0.0%) |
| 10 to 14 Year Olds | 370 (92.3%) | 31 (7.7%) |
| 15 to 17 Year Olds | 117 (100.0%) | 0 (0.0%) |
| 18 to 19 Year Olds | 33 (100.0%) | 0 (0.0%) |
| 20 to 24 Year Olds | 21 (100.0%) | 0 (0.0%) |
| 25 to 34 Year Olds | 55 (100.0%) | 0 (0.0%) |
| 35 Years and over | 51 (100.0%) | 0 (0.0%) |
| Total | 738 (96.0%) | 31 (4.0%) |
Educational Attainment by Field of Study in Brogden
Visual & performing arts (33 | 39.8%), business (15 | 18.1%), physical & health sciences (13 | 15.7%), literature & languages (9 | 10.8%), and social sciences (7 | 8.4%) are the most common fields of study among 83 individuals in Brogden who have obtained a bachelor's degree or higher.
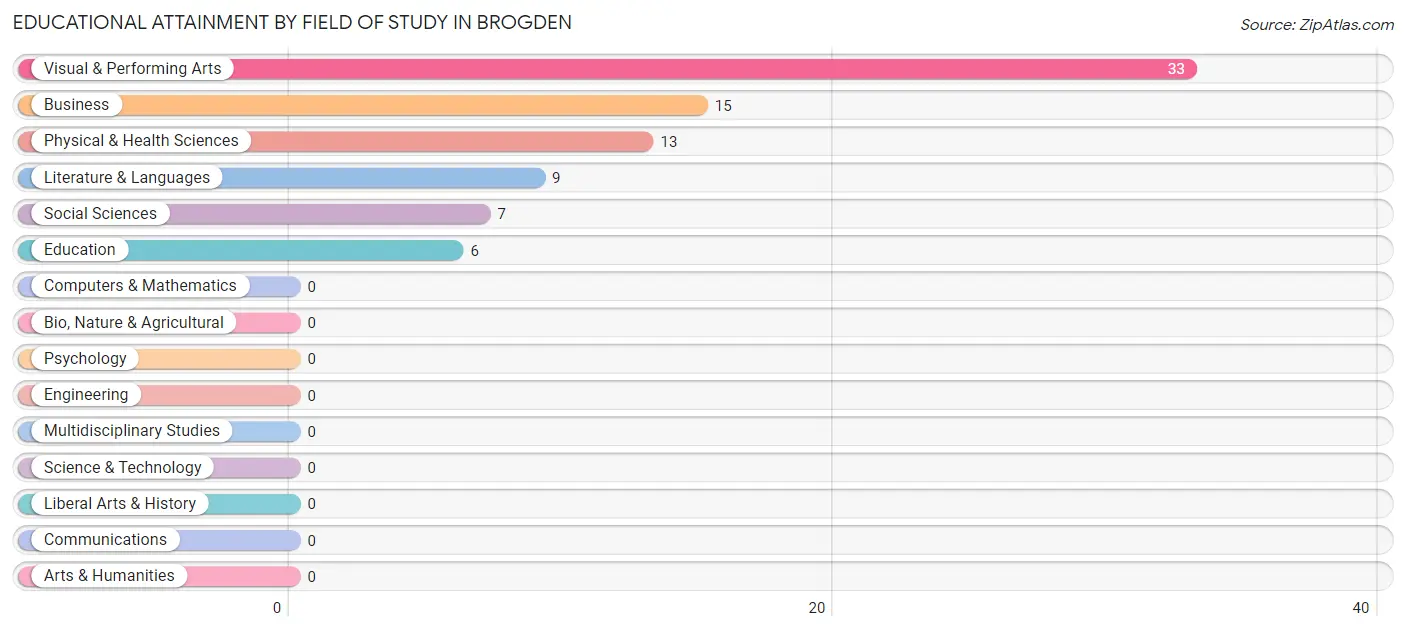
| Field of Study | # Graduates | % Graduates |
| Computers & Mathematics | 0 | 0.0% |
| Bio, Nature & Agricultural | 0 | 0.0% |
| Physical & Health Sciences | 13 | 15.7% |
| Psychology | 0 | 0.0% |
| Social Sciences | 7 | 8.4% |
| Engineering | 0 | 0.0% |
| Multidisciplinary Studies | 0 | 0.0% |
| Science & Technology | 0 | 0.0% |
| Business | 15 | 18.1% |
| Education | 6 | 7.2% |
| Literature & Languages | 9 | 10.8% |
| Liberal Arts & History | 0 | 0.0% |
| Visual & Performing Arts | 33 | 39.8% |
| Communications | 0 | 0.0% |
| Arts & Humanities | 0 | 0.0% |
| Total | 83 | 100.0% |
Transportation & Commute in Brogden
Vehicle Availability by Sex in Brogden
The most prevalent vehicle ownership categories in Brogden are males with 4 vehicles (204, accounting for 34.7%) and females with 4 vehicles (66, making up 50.2%).
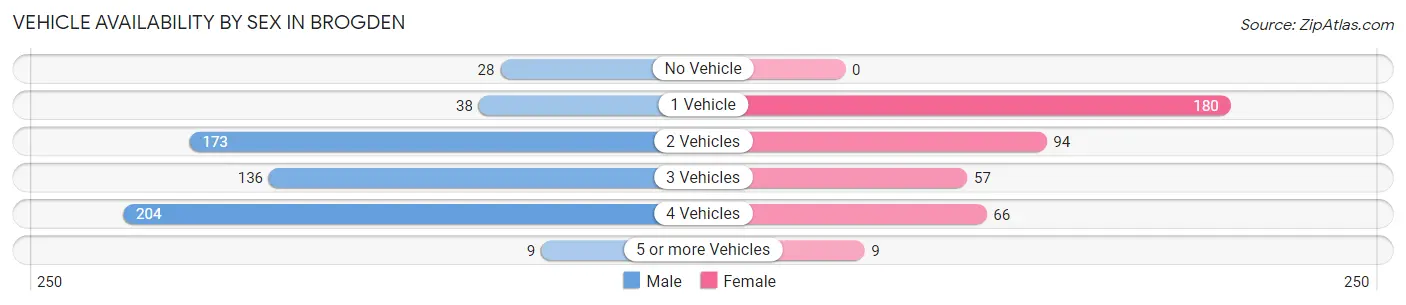
| Vehicles Available | Male | Female |
| No Vehicle | 28 (4.8%) | 0 (0.0%) |
| 1 Vehicle | 38 (6.5%) | 180 (44.3%) |
| 2 Vehicles | 173 (29.4%) | 94 (23.2%) |
| 3 Vehicles | 136 (23.1%) | 57 (14.0%) |
| 4 Vehicles | 204 (34.7%) | 66 (16.3%) |
| 5 or more Vehicles | 9 (1.5%) | 9 (2.2%) |
| Total | 588 (100.0%) | 406 (100.0%) |
Commute Time in Brogden
The most frequently occuring commute durations in Brogden are 10 to 14 minutes (363 commuters, 36.8%), 15 to 19 minutes (159 commuters, 16.1%), and 5 to 9 minutes (138 commuters, 14.0%).
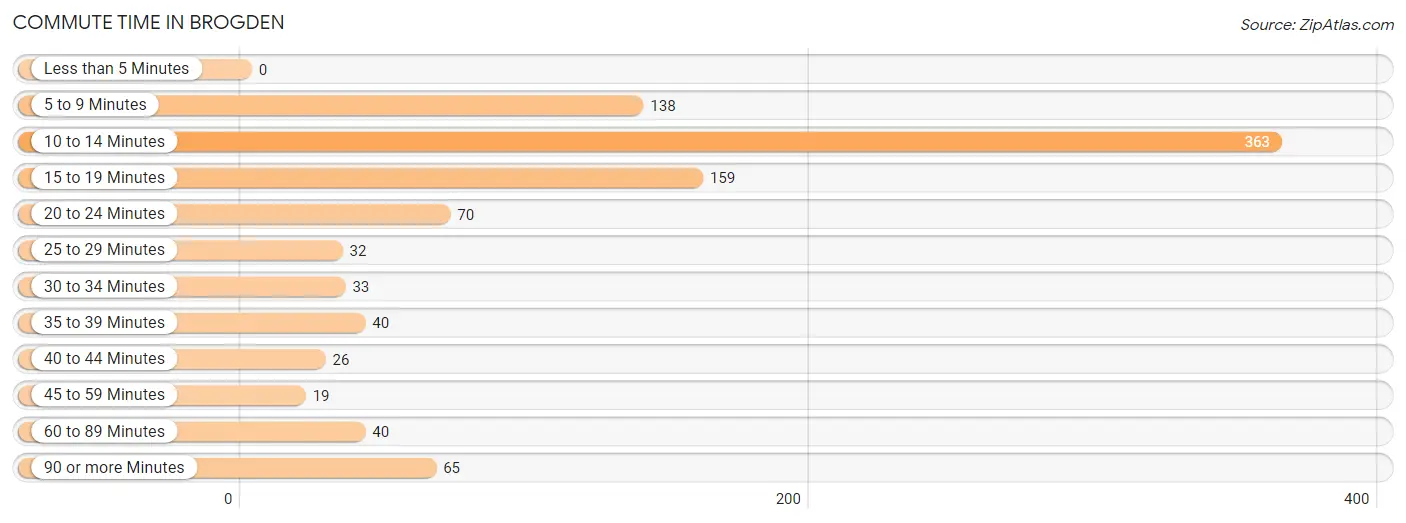
| Commute Time | # Commuters | % Commuters |
| Less than 5 Minutes | 0 | 0.0% |
| 5 to 9 Minutes | 138 | 14.0% |
| 10 to 14 Minutes | 363 | 36.8% |
| 15 to 19 Minutes | 159 | 16.1% |
| 20 to 24 Minutes | 70 | 7.1% |
| 25 to 29 Minutes | 32 | 3.3% |
| 30 to 34 Minutes | 33 | 3.4% |
| 35 to 39 Minutes | 40 | 4.1% |
| 40 to 44 Minutes | 26 | 2.6% |
| 45 to 59 Minutes | 19 | 1.9% |
| 60 to 89 Minutes | 40 | 4.1% |
| 90 or more Minutes | 65 | 6.6% |
Commute Time by Sex in Brogden
The most common commute times in Brogden are 10 to 14 minutes (284 commuters, 48.3%) for males and 5 to 9 minutes (100 commuters, 25.2%) for females.
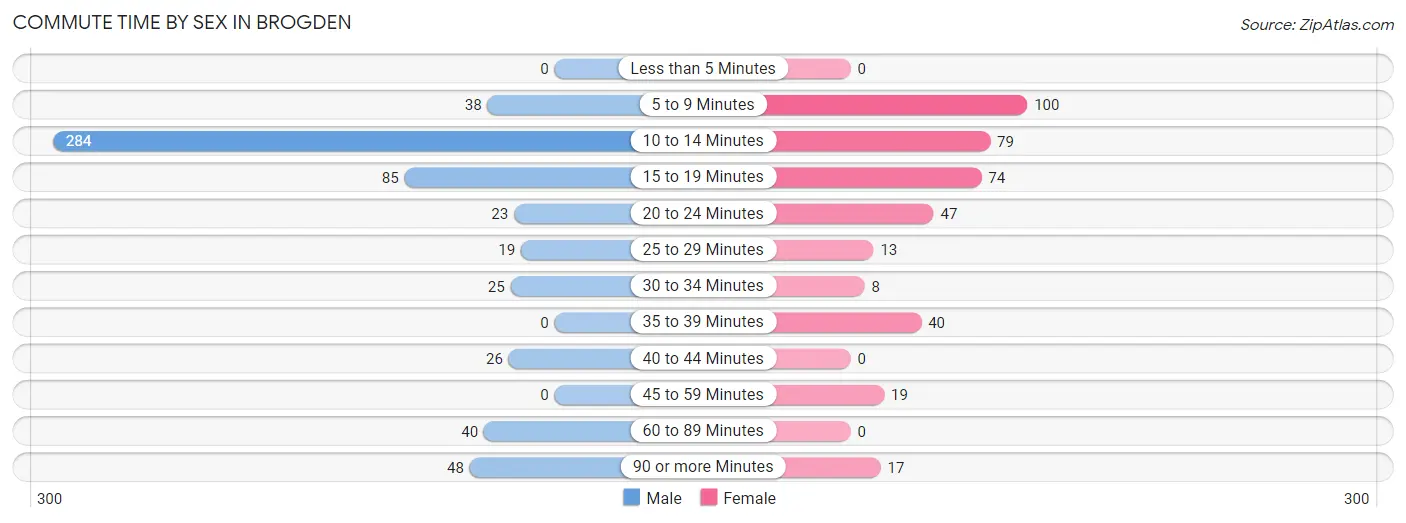
| Commute Time | Male | Female |
| Less than 5 Minutes | 0 (0.0%) | 0 (0.0%) |
| 5 to 9 Minutes | 38 (6.5%) | 100 (25.2%) |
| 10 to 14 Minutes | 284 (48.3%) | 79 (19.9%) |
| 15 to 19 Minutes | 85 (14.5%) | 74 (18.6%) |
| 20 to 24 Minutes | 23 (3.9%) | 47 (11.8%) |
| 25 to 29 Minutes | 19 (3.2%) | 13 (3.3%) |
| 30 to 34 Minutes | 25 (4.3%) | 8 (2.0%) |
| 35 to 39 Minutes | 0 (0.0%) | 40 (10.1%) |
| 40 to 44 Minutes | 26 (4.4%) | 0 (0.0%) |
| 45 to 59 Minutes | 0 (0.0%) | 19 (4.8%) |
| 60 to 89 Minutes | 40 (6.8%) | 0 (0.0%) |
| 90 or more Minutes | 48 (8.2%) | 17 (4.3%) |
Time of Departure to Work by Sex in Brogden
The most frequent times of departure to work in Brogden are 10:00 AM to 10:59 AM (182, 30.9%) for males and 4:00 PM to 11:59 PM (100, 25.2%) for females.
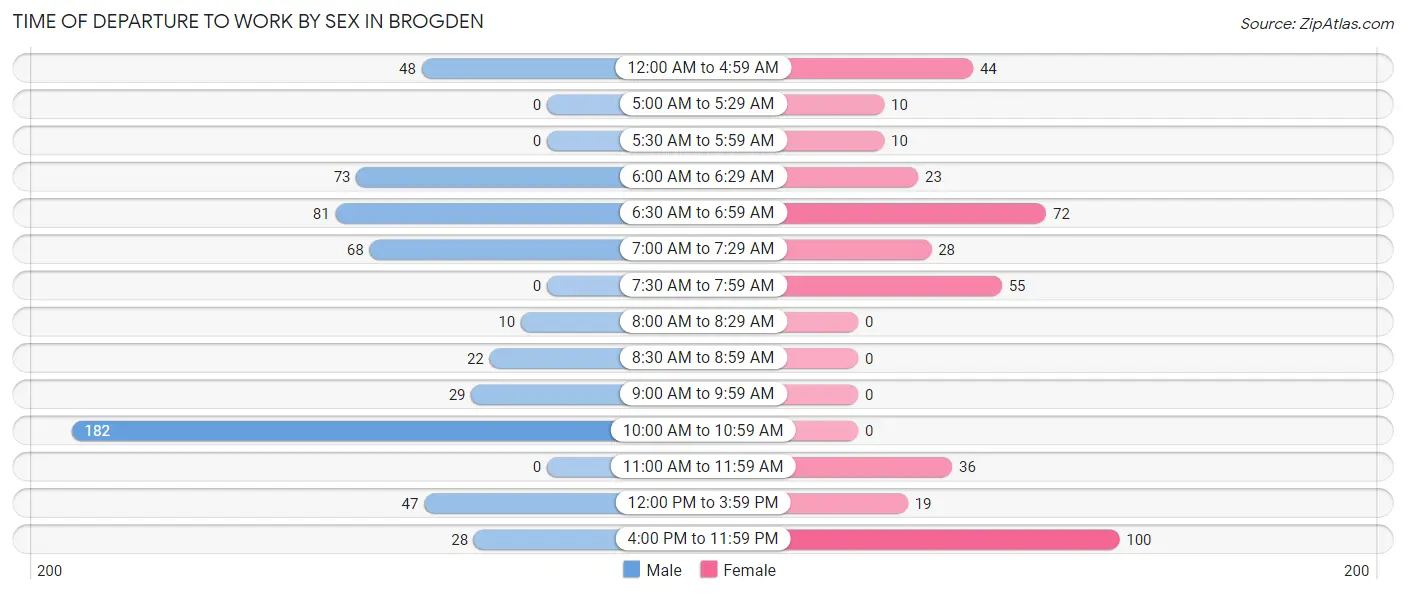
| Time of Departure | Male | Female |
| 12:00 AM to 4:59 AM | 48 (8.2%) | 44 (11.1%) |
| 5:00 AM to 5:29 AM | 0 (0.0%) | 10 (2.5%) |
| 5:30 AM to 5:59 AM | 0 (0.0%) | 10 (2.5%) |
| 6:00 AM to 6:29 AM | 73 (12.4%) | 23 (5.8%) |
| 6:30 AM to 6:59 AM | 81 (13.8%) | 72 (18.1%) |
| 7:00 AM to 7:29 AM | 68 (11.6%) | 28 (7.0%) |
| 7:30 AM to 7:59 AM | 0 (0.0%) | 55 (13.9%) |
| 8:00 AM to 8:29 AM | 10 (1.7%) | 0 (0.0%) |
| 8:30 AM to 8:59 AM | 22 (3.7%) | 0 (0.0%) |
| 9:00 AM to 9:59 AM | 29 (4.9%) | 0 (0.0%) |
| 10:00 AM to 10:59 AM | 182 (30.9%) | 0 (0.0%) |
| 11:00 AM to 11:59 AM | 0 (0.0%) | 36 (9.1%) |
| 12:00 PM to 3:59 PM | 47 (8.0%) | 19 (4.8%) |
| 4:00 PM to 11:59 PM | 28 (4.8%) | 100 (25.2%) |
| Total | 588 (100.0%) | 397 (100.0%) |
Housing Occupancy in Brogden
Occupancy by Ownership in Brogden
Of the total 1,062 dwellings in Brogden, owner-occupied units account for 741 (69.8%), while renter-occupied units make up 321 (30.2%).
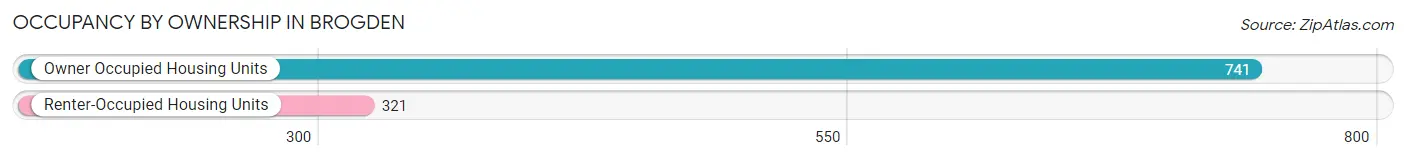
| Occupancy | # Housing Units | % Housing Units |
| Owner Occupied Housing Units | 741 | 69.8% |
| Renter-Occupied Housing Units | 321 | 30.2% |
| Total Occupied Housing Units | 1,062 | 100.0% |
Occupancy by Household Size in Brogden
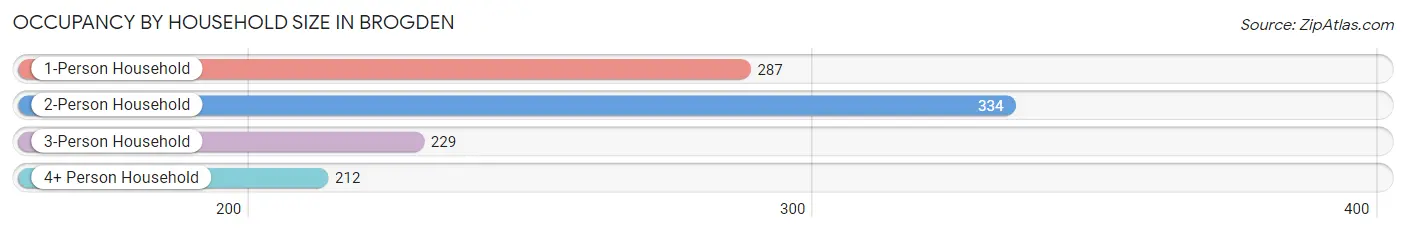
| Household Size | # Housing Units | % Housing Units |
| 1-Person Household | 287 | 27.0% |
| 2-Person Household | 334 | 31.5% |
| 3-Person Household | 229 | 21.6% |
| 4+ Person Household | 212 | 20.0% |
| Total Housing Units | 1,062 | 100.0% |
Occupancy by Ownership by Household Size in Brogden
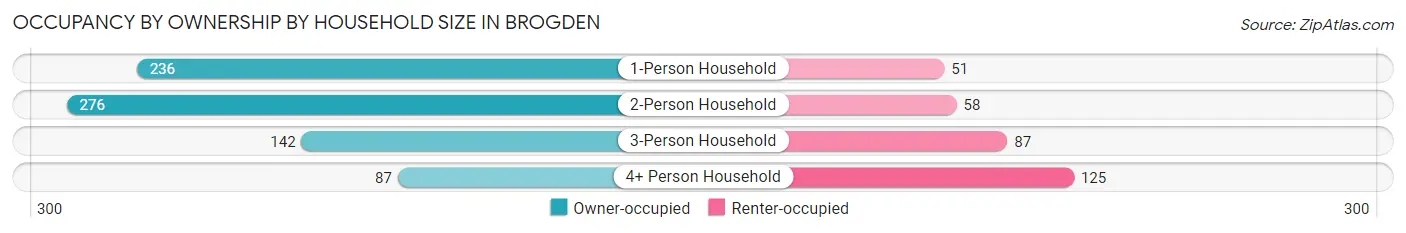
| Household Size | Owner-occupied | Renter-occupied |
| 1-Person Household | 236 (82.2%) | 51 (17.8%) |
| 2-Person Household | 276 (82.6%) | 58 (17.4%) |
| 3-Person Household | 142 (62.0%) | 87 (38.0%) |
| 4+ Person Household | 87 (41.0%) | 125 (59.0%) |
| Total Housing Units | 741 (69.8%) | 321 (30.2%) |
Occupancy by Educational Attainment in Brogden
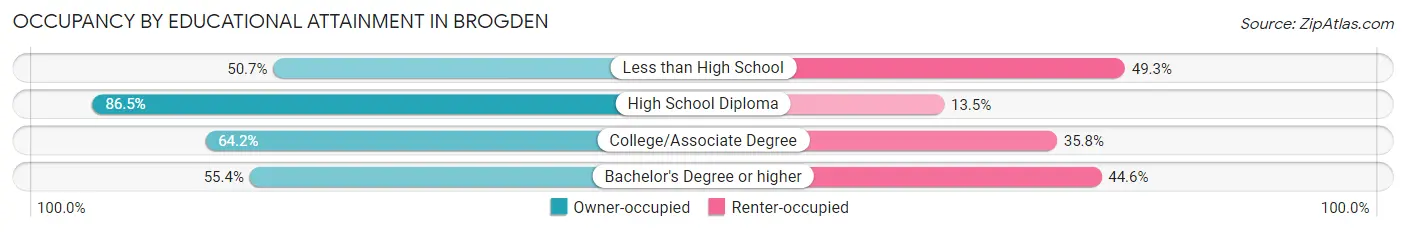
| Household Size | Owner-occupied | Renter-occupied |
| Less than High School | 108 (50.7%) | 105 (49.3%) |
| High School Diploma | 360 (86.5%) | 56 (13.5%) |
| College/Associate Degree | 242 (64.2%) | 135 (35.8%) |
| Bachelor's Degree or higher | 31 (55.4%) | 25 (44.6%) |
Occupancy by Age of Householder in Brogden
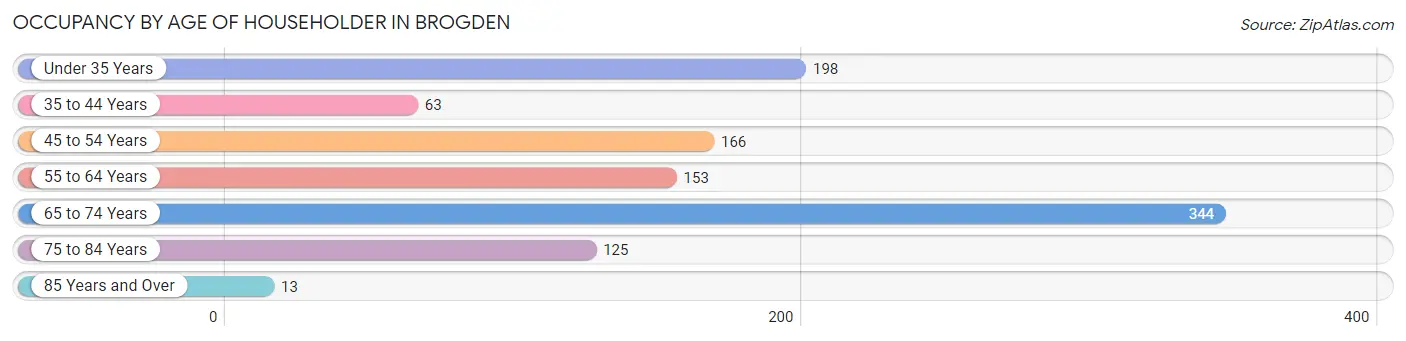
| Age Bracket | # Households | % Households |
| Under 35 Years | 198 | 18.6% |
| 35 to 44 Years | 63 | 5.9% |
| 45 to 54 Years | 166 | 15.6% |
| 55 to 64 Years | 153 | 14.4% |
| 65 to 74 Years | 344 | 32.4% |
| 75 to 84 Years | 125 | 11.8% |
| 85 Years and Over | 13 | 1.2% |
| Total | 1,062 | 100.0% |
Housing Finances in Brogden
Median Income by Occupancy in Brogden
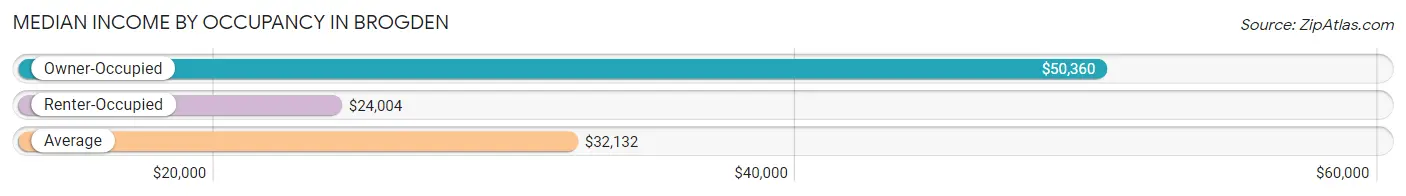
| Occupancy Type | # Households | Median Income |
| Owner-Occupied | 741 (69.8%) | $50,360 |
| Renter-Occupied | 321 (30.2%) | $24,004 |
| Average | 1,062 (100.0%) | $32,132 |
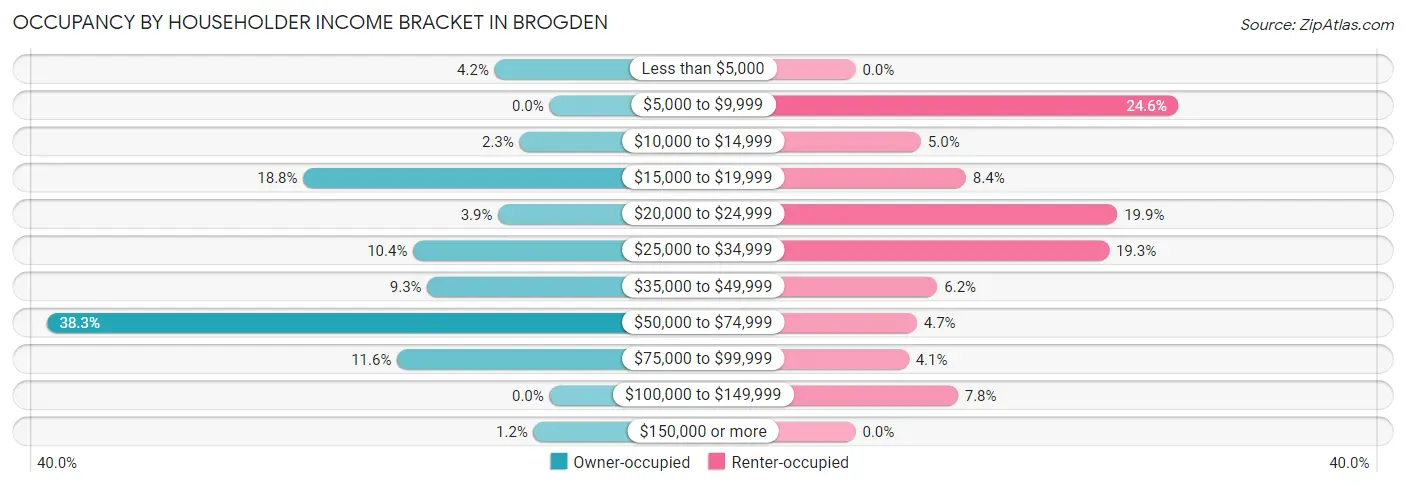
Occupancy by Householder Income Bracket in Brogden
| Income Bracket | Owner-occupied | Renter-occupied |
| Less than $5,000 | 31 (4.2%) | 0 (0.0%) |
| $5,000 to $9,999 | 0 (0.0%) | 79 (24.6%) |
| $10,000 to $14,999 | 17 (2.3%) | 16 (5.0%) |
| $15,000 to $19,999 | 139 (18.8%) | 27 (8.4%) |
| $20,000 to $24,999 | 29 (3.9%) | 64 (19.9%) |
| $25,000 to $34,999 | 77 (10.4%) | 62 (19.3%) |
| $35,000 to $49,999 | 69 (9.3%) | 20 (6.2%) |
| $50,000 to $74,999 | 284 (38.3%) | 15 (4.7%) |
| $75,000 to $99,999 | 86 (11.6%) | 13 (4.1%) |
| $100,000 to $149,999 | 0 (0.0%) | 25 (7.8%) |
| $150,000 or more | 9 (1.2%) | 0 (0.0%) |
| Total | 741 (100.0%) | 321 (100.0%) |
Monthly Housing Cost Tiers in Brogden
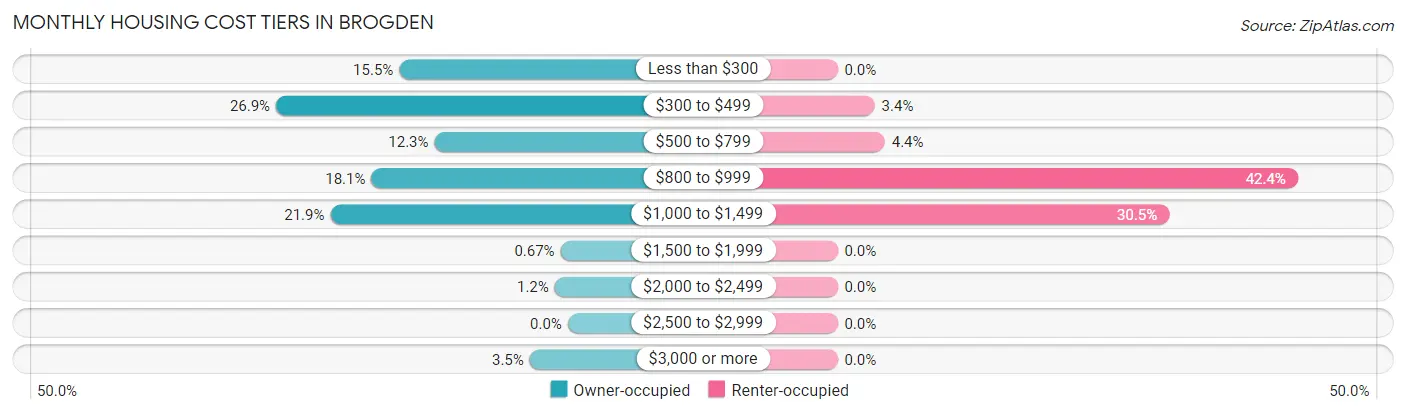
| Monthly Cost | Owner-occupied | Renter-occupied |
| Less than $300 | 115 (15.5%) | 0 (0.0%) |
| $300 to $499 | 199 (26.9%) | 11 (3.4%) |
| $500 to $799 | 91 (12.3%) | 14 (4.4%) |
| $800 to $999 | 134 (18.1%) | 136 (42.4%) |
| $1,000 to $1,499 | 162 (21.9%) | 98 (30.5%) |
| $1,500 to $1,999 | 5 (0.7%) | 0 (0.0%) |
| $2,000 to $2,499 | 9 (1.2%) | 0 (0.0%) |
| $2,500 to $2,999 | 0 (0.0%) | 0 (0.0%) |
| $3,000 or more | 26 (3.5%) | 0 (0.0%) |
| Total | 741 (100.0%) | 321 (100.0%) |
Physical Housing Characteristics in Brogden
Housing Structures in Brogden
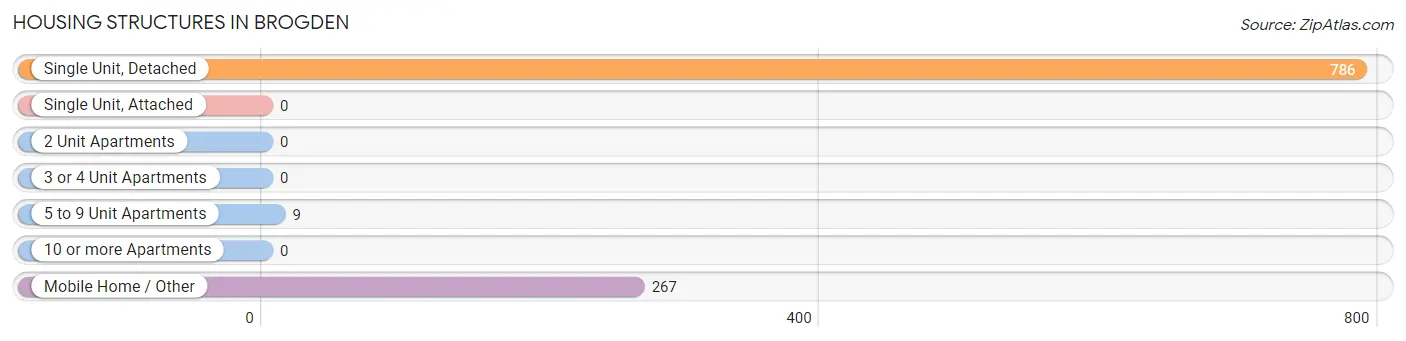
| Structure Type | # Housing Units | % Housing Units |
| Single Unit, Detached | 786 | 74.0% |
| Single Unit, Attached | 0 | 0.0% |
| 2 Unit Apartments | 0 | 0.0% |
| 3 or 4 Unit Apartments | 0 | 0.0% |
| 5 to 9 Unit Apartments | 9 | 0.9% |
| 10 or more Apartments | 0 | 0.0% |
| Mobile Home / Other | 267 | 25.1% |
| Total | 1,062 | 100.0% |
Housing Structures by Occupancy in Brogden
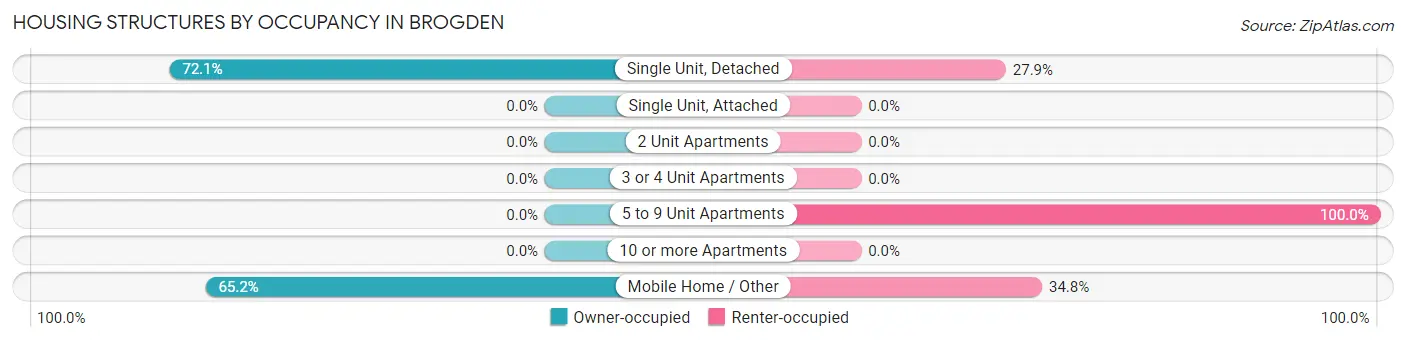
| Structure Type | Owner-occupied | Renter-occupied |
| Single Unit, Detached | 567 (72.1%) | 219 (27.9%) |
| Single Unit, Attached | 0 (0.0%) | 0 (0.0%) |
| 2 Unit Apartments | 0 (0.0%) | 0 (0.0%) |
| 3 or 4 Unit Apartments | 0 (0.0%) | 0 (0.0%) |
| 5 to 9 Unit Apartments | 0 (0.0%) | 9 (100.0%) |
| 10 or more Apartments | 0 (0.0%) | 0 (0.0%) |
| Mobile Home / Other | 174 (65.2%) | 93 (34.8%) |
| Total | 741 (69.8%) | 321 (30.2%) |
Housing Structures by Number of Rooms in Brogden
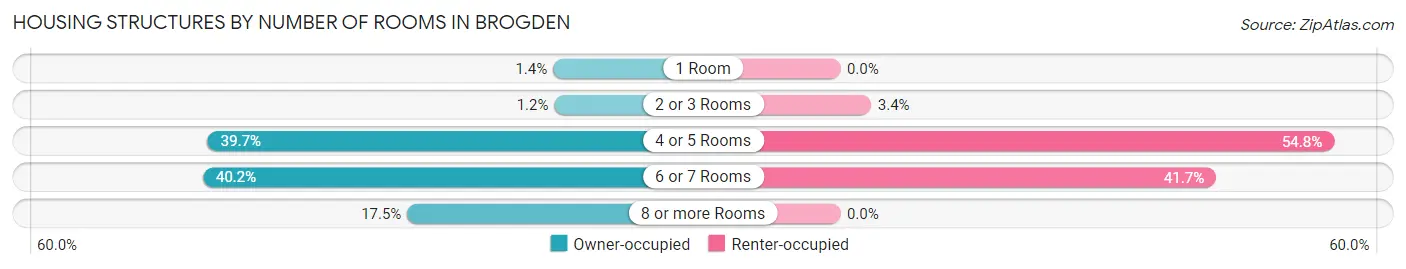
| Number of Rooms | Owner-occupied | Renter-occupied |
| 1 Room | 10 (1.3%) | 0 (0.0%) |
| 2 or 3 Rooms | 9 (1.2%) | 11 (3.4%) |
| 4 or 5 Rooms | 294 (39.7%) | 176 (54.8%) |
| 6 or 7 Rooms | 298 (40.2%) | 134 (41.7%) |
| 8 or more Rooms | 130 (17.5%) | 0 (0.0%) |
| Total | 741 (100.0%) | 321 (100.0%) |
Housing Structure by Heating Type in Brogden
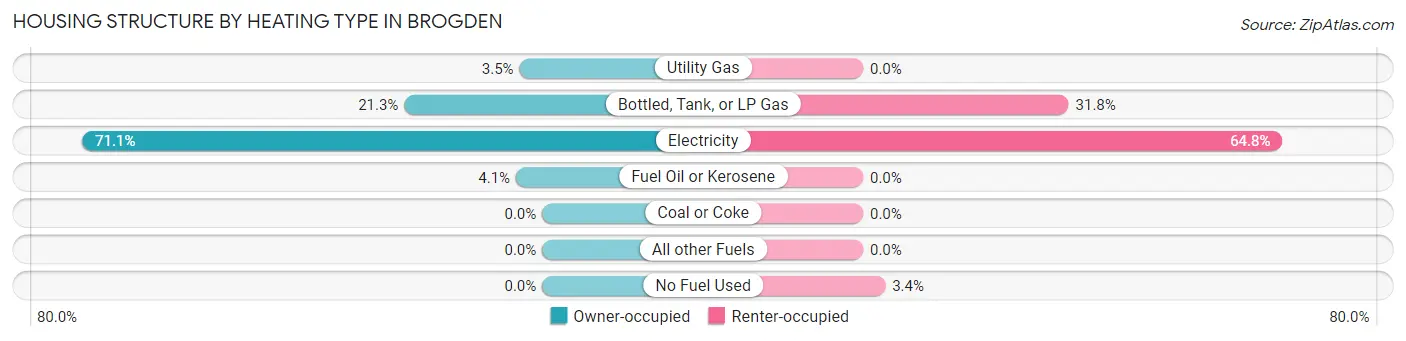
| Heating Type | Owner-occupied | Renter-occupied |
| Utility Gas | 26 (3.5%) | 0 (0.0%) |
| Bottled, Tank, or LP Gas | 158 (21.3%) | 102 (31.8%) |
| Electricity | 527 (71.1%) | 208 (64.8%) |
| Fuel Oil or Kerosene | 30 (4.1%) | 0 (0.0%) |
| Coal or Coke | 0 (0.0%) | 0 (0.0%) |
| All other Fuels | 0 (0.0%) | 0 (0.0%) |
| No Fuel Used | 0 (0.0%) | 11 (3.4%) |
| Total | 741 (100.0%) | 321 (100.0%) |
Household Vehicle Usage in Brogden
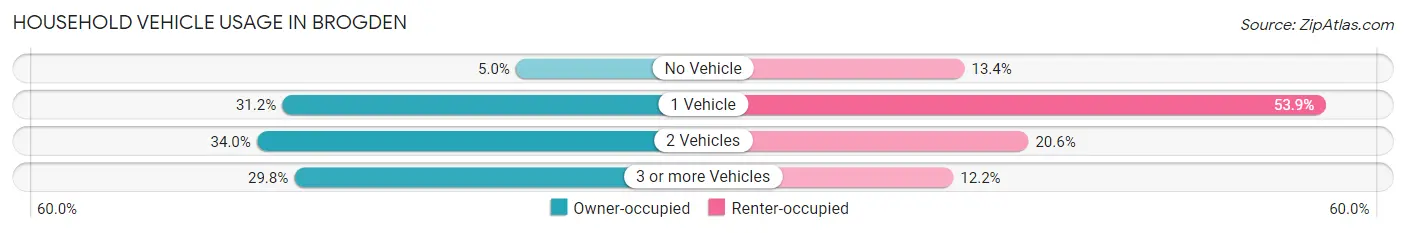
| Vehicles per Household | Owner-occupied | Renter-occupied |
| No Vehicle | 37 (5.0%) | 43 (13.4%) |
| 1 Vehicle | 231 (31.2%) | 173 (53.9%) |
| 2 Vehicles | 252 (34.0%) | 66 (20.6%) |
| 3 or more Vehicles | 221 (29.8%) | 39 (12.1%) |
| Total | 741 (100.0%) | 321 (100.0%) |
Real Estate & Mortgages in Brogden
Real Estate and Mortgage Overview in Brogden
| Characteristic | Without Mortgage | With Mortgage |
| Housing Units | 297 | 444 |
| Median Property Value | $83,100 | $119,100 |
| Median Household Income | $38,281 | $9 |
| Monthly Housing Costs | $345 | $26 |
| Real Estate Taxes | $591 | $11 |
Property Value by Mortgage Status in Brogden
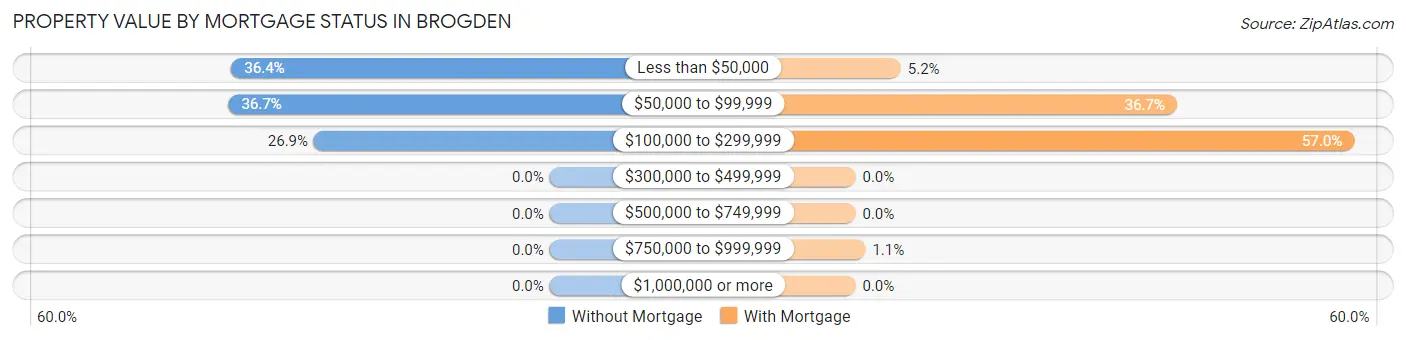
| Property Value | Without Mortgage | With Mortgage |
| Less than $50,000 | 108 (36.4%) | 23 (5.2%) |
| $50,000 to $99,999 | 109 (36.7%) | 163 (36.7%) |
| $100,000 to $299,999 | 80 (26.9%) | 253 (57.0%) |
| $300,000 to $499,999 | 0 (0.0%) | 0 (0.0%) |
| $500,000 to $749,999 | 0 (0.0%) | 0 (0.0%) |
| $750,000 to $999,999 | 0 (0.0%) | 5 (1.1%) |
| $1,000,000 or more | 0 (0.0%) | 0 (0.0%) |
| Total | 297 (100.0%) | 444 (100.0%) |
Household Income by Mortgage Status in Brogden
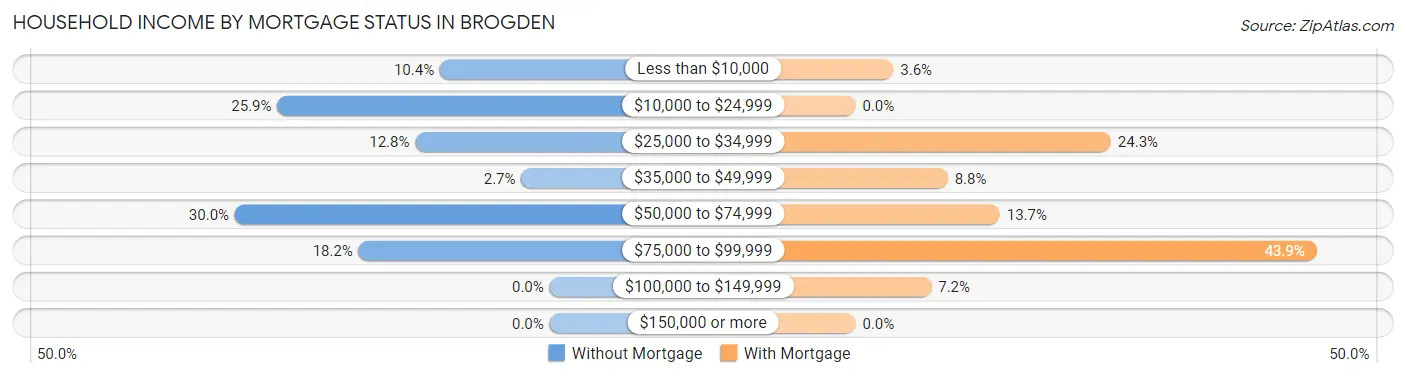
| Household Income | Without Mortgage | With Mortgage |
| Less than $10,000 | 31 (10.4%) | 16 (3.6%) |
| $10,000 to $24,999 | 77 (25.9%) | 0 (0.0%) |
| $25,000 to $34,999 | 38 (12.8%) | 108 (24.3%) |
| $35,000 to $49,999 | 8 (2.7%) | 39 (8.8%) |
| $50,000 to $74,999 | 89 (30.0%) | 61 (13.7%) |
| $75,000 to $99,999 | 54 (18.2%) | 195 (43.9%) |
| $100,000 to $149,999 | 0 (0.0%) | 32 (7.2%) |
| $150,000 or more | 0 (0.0%) | 0 (0.0%) |
| Total | 297 (100.0%) | 444 (100.0%) |
Property Value to Household Income Ratio in Brogden
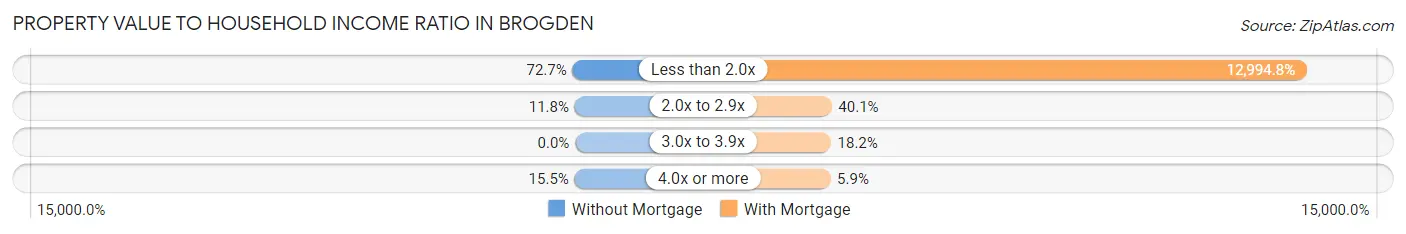
| Value-to-Income Ratio | Without Mortgage | With Mortgage |
| Less than 2.0x | 216 (72.7%) | 57,697 (12,994.8%) |
| 2.0x to 2.9x | 35 (11.8%) | 178 (40.1%) |
| 3.0x to 3.9x | 0 (0.0%) | 81 (18.2%) |
| 4.0x or more | 46 (15.5%) | 26 (5.9%) |
| Total | 297 (100.0%) | 444 (100.0%) |
Real Estate Taxes by Mortgage Status in Brogden
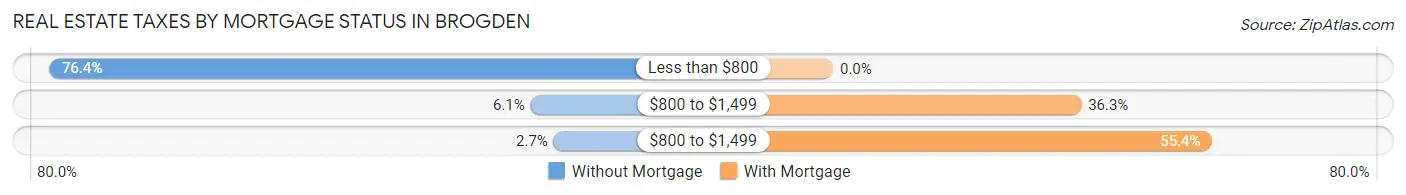
| Property Taxes | Without Mortgage | With Mortgage |
| Less than $800 | 227 (76.4%) | 0 (0.0%) |
| $800 to $1,499 | 18 (6.1%) | 161 (36.3%) |
| $800 to $1,499 | 8 (2.7%) | 246 (55.4%) |
| Total | 297 (100.0%) | 444 (100.0%) |
Health & Disability in Brogden
Health Insurance Coverage by Age in Brogden
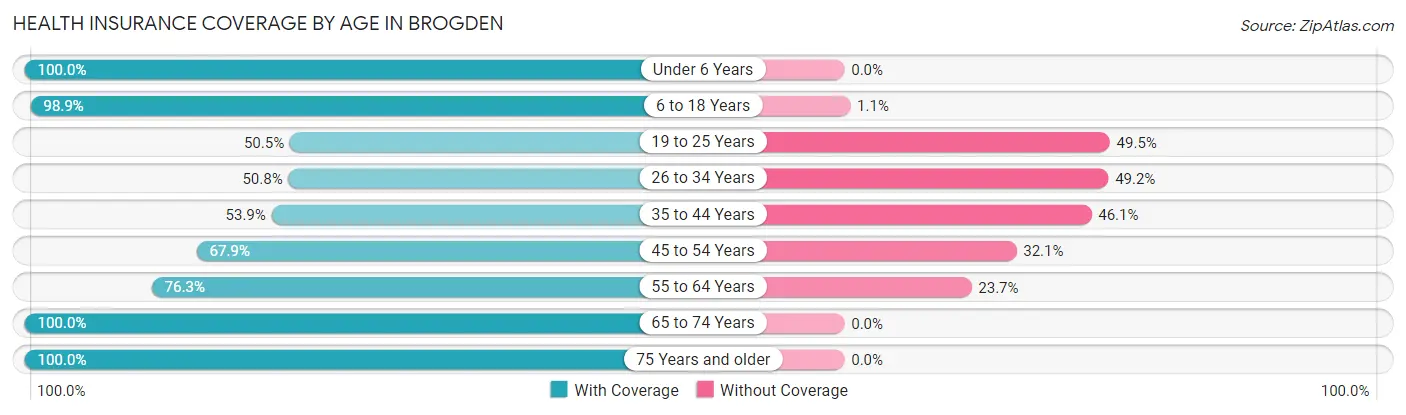
| Age Bracket | With Coverage | Without Coverage |
| Under 6 Years | 87 (100.0%) | 0 (0.0%) |
| 6 to 18 Years | 635 (98.9%) | 7 (1.1%) |
| 19 to 25 Years | 50 (50.5%) | 49 (49.5%) |
| 26 to 34 Years | 289 (50.8%) | 280 (49.2%) |
| 35 to 44 Years | 89 (53.9%) | 76 (46.1%) |
| 45 to 54 Years | 197 (67.9%) | 93 (32.1%) |
| 55 to 64 Years | 190 (76.3%) | 59 (23.7%) |
| 65 to 74 Years | 453 (100.0%) | 0 (0.0%) |
| 75 Years and older | 156 (100.0%) | 0 (0.0%) |
| Total | 2,146 (79.2%) | 564 (20.8%) |
Health Insurance Coverage by Citizenship Status in Brogden
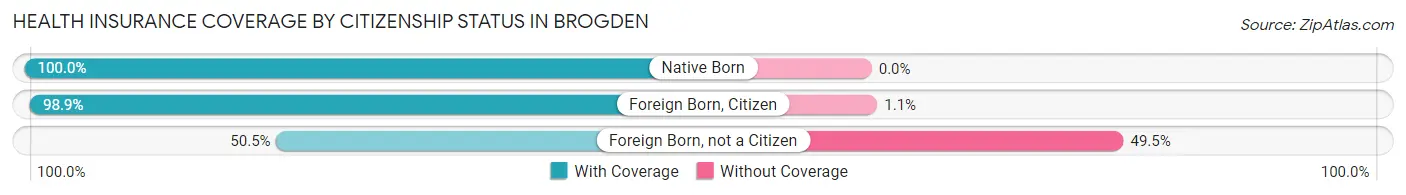
| Citizenship Status | With Coverage | Without Coverage |
| Native Born | 87 (100.0%) | 0 (0.0%) |
| Foreign Born, Citizen | 635 (98.9%) | 7 (1.1%) |
| Foreign Born, not a Citizen | 50 (50.5%) | 49 (49.5%) |
Health Insurance Coverage by Household Income in Brogden
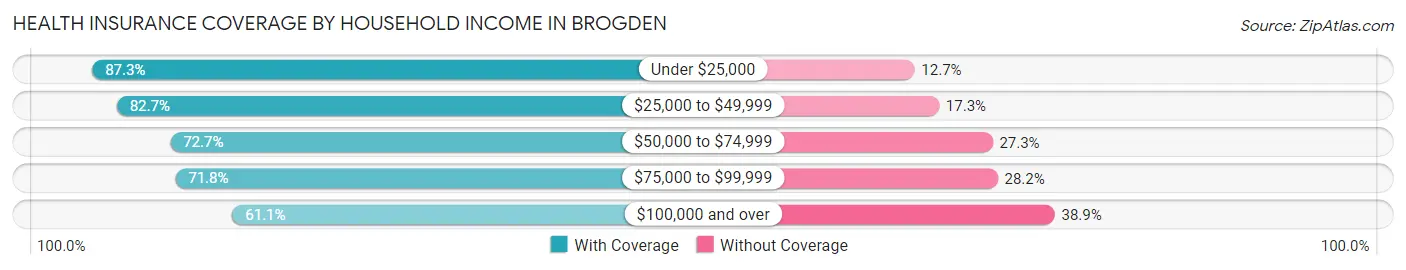
| Household Income | With Coverage | Without Coverage |
| Under $25,000 | 855 (87.3%) | 124 (12.7%) |
| $25,000 to $49,999 | 417 (82.7%) | 87 (17.3%) |
| $50,000 to $74,999 | 509 (72.7%) | 191 (27.3%) |
| $75,000 to $99,999 | 282 (71.8%) | 111 (28.2%) |
| $100,000 and over | 80 (61.1%) | 51 (38.9%) |
Public vs Private Health Insurance Coverage by Age in Brogden
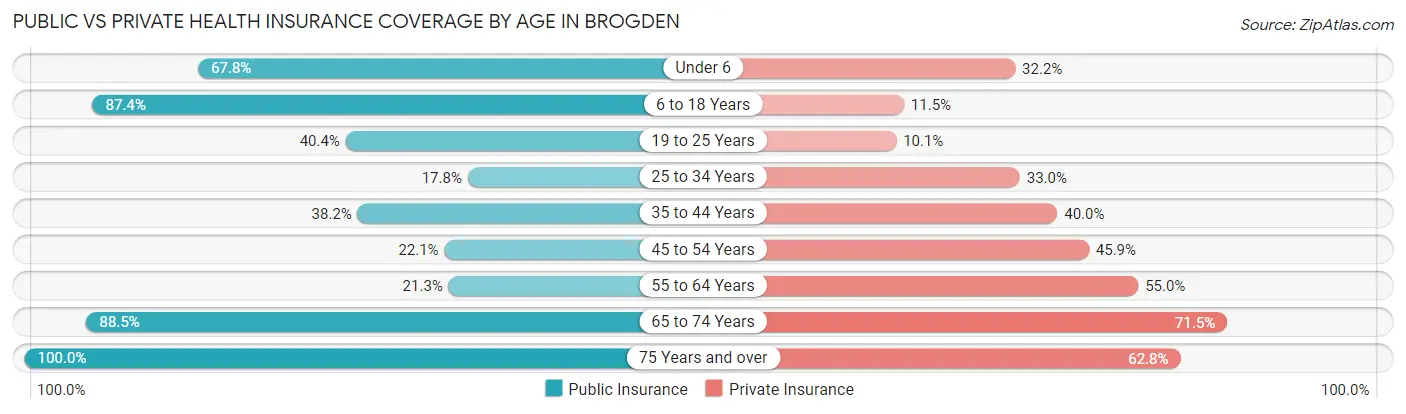
| Age Bracket | Public Insurance | Private Insurance |
| Under 6 | 59 (67.8%) | 28 (32.2%) |
| 6 to 18 Years | 561 (87.4%) | 74 (11.5%) |
| 19 to 25 Years | 40 (40.4%) | 10 (10.1%) |
| 25 to 34 Years | 101 (17.7%) | 188 (33.0%) |
| 35 to 44 Years | 63 (38.2%) | 66 (40.0%) |
| 45 to 54 Years | 64 (22.1%) | 133 (45.9%) |
| 55 to 64 Years | 53 (21.3%) | 137 (55.0%) |
| 65 to 74 Years | 401 (88.5%) | 324 (71.5%) |
| 75 Years and over | 156 (100.0%) | 98 (62.8%) |
| Total | 1,498 (55.3%) | 1,058 (39.0%) |
Disability Status by Sex by Age in Brogden
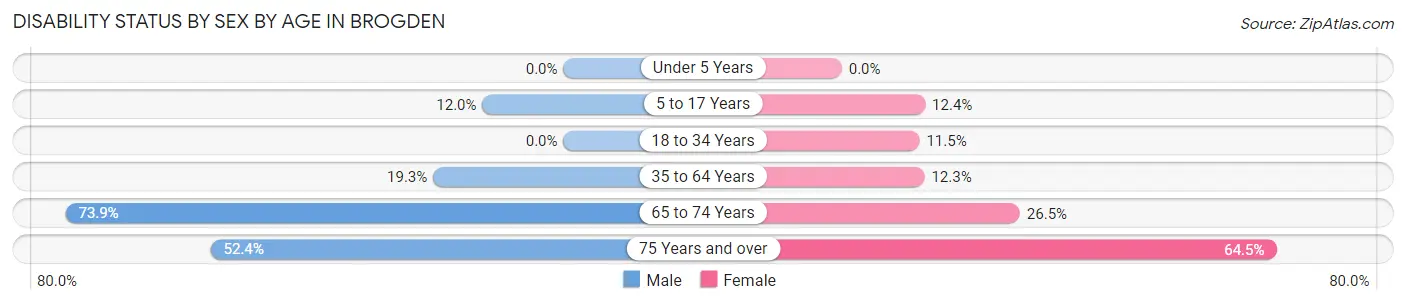
| Age Bracket | Male | Female |
| Under 5 Years | 0 (0.0%) | 0 (0.0%) |
| 5 to 17 Years | 48 (12.0%) | 26 (12.4%) |
| 18 to 34 Years | 0 (0.0%) | 36 (11.5%) |
| 35 to 64 Years | 70 (19.3%) | 42 (12.3%) |
| 65 to 74 Years | 156 (73.9%) | 64 (26.5%) |
| 75 Years and over | 33 (52.4%) | 60 (64.5%) |
Disability Class by Sex by Age in Brogden
Disability Class: Hearing Difficulty
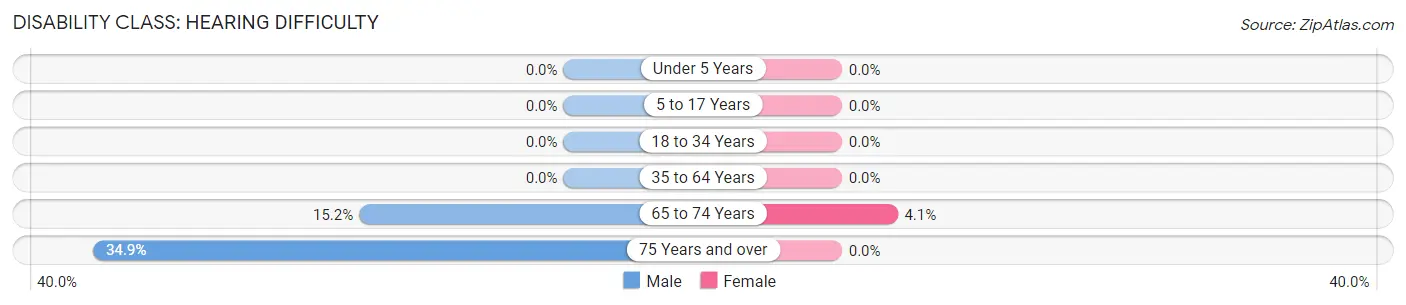
| Age Bracket | Male | Female |
| Under 5 Years | 0 (0.0%) | 0 (0.0%) |
| 5 to 17 Years | 0 (0.0%) | 0 (0.0%) |
| 18 to 34 Years | 0 (0.0%) | 0 (0.0%) |
| 35 to 64 Years | 0 (0.0%) | 0 (0.0%) |
| 65 to 74 Years | 32 (15.2%) | 10 (4.1%) |
| 75 Years and over | 22 (34.9%) | 0 (0.0%) |
Disability Class: Vision Difficulty
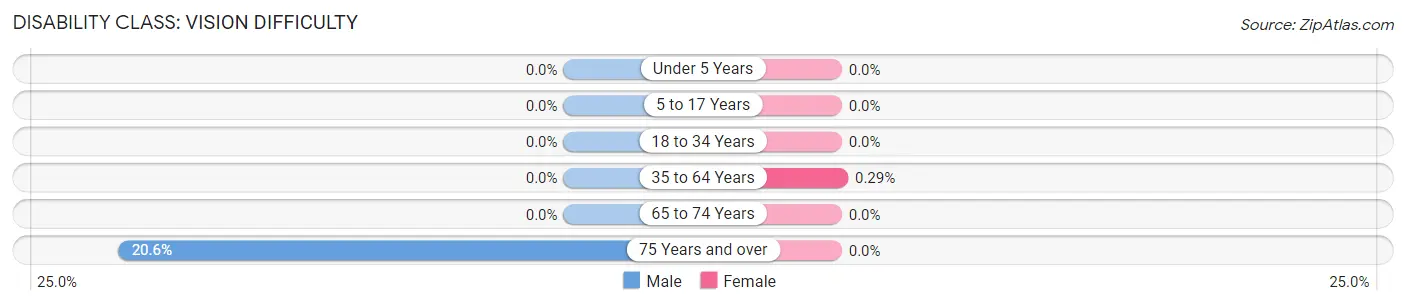
| Age Bracket | Male | Female |
| Under 5 Years | 0 (0.0%) | 0 (0.0%) |
| 5 to 17 Years | 0 (0.0%) | 0 (0.0%) |
| 18 to 34 Years | 0 (0.0%) | 0 (0.0%) |
| 35 to 64 Years | 0 (0.0%) | 1 (0.3%) |
| 65 to 74 Years | 0 (0.0%) | 0 (0.0%) |
| 75 Years and over | 13 (20.6%) | 0 (0.0%) |
Disability Class: Cognitive Difficulty
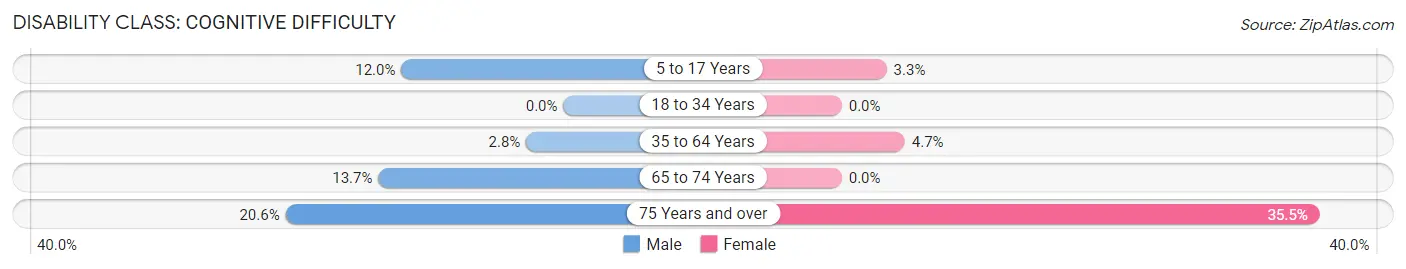
| Age Bracket | Male | Female |
| 5 to 17 Years | 48 (12.0%) | 7 (3.3%) |
| 18 to 34 Years | 0 (0.0%) | 0 (0.0%) |
| 35 to 64 Years | 10 (2.8%) | 16 (4.7%) |
| 65 to 74 Years | 29 (13.7%) | 0 (0.0%) |
| 75 Years and over | 13 (20.6%) | 33 (35.5%) |
Disability Class: Ambulatory Difficulty
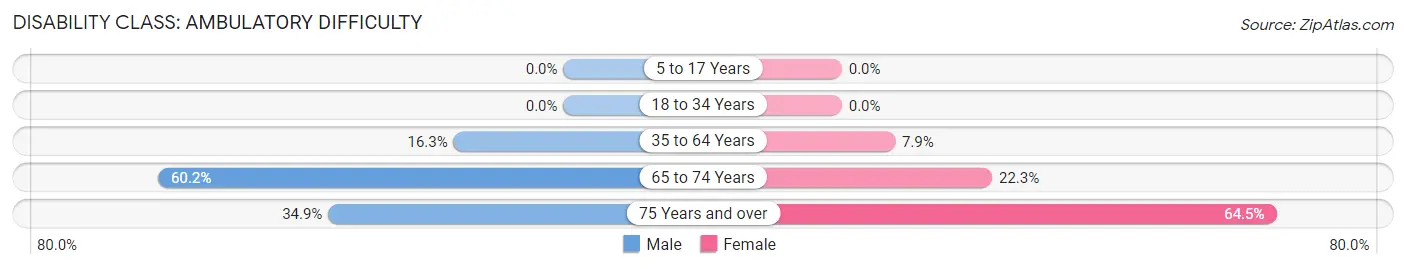
| Age Bracket | Male | Female |
| 5 to 17 Years | 0 (0.0%) | 0 (0.0%) |
| 18 to 34 Years | 0 (0.0%) | 0 (0.0%) |
| 35 to 64 Years | 59 (16.3%) | 27 (7.9%) |
| 65 to 74 Years | 127 (60.2%) | 54 (22.3%) |
| 75 Years and over | 22 (34.9%) | 60 (64.5%) |
Disability Class: Self-Care Difficulty
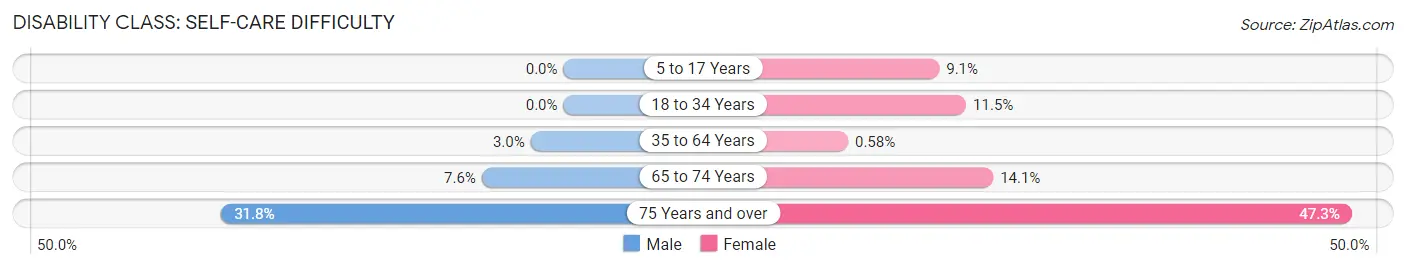
| Age Bracket | Male | Female |
| 5 to 17 Years | 0 (0.0%) | 19 (9.0%) |
| 18 to 34 Years | 0 (0.0%) | 36 (11.5%) |
| 35 to 64 Years | 11 (3.0%) | 2 (0.6%) |
| 65 to 74 Years | 16 (7.6%) | 34 (14.1%) |
| 75 Years and over | 20 (31.8%) | 44 (47.3%) |
Technology Access in Brogden
Computing Device Access in Brogden
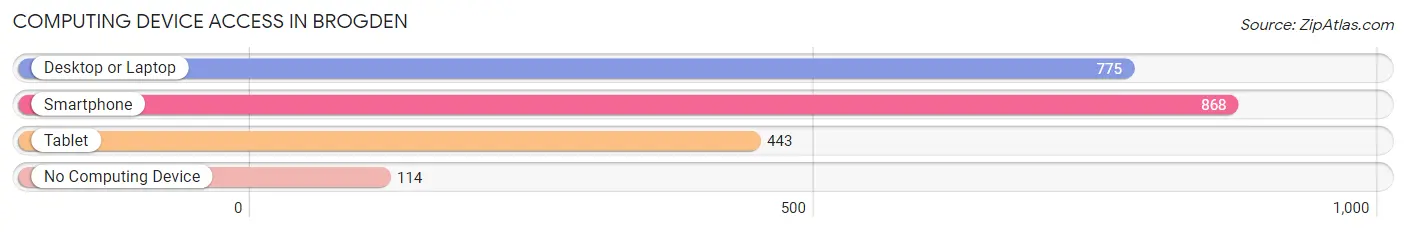
| Device Type | # Households | % Households |
| Desktop or Laptop | 775 | 73.0% |
| Smartphone | 868 | 81.7% |
| Tablet | 443 | 41.7% |
| No Computing Device | 114 | 10.7% |
| Total | 1,062 | 100.0% |
Internet Access in Brogden
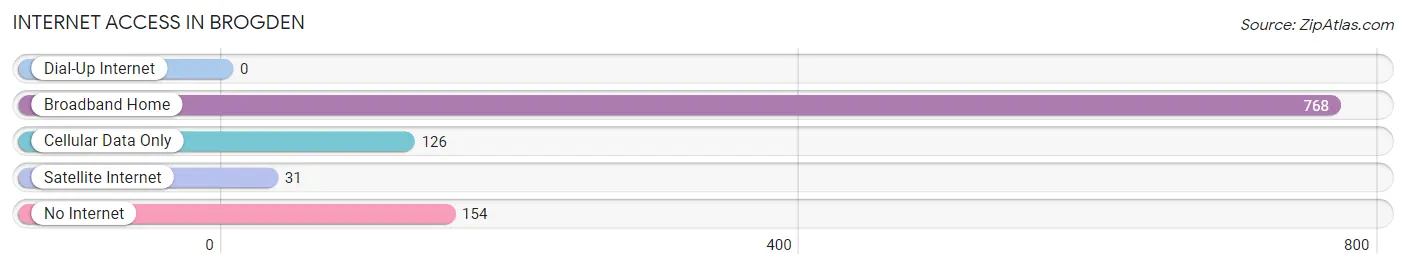
| Internet Type | # Households | % Households |
| Dial-Up Internet | 0 | 0.0% |
| Broadband Home | 768 | 72.3% |
| Cellular Data Only | 126 | 11.9% |
| Satellite Internet | 31 | 2.9% |
| No Internet | 154 | 14.5% |
| Total | 1,062 | 100.0% |
Brogden Summary
Brogden is a small unincorporated community located in Wayne County, North Carolina. It is situated in the eastern part of the county, approximately 10 miles south of the city of Goldsboro. The community is named after the Brogden family, who were among the first settlers in the area.
History
The Brogden area was first settled in the late 1700s by the Brogden family, who were among the first settlers in the area. The Brogden family was originally from England and had come to the area in search of a better life. The family established a small farm and built a log cabin, which still stands today.
In the early 1800s, the Brogden family began to expand their land holdings and built a grist mill, which was used to grind grain for the local farmers. The mill was powered by a nearby stream, which is now known as Brogden Creek.
In 1845, the Brogden family donated land for the construction of a church, which was named Brogden Methodist Church. The church still stands today and is the oldest church in Wayne County.
In the late 1800s, the Brogden area began to grow and develop. A post office was established in 1891 and a school was built in 1895. The school was later replaced by a larger building in the early 1900s.
In the early 1900s, the Brogden area began to experience a period of growth and prosperity. Several businesses were established, including a general store, a blacksmith shop, and a sawmill. The sawmill was used to produce lumber for the local farmers and for the construction of homes in the area.
In the mid-1900s, the Brogden area began to decline. The sawmill closed in the 1950s and the post office closed in the 1960s. The area experienced a period of stagnation until the late 1990s, when new businesses began to move into the area.
Geography
Brogden is located in the eastern part of Wayne County, approximately 10 miles south of the city of Goldsboro. The community is situated in a rural area and is surrounded by farmland. The area is mostly flat, with some rolling hills in the surrounding area.
The Brogden area is located in the Piedmont region of North Carolina, which is characterized by rolling hills and flat plains. The area is known for its mild climate and abundant rainfall.
Economy
The economy of Brogden is largely based on agriculture. The area is home to several farms, which produce a variety of crops, including corn, soybeans, and cotton. The area is also home to several small businesses, including a general store, a blacksmith shop, and a sawmill.
The Brogden area is also home to several manufacturing companies, which produce a variety of products, including furniture, textiles, and automotive parts. The area is also home to several distribution centers, which provide jobs for local residents.
Demographics
As of the 2010 census, the population of Brogden was 1,845. The population is largely white (94.3%) and African American (3.7%). The median household income in the area is $37,941, which is slightly lower than the state average of $45,906.
The majority of the population (90.3%) is over the age of 18, and the median age is 39. The area is home to a large number of families, with the majority (63.2%) being married couples. The area is also home to a large number of single-parent households (25.3%).
Conclusion
Brogden is a small unincorporated community located in Wayne County, North Carolina. The area was first settled in the late 1700s by the Brogden family and has since grown to become a thriving community. The area is largely agricultural, with several small businesses and manufacturing companies providing jobs for local residents. The population of Brogden is largely white and African American, with a median household income of $37,941.
Common Questions
What is the Total Population of Brogden?
Total Population of Brogden is 2,744.
What is the Total Male Population of Brogden?
Total Male Population of Brogden is 1,512.
What is the Total Female Population of Brogden?
Total Female Population of Brogden is 1,232.
What is the Ratio of Males per 100 Females in Brogden?
There are 122.73 Males per 100 Females in Brogden.
What is the Ratio of Females per 100 Males in Brogden?
There are 81.48 Females per 100 Males in Brogden.
What is the Median Population Age in Brogden?
Median Population Age in Brogden is 33.8 Years.
What is the Average Family Size in Brogden
Average Family Size in Brogden is 3.0 People.
What is the Average Household Size in Brogden
Average Household Size in Brogden is 2.6 People.
What is Per Capita Income in Brogden?
Per Capita income in Brogden is $17,501.
What is the Median Family Income in Brogden?
Median Family Income in Brogden is $50,508.
What is the Median Household income in Brogden?
Median Household Income in Brogden is $32,132.
What is Inequality or Gini Index in Brogden?
Inequality or Gini Index in Brogden is 0.38.
How Large is the Labor Force in Brogden?
There are 1,164 People in the Labor Forcein in Brogden.
What is the Percentage of People in the Labor Force in Brogden?
54.9% of People are in the Labor Force in Brogden.
What is the Unemployment Rate in Brogden?
Unemployment Rate in Brogden is 10.5%.