Spring Hope, NC
Spring Hope Map
Spring Hope Overview
1,441
TOTAL POPULATION
667
MALE POPULATION
774
FEMALE POPULATION
86.18
MALES / 100 FEMALES
116.04
FEMALES / 100 MALES
51.4
MEDIAN AGE
2.9
AVG FAMILY SIZE
2.0
AVG HOUSEHOLD SIZE
$24,381
PER CAPITA INCOME
$49,191
AVG FAMILY INCOME
$29,699
AVG HOUSEHOLD INCOME
31.1%
WAGE / INCOME GAP [ % ]
68.9¢/ $1
WAGE / INCOME GAP [ $ ]
0.46
INEQUALITY / GINI INDEX
598
LABOR FORCE [ PEOPLE ]
46.4%
PERCENT IN LABOR FORCE
8.7%
UNEMPLOYMENT RATE
Spring Hope Zip Codes
Spring Hope Area Codes
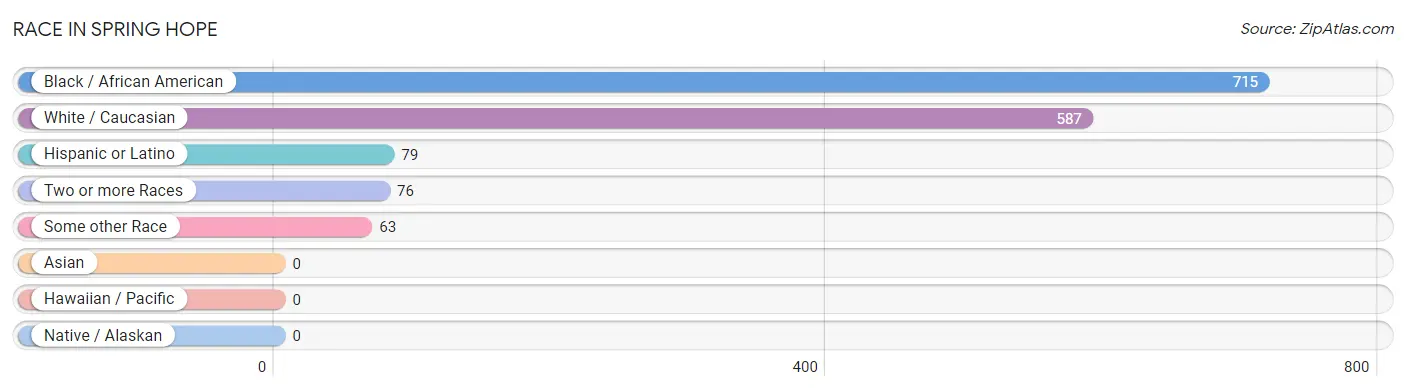
Race in Spring Hope
The most populous races in Spring Hope are Black / African American (715 | 49.6%), White / Caucasian (587 | 40.7%), and Hispanic or Latino (79 | 5.5%).
| Race | # Population | % Population |
| Asian | 0 | 0.0% |
| Black / African American | 715 | 49.6% |
| Hawaiian / Pacific | 0 | 0.0% |
| Hispanic or Latino | 79 | 5.5% |
| Native / Alaskan | 0 | 0.0% |
| White / Caucasian | 587 | 40.7% |
| Two or more Races | 76 | 5.3% |
| Some other Race | 63 | 4.4% |
| Total | 1,441 | 100.0% |
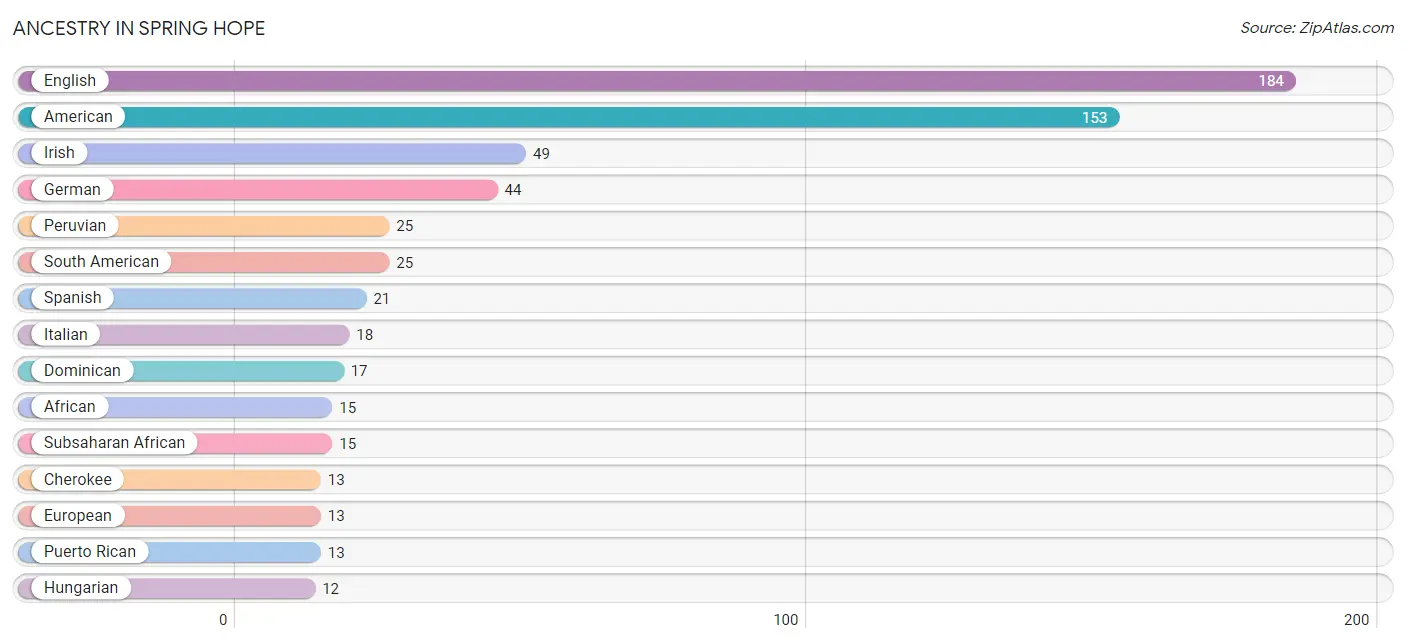
Ancestry in Spring Hope
The most populous ancestries reported in Spring Hope are English (184 | 12.8%), American (153 | 10.6%), Irish (49 | 3.4%), German (44 | 3.0%), and Peruvian (25 | 1.7%), together accounting for 31.6% of all Spring Hope residents.
| Ancestry | # Population | % Population |
| African | 15 | 1.0% |
| American | 153 | 10.6% |
| Arab | 3 | 0.2% |
| Cherokee | 13 | 0.9% |
| Dominican | 17 | 1.2% |
| Dutch | 2 | 0.1% |
| English | 184 | 12.8% |
| European | 13 | 0.9% |
| French | 9 | 0.6% |
| French Canadian | 2 | 0.1% |
| German | 44 | 3.0% |
| Hungarian | 12 | 0.8% |
| Irish | 49 | 3.4% |
| Italian | 18 | 1.3% |
| Mexican | 3 | 0.2% |
| Moroccan | 3 | 0.2% |
| Norwegian | 5 | 0.4% |
| Peruvian | 25 | 1.7% |
| Polish | 6 | 0.4% |
| Puerto Rican | 13 | 0.9% |
| Scotch-Irish | 10 | 0.7% |
| Scottish | 10 | 0.7% |
| South American | 25 | 1.7% |
| Spanish | 21 | 1.5% |
| Subsaharan African | 15 | 1.0% |
| Swiss | 2 | 0.1% | View All 26 Rows |
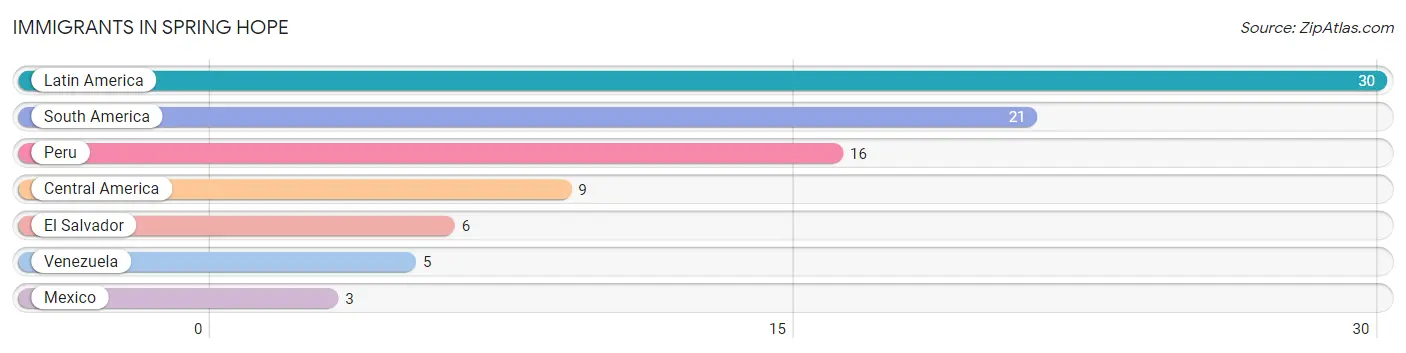
Immigrants in Spring Hope
The most numerous immigrant groups reported in Spring Hope came from Latin America (30 | 2.1%), South America (21 | 1.5%), Peru (16 | 1.1%), Central America (9 | 0.6%), and El Salvador (6 | 0.4%), together accounting for 5.7% of all Spring Hope residents.
| Immigration Origin | # Population | % Population |
| Central America | 9 | 0.6% |
| El Salvador | 6 | 0.4% |
| Latin America | 30 | 2.1% |
| Mexico | 3 | 0.2% |
| Peru | 16 | 1.1% |
| South America | 21 | 1.5% |
| Venezuela | 5 | 0.4% | View All 7 Rows |
Sex and Age in Spring Hope
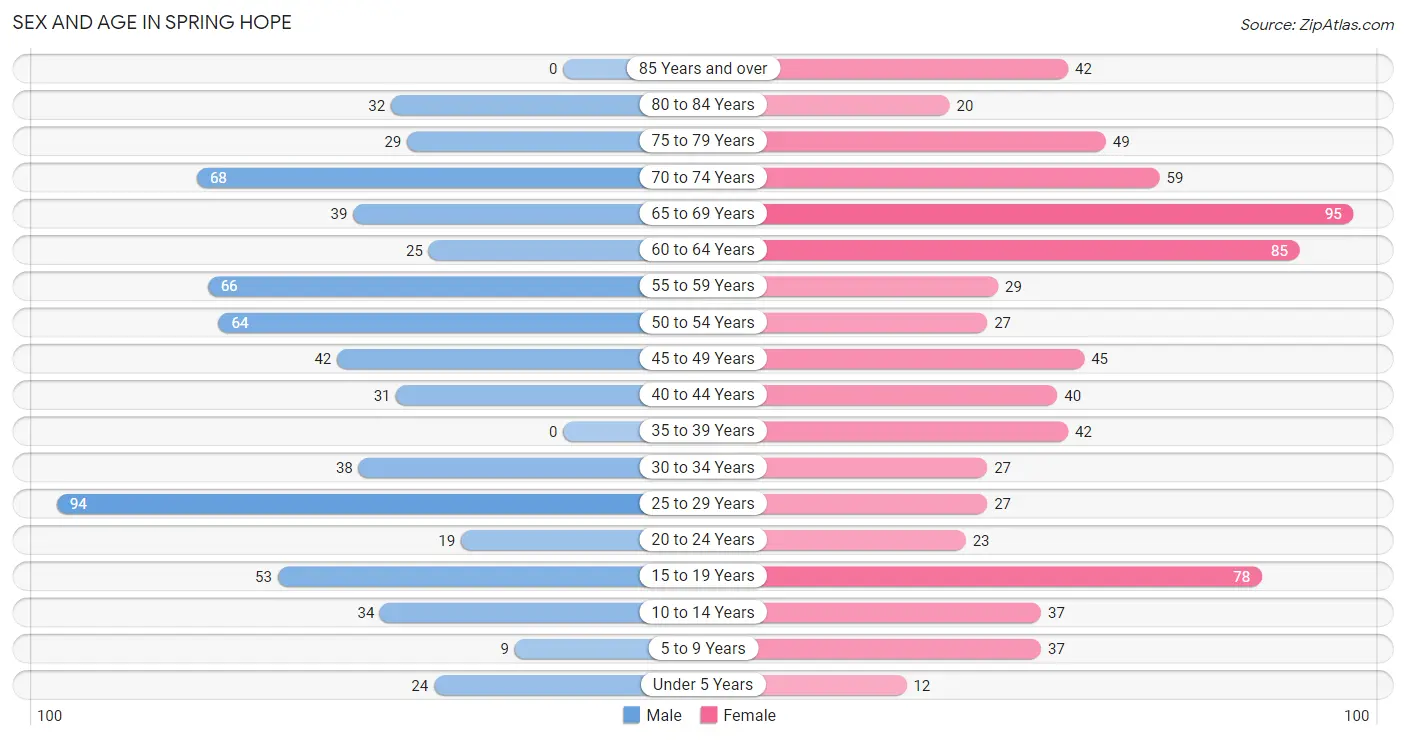
Sex and Age in Spring Hope
The most populous age groups in Spring Hope are 25 to 29 Years (94 | 14.1%) for men and 65 to 69 Years (95 | 12.3%) for women.
| Age Bracket | Male | Female |
| Under 5 Years | 24 (3.6%) | 12 (1.5%) |
| 5 to 9 Years | 9 (1.3%) | 37 (4.8%) |
| 10 to 14 Years | 34 (5.1%) | 37 (4.8%) |
| 15 to 19 Years | 53 (8.0%) | 78 (10.1%) |
| 20 to 24 Years | 19 (2.9%) | 23 (3.0%) |
| 25 to 29 Years | 94 (14.1%) | 27 (3.5%) |
| 30 to 34 Years | 38 (5.7%) | 27 (3.5%) |
| 35 to 39 Years | 0 (0.0%) | 42 (5.4%) |
| 40 to 44 Years | 31 (4.6%) | 40 (5.2%) |
| 45 to 49 Years | 42 (6.3%) | 45 (5.8%) |
| 50 to 54 Years | 64 (9.6%) | 27 (3.5%) |
| 55 to 59 Years | 66 (9.9%) | 29 (3.7%) |
| 60 to 64 Years | 25 (3.7%) | 85 (11.0%) |
| 65 to 69 Years | 39 (5.9%) | 95 (12.3%) |
| 70 to 74 Years | 68 (10.2%) | 59 (7.6%) |
| 75 to 79 Years | 29 (4.3%) | 49 (6.3%) |
| 80 to 84 Years | 32 (4.8%) | 20 (2.6%) |
| 85 Years and over | 0 (0.0%) | 42 (5.4%) |
| Total | 667 (100.0%) | 774 (100.0%) |
Families and Households in Spring Hope
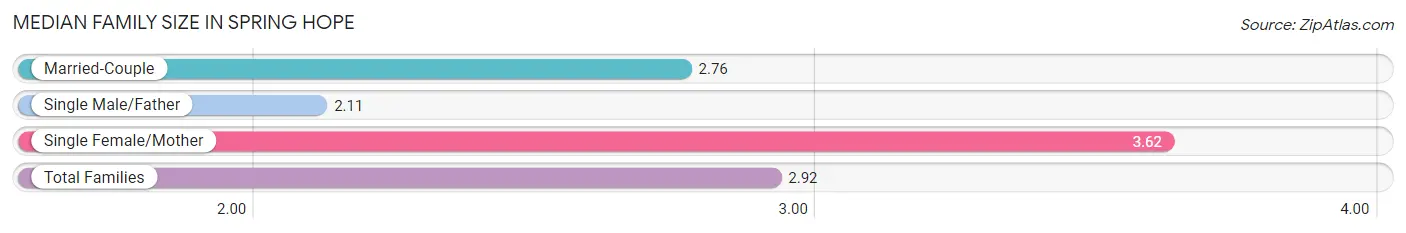
Median Family Size in Spring Hope
The median family size in Spring Hope is 2.92 persons per family, with single female/mother families (106 | 31.1%) accounting for the largest median family size of 3.62 persons per family. On the other hand, single male/father families (55 | 16.1%) represent the smallest median family size with 2.11 persons per family.
| Family Type | # Families | Family Size |
| Married-Couple | 180 (52.8%) | 2.76 |
| Single Male/Father | 55 (16.1%) | 2.11 |
| Single Female/Mother | 106 (31.1%) | 3.62 |
| Total Families | 341 (100.0%) | 2.92 |
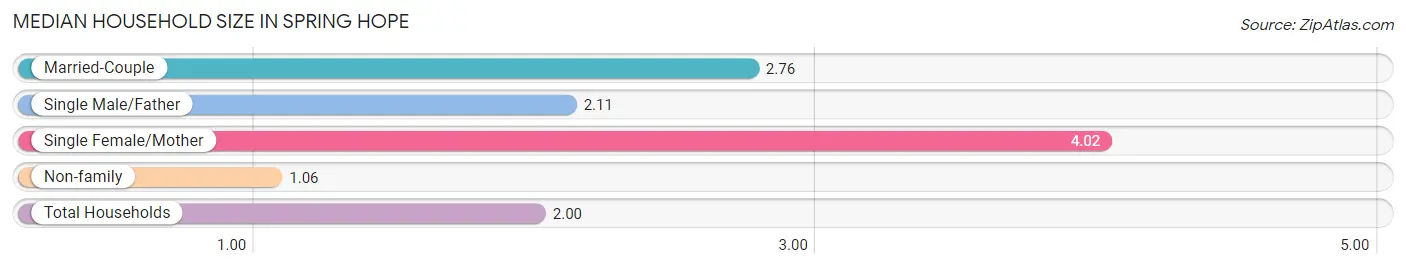
Median Household Size in Spring Hope
The median household size in Spring Hope is 2.00 persons per household, with single female/mother households (106 | 14.7%) accounting for the largest median household size of 4.02 persons per household. non-family households (378 | 52.6%) represent the smallest median household size with 1.06 persons per household.
| Household Type | # Households | Household Size |
| Married-Couple | 180 (25.0%) | 2.76 |
| Single Male/Father | 55 (7.6%) | 2.11 |
| Single Female/Mother | 106 (14.7%) | 4.02 |
| Non-family | 378 (52.6%) | 1.06 |
| Total Households | 719 (100.0%) | 2.00 |
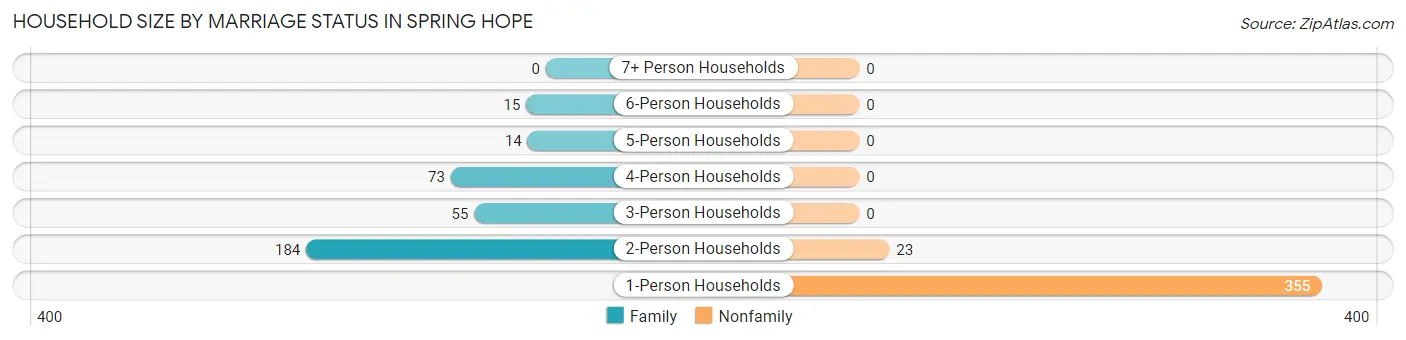
Household Size by Marriage Status in Spring Hope
Out of a total of 719 households in Spring Hope, 341 (47.4%) are family households, while 378 (52.6%) are nonfamily households. The most numerous type of family households are 2-person households, comprising 184, and the most common type of nonfamily households are 1-person households, comprising 355.
| Household Size | Family Households | Nonfamily Households |
| 1-Person Households | - | 355 (49.4%) |
| 2-Person Households | 184 (25.6%) | 23 (3.2%) |
| 3-Person Households | 55 (7.6%) | 0 (0.0%) |
| 4-Person Households | 73 (10.2%) | 0 (0.0%) |
| 5-Person Households | 14 (1.9%) | 0 (0.0%) |
| 6-Person Households | 15 (2.1%) | 0 (0.0%) |
| 7+ Person Households | 0 (0.0%) | 0 (0.0%) |
| Total | 341 (47.4%) | 378 (52.6%) |
Female Fertility in Spring Hope
Fertility by Age in Spring Hope
Average fertility rate in Spring Hope is 11.0 births per 1,000 women. Women in the age bracket of 20 to 34 years have the highest fertility rate with 39.0 births per 1,000 women. Women in the age bracket of 20 to 34 years acount for 100.0% of all women with births.
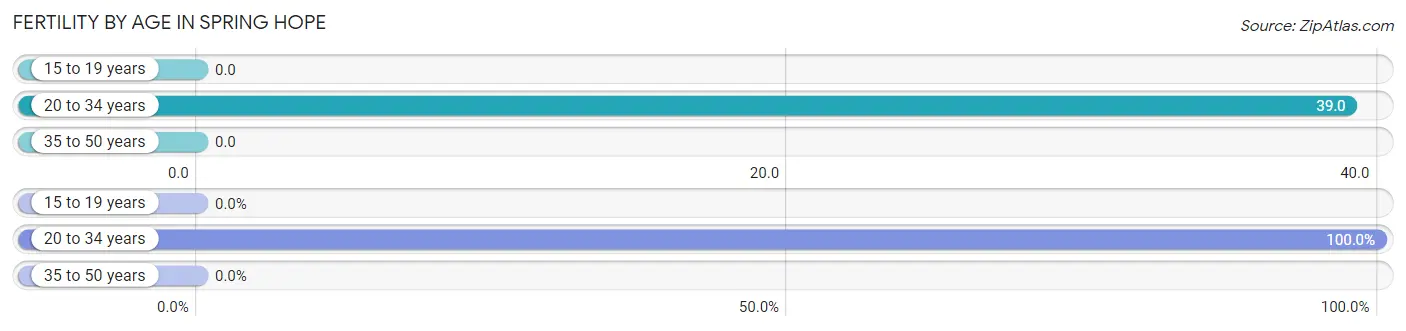
| Age Bracket | Women with Births | Births / 1,000 Women |
| 15 to 19 years | 0 (0.0%) | 0.0 |
| 20 to 34 years | 3 (100.0%) | 39.0 |
| 35 to 50 years | 0 (0.0%) | 0.0 |
| Total | 3 (100.0%) | 11.0 |
Fertility by Age by Marriage Status in Spring Hope
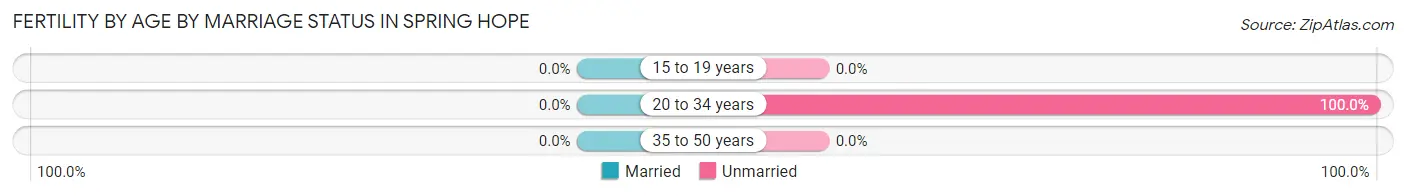
| Age Bracket | Married | Unmarried |
| 15 to 19 years | 0 (0.0%) | 0 (0.0%) |
| 20 to 34 years | 0 (0.0%) | 3 (100.0%) |
| 35 to 50 years | 0 (0.0%) | 0 (0.0%) |
| Total | 0 (0.0%) | 3 (100.0%) |
Fertility by Education in Spring Hope
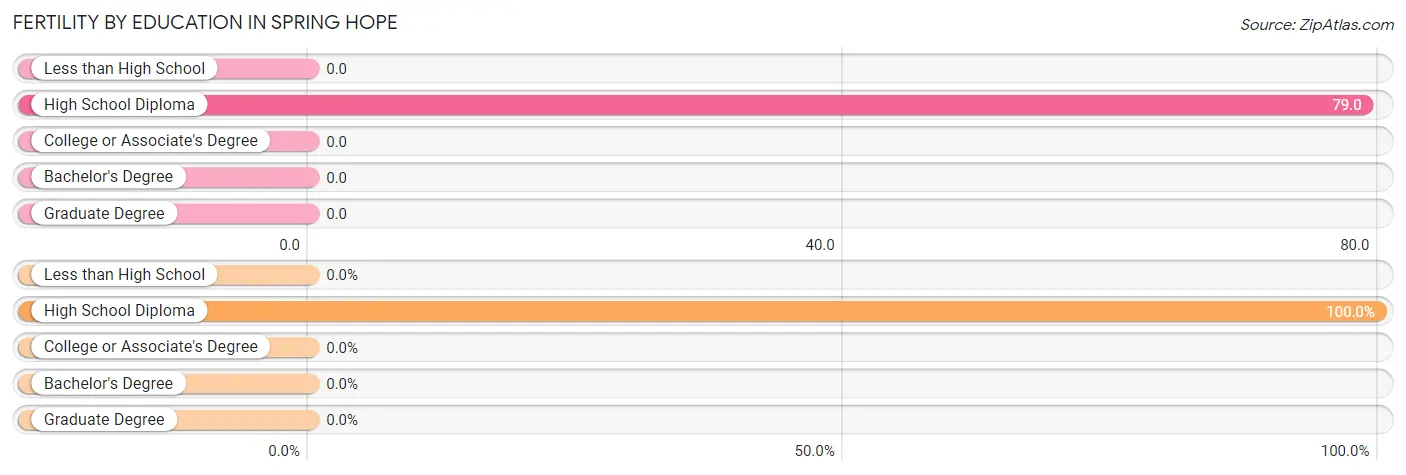
| Educational Attainment | Women with Births | Births / 1,000 Women |
| Less than High School | 0 (0.0%) | 0.0 |
| High School Diploma | 3 (100.0%) | 79.0 |
| College or Associate's Degree | 0 (0.0%) | 0.0 |
| Bachelor's Degree | 0 (0.0%) | 0.0 |
| Graduate Degree | 0 (0.0%) | 0.0 |
| Total | 3 (100.0%) | 11.0 |
Fertility by Education by Marriage Status in Spring Hope
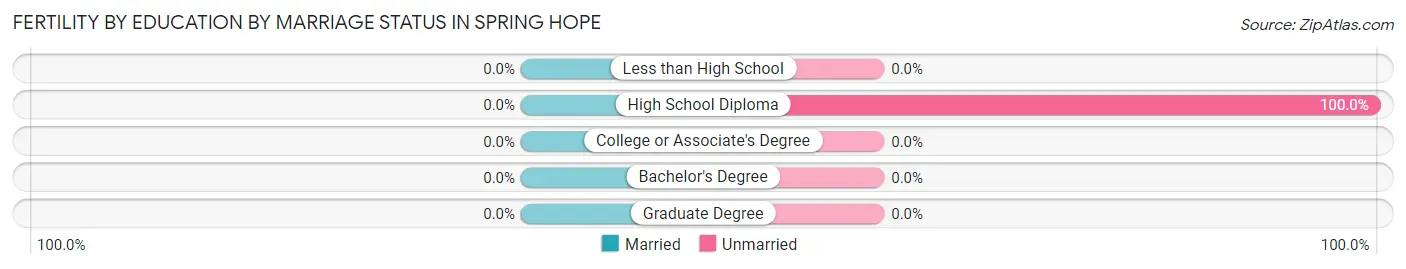
| Educational Attainment | Married | Unmarried |
| Less than High School | 0 (0.0%) | 0 (0.0%) |
| High School Diploma | 0 (0.0%) | 3 (100.0%) |
| College or Associate's Degree | 0 (0.0%) | 0 (0.0%) |
| Bachelor's Degree | 0 (0.0%) | 0 (0.0%) |
| Graduate Degree | 0 (0.0%) | 0 (0.0%) |
| Total | 0 (0.0%) | 3 (100.0%) |
Income in Spring Hope
Income Overview in Spring Hope
Per Capita Income in Spring Hope is $24,381, while median incomes of families and households are $49,191 and $29,699 respectively.
| Characteristic | Number | Measure |
| Per Capita Income | 1,441 | $24,381 |
| Median Family Income | 341 | $49,191 |
| Mean Family Income | 341 | $65,426 |
| Median Household Income | 719 | $29,699 |
| Mean Household Income | 719 | $47,200 |
| Income Deficit | 341 | $0 |
| Wage / Income Gap (%) | 1,441 | 31.06% |
| Wage / Income Gap ($) | 1,441 | 68.94¢ per $1 |
| Gini / Inequality Index | 1,441 | 0.46 |
Earnings by Sex in Spring Hope
Average Earnings in Spring Hope are $29,034, $35,536 for men and $24,500 for women, a difference of 31.1%.
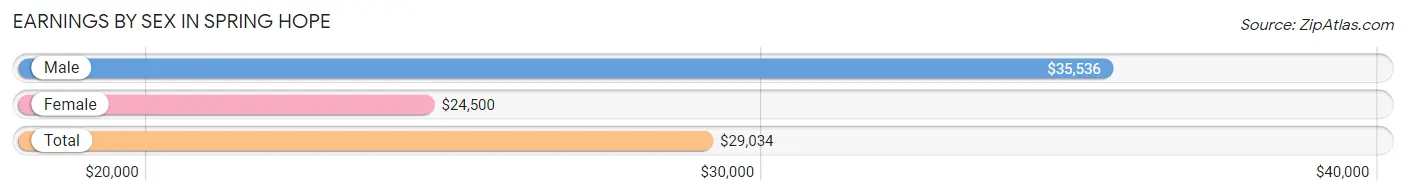
| Sex | Number | Average Earnings |
| Male | 332 (56.7%) | $35,536 |
| Female | 254 (43.3%) | $24,500 |
| Total | 586 (100.0%) | $29,034 |
Earnings by Sex by Income Bracket in Spring Hope
The most common earnings brackets in Spring Hope are $7,500 to $9,999 for men (47 | 14.2%) and $15,000 to $17,499 for women (29 | 11.4%).
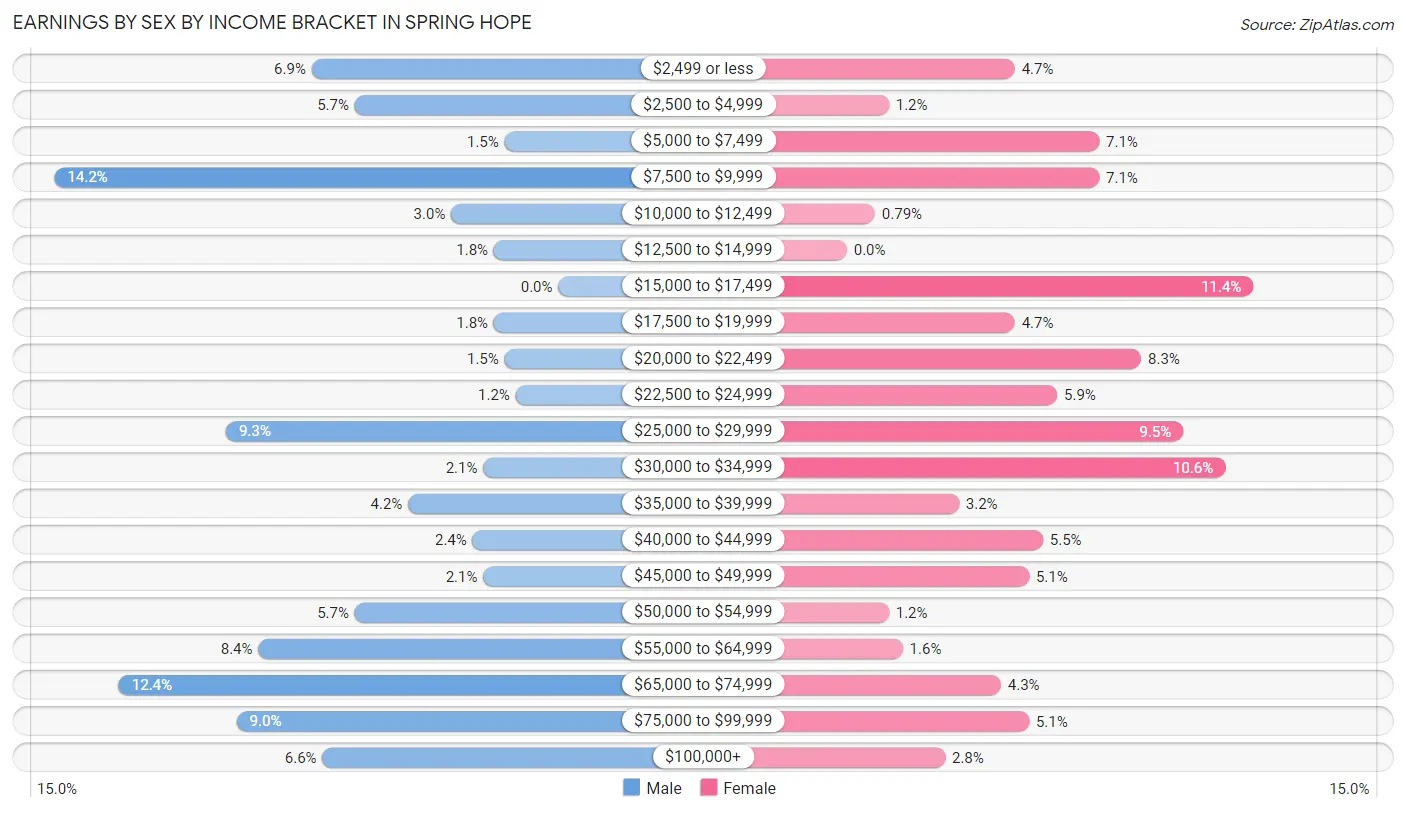
| Income | Male | Female |
| $2,499 or less | 23 (6.9%) | 12 (4.7%) |
| $2,500 to $4,999 | 19 (5.7%) | 3 (1.2%) |
| $5,000 to $7,499 | 5 (1.5%) | 18 (7.1%) |
| $7,500 to $9,999 | 47 (14.2%) | 18 (7.1%) |
| $10,000 to $12,499 | 10 (3.0%) | 2 (0.8%) |
| $12,500 to $14,999 | 6 (1.8%) | 0 (0.0%) |
| $15,000 to $17,499 | 0 (0.0%) | 29 (11.4%) |
| $17,500 to $19,999 | 6 (1.8%) | 12 (4.7%) |
| $20,000 to $22,499 | 5 (1.5%) | 21 (8.3%) |
| $22,500 to $24,999 | 4 (1.2%) | 15 (5.9%) |
| $25,000 to $29,999 | 31 (9.3%) | 24 (9.5%) |
| $30,000 to $34,999 | 7 (2.1%) | 27 (10.6%) |
| $35,000 to $39,999 | 14 (4.2%) | 8 (3.2%) |
| $40,000 to $44,999 | 8 (2.4%) | 14 (5.5%) |
| $45,000 to $49,999 | 7 (2.1%) | 13 (5.1%) |
| $50,000 to $54,999 | 19 (5.7%) | 3 (1.2%) |
| $55,000 to $64,999 | 28 (8.4%) | 4 (1.6%) |
| $65,000 to $74,999 | 41 (12.3%) | 11 (4.3%) |
| $75,000 to $99,999 | 30 (9.0%) | 13 (5.1%) |
| $100,000+ | 22 (6.6%) | 7 (2.8%) |
| Total | 332 (100.0%) | 254 (100.0%) |
Earnings by Sex by Educational Attainment in Spring Hope
Average earnings in Spring Hope are $36,161 for men and $28,269 for women, a difference of 21.8%. Men with an educational attainment of high school diploma enjoy the highest average annual earnings of $29,167, while those with high school diploma education earn the least with $29,167. Women with an educational attainment of graduate degree earn the most with the average annual earnings of $76,964, while those with bachelor's degree education have the smallest earnings of $25,000.
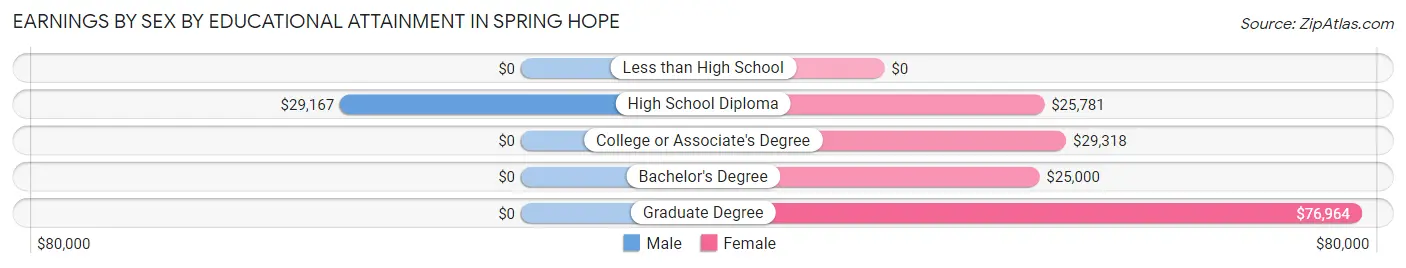
| Educational Attainment | Male Income | Female Income |
| Less than High School | - | - |
| High School Diploma | $29,167 | $25,781 |
| College or Associate's Degree | - | - |
| Bachelor's Degree | - | - |
| Graduate Degree | - | - |
| Total | $36,161 | $28,269 |
Family Income in Spring Hope
Family Income Brackets in Spring Hope
According to the Spring Hope family income data, there are 79 families falling into the $25,000 to $34,999 income range, which is the most common income bracket and makes up 23.2% of all families.
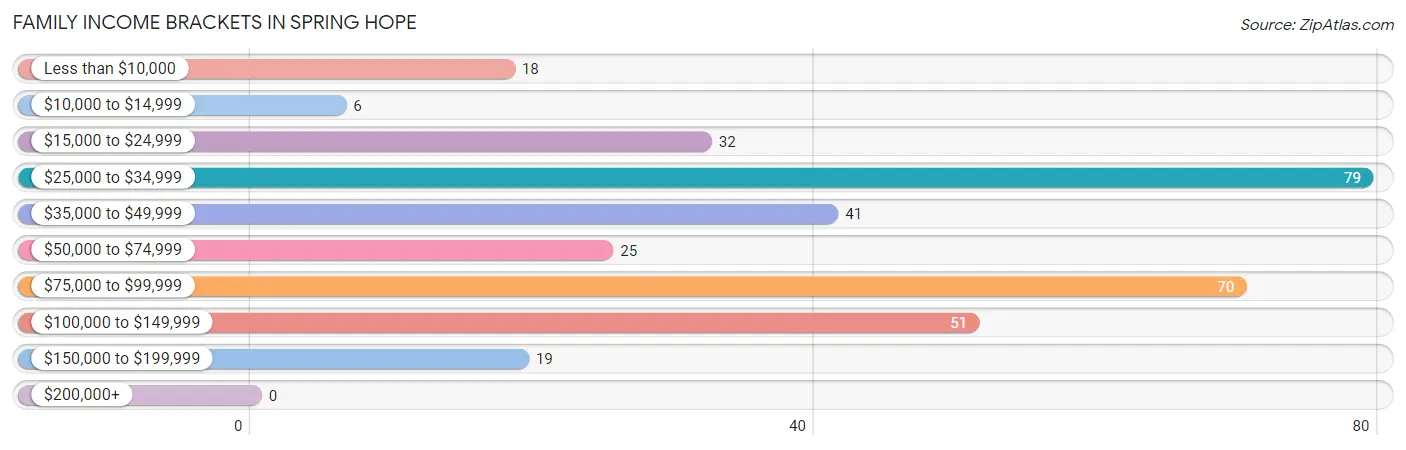
| Income Bracket | # Families | % Families |
| Less than $10,000 | 18 | 5.3% |
| $10,000 to $14,999 | 6 | 1.8% |
| $15,000 to $24,999 | 32 | 9.4% |
| $25,000 to $34,999 | 79 | 23.2% |
| $35,000 to $49,999 | 41 | 12.0% |
| $50,000 to $74,999 | 25 | 7.3% |
| $75,000 to $99,999 | 70 | 20.5% |
| $100,000 to $149,999 | 51 | 15.0% |
| $150,000 to $199,999 | 19 | 5.6% |
| $200,000+ | 0 | 0.0% |
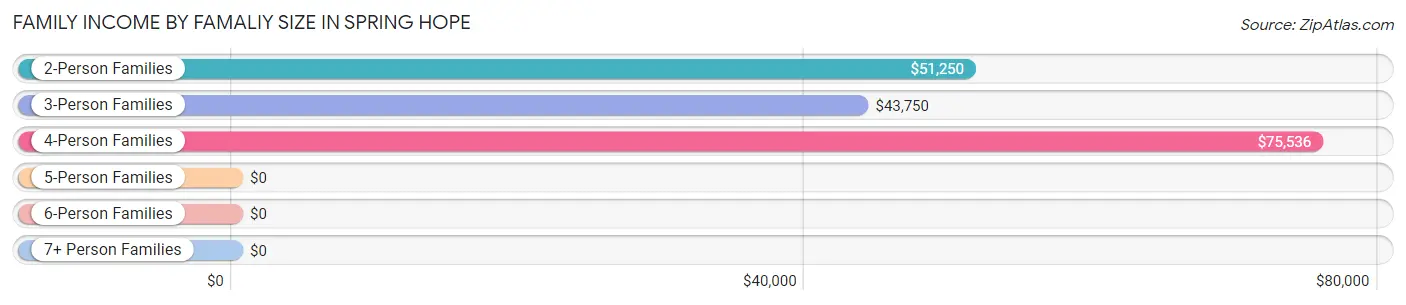
Family Income by Famaliy Size in Spring Hope
4-person families (45 | 13.2%) account for the highest median family income in Spring Hope with $75,536 per family, while 2-person families (190 | 55.7%) have the highest median income of $25,625 per family member.
| Income Bracket | # Families | Median Income |
| 2-Person Families | 190 (55.7%) | $51,250 |
| 3-Person Families | 77 (22.6%) | $43,750 |
| 4-Person Families | 45 (13.2%) | $75,536 |
| 5-Person Families | 14 (4.1%) | $0 |
| 6-Person Families | 15 (4.4%) | $0 |
| 7+ Person Families | 0 (0.0%) | $0 |
| Total | 341 (100.0%) | $49,191 |
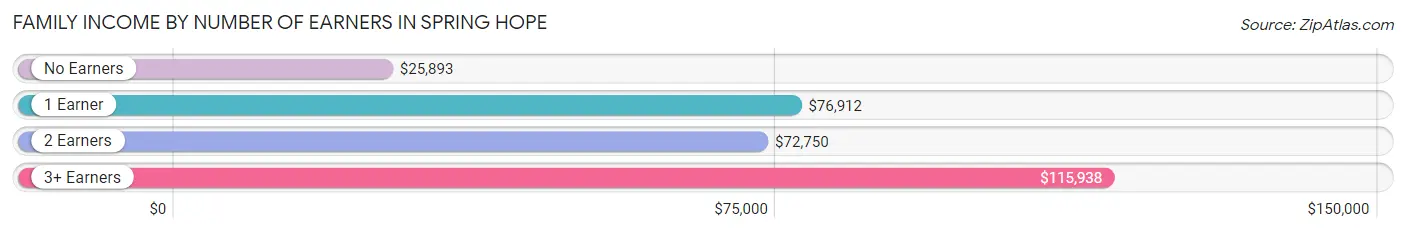
Family Income by Number of Earners in Spring Hope
The median family income in Spring Hope is $49,191, with families comprising 3+ earners (16) having the highest median family income of $115,938, while families with no earners (106) have the lowest median family income of $25,893, accounting for 4.7% and 31.1% of families, respectively.
| Number of Earners | # Families | Median Income |
| No Earners | 106 (31.1%) | $25,893 |
| 1 Earner | 120 (35.2%) | $76,912 |
| 2 Earners | 99 (29.0%) | $72,750 |
| 3+ Earners | 16 (4.7%) | $115,938 |
| Total | 341 (100.0%) | $49,191 |
Household Income in Spring Hope
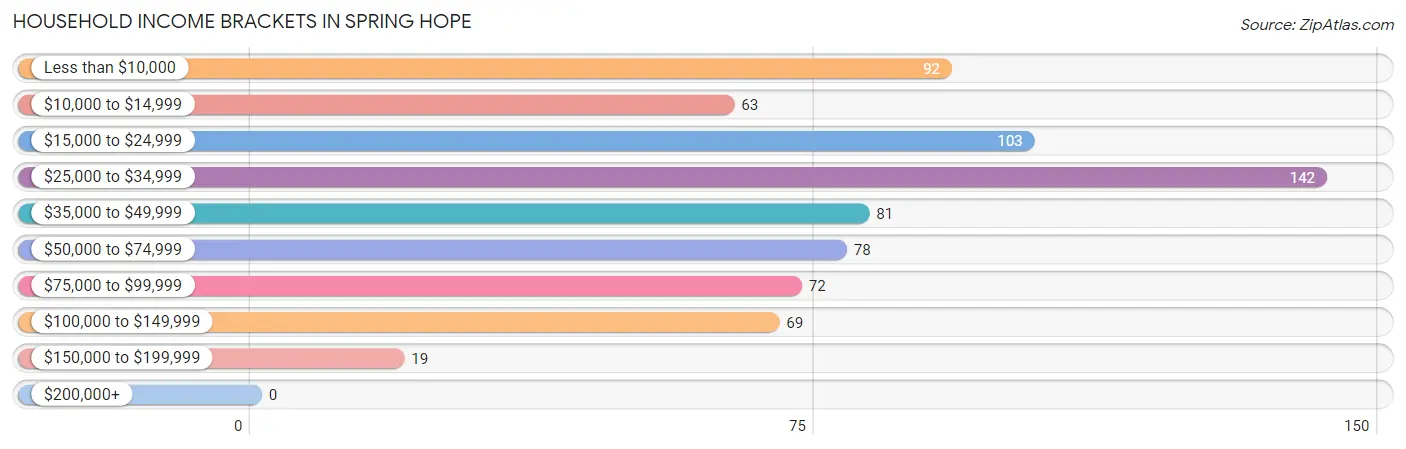
Household Income Brackets in Spring Hope
With 142 households falling in the category, the $25,000 to $34,999 income range is the most frequent in Spring Hope, accounting for 19.8% of all households.
| Income Bracket | # Households | % Households |
| Less than $10,000 | 92 | 12.8% |
| $10,000 to $14,999 | 63 | 8.8% |
| $15,000 to $24,999 | 103 | 14.3% |
| $25,000 to $34,999 | 142 | 19.7% |
| $35,000 to $49,999 | 81 | 11.3% |
| $50,000 to $74,999 | 78 | 10.8% |
| $75,000 to $99,999 | 72 | 10.0% |
| $100,000 to $149,999 | 69 | 9.6% |
| $150,000 to $199,999 | 19 | 2.6% |
| $200,000+ | 0 | 0.0% |
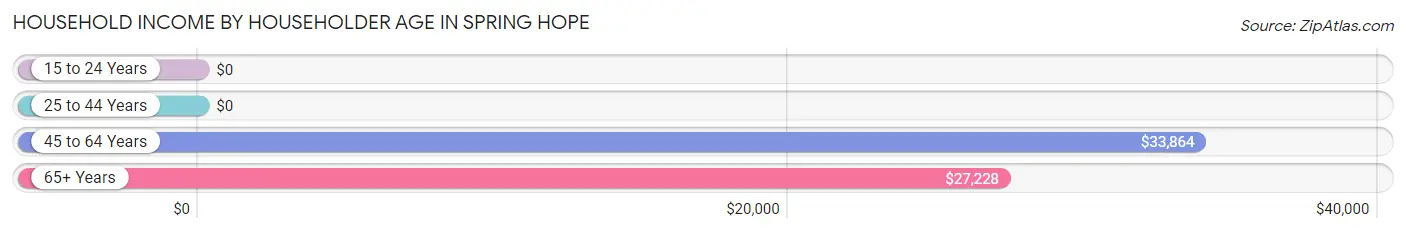
Household Income by Householder Age in Spring Hope
The median household income in Spring Hope is $29,699, with the highest median household income of $33,864 found in the 45 to 64 years age bracket for the primary householder. A total of 246 households (34.2%) fall into this category. Meanwhile, the 15 to 24 years age bracket for the primary householder has the lowest median household income of $0, with 5 households (0.7%) in this group.
| Income Bracket | # Households | Median Income |
| 15 to 24 Years | 5 (0.7%) | $0 |
| 25 to 44 Years | 164 (22.8%) | $0 |
| 45 to 64 Years | 246 (34.2%) | $33,864 |
| 65+ Years | 304 (42.3%) | $27,228 |
| Total | 719 (100.0%) | $29,699 |
Poverty in Spring Hope
Income Below Poverty by Sex and Age in Spring Hope
With 23.8% poverty level for males and 18.5% for females among the residents of Spring Hope, 6 to 11 year old males and 12 to 14 year old females are the most vulnerable to poverty, with 9 males (100.0%) and 9 females (42.9%) in their respective age groups living below the poverty level.
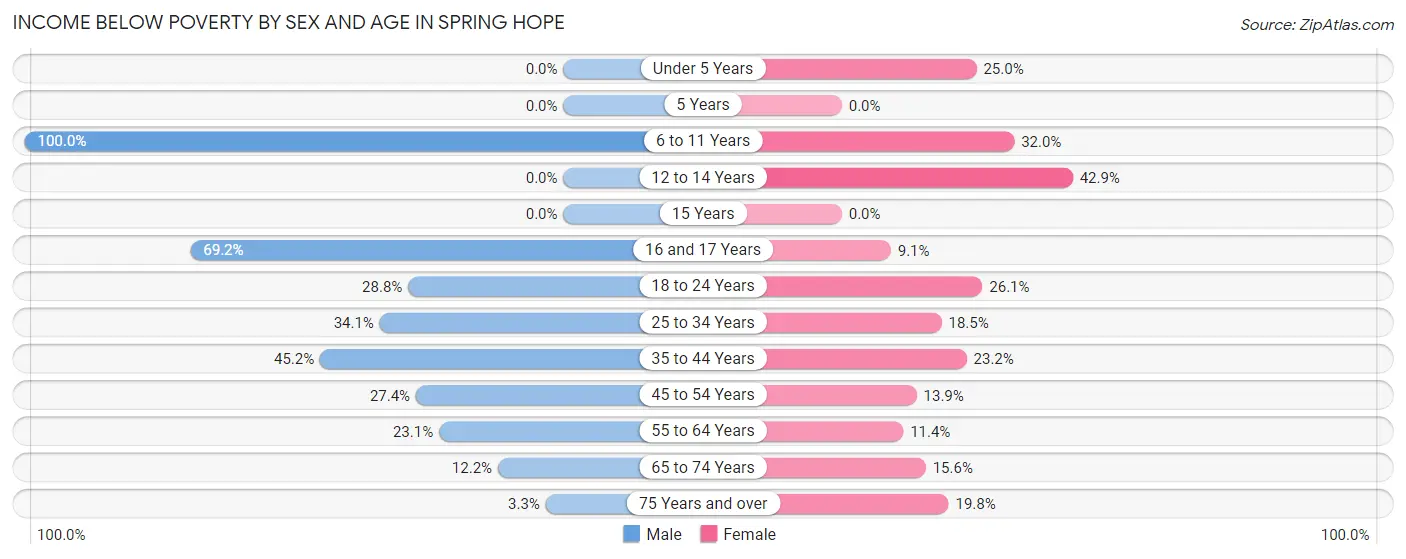
| Age Bracket | Male | Female |
| Under 5 Years | 0 (0.0%) | 3 (25.0%) |
| 5 Years | 0 (0.0%) | 0 (0.0%) |
| 6 to 11 Years | 9 (100.0%) | 16 (32.0%) |
| 12 to 14 Years | 0 (0.0%) | 9 (42.9%) |
| 15 Years | 0 (0.0%) | 0 (0.0%) |
| 16 and 17 Years | 9 (69.2%) | 5 (9.1%) |
| 18 to 24 Years | 17 (28.8%) | 12 (26.1%) |
| 25 to 34 Years | 45 (34.1%) | 10 (18.5%) |
| 35 to 44 Years | 14 (45.2%) | 19 (23.2%) |
| 45 to 54 Years | 29 (27.4%) | 10 (13.9%) |
| 55 to 64 Years | 21 (23.1%) | 13 (11.4%) |
| 65 to 74 Years | 13 (12.1%) | 24 (15.6%) |
| 75 Years and over | 2 (3.3%) | 22 (19.8%) |
| Total | 159 (23.8%) | 143 (18.5%) |
Income Above Poverty by Sex and Age in Spring Hope
According to the poverty statistics in Spring Hope, males aged under 5 years and females aged 16 and 17 years are the age groups that are most secure financially, with 100.0% of males and 90.9% of females in these age groups living above the poverty line.
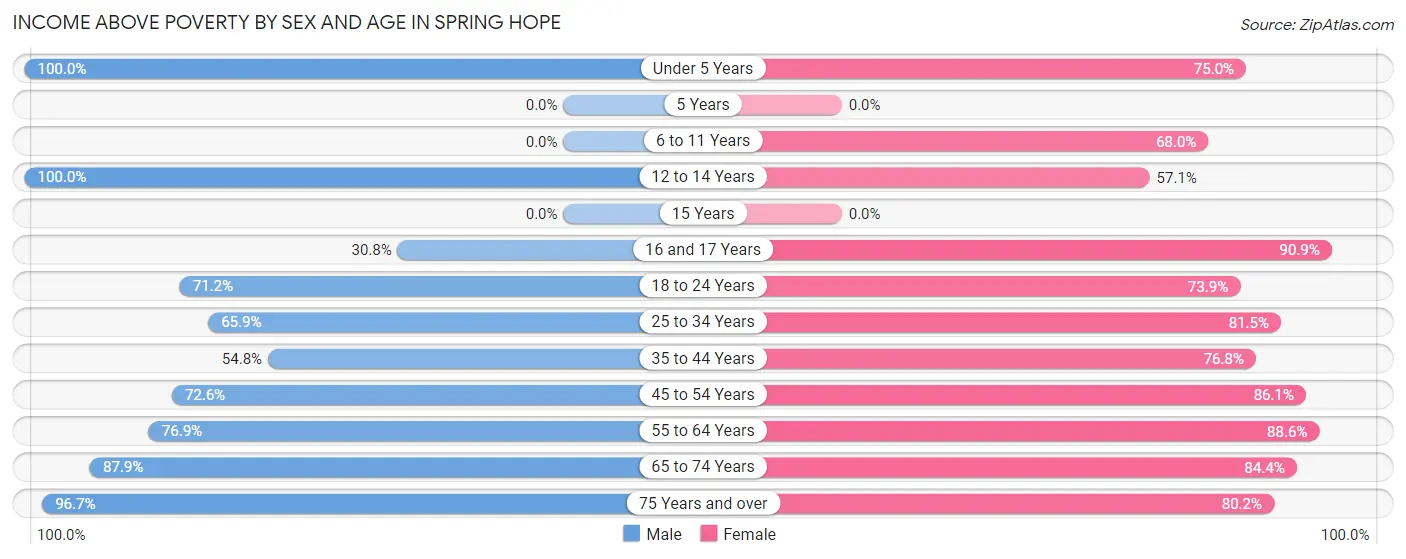
| Age Bracket | Male | Female |
| Under 5 Years | 24 (100.0%) | 9 (75.0%) |
| 5 Years | 0 (0.0%) | 0 (0.0%) |
| 6 to 11 Years | 0 (0.0%) | 34 (68.0%) |
| 12 to 14 Years | 34 (100.0%) | 12 (57.1%) |
| 15 Years | 0 (0.0%) | 0 (0.0%) |
| 16 and 17 Years | 4 (30.8%) | 50 (90.9%) |
| 18 to 24 Years | 42 (71.2%) | 34 (73.9%) |
| 25 to 34 Years | 87 (65.9%) | 44 (81.5%) |
| 35 to 44 Years | 17 (54.8%) | 63 (76.8%) |
| 45 to 54 Years | 77 (72.6%) | 62 (86.1%) |
| 55 to 64 Years | 70 (76.9%) | 101 (88.6%) |
| 65 to 74 Years | 94 (87.8%) | 130 (84.4%) |
| 75 Years and over | 59 (96.7%) | 89 (80.2%) |
| Total | 508 (76.2%) | 628 (81.5%) |
Income Below Poverty Among Married-Couple Families in Spring Hope
The poverty statistics for married-couple families in Spring Hope show that 8.9% or 16 of the total 180 families live below the poverty line. Families with 1 or 2 children have the highest poverty rate of 27.1%, comprising of 16 families. On the other hand, families with no children have the lowest poverty rate of 0.0%, which includes 0 families.
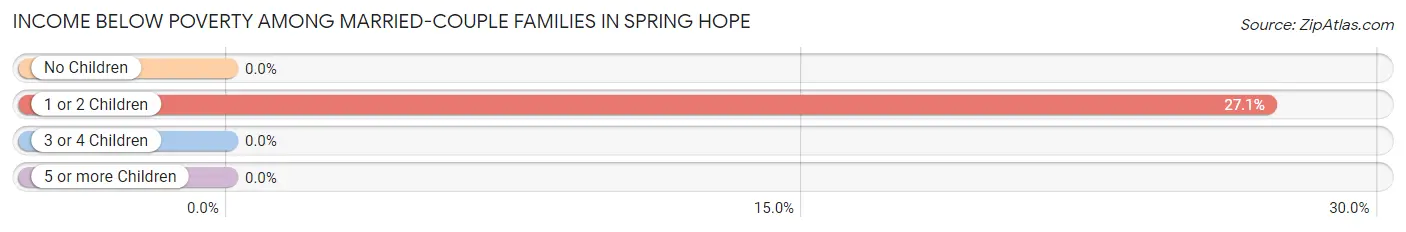
| Children | Above Poverty | Below Poverty |
| No Children | 118 (100.0%) | 0 (0.0%) |
| 1 or 2 Children | 43 (72.9%) | 16 (27.1%) |
| 3 or 4 Children | 3 (100.0%) | 0 (0.0%) |
| 5 or more Children | 0 (0.0%) | 0 (0.0%) |
| Total | 164 (91.1%) | 16 (8.9%) |
Income Below Poverty Among Single-Parent Households in Spring Hope
According to the poverty data in Spring Hope, 18.2% or 10 single-father households and 22.6% or 24 single-mother households are living below the poverty line. Among single-father households, those with 1 or 2 children have the highest poverty rate, with 7 households (26.9%) experiencing poverty. Likewise, among single-mother households, those with no children have the highest poverty rate, with 18 households (40.0%) falling below the poverty line.
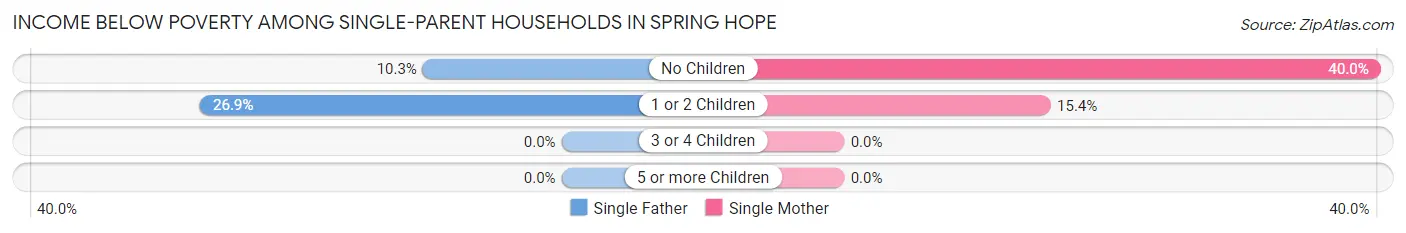
| Children | Single Father | Single Mother |
| No Children | 3 (10.3%) | 18 (40.0%) |
| 1 or 2 Children | 7 (26.9%) | 6 (15.4%) |
| 3 or 4 Children | 0 (0.0%) | 0 (0.0%) |
| 5 or more Children | 0 (0.0%) | 0 (0.0%) |
| Total | 10 (18.2%) | 24 (22.6%) |
Income Below Poverty Among Married-Couple vs Single-Parent Households in Spring Hope
The poverty data for Spring Hope shows that 16 of the married-couple family households (8.9%) and 34 of the single-parent households (21.1%) are living below the poverty level. Within the married-couple family households, those with 1 or 2 children have the highest poverty rate, with 16 households (27.1%) falling below the poverty line. Among the single-parent households, those with no children have the highest poverty rate, with 21 household (28.4%) living below poverty.
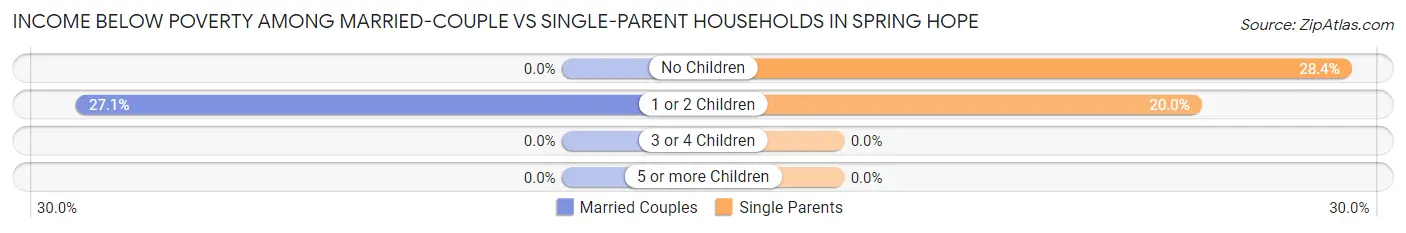
| Children | Married-Couple Families | Single-Parent Households |
| No Children | 0 (0.0%) | 21 (28.4%) |
| 1 or 2 Children | 16 (27.1%) | 13 (20.0%) |
| 3 or 4 Children | 0 (0.0%) | 0 (0.0%) |
| 5 or more Children | 0 (0.0%) | 0 (0.0%) |
| Total | 16 (8.9%) | 34 (21.1%) |
Employment Characteristics in Spring Hope
Employment by Class of Employer in Spring Hope
Among the 545 employed individuals in Spring Hope, private company employees (407 | 74.7%), state government employees (41 | 7.5%), and local government employees (33 | 6.1%) make up the most common classes of employment.
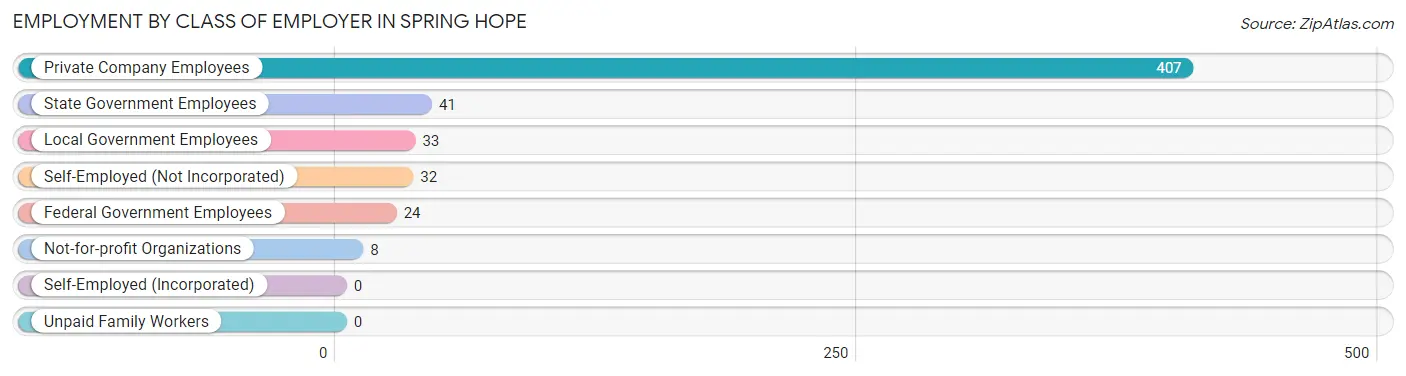
| Employer Class | # Employees | % Employees |
| Private Company Employees | 407 | 74.7% |
| Self-Employed (Incorporated) | 0 | 0.0% |
| Self-Employed (Not Incorporated) | 32 | 5.9% |
| Not-for-profit Organizations | 8 | 1.5% |
| Local Government Employees | 33 | 6.1% |
| State Government Employees | 41 | 7.5% |
| Federal Government Employees | 24 | 4.4% |
| Unpaid Family Workers | 0 | 0.0% |
| Total | 545 | 100.0% |
Employment Status by Age in Spring Hope
According to the labor force statistics for Spring Hope, out of the total population over 16 years of age (1,288), 46.4% or 598 individuals are in the labor force, with 8.7% or 52 of them unemployed. The age group with the highest labor force participation rate is 30 to 34 years, with 95.4% or 62 individuals in the labor force. Within the labor force, the 20 to 24 years age range has the highest percentage of unemployed individuals, with 27.6% or 8 of them being unemployed.
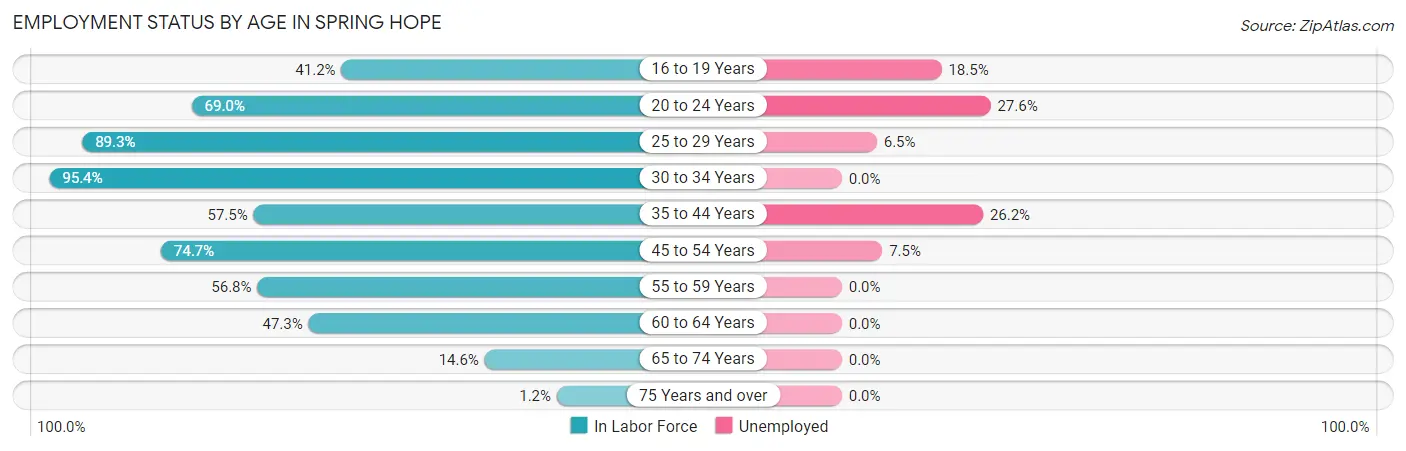
| Age Bracket | In Labor Force | Unemployed |
| 16 to 19 Years | 54 (41.2%) | 10 (18.5%) |
| 20 to 24 Years | 29 (69.0%) | 8 (27.6%) |
| 25 to 29 Years | 108 (89.3%) | 7 (6.5%) |
| 30 to 34 Years | 62 (95.4%) | 0 (0.0%) |
| 35 to 44 Years | 65 (57.5%) | 17 (26.2%) |
| 45 to 54 Years | 133 (74.7%) | 10 (7.5%) |
| 55 to 59 Years | 54 (56.8%) | 0 (0.0%) |
| 60 to 64 Years | 52 (47.3%) | 0 (0.0%) |
| 65 to 74 Years | 38 (14.6%) | 0 (0.0%) |
| 75 Years and over | 2 (1.2%) | 0 (0.0%) |
| Total | 598 (46.4%) | 52 (8.7%) |
Employment Status by Educational Attainment in Spring Hope
According to labor force statistics for Spring Hope, 69.5% of individuals (474) out of the total population between 25 and 64 years of age (682) are in the labor force, with 7.2% or 34 of them being unemployed. The group with the highest labor force participation rate are those with the educational attainment of bachelor's degree or higher, with 86.1% or 68 individuals in the labor force. Within the labor force, individuals with less than high school education have the highest percentage of unemployment, with 15.4% or 10 of them being unemployed.
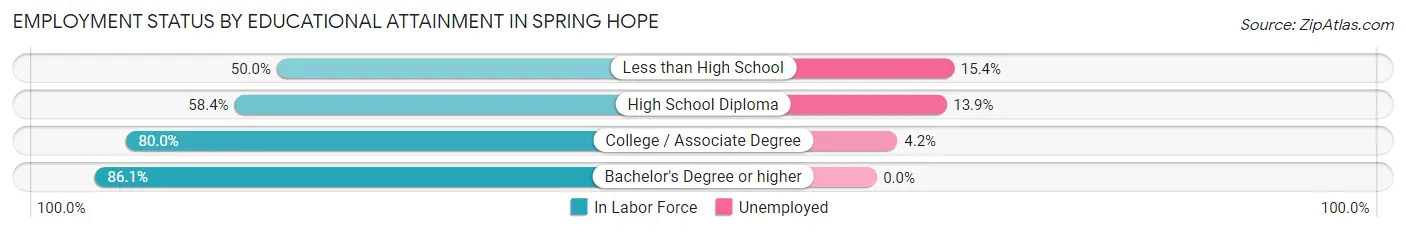
| Educational Attainment | In Labor Force | Unemployed |
| Less than High School | 65 (50.0%) | 20 (15.4%) |
| High School Diploma | 101 (58.4%) | 24 (13.9%) |
| College / Associate Degree | 240 (80.0%) | 13 (4.2%) |
| Bachelor's Degree or higher | 68 (86.1%) | 0 (0.0%) |
| Total | 474 (69.5%) | 49 (7.2%) |
Employment Occupations by Sex in Spring Hope
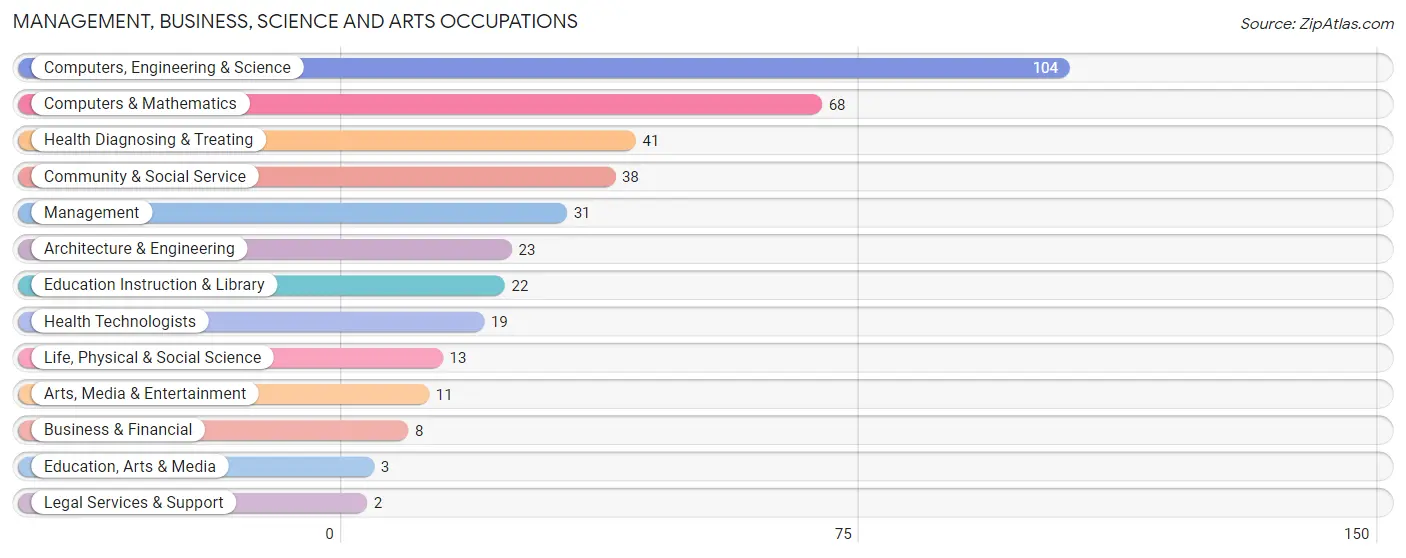
Management, Business, Science and Arts Occupations
The most common Management, Business, Science and Arts occupations in Spring Hope are Computers, Engineering & Science (104 | 19.1%), Computers & Mathematics (68 | 12.5%), Health Diagnosing & Treating (41 | 7.5%), Community & Social Service (38 | 7.0%), and Management (31 | 5.7%).
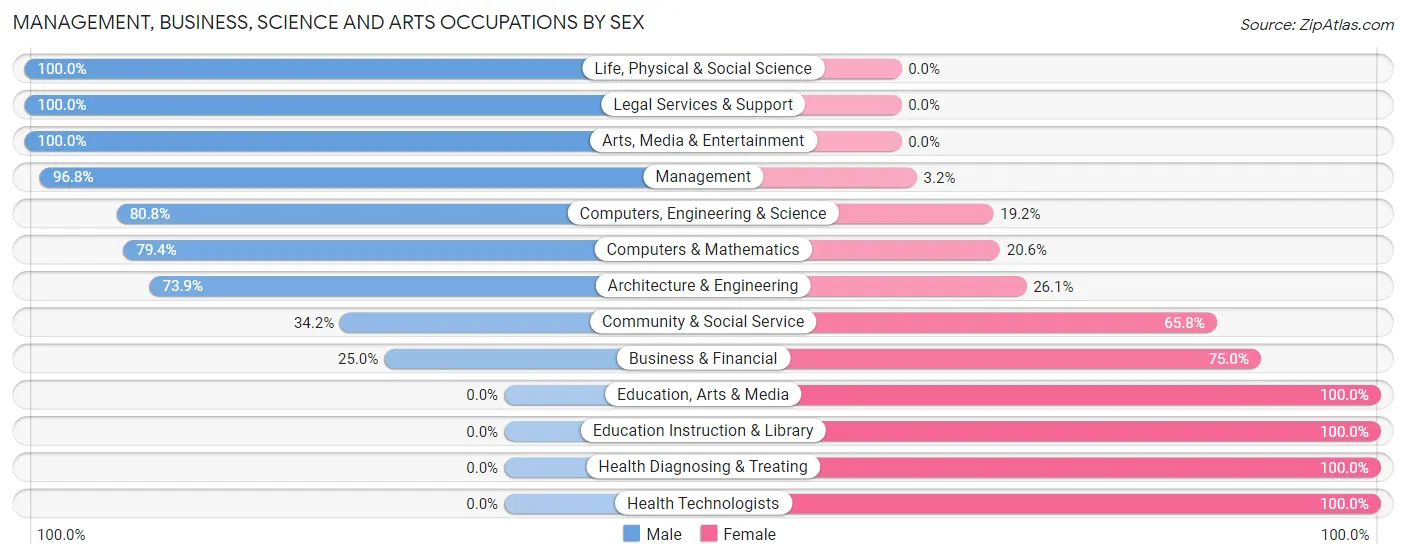
Management, Business, Science and Arts Occupations by Sex
Within the Management, Business, Science and Arts occupations in Spring Hope, the most male-oriented occupations are Life, Physical & Social Science (100.0%), Legal Services & Support (100.0%), and Arts, Media & Entertainment (100.0%), while the most female-oriented occupations are Education, Arts & Media (100.0%), Education Instruction & Library (100.0%), and Health Diagnosing & Treating (100.0%).
| Occupation | Male | Female |
| Management | 30 (96.8%) | 1 (3.2%) |
| Business & Financial | 2 (25.0%) | 6 (75.0%) |
| Computers, Engineering & Science | 84 (80.8%) | 20 (19.2%) |
| Computers & Mathematics | 54 (79.4%) | 14 (20.6%) |
| Architecture & Engineering | 17 (73.9%) | 6 (26.1%) |
| Life, Physical & Social Science | 13 (100.0%) | 0 (0.0%) |
| Community & Social Service | 13 (34.2%) | 25 (65.8%) |
| Education, Arts & Media | 0 (0.0%) | 3 (100.0%) |
| Legal Services & Support | 2 (100.0%) | 0 (0.0%) |
| Education Instruction & Library | 0 (0.0%) | 22 (100.0%) |
| Arts, Media & Entertainment | 11 (100.0%) | 0 (0.0%) |
| Health Diagnosing & Treating | 0 (0.0%) | 41 (100.0%) |
| Health Technologists | 0 (0.0%) | 19 (100.0%) |
| Total (Category) | 129 (58.1%) | 93 (41.9%) |
| Total (Overall) | 306 (56.1%) | 239 (43.9%) |
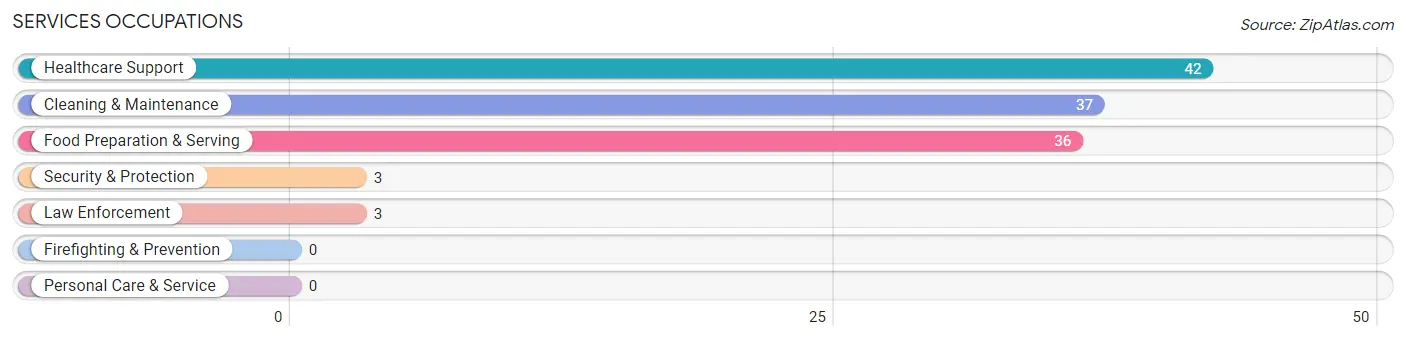
Services Occupations
The most common Services occupations in Spring Hope are Healthcare Support (42 | 7.7%), Cleaning & Maintenance (37 | 6.8%), Food Preparation & Serving (36 | 6.6%), Security & Protection (3 | 0.5%), and Law Enforcement (3 | 0.5%).
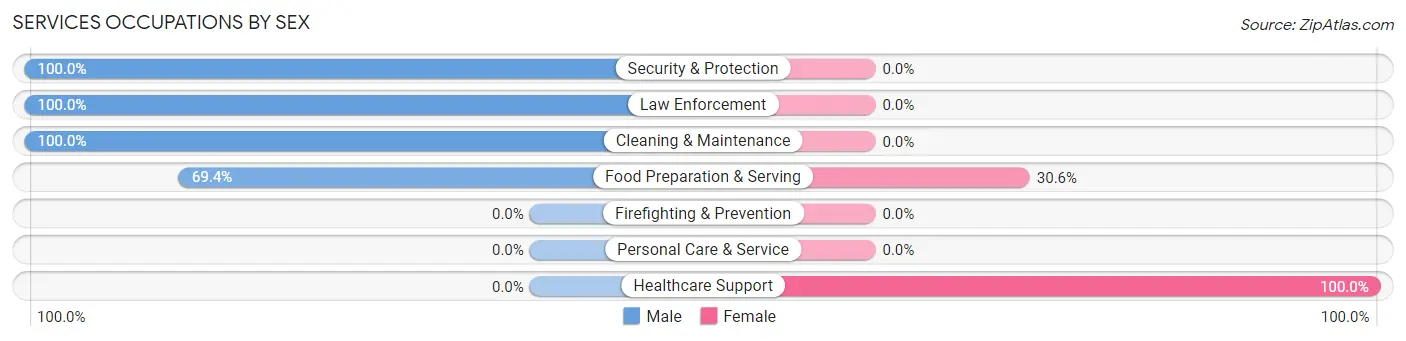
Services Occupations by Sex
Within the Services occupations in Spring Hope, the most male-oriented occupations are Security & Protection (100.0%), Law Enforcement (100.0%), and Cleaning & Maintenance (100.0%), while the most female-oriented occupations are Healthcare Support (100.0%), and Food Preparation & Serving (30.6%).
| Occupation | Male | Female |
| Healthcare Support | 0 (0.0%) | 42 (100.0%) |
| Security & Protection | 3 (100.0%) | 0 (0.0%) |
| Firefighting & Prevention | 0 (0.0%) | 0 (0.0%) |
| Law Enforcement | 3 (100.0%) | 0 (0.0%) |
| Food Preparation & Serving | 25 (69.4%) | 11 (30.6%) |
| Cleaning & Maintenance | 37 (100.0%) | 0 (0.0%) |
| Personal Care & Service | 0 (0.0%) | 0 (0.0%) |
| Total (Category) | 65 (55.1%) | 53 (44.9%) |
| Total (Overall) | 306 (56.1%) | 239 (43.9%) |
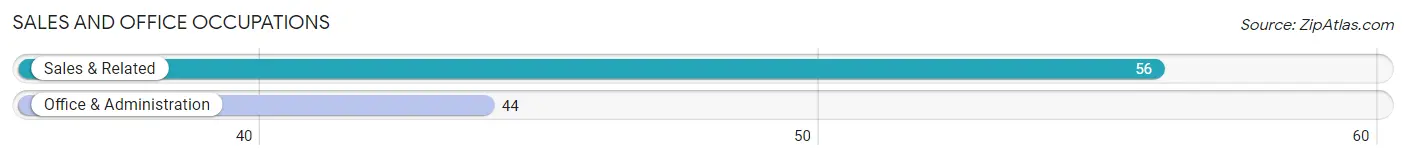
Sales and Office Occupations
The most common Sales and Office occupations in Spring Hope are Sales & Related (56 | 10.3%), and Office & Administration (44 | 8.1%).
Sales and Office Occupations by Sex
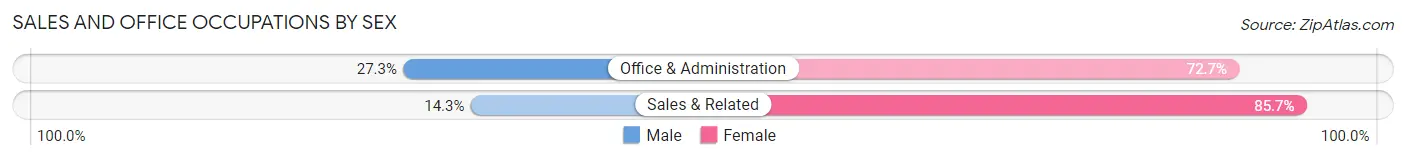
| Occupation | Male | Female |
| Sales & Related | 8 (14.3%) | 48 (85.7%) |
| Office & Administration | 12 (27.3%) | 32 (72.7%) |
| Total (Category) | 20 (20.0%) | 80 (80.0%) |
| Total (Overall) | 306 (56.1%) | 239 (43.9%) |
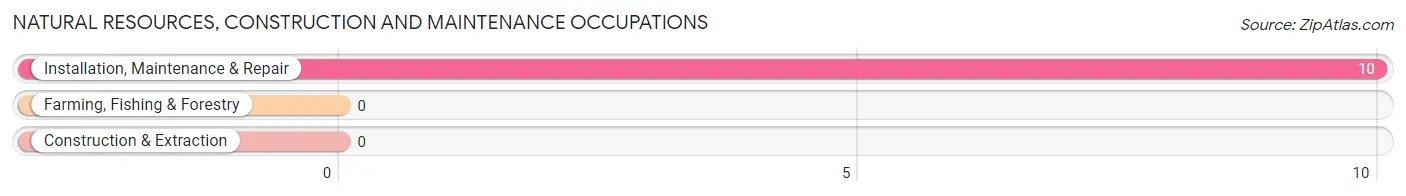
Natural Resources, Construction and Maintenance Occupations
The most common Natural Resources, Construction and Maintenance occupations in Spring Hope are , and Installation, Maintenance & Repair (10 | 1.8%).
Natural Resources, Construction and Maintenance Occupations by Sex
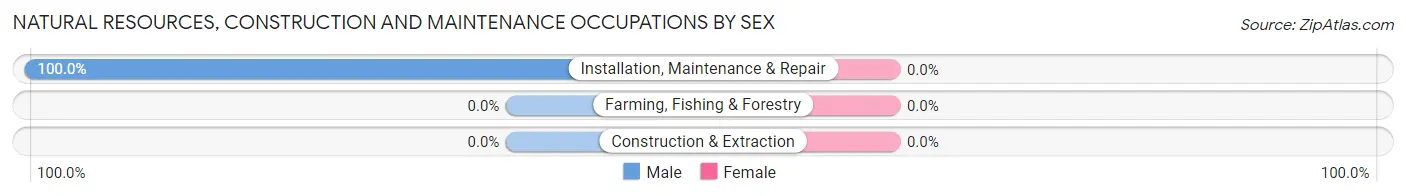
| Occupation | Male | Female |
| Farming, Fishing & Forestry | 0 (0.0%) | 0 (0.0%) |
| Construction & Extraction | 0 (0.0%) | 0 (0.0%) |
| Installation, Maintenance & Repair | 10 (100.0%) | 0 (0.0%) |
| Total (Category) | 10 (100.0%) | 0 (0.0%) |
| Total (Overall) | 306 (56.1%) | 239 (43.9%) |
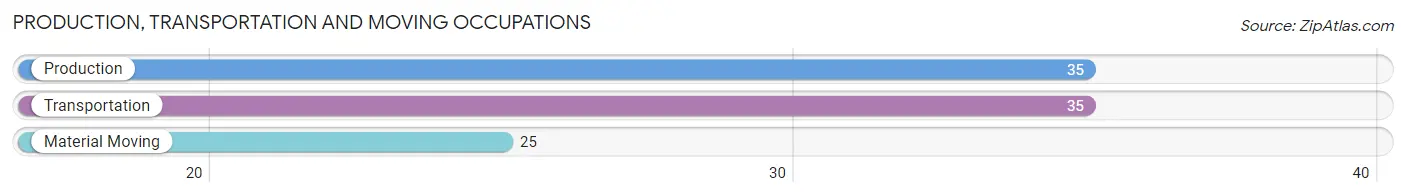
Production, Transportation and Moving Occupations
The most common Production, Transportation and Moving occupations in Spring Hope are Production (35 | 6.4%), Transportation (35 | 6.4%), and Material Moving (25 | 4.6%).
Production, Transportation and Moving Occupations by Sex
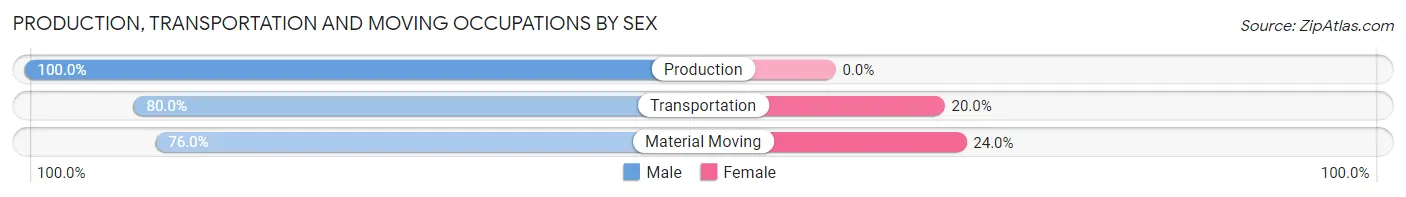
| Occupation | Male | Female |
| Production | 35 (100.0%) | 0 (0.0%) |
| Transportation | 28 (80.0%) | 7 (20.0%) |
| Material Moving | 19 (76.0%) | 6 (24.0%) |
| Total (Category) | 82 (86.3%) | 13 (13.7%) |
| Total (Overall) | 306 (56.1%) | 239 (43.9%) |
Employment Industries by Sex in Spring Hope
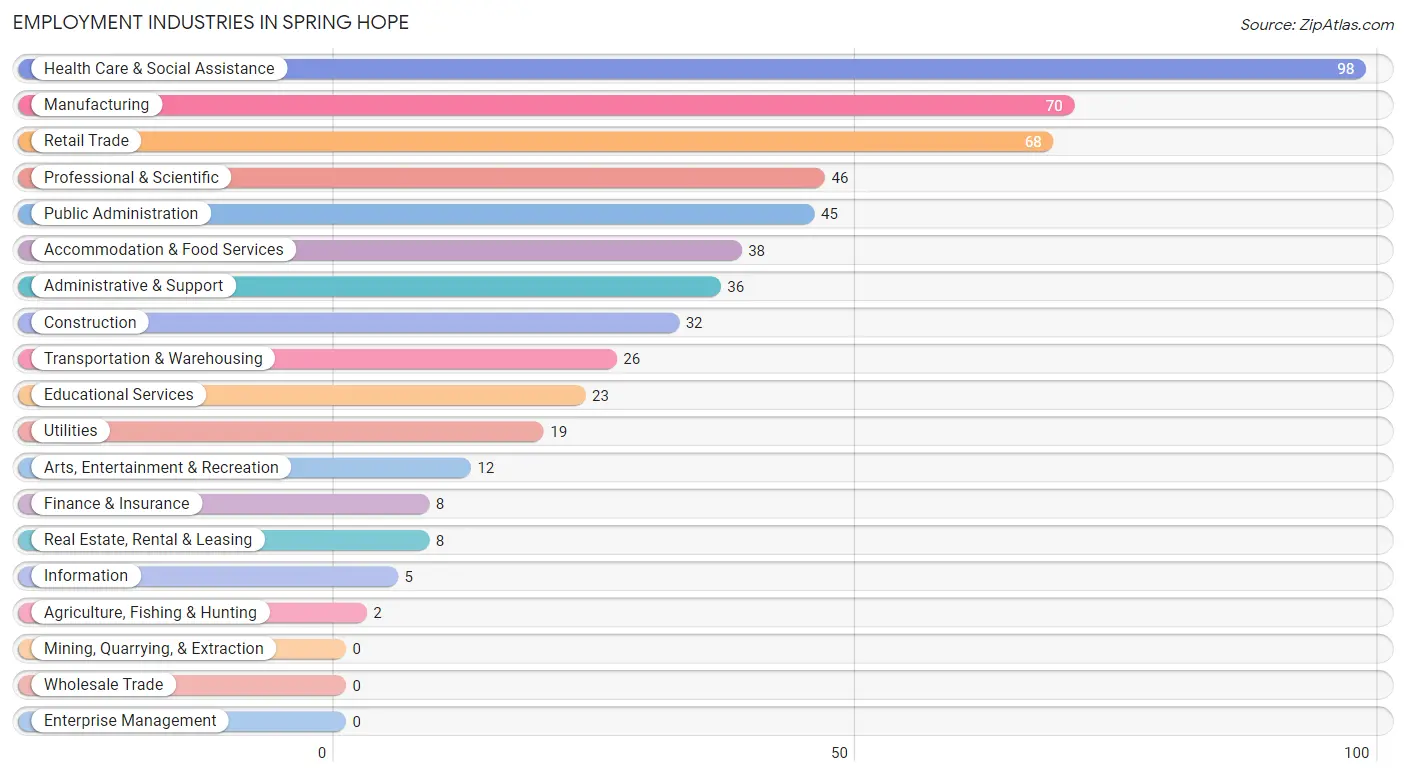
Employment Industries in Spring Hope
The major employment industries in Spring Hope include Health Care & Social Assistance (98 | 18.0%), Manufacturing (70 | 12.8%), Retail Trade (68 | 12.5%), Professional & Scientific (46 | 8.4%), and Public Administration (45 | 8.3%).
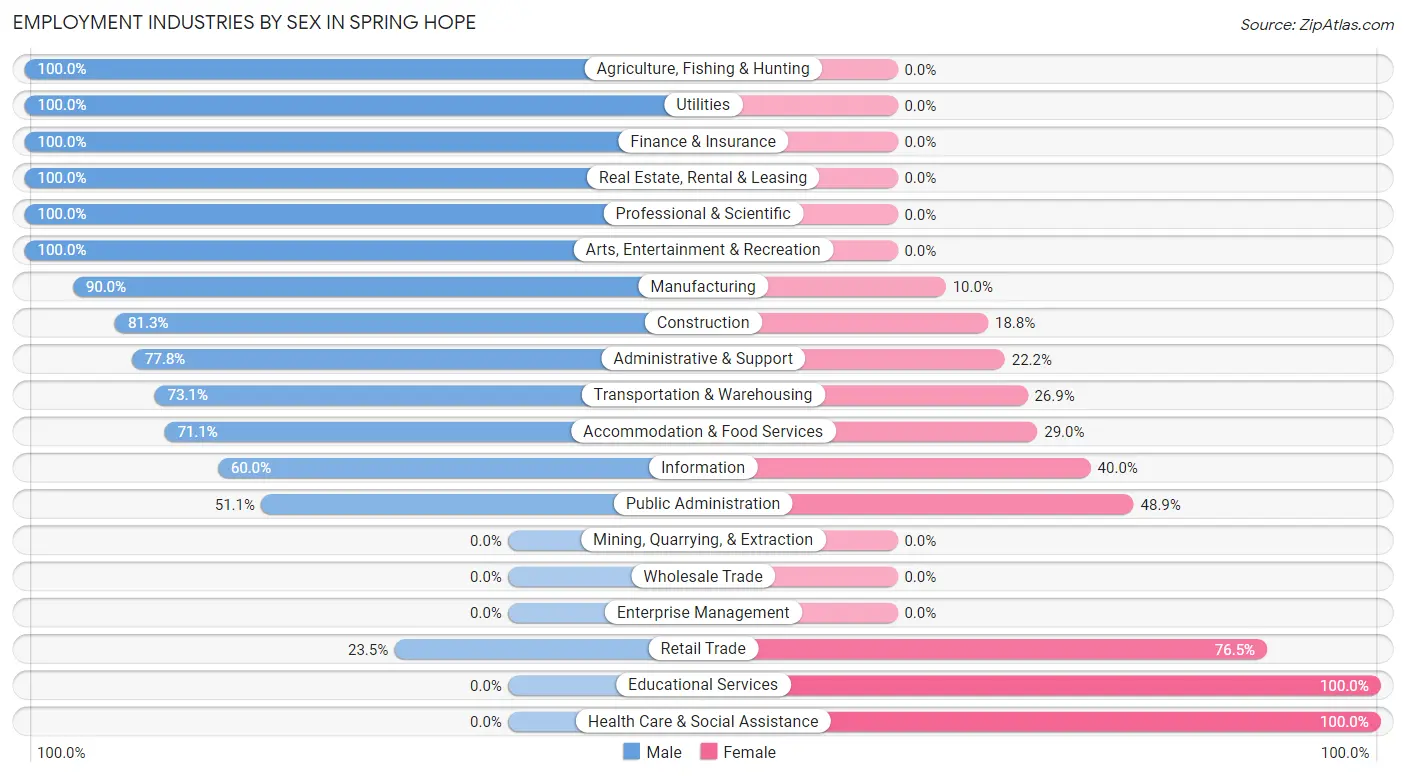
Employment Industries by Sex in Spring Hope
The Spring Hope industries that see more men than women are Agriculture, Fishing & Hunting (100.0%), Utilities (100.0%), and Finance & Insurance (100.0%), whereas the industries that tend to have a higher number of women are Educational Services (100.0%), Health Care & Social Assistance (100.0%), and Retail Trade (76.5%).
| Industry | Male | Female |
| Agriculture, Fishing & Hunting | 2 (100.0%) | 0 (0.0%) |
| Mining, Quarrying, & Extraction | 0 (0.0%) | 0 (0.0%) |
| Construction | 26 (81.2%) | 6 (18.8%) |
| Manufacturing | 63 (90.0%) | 7 (10.0%) |
| Wholesale Trade | 0 (0.0%) | 0 (0.0%) |
| Retail Trade | 16 (23.5%) | 52 (76.5%) |
| Transportation & Warehousing | 19 (73.1%) | 7 (26.9%) |
| Utilities | 19 (100.0%) | 0 (0.0%) |
| Information | 3 (60.0%) | 2 (40.0%) |
| Finance & Insurance | 8 (100.0%) | 0 (0.0%) |
| Real Estate, Rental & Leasing | 8 (100.0%) | 0 (0.0%) |
| Professional & Scientific | 46 (100.0%) | 0 (0.0%) |
| Enterprise Management | 0 (0.0%) | 0 (0.0%) |
| Administrative & Support | 28 (77.8%) | 8 (22.2%) |
| Educational Services | 0 (0.0%) | 23 (100.0%) |
| Health Care & Social Assistance | 0 (0.0%) | 98 (100.0%) |
| Arts, Entertainment & Recreation | 12 (100.0%) | 0 (0.0%) |
| Accommodation & Food Services | 27 (71.1%) | 11 (28.9%) |
| Public Administration | 23 (51.1%) | 22 (48.9%) |
| Total | 306 (56.1%) | 239 (43.9%) |
Education in Spring Hope
School Enrollment in Spring Hope
The most common levels of schooling among the 289 students in Spring Hope are high school (97 | 33.6%), college / undergraduate (71 | 24.6%), and elementary school (54 | 18.7%).
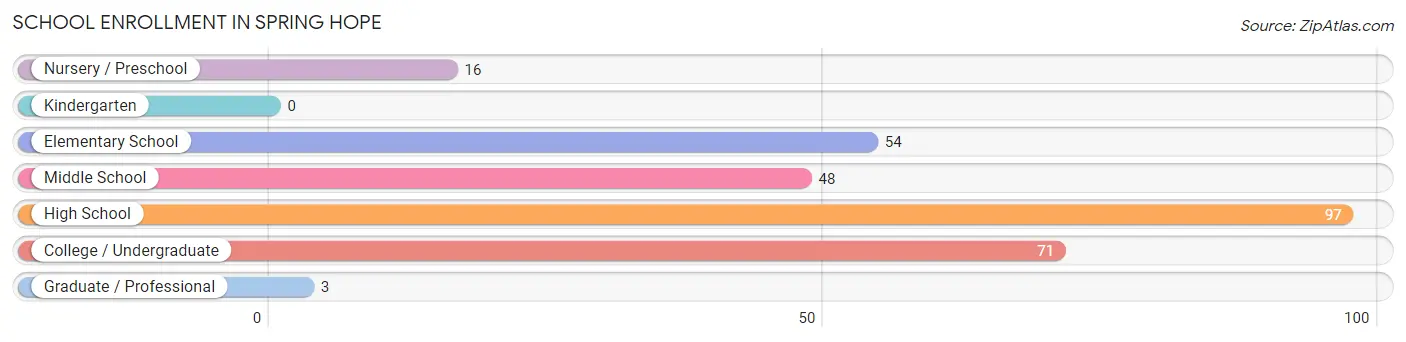
| School Level | # Students | % Students |
| Nursery / Preschool | 16 | 5.5% |
| Kindergarten | 0 | 0.0% |
| Elementary School | 54 | 18.7% |
| Middle School | 48 | 16.6% |
| High School | 97 | 33.6% |
| College / Undergraduate | 71 | 24.6% |
| Graduate / Professional | 3 | 1.0% |
| Total | 289 | 100.0% |
School Enrollment by Age by Funding Source in Spring Hope
Out of a total of 289 students who are enrolled in schools in Spring Hope, 28 (9.7%) attend a private institution, while the remaining 261 (90.3%) are enrolled in public schools. The age group of 25 to 34 year olds has the highest likelihood of being enrolled in private schools, with 3 (30.0% in the age bracket) enrolled. Conversely, the age group of 15 to 17 year olds has the lowest likelihood of being enrolled in a private school, with 68 (100.0% in the age bracket) attending a public institution.
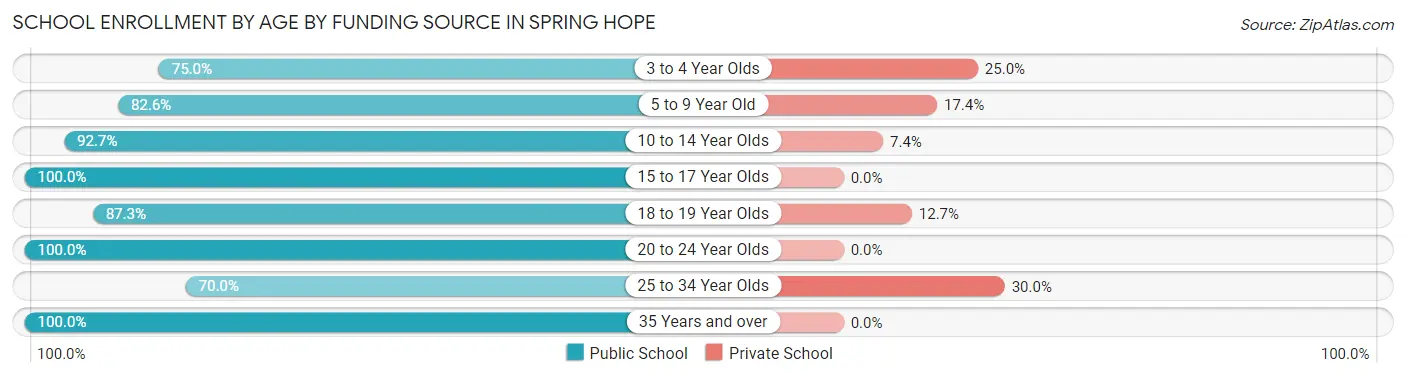
| Age Bracket | Public School | Private School |
| 3 to 4 Year Olds | 12 (75.0%) | 4 (25.0%) |
| 5 to 9 Year Old | 38 (82.6%) | 8 (17.4%) |
| 10 to 14 Year Olds | 63 (92.6%) | 5 (7.3%) |
| 15 to 17 Year Olds | 68 (100.0%) | 0 (0.0%) |
| 18 to 19 Year Olds | 55 (87.3%) | 8 (12.7%) |
| 20 to 24 Year Olds | 7 (100.0%) | 0 (0.0%) |
| 25 to 34 Year Olds | 7 (70.0%) | 3 (30.0%) |
| 35 Years and over | 11 (100.0%) | 0 (0.0%) |
| Total | 261 (90.3%) | 28 (9.7%) |
Educational Attainment by Field of Study in Spring Hope
Education (22 | 15.9%), computers & mathematics (21 | 15.2%), science & technology (21 | 15.2%), communications (15 | 10.9%), and arts & humanities (14 | 10.1%) are the most common fields of study among 138 individuals in Spring Hope who have obtained a bachelor's degree or higher.
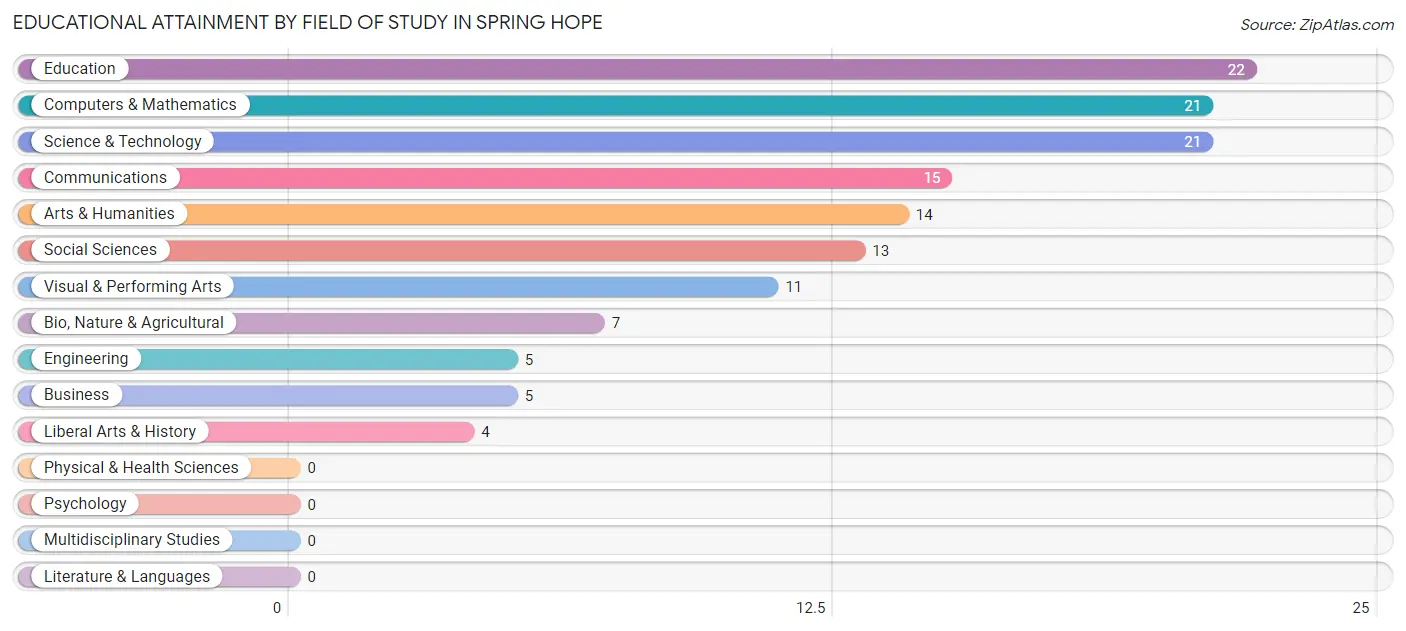
| Field of Study | # Graduates | % Graduates |
| Computers & Mathematics | 21 | 15.2% |
| Bio, Nature & Agricultural | 7 | 5.1% |
| Physical & Health Sciences | 0 | 0.0% |
| Psychology | 0 | 0.0% |
| Social Sciences | 13 | 9.4% |
| Engineering | 5 | 3.6% |
| Multidisciplinary Studies | 0 | 0.0% |
| Science & Technology | 21 | 15.2% |
| Business | 5 | 3.6% |
| Education | 22 | 15.9% |
| Literature & Languages | 0 | 0.0% |
| Liberal Arts & History | 4 | 2.9% |
| Visual & Performing Arts | 11 | 8.0% |
| Communications | 15 | 10.9% |
| Arts & Humanities | 14 | 10.1% |
| Total | 138 | 100.0% |
Transportation & Commute in Spring Hope
Vehicle Availability by Sex in Spring Hope
The most prevalent vehicle ownership categories in Spring Hope are males with 1 vehicle (100, accounting for 32.7%) and females with 1 vehicle (88, making up 41.8%).
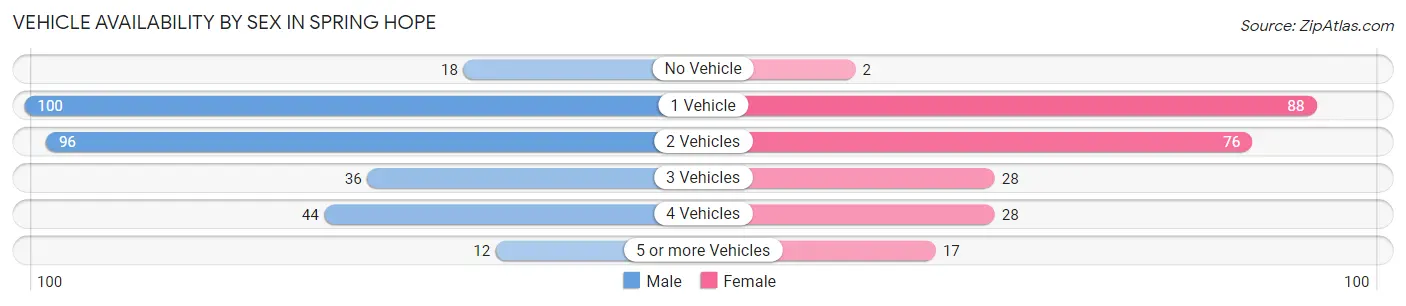
| Vehicles Available | Male | Female |
| No Vehicle | 18 (5.9%) | 2 (0.8%) |
| 1 Vehicle | 100 (32.7%) | 88 (36.8%) |
| 2 Vehicles | 96 (31.4%) | 76 (31.8%) |
| 3 Vehicles | 36 (11.8%) | 28 (11.7%) |
| 4 Vehicles | 44 (14.4%) | 28 (11.7%) |
| 5 or more Vehicles | 12 (3.9%) | 17 (7.1%) |
| Total | 306 (100.0%) | 239 (100.0%) |
Commute Time in Spring Hope
The most frequently occuring commute durations in Spring Hope are 30 to 34 minutes (101 commuters, 20.0%), 45 to 59 minutes (71 commuters, 14.1%), and 20 to 24 minutes (54 commuters, 10.7%).
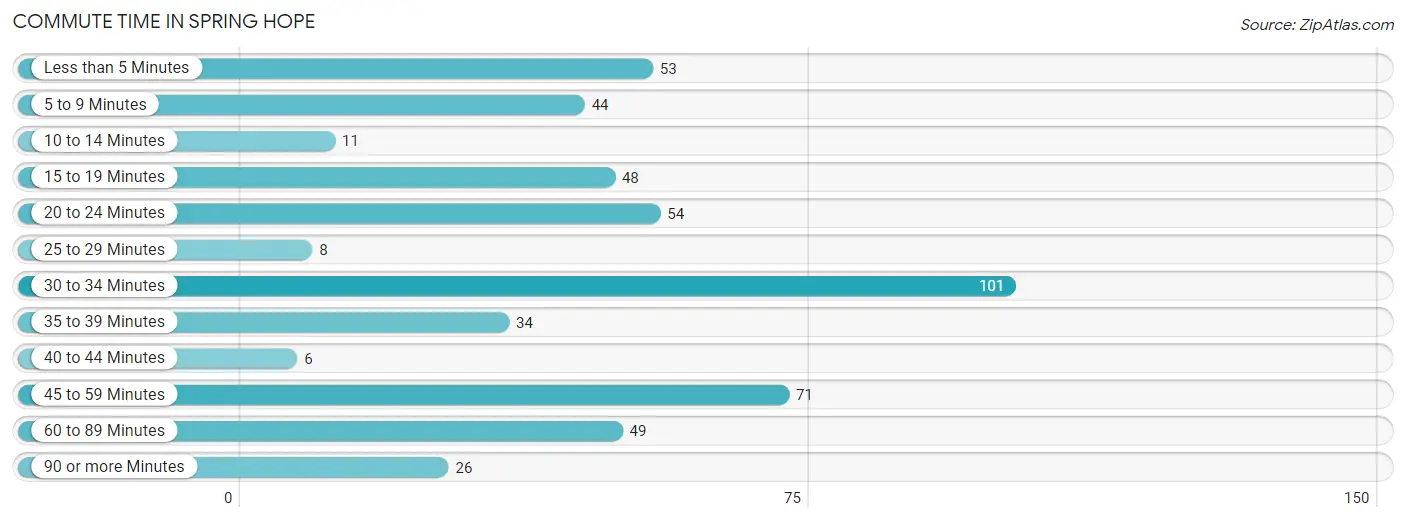
| Commute Time | # Commuters | % Commuters |
| Less than 5 Minutes | 53 | 10.5% |
| 5 to 9 Minutes | 44 | 8.7% |
| 10 to 14 Minutes | 11 | 2.2% |
| 15 to 19 Minutes | 48 | 9.5% |
| 20 to 24 Minutes | 54 | 10.7% |
| 25 to 29 Minutes | 8 | 1.6% |
| 30 to 34 Minutes | 101 | 20.0% |
| 35 to 39 Minutes | 34 | 6.7% |
| 40 to 44 Minutes | 6 | 1.2% |
| 45 to 59 Minutes | 71 | 14.1% |
| 60 to 89 Minutes | 49 | 9.7% |
| 90 or more Minutes | 26 | 5.1% |
Commute Time by Sex in Spring Hope
The most common commute times in Spring Hope are 45 to 59 minutes (61 commuters, 20.7%) for males and 30 to 34 minutes (62 commuters, 29.4%) for females.
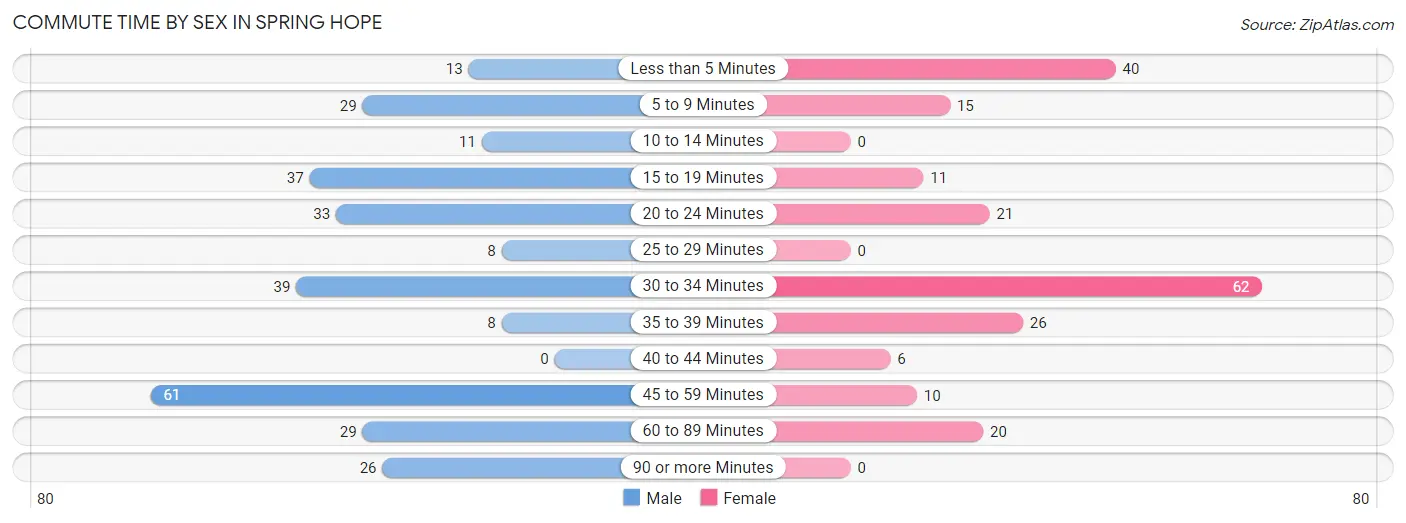
| Commute Time | Male | Female |
| Less than 5 Minutes | 13 (4.4%) | 40 (19.0%) |
| 5 to 9 Minutes | 29 (9.9%) | 15 (7.1%) |
| 10 to 14 Minutes | 11 (3.7%) | 0 (0.0%) |
| 15 to 19 Minutes | 37 (12.6%) | 11 (5.2%) |
| 20 to 24 Minutes | 33 (11.2%) | 21 (10.0%) |
| 25 to 29 Minutes | 8 (2.7%) | 0 (0.0%) |
| 30 to 34 Minutes | 39 (13.3%) | 62 (29.4%) |
| 35 to 39 Minutes | 8 (2.7%) | 26 (12.3%) |
| 40 to 44 Minutes | 0 (0.0%) | 6 (2.8%) |
| 45 to 59 Minutes | 61 (20.7%) | 10 (4.7%) |
| 60 to 89 Minutes | 29 (9.9%) | 20 (9.5%) |
| 90 or more Minutes | 26 (8.8%) | 0 (0.0%) |
Time of Departure to Work by Sex in Spring Hope
The most frequent times of departure to work in Spring Hope are 6:00 AM to 6:29 AM (42, 14.3%) for males and 7:00 AM to 7:29 AM (38, 18.0%) for females.
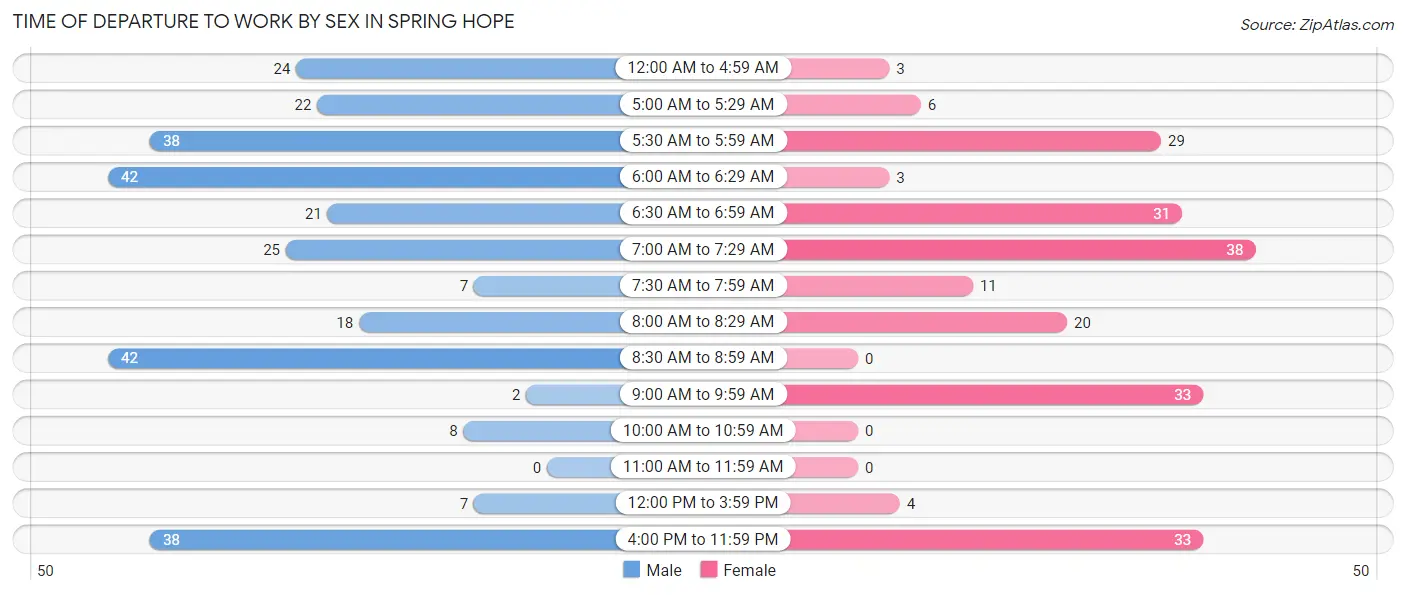
| Time of Departure | Male | Female |
| 12:00 AM to 4:59 AM | 24 (8.2%) | 3 (1.4%) |
| 5:00 AM to 5:29 AM | 22 (7.5%) | 6 (2.8%) |
| 5:30 AM to 5:59 AM | 38 (12.9%) | 29 (13.7%) |
| 6:00 AM to 6:29 AM | 42 (14.3%) | 3 (1.4%) |
| 6:30 AM to 6:59 AM | 21 (7.1%) | 31 (14.7%) |
| 7:00 AM to 7:29 AM | 25 (8.5%) | 38 (18.0%) |
| 7:30 AM to 7:59 AM | 7 (2.4%) | 11 (5.2%) |
| 8:00 AM to 8:29 AM | 18 (6.1%) | 20 (9.5%) |
| 8:30 AM to 8:59 AM | 42 (14.3%) | 0 (0.0%) |
| 9:00 AM to 9:59 AM | 2 (0.7%) | 33 (15.6%) |
| 10:00 AM to 10:59 AM | 8 (2.7%) | 0 (0.0%) |
| 11:00 AM to 11:59 AM | 0 (0.0%) | 0 (0.0%) |
| 12:00 PM to 3:59 PM | 7 (2.4%) | 4 (1.9%) |
| 4:00 PM to 11:59 PM | 38 (12.9%) | 33 (15.6%) |
| Total | 294 (100.0%) | 211 (100.0%) |
Housing Occupancy in Spring Hope
Occupancy by Ownership in Spring Hope
Of the total 719 dwellings in Spring Hope, owner-occupied units account for 254 (35.3%), while renter-occupied units make up 465 (64.7%).
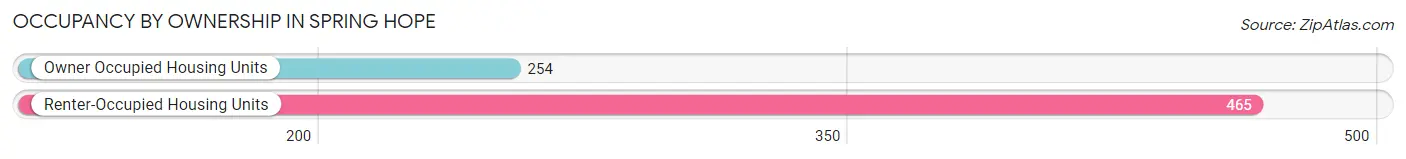
| Occupancy | # Housing Units | % Housing Units |
| Owner Occupied Housing Units | 254 | 35.3% |
| Renter-Occupied Housing Units | 465 | 64.7% |
| Total Occupied Housing Units | 719 | 100.0% |
Occupancy by Household Size in Spring Hope
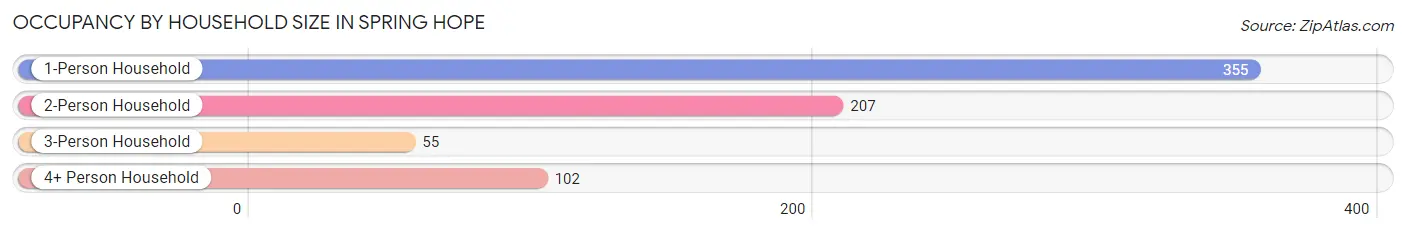
| Household Size | # Housing Units | % Housing Units |
| 1-Person Household | 355 | 49.4% |
| 2-Person Household | 207 | 28.8% |
| 3-Person Household | 55 | 7.6% |
| 4+ Person Household | 102 | 14.2% |
| Total Housing Units | 719 | 100.0% |
Occupancy by Ownership by Household Size in Spring Hope
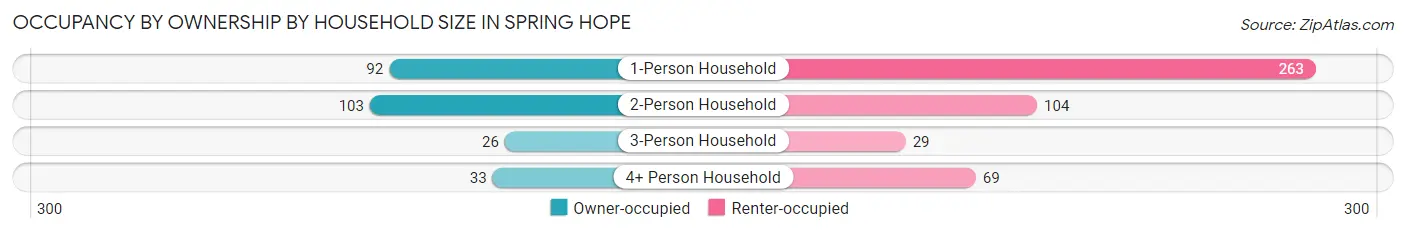
| Household Size | Owner-occupied | Renter-occupied |
| 1-Person Household | 92 (25.9%) | 263 (74.1%) |
| 2-Person Household | 103 (49.8%) | 104 (50.2%) |
| 3-Person Household | 26 (47.3%) | 29 (52.7%) |
| 4+ Person Household | 33 (32.4%) | 69 (67.6%) |
| Total Housing Units | 254 (35.3%) | 465 (64.7%) |
Occupancy by Educational Attainment in Spring Hope
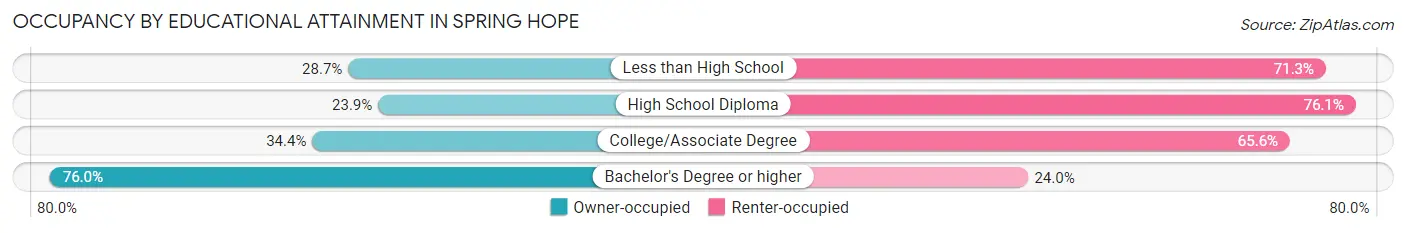
| Household Size | Owner-occupied | Renter-occupied |
| Less than High School | 37 (28.7%) | 92 (71.3%) |
| High School Diploma | 39 (23.9%) | 124 (76.1%) |
| College/Associate Degree | 121 (34.4%) | 231 (65.6%) |
| Bachelor's Degree or higher | 57 (76.0%) | 18 (24.0%) |
Occupancy by Age of Householder in Spring Hope
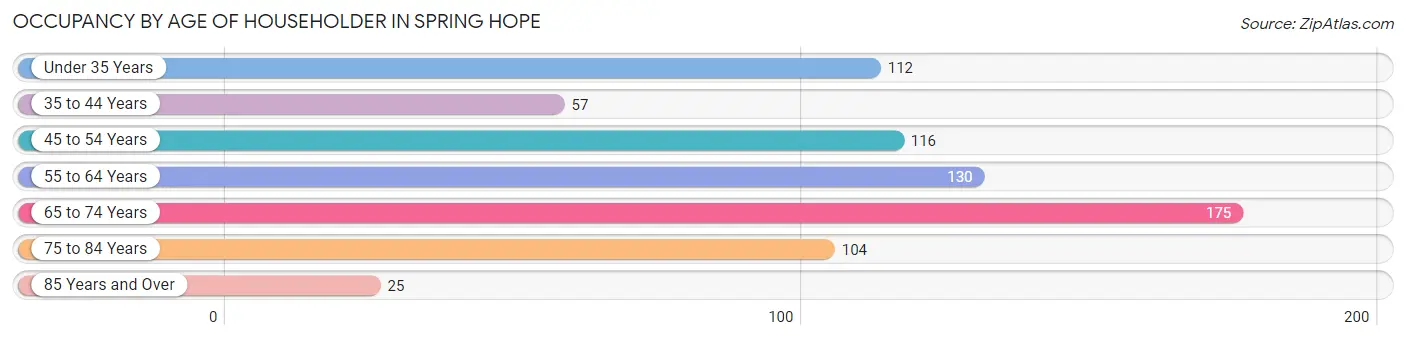
| Age Bracket | # Households | % Households |
| Under 35 Years | 112 | 15.6% |
| 35 to 44 Years | 57 | 7.9% |
| 45 to 54 Years | 116 | 16.1% |
| 55 to 64 Years | 130 | 18.1% |
| 65 to 74 Years | 175 | 24.3% |
| 75 to 84 Years | 104 | 14.5% |
| 85 Years and Over | 25 | 3.5% |
| Total | 719 | 100.0% |
Housing Finances in Spring Hope
Median Income by Occupancy in Spring Hope
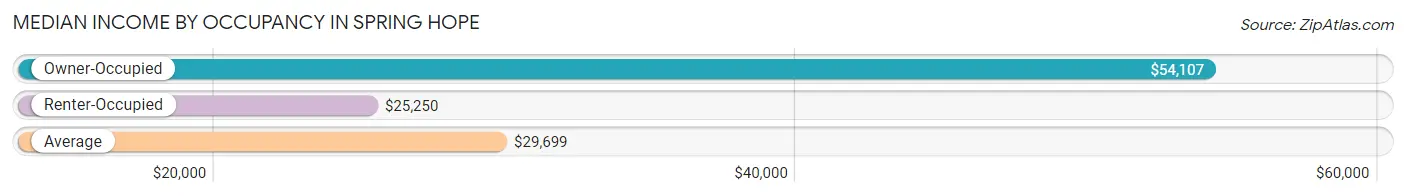
| Occupancy Type | # Households | Median Income |
| Owner-Occupied | 254 (35.3%) | $54,107 |
| Renter-Occupied | 465 (64.7%) | $25,250 |
| Average | 719 (100.0%) | $29,699 |
Occupancy by Householder Income Bracket in Spring Hope
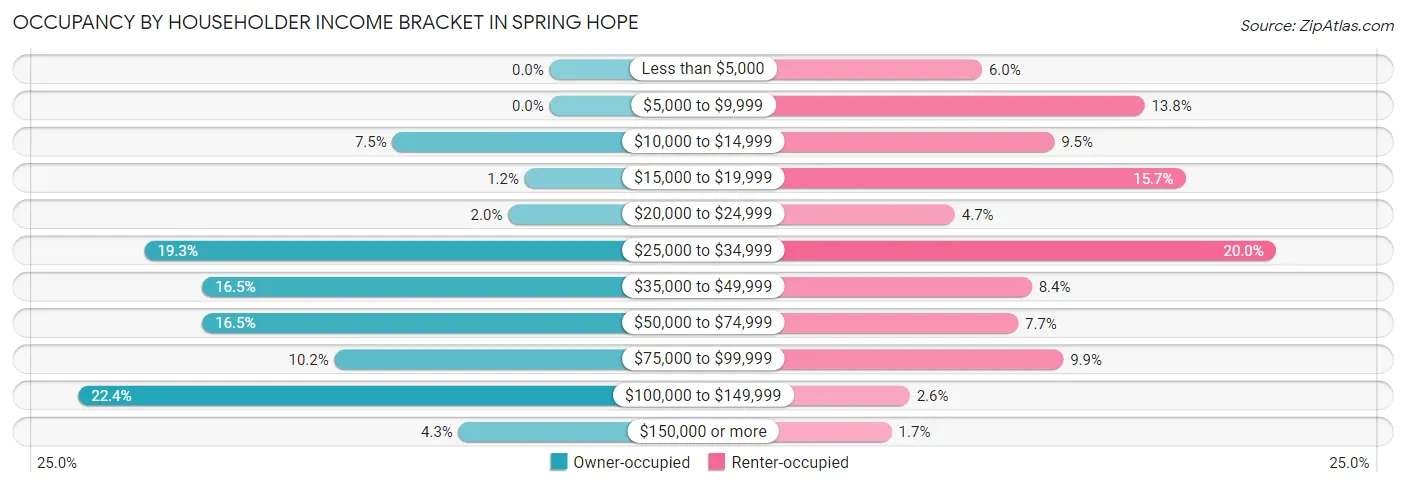
| Income Bracket | Owner-occupied | Renter-occupied |
| Less than $5,000 | 0 (0.0%) | 28 (6.0%) |
| $5,000 to $9,999 | 0 (0.0%) | 64 (13.8%) |
| $10,000 to $14,999 | 19 (7.5%) | 44 (9.5%) |
| $15,000 to $19,999 | 3 (1.2%) | 73 (15.7%) |
| $20,000 to $24,999 | 5 (2.0%) | 22 (4.7%) |
| $25,000 to $34,999 | 49 (19.3%) | 93 (20.0%) |
| $35,000 to $49,999 | 42 (16.5%) | 39 (8.4%) |
| $50,000 to $74,999 | 42 (16.5%) | 36 (7.7%) |
| $75,000 to $99,999 | 26 (10.2%) | 46 (9.9%) |
| $100,000 to $149,999 | 57 (22.4%) | 12 (2.6%) |
| $150,000 or more | 11 (4.3%) | 8 (1.7%) |
| Total | 254 (100.0%) | 465 (100.0%) |
Monthly Housing Cost Tiers in Spring Hope
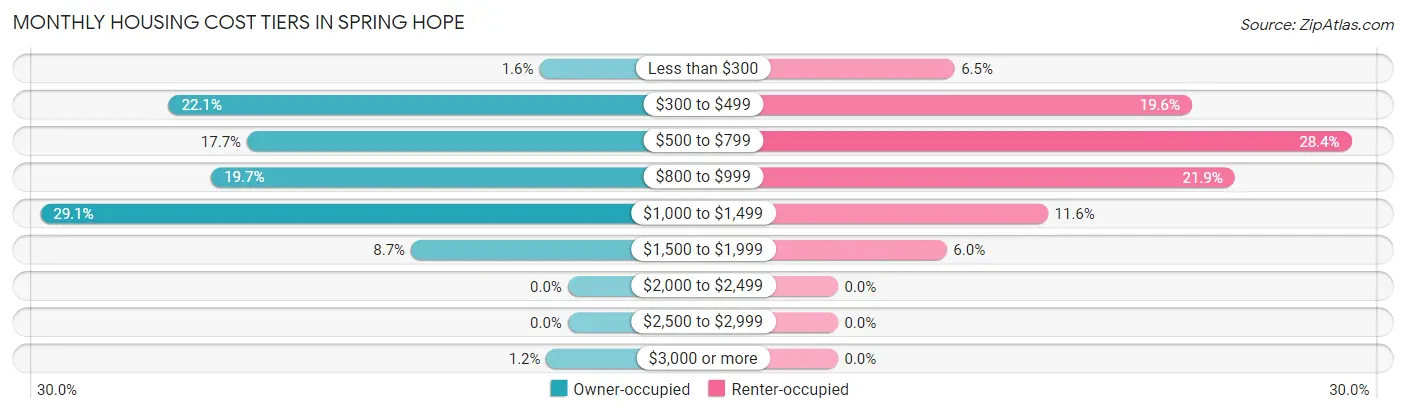
| Monthly Cost | Owner-occupied | Renter-occupied |
| Less than $300 | 4 (1.6%) | 30 (6.5%) |
| $300 to $499 | 56 (22.1%) | 91 (19.6%) |
| $500 to $799 | 45 (17.7%) | 132 (28.4%) |
| $800 to $999 | 50 (19.7%) | 102 (21.9%) |
| $1,000 to $1,499 | 74 (29.1%) | 54 (11.6%) |
| $1,500 to $1,999 | 22 (8.7%) | 28 (6.0%) |
| $2,000 to $2,499 | 0 (0.0%) | 0 (0.0%) |
| $2,500 to $2,999 | 0 (0.0%) | 0 (0.0%) |
| $3,000 or more | 3 (1.2%) | 0 (0.0%) |
| Total | 254 (100.0%) | 465 (100.0%) |
Physical Housing Characteristics in Spring Hope
Housing Structures in Spring Hope
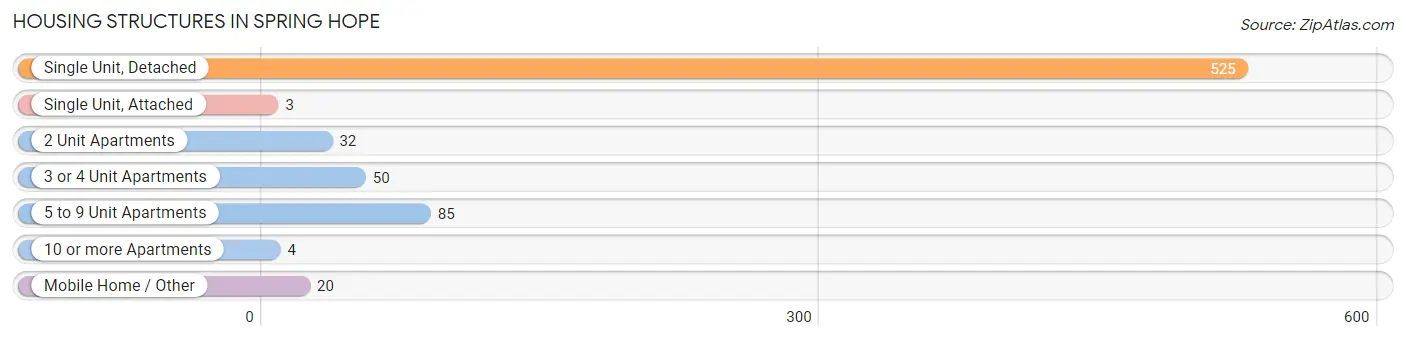
| Structure Type | # Housing Units | % Housing Units |
| Single Unit, Detached | 525 | 73.0% |
| Single Unit, Attached | 3 | 0.4% |
| 2 Unit Apartments | 32 | 4.4% |
| 3 or 4 Unit Apartments | 50 | 7.0% |
| 5 to 9 Unit Apartments | 85 | 11.8% |
| 10 or more Apartments | 4 | 0.6% |
| Mobile Home / Other | 20 | 2.8% |
| Total | 719 | 100.0% |
Housing Structures by Occupancy in Spring Hope
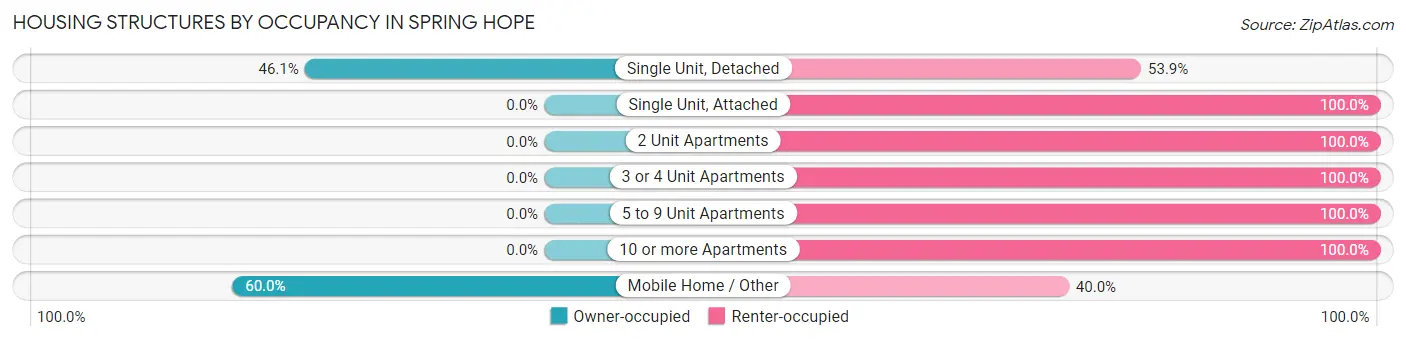
| Structure Type | Owner-occupied | Renter-occupied |
| Single Unit, Detached | 242 (46.1%) | 283 (53.9%) |
| Single Unit, Attached | 0 (0.0%) | 3 (100.0%) |
| 2 Unit Apartments | 0 (0.0%) | 32 (100.0%) |
| 3 or 4 Unit Apartments | 0 (0.0%) | 50 (100.0%) |
| 5 to 9 Unit Apartments | 0 (0.0%) | 85 (100.0%) |
| 10 or more Apartments | 0 (0.0%) | 4 (100.0%) |
| Mobile Home / Other | 12 (60.0%) | 8 (40.0%) |
| Total | 254 (35.3%) | 465 (64.7%) |
Housing Structures by Number of Rooms in Spring Hope
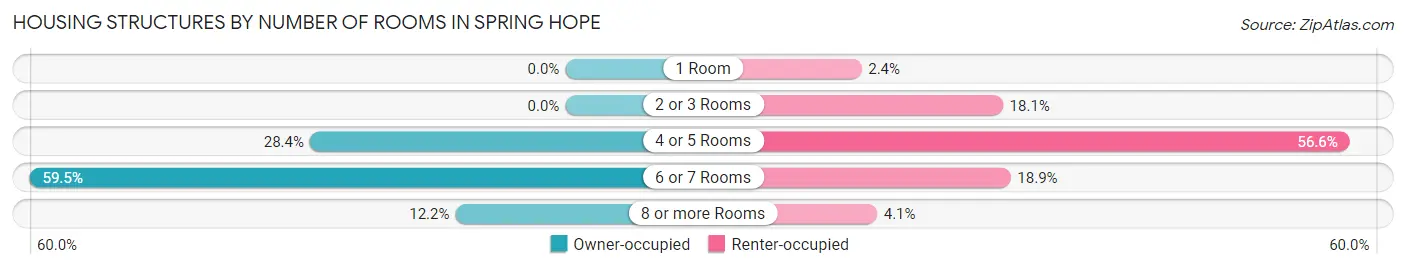
| Number of Rooms | Owner-occupied | Renter-occupied |
| 1 Room | 0 (0.0%) | 11 (2.4%) |
| 2 or 3 Rooms | 0 (0.0%) | 84 (18.1%) |
| 4 or 5 Rooms | 72 (28.3%) | 263 (56.6%) |
| 6 or 7 Rooms | 151 (59.5%) | 88 (18.9%) |
| 8 or more Rooms | 31 (12.2%) | 19 (4.1%) |
| Total | 254 (100.0%) | 465 (100.0%) |
Housing Structure by Heating Type in Spring Hope
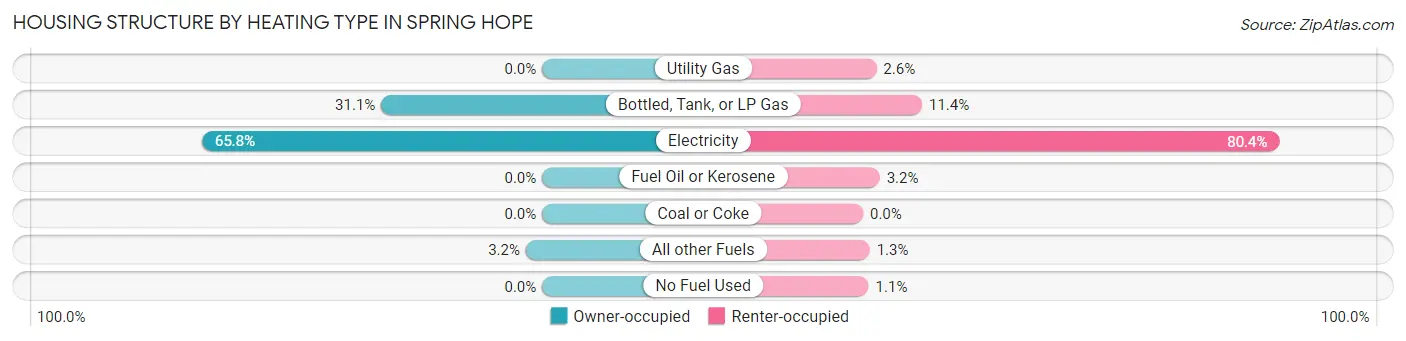
| Heating Type | Owner-occupied | Renter-occupied |
| Utility Gas | 0 (0.0%) | 12 (2.6%) |
| Bottled, Tank, or LP Gas | 79 (31.1%) | 53 (11.4%) |
| Electricity | 167 (65.7%) | 374 (80.4%) |
| Fuel Oil or Kerosene | 0 (0.0%) | 15 (3.2%) |
| Coal or Coke | 0 (0.0%) | 0 (0.0%) |
| All other Fuels | 8 (3.2%) | 6 (1.3%) |
| No Fuel Used | 0 (0.0%) | 5 (1.1%) |
| Total | 254 (100.0%) | 465 (100.0%) |
Household Vehicle Usage in Spring Hope
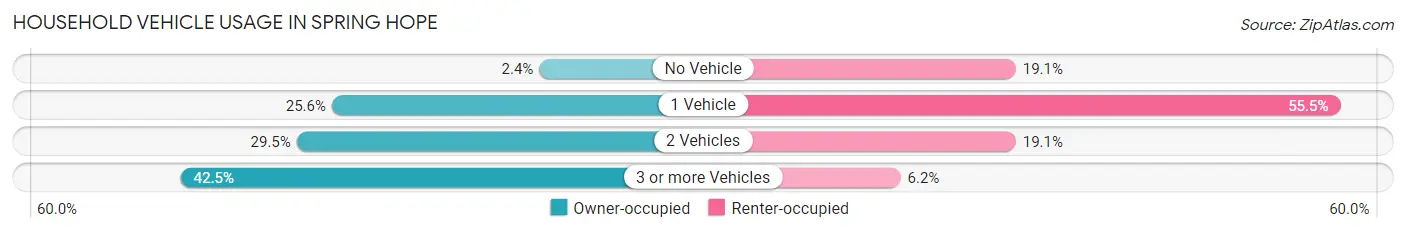
| Vehicles per Household | Owner-occupied | Renter-occupied |
| No Vehicle | 6 (2.4%) | 89 (19.1%) |
| 1 Vehicle | 65 (25.6%) | 258 (55.5%) |
| 2 Vehicles | 75 (29.5%) | 89 (19.1%) |
| 3 or more Vehicles | 108 (42.5%) | 29 (6.2%) |
| Total | 254 (100.0%) | 465 (100.0%) |
Real Estate & Mortgages in Spring Hope
Real Estate and Mortgage Overview in Spring Hope
| Characteristic | Without Mortgage | With Mortgage |
| Housing Units | 97 | 157 |
| Median Property Value | $107,100 | $113,600 |
| Median Household Income | $47,011 | $3 |
| Monthly Housing Costs | $476 | $3 |
| Real Estate Taxes | $933 | $0 |
Property Value by Mortgage Status in Spring Hope
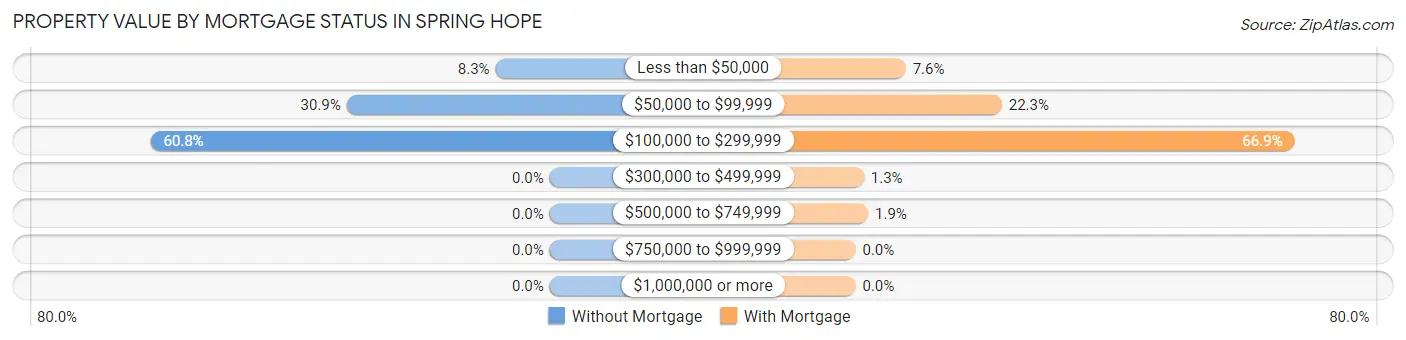
| Property Value | Without Mortgage | With Mortgage |
| Less than $50,000 | 8 (8.3%) | 12 (7.6%) |
| $50,000 to $99,999 | 30 (30.9%) | 35 (22.3%) |
| $100,000 to $299,999 | 59 (60.8%) | 105 (66.9%) |
| $300,000 to $499,999 | 0 (0.0%) | 2 (1.3%) |
| $500,000 to $749,999 | 0 (0.0%) | 3 (1.9%) |
| $750,000 to $999,999 | 0 (0.0%) | 0 (0.0%) |
| $1,000,000 or more | 0 (0.0%) | 0 (0.0%) |
| Total | 97 (100.0%) | 157 (100.0%) |
Household Income by Mortgage Status in Spring Hope
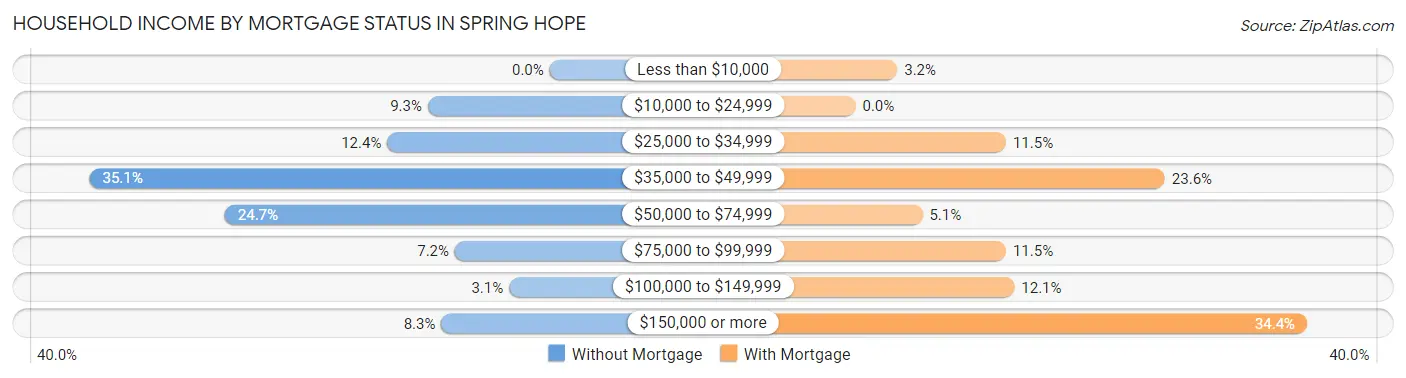
| Household Income | Without Mortgage | With Mortgage |
| Less than $10,000 | 0 (0.0%) | 5 (3.2%) |
| $10,000 to $24,999 | 9 (9.3%) | 0 (0.0%) |
| $25,000 to $34,999 | 12 (12.4%) | 18 (11.5%) |
| $35,000 to $49,999 | 34 (35.0%) | 37 (23.6%) |
| $50,000 to $74,999 | 24 (24.7%) | 8 (5.1%) |
| $75,000 to $99,999 | 7 (7.2%) | 18 (11.5%) |
| $100,000 to $149,999 | 3 (3.1%) | 19 (12.1%) |
| $150,000 or more | 8 (8.3%) | 54 (34.4%) |
| Total | 97 (100.0%) | 157 (100.0%) |
Property Value to Household Income Ratio in Spring Hope
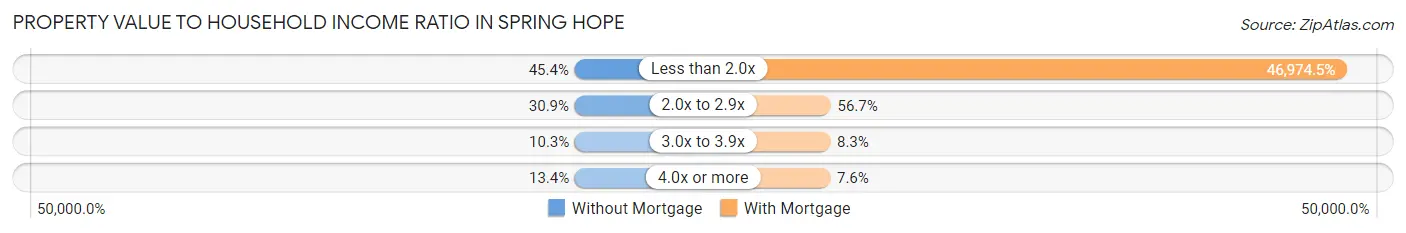
| Value-to-Income Ratio | Without Mortgage | With Mortgage |
| Less than 2.0x | 44 (45.4%) | 73,750 (46,974.5%) |
| 2.0x to 2.9x | 30 (30.9%) | 89 (56.7%) |
| 3.0x to 3.9x | 10 (10.3%) | 13 (8.3%) |
| 4.0x or more | 13 (13.4%) | 12 (7.6%) |
| Total | 97 (100.0%) | 157 (100.0%) |
Real Estate Taxes by Mortgage Status in Spring Hope
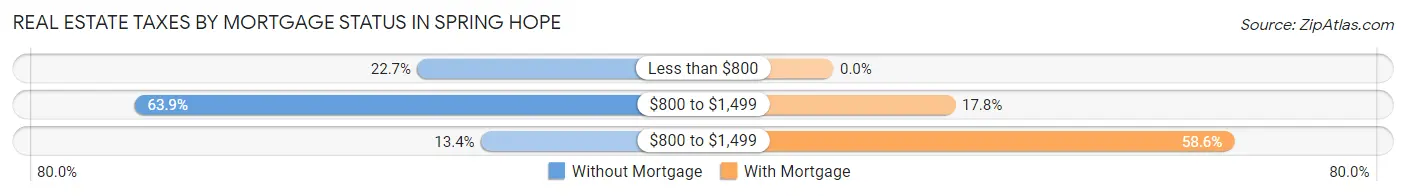
| Property Taxes | Without Mortgage | With Mortgage |
| Less than $800 | 22 (22.7%) | 0 (0.0%) |
| $800 to $1,499 | 62 (63.9%) | 28 (17.8%) |
| $800 to $1,499 | 13 (13.4%) | 92 (58.6%) |
| Total | 97 (100.0%) | 157 (100.0%) |
Health & Disability in Spring Hope
Health Insurance Coverage by Age in Spring Hope
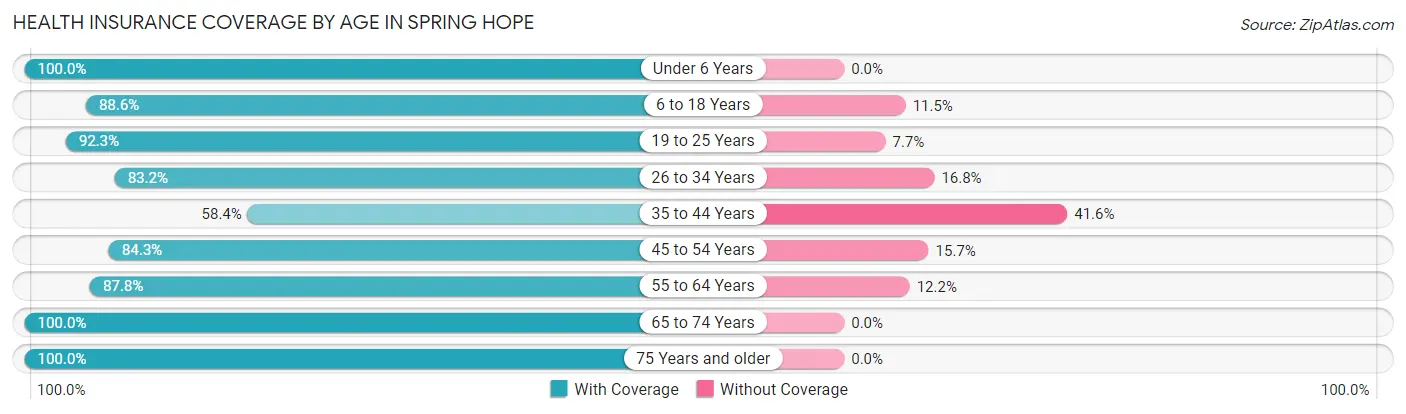
| Age Bracket | With Coverage | Without Coverage |
| Under 6 Years | 36 (100.0%) | 0 (0.0%) |
| 6 to 18 Years | 201 (88.5%) | 26 (11.5%) |
| 19 to 25 Years | 120 (92.3%) | 10 (7.7%) |
| 26 to 34 Years | 99 (83.2%) | 20 (16.8%) |
| 35 to 44 Years | 66 (58.4%) | 47 (41.6%) |
| 45 to 54 Years | 150 (84.3%) | 28 (15.7%) |
| 55 to 64 Years | 180 (87.8%) | 25 (12.2%) |
| 65 to 74 Years | 261 (100.0%) | 0 (0.0%) |
| 75 Years and older | 172 (100.0%) | 0 (0.0%) |
| Total | 1,285 (89.2%) | 156 (10.8%) |
Health Insurance Coverage by Citizenship Status in Spring Hope
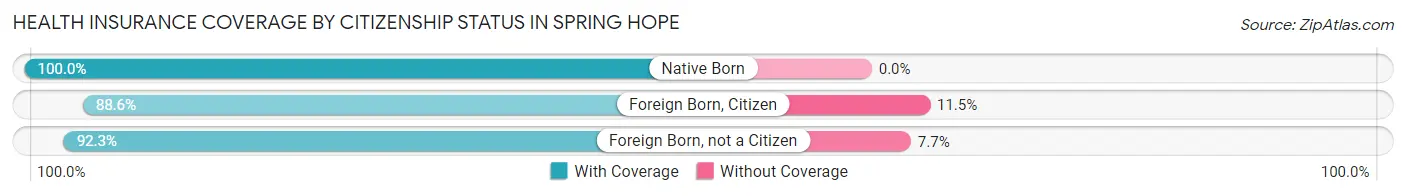
| Citizenship Status | With Coverage | Without Coverage |
| Native Born | 36 (100.0%) | 0 (0.0%) |
| Foreign Born, Citizen | 201 (88.5%) | 26 (11.5%) |
| Foreign Born, not a Citizen | 120 (92.3%) | 10 (7.7%) |
Health Insurance Coverage by Household Income in Spring Hope
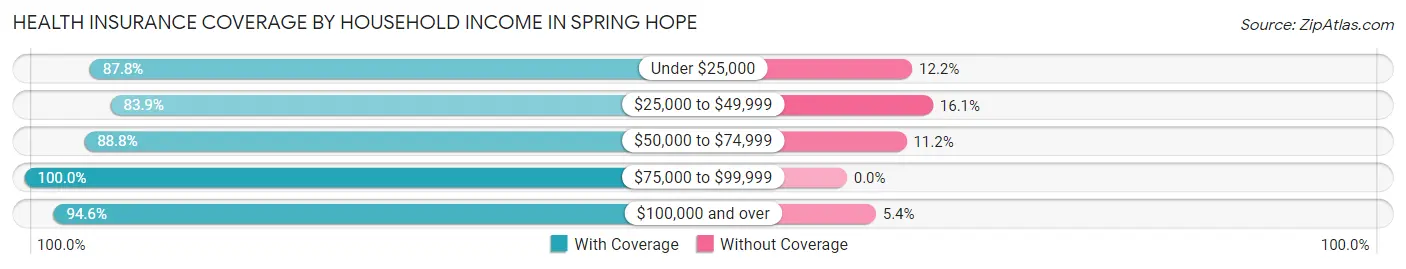
| Household Income | With Coverage | Without Coverage |
| Under $25,000 | 337 (87.8%) | 47 (12.2%) |
| $25,000 to $49,999 | 411 (83.9%) | 79 (16.1%) |
| $50,000 to $74,999 | 143 (88.8%) | 18 (11.2%) |
| $75,000 to $99,999 | 183 (100.0%) | 0 (0.0%) |
| $100,000 and over | 209 (94.6%) | 12 (5.4%) |
Public vs Private Health Insurance Coverage by Age in Spring Hope
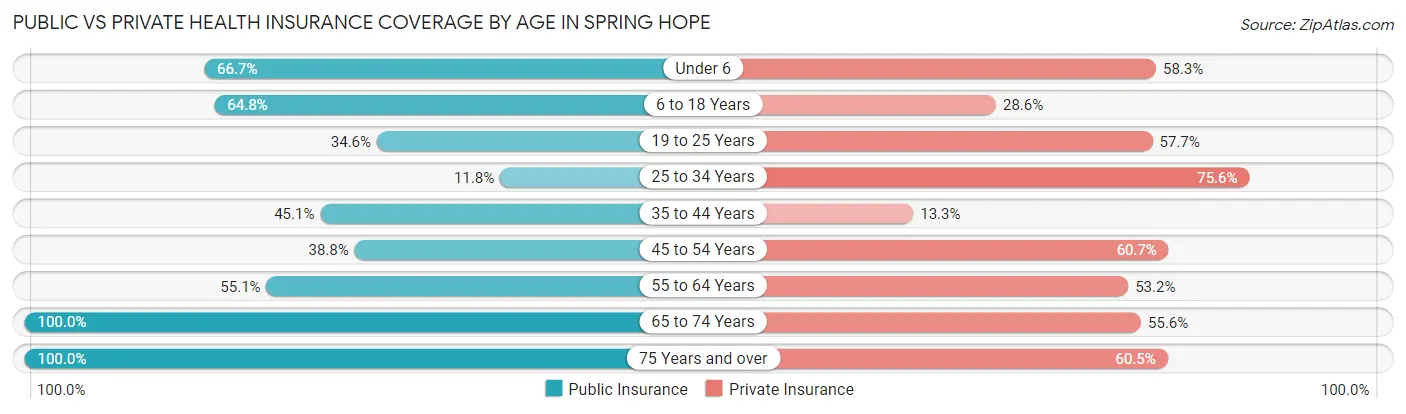
| Age Bracket | Public Insurance | Private Insurance |
| Under 6 | 24 (66.7%) | 21 (58.3%) |
| 6 to 18 Years | 147 (64.8%) | 65 (28.6%) |
| 19 to 25 Years | 45 (34.6%) | 75 (57.7%) |
| 25 to 34 Years | 14 (11.8%) | 90 (75.6%) |
| 35 to 44 Years | 51 (45.1%) | 15 (13.3%) |
| 45 to 54 Years | 69 (38.8%) | 108 (60.7%) |
| 55 to 64 Years | 113 (55.1%) | 109 (53.2%) |
| 65 to 74 Years | 261 (100.0%) | 145 (55.6%) |
| 75 Years and over | 172 (100.0%) | 104 (60.5%) |
| Total | 896 (62.2%) | 732 (50.8%) |
Disability Status by Sex by Age in Spring Hope
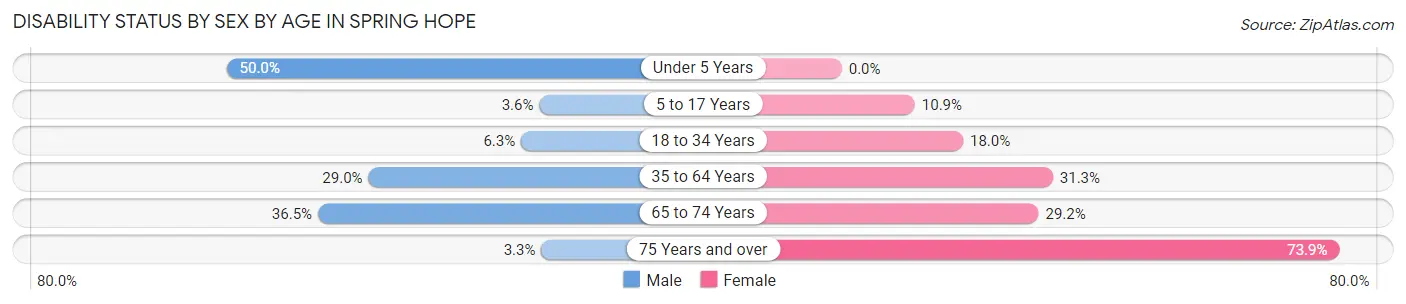
| Age Bracket | Male | Female |
| Under 5 Years | 12 (50.0%) | 0 (0.0%) |
| 5 to 17 Years | 2 (3.6%) | 14 (10.8%) |
| 18 to 34 Years | 12 (6.3%) | 18 (18.0%) |
| 35 to 64 Years | 66 (28.9%) | 84 (31.3%) |
| 65 to 74 Years | 39 (36.4%) | 45 (29.2%) |
| 75 Years and over | 2 (3.3%) | 82 (73.9%) |
Disability Class by Sex by Age in Spring Hope
Disability Class: Hearing Difficulty
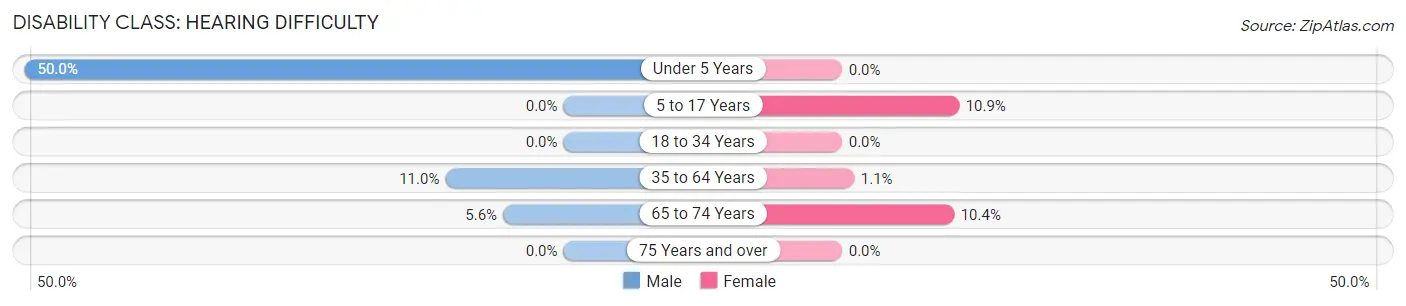
| Age Bracket | Male | Female |
| Under 5 Years | 12 (50.0%) | 0 (0.0%) |
| 5 to 17 Years | 0 (0.0%) | 14 (10.8%) |
| 18 to 34 Years | 0 (0.0%) | 0 (0.0%) |
| 35 to 64 Years | 25 (11.0%) | 3 (1.1%) |
| 65 to 74 Years | 6 (5.6%) | 16 (10.4%) |
| 75 Years and over | 0 (0.0%) | 0 (0.0%) |
Disability Class: Vision Difficulty
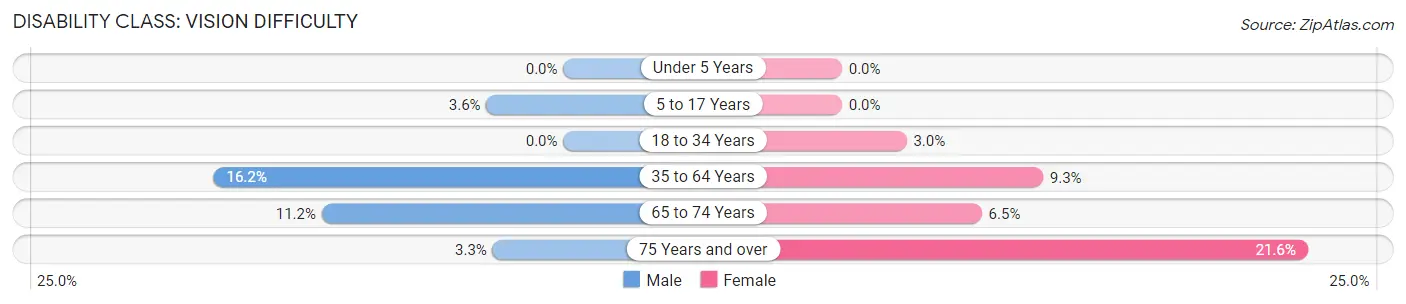
| Age Bracket | Male | Female |
| Under 5 Years | 0 (0.0%) | 0 (0.0%) |
| 5 to 17 Years | 2 (3.6%) | 0 (0.0%) |
| 18 to 34 Years | 0 (0.0%) | 3 (3.0%) |
| 35 to 64 Years | 37 (16.2%) | 25 (9.3%) |
| 65 to 74 Years | 12 (11.2%) | 10 (6.5%) |
| 75 Years and over | 2 (3.3%) | 24 (21.6%) |
Disability Class: Cognitive Difficulty
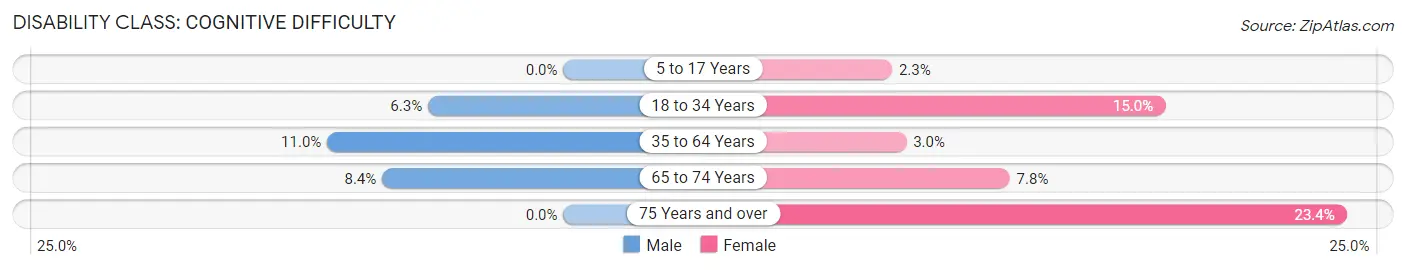
| Age Bracket | Male | Female |
| 5 to 17 Years | 0 (0.0%) | 3 (2.3%) |
| 18 to 34 Years | 12 (6.3%) | 15 (15.0%) |
| 35 to 64 Years | 25 (11.0%) | 8 (3.0%) |
| 65 to 74 Years | 9 (8.4%) | 12 (7.8%) |
| 75 Years and over | 0 (0.0%) | 26 (23.4%) |
Disability Class: Ambulatory Difficulty
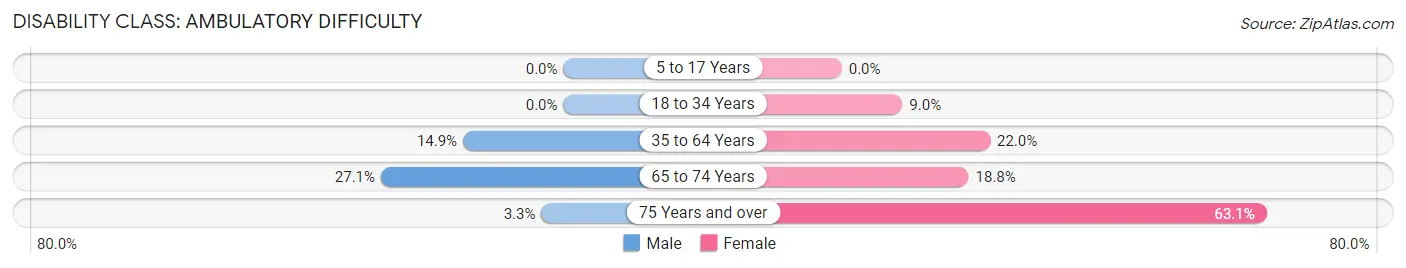
| Age Bracket | Male | Female |
| 5 to 17 Years | 0 (0.0%) | 0 (0.0%) |
| 18 to 34 Years | 0 (0.0%) | 9 (9.0%) |
| 35 to 64 Years | 34 (14.9%) | 59 (22.0%) |
| 65 to 74 Years | 29 (27.1%) | 29 (18.8%) |
| 75 Years and over | 2 (3.3%) | 70 (63.1%) |
Disability Class: Self-Care Difficulty
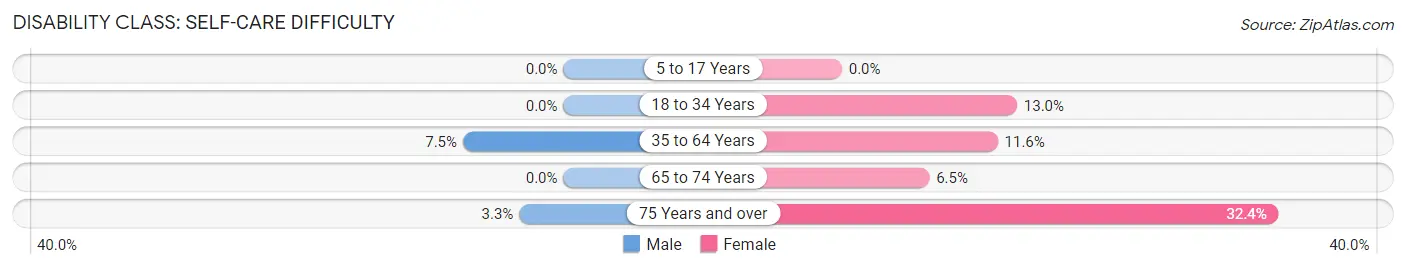
| Age Bracket | Male | Female |
| 5 to 17 Years | 0 (0.0%) | 0 (0.0%) |
| 18 to 34 Years | 0 (0.0%) | 13 (13.0%) |
| 35 to 64 Years | 17 (7.5%) | 31 (11.6%) |
| 65 to 74 Years | 0 (0.0%) | 10 (6.5%) |
| 75 Years and over | 2 (3.3%) | 36 (32.4%) |
Technology Access in Spring Hope
Computing Device Access in Spring Hope
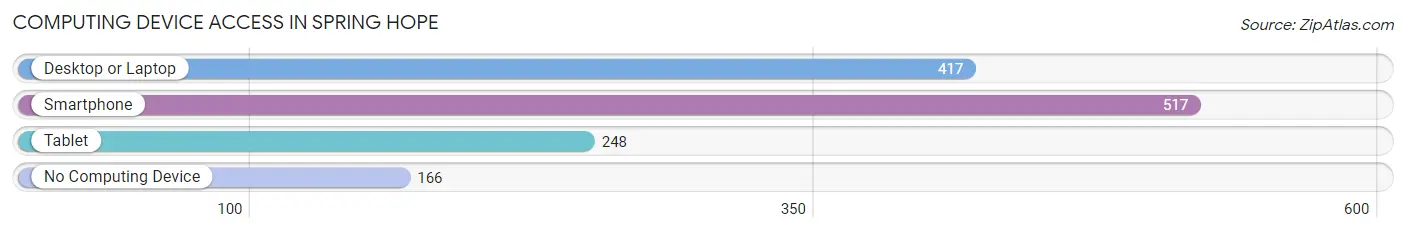
| Device Type | # Households | % Households |
| Desktop or Laptop | 417 | 58.0% |
| Smartphone | 517 | 71.9% |
| Tablet | 248 | 34.5% |
| No Computing Device | 166 | 23.1% |
| Total | 719 | 100.0% |
Internet Access in Spring Hope
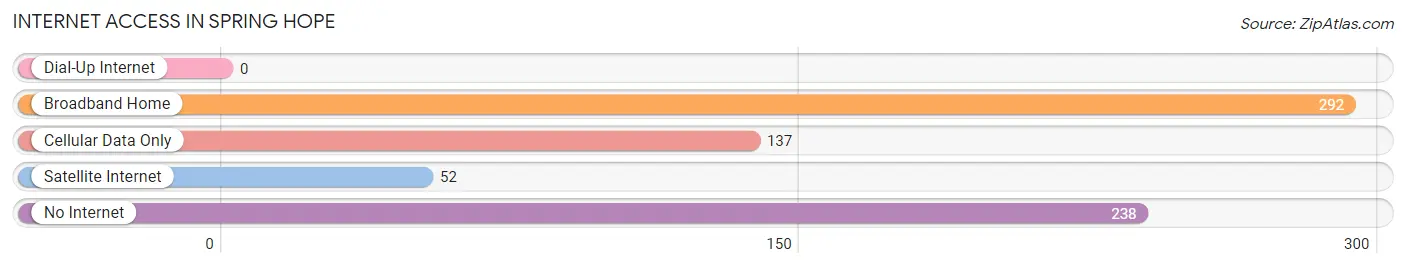
| Internet Type | # Households | % Households |
| Dial-Up Internet | 0 | 0.0% |
| Broadband Home | 292 | 40.6% |
| Cellular Data Only | 137 | 19.1% |
| Satellite Internet | 52 | 7.2% |
| No Internet | 238 | 33.1% |
| Total | 719 | 100.0% |
Spring Hope Summary
History
The town of Spring Hope, North Carolina is located in Nash County, in the northeastern part of the state. It is situated on the banks of the Tar River, and is part of the Rocky Mount metropolitan area. The town was first settled in the late 1700s, and was originally known as “Spring Hope Plantation”. The town was officially incorporated in 1874, and was named after the nearby spring that provided the town with its water supply.
The town was originally a farming community, and the main crops grown were cotton, corn, and tobacco. The town also had a thriving lumber industry, and the local sawmill was a major employer in the area. The town was also home to several brickyards, which provided the bricks for many of the buildings in the area.
In the early 1900s, the town began to experience a period of growth and prosperity. The railroad arrived in the town in 1906, and this allowed for the transportation of goods and people to and from the town. The railroad also allowed for the development of the local textile industry, which provided jobs for many of the town’s residents.
The town continued to grow and prosper throughout the 20th century. In the 1950s, the town was home to several factories, including a furniture factory, a shoe factory, and a textile mill. The town also had several stores, restaurants, and other businesses.
Geography
Spring Hope is located in the northeastern part of North Carolina, in Nash County. The town is situated on the banks of the Tar River, and is part of the Rocky Mount metropolitan area. The town is located approximately 30 miles east of Raleigh, the state capital.
The town is located in a rural area, and is surrounded by farmland and forests. The town is located in the Coastal Plain region of the state, and the terrain is mostly flat. The town is located at an elevation of approximately 200 feet above sea level.
The climate in Spring Hope is humid subtropical, with hot, humid summers and mild winters. The average annual temperature is around 70 degrees Fahrenheit, and the average annual precipitation is around 45 inches.
Economy
The economy of Spring Hope is largely based on agriculture and manufacturing. The town is home to several farms, which produce a variety of crops, including cotton, corn, and tobacco. The town also has several factories, including a furniture factory, a shoe factory, and a textile mill.
The town is also home to several stores, restaurants, and other businesses. The town is also home to several medical facilities, including a hospital and several clinics.
Demographics
As of the 2010 census, the population of Spring Hope was 2,837. The population is predominantly white, with African Americans making up the largest minority group. The median household income is around $35,000, and the median home value is around $130,000.
The town is served by the Nash-Rocky Mount Public School System, and there are several private schools in the area. The town is also home to several churches, and there are several parks and recreational facilities in the area.
Common Questions
What is the Total Population of Spring Hope?
Total Population of Spring Hope is 1,441.
What is the Total Male Population of Spring Hope?
Total Male Population of Spring Hope is 667.
What is the Total Female Population of Spring Hope?
Total Female Population of Spring Hope is 774.
What is the Ratio of Males per 100 Females in Spring Hope?
There are 86.18 Males per 100 Females in Spring Hope.
What is the Ratio of Females per 100 Males in Spring Hope?
There are 116.04 Females per 100 Males in Spring Hope.
What is the Median Population Age in Spring Hope?
Median Population Age in Spring Hope is 51.4 Years.
What is the Average Family Size in Spring Hope
Average Family Size in Spring Hope is 2.9 People.
What is the Average Household Size in Spring Hope
Average Household Size in Spring Hope is 2.0 People.
What is Per Capita Income in Spring Hope?
Per Capita income in Spring Hope is $24,381.
What is the Median Family Income in Spring Hope?
Median Family Income in Spring Hope is $49,191.
What is the Median Household income in Spring Hope?
Median Household Income in Spring Hope is $29,699.
What is Income or Wage Gap in Spring Hope?
Income or Wage Gap in Spring Hope is 31.1%.
Women in Spring Hope earn 68.9 cents for every dollar earned by a man.
What is Inequality or Gini Index in Spring Hope?
Inequality or Gini Index in Spring Hope is 0.46.
How Large is the Labor Force in Spring Hope?
There are 598 People in the Labor Forcein in Spring Hope.
What is the Percentage of People in the Labor Force in Spring Hope?
46.4% of People are in the Labor Force in Spring Hope.
What is the Unemployment Rate in Spring Hope?
Unemployment Rate in Spring Hope is 8.7%.