Conway, NC
Conway Map
Conway Overview
884
TOTAL POPULATION
373
MALE POPULATION
511
FEMALE POPULATION
72.99
MALES / 100 FEMALES
137.00
FEMALES / 100 MALES
31.0
MEDIAN AGE
3.1
AVG FAMILY SIZE
2.5
AVG HOUSEHOLD SIZE
$22,210
PER CAPITA INCOME
$52,750
AVG FAMILY INCOME
$43,095
AVG HOUSEHOLD INCOME
53.5%
WAGE / INCOME GAP [ % ]
46.5¢/ $1
WAGE / INCOME GAP [ $ ]
$13,292
FAMILY INCOME DEFICIT
0.53
INEQUALITY / GINI INDEX
353
LABOR FORCE [ PEOPLE ]
58.3%
PERCENT IN LABOR FORCE
12.7%
UNEMPLOYMENT RATE
Conway Zip Codes
Conway Area Codes
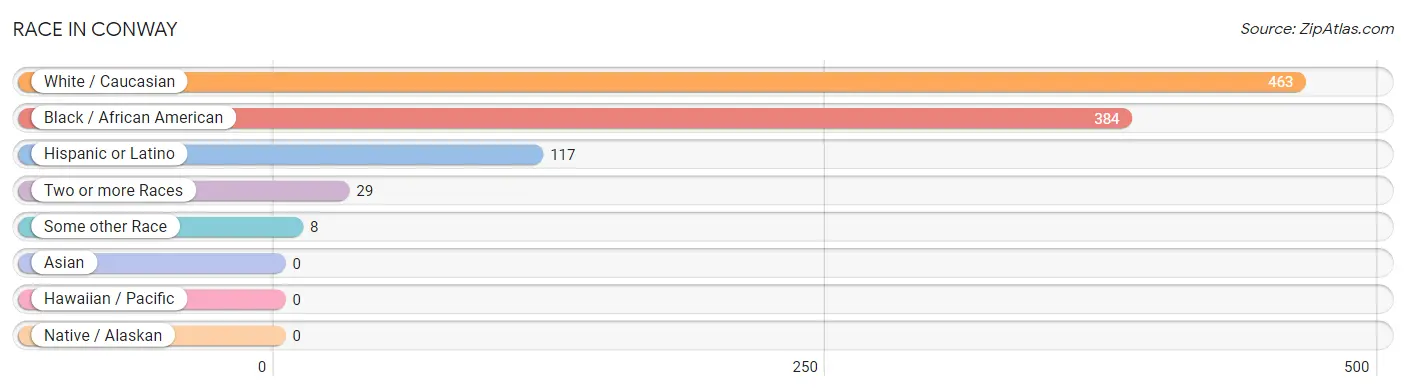
Race in Conway
The most populous races in Conway are White / Caucasian (463 | 52.4%), Black / African American (384 | 43.4%), and Hispanic or Latino (117 | 13.2%).
| Race | # Population | % Population |
| Asian | 0 | 0.0% |
| Black / African American | 384 | 43.4% |
| Hawaiian / Pacific | 0 | 0.0% |
| Hispanic or Latino | 117 | 13.2% |
| Native / Alaskan | 0 | 0.0% |
| White / Caucasian | 463 | 52.4% |
| Two or more Races | 29 | 3.3% |
| Some other Race | 8 | 0.9% |
| Total | 884 | 100.0% |
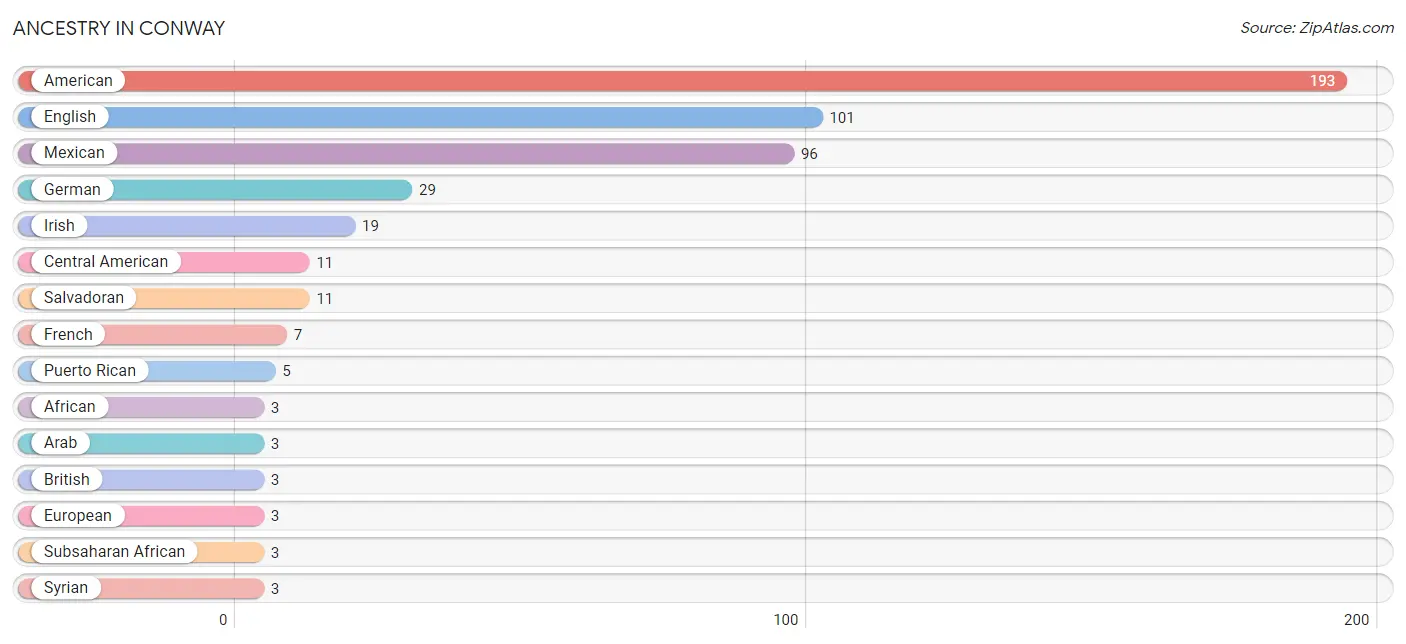
Ancestry in Conway
The most populous ancestries reported in Conway are American (193 | 21.8%), English (101 | 11.4%), Mexican (96 | 10.9%), German (29 | 3.3%), and Irish (19 | 2.1%), together accounting for 49.6% of all Conway residents.
| Ancestry | # Population | % Population |
| African | 3 | 0.3% |
| American | 193 | 21.8% |
| Arab | 3 | 0.3% |
| British | 3 | 0.3% |
| Central American | 11 | 1.2% |
| Dutch | 2 | 0.2% |
| English | 101 | 11.4% |
| European | 3 | 0.3% |
| French | 7 | 0.8% |
| German | 29 | 3.3% |
| Irish | 19 | 2.1% |
| Italian | 2 | 0.2% |
| Mexican | 96 | 10.9% |
| Puerto Rican | 5 | 0.6% |
| Salvadoran | 11 | 1.2% |
| Scottish | 2 | 0.2% |
| Subsaharan African | 3 | 0.3% |
| Syrian | 3 | 0.3% |
| Welsh | 2 | 0.2% | View All 19 Rows |
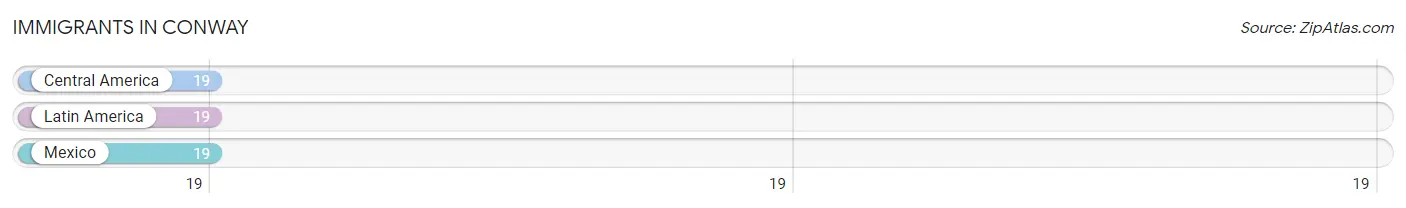
Immigrants in Conway
The most numerous immigrant groups reported in Conway came from Central America (19 | 2.1%), Latin America (19 | 2.1%), and Mexico (19 | 2.1%), together accounting for 6.5% of all Conway residents.
| Immigration Origin | # Population | % Population |
| Central America | 19 | 2.1% |
| Latin America | 19 | 2.1% |
| Mexico | 19 | 2.1% | View All 3 Rows |
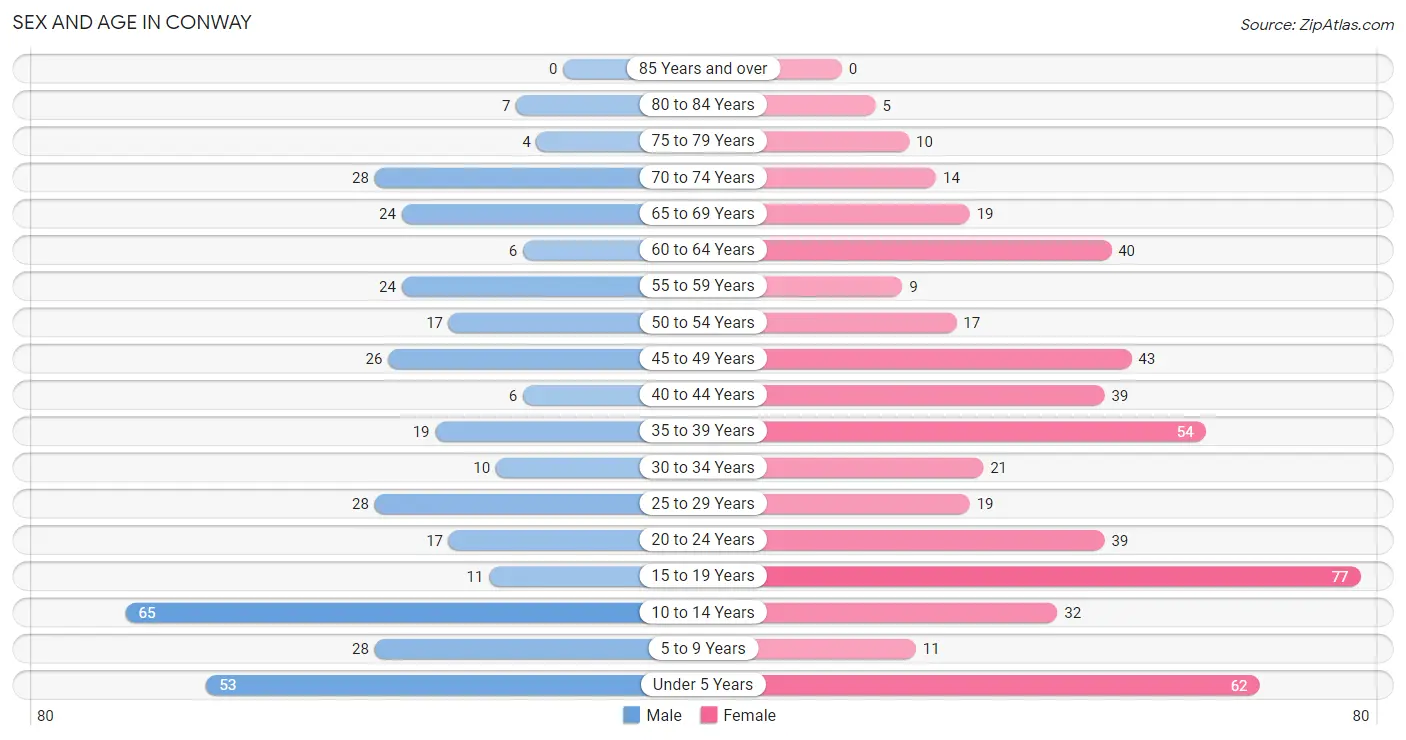
Sex and Age in Conway
Sex and Age in Conway
The most populous age groups in Conway are 10 to 14 Years (65 | 17.4%) for men and 15 to 19 Years (77 | 15.1%) for women.
| Age Bracket | Male | Female |
| Under 5 Years | 53 (14.2%) | 62 (12.1%) |
| 5 to 9 Years | 28 (7.5%) | 11 (2.1%) |
| 10 to 14 Years | 65 (17.4%) | 32 (6.3%) |
| 15 to 19 Years | 11 (2.9%) | 77 (15.1%) |
| 20 to 24 Years | 17 (4.6%) | 39 (7.6%) |
| 25 to 29 Years | 28 (7.5%) | 19 (3.7%) |
| 30 to 34 Years | 10 (2.7%) | 21 (4.1%) |
| 35 to 39 Years | 19 (5.1%) | 54 (10.6%) |
| 40 to 44 Years | 6 (1.6%) | 39 (7.6%) |
| 45 to 49 Years | 26 (7.0%) | 43 (8.4%) |
| 50 to 54 Years | 17 (4.6%) | 17 (3.3%) |
| 55 to 59 Years | 24 (6.4%) | 9 (1.8%) |
| 60 to 64 Years | 6 (1.6%) | 40 (7.8%) |
| 65 to 69 Years | 24 (6.4%) | 19 (3.7%) |
| 70 to 74 Years | 28 (7.5%) | 14 (2.7%) |
| 75 to 79 Years | 4 (1.1%) | 10 (2.0%) |
| 80 to 84 Years | 7 (1.9%) | 5 (1.0%) |
| 85 Years and over | 0 (0.0%) | 0 (0.0%) |
| Total | 373 (100.0%) | 511 (100.0%) |
Families and Households in Conway
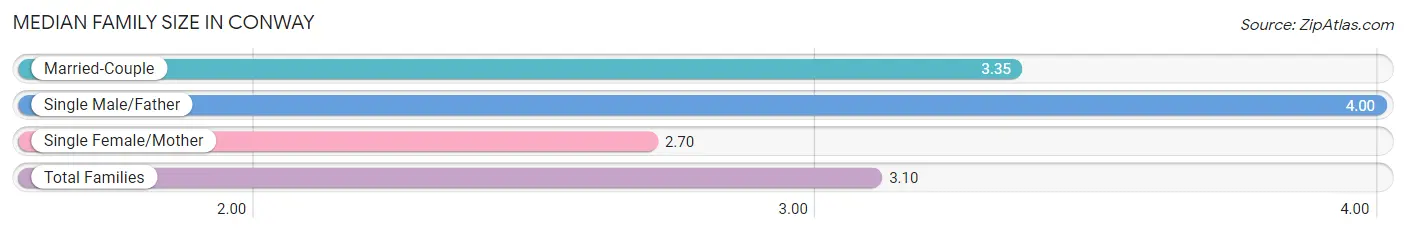
Median Family Size in Conway
The median family size in Conway is 3.10 persons per family, with single male/father families (7 | 3.0%) accounting for the largest median family size of 4 persons per family. On the other hand, single female/mother families (96 | 41.2%) represent the smallest median family size with 2.70 persons per family.
| Family Type | # Families | Family Size |
| Married-Couple | 130 (55.8%) | 3.35 |
| Single Male/Father | 7 (3.0%) | 4.00 |
| Single Female/Mother | 96 (41.2%) | 2.70 |
| Total Families | 233 (100.0%) | 3.10 |
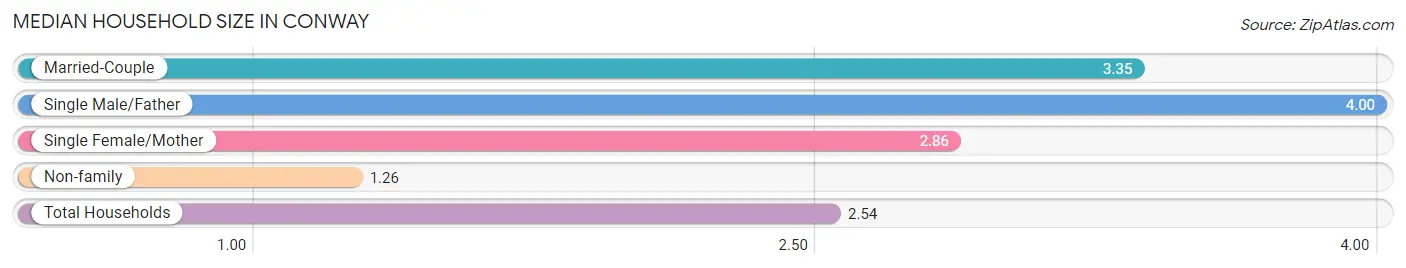
Median Household Size in Conway
The median household size in Conway is 2.54 persons per household, with single male/father households (7 | 2.0%) accounting for the largest median household size of 4 persons per household. non-family households (115 | 33.1%) represent the smallest median household size with 1.26 persons per household.
| Household Type | # Households | Household Size |
| Married-Couple | 130 (37.4%) | 3.35 |
| Single Male/Father | 7 (2.0%) | 4.00 |
| Single Female/Mother | 96 (27.6%) | 2.86 |
| Non-family | 115 (33.1%) | 1.26 |
| Total Households | 348 (100.0%) | 2.54 |
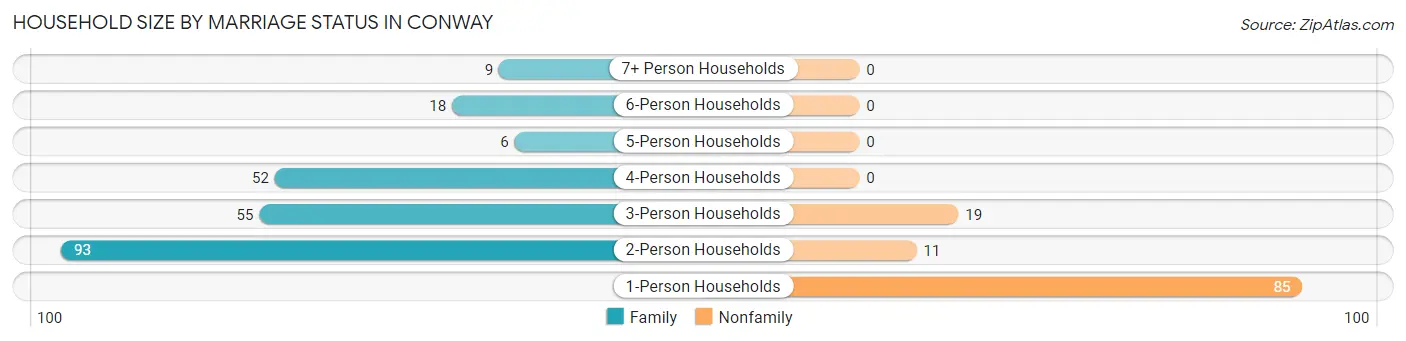
Household Size by Marriage Status in Conway
Out of a total of 348 households in Conway, 233 (66.9%) are family households, while 115 (33.1%) are nonfamily households. The most numerous type of family households are 2-person households, comprising 93, and the most common type of nonfamily households are 1-person households, comprising 85.
| Household Size | Family Households | Nonfamily Households |
| 1-Person Households | - | 85 (24.4%) |
| 2-Person Households | 93 (26.7%) | 11 (3.2%) |
| 3-Person Households | 55 (15.8%) | 19 (5.5%) |
| 4-Person Households | 52 (14.9%) | 0 (0.0%) |
| 5-Person Households | 6 (1.7%) | 0 (0.0%) |
| 6-Person Households | 18 (5.2%) | 0 (0.0%) |
| 7+ Person Households | 9 (2.6%) | 0 (0.0%) |
| Total | 233 (66.9%) | 115 (33.1%) |
Female Fertility in Conway
Fertility by Age in Conway
Average fertility rate in Conway is 65.0 births per 1,000 women. Women in the age bracket of 20 to 34 years have the highest fertility rate with 241.0 births per 1,000 women. Women in the age bracket of 20 to 34 years acount for 100.0% of all women with births.
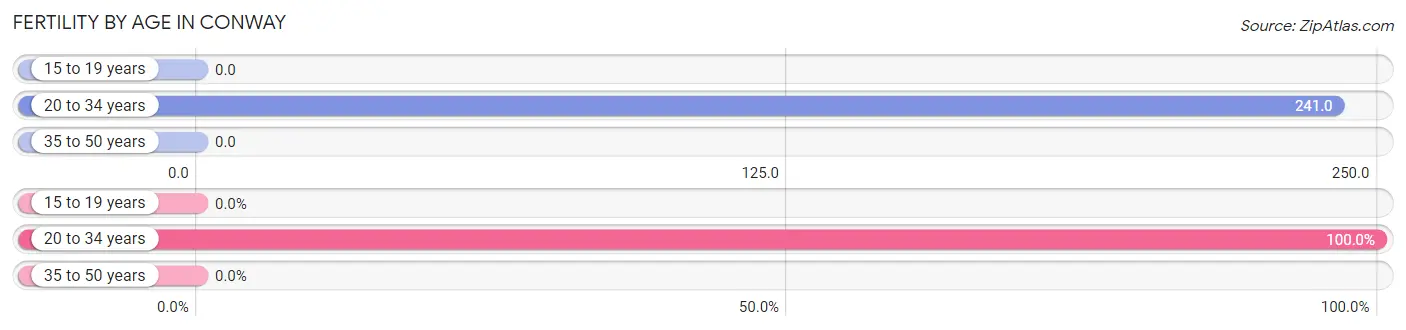
| Age Bracket | Women with Births | Births / 1,000 Women |
| 15 to 19 years | 0 (0.0%) | 0.0 |
| 20 to 34 years | 19 (100.0%) | 241.0 |
| 35 to 50 years | 0 (0.0%) | 0.0 |
| Total | 19 (100.0%) | 65.0 |
Fertility by Age by Marriage Status in Conway
10.5% of women with births (19) in Conway are married. The highest percentage of unmarried women with births falls into 20 to 34 years age bracket with 89.5% of them unmarried at the time of birth, while the lowest percentage of unmarried women with births belong to 20 to 34 years age bracket with 89.5% of them unmarried.
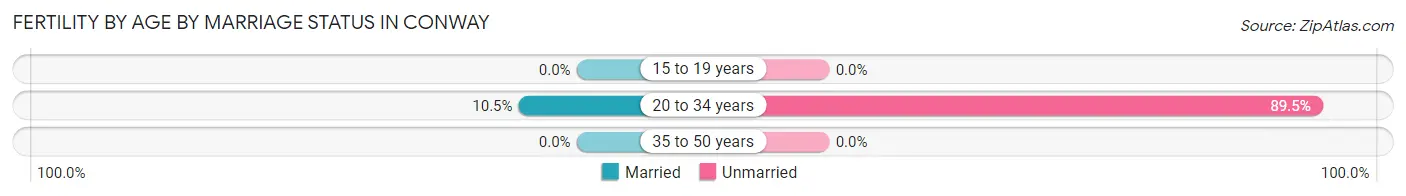
| Age Bracket | Married | Unmarried |
| 15 to 19 years | 0 (0.0%) | 0 (0.0%) |
| 20 to 34 years | 2 (10.5%) | 17 (89.5%) |
| 35 to 50 years | 0 (0.0%) | 0 (0.0%) |
| Total | 2 (10.5%) | 17 (89.5%) |
Fertility by Education in Conway
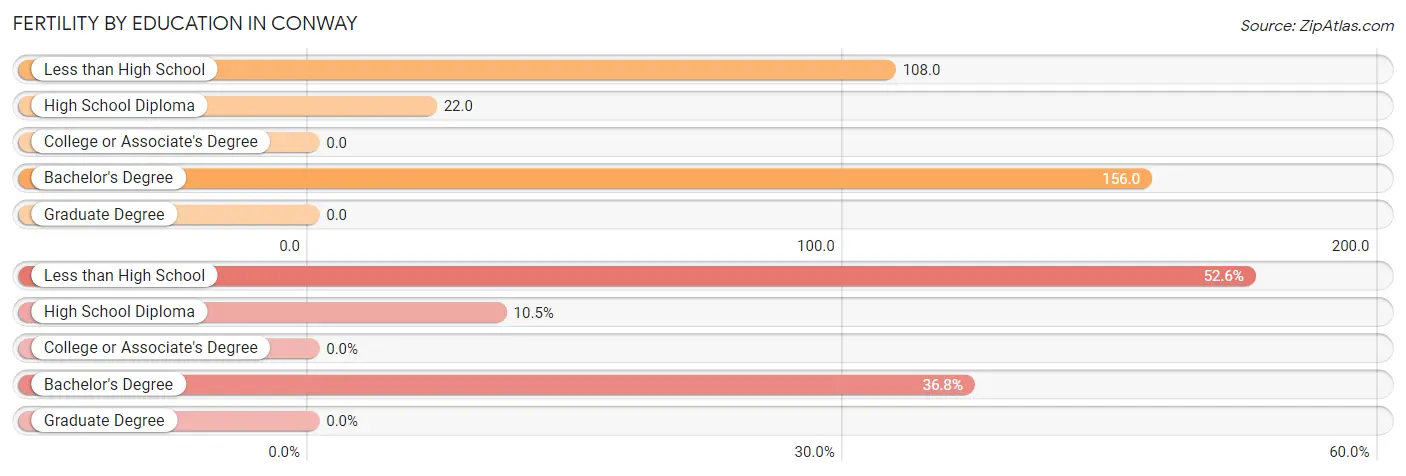
| Educational Attainment | Women with Births | Births / 1,000 Women |
| Less than High School | 10 (52.6%) | 108.0 |
| High School Diploma | 2 (10.5%) | 22.0 |
| College or Associate's Degree | 0 (0.0%) | 0.0 |
| Bachelor's Degree | 7 (36.8%) | 156.0 |
| Graduate Degree | 0 (0.0%) | 0.0 |
| Total | 19 (100.0%) | 65.0 |
Fertility by Education by Marriage Status in Conway
89.5% of women with births in Conway are unmarried. Women with the educational attainment of high school diploma are most likely to be married with 100.0% of them married at childbirth, while women with the educational attainment of less than high school are least likely to be married with 100.0% of them unmarried at childbirth.
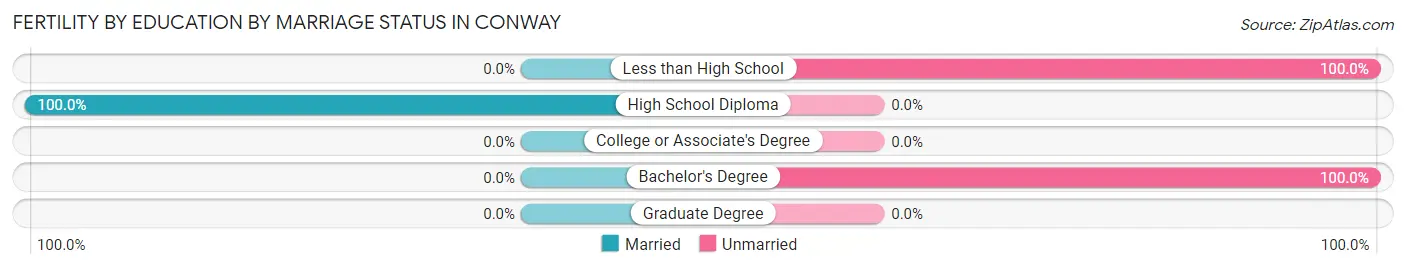
| Educational Attainment | Married | Unmarried |
| Less than High School | 0 (0.0%) | 10 (100.0%) |
| High School Diploma | 2 (100.0%) | 0 (0.0%) |
| College or Associate's Degree | 0 (0.0%) | 0 (0.0%) |
| Bachelor's Degree | 0 (0.0%) | 7 (100.0%) |
| Graduate Degree | 0 (0.0%) | 0 (0.0%) |
| Total | 2 (10.5%) | 17 (89.5%) |
Income in Conway
Income Overview in Conway
Per Capita Income in Conway is $22,210, while median incomes of families and households are $52,750 and $43,095 respectively.
| Characteristic | Number | Measure |
| Per Capita Income | 884 | $22,210 |
| Median Family Income | 233 | $52,750 |
| Mean Family Income | 233 | $70,216 |
| Median Household Income | 348 | $43,095 |
| Mean Household Income | 348 | $62,500 |
| Income Deficit | 233 | $13,292 |
| Wage / Income Gap (%) | 884 | 53.48% |
| Wage / Income Gap ($) | 884 | 46.52¢ per $1 |
| Gini / Inequality Index | 884 | 0.53 |
Earnings by Sex in Conway
Average Earnings in Conway are $26,250, $43,889 for men and $20,417 for women, a difference of 53.5%.
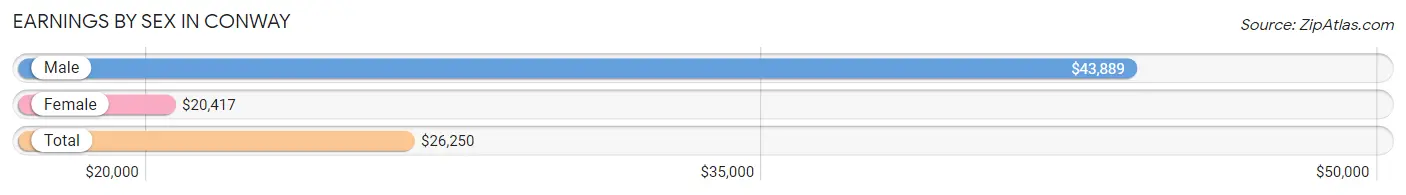
| Sex | Number | Average Earnings |
| Male | 136 (38.5%) | $43,889 |
| Female | 217 (61.5%) | $20,417 |
| Total | 353 (100.0%) | $26,250 |
Earnings by Sex by Income Bracket in Conway
The most common earnings brackets in Conway are $55,000 to $64,999 for men (24 | 17.6%) and $10,000 to $12,499 for women (29 | 13.4%).
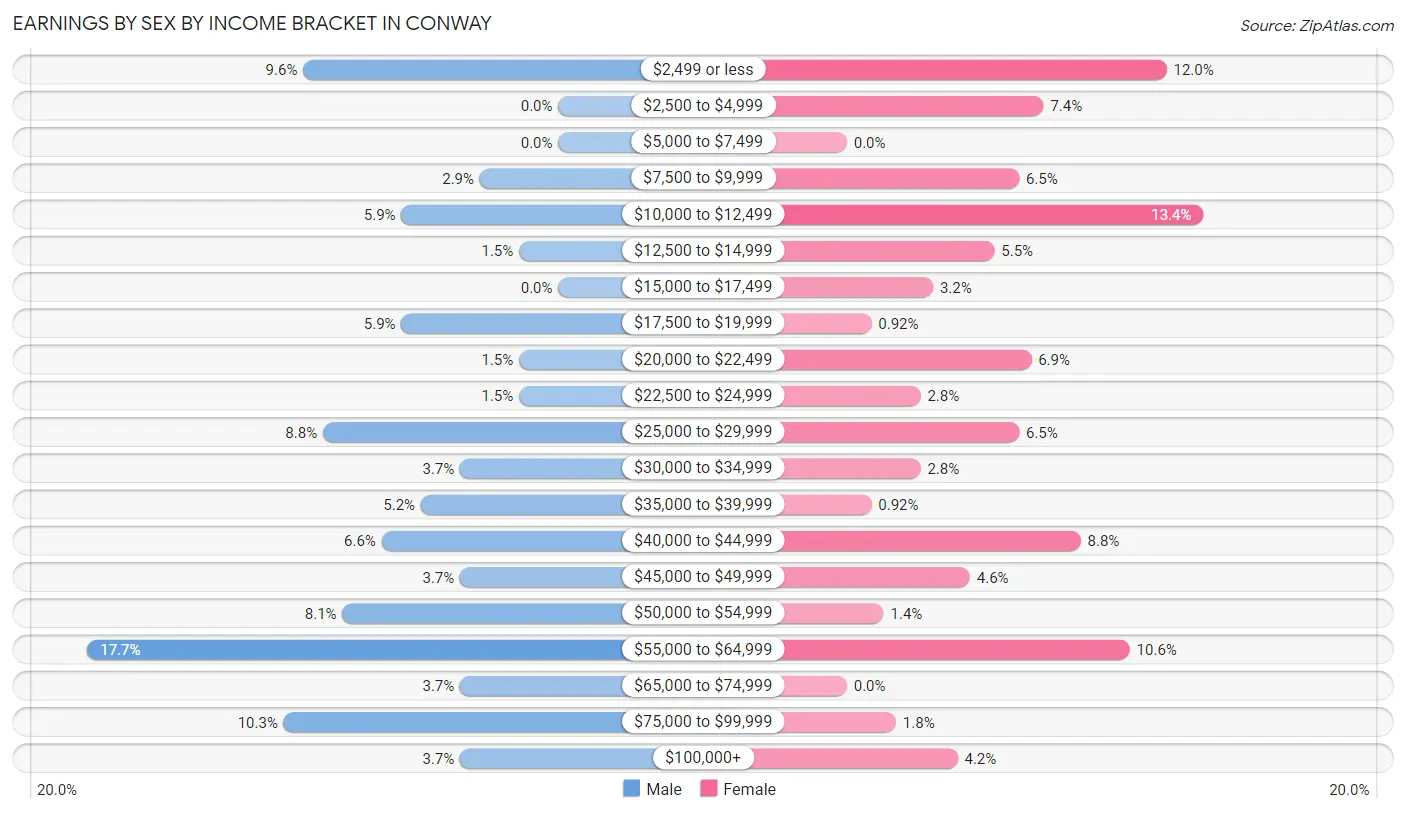
| Income | Male | Female |
| $2,499 or less | 13 (9.6%) | 26 (12.0%) |
| $2,500 to $4,999 | 0 (0.0%) | 16 (7.4%) |
| $5,000 to $7,499 | 0 (0.0%) | 0 (0.0%) |
| $7,500 to $9,999 | 4 (2.9%) | 14 (6.5%) |
| $10,000 to $12,499 | 8 (5.9%) | 29 (13.4%) |
| $12,500 to $14,999 | 2 (1.5%) | 12 (5.5%) |
| $15,000 to $17,499 | 0 (0.0%) | 7 (3.2%) |
| $17,500 to $19,999 | 8 (5.9%) | 2 (0.9%) |
| $20,000 to $22,499 | 2 (1.5%) | 15 (6.9%) |
| $22,500 to $24,999 | 2 (1.5%) | 6 (2.8%) |
| $25,000 to $29,999 | 12 (8.8%) | 14 (6.5%) |
| $30,000 to $34,999 | 5 (3.7%) | 6 (2.8%) |
| $35,000 to $39,999 | 7 (5.1%) | 2 (0.9%) |
| $40,000 to $44,999 | 9 (6.6%) | 19 (8.8%) |
| $45,000 to $49,999 | 5 (3.7%) | 10 (4.6%) |
| $50,000 to $54,999 | 11 (8.1%) | 3 (1.4%) |
| $55,000 to $64,999 | 24 (17.6%) | 23 (10.6%) |
| $65,000 to $74,999 | 5 (3.7%) | 0 (0.0%) |
| $75,000 to $99,999 | 14 (10.3%) | 4 (1.8%) |
| $100,000+ | 5 (3.7%) | 9 (4.2%) |
| Total | 136 (100.0%) | 217 (100.0%) |
Earnings by Sex by Educational Attainment in Conway
Average earnings in Conway are $49,583 for men and $22,083 for women, a difference of 55.5%. Men with an educational attainment of graduate degree enjoy the highest average annual earnings of $83,036, while those with college or associate's degree education earn the least with $42,500. Women with an educational attainment of graduate degree earn the most with the average annual earnings of $47,361, while those with high school diploma education have the smallest earnings of $21,042.
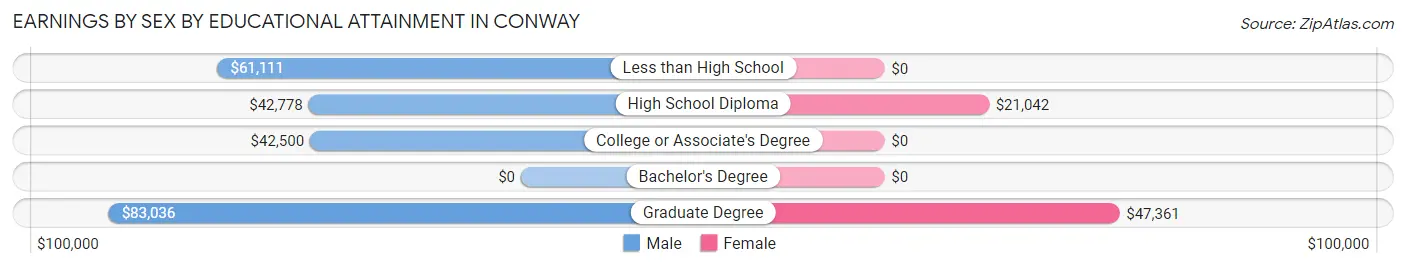
| Educational Attainment | Male Income | Female Income |
| Less than High School | $61,111 | $0 |
| High School Diploma | $42,778 | $21,042 |
| College or Associate's Degree | $42,500 | $0 |
| Bachelor's Degree | - | - |
| Graduate Degree | $83,036 | $47,361 |
| Total | $49,583 | $22,083 |
Family Income in Conway
Family Income Brackets in Conway
According to the Conway family income data, there are 53 families falling into the less than $10,000 income range, which is the most common income bracket and makes up 22.8% of all families. Conversely, the $10,000 to $14,999 income bracket is the least frequent group with only 3 families (1.3%) belonging to this category.
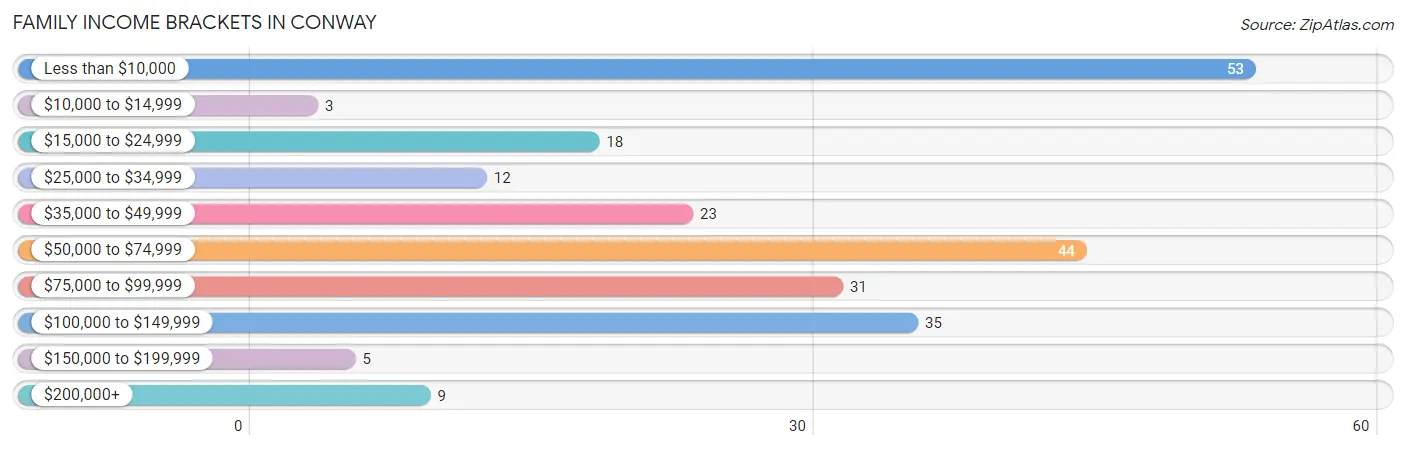
| Income Bracket | # Families | % Families |
| Less than $10,000 | 53 | 22.7% |
| $10,000 to $14,999 | 3 | 1.3% |
| $15,000 to $24,999 | 18 | 7.7% |
| $25,000 to $34,999 | 12 | 5.2% |
| $35,000 to $49,999 | 23 | 9.9% |
| $50,000 to $74,999 | 44 | 18.9% |
| $75,000 to $99,999 | 31 | 13.3% |
| $100,000 to $149,999 | 35 | 15.0% |
| $150,000 to $199,999 | 5 | 2.1% |
| $200,000+ | 9 | 3.9% |
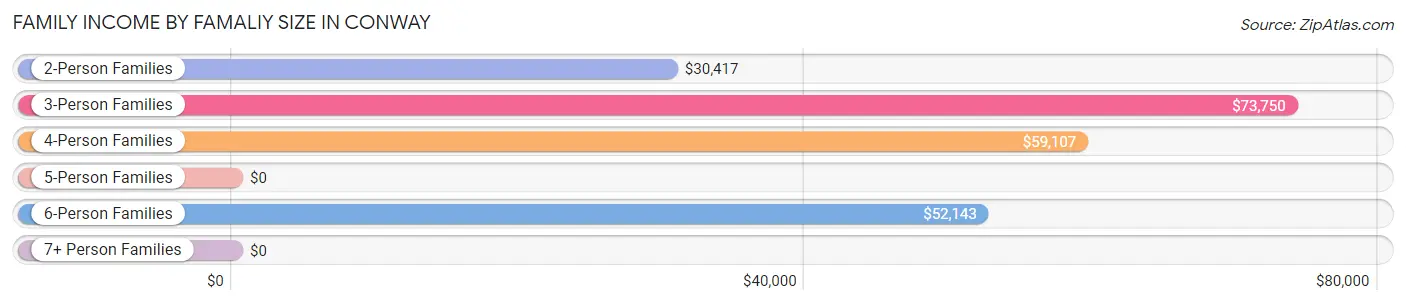
Family Income by Famaliy Size in Conway
3-person families (55 | 23.6%) account for the highest median family income in Conway with $73,750 per family, while 3-person families (55 | 23.6%) have the highest median income of $24,583 per family member.
| Income Bracket | # Families | Median Income |
| 2-Person Families | 100 (42.9%) | $30,417 |
| 3-Person Families | 55 (23.6%) | $73,750 |
| 4-Person Families | 49 (21.0%) | $59,107 |
| 5-Person Families | 2 (0.9%) | $0 |
| 6-Person Families | 18 (7.7%) | $52,143 |
| 7+ Person Families | 9 (3.9%) | $0 |
| Total | 233 (100.0%) | $52,750 |
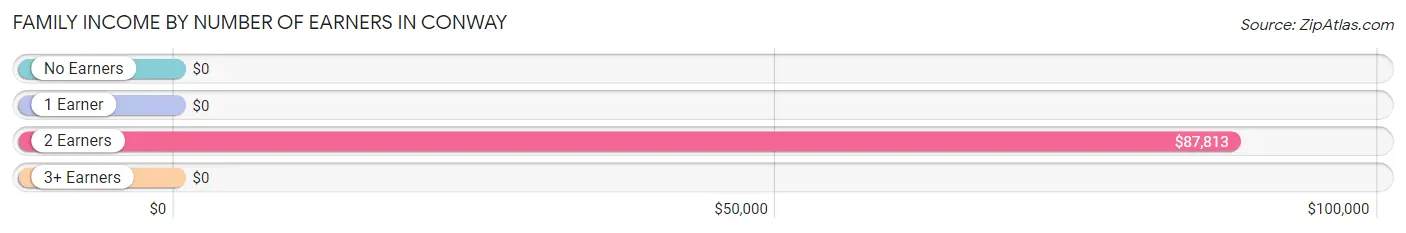
Family Income by Number of Earners in Conway
| Number of Earners | # Families | Median Income |
| No Earners | 60 (25.8%) | $0 |
| 1 Earner | 74 (31.8%) | $0 |
| 2 Earners | 93 (39.9%) | $87,813 |
| 3+ Earners | 6 (2.6%) | $0 |
| Total | 233 (100.0%) | $52,750 |
Household Income in Conway
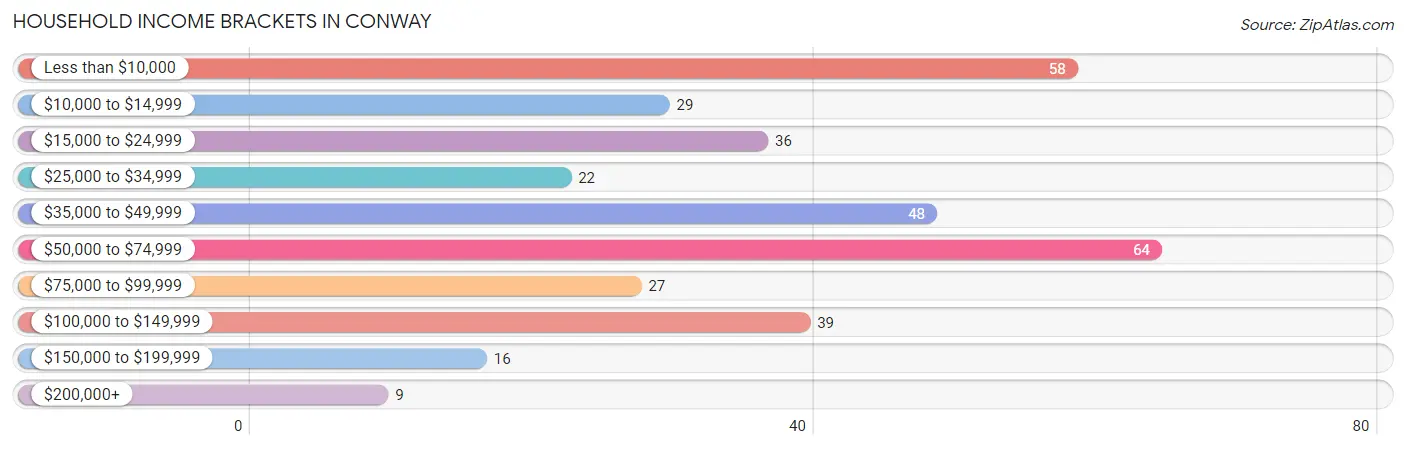
Household Income Brackets in Conway
With 64 households falling in the category, the $50,000 to $74,999 income range is the most frequent in Conway, accounting for 18.4% of all households. In contrast, only 9 households (2.6%) fall into the $200,000+ income bracket, making it the least populous group.
| Income Bracket | # Households | % Households |
| Less than $10,000 | 58 | 16.7% |
| $10,000 to $14,999 | 29 | 8.3% |
| $15,000 to $24,999 | 36 | 10.3% |
| $25,000 to $34,999 | 22 | 6.3% |
| $35,000 to $49,999 | 48 | 13.8% |
| $50,000 to $74,999 | 64 | 18.4% |
| $75,000 to $99,999 | 27 | 7.8% |
| $100,000 to $149,999 | 39 | 11.2% |
| $150,000 to $199,999 | 16 | 4.6% |
| $200,000+ | 9 | 2.6% |
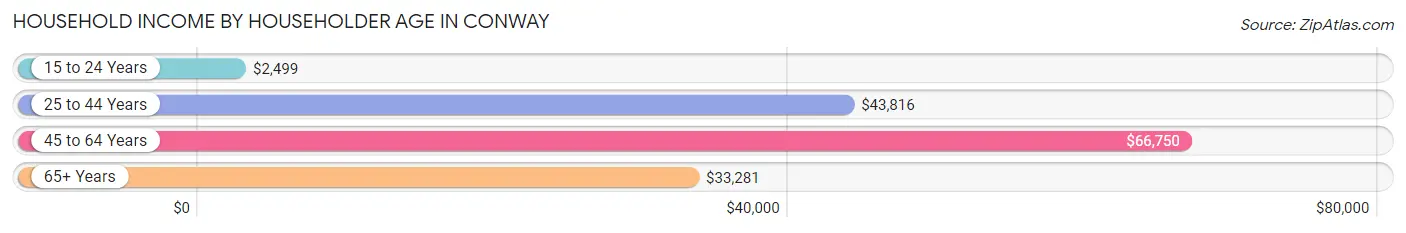
Household Income by Householder Age in Conway
The median household income in Conway is $43,095, with the highest median household income of $66,750 found in the 45 to 64 years age bracket for the primary householder. A total of 118 households (33.9%) fall into this category. Meanwhile, the 15 to 24 years age bracket for the primary householder has the lowest median household income of $2,499, with 27 households (7.8%) in this group.
| Income Bracket | # Households | Median Income |
| 15 to 24 Years | 27 (7.8%) | $2,499 |
| 25 to 44 Years | 120 (34.5%) | $43,816 |
| 45 to 64 Years | 118 (33.9%) | $66,750 |
| 65+ Years | 83 (23.8%) | $33,281 |
| Total | 348 (100.0%) | $43,095 |
Poverty in Conway
Income Below Poverty by Sex and Age in Conway
With 22.5% poverty level for males and 29.7% for females among the residents of Conway, 15 year old males and under 5 year old females are the most vulnerable to poverty, with 5 males (100.0%) and 31 females (50.0%) in their respective age groups living below the poverty level.
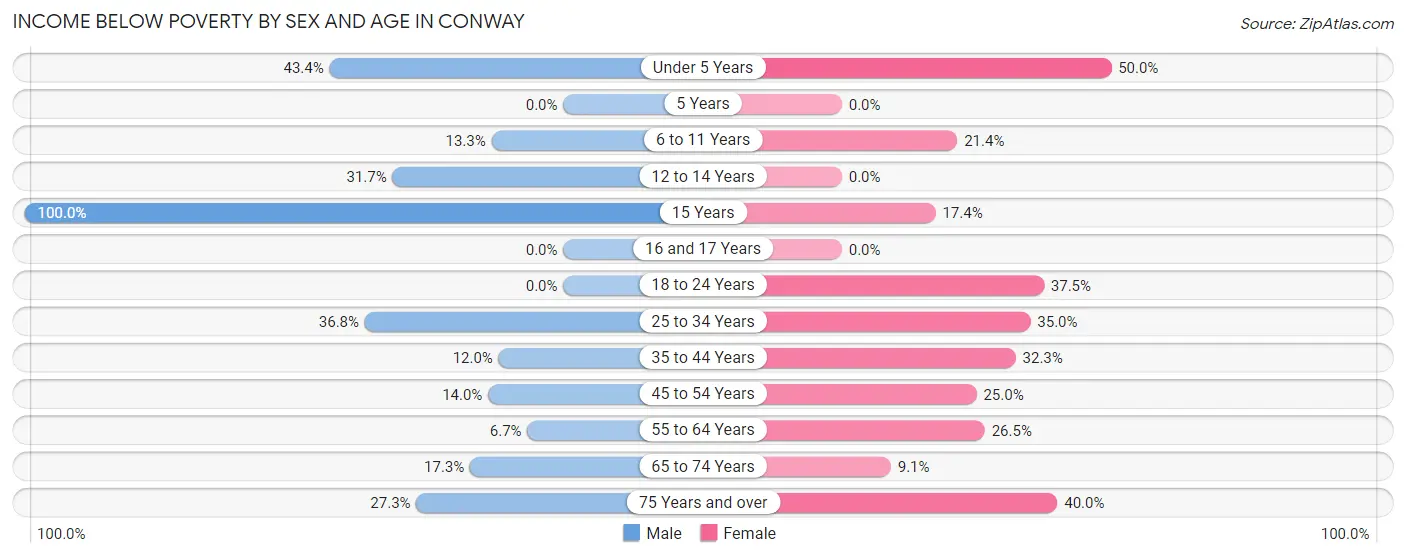
| Age Bracket | Male | Female |
| Under 5 Years | 23 (43.4%) | 31 (50.0%) |
| 5 Years | 0 (0.0%) | 0 (0.0%) |
| 6 to 11 Years | 6 (13.3%) | 6 (21.4%) |
| 12 to 14 Years | 13 (31.7%) | 0 (0.0%) |
| 15 Years | 5 (100.0%) | 4 (17.4%) |
| 16 and 17 Years | 0 (0.0%) | 0 (0.0%) |
| 18 to 24 Years | 0 (0.0%) | 27 (37.5%) |
| 25 to 34 Years | 14 (36.8%) | 14 (35.0%) |
| 35 to 44 Years | 3 (12.0%) | 30 (32.3%) |
| 45 to 54 Years | 6 (14.0%) | 15 (25.0%) |
| 55 to 64 Years | 2 (6.7%) | 13 (26.5%) |
| 65 to 74 Years | 9 (17.3%) | 3 (9.1%) |
| 75 Years and over | 3 (27.3%) | 6 (40.0%) |
| Total | 84 (22.5%) | 149 (29.7%) |
Income Above Poverty by Sex and Age in Conway
According to the poverty statistics in Conway, males aged 5 years and females aged 12 to 14 years are the age groups that are most secure financially, with 100.0% of males and 100.0% of females in these age groups living above the poverty line.
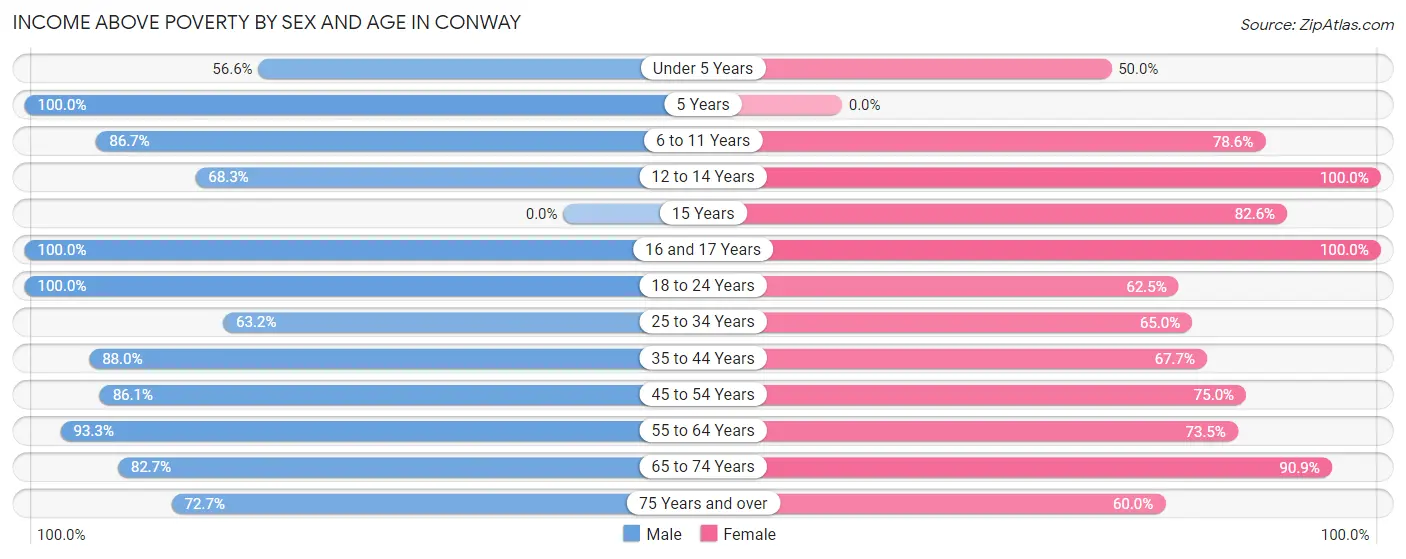
| Age Bracket | Male | Female |
| Under 5 Years | 30 (56.6%) | 31 (50.0%) |
| 5 Years | 7 (100.0%) | 0 (0.0%) |
| 6 to 11 Years | 39 (86.7%) | 22 (78.6%) |
| 12 to 14 Years | 28 (68.3%) | 6 (100.0%) |
| 15 Years | 0 (0.0%) | 19 (82.6%) |
| 16 and 17 Years | 6 (100.0%) | 21 (100.0%) |
| 18 to 24 Years | 17 (100.0%) | 45 (62.5%) |
| 25 to 34 Years | 24 (63.2%) | 26 (65.0%) |
| 35 to 44 Years | 22 (88.0%) | 63 (67.7%) |
| 45 to 54 Years | 37 (86.1%) | 45 (75.0%) |
| 55 to 64 Years | 28 (93.3%) | 36 (73.5%) |
| 65 to 74 Years | 43 (82.7%) | 30 (90.9%) |
| 75 Years and over | 8 (72.7%) | 9 (60.0%) |
| Total | 289 (77.5%) | 353 (70.3%) |
Income Below Poverty Among Married-Couple Families in Conway
The poverty statistics for married-couple families in Conway show that 14.6% or 19 of the total 130 families live below the poverty line. Families with 1 or 2 children have the highest poverty rate of 26.5%, comprising of 13 families. On the other hand, families with no children have the lowest poverty rate of 5.6%, which includes 3 families.
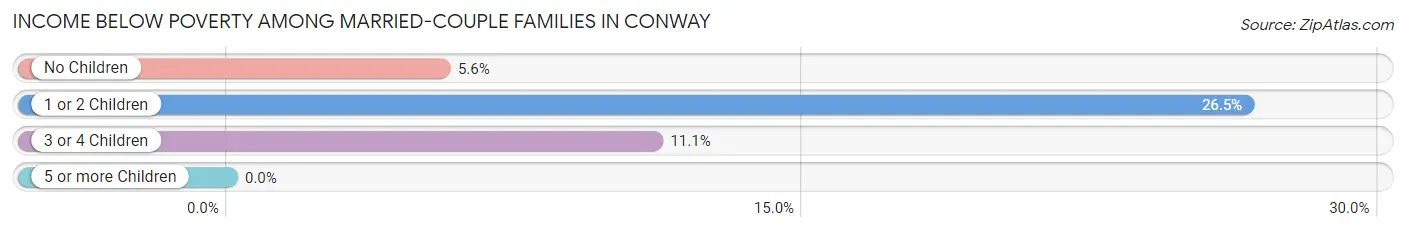
| Children | Above Poverty | Below Poverty |
| No Children | 51 (94.4%) | 3 (5.6%) |
| 1 or 2 Children | 36 (73.5%) | 13 (26.5%) |
| 3 or 4 Children | 24 (88.9%) | 3 (11.1%) |
| 5 or more Children | 0 (0.0%) | 0 (0.0%) |
| Total | 111 (85.4%) | 19 (14.6%) |
Income Below Poverty Among Single-Parent Households in Conway
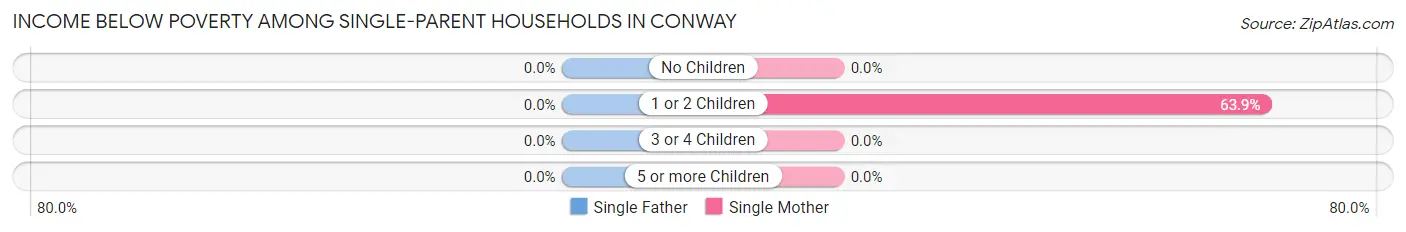
| Children | Single Father | Single Mother |
| No Children | 0 (0.0%) | 0 (0.0%) |
| 1 or 2 Children | 0 (0.0%) | 53 (63.9%) |
| 3 or 4 Children | 0 (0.0%) | 0 (0.0%) |
| 5 or more Children | 0 (0.0%) | 0 (0.0%) |
| Total | 0 (0.0%) | 53 (55.2%) |
Income Below Poverty Among Married-Couple vs Single-Parent Households in Conway
The poverty data for Conway shows that 19 of the married-couple family households (14.6%) and 53 of the single-parent households (51.5%) are living below the poverty level. Within the married-couple family households, those with 1 or 2 children have the highest poverty rate, with 13 households (26.5%) falling below the poverty line. Among the single-parent households, those with 1 or 2 children have the highest poverty rate, with 53 household (58.9%) living below poverty.
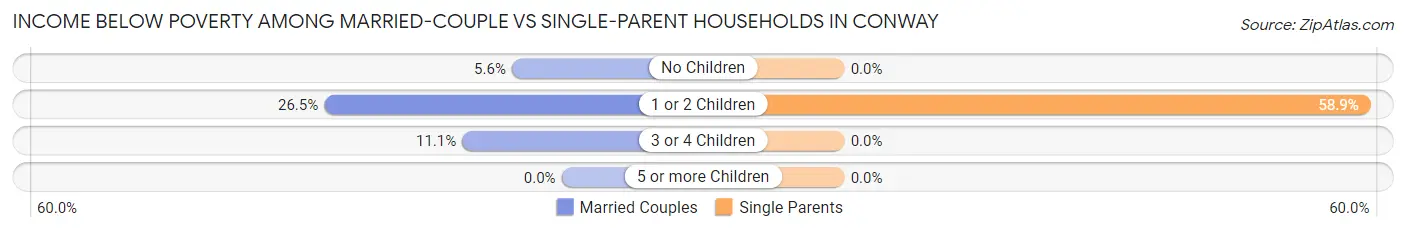
| Children | Married-Couple Families | Single-Parent Households |
| No Children | 3 (5.6%) | 0 (0.0%) |
| 1 or 2 Children | 13 (26.5%) | 53 (58.9%) |
| 3 or 4 Children | 3 (11.1%) | 0 (0.0%) |
| 5 or more Children | 0 (0.0%) | 0 (0.0%) |
| Total | 19 (14.6%) | 53 (51.5%) |
Employment Characteristics in Conway
Employment by Class of Employer in Conway
Among the 303 employed individuals in Conway, private company employees (191 | 63.0%), state government employees (56 | 18.5%), and local government employees (28 | 9.2%) make up the most common classes of employment.
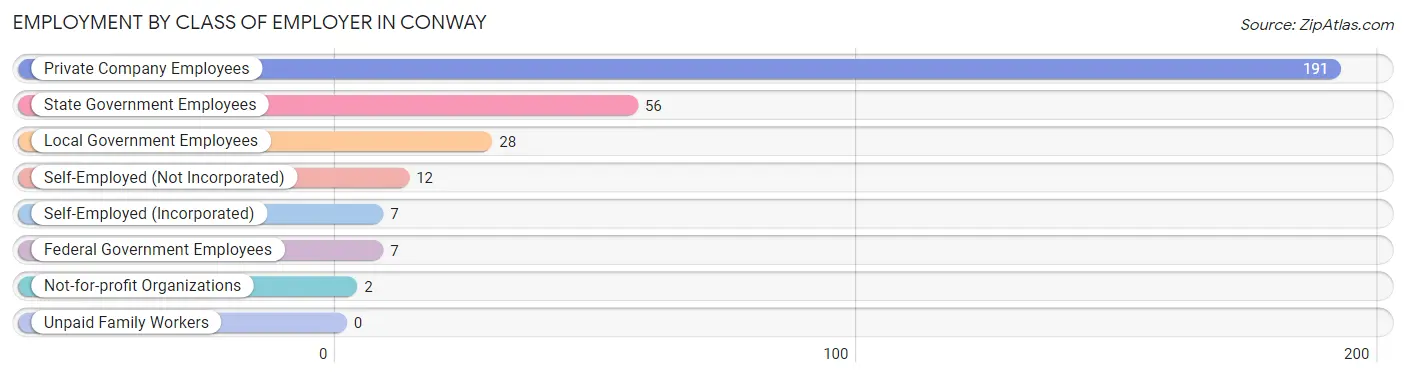
| Employer Class | # Employees | % Employees |
| Private Company Employees | 191 | 63.0% |
| Self-Employed (Incorporated) | 7 | 2.3% |
| Self-Employed (Not Incorporated) | 12 | 4.0% |
| Not-for-profit Organizations | 2 | 0.7% |
| Local Government Employees | 28 | 9.2% |
| State Government Employees | 56 | 18.5% |
| Federal Government Employees | 7 | 2.3% |
| Unpaid Family Workers | 0 | 0.0% |
| Total | 303 | 100.0% |
Employment Status by Age in Conway
According to the labor force statistics for Conway, out of the total population over 16 years of age (605), 58.3% or 353 individuals are in the labor force, with 12.7% or 45 of them unemployed. The age group with the highest labor force participation rate is 55 to 59 years, with 100.0% or 33 individuals in the labor force. Within the labor force, the 20 to 24 years age range has the highest percentage of unemployed individuals, with 43.5% or 20 of them being unemployed.
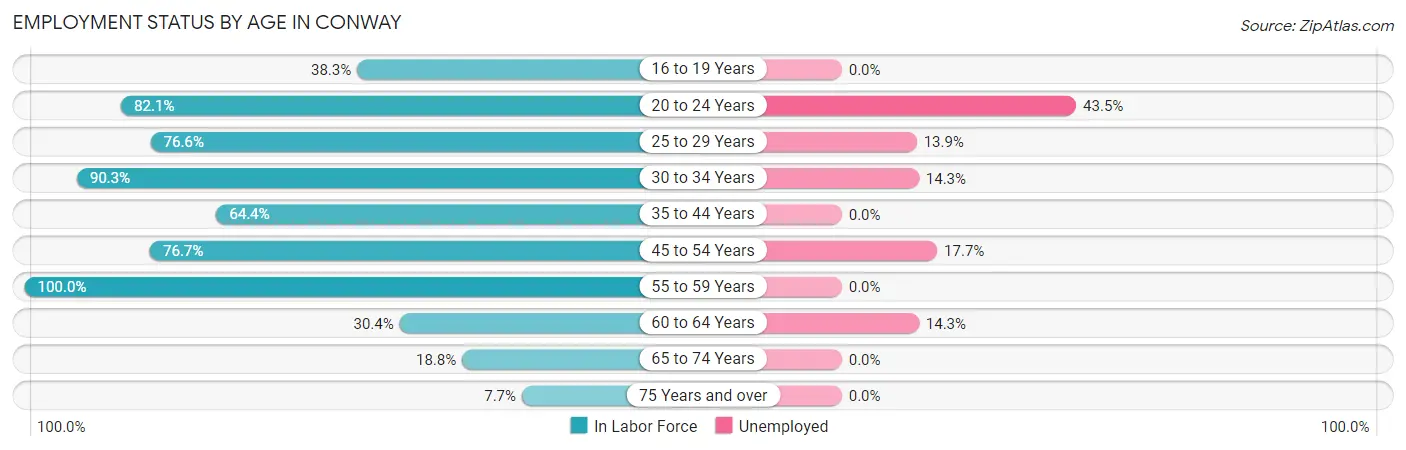
| Age Bracket | In Labor Force | Unemployed |
| 16 to 19 Years | 23 (38.3%) | 0 (0.0%) |
| 20 to 24 Years | 46 (82.1%) | 20 (43.5%) |
| 25 to 29 Years | 36 (76.6%) | 5 (13.9%) |
| 30 to 34 Years | 28 (90.3%) | 4 (14.3%) |
| 35 to 44 Years | 76 (64.4%) | 0 (0.0%) |
| 45 to 54 Years | 79 (76.7%) | 14 (17.7%) |
| 55 to 59 Years | 33 (100.0%) | 0 (0.0%) |
| 60 to 64 Years | 14 (30.4%) | 2 (14.3%) |
| 65 to 74 Years | 16 (18.8%) | 0 (0.0%) |
| 75 Years and over | 2 (7.7%) | 0 (0.0%) |
| Total | 353 (58.3%) | 45 (12.7%) |
Employment Status by Educational Attainment in Conway
According to labor force statistics for Conway, 70.4% of individuals (266) out of the total population between 25 and 64 years of age (378) are in the labor force, with 9.4% or 25 of them being unemployed. The group with the highest labor force participation rate are those with the educational attainment of bachelor's degree or higher, with 85.6% or 77 individuals in the labor force. Within the labor force, individuals with college / associate degree education have the highest percentage of unemployment, with 24.1% or 14 of them being unemployed.
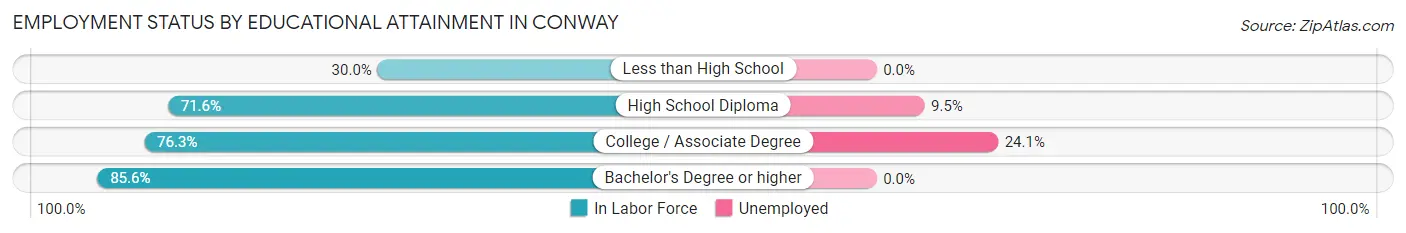
| Educational Attainment | In Labor Force | Unemployed |
| Less than High School | 15 (30.0%) | 0 (0.0%) |
| High School Diploma | 116 (71.6%) | 15 (9.5%) |
| College / Associate Degree | 58 (76.3%) | 18 (24.1%) |
| Bachelor's Degree or higher | 77 (85.6%) | 0 (0.0%) |
| Total | 266 (70.4%) | 36 (9.4%) |
Employment Occupations by Sex in Conway
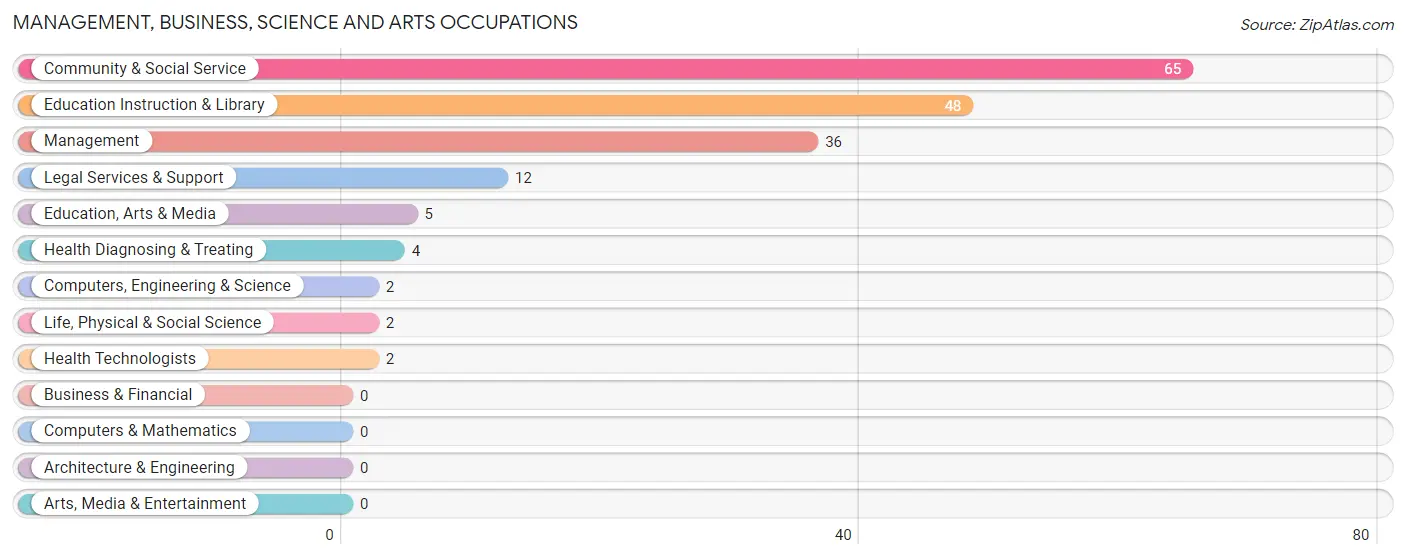
Management, Business, Science and Arts Occupations
The most common Management, Business, Science and Arts occupations in Conway are Community & Social Service (65 | 21.1%), Education Instruction & Library (48 | 15.6%), Management (36 | 11.7%), Legal Services & Support (12 | 3.9%), and Education, Arts & Media (5 | 1.6%).
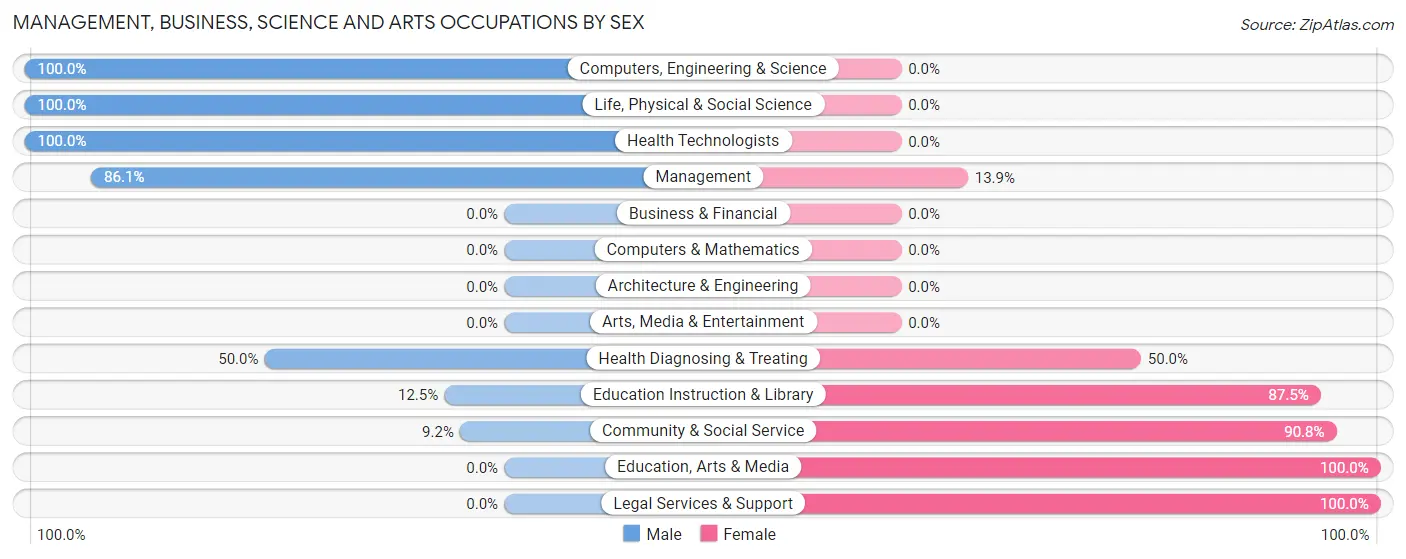
Management, Business, Science and Arts Occupations by Sex
Within the Management, Business, Science and Arts occupations in Conway, the most male-oriented occupations are Computers, Engineering & Science (100.0%), Life, Physical & Social Science (100.0%), and Health Technologists (100.0%), while the most female-oriented occupations are Education, Arts & Media (100.0%), Legal Services & Support (100.0%), and Community & Social Service (90.8%).
| Occupation | Male | Female |
| Management | 31 (86.1%) | 5 (13.9%) |
| Business & Financial | 0 (0.0%) | 0 (0.0%) |
| Computers, Engineering & Science | 2 (100.0%) | 0 (0.0%) |
| Computers & Mathematics | 0 (0.0%) | 0 (0.0%) |
| Architecture & Engineering | 0 (0.0%) | 0 (0.0%) |
| Life, Physical & Social Science | 2 (100.0%) | 0 (0.0%) |
| Community & Social Service | 6 (9.2%) | 59 (90.8%) |
| Education, Arts & Media | 0 (0.0%) | 5 (100.0%) |
| Legal Services & Support | 0 (0.0%) | 12 (100.0%) |
| Education Instruction & Library | 6 (12.5%) | 42 (87.5%) |
| Arts, Media & Entertainment | 0 (0.0%) | 0 (0.0%) |
| Health Diagnosing & Treating | 2 (50.0%) | 2 (50.0%) |
| Health Technologists | 2 (100.0%) | 0 (0.0%) |
| Total (Category) | 41 (38.3%) | 66 (61.7%) |
| Total (Overall) | 126 (40.9%) | 182 (59.1%) |
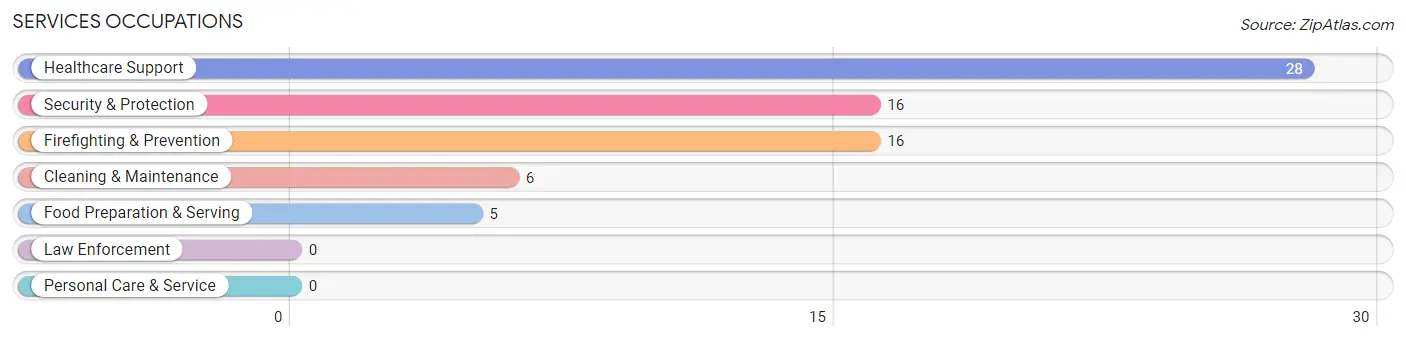
Services Occupations
The most common Services occupations in Conway are Healthcare Support (28 | 9.1%), Security & Protection (16 | 5.2%), Firefighting & Prevention (16 | 5.2%), Cleaning & Maintenance (6 | 1.9%), and Food Preparation & Serving (5 | 1.6%).
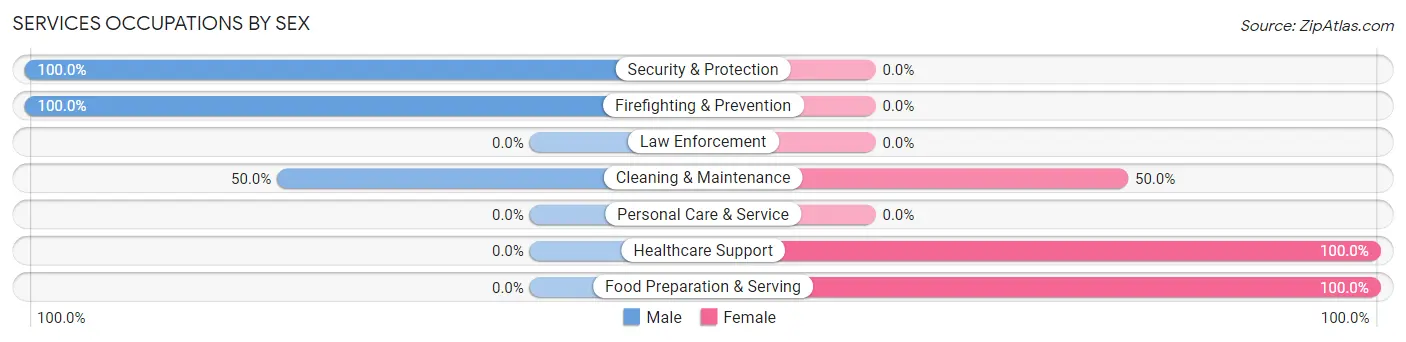
Services Occupations by Sex
Within the Services occupations in Conway, the most male-oriented occupations are Security & Protection (100.0%), Firefighting & Prevention (100.0%), and Cleaning & Maintenance (50.0%), while the most female-oriented occupations are Healthcare Support (100.0%), Food Preparation & Serving (100.0%), and Cleaning & Maintenance (50.0%).
| Occupation | Male | Female |
| Healthcare Support | 0 (0.0%) | 28 (100.0%) |
| Security & Protection | 16 (100.0%) | 0 (0.0%) |
| Firefighting & Prevention | 16 (100.0%) | 0 (0.0%) |
| Law Enforcement | 0 (0.0%) | 0 (0.0%) |
| Food Preparation & Serving | 0 (0.0%) | 5 (100.0%) |
| Cleaning & Maintenance | 3 (50.0%) | 3 (50.0%) |
| Personal Care & Service | 0 (0.0%) | 0 (0.0%) |
| Total (Category) | 19 (34.5%) | 36 (65.4%) |
| Total (Overall) | 126 (40.9%) | 182 (59.1%) |
Sales and Office Occupations
The most common Sales and Office occupations in Conway are Sales & Related (41 | 13.3%), and Office & Administration (27 | 8.8%).

Sales and Office Occupations by Sex

| Occupation | Male | Female |
| Sales & Related | 15 (36.6%) | 26 (63.4%) |
| Office & Administration | 0 (0.0%) | 27 (100.0%) |
| Total (Category) | 15 (22.1%) | 53 (77.9%) |
| Total (Overall) | 126 (40.9%) | 182 (59.1%) |
Natural Resources, Construction and Maintenance Occupations
The most common Natural Resources, Construction and Maintenance occupations in Conway are Installation, Maintenance & Repair (18 | 5.8%), and Construction & Extraction (12 | 3.9%).
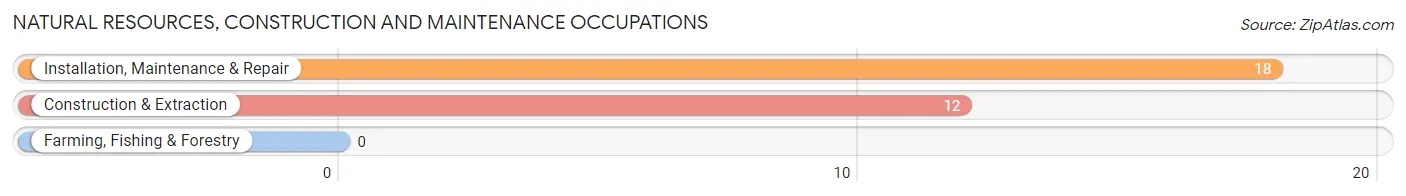
Natural Resources, Construction and Maintenance Occupations by Sex

| Occupation | Male | Female |
| Farming, Fishing & Forestry | 0 (0.0%) | 0 (0.0%) |
| Construction & Extraction | 12 (100.0%) | 0 (0.0%) |
| Installation, Maintenance & Repair | 18 (100.0%) | 0 (0.0%) |
| Total (Category) | 30 (100.0%) | 0 (0.0%) |
| Total (Overall) | 126 (40.9%) | 182 (59.1%) |
Production, Transportation and Moving Occupations
The most common Production, Transportation and Moving occupations in Conway are Production (16 | 5.2%), Transportation (16 | 5.2%), and Material Moving (16 | 5.2%).
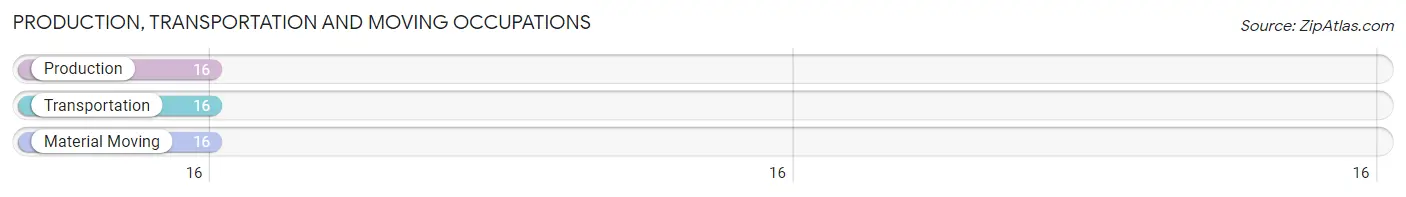
Production, Transportation and Moving Occupations by Sex
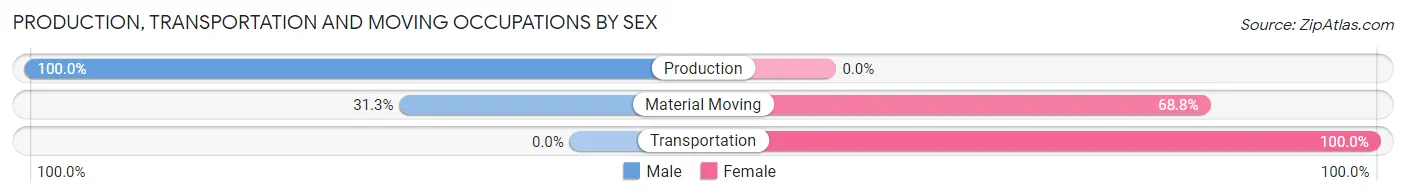
| Occupation | Male | Female |
| Production | 16 (100.0%) | 0 (0.0%) |
| Transportation | 0 (0.0%) | 16 (100.0%) |
| Material Moving | 5 (31.2%) | 11 (68.8%) |
| Total (Category) | 21 (43.8%) | 27 (56.2%) |
| Total (Overall) | 126 (40.9%) | 182 (59.1%) |
Employment Industries by Sex in Conway
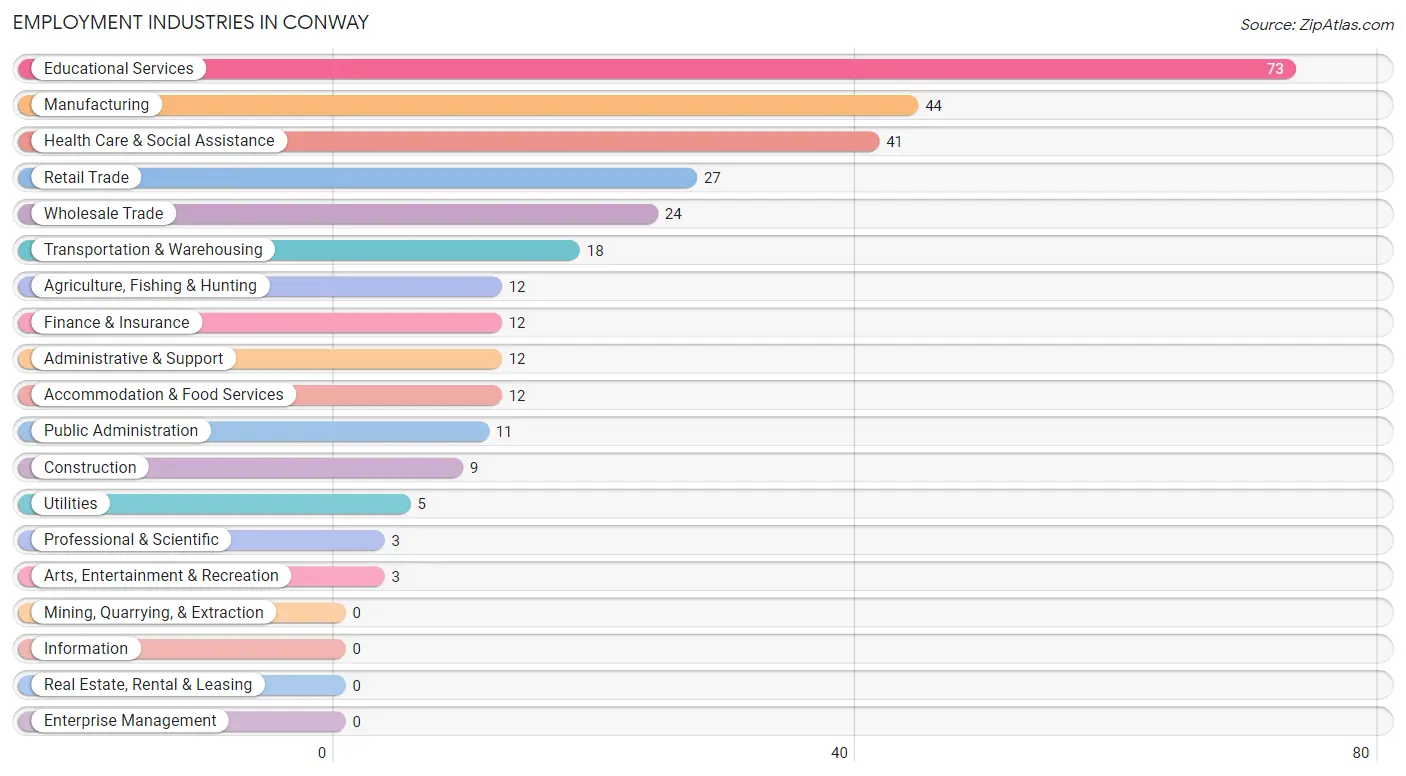
Employment Industries in Conway
The major employment industries in Conway include Educational Services (73 | 23.7%), Manufacturing (44 | 14.3%), Health Care & Social Assistance (41 | 13.3%), Retail Trade (27 | 8.8%), and Wholesale Trade (24 | 7.8%).
Employment Industries by Sex in Conway
The Conway industries that see more men than women are Agriculture, Fishing & Hunting (100.0%), Construction (100.0%), and Manufacturing (100.0%), whereas the industries that tend to have a higher number of women are Transportation & Warehousing (100.0%), Finance & Insurance (100.0%), and Professional & Scientific (100.0%).
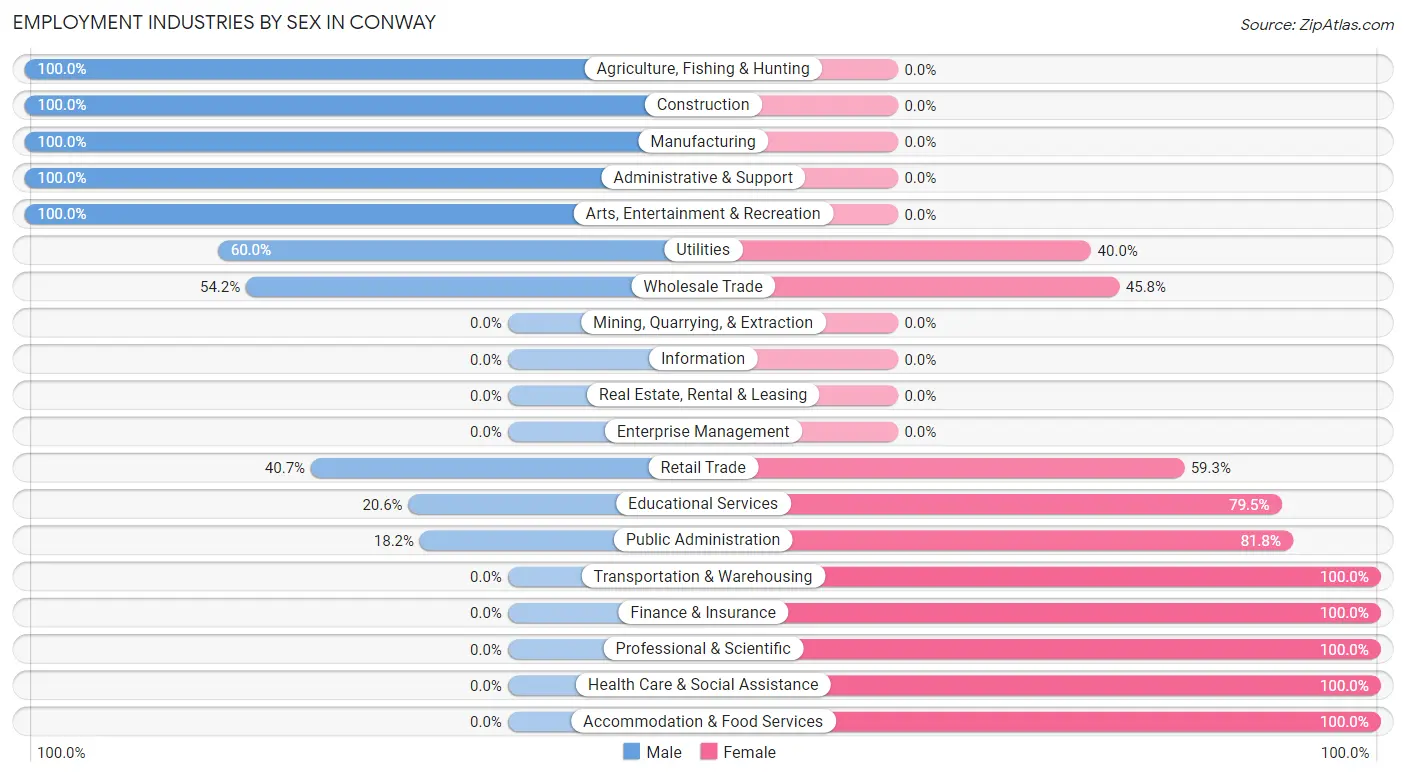
| Industry | Male | Female |
| Agriculture, Fishing & Hunting | 12 (100.0%) | 0 (0.0%) |
| Mining, Quarrying, & Extraction | 0 (0.0%) | 0 (0.0%) |
| Construction | 9 (100.0%) | 0 (0.0%) |
| Manufacturing | 44 (100.0%) | 0 (0.0%) |
| Wholesale Trade | 13 (54.2%) | 11 (45.8%) |
| Retail Trade | 11 (40.7%) | 16 (59.3%) |
| Transportation & Warehousing | 0 (0.0%) | 18 (100.0%) |
| Utilities | 3 (60.0%) | 2 (40.0%) |
| Information | 0 (0.0%) | 0 (0.0%) |
| Finance & Insurance | 0 (0.0%) | 12 (100.0%) |
| Real Estate, Rental & Leasing | 0 (0.0%) | 0 (0.0%) |
| Professional & Scientific | 0 (0.0%) | 3 (100.0%) |
| Enterprise Management | 0 (0.0%) | 0 (0.0%) |
| Administrative & Support | 12 (100.0%) | 0 (0.0%) |
| Educational Services | 15 (20.5%) | 58 (79.4%) |
| Health Care & Social Assistance | 0 (0.0%) | 41 (100.0%) |
| Arts, Entertainment & Recreation | 3 (100.0%) | 0 (0.0%) |
| Accommodation & Food Services | 0 (0.0%) | 12 (100.0%) |
| Public Administration | 2 (18.2%) | 9 (81.8%) |
| Total | 126 (40.9%) | 182 (59.1%) |
Education in Conway
School Enrollment in Conway
The most common levels of schooling among the 235 students in Conway are middle school (86 | 36.6%), high school (65 | 27.7%), and elementary school (30 | 12.8%).
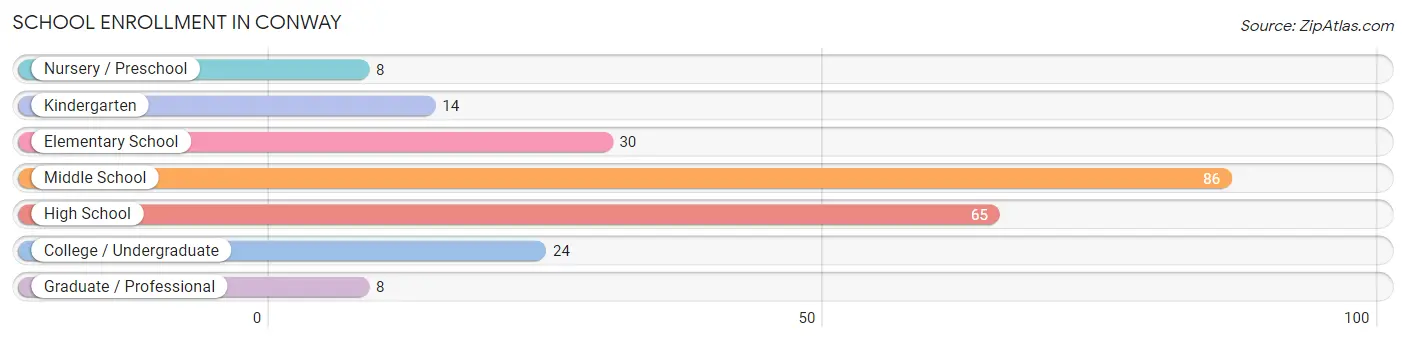
| School Level | # Students | % Students |
| Nursery / Preschool | 8 | 3.4% |
| Kindergarten | 14 | 6.0% |
| Elementary School | 30 | 12.8% |
| Middle School | 86 | 36.6% |
| High School | 65 | 27.7% |
| College / Undergraduate | 24 | 10.2% |
| Graduate / Professional | 8 | 3.4% |
| Total | 235 | 100.0% |
School Enrollment by Age by Funding Source in Conway
Out of a total of 235 students who are enrolled in schools in Conway, 84 (35.7%) attend a private institution, while the remaining 151 (64.3%) are enrolled in public schools. The age group of 3 to 4 year olds has the highest likelihood of being enrolled in private schools, with 8 (100.0% in the age bracket) enrolled. Conversely, the age group of 25 to 34 year olds has the lowest likelihood of being enrolled in a private school, with 3 (100.0% in the age bracket) attending a public institution.
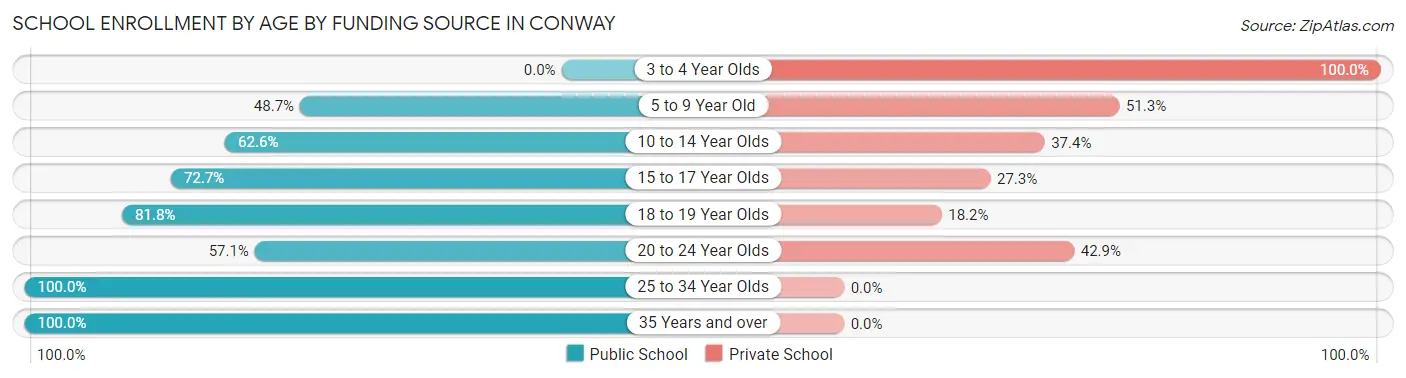
| Age Bracket | Public School | Private School |
| 3 to 4 Year Olds | 0 (0.0%) | 8 (100.0%) |
| 5 to 9 Year Old | 19 (48.7%) | 20 (51.3%) |
| 10 to 14 Year Olds | 57 (62.6%) | 34 (37.4%) |
| 15 to 17 Year Olds | 40 (72.7%) | 15 (27.3%) |
| 18 to 19 Year Olds | 18 (81.8%) | 4 (18.2%) |
| 20 to 24 Year Olds | 4 (57.1%) | 3 (42.9%) |
| 25 to 34 Year Olds | 3 (100.0%) | 0 (0.0%) |
| 35 Years and over | 10 (100.0%) | 0 (0.0%) |
| Total | 151 (64.3%) | 84 (35.7%) |
Educational Attainment by Field of Study in Conway
Education (39 | 33.1%), literature & languages (29 | 24.6%), visual & performing arts (10 | 8.5%), physical & health sciences (8 | 6.8%), and psychology (7 | 5.9%) are the most common fields of study among 118 individuals in Conway who have obtained a bachelor's degree or higher.
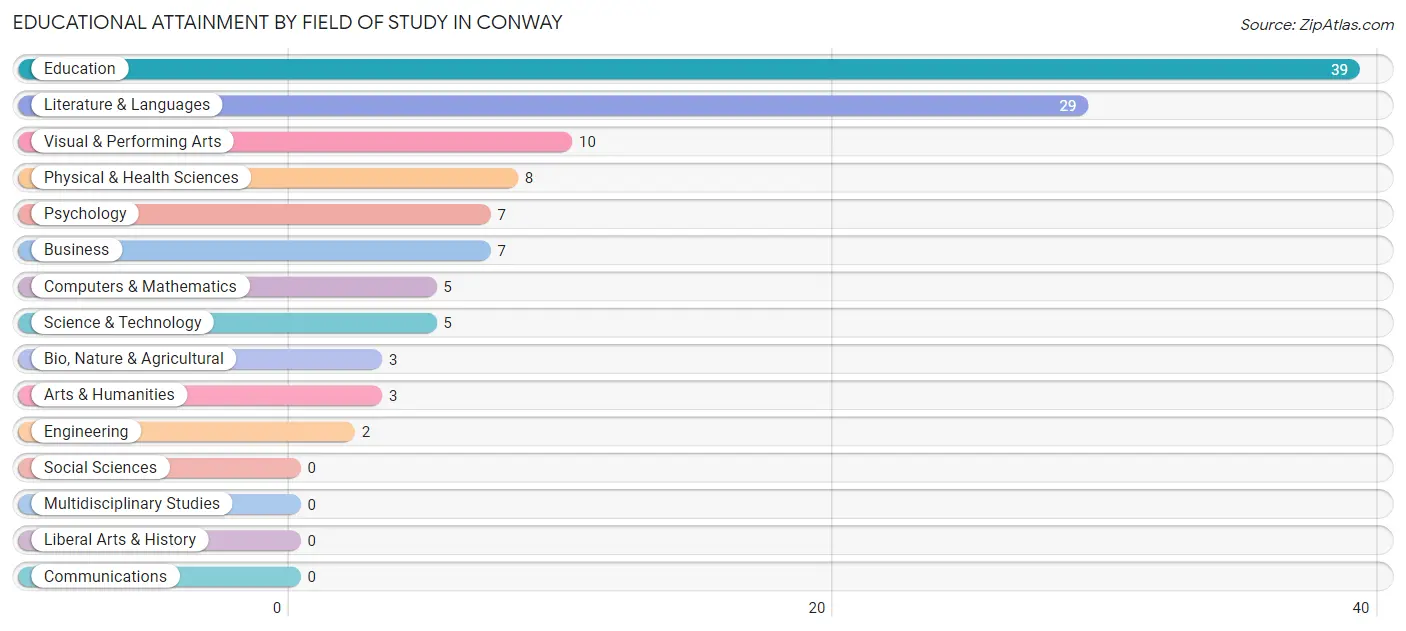
| Field of Study | # Graduates | % Graduates |
| Computers & Mathematics | 5 | 4.2% |
| Bio, Nature & Agricultural | 3 | 2.5% |
| Physical & Health Sciences | 8 | 6.8% |
| Psychology | 7 | 5.9% |
| Social Sciences | 0 | 0.0% |
| Engineering | 2 | 1.7% |
| Multidisciplinary Studies | 0 | 0.0% |
| Science & Technology | 5 | 4.2% |
| Business | 7 | 5.9% |
| Education | 39 | 33.1% |
| Literature & Languages | 29 | 24.6% |
| Liberal Arts & History | 0 | 0.0% |
| Visual & Performing Arts | 10 | 8.5% |
| Communications | 0 | 0.0% |
| Arts & Humanities | 3 | 2.5% |
| Total | 118 | 100.0% |
Transportation & Commute in Conway
Vehicle Availability by Sex in Conway
The most prevalent vehicle ownership categories in Conway are males with 2 vehicles (42, accounting for 34.7%) and females with 2 vehicles (66, making up 23.1%).
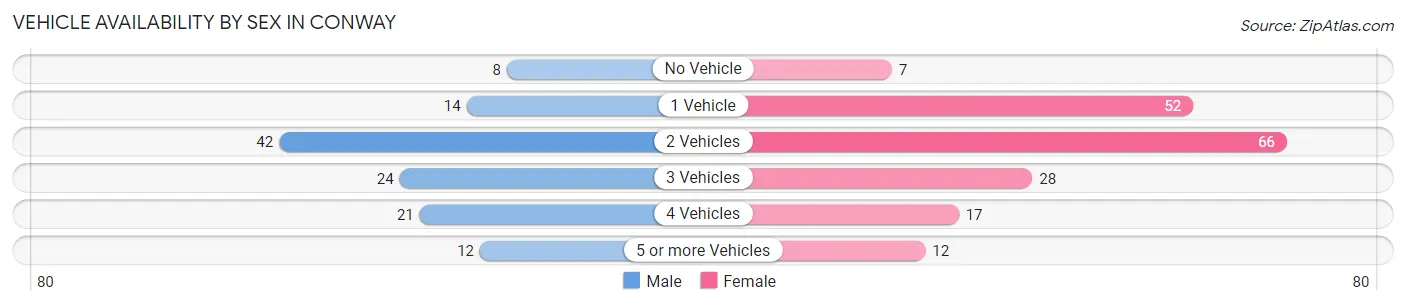
| Vehicles Available | Male | Female |
| No Vehicle | 8 (6.6%) | 7 (3.8%) |
| 1 Vehicle | 14 (11.6%) | 52 (28.6%) |
| 2 Vehicles | 42 (34.7%) | 66 (36.3%) |
| 3 Vehicles | 24 (19.8%) | 28 (15.4%) |
| 4 Vehicles | 21 (17.4%) | 17 (9.3%) |
| 5 or more Vehicles | 12 (9.9%) | 12 (6.6%) |
| Total | 121 (100.0%) | 182 (100.0%) |
Commute Time in Conway
The most frequently occuring commute durations in Conway are 30 to 34 minutes (59 commuters, 22.4%), 20 to 24 minutes (40 commuters, 15.2%), and 10 to 14 minutes (26 commuters, 9.9%).
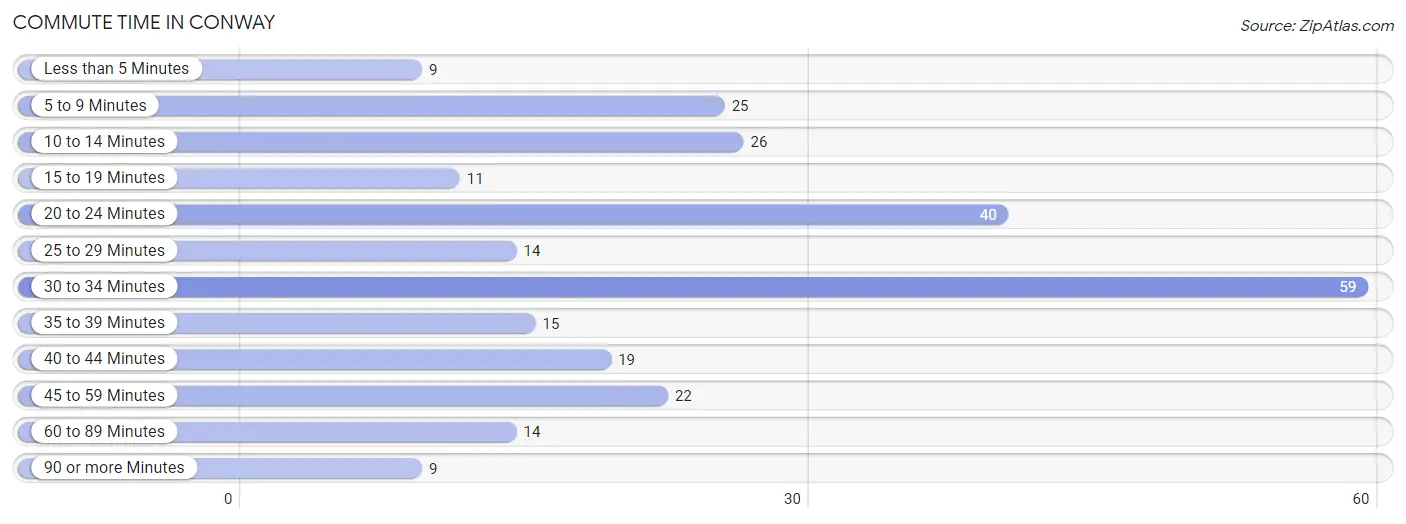
| Commute Time | # Commuters | % Commuters |
| Less than 5 Minutes | 9 | 3.4% |
| 5 to 9 Minutes | 25 | 9.5% |
| 10 to 14 Minutes | 26 | 9.9% |
| 15 to 19 Minutes | 11 | 4.2% |
| 20 to 24 Minutes | 40 | 15.2% |
| 25 to 29 Minutes | 14 | 5.3% |
| 30 to 34 Minutes | 59 | 22.4% |
| 35 to 39 Minutes | 15 | 5.7% |
| 40 to 44 Minutes | 19 | 7.2% |
| 45 to 59 Minutes | 22 | 8.4% |
| 60 to 89 Minutes | 14 | 5.3% |
| 90 or more Minutes | 9 | 3.4% |
Commute Time by Sex in Conway
The most common commute times in Conway are 45 to 59 minutes (17 commuters, 14.7%) for males and 30 to 34 minutes (43 commuters, 29.2%) for females.
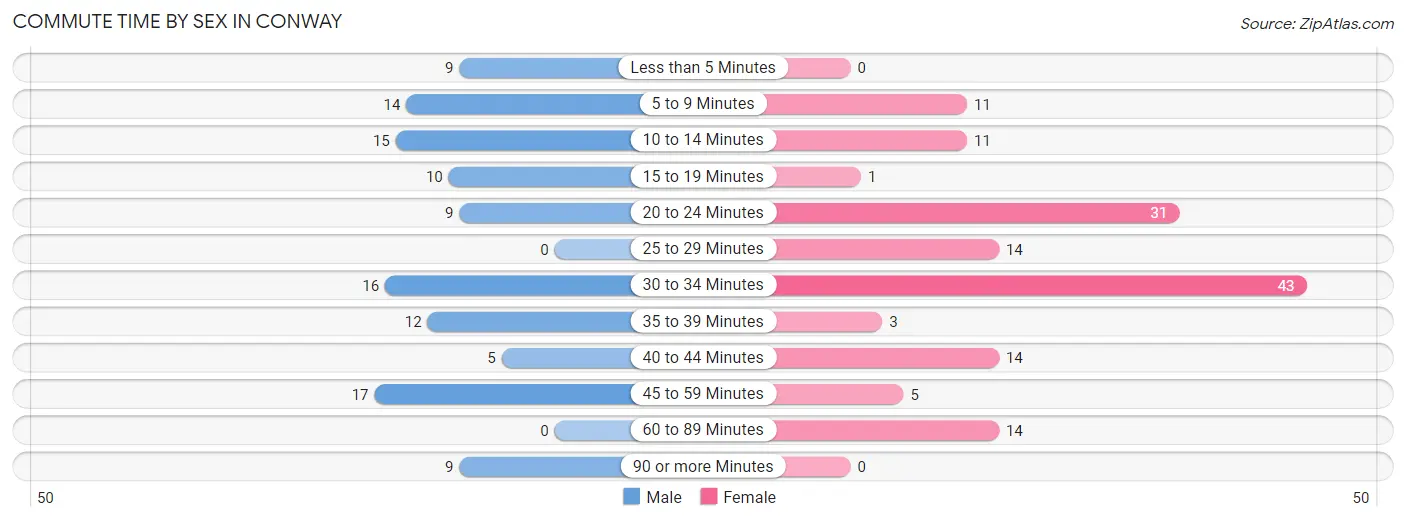
| Commute Time | Male | Female |
| Less than 5 Minutes | 9 (7.8%) | 0 (0.0%) |
| 5 to 9 Minutes | 14 (12.1%) | 11 (7.5%) |
| 10 to 14 Minutes | 15 (12.9%) | 11 (7.5%) |
| 15 to 19 Minutes | 10 (8.6%) | 1 (0.7%) |
| 20 to 24 Minutes | 9 (7.8%) | 31 (21.1%) |
| 25 to 29 Minutes | 0 (0.0%) | 14 (9.5%) |
| 30 to 34 Minutes | 16 (13.8%) | 43 (29.2%) |
| 35 to 39 Minutes | 12 (10.3%) | 3 (2.0%) |
| 40 to 44 Minutes | 5 (4.3%) | 14 (9.5%) |
| 45 to 59 Minutes | 17 (14.7%) | 5 (3.4%) |
| 60 to 89 Minutes | 0 (0.0%) | 14 (9.5%) |
| 90 or more Minutes | 9 (7.8%) | 0 (0.0%) |
Time of Departure to Work by Sex in Conway
The most frequent times of departure to work in Conway are 7:00 AM to 7:29 AM (25, 21.5%) for males and 8:00 AM to 8:29 AM (25, 17.0%) for females.
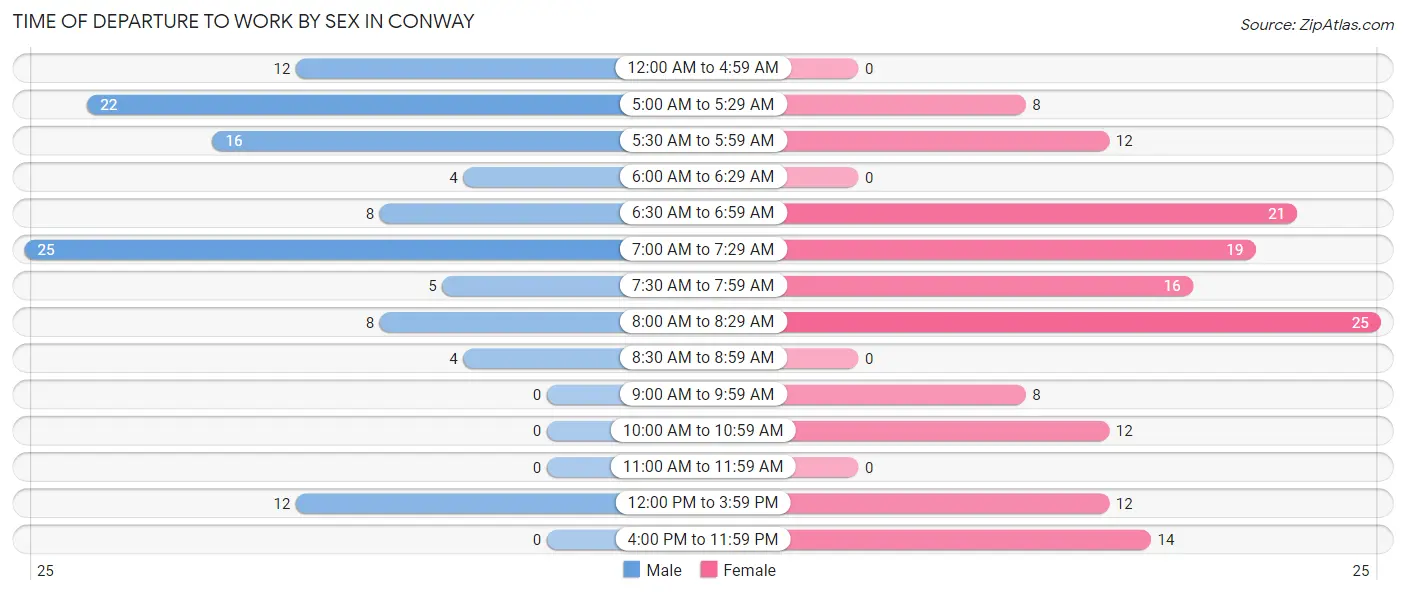
| Time of Departure | Male | Female |
| 12:00 AM to 4:59 AM | 12 (10.3%) | 0 (0.0%) |
| 5:00 AM to 5:29 AM | 22 (19.0%) | 8 (5.4%) |
| 5:30 AM to 5:59 AM | 16 (13.8%) | 12 (8.2%) |
| 6:00 AM to 6:29 AM | 4 (3.5%) | 0 (0.0%) |
| 6:30 AM to 6:59 AM | 8 (6.9%) | 21 (14.3%) |
| 7:00 AM to 7:29 AM | 25 (21.5%) | 19 (12.9%) |
| 7:30 AM to 7:59 AM | 5 (4.3%) | 16 (10.9%) |
| 8:00 AM to 8:29 AM | 8 (6.9%) | 25 (17.0%) |
| 8:30 AM to 8:59 AM | 4 (3.5%) | 0 (0.0%) |
| 9:00 AM to 9:59 AM | 0 (0.0%) | 8 (5.4%) |
| 10:00 AM to 10:59 AM | 0 (0.0%) | 12 (8.2%) |
| 11:00 AM to 11:59 AM | 0 (0.0%) | 0 (0.0%) |
| 12:00 PM to 3:59 PM | 12 (10.3%) | 12 (8.2%) |
| 4:00 PM to 11:59 PM | 0 (0.0%) | 14 (9.5%) |
| Total | 116 (100.0%) | 147 (100.0%) |
Housing Occupancy in Conway
Occupancy by Ownership in Conway
Of the total 348 dwellings in Conway, owner-occupied units account for 200 (57.5%), while renter-occupied units make up 148 (42.5%).
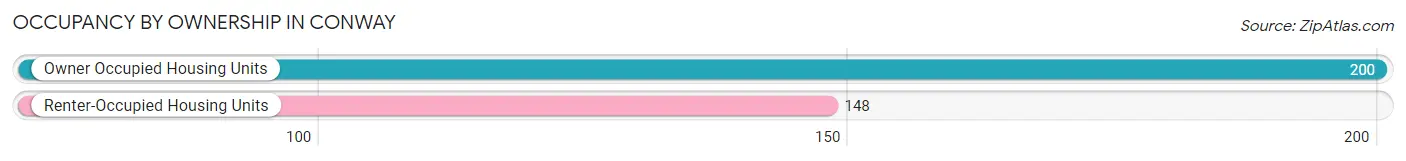
| Occupancy | # Housing Units | % Housing Units |
| Owner Occupied Housing Units | 200 | 57.5% |
| Renter-Occupied Housing Units | 148 | 42.5% |
| Total Occupied Housing Units | 348 | 100.0% |
Occupancy by Household Size in Conway
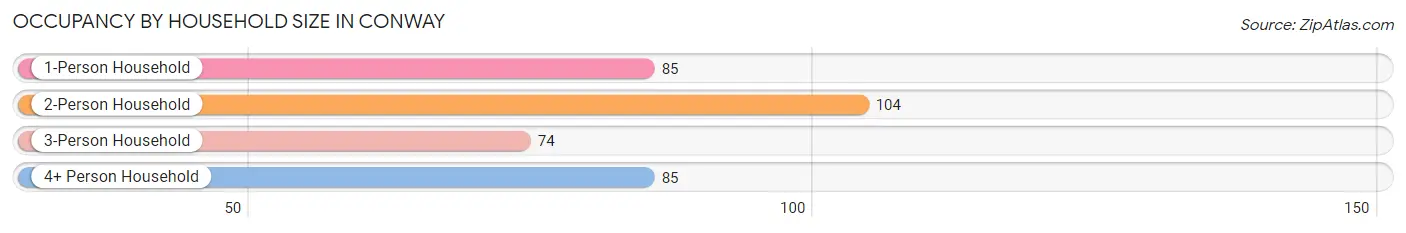
| Household Size | # Housing Units | % Housing Units |
| 1-Person Household | 85 | 24.4% |
| 2-Person Household | 104 | 29.9% |
| 3-Person Household | 74 | 21.3% |
| 4+ Person Household | 85 | 24.4% |
| Total Housing Units | 348 | 100.0% |
Occupancy by Ownership by Household Size in Conway
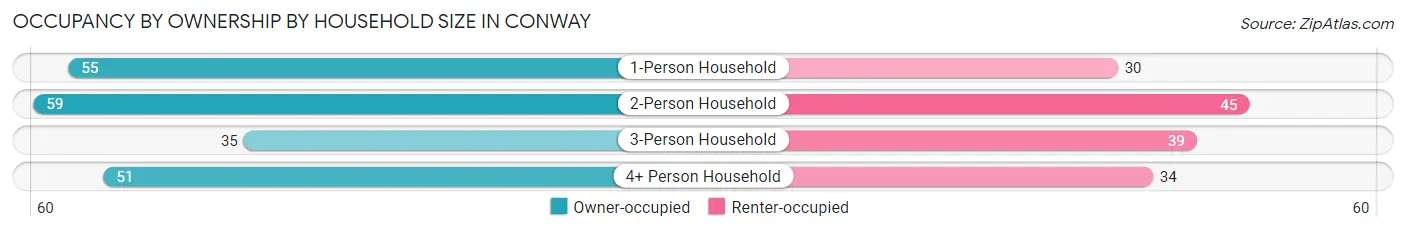
| Household Size | Owner-occupied | Renter-occupied |
| 1-Person Household | 55 (64.7%) | 30 (35.3%) |
| 2-Person Household | 59 (56.7%) | 45 (43.3%) |
| 3-Person Household | 35 (47.3%) | 39 (52.7%) |
| 4+ Person Household | 51 (60.0%) | 34 (40.0%) |
| Total Housing Units | 200 (57.5%) | 148 (42.5%) |
Occupancy by Educational Attainment in Conway
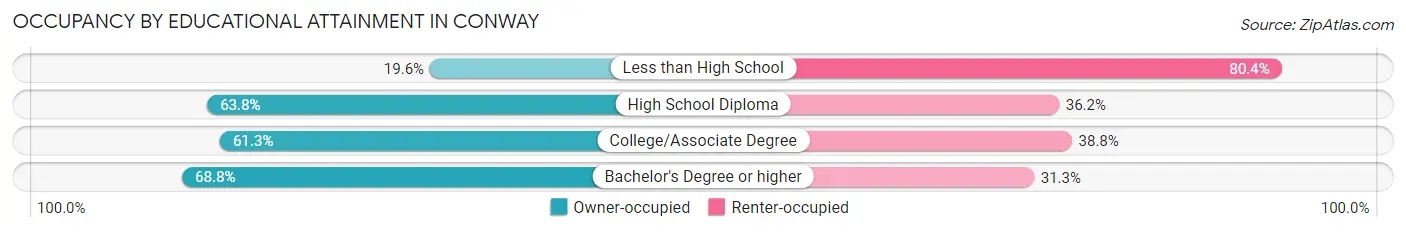
| Household Size | Owner-occupied | Renter-occupied |
| Less than High School | 11 (19.6%) | 45 (80.4%) |
| High School Diploma | 74 (63.8%) | 42 (36.2%) |
| College/Associate Degree | 49 (61.3%) | 31 (38.8%) |
| Bachelor's Degree or higher | 66 (68.8%) | 30 (31.2%) |
Occupancy by Age of Householder in Conway
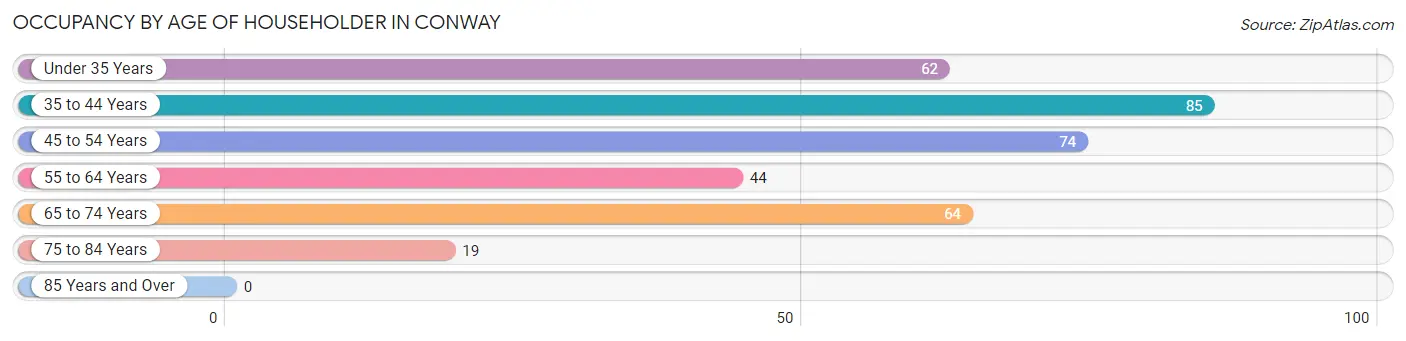
| Age Bracket | # Households | % Households |
| Under 35 Years | 62 | 17.8% |
| 35 to 44 Years | 85 | 24.4% |
| 45 to 54 Years | 74 | 21.3% |
| 55 to 64 Years | 44 | 12.6% |
| 65 to 74 Years | 64 | 18.4% |
| 75 to 84 Years | 19 | 5.5% |
| 85 Years and Over | 0 | 0.0% |
| Total | 348 | 100.0% |
Housing Finances in Conway
Median Income by Occupancy in Conway
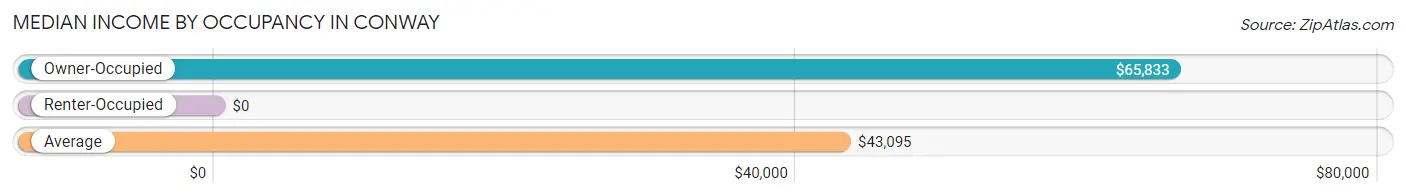
| Occupancy Type | # Households | Median Income |
| Owner-Occupied | 200 (57.5%) | $65,833 |
| Renter-Occupied | 148 (42.5%) | $0 |
| Average | 348 (100.0%) | $43,095 |
Occupancy by Householder Income Bracket in Conway
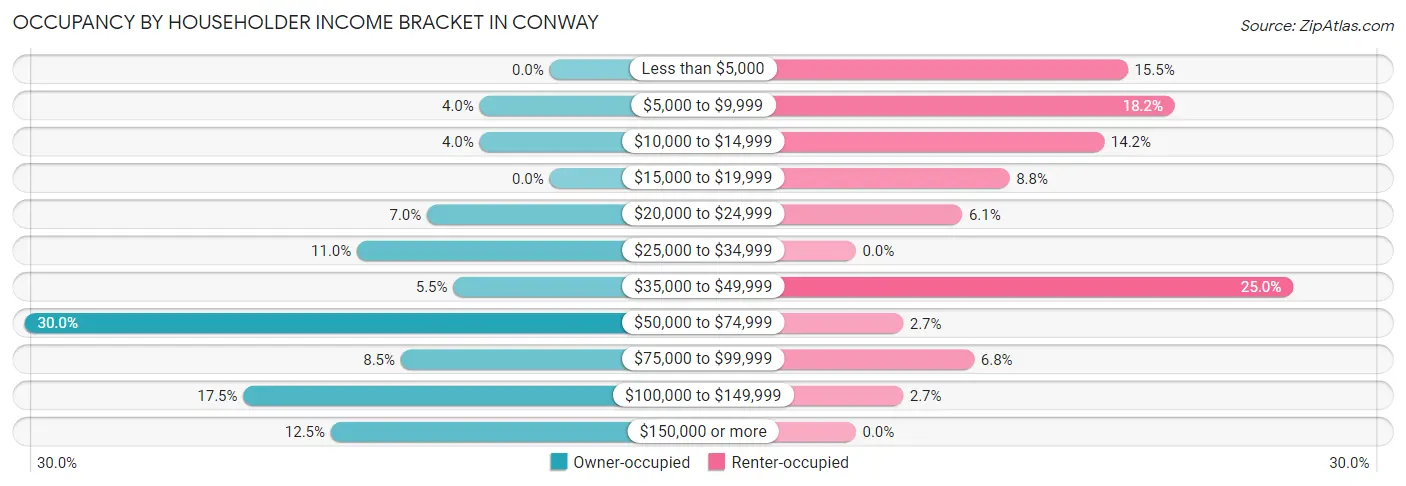
| Income Bracket | Owner-occupied | Renter-occupied |
| Less than $5,000 | 0 (0.0%) | 23 (15.5%) |
| $5,000 to $9,999 | 8 (4.0%) | 27 (18.2%) |
| $10,000 to $14,999 | 8 (4.0%) | 21 (14.2%) |
| $15,000 to $19,999 | 0 (0.0%) | 13 (8.8%) |
| $20,000 to $24,999 | 14 (7.0%) | 9 (6.1%) |
| $25,000 to $34,999 | 22 (11.0%) | 0 (0.0%) |
| $35,000 to $49,999 | 11 (5.5%) | 37 (25.0%) |
| $50,000 to $74,999 | 60 (30.0%) | 4 (2.7%) |
| $75,000 to $99,999 | 17 (8.5%) | 10 (6.8%) |
| $100,000 to $149,999 | 35 (17.5%) | 4 (2.7%) |
| $150,000 or more | 25 (12.5%) | 0 (0.0%) |
| Total | 200 (100.0%) | 148 (100.0%) |
Monthly Housing Cost Tiers in Conway
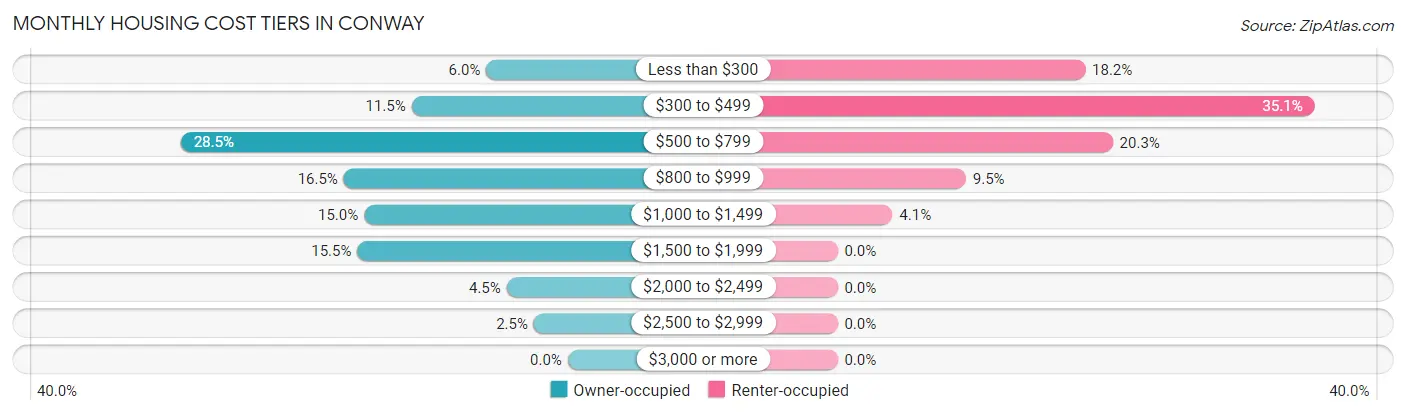
| Monthly Cost | Owner-occupied | Renter-occupied |
| Less than $300 | 12 (6.0%) | 27 (18.2%) |
| $300 to $499 | 23 (11.5%) | 52 (35.1%) |
| $500 to $799 | 57 (28.5%) | 30 (20.3%) |
| $800 to $999 | 33 (16.5%) | 14 (9.5%) |
| $1,000 to $1,499 | 30 (15.0%) | 6 (4.1%) |
| $1,500 to $1,999 | 31 (15.5%) | 0 (0.0%) |
| $2,000 to $2,499 | 9 (4.5%) | 0 (0.0%) |
| $2,500 to $2,999 | 5 (2.5%) | 0 (0.0%) |
| $3,000 or more | 0 (0.0%) | 0 (0.0%) |
| Total | 200 (100.0%) | 148 (100.0%) |
Physical Housing Characteristics in Conway
Housing Structures in Conway
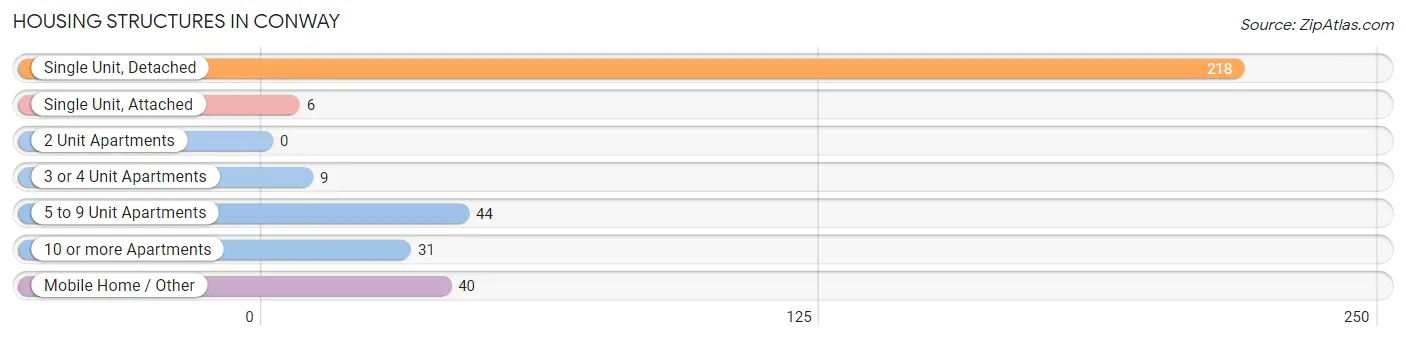
| Structure Type | # Housing Units | % Housing Units |
| Single Unit, Detached | 218 | 62.6% |
| Single Unit, Attached | 6 | 1.7% |
| 2 Unit Apartments | 0 | 0.0% |
| 3 or 4 Unit Apartments | 9 | 2.6% |
| 5 to 9 Unit Apartments | 44 | 12.6% |
| 10 or more Apartments | 31 | 8.9% |
| Mobile Home / Other | 40 | 11.5% |
| Total | 348 | 100.0% |
Housing Structures by Occupancy in Conway
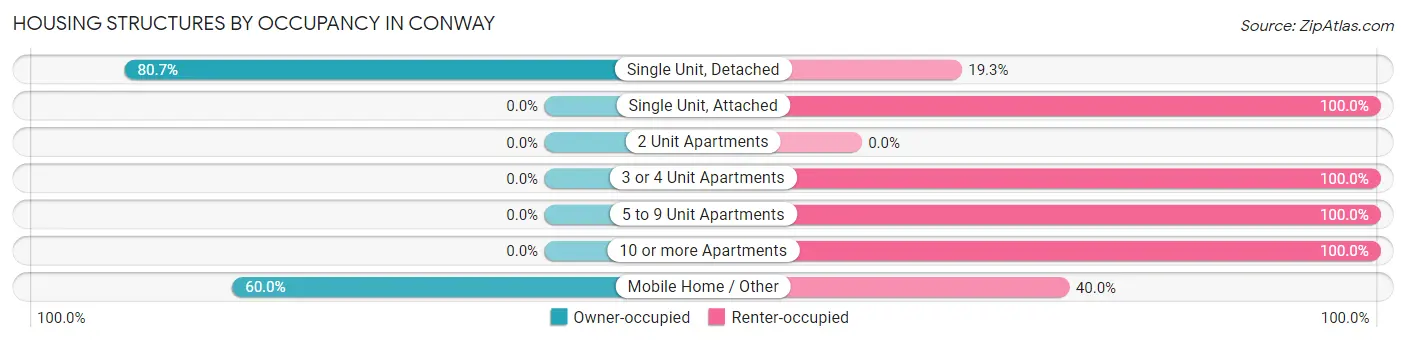
| Structure Type | Owner-occupied | Renter-occupied |
| Single Unit, Detached | 176 (80.7%) | 42 (19.3%) |
| Single Unit, Attached | 0 (0.0%) | 6 (100.0%) |
| 2 Unit Apartments | 0 (0.0%) | 0 (0.0%) |
| 3 or 4 Unit Apartments | 0 (0.0%) | 9 (100.0%) |
| 5 to 9 Unit Apartments | 0 (0.0%) | 44 (100.0%) |
| 10 or more Apartments | 0 (0.0%) | 31 (100.0%) |
| Mobile Home / Other | 24 (60.0%) | 16 (40.0%) |
| Total | 200 (57.5%) | 148 (42.5%) |
Housing Structures by Number of Rooms in Conway
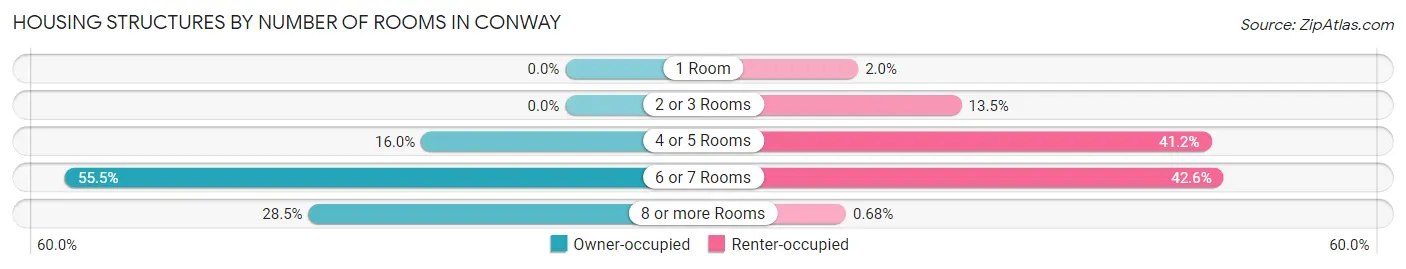
| Number of Rooms | Owner-occupied | Renter-occupied |
| 1 Room | 0 (0.0%) | 3 (2.0%) |
| 2 or 3 Rooms | 0 (0.0%) | 20 (13.5%) |
| 4 or 5 Rooms | 32 (16.0%) | 61 (41.2%) |
| 6 or 7 Rooms | 111 (55.5%) | 63 (42.6%) |
| 8 or more Rooms | 57 (28.5%) | 1 (0.7%) |
| Total | 200 (100.0%) | 148 (100.0%) |
Housing Structure by Heating Type in Conway
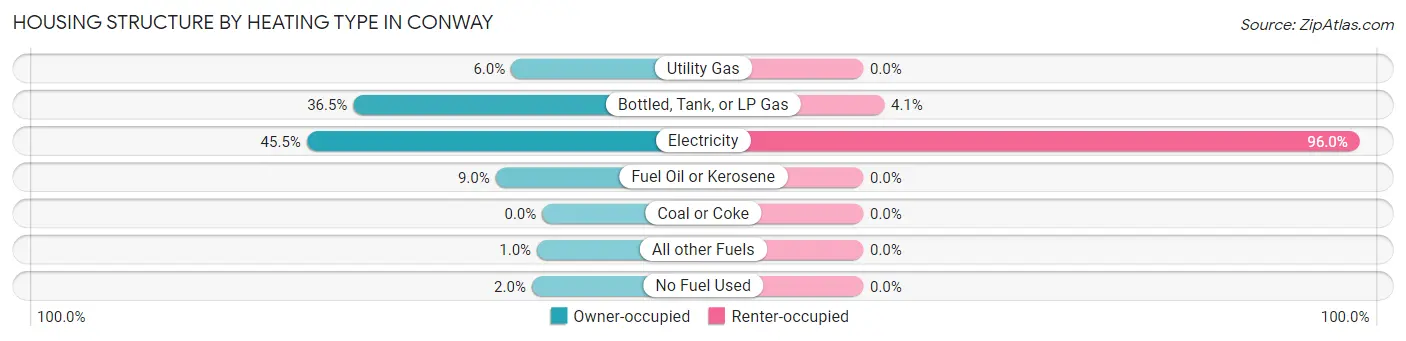
| Heating Type | Owner-occupied | Renter-occupied |
| Utility Gas | 12 (6.0%) | 0 (0.0%) |
| Bottled, Tank, or LP Gas | 73 (36.5%) | 6 (4.1%) |
| Electricity | 91 (45.5%) | 142 (96.0%) |
| Fuel Oil or Kerosene | 18 (9.0%) | 0 (0.0%) |
| Coal or Coke | 0 (0.0%) | 0 (0.0%) |
| All other Fuels | 2 (1.0%) | 0 (0.0%) |
| No Fuel Used | 4 (2.0%) | 0 (0.0%) |
| Total | 200 (100.0%) | 148 (100.0%) |
Household Vehicle Usage in Conway
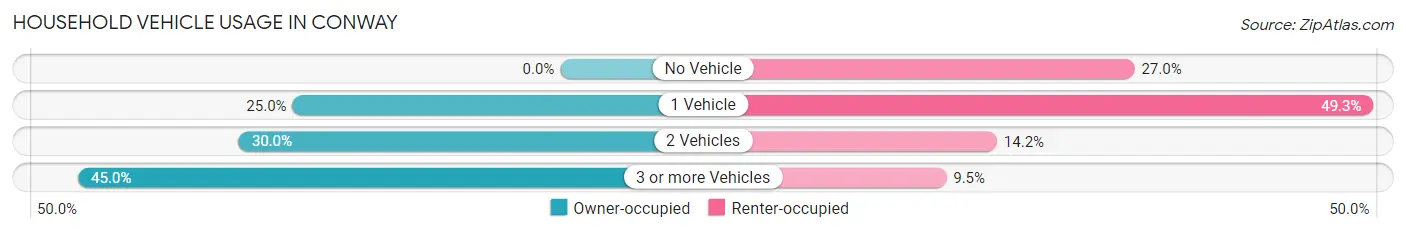
| Vehicles per Household | Owner-occupied | Renter-occupied |
| No Vehicle | 0 (0.0%) | 40 (27.0%) |
| 1 Vehicle | 50 (25.0%) | 73 (49.3%) |
| 2 Vehicles | 60 (30.0%) | 21 (14.2%) |
| 3 or more Vehicles | 90 (45.0%) | 14 (9.5%) |
| Total | 200 (100.0%) | 148 (100.0%) |
Real Estate & Mortgages in Conway
Real Estate and Mortgage Overview in Conway
| Characteristic | Without Mortgage | With Mortgage |
| Housing Units | 96 | 104 |
| Median Property Value | $99,600 | $107,400 |
| Median Household Income | $52,250 | $11 |
| Monthly Housing Costs | $537 | $0 |
| Real Estate Taxes | $1,250 | $3 |
Property Value by Mortgage Status in Conway
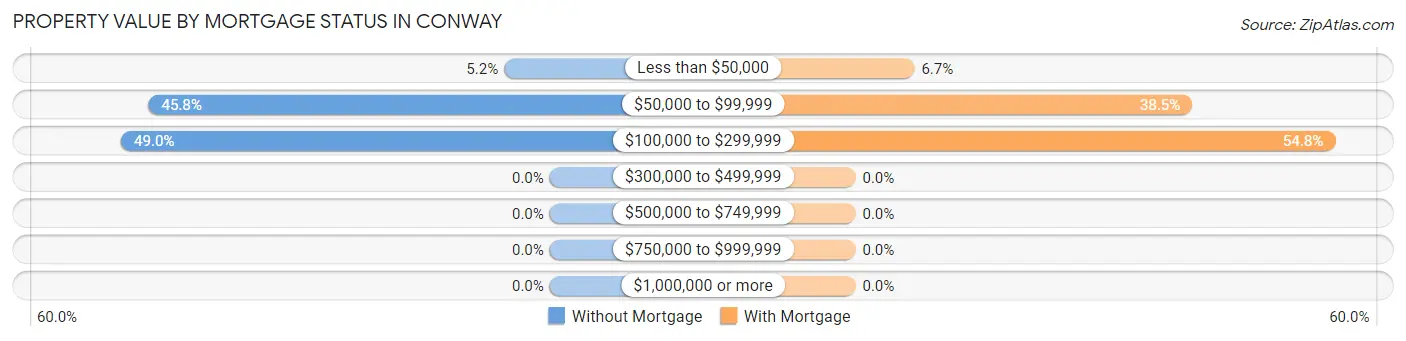
| Property Value | Without Mortgage | With Mortgage |
| Less than $50,000 | 5 (5.2%) | 7 (6.7%) |
| $50,000 to $99,999 | 44 (45.8%) | 40 (38.5%) |
| $100,000 to $299,999 | 47 (49.0%) | 57 (54.8%) |
| $300,000 to $499,999 | 0 (0.0%) | 0 (0.0%) |
| $500,000 to $749,999 | 0 (0.0%) | 0 (0.0%) |
| $750,000 to $999,999 | 0 (0.0%) | 0 (0.0%) |
| $1,000,000 or more | 0 (0.0%) | 0 (0.0%) |
| Total | 96 (100.0%) | 104 (100.0%) |
Household Income by Mortgage Status in Conway
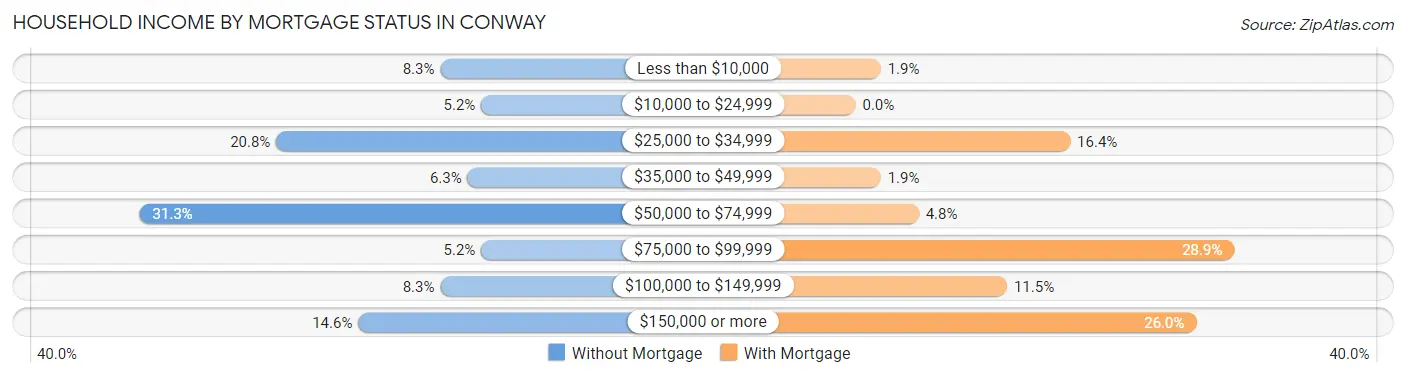
| Household Income | Without Mortgage | With Mortgage |
| Less than $10,000 | 8 (8.3%) | 2 (1.9%) |
| $10,000 to $24,999 | 5 (5.2%) | 0 (0.0%) |
| $25,000 to $34,999 | 20 (20.8%) | 17 (16.4%) |
| $35,000 to $49,999 | 6 (6.2%) | 2 (1.9%) |
| $50,000 to $74,999 | 30 (31.2%) | 5 (4.8%) |
| $75,000 to $99,999 | 5 (5.2%) | 30 (28.8%) |
| $100,000 to $149,999 | 8 (8.3%) | 12 (11.5%) |
| $150,000 or more | 14 (14.6%) | 27 (26.0%) |
| Total | 96 (100.0%) | 104 (100.0%) |
Property Value to Household Income Ratio in Conway
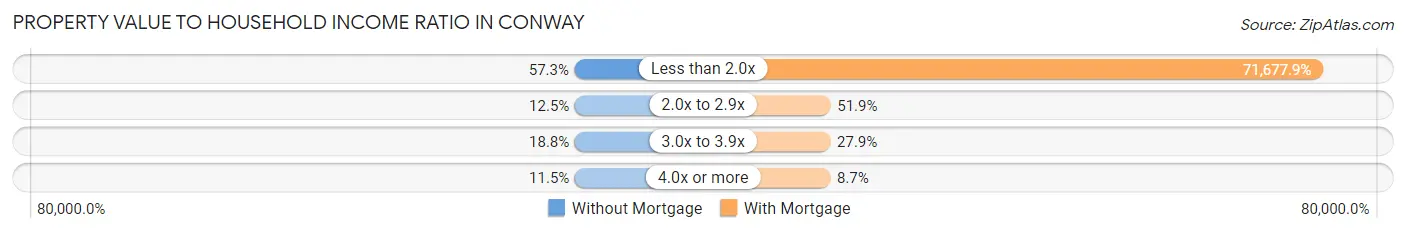
| Value-to-Income Ratio | Without Mortgage | With Mortgage |
| Less than 2.0x | 55 (57.3%) | 74,545 (71,677.9%) |
| 2.0x to 2.9x | 12 (12.5%) | 54 (51.9%) |
| 3.0x to 3.9x | 18 (18.8%) | 29 (27.9%) |
| 4.0x or more | 11 (11.5%) | 9 (8.6%) |
| Total | 96 (100.0%) | 104 (100.0%) |
Real Estate Taxes by Mortgage Status in Conway
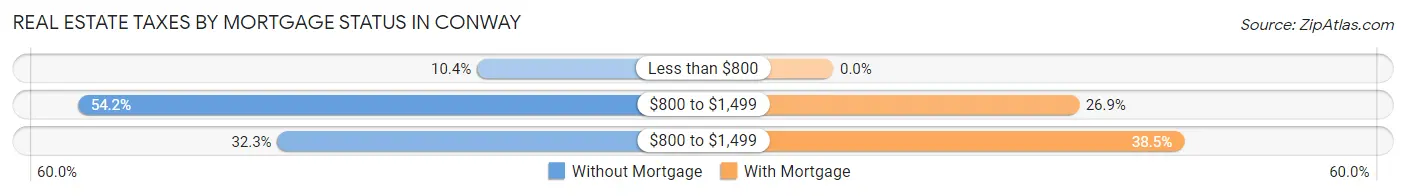
| Property Taxes | Without Mortgage | With Mortgage |
| Less than $800 | 10 (10.4%) | 0 (0.0%) |
| $800 to $1,499 | 52 (54.2%) | 28 (26.9%) |
| $800 to $1,499 | 31 (32.3%) | 40 (38.5%) |
| Total | 96 (100.0%) | 104 (100.0%) |
Health & Disability in Conway
Health Insurance Coverage by Age in Conway
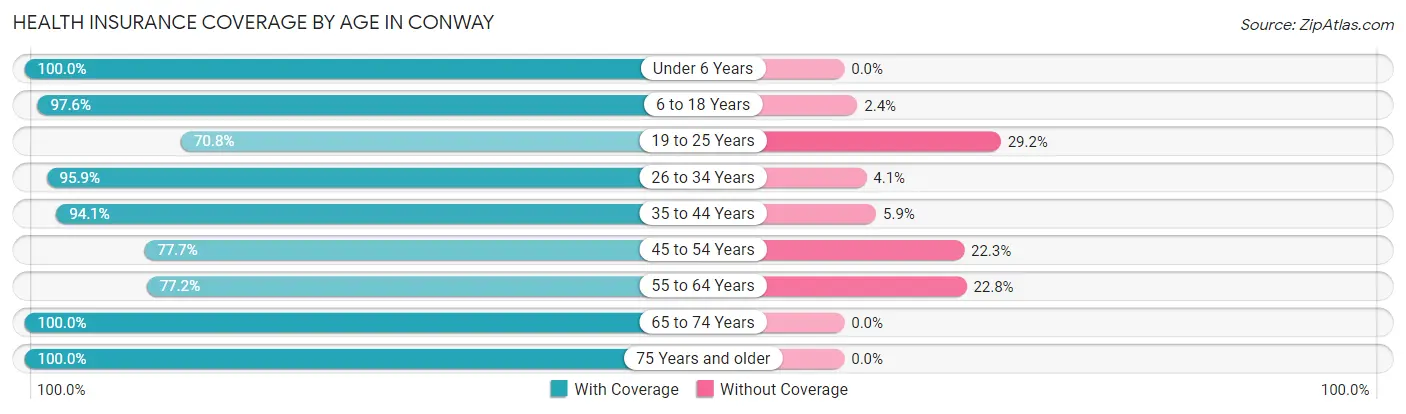
| Age Bracket | With Coverage | Without Coverage |
| Under 6 Years | 122 (100.0%) | 0 (0.0%) |
| 6 to 18 Years | 201 (97.6%) | 5 (2.4%) |
| 19 to 25 Years | 51 (70.8%) | 21 (29.2%) |
| 26 to 34 Years | 70 (95.9%) | 3 (4.1%) |
| 35 to 44 Years | 111 (94.1%) | 7 (5.9%) |
| 45 to 54 Years | 80 (77.7%) | 23 (22.3%) |
| 55 to 64 Years | 61 (77.2%) | 18 (22.8%) |
| 65 to 74 Years | 85 (100.0%) | 0 (0.0%) |
| 75 Years and older | 26 (100.0%) | 0 (0.0%) |
| Total | 807 (91.3%) | 77 (8.7%) |
Health Insurance Coverage by Citizenship Status in Conway
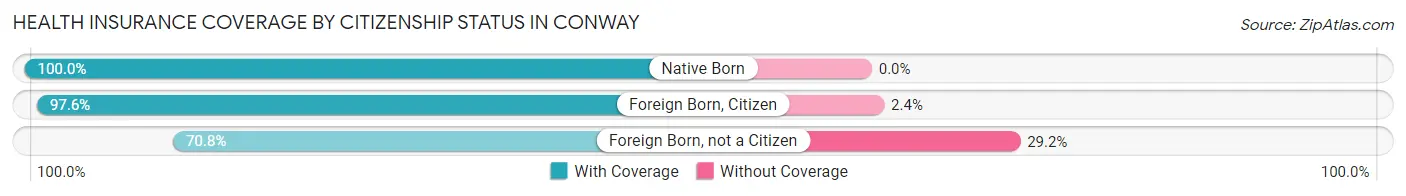
| Citizenship Status | With Coverage | Without Coverage |
| Native Born | 122 (100.0%) | 0 (0.0%) |
| Foreign Born, Citizen | 201 (97.6%) | 5 (2.4%) |
| Foreign Born, not a Citizen | 51 (70.8%) | 21 (29.2%) |
Health Insurance Coverage by Household Income in Conway
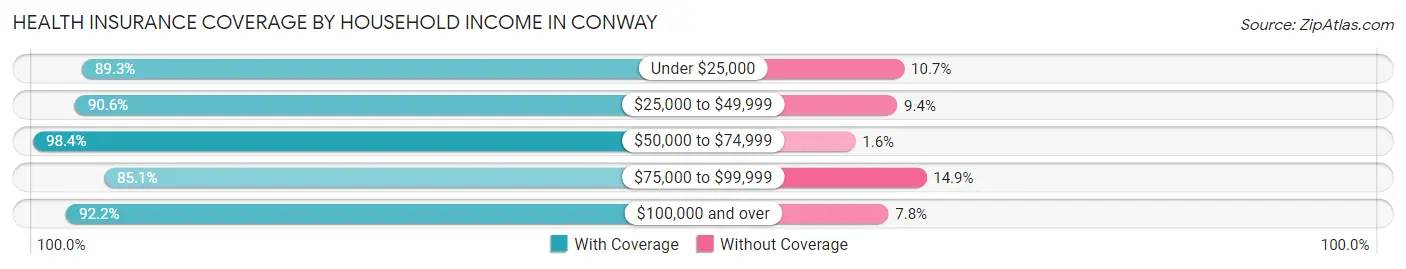
| Household Income | With Coverage | Without Coverage |
| Under $25,000 | 216 (89.3%) | 26 (10.7%) |
| $25,000 to $49,999 | 144 (90.6%) | 15 (9.4%) |
| $50,000 to $74,999 | 185 (98.4%) | 3 (1.6%) |
| $75,000 to $99,999 | 120 (85.1%) | 21 (14.9%) |
| $100,000 and over | 142 (92.2%) | 12 (7.8%) |
Public vs Private Health Insurance Coverage by Age in Conway
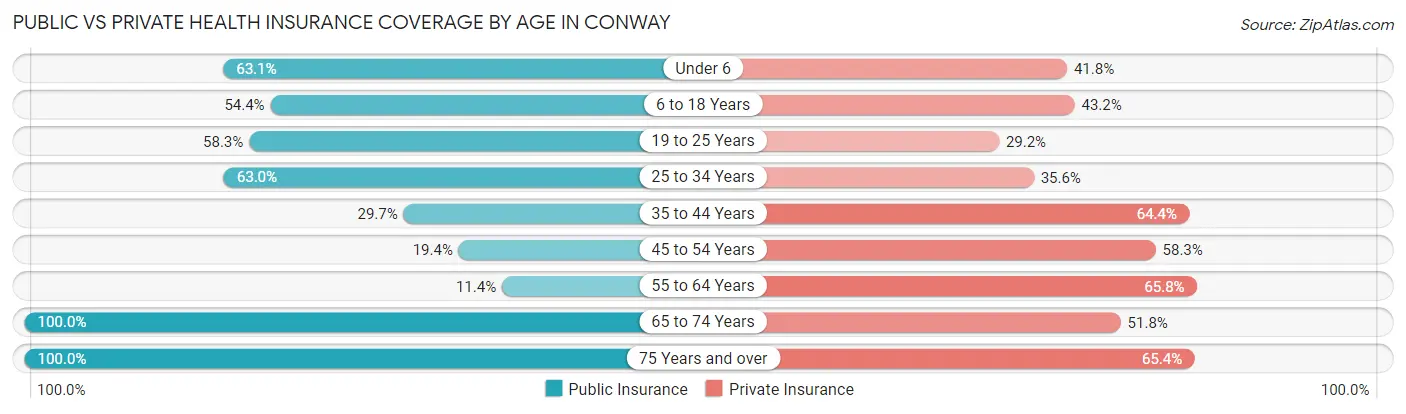
| Age Bracket | Public Insurance | Private Insurance |
| Under 6 | 77 (63.1%) | 51 (41.8%) |
| 6 to 18 Years | 112 (54.4%) | 89 (43.2%) |
| 19 to 25 Years | 42 (58.3%) | 21 (29.2%) |
| 25 to 34 Years | 46 (63.0%) | 26 (35.6%) |
| 35 to 44 Years | 35 (29.7%) | 76 (64.4%) |
| 45 to 54 Years | 20 (19.4%) | 60 (58.3%) |
| 55 to 64 Years | 9 (11.4%) | 52 (65.8%) |
| 65 to 74 Years | 85 (100.0%) | 44 (51.8%) |
| 75 Years and over | 26 (100.0%) | 17 (65.4%) |
| Total | 452 (51.1%) | 436 (49.3%) |
Disability Status by Sex by Age in Conway
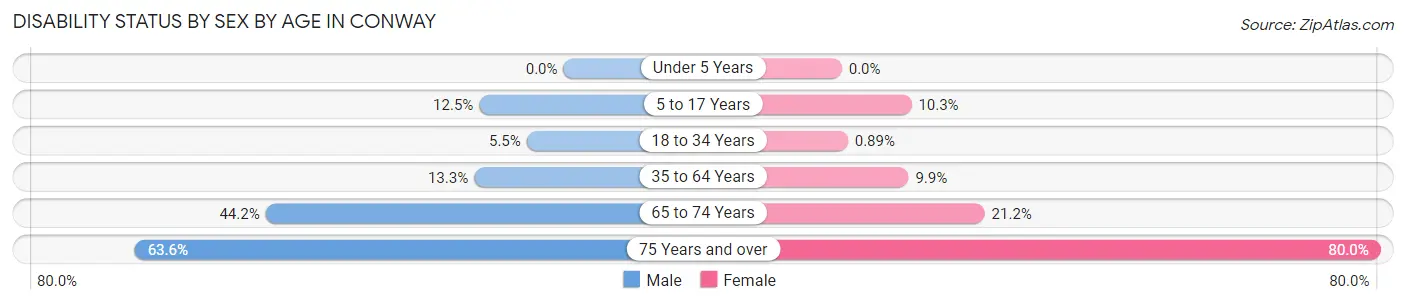
| Age Bracket | Male | Female |
| Under 5 Years | 0 (0.0%) | 0 (0.0%) |
| 5 to 17 Years | 13 (12.5%) | 9 (10.3%) |
| 18 to 34 Years | 3 (5.4%) | 1 (0.9%) |
| 35 to 64 Years | 13 (13.3%) | 20 (9.9%) |
| 65 to 74 Years | 23 (44.2%) | 7 (21.2%) |
| 75 Years and over | 7 (63.6%) | 12 (80.0%) |
Disability Class by Sex by Age in Conway
Disability Class: Hearing Difficulty
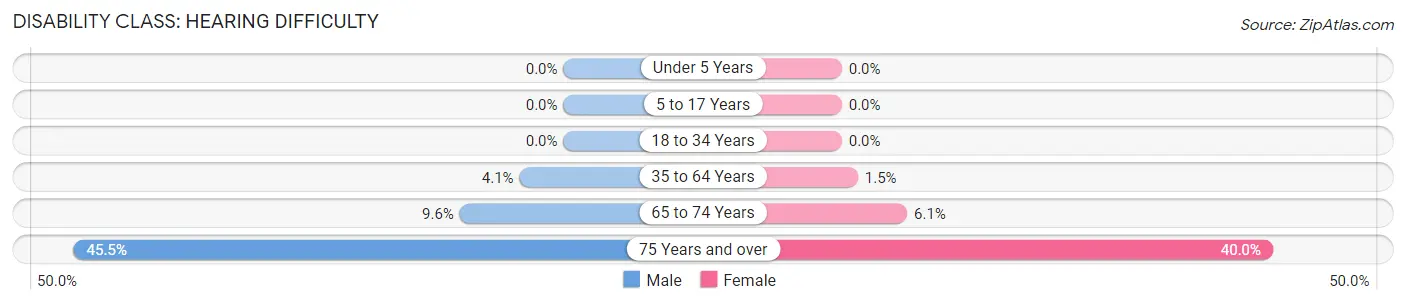
| Age Bracket | Male | Female |
| Under 5 Years | 0 (0.0%) | 0 (0.0%) |
| 5 to 17 Years | 0 (0.0%) | 0 (0.0%) |
| 18 to 34 Years | 0 (0.0%) | 0 (0.0%) |
| 35 to 64 Years | 4 (4.1%) | 3 (1.5%) |
| 65 to 74 Years | 5 (9.6%) | 2 (6.1%) |
| 75 Years and over | 5 (45.5%) | 6 (40.0%) |
Disability Class: Vision Difficulty
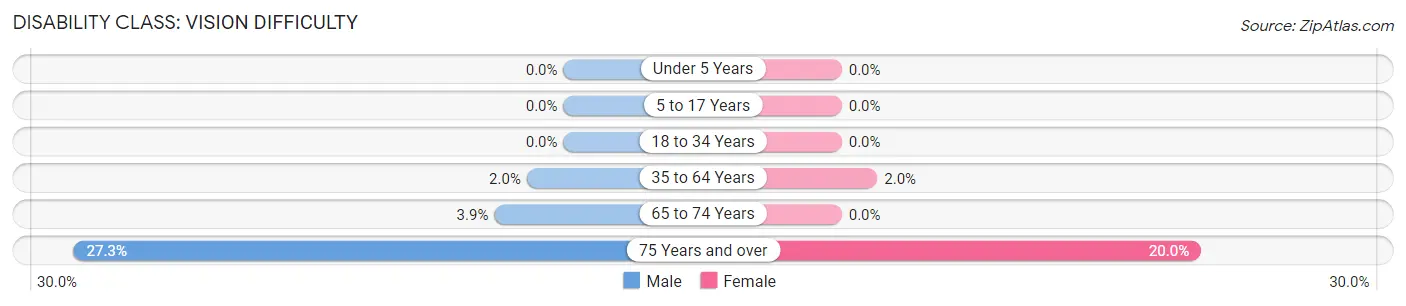
| Age Bracket | Male | Female |
| Under 5 Years | 0 (0.0%) | 0 (0.0%) |
| 5 to 17 Years | 0 (0.0%) | 0 (0.0%) |
| 18 to 34 Years | 0 (0.0%) | 0 (0.0%) |
| 35 to 64 Years | 2 (2.0%) | 4 (2.0%) |
| 65 to 74 Years | 2 (3.8%) | 0 (0.0%) |
| 75 Years and over | 3 (27.3%) | 3 (20.0%) |
Disability Class: Cognitive Difficulty
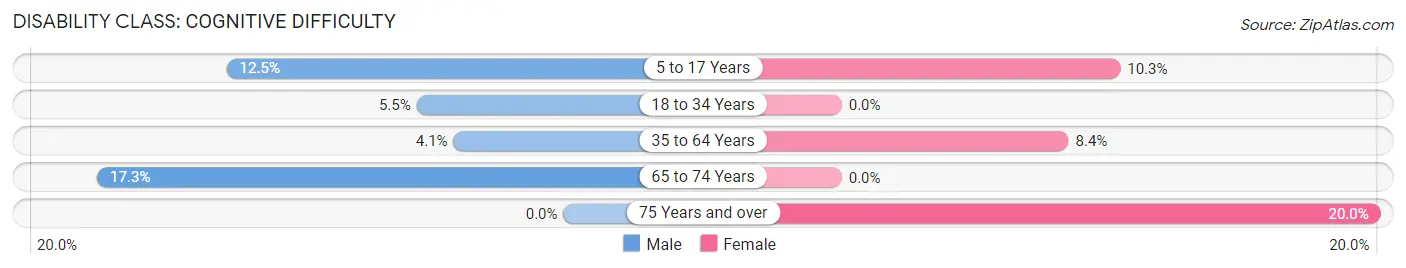
| Age Bracket | Male | Female |
| 5 to 17 Years | 13 (12.5%) | 9 (10.3%) |
| 18 to 34 Years | 3 (5.4%) | 0 (0.0%) |
| 35 to 64 Years | 4 (4.1%) | 17 (8.4%) |
| 65 to 74 Years | 9 (17.3%) | 0 (0.0%) |
| 75 Years and over | 0 (0.0%) | 3 (20.0%) |
Disability Class: Ambulatory Difficulty
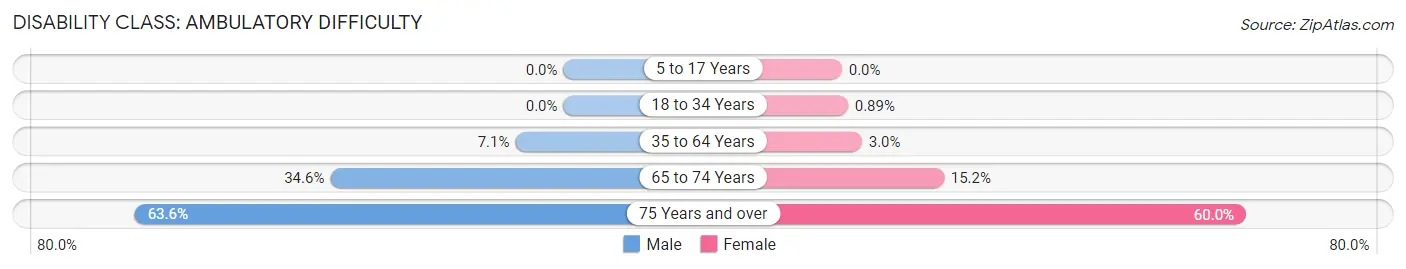
| Age Bracket | Male | Female |
| 5 to 17 Years | 0 (0.0%) | 0 (0.0%) |
| 18 to 34 Years | 0 (0.0%) | 1 (0.9%) |
| 35 to 64 Years | 7 (7.1%) | 6 (3.0%) |
| 65 to 74 Years | 18 (34.6%) | 5 (15.1%) |
| 75 Years and over | 7 (63.6%) | 9 (60.0%) |
Disability Class: Self-Care Difficulty
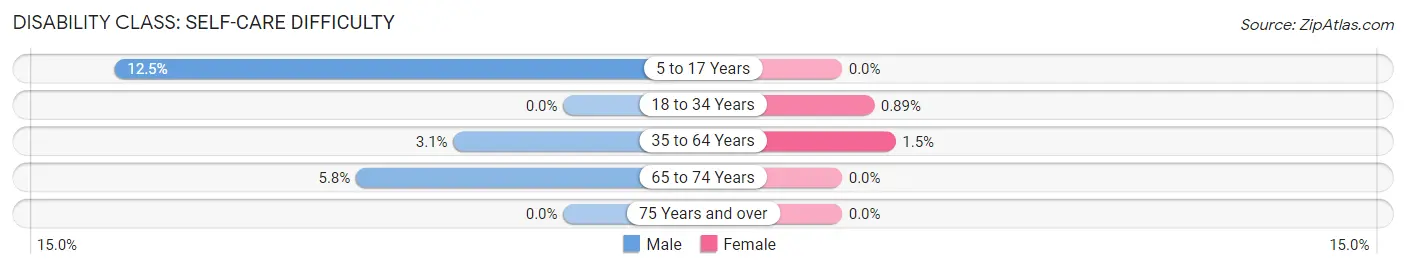
| Age Bracket | Male | Female |
| 5 to 17 Years | 13 (12.5%) | 0 (0.0%) |
| 18 to 34 Years | 0 (0.0%) | 1 (0.9%) |
| 35 to 64 Years | 3 (3.1%) | 3 (1.5%) |
| 65 to 74 Years | 3 (5.8%) | 0 (0.0%) |
| 75 Years and over | 0 (0.0%) | 0 (0.0%) |
Technology Access in Conway
Computing Device Access in Conway
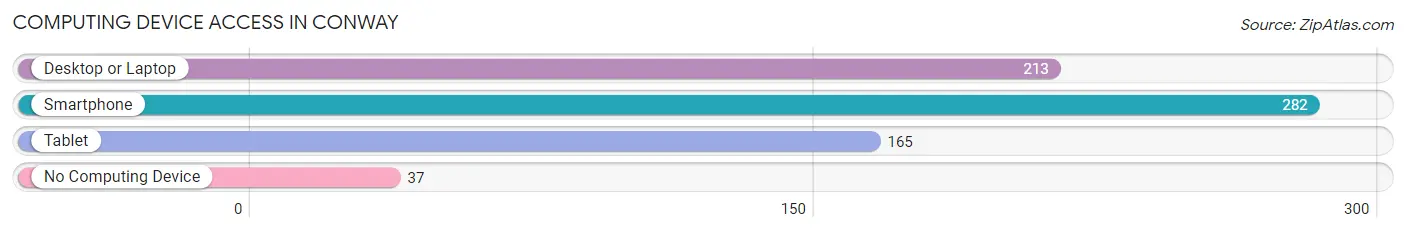
| Device Type | # Households | % Households |
| Desktop or Laptop | 213 | 61.2% |
| Smartphone | 282 | 81.0% |
| Tablet | 165 | 47.4% |
| No Computing Device | 37 | 10.6% |
| Total | 348 | 100.0% |
Internet Access in Conway
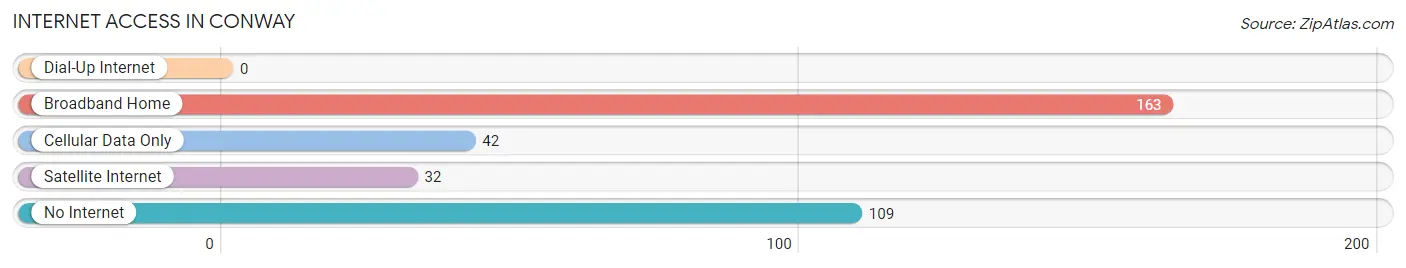
| Internet Type | # Households | % Households |
| Dial-Up Internet | 0 | 0.0% |
| Broadband Home | 163 | 46.8% |
| Cellular Data Only | 42 | 12.1% |
| Satellite Internet | 32 | 9.2% |
| No Internet | 109 | 31.3% |
| Total | 348 | 100.0% |
Conway Summary
Conway is a city located in Horry County, South Carolina, United States. The population was 17,103 at the 2010 census, and had an estimated population of 22,761 in 2018. It is the county seat of Horry County and is part of the Myrtle Beach metropolitan area.
Geography
Conway is located at 33°51′N 79°04′W (33.851, -79.067). According to the United States Census Bureau, the city has a total area of 10.5 square miles (27.2 km2), of which 10.4 square miles (26.9 km2) is land and 0.1 square miles (0.3 km2) (0.95%) is water.
Conway is located on the western side of the Waccamaw River, which is the largest river in South Carolina. The Waccamaw River is a tributary of the Pee Dee River, which flows into the Atlantic Ocean. The city is also located near the Intracoastal Waterway, which is a navigable waterway that runs along the Atlantic Coast.
Climate
Conway has a humid subtropical climate, with hot, humid summers and mild winters. The average annual temperature is 64.3 °F (17.9 °C). The average annual precipitation is 46.2 inches (1173 mm).
Demographics
As of the 2010 census, there were 17,103 people, 6,845 households, and 4,541 families residing in the city. The population density was 1,637.2 people per square mile (630.2/km2). There were 7,837 housing units at an average density of 754.3 per square mile (291.2/km2). The racial makeup of the city was 68.2% White, 25.2% African American, 0.3% Native American, 1.7% Asian, 0.1% Pacific Islander, 2.3% from other races, and 2.2% from two or more races. Hispanic or Latino of any race were 5.7% of the population.
Economy
Conway is home to a variety of businesses, including manufacturing, retail, and tourism. The city is home to several large employers, including Horry County Schools, Conway Medical Center, and Coastal Carolina University.
The city is also home to several major retail stores, including Walmart, Lowe's, and Target. The city is also home to several restaurants, including Applebee's, Olive Garden, and Red Lobster.
Tourism is an important part of the economy in Conway. The city is home to several attractions, including the Myrtle Beach Boardwalk, the Myrtle Beach SkyWheel, and the Myrtle Beach State Park.
Conclusion
Conway is a city located in Horry County, South Carolina, United States. The population was 17,103 at the 2010 census, and had an estimated population of 22,761 in 2018. It is the county seat of Horry County and is part of the Myrtle Beach metropolitan area. Conway has a humid subtropical climate, with hot, humid summers and mild winters. The city is home to a variety of businesses, including manufacturing, retail, and tourism. Tourism is an important part of the economy in Conway, and the city is home to several attractions, including the Myrtle Beach Boardwalk, the Myrtle Beach SkyWheel, and the Myrtle Beach State Park.
Common Questions
What is the Total Population of Conway?
Total Population of Conway is 884.
What is the Total Male Population of Conway?
Total Male Population of Conway is 373.
What is the Total Female Population of Conway?
Total Female Population of Conway is 511.
What is the Ratio of Males per 100 Females in Conway?
There are 72.99 Males per 100 Females in Conway.
What is the Ratio of Females per 100 Males in Conway?
There are 137.00 Females per 100 Males in Conway.
What is the Median Population Age in Conway?
Median Population Age in Conway is 31.0 Years.
What is the Average Family Size in Conway
Average Family Size in Conway is 3.1 People.
What is the Average Household Size in Conway
Average Household Size in Conway is 2.5 People.
What is Per Capita Income in Conway?
Per Capita income in Conway is $22,210.
What is the Median Family Income in Conway?
Median Family Income in Conway is $52,750.
What is the Median Household income in Conway?
Median Household Income in Conway is $43,095.
What is Income or Wage Gap in Conway?
Income or Wage Gap in Conway is 53.5%.
Women in Conway earn 46.5 cents for every dollar earned by a man.
What is Family Income Deficit in Conway?
Family Income Deficit in Conway is $13,292.
Families that are below poverty line in Conway earn $13,292 less on average than the poverty threshold level.
What is Inequality or Gini Index in Conway?
Inequality or Gini Index in Conway is 0.53.
How Large is the Labor Force in Conway?
There are 353 People in the Labor Forcein in Conway.
What is the Percentage of People in the Labor Force in Conway?
58.3% of People are in the Labor Force in Conway.
What is the Unemployment Rate in Conway?
Unemployment Rate in Conway is 12.7%.