Hanover, MN
Hanover Map
Hanover Overview
3,454
TOTAL POPULATION
1,696
MALE POPULATION
1,758
FEMALE POPULATION
96.47
MALES / 100 FEMALES
103.66
FEMALES / 100 MALES
36.4
MEDIAN AGE
3.4
AVG FAMILY SIZE
3.0
AVG HOUSEHOLD SIZE
$52,891
PER CAPITA INCOME
$156,827
AVG FAMILY INCOME
$145,156
AVG HOUSEHOLD INCOME
32.1%
WAGE / INCOME GAP [ % ]
67.9¢/ $1
WAGE / INCOME GAP [ $ ]
0.35
INEQUALITY / GINI INDEX
1,987
LABOR FORCE [ PEOPLE ]
79.8%
PERCENT IN LABOR FORCE
0.8%
UNEMPLOYMENT RATE
Hanover Zip Codes
Hanover Area Codes
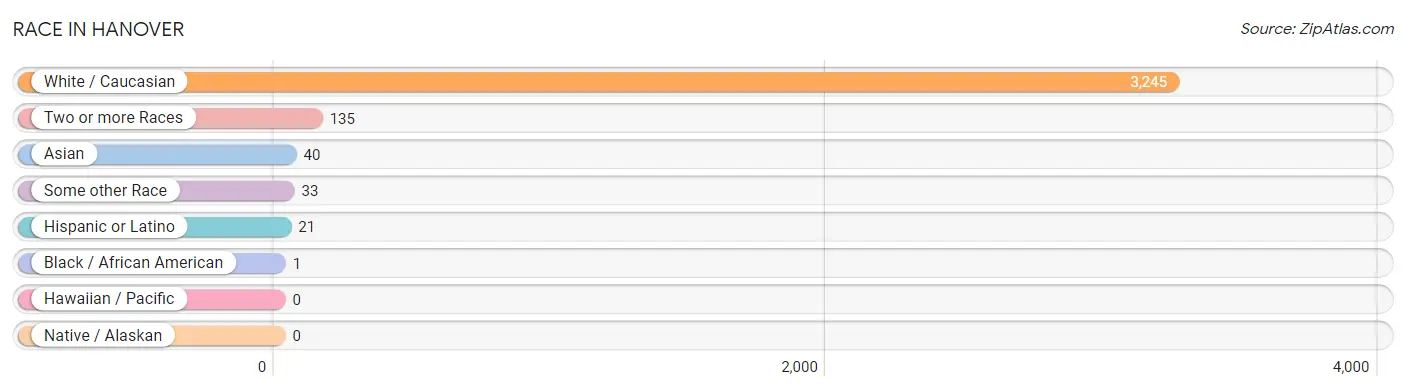
Race in Hanover
The most populous races in Hanover are White / Caucasian (3,245 | 94.0%), Two or more Races (135 | 3.9%), and Asian (40 | 1.2%).
| Race | # Population | % Population |
| Asian | 40 | 1.2% |
| Black / African American | 1 | 0.0% |
| Hawaiian / Pacific | 0 | 0.0% |
| Hispanic or Latino | 21 | 0.6% |
| Native / Alaskan | 0 | 0.0% |
| White / Caucasian | 3,245 | 94.0% |
| Two or more Races | 135 | 3.9% |
| Some other Race | 33 | 1.0% |
| Total | 3,454 | 100.0% |
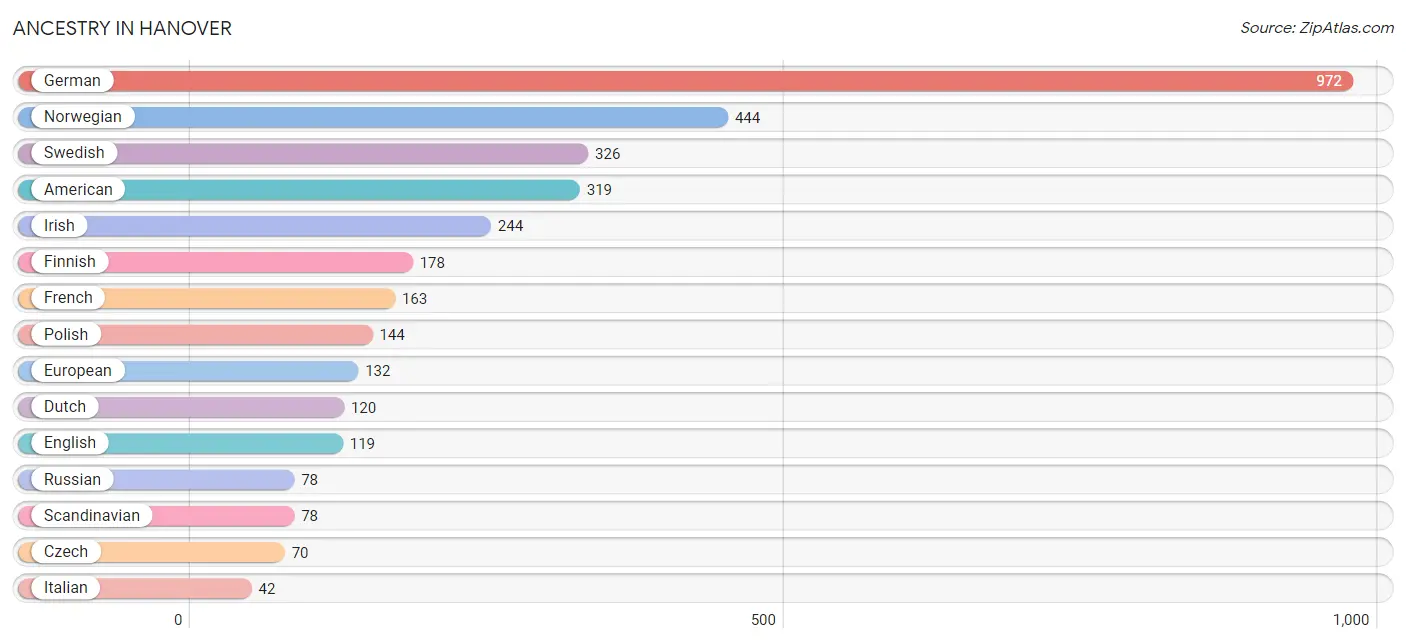
Ancestry in Hanover
The most populous ancestries reported in Hanover are German (972 | 28.1%), Norwegian (444 | 12.9%), Swedish (326 | 9.4%), American (319 | 9.2%), and Irish (244 | 7.1%), together accounting for 66.7% of all Hanover residents.
| Ancestry | # Population | % Population |
| American | 319 | 9.2% |
| Arab | 9 | 0.3% |
| Armenian | 9 | 0.3% |
| Austrian | 11 | 0.3% |
| Belgian | 23 | 0.7% |
| Burmese | 28 | 0.8% |
| Czech | 70 | 2.0% |
| Czechoslovakian | 17 | 0.5% |
| Danish | 15 | 0.4% |
| Dutch | 120 | 3.5% |
| English | 119 | 3.5% |
| European | 132 | 3.8% |
| Finnish | 178 | 5.1% |
| French | 163 | 4.7% |
| French Canadian | 30 | 0.9% |
| German | 972 | 28.1% |
| Indian (Asian) | 8 | 0.2% |
| Irish | 244 | 7.1% |
| Italian | 42 | 1.2% |
| Lebanese | 9 | 0.3% |
| Mexican | 16 | 0.5% |
| Northern European | 37 | 1.1% |
| Norwegian | 444 | 12.9% |
| Polish | 144 | 4.2% |
| Romanian | 3 | 0.1% |
| Russian | 78 | 2.3% |
| Samoan | 4 | 0.1% |
| Scandinavian | 78 | 2.3% |
| Scotch-Irish | 6 | 0.2% |
| Scottish | 26 | 0.7% |
| Slovene | 16 | 0.5% |
| Spanish | 5 | 0.1% |
| Swedish | 326 | 9.4% |
| Swiss | 17 | 0.5% |
| Thai | 13 | 0.4% |
| Ukrainian | 15 | 0.4% | View All 36 Rows |
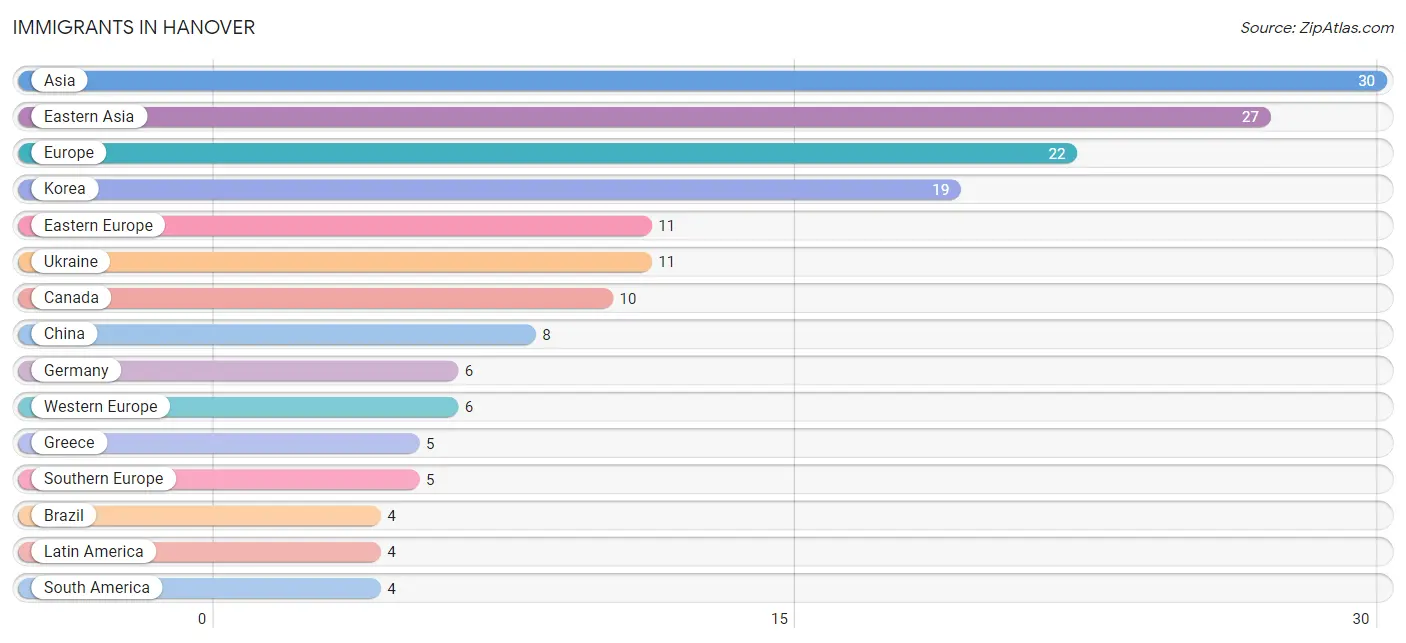
Immigrants in Hanover
The most numerous immigrant groups reported in Hanover came from Asia (30 | 0.9%), Eastern Asia (27 | 0.8%), Europe (22 | 0.6%), Korea (19 | 0.5%), and Eastern Europe (11 | 0.3%), together accounting for 3.2% of all Hanover residents.
| Immigration Origin | # Population | % Population |
| Asia | 30 | 0.9% |
| Brazil | 4 | 0.1% |
| Canada | 10 | 0.3% |
| China | 8 | 0.2% |
| Eastern Asia | 27 | 0.8% |
| Eastern Europe | 11 | 0.3% |
| Europe | 22 | 0.6% |
| Germany | 6 | 0.2% |
| Greece | 5 | 0.1% |
| Korea | 19 | 0.5% |
| Laos | 3 | 0.1% |
| Latin America | 4 | 0.1% |
| South America | 4 | 0.1% |
| South Eastern Asia | 3 | 0.1% |
| Southern Europe | 5 | 0.1% |
| Ukraine | 11 | 0.3% |
| Western Europe | 6 | 0.2% | View All 17 Rows |
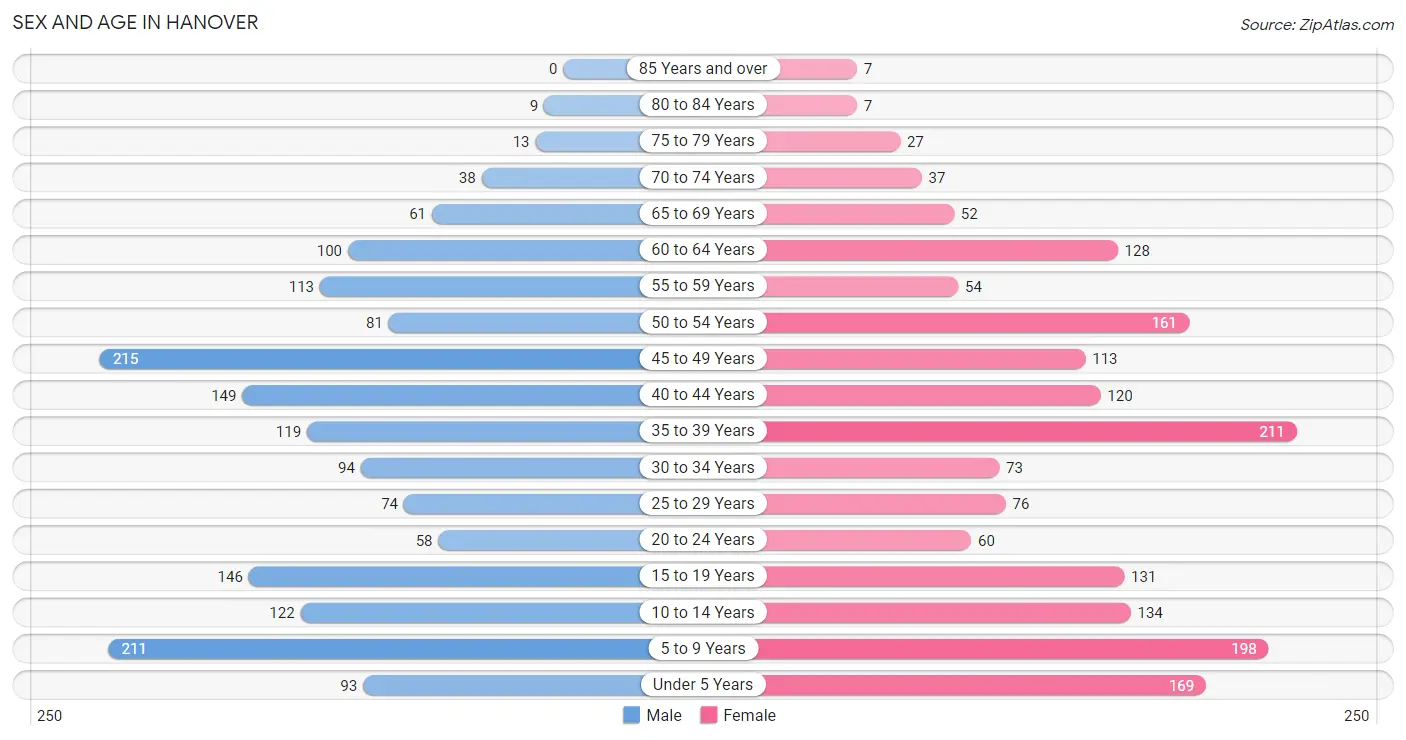
Sex and Age in Hanover
Sex and Age in Hanover
The most populous age groups in Hanover are 45 to 49 Years (215 | 12.7%) for men and 35 to 39 Years (211 | 12.0%) for women.
| Age Bracket | Male | Female |
| Under 5 Years | 93 (5.5%) | 169 (9.6%) |
| 5 to 9 Years | 211 (12.4%) | 198 (11.3%) |
| 10 to 14 Years | 122 (7.2%) | 134 (7.6%) |
| 15 to 19 Years | 146 (8.6%) | 131 (7.4%) |
| 20 to 24 Years | 58 (3.4%) | 60 (3.4%) |
| 25 to 29 Years | 74 (4.4%) | 76 (4.3%) |
| 30 to 34 Years | 94 (5.5%) | 73 (4.2%) |
| 35 to 39 Years | 119 (7.0%) | 211 (12.0%) |
| 40 to 44 Years | 149 (8.8%) | 120 (6.8%) |
| 45 to 49 Years | 215 (12.7%) | 113 (6.4%) |
| 50 to 54 Years | 81 (4.8%) | 161 (9.2%) |
| 55 to 59 Years | 113 (6.7%) | 54 (3.1%) |
| 60 to 64 Years | 100 (5.9%) | 128 (7.3%) |
| 65 to 69 Years | 61 (3.6%) | 52 (3.0%) |
| 70 to 74 Years | 38 (2.2%) | 37 (2.1%) |
| 75 to 79 Years | 13 (0.8%) | 27 (1.5%) |
| 80 to 84 Years | 9 (0.5%) | 7 (0.4%) |
| 85 Years and over | 0 (0.0%) | 7 (0.4%) |
| Total | 1,696 (100.0%) | 1,758 (100.0%) |
Families and Households in Hanover
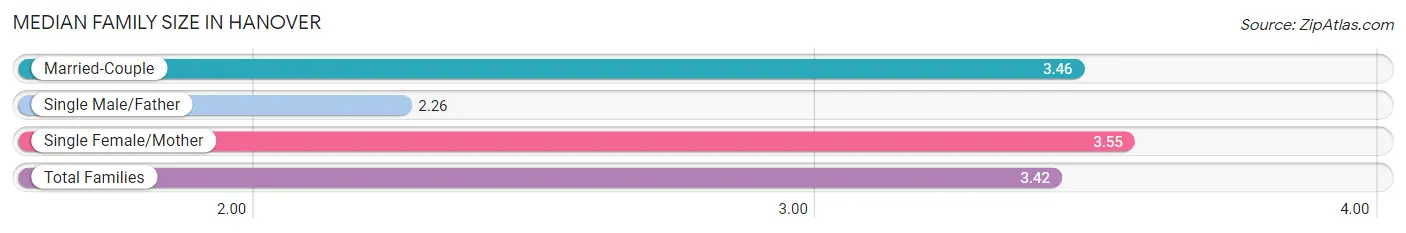
Median Family Size in Hanover
The median family size in Hanover is 3.42 persons per family, with single female/mother families (82 | 8.9%) accounting for the largest median family size of 3.55 persons per family. On the other hand, single male/father families (39 | 4.3%) represent the smallest median family size with 2.26 persons per family.
| Family Type | # Families | Family Size |
| Married-Couple | 797 (86.8%) | 3.46 |
| Single Male/Father | 39 (4.3%) | 2.26 |
| Single Female/Mother | 82 (8.9%) | 3.55 |
| Total Families | 918 (100.0%) | 3.42 |
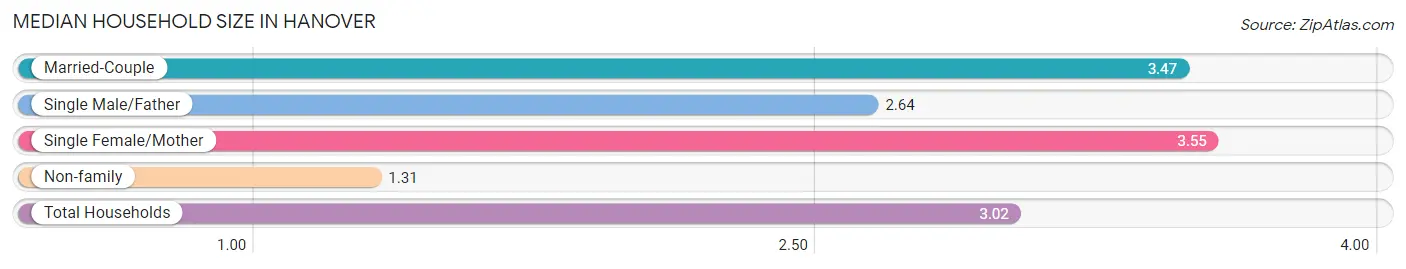
Median Household Size in Hanover
The median household size in Hanover is 3.02 persons per household, with single female/mother households (82 | 7.2%) accounting for the largest median household size of 3.55 persons per household. non-family households (223 | 19.5%) represent the smallest median household size with 1.31 persons per household.
| Household Type | # Households | Household Size |
| Married-Couple | 797 (69.9%) | 3.47 |
| Single Male/Father | 39 (3.4%) | 2.64 |
| Single Female/Mother | 82 (7.2%) | 3.55 |
| Non-family | 223 (19.5%) | 1.31 |
| Total Households | 1,141 (100.0%) | 3.02 |
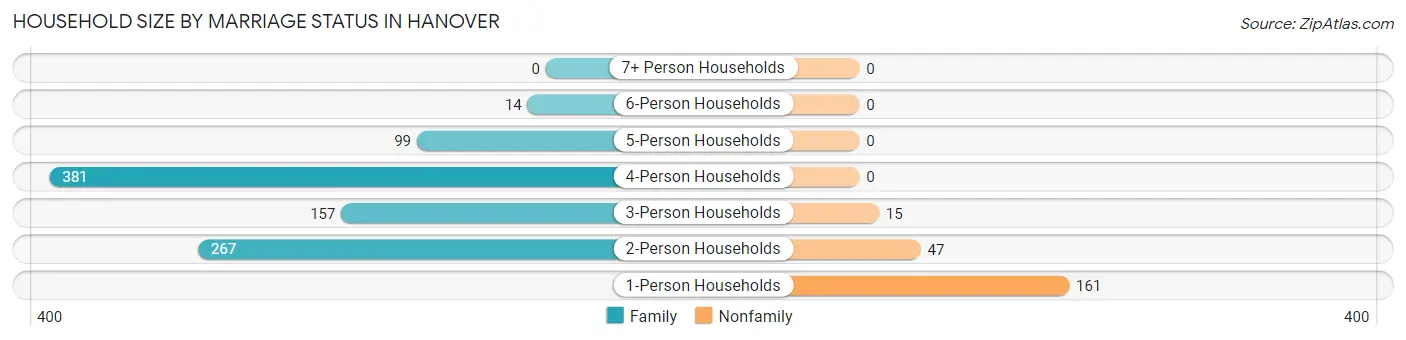
Household Size by Marriage Status in Hanover
Out of a total of 1,141 households in Hanover, 918 (80.5%) are family households, while 223 (19.5%) are nonfamily households. The most numerous type of family households are 4-person households, comprising 381, and the most common type of nonfamily households are 1-person households, comprising 161.
| Household Size | Family Households | Nonfamily Households |
| 1-Person Households | - | 161 (14.1%) |
| 2-Person Households | 267 (23.4%) | 47 (4.1%) |
| 3-Person Households | 157 (13.8%) | 15 (1.3%) |
| 4-Person Households | 381 (33.4%) | 0 (0.0%) |
| 5-Person Households | 99 (8.7%) | 0 (0.0%) |
| 6-Person Households | 14 (1.2%) | 0 (0.0%) |
| 7+ Person Households | 0 (0.0%) | 0 (0.0%) |
| Total | 918 (80.5%) | 223 (19.5%) |
Female Fertility in Hanover
Fertility by Age in Hanover
Average fertility rate in Hanover is 64.0 births per 1,000 women. Women in the age bracket of 20 to 34 years have the highest fertility rate with 177.0 births per 1,000 women. Women in the age bracket of 20 to 34 years acount for 71.2% of all women with births.
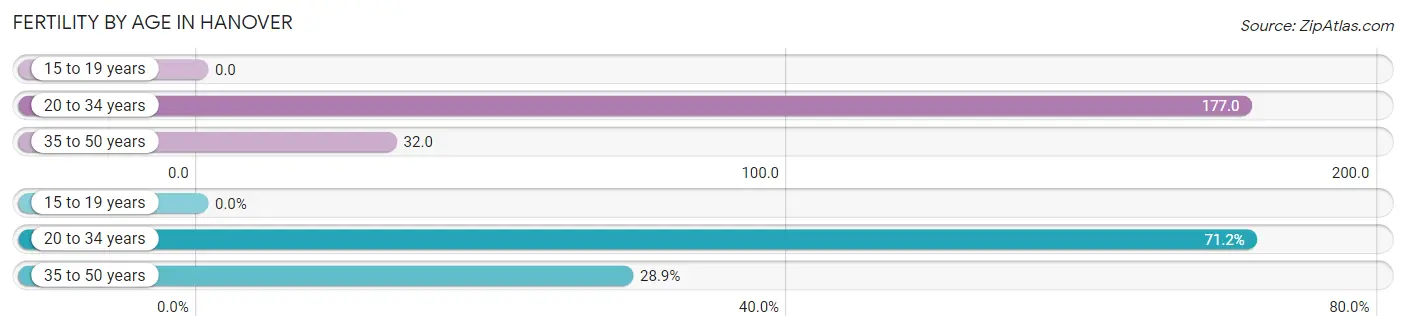
| Age Bracket | Women with Births | Births / 1,000 Women |
| 15 to 19 years | 0 (0.0%) | 0.0 |
| 20 to 34 years | 37 (71.2%) | 177.0 |
| 35 to 50 years | 15 (28.8%) | 32.0 |
| Total | 52 (100.0%) | 64.0 |
Fertility by Age by Marriage Status in Hanover
90.4% of women with births (52) in Hanover are married. The highest percentage of unmarried women with births falls into 20 to 34 years age bracket with 13.5% of them unmarried at the time of birth, while the lowest percentage of unmarried women with births belong to 35 to 50 years age bracket with 0.0% of them unmarried.
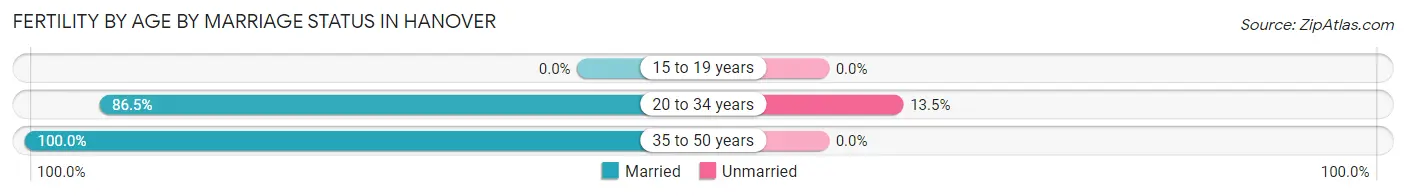
| Age Bracket | Married | Unmarried |
| 15 to 19 years | 0 (0.0%) | 0 (0.0%) |
| 20 to 34 years | 32 (86.5%) | 5 (13.5%) |
| 35 to 50 years | 15 (100.0%) | 0 (0.0%) |
| Total | 47 (90.4%) | 5 (9.6%) |
Fertility by Education in Hanover
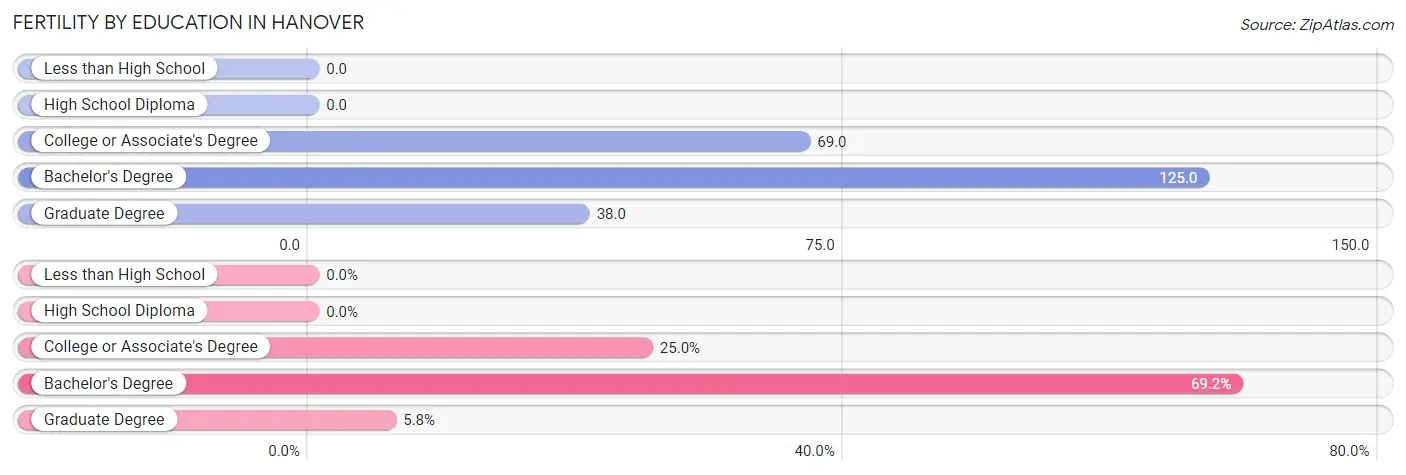
| Educational Attainment | Women with Births | Births / 1,000 Women |
| Less than High School | 0 (0.0%) | 0.0 |
| High School Diploma | 0 (0.0%) | 0.0 |
| College or Associate's Degree | 13 (25.0%) | 69.0 |
| Bachelor's Degree | 36 (69.2%) | 125.0 |
| Graduate Degree | 3 (5.8%) | 38.0 |
| Total | 52 (100.0%) | 64.0 |
Fertility by Education by Marriage Status in Hanover
9.6% of women with births in Hanover are unmarried. Women with the educational attainment of bachelor's degree are most likely to be married with 100.0% of them married at childbirth, while women with the educational attainment of college or associate's degree are least likely to be married with 38.5% of them unmarried at childbirth.
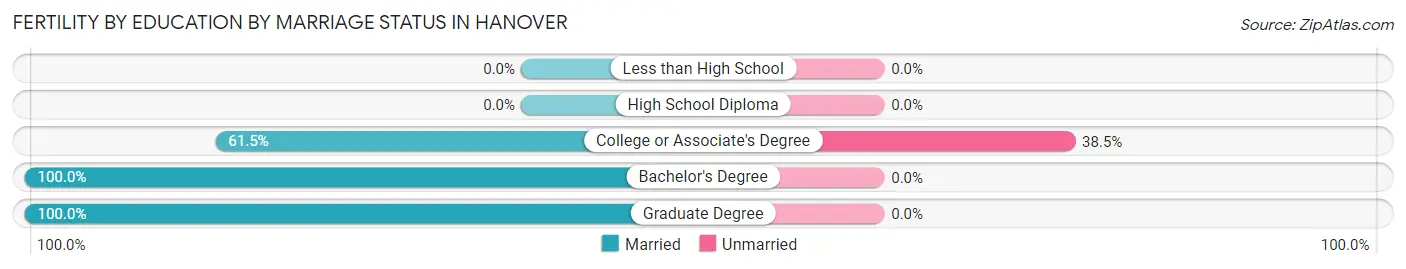
| Educational Attainment | Married | Unmarried |
| Less than High School | 0 (0.0%) | 0 (0.0%) |
| High School Diploma | 0 (0.0%) | 0 (0.0%) |
| College or Associate's Degree | 8 (61.5%) | 5 (38.5%) |
| Bachelor's Degree | 36 (100.0%) | 0 (0.0%) |
| Graduate Degree | 3 (100.0%) | 0 (0.0%) |
| Total | 47 (90.4%) | 5 (9.6%) |
Income in Hanover
Income Overview in Hanover
Per Capita Income in Hanover is $52,891, while median incomes of families and households are $156,827 and $145,156 respectively.
| Characteristic | Number | Measure |
| Per Capita Income | 3,454 | $52,891 |
| Median Family Income | 918 | $156,827 |
| Mean Family Income | 918 | $174,371 |
| Median Household Income | 1,141 | $145,156 |
| Mean Household Income | 1,141 | $158,383 |
| Income Deficit | 918 | $0 |
| Wage / Income Gap (%) | 3,454 | 32.08% |
| Wage / Income Gap ($) | 3,454 | 67.92¢ per $1 |
| Gini / Inequality Index | 3,454 | 0.35 |
Earnings by Sex in Hanover
Average Earnings in Hanover are $71,272, $82,004 for men and $55,694 for women, a difference of 32.1%.
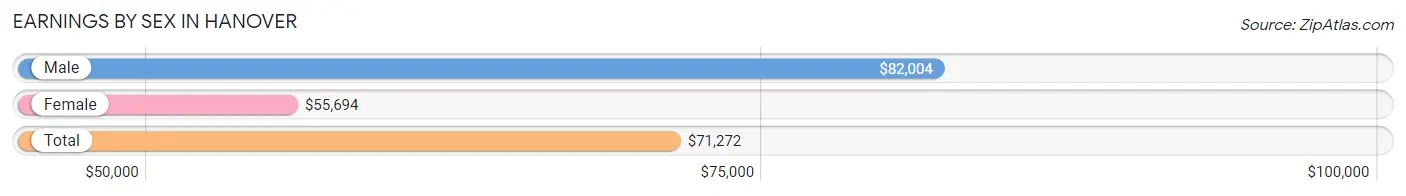
| Sex | Number | Average Earnings |
| Male | 1,087 (52.3%) | $82,004 |
| Female | 990 (47.7%) | $55,694 |
| Total | 2,077 (100.0%) | $71,272 |
Earnings by Sex by Income Bracket in Hanover
The most common earnings brackets in Hanover are $100,000+ for men (362 | 33.3%) and $75,000 to $99,999 for women (171 | 17.3%).
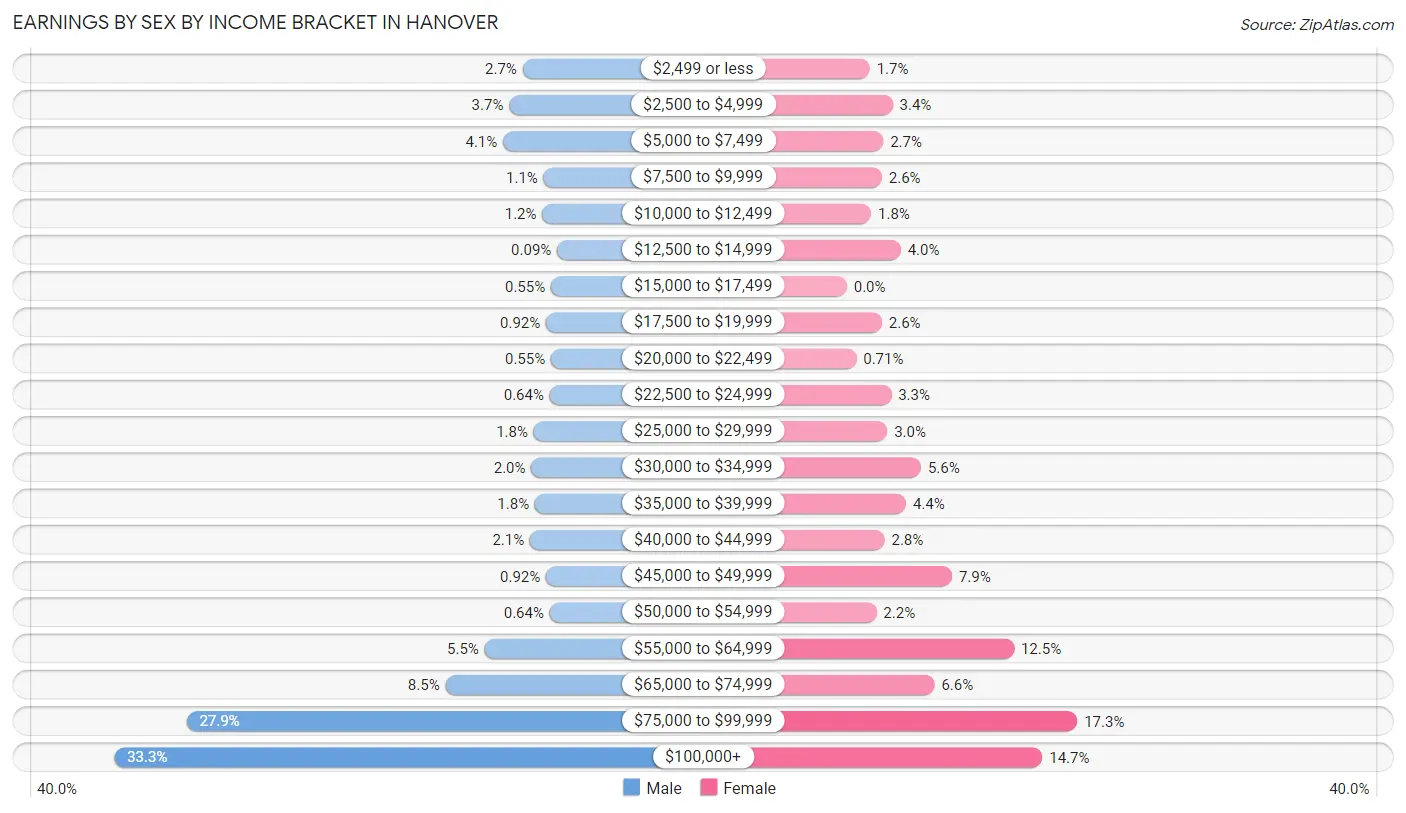
| Income | Male | Female |
| $2,499 or less | 29 (2.7%) | 17 (1.7%) |
| $2,500 to $4,999 | 40 (3.7%) | 34 (3.4%) |
| $5,000 to $7,499 | 45 (4.1%) | 27 (2.7%) |
| $7,500 to $9,999 | 12 (1.1%) | 26 (2.6%) |
| $10,000 to $12,499 | 13 (1.2%) | 18 (1.8%) |
| $12,500 to $14,999 | 1 (0.1%) | 40 (4.0%) |
| $15,000 to $17,499 | 6 (0.5%) | 0 (0.0%) |
| $17,500 to $19,999 | 10 (0.9%) | 26 (2.6%) |
| $20,000 to $22,499 | 6 (0.5%) | 7 (0.7%) |
| $22,500 to $24,999 | 7 (0.6%) | 33 (3.3%) |
| $25,000 to $29,999 | 20 (1.8%) | 30 (3.0%) |
| $30,000 to $34,999 | 22 (2.0%) | 55 (5.6%) |
| $35,000 to $39,999 | 19 (1.8%) | 44 (4.4%) |
| $40,000 to $44,999 | 23 (2.1%) | 28 (2.8%) |
| $45,000 to $49,999 | 10 (0.9%) | 78 (7.9%) |
| $50,000 to $54,999 | 7 (0.6%) | 22 (2.2%) |
| $55,000 to $64,999 | 60 (5.5%) | 124 (12.5%) |
| $65,000 to $74,999 | 92 (8.5%) | 65 (6.6%) |
| $75,000 to $99,999 | 303 (27.9%) | 171 (17.3%) |
| $100,000+ | 362 (33.3%) | 145 (14.6%) |
| Total | 1,087 (100.0%) | 990 (100.0%) |
Earnings by Sex by Educational Attainment in Hanover
Average earnings in Hanover are $87,292 for men and $59,030 for women, a difference of 32.4%. Men with an educational attainment of bachelor's degree enjoy the highest average annual earnings of $100,714, while those with college or associate's degree education earn the least with $78,869. Women with an educational attainment of graduate degree earn the most with the average annual earnings of $81,932, while those with high school diploma education have the smallest earnings of $40,329.
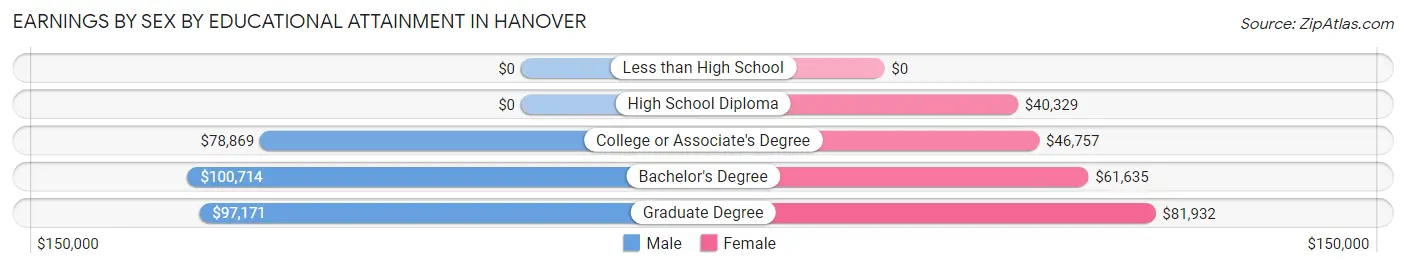
| Educational Attainment | Male Income | Female Income |
| Less than High School | - | - |
| High School Diploma | - | - |
| College or Associate's Degree | $78,869 | $46,757 |
| Bachelor's Degree | $100,714 | $61,635 |
| Graduate Degree | $97,171 | $81,932 |
| Total | $87,292 | $59,030 |
Family Income in Hanover
Family Income Brackets in Hanover
According to the Hanover family income data, there are 284 families falling into the $200,000+ income range, which is the most common income bracket and makes up 30.9% of all families. Conversely, the $35,000 to $49,999 income bracket is the least frequent group with only 4 families (0.4%) belonging to this category.
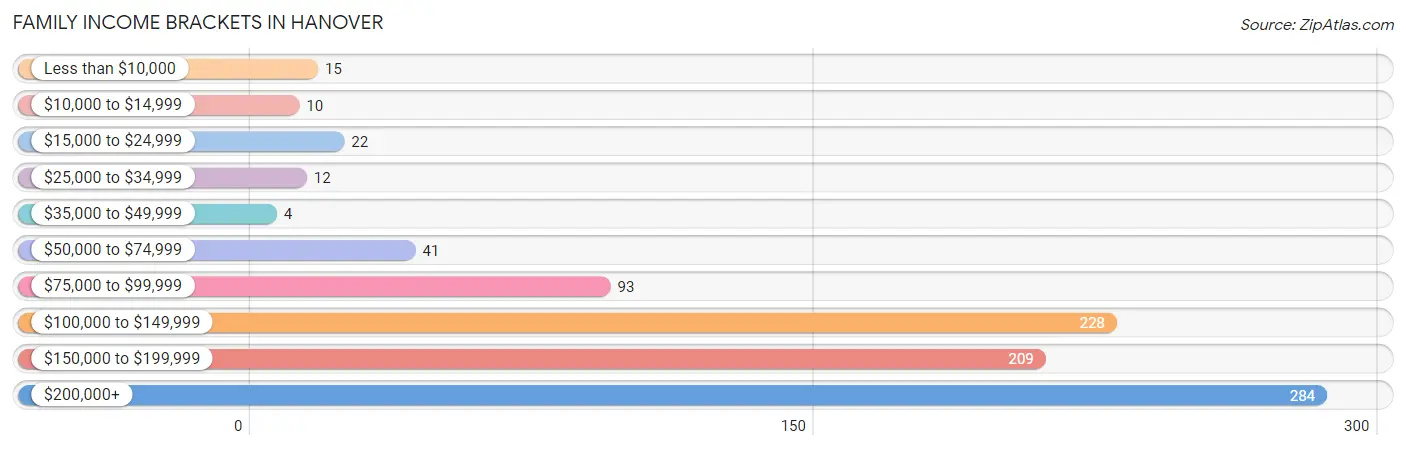
| Income Bracket | # Families | % Families |
| Less than $10,000 | 15 | 1.6% |
| $10,000 to $14,999 | 10 | 1.1% |
| $15,000 to $24,999 | 22 | 2.4% |
| $25,000 to $34,999 | 12 | 1.3% |
| $35,000 to $49,999 | 4 | 0.4% |
| $50,000 to $74,999 | 41 | 4.5% |
| $75,000 to $99,999 | 93 | 10.1% |
| $100,000 to $149,999 | 228 | 24.8% |
| $150,000 to $199,999 | 209 | 22.8% |
| $200,000+ | 284 | 30.9% |
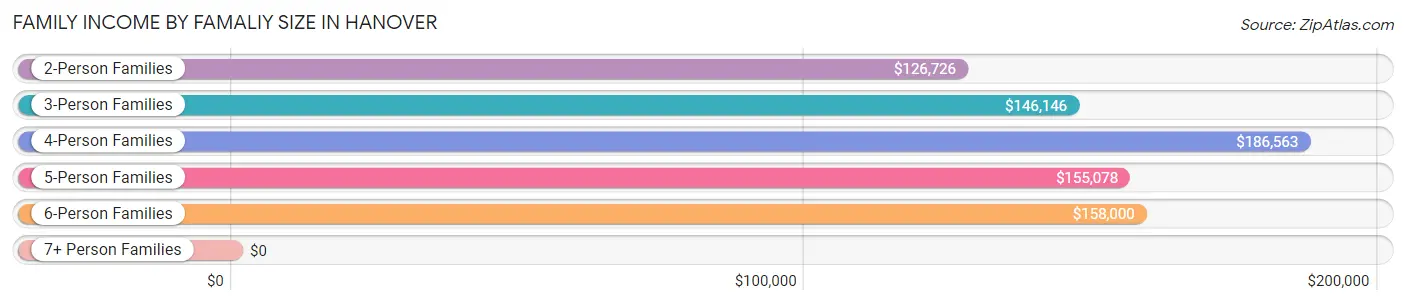
Family Income by Famaliy Size in Hanover
4-person families (370 | 40.3%) account for the highest median family income in Hanover with $186,563 per family, while 2-person families (274 | 29.8%) have the highest median income of $63,363 per family member.
| Income Bracket | # Families | Median Income |
| 2-Person Families | 274 (29.8%) | $126,726 |
| 3-Person Families | 161 (17.5%) | $146,146 |
| 4-Person Families | 370 (40.3%) | $186,563 |
| 5-Person Families | 99 (10.8%) | $155,078 |
| 6-Person Families | 14 (1.5%) | $158,000 |
| 7+ Person Families | 0 (0.0%) | $0 |
| Total | 918 (100.0%) | $156,827 |
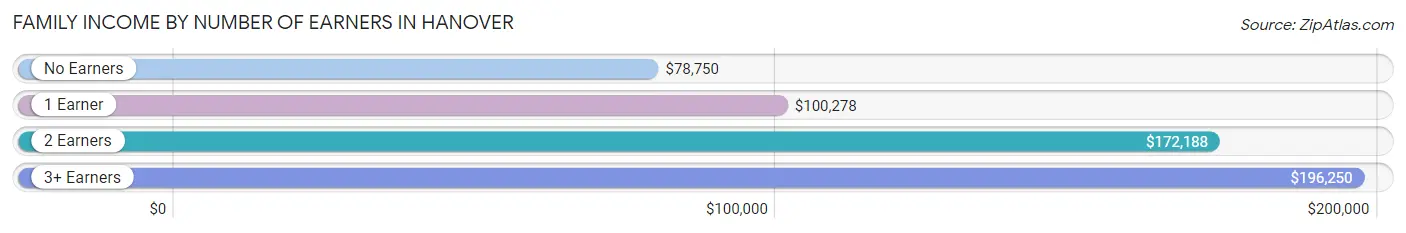
Family Income by Number of Earners in Hanover
The median family income in Hanover is $156,827, with families comprising 3+ earners (172) having the highest median family income of $196,250, while families with no earners (38) have the lowest median family income of $78,750, accounting for 18.7% and 4.1% of families, respectively.
| Number of Earners | # Families | Median Income |
| No Earners | 38 (4.1%) | $78,750 |
| 1 Earner | 216 (23.5%) | $100,278 |
| 2 Earners | 492 (53.6%) | $172,188 |
| 3+ Earners | 172 (18.7%) | $196,250 |
| Total | 918 (100.0%) | $156,827 |
Household Income in Hanover
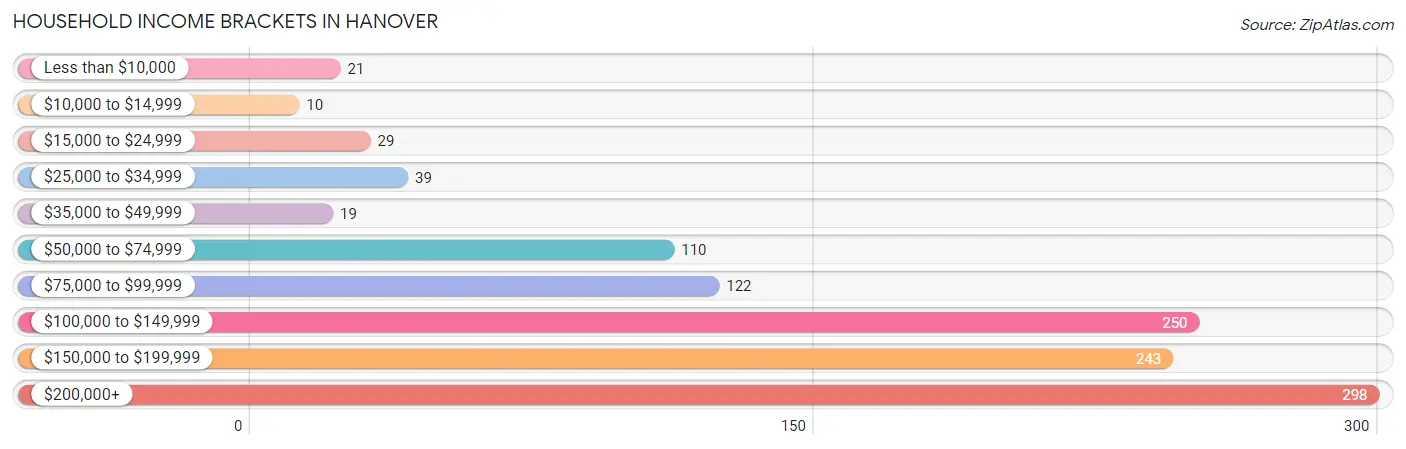
Household Income Brackets in Hanover
With 298 households falling in the category, the $200,000+ income range is the most frequent in Hanover, accounting for 26.1% of all households. In contrast, only 10 households (0.9%) fall into the $10,000 to $14,999 income bracket, making it the least populous group.
| Income Bracket | # Households | % Households |
| Less than $10,000 | 21 | 1.8% |
| $10,000 to $14,999 | 10 | 0.9% |
| $15,000 to $24,999 | 29 | 2.5% |
| $25,000 to $34,999 | 39 | 3.4% |
| $35,000 to $49,999 | 19 | 1.7% |
| $50,000 to $74,999 | 110 | 9.6% |
| $75,000 to $99,999 | 122 | 10.7% |
| $100,000 to $149,999 | 250 | 21.9% |
| $150,000 to $199,999 | 243 | 21.3% |
| $200,000+ | 298 | 26.1% |
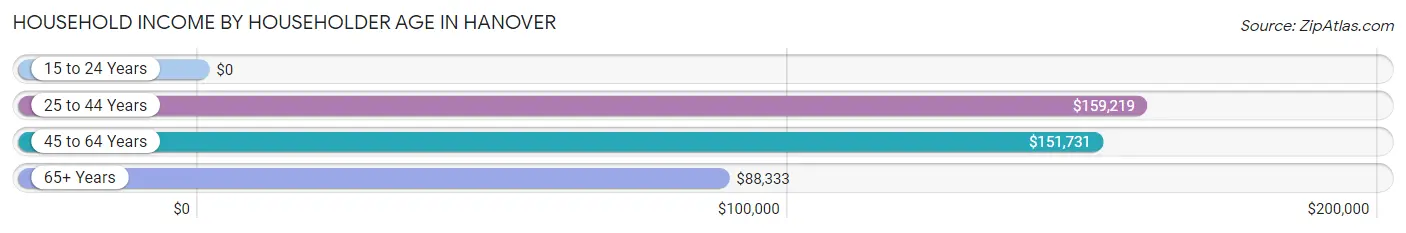
Household Income by Householder Age in Hanover
The median household income in Hanover is $145,156, with the highest median household income of $159,219 found in the 25 to 44 years age bracket for the primary householder. A total of 459 households (40.2%) fall into this category. Meanwhile, the 15 to 24 years age bracket for the primary householder has the lowest median household income of $0, with 12 households (1.1%) in this group.
| Income Bracket | # Households | Median Income |
| 15 to 24 Years | 12 (1.1%) | $0 |
| 25 to 44 Years | 459 (40.2%) | $159,219 |
| 45 to 64 Years | 504 (44.2%) | $151,731 |
| 65+ Years | 166 (14.5%) | $88,333 |
| Total | 1,141 (100.0%) | $145,156 |
Poverty in Hanover
Income Below Poverty by Sex and Age in Hanover
With 3.4% poverty level for males and 3.0% for females among the residents of Hanover, 75 year old and over males and 75 year old and over females are the most vulnerable to poverty, with 7 males (31.8%) and 7 females (17.1%) in their respective age groups living below the poverty level.
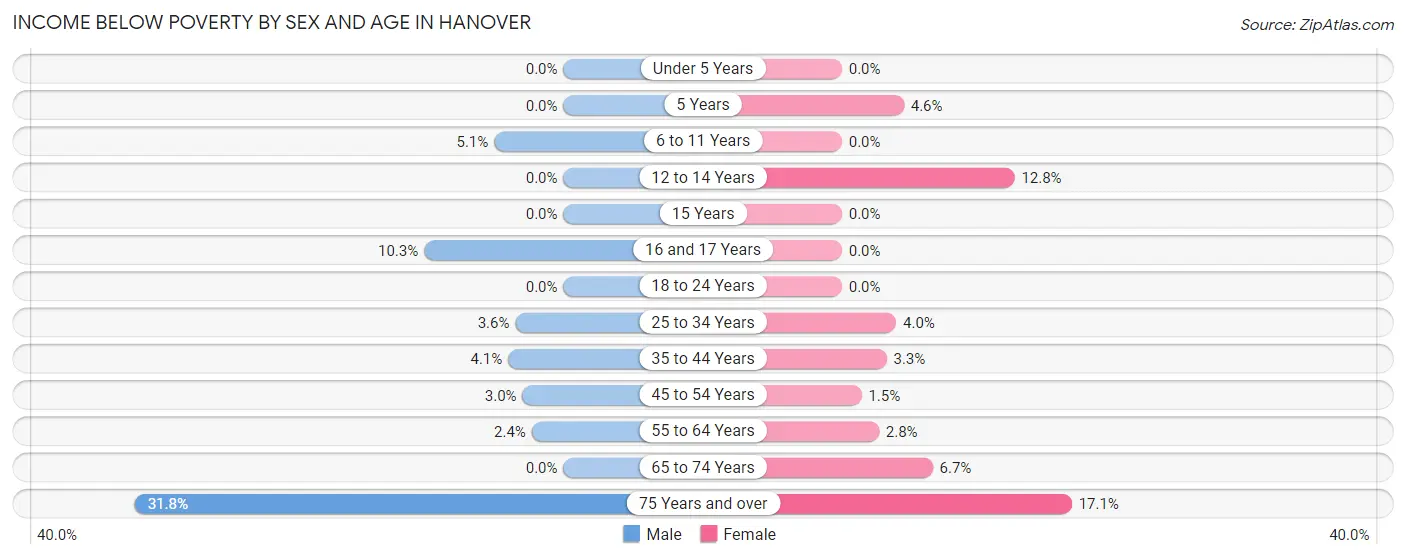
| Age Bracket | Male | Female |
| Under 5 Years | 0 (0.0%) | 0 (0.0%) |
| 5 Years | 0 (0.0%) | 4 (4.6%) |
| 6 to 11 Years | 11 (5.1%) | 0 (0.0%) |
| 12 to 14 Years | 0 (0.0%) | 10 (12.8%) |
| 15 Years | 0 (0.0%) | 0 (0.0%) |
| 16 and 17 Years | 9 (10.3%) | 0 (0.0%) |
| 18 to 24 Years | 0 (0.0%) | 0 (0.0%) |
| 25 to 34 Years | 6 (3.6%) | 6 (4.0%) |
| 35 to 44 Years | 11 (4.1%) | 11 (3.3%) |
| 45 to 54 Years | 9 (3.0%) | 4 (1.5%) |
| 55 to 64 Years | 5 (2.4%) | 5 (2.8%) |
| 65 to 74 Years | 0 (0.0%) | 6 (6.7%) |
| 75 Years and over | 7 (31.8%) | 7 (17.1%) |
| Total | 58 (3.4%) | 53 (3.0%) |
Income Above Poverty by Sex and Age in Hanover
According to the poverty statistics in Hanover, males aged under 5 years and females aged under 5 years are the age groups that are most secure financially, with 100.0% of males and 100.0% of females in these age groups living above the poverty line.
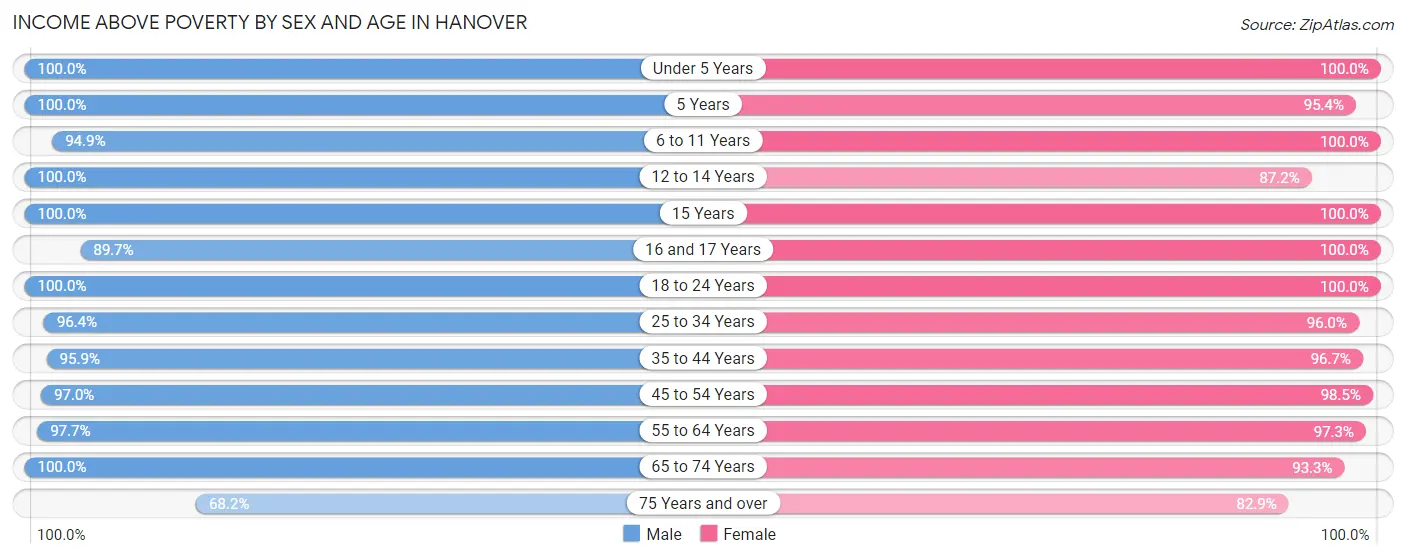
| Age Bracket | Male | Female |
| Under 5 Years | 93 (100.0%) | 169 (100.0%) |
| 5 Years | 37 (100.0%) | 83 (95.4%) |
| 6 to 11 Years | 203 (94.9%) | 167 (100.0%) |
| 12 to 14 Years | 82 (100.0%) | 68 (87.2%) |
| 15 Years | 26 (100.0%) | 11 (100.0%) |
| 16 and 17 Years | 78 (89.7%) | 53 (100.0%) |
| 18 to 24 Years | 91 (100.0%) | 127 (100.0%) |
| 25 to 34 Years | 162 (96.4%) | 143 (96.0%) |
| 35 to 44 Years | 257 (95.9%) | 320 (96.7%) |
| 45 to 54 Years | 287 (97.0%) | 270 (98.5%) |
| 55 to 64 Years | 208 (97.7%) | 177 (97.3%) |
| 65 to 74 Years | 99 (100.0%) | 83 (93.3%) |
| 75 Years and over | 15 (68.2%) | 34 (82.9%) |
| Total | 1,638 (96.6%) | 1,705 (97.0%) |
Income Below Poverty Among Married-Couple Families in Hanover
The poverty statistics for married-couple families in Hanover show that 2.9% or 23 of the total 797 families live below the poverty line. Families with no children have the highest poverty rate of 4.2%, comprising of 13 families. On the other hand, families with 3 or 4 children have the lowest poverty rate of 0.0%, which includes 0 families.
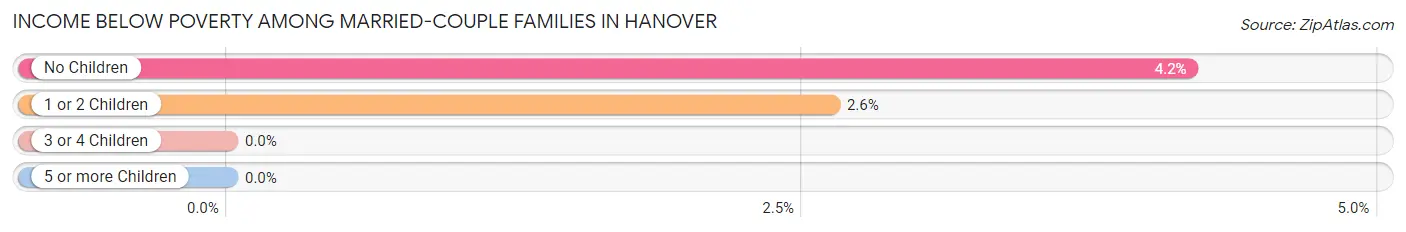
| Children | Above Poverty | Below Poverty |
| No Children | 298 (95.8%) | 13 (4.2%) |
| 1 or 2 Children | 372 (97.4%) | 10 (2.6%) |
| 3 or 4 Children | 104 (100.0%) | 0 (0.0%) |
| 5 or more Children | 0 (0.0%) | 0 (0.0%) |
| Total | 774 (97.1%) | 23 (2.9%) |
Income Below Poverty Among Single-Parent Households in Hanover
According to the poverty data in Hanover, 23.1% or 9 single-father households and 4.9% or 4 single-mother households are living below the poverty line. Among single-father households, those with 1 or 2 children have the highest poverty rate, with 9 households (31.0%) experiencing poverty. Likewise, among single-mother households, those with 1 or 2 children have the highest poverty rate, with 4 households (6.8%) falling below the poverty line.
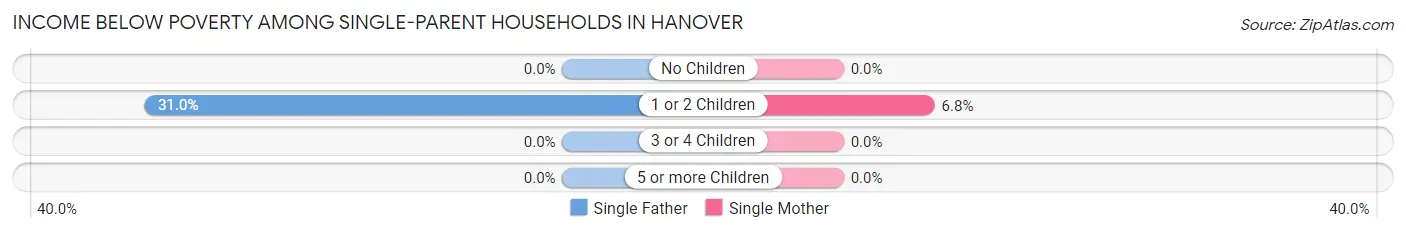
| Children | Single Father | Single Mother |
| No Children | 0 (0.0%) | 0 (0.0%) |
| 1 or 2 Children | 9 (31.0%) | 4 (6.8%) |
| 3 or 4 Children | 0 (0.0%) | 0 (0.0%) |
| 5 or more Children | 0 (0.0%) | 0 (0.0%) |
| Total | 9 (23.1%) | 4 (4.9%) |
Income Below Poverty Among Married-Couple vs Single-Parent Households in Hanover
The poverty data for Hanover shows that 23 of the married-couple family households (2.9%) and 13 of the single-parent households (10.7%) are living below the poverty level. Within the married-couple family households, those with no children have the highest poverty rate, with 13 households (4.2%) falling below the poverty line. Among the single-parent households, those with 1 or 2 children have the highest poverty rate, with 13 household (14.8%) living below poverty.
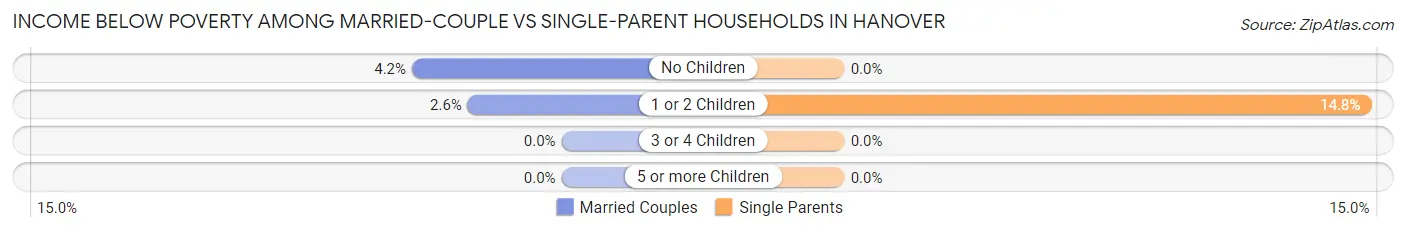
| Children | Married-Couple Families | Single-Parent Households |
| No Children | 13 (4.2%) | 0 (0.0%) |
| 1 or 2 Children | 10 (2.6%) | 13 (14.8%) |
| 3 or 4 Children | 0 (0.0%) | 0 (0.0%) |
| 5 or more Children | 0 (0.0%) | 0 (0.0%) |
| Total | 23 (2.9%) | 13 (10.7%) |
Employment Characteristics in Hanover
Employment by Class of Employer in Hanover
Among the 1,961 employed individuals in Hanover, private company employees (1,436 | 73.2%), not-for-profit organizations (197 | 10.1%), and local government employees (96 | 4.9%) make up the most common classes of employment.
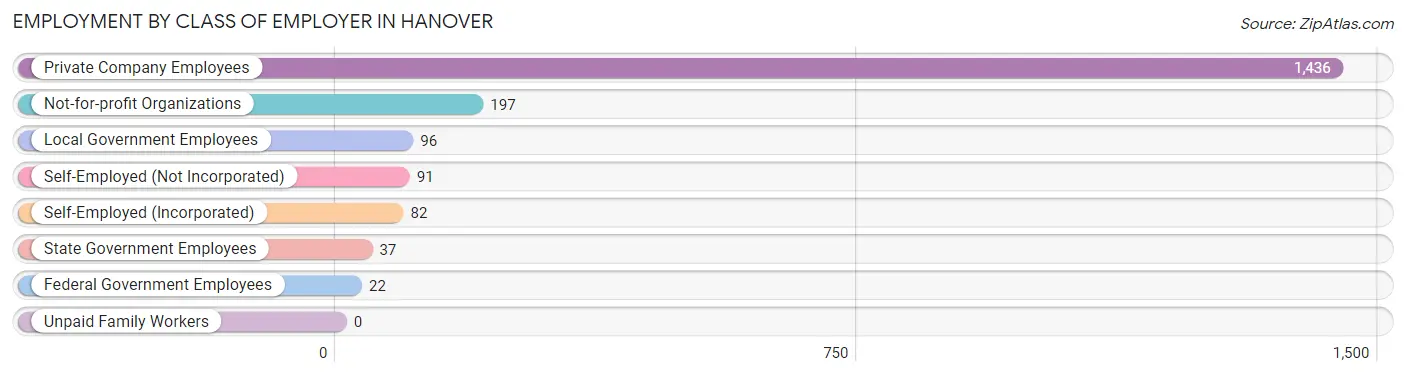
| Employer Class | # Employees | % Employees |
| Private Company Employees | 1,436 | 73.2% |
| Self-Employed (Incorporated) | 82 | 4.2% |
| Self-Employed (Not Incorporated) | 91 | 4.6% |
| Not-for-profit Organizations | 197 | 10.1% |
| Local Government Employees | 96 | 4.9% |
| State Government Employees | 37 | 1.9% |
| Federal Government Employees | 22 | 1.1% |
| Unpaid Family Workers | 0 | 0.0% |
| Total | 1,961 | 100.0% |
Employment Status by Age in Hanover
According to the labor force statistics for Hanover, out of the total population over 16 years of age (2,490), 79.8% or 1,987 individuals are in the labor force, with 0.8% or 16 of them unemployed. The age group with the highest labor force participation rate is 20 to 24 years, with 95.8% or 113 individuals in the labor force. Within the labor force, the 65 to 74 years age range has the highest percentage of unemployed individuals, with 4.5% or 4 of them being unemployed.
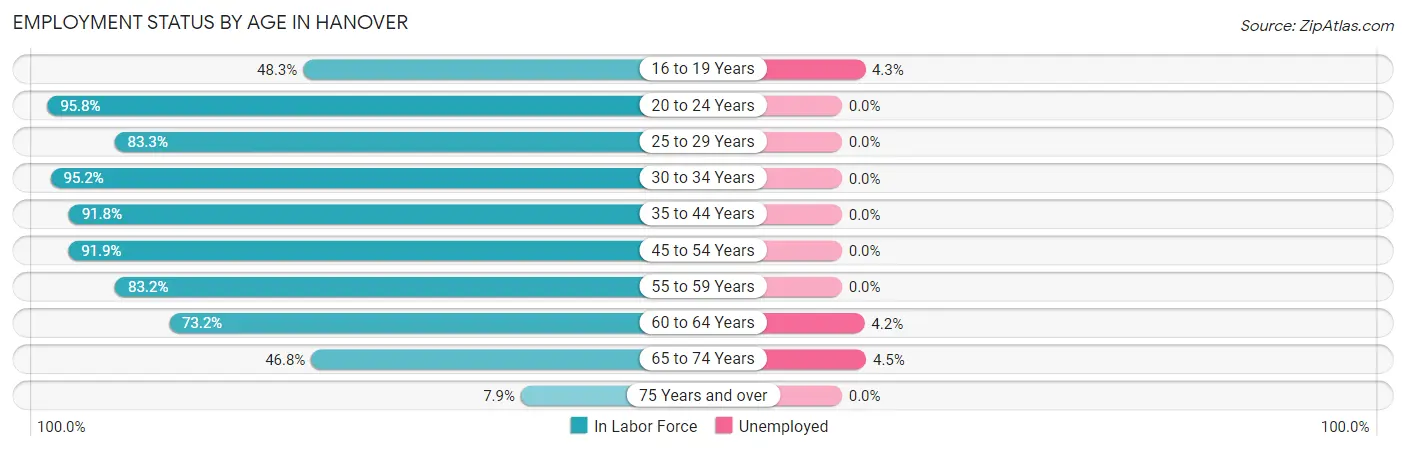
| Age Bracket | In Labor Force | Unemployed |
| 16 to 19 Years | 116 (48.3%) | 5 (4.3%) |
| 20 to 24 Years | 113 (95.8%) | 0 (0.0%) |
| 25 to 29 Years | 125 (83.3%) | 0 (0.0%) |
| 30 to 34 Years | 159 (95.2%) | 0 (0.0%) |
| 35 to 44 Years | 550 (91.8%) | 0 (0.0%) |
| 45 to 54 Years | 524 (91.9%) | 0 (0.0%) |
| 55 to 59 Years | 139 (83.2%) | 0 (0.0%) |
| 60 to 64 Years | 167 (73.2%) | 7 (4.2%) |
| 65 to 74 Years | 88 (46.8%) | 4 (4.5%) |
| 75 Years and over | 5 (7.9%) | 0 (0.0%) |
| Total | 1,987 (79.8%) | 16 (0.8%) |
Employment Status by Educational Attainment in Hanover
According to labor force statistics for Hanover, 88.5% of individuals (1,665) out of the total population between 25 and 64 years of age (1,881) are in the labor force, with 0.4% or 7 of them being unemployed. The group with the highest labor force participation rate are those with the educational attainment of college / associate degree, with 93.9% or 633 individuals in the labor force. Within the labor force, individuals with high school diploma education have the highest percentage of unemployment, with 3.9% or 5 of them being unemployed.
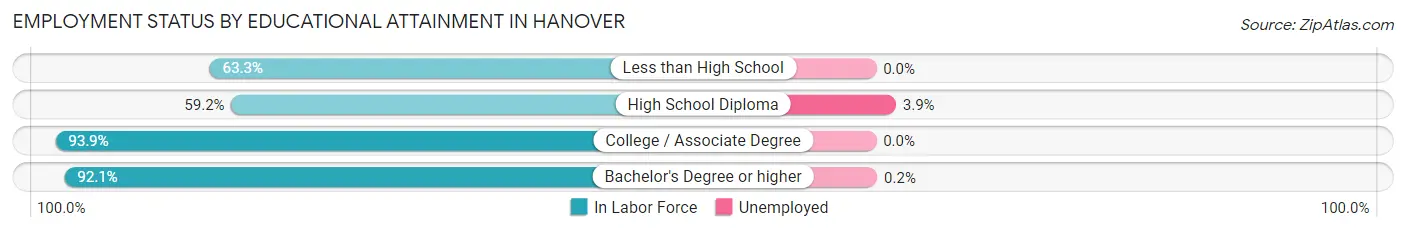
| Educational Attainment | In Labor Force | Unemployed |
| Less than High School | 19 (63.3%) | 0 (0.0%) |
| High School Diploma | 129 (59.2%) | 9 (3.9%) |
| College / Associate Degree | 633 (93.9%) | 0 (0.0%) |
| Bachelor's Degree or higher | 883 (92.1%) | 2 (0.2%) |
| Total | 1,665 (88.5%) | 8 (0.4%) |
Employment Occupations by Sex in Hanover
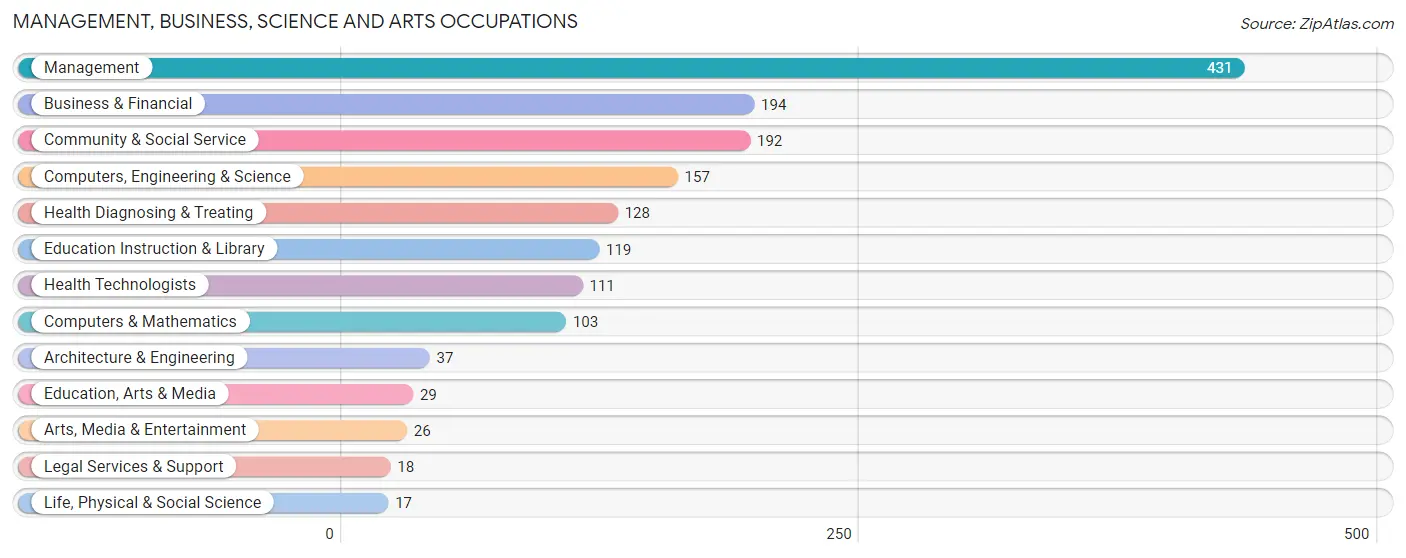
Management, Business, Science and Arts Occupations
The most common Management, Business, Science and Arts occupations in Hanover are Management (431 | 21.9%), Business & Financial (194 | 9.9%), Community & Social Service (192 | 9.8%), Computers, Engineering & Science (157 | 8.0%), and Health Diagnosing & Treating (128 | 6.5%).
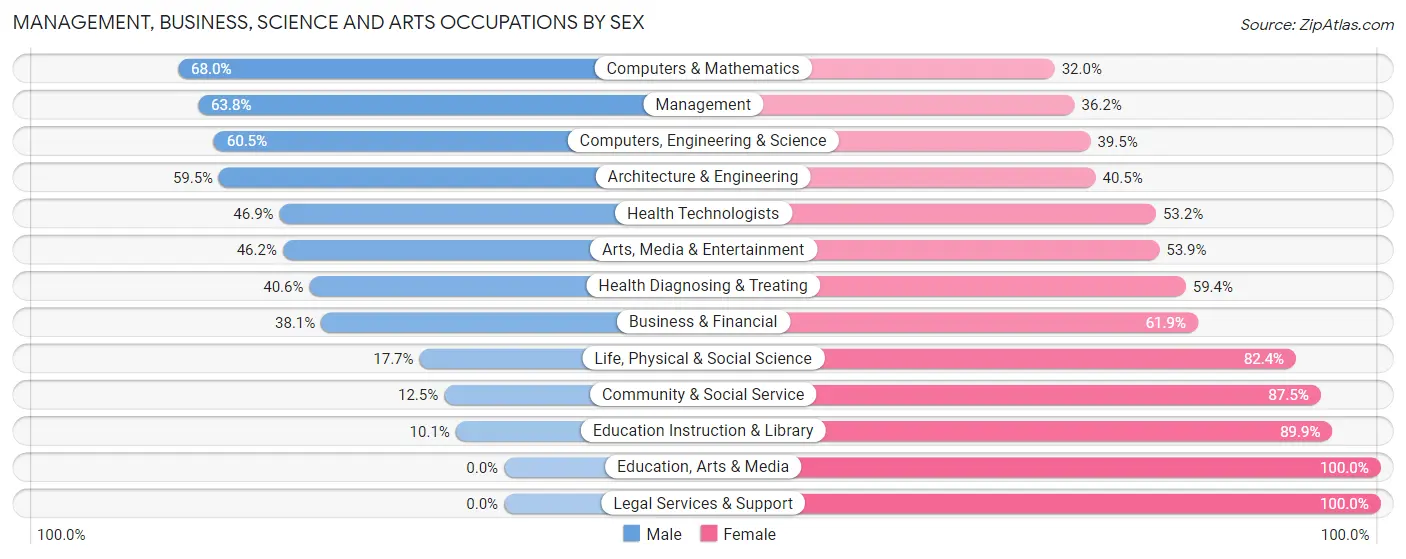
Management, Business, Science and Arts Occupations by Sex
Within the Management, Business, Science and Arts occupations in Hanover, the most male-oriented occupations are Computers & Mathematics (68.0%), Management (63.8%), and Computers, Engineering & Science (60.5%), while the most female-oriented occupations are Education, Arts & Media (100.0%), Legal Services & Support (100.0%), and Education Instruction & Library (89.9%).
| Occupation | Male | Female |
| Management | 275 (63.8%) | 156 (36.2%) |
| Business & Financial | 74 (38.1%) | 120 (61.9%) |
| Computers, Engineering & Science | 95 (60.5%) | 62 (39.5%) |
| Computers & Mathematics | 70 (68.0%) | 33 (32.0%) |
| Architecture & Engineering | 22 (59.5%) | 15 (40.5%) |
| Life, Physical & Social Science | 3 (17.6%) | 14 (82.4%) |
| Community & Social Service | 24 (12.5%) | 168 (87.5%) |
| Education, Arts & Media | 0 (0.0%) | 29 (100.0%) |
| Legal Services & Support | 0 (0.0%) | 18 (100.0%) |
| Education Instruction & Library | 12 (10.1%) | 107 (89.9%) |
| Arts, Media & Entertainment | 12 (46.2%) | 14 (53.8%) |
| Health Diagnosing & Treating | 52 (40.6%) | 76 (59.4%) |
| Health Technologists | 52 (46.9%) | 59 (53.1%) |
| Total (Category) | 520 (47.2%) | 582 (52.8%) |
| Total (Overall) | 1,037 (52.6%) | 933 (47.4%) |
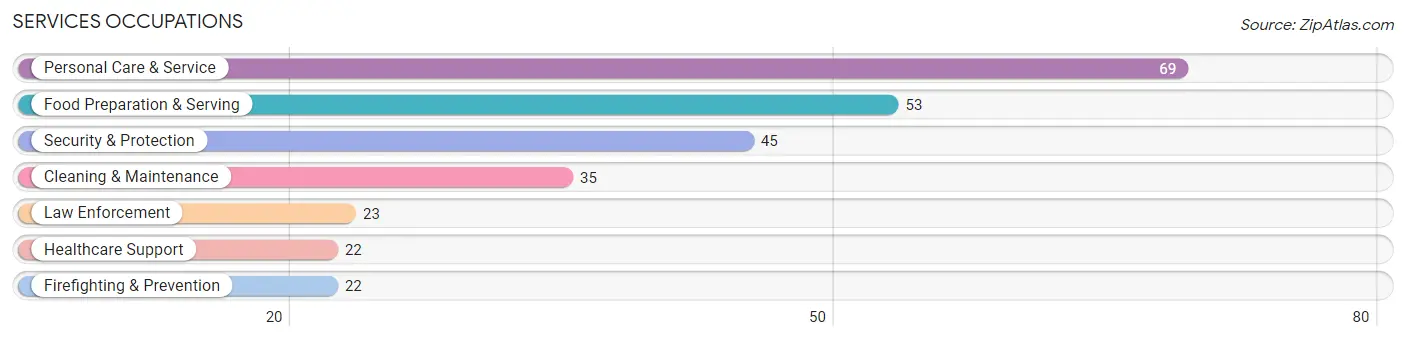
Services Occupations
The most common Services occupations in Hanover are Personal Care & Service (69 | 3.5%), Food Preparation & Serving (53 | 2.7%), Security & Protection (45 | 2.3%), Cleaning & Maintenance (35 | 1.8%), and Law Enforcement (23 | 1.2%).
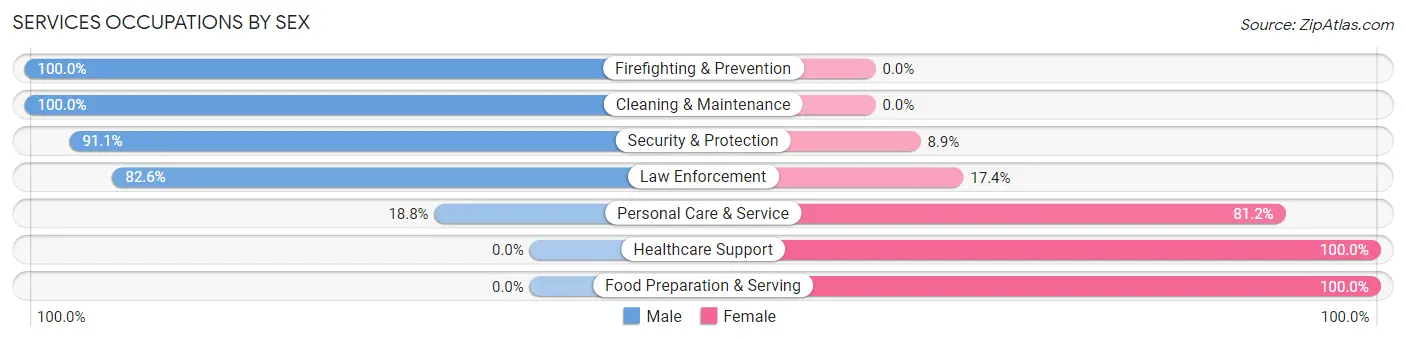
Services Occupations by Sex
Within the Services occupations in Hanover, the most male-oriented occupations are Firefighting & Prevention (100.0%), Cleaning & Maintenance (100.0%), and Security & Protection (91.1%), while the most female-oriented occupations are Healthcare Support (100.0%), Food Preparation & Serving (100.0%), and Personal Care & Service (81.2%).
| Occupation | Male | Female |
| Healthcare Support | 0 (0.0%) | 22 (100.0%) |
| Security & Protection | 41 (91.1%) | 4 (8.9%) |
| Firefighting & Prevention | 22 (100.0%) | 0 (0.0%) |
| Law Enforcement | 19 (82.6%) | 4 (17.4%) |
| Food Preparation & Serving | 0 (0.0%) | 53 (100.0%) |
| Cleaning & Maintenance | 35 (100.0%) | 0 (0.0%) |
| Personal Care & Service | 13 (18.8%) | 56 (81.2%) |
| Total (Category) | 89 (39.7%) | 135 (60.3%) |
| Total (Overall) | 1,037 (52.6%) | 933 (47.4%) |
Sales and Office Occupations
The most common Sales and Office occupations in Hanover are Sales & Related (208 | 10.6%), and Office & Administration (134 | 6.8%).
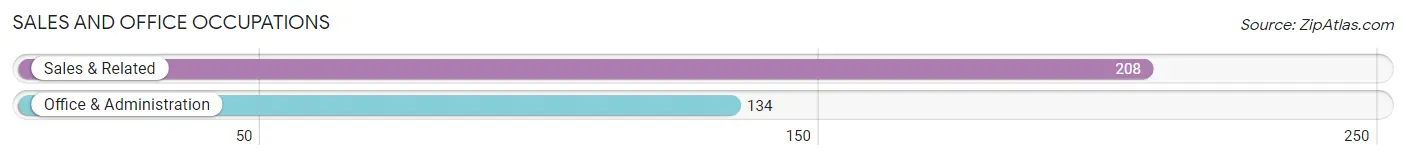
Sales and Office Occupations by Sex
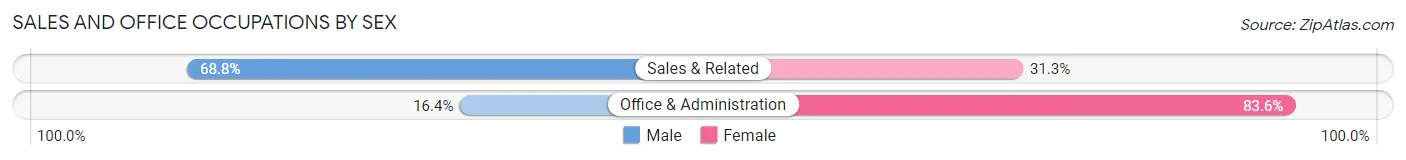
| Occupation | Male | Female |
| Sales & Related | 143 (68.8%) | 65 (31.2%) |
| Office & Administration | 22 (16.4%) | 112 (83.6%) |
| Total (Category) | 165 (48.2%) | 177 (51.7%) |
| Total (Overall) | 1,037 (52.6%) | 933 (47.4%) |
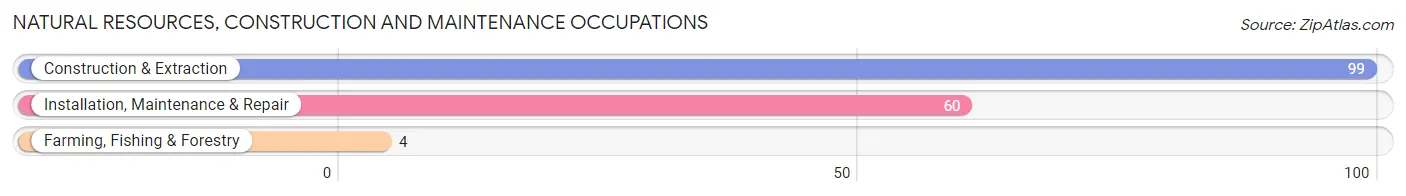
Natural Resources, Construction and Maintenance Occupations
The most common Natural Resources, Construction and Maintenance occupations in Hanover are Construction & Extraction (99 | 5.0%), Installation, Maintenance & Repair (60 | 3.0%), and Farming, Fishing & Forestry (4 | 0.2%).
Natural Resources, Construction and Maintenance Occupations by Sex
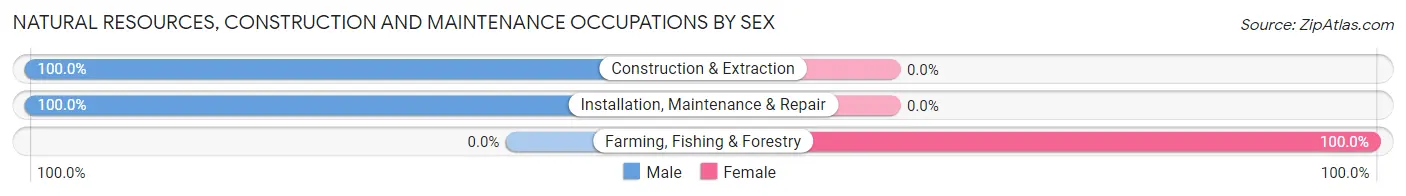
| Occupation | Male | Female |
| Farming, Fishing & Forestry | 0 (0.0%) | 4 (100.0%) |
| Construction & Extraction | 99 (100.0%) | 0 (0.0%) |
| Installation, Maintenance & Repair | 60 (100.0%) | 0 (0.0%) |
| Total (Category) | 159 (97.6%) | 4 (2.5%) |
| Total (Overall) | 1,037 (52.6%) | 933 (47.4%) |
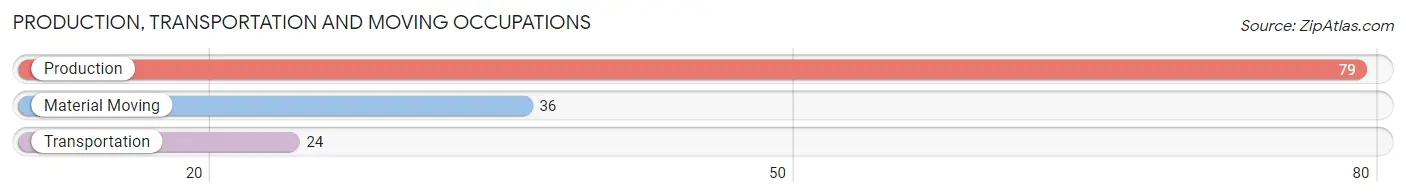
Production, Transportation and Moving Occupations
The most common Production, Transportation and Moving occupations in Hanover are Production (79 | 4.0%), Material Moving (36 | 1.8%), and Transportation (24 | 1.2%).
Production, Transportation and Moving Occupations by Sex
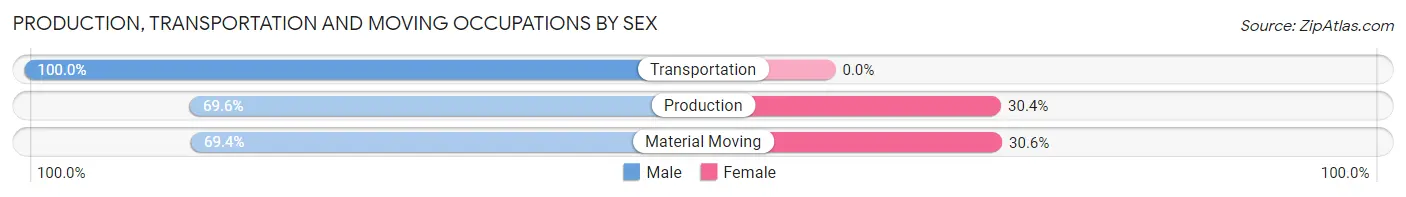
| Occupation | Male | Female |
| Production | 55 (69.6%) | 24 (30.4%) |
| Transportation | 24 (100.0%) | 0 (0.0%) |
| Material Moving | 25 (69.4%) | 11 (30.6%) |
| Total (Category) | 104 (74.8%) | 35 (25.2%) |
| Total (Overall) | 1,037 (52.6%) | 933 (47.4%) |
Employment Industries by Sex in Hanover
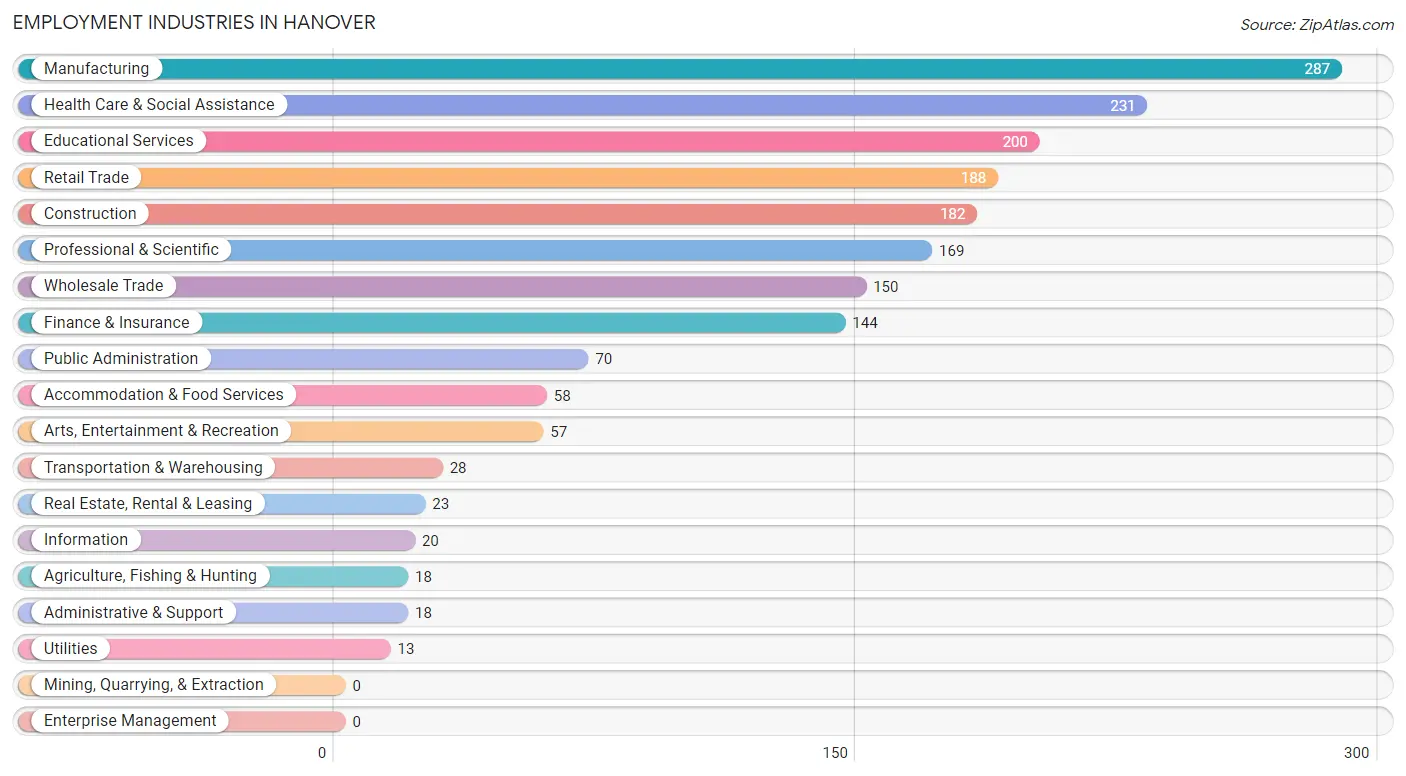
Employment Industries in Hanover
The major employment industries in Hanover include Manufacturing (287 | 14.6%), Health Care & Social Assistance (231 | 11.7%), Educational Services (200 | 10.2%), Retail Trade (188 | 9.5%), and Construction (182 | 9.2%).
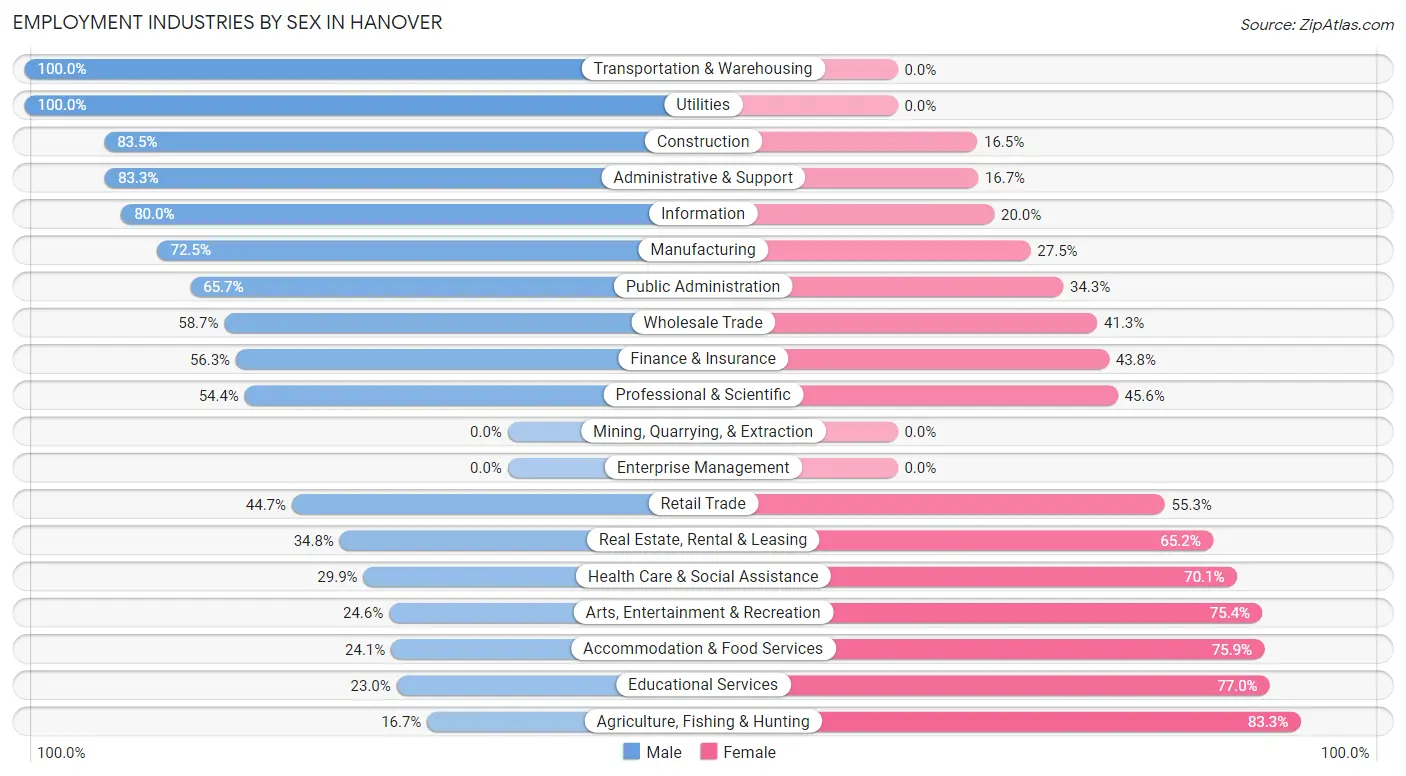
Employment Industries by Sex in Hanover
The Hanover industries that see more men than women are Transportation & Warehousing (100.0%), Utilities (100.0%), and Construction (83.5%), whereas the industries that tend to have a higher number of women are Agriculture, Fishing & Hunting (83.3%), Educational Services (77.0%), and Accommodation & Food Services (75.9%).
| Industry | Male | Female |
| Agriculture, Fishing & Hunting | 3 (16.7%) | 15 (83.3%) |
| Mining, Quarrying, & Extraction | 0 (0.0%) | 0 (0.0%) |
| Construction | 152 (83.5%) | 30 (16.5%) |
| Manufacturing | 208 (72.5%) | 79 (27.5%) |
| Wholesale Trade | 88 (58.7%) | 62 (41.3%) |
| Retail Trade | 84 (44.7%) | 104 (55.3%) |
| Transportation & Warehousing | 28 (100.0%) | 0 (0.0%) |
| Utilities | 13 (100.0%) | 0 (0.0%) |
| Information | 16 (80.0%) | 4 (20.0%) |
| Finance & Insurance | 81 (56.2%) | 63 (43.8%) |
| Real Estate, Rental & Leasing | 8 (34.8%) | 15 (65.2%) |
| Professional & Scientific | 92 (54.4%) | 77 (45.6%) |
| Enterprise Management | 0 (0.0%) | 0 (0.0%) |
| Administrative & Support | 15 (83.3%) | 3 (16.7%) |
| Educational Services | 46 (23.0%) | 154 (77.0%) |
| Health Care & Social Assistance | 69 (29.9%) | 162 (70.1%) |
| Arts, Entertainment & Recreation | 14 (24.6%) | 43 (75.4%) |
| Accommodation & Food Services | 14 (24.1%) | 44 (75.9%) |
| Public Administration | 46 (65.7%) | 24 (34.3%) |
| Total | 1,037 (52.6%) | 933 (47.4%) |
Education in Hanover
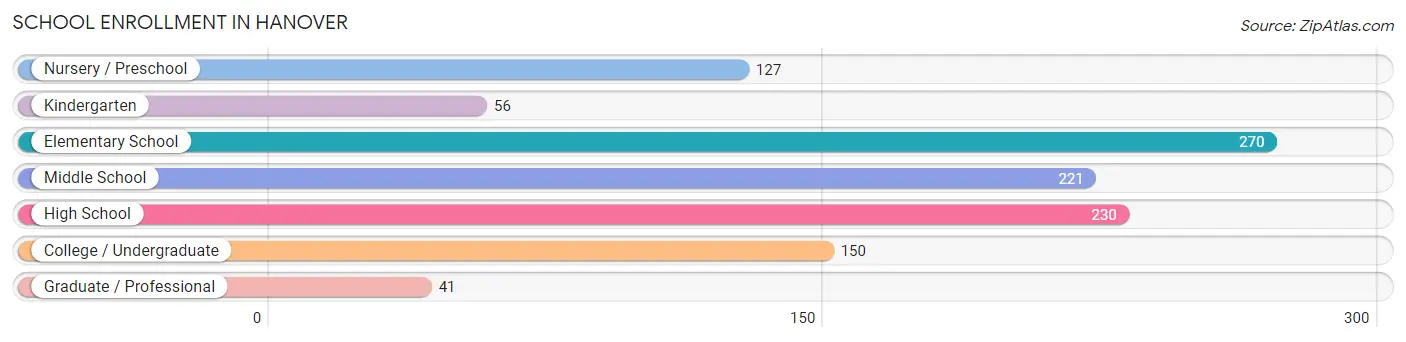
School Enrollment in Hanover
The most common levels of schooling among the 1,095 students in Hanover are elementary school (270 | 24.7%), high school (230 | 21.0%), and middle school (221 | 20.2%).
| School Level | # Students | % Students |
| Nursery / Preschool | 127 | 11.6% |
| Kindergarten | 56 | 5.1% |
| Elementary School | 270 | 24.7% |
| Middle School | 221 | 20.2% |
| High School | 230 | 21.0% |
| College / Undergraduate | 150 | 13.7% |
| Graduate / Professional | 41 | 3.7% |
| Total | 1,095 | 100.0% |
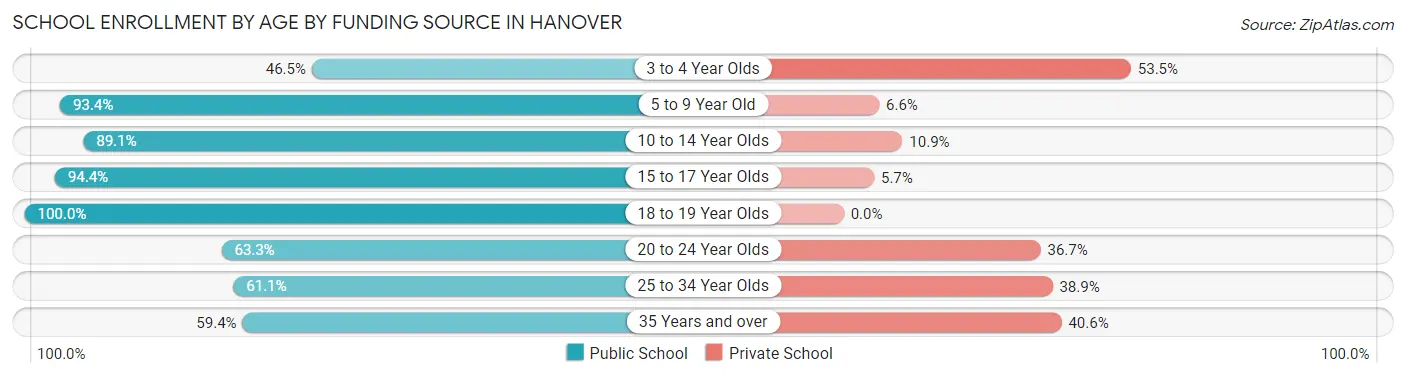
School Enrollment by Age by Funding Source in Hanover
Out of a total of 1,095 students who are enrolled in schools in Hanover, 148 (13.5%) attend a private institution, while the remaining 947 (86.5%) are enrolled in public schools. The age group of 3 to 4 year olds has the highest likelihood of being enrolled in private schools, with 23 (53.5% in the age bracket) enrolled. Conversely, the age group of 18 to 19 year olds has the lowest likelihood of being enrolled in a private school, with 71 (100.0% in the age bracket) attending a public institution.
| Age Bracket | Public School | Private School |
| 3 to 4 Year Olds | 20 (46.5%) | 23 (53.5%) |
| 5 to 9 Year Old | 368 (93.4%) | 26 (6.6%) |
| 10 to 14 Year Olds | 228 (89.1%) | 28 (10.9%) |
| 15 to 17 Year Olds | 167 (94.4%) | 10 (5.7%) |
| 18 to 19 Year Olds | 71 (100.0%) | 0 (0.0%) |
| 20 to 24 Year Olds | 19 (63.3%) | 11 (36.7%) |
| 25 to 34 Year Olds | 11 (61.1%) | 7 (38.9%) |
| 35 Years and over | 63 (59.4%) | 43 (40.6%) |
| Total | 947 (86.5%) | 148 (13.5%) |
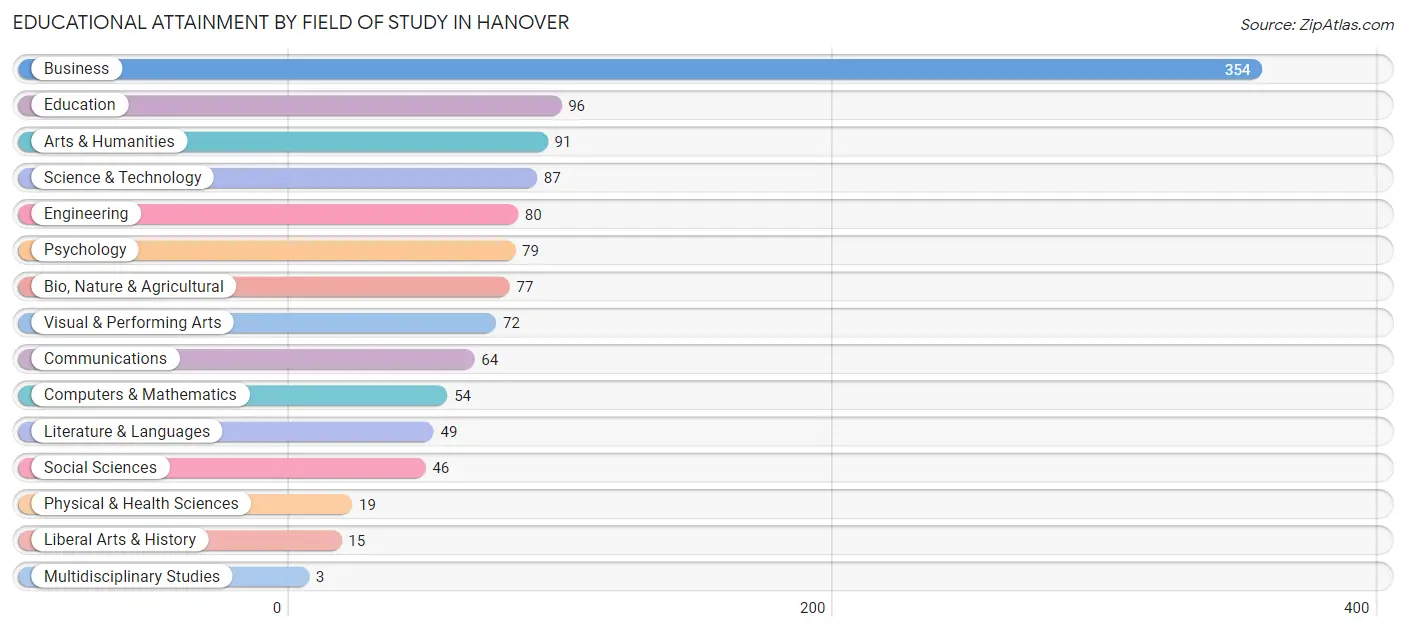
Educational Attainment by Field of Study in Hanover
Business (354 | 29.8%), education (96 | 8.1%), arts & humanities (91 | 7.7%), science & technology (87 | 7.3%), and engineering (80 | 6.8%) are the most common fields of study among 1,186 individuals in Hanover who have obtained a bachelor's degree or higher.
| Field of Study | # Graduates | % Graduates |
| Computers & Mathematics | 54 | 4.5% |
| Bio, Nature & Agricultural | 77 | 6.5% |
| Physical & Health Sciences | 19 | 1.6% |
| Psychology | 79 | 6.7% |
| Social Sciences | 46 | 3.9% |
| Engineering | 80 | 6.8% |
| Multidisciplinary Studies | 3 | 0.3% |
| Science & Technology | 87 | 7.3% |
| Business | 354 | 29.8% |
| Education | 96 | 8.1% |
| Literature & Languages | 49 | 4.1% |
| Liberal Arts & History | 15 | 1.3% |
| Visual & Performing Arts | 72 | 6.1% |
| Communications | 64 | 5.4% |
| Arts & Humanities | 91 | 7.7% |
| Total | 1,186 | 100.0% |
Transportation & Commute in Hanover
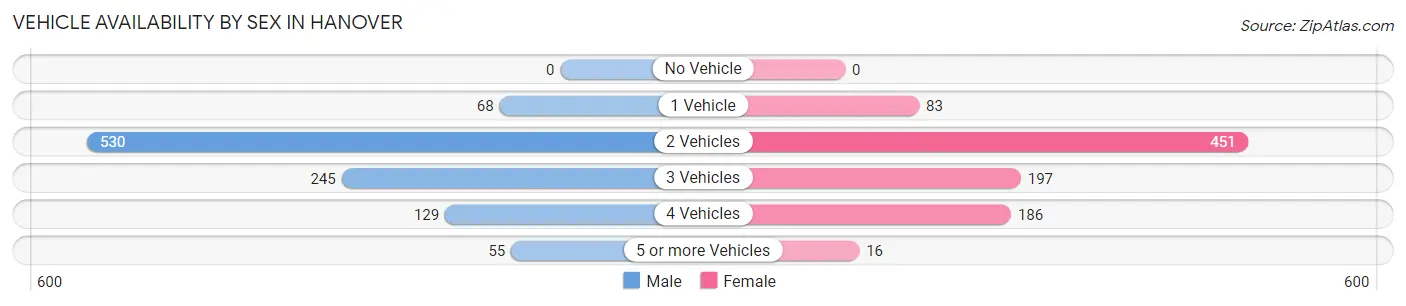
Vehicle Availability by Sex in Hanover
The most prevalent vehicle ownership categories in Hanover are males with 2 vehicles (530, accounting for 51.6%) and females with 2 vehicles (451, making up 56.8%).
| Vehicles Available | Male | Female |
| No Vehicle | 0 (0.0%) | 0 (0.0%) |
| 1 Vehicle | 68 (6.6%) | 83 (8.9%) |
| 2 Vehicles | 530 (51.6%) | 451 (48.3%) |
| 3 Vehicles | 245 (23.9%) | 197 (21.1%) |
| 4 Vehicles | 129 (12.6%) | 186 (19.9%) |
| 5 or more Vehicles | 55 (5.4%) | 16 (1.7%) |
| Total | 1,027 (100.0%) | 933 (100.0%) |
Commute Time in Hanover
The most frequently occuring commute durations in Hanover are 45 to 59 minutes (228 commuters, 14.2%), 20 to 24 minutes (210 commuters, 13.1%), and 30 to 34 minutes (206 commuters, 12.8%).
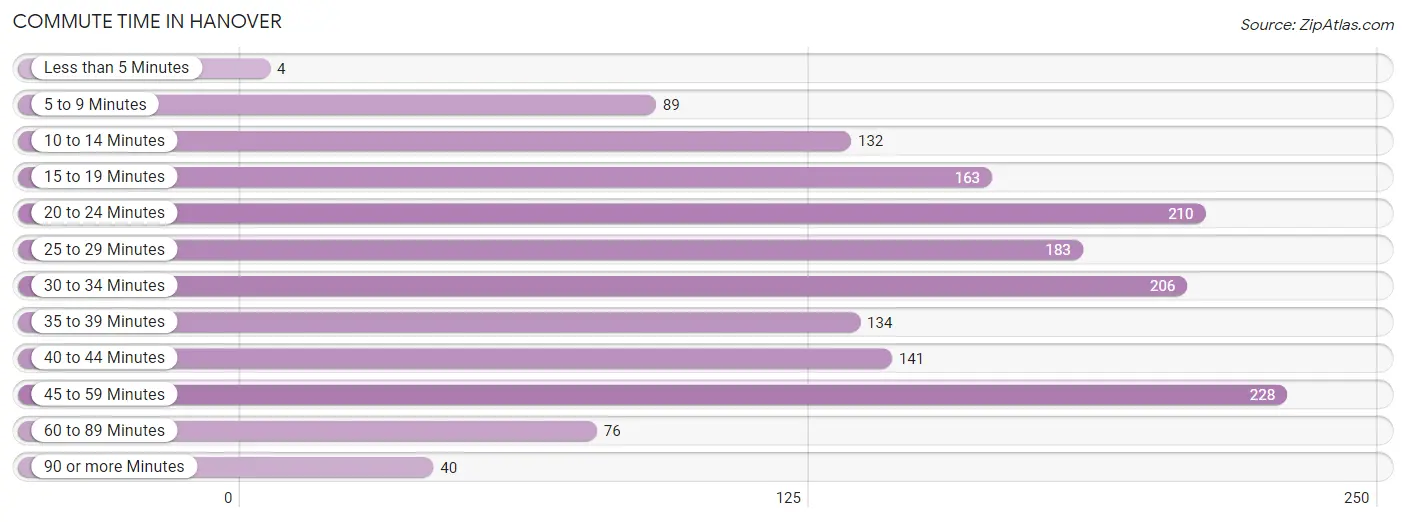
| Commute Time | # Commuters | % Commuters |
| Less than 5 Minutes | 4 | 0.3% |
| 5 to 9 Minutes | 89 | 5.5% |
| 10 to 14 Minutes | 132 | 8.2% |
| 15 to 19 Minutes | 163 | 10.2% |
| 20 to 24 Minutes | 210 | 13.1% |
| 25 to 29 Minutes | 183 | 11.4% |
| 30 to 34 Minutes | 206 | 12.8% |
| 35 to 39 Minutes | 134 | 8.3% |
| 40 to 44 Minutes | 141 | 8.8% |
| 45 to 59 Minutes | 228 | 14.2% |
| 60 to 89 Minutes | 76 | 4.7% |
| 90 or more Minutes | 40 | 2.5% |
Commute Time by Sex in Hanover
The most common commute times in Hanover are 45 to 59 minutes (144 commuters, 17.5%) for males and 20 to 24 minutes (126 commuters, 16.1%) for females.
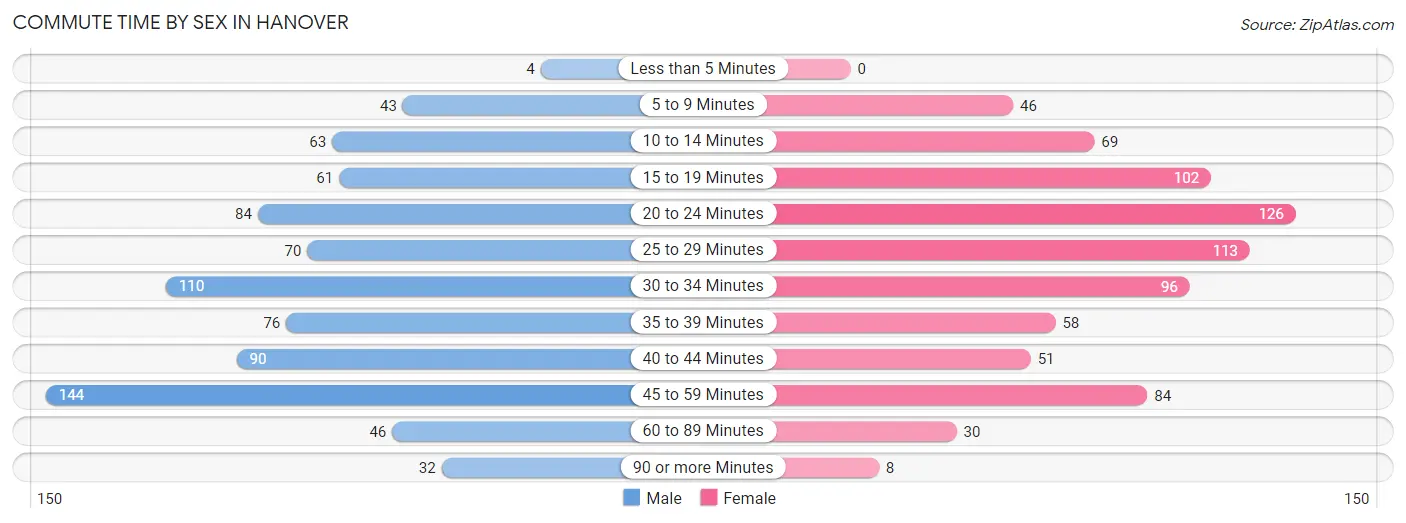
| Commute Time | Male | Female |
| Less than 5 Minutes | 4 (0.5%) | 0 (0.0%) |
| 5 to 9 Minutes | 43 (5.2%) | 46 (5.9%) |
| 10 to 14 Minutes | 63 (7.6%) | 69 (8.8%) |
| 15 to 19 Minutes | 61 (7.4%) | 102 (13.0%) |
| 20 to 24 Minutes | 84 (10.2%) | 126 (16.1%) |
| 25 to 29 Minutes | 70 (8.5%) | 113 (14.4%) |
| 30 to 34 Minutes | 110 (13.4%) | 96 (12.3%) |
| 35 to 39 Minutes | 76 (9.2%) | 58 (7.4%) |
| 40 to 44 Minutes | 90 (10.9%) | 51 (6.5%) |
| 45 to 59 Minutes | 144 (17.5%) | 84 (10.7%) |
| 60 to 89 Minutes | 46 (5.6%) | 30 (3.8%) |
| 90 or more Minutes | 32 (3.9%) | 8 (1.0%) |
Time of Departure to Work by Sex in Hanover
The most frequent times of departure to work in Hanover are 6:00 AM to 6:29 AM (172, 20.9%) for males and 7:00 AM to 7:29 AM (238, 30.4%) for females.
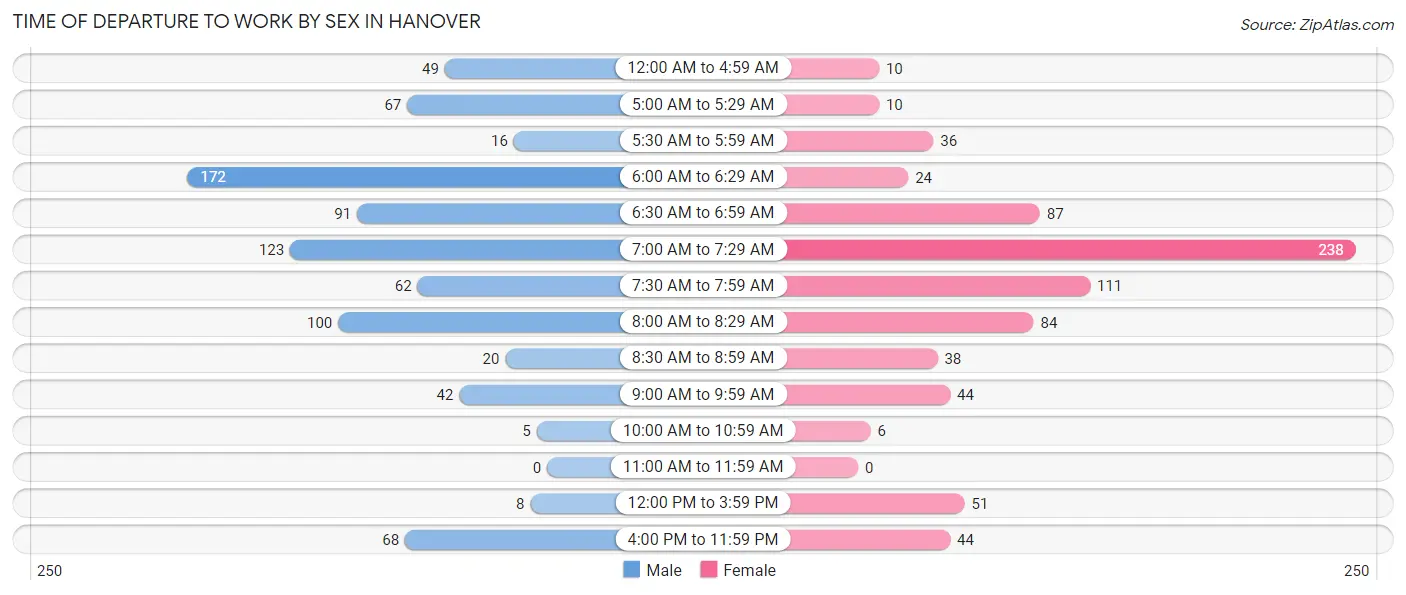
| Time of Departure | Male | Female |
| 12:00 AM to 4:59 AM | 49 (5.9%) | 10 (1.3%) |
| 5:00 AM to 5:29 AM | 67 (8.1%) | 10 (1.3%) |
| 5:30 AM to 5:59 AM | 16 (1.9%) | 36 (4.6%) |
| 6:00 AM to 6:29 AM | 172 (20.9%) | 24 (3.1%) |
| 6:30 AM to 6:59 AM | 91 (11.1%) | 87 (11.1%) |
| 7:00 AM to 7:29 AM | 123 (14.9%) | 238 (30.4%) |
| 7:30 AM to 7:59 AM | 62 (7.5%) | 111 (14.2%) |
| 8:00 AM to 8:29 AM | 100 (12.1%) | 84 (10.7%) |
| 8:30 AM to 8:59 AM | 20 (2.4%) | 38 (4.9%) |
| 9:00 AM to 9:59 AM | 42 (5.1%) | 44 (5.6%) |
| 10:00 AM to 10:59 AM | 5 (0.6%) | 6 (0.8%) |
| 11:00 AM to 11:59 AM | 0 (0.0%) | 0 (0.0%) |
| 12:00 PM to 3:59 PM | 8 (1.0%) | 51 (6.5%) |
| 4:00 PM to 11:59 PM | 68 (8.3%) | 44 (5.6%) |
| Total | 823 (100.0%) | 783 (100.0%) |
Housing Occupancy in Hanover
Occupancy by Ownership in Hanover
Of the total 1,141 dwellings in Hanover, owner-occupied units account for 1,027 (90.0%), while renter-occupied units make up 114 (10.0%).
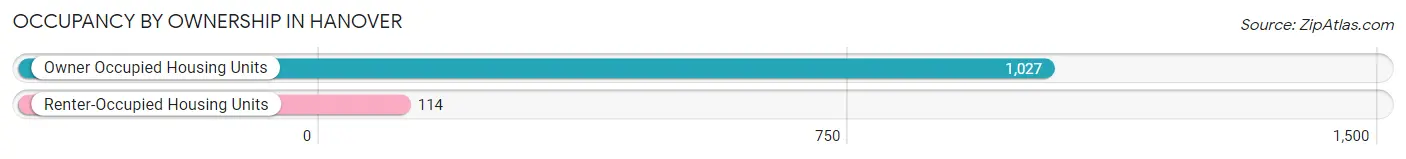
| Occupancy | # Housing Units | % Housing Units |
| Owner Occupied Housing Units | 1,027 | 90.0% |
| Renter-Occupied Housing Units | 114 | 10.0% |
| Total Occupied Housing Units | 1,141 | 100.0% |
Occupancy by Household Size in Hanover
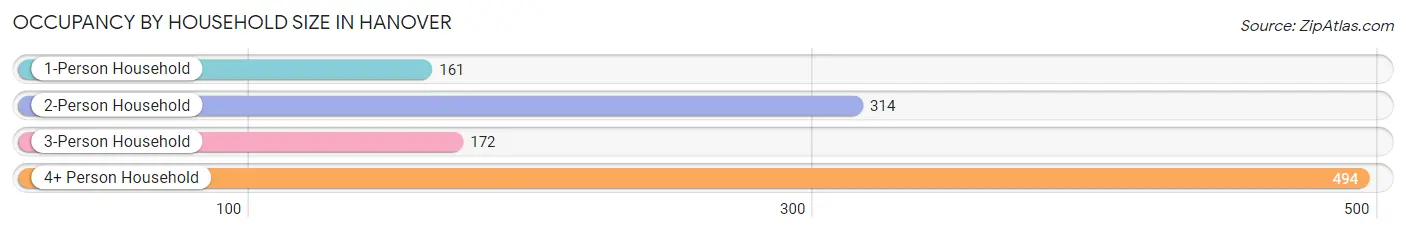
| Household Size | # Housing Units | % Housing Units |
| 1-Person Household | 161 | 14.1% |
| 2-Person Household | 314 | 27.5% |
| 3-Person Household | 172 | 15.1% |
| 4+ Person Household | 494 | 43.3% |
| Total Housing Units | 1,141 | 100.0% |
Occupancy by Ownership by Household Size in Hanover
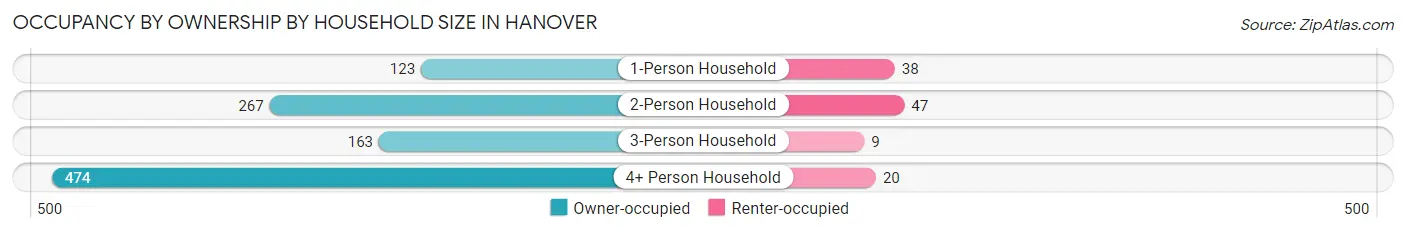
| Household Size | Owner-occupied | Renter-occupied |
| 1-Person Household | 123 (76.4%) | 38 (23.6%) |
| 2-Person Household | 267 (85.0%) | 47 (15.0%) |
| 3-Person Household | 163 (94.8%) | 9 (5.2%) |
| 4+ Person Household | 474 (96.0%) | 20 (4.1%) |
| Total Housing Units | 1,027 (90.0%) | 114 (10.0%) |
Occupancy by Educational Attainment in Hanover
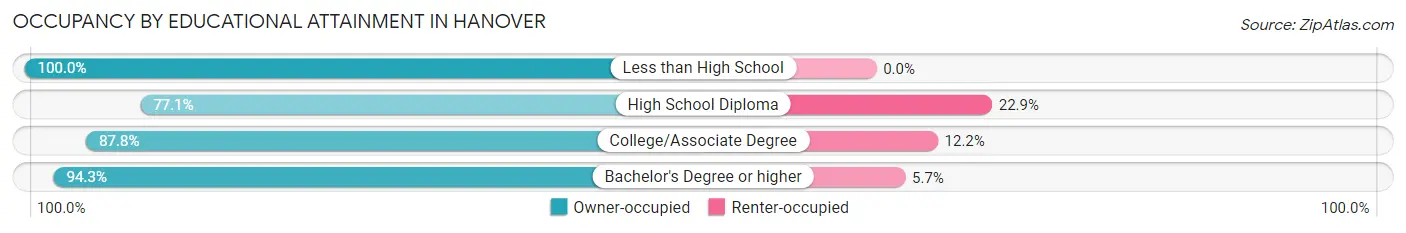
| Household Size | Owner-occupied | Renter-occupied |
| Less than High School | 21 (100.0%) | 0 (0.0%) |
| High School Diploma | 121 (77.1%) | 36 (22.9%) |
| College/Associate Degree | 310 (87.8%) | 43 (12.2%) |
| Bachelor's Degree or higher | 575 (94.3%) | 35 (5.7%) |
Occupancy by Age of Householder in Hanover
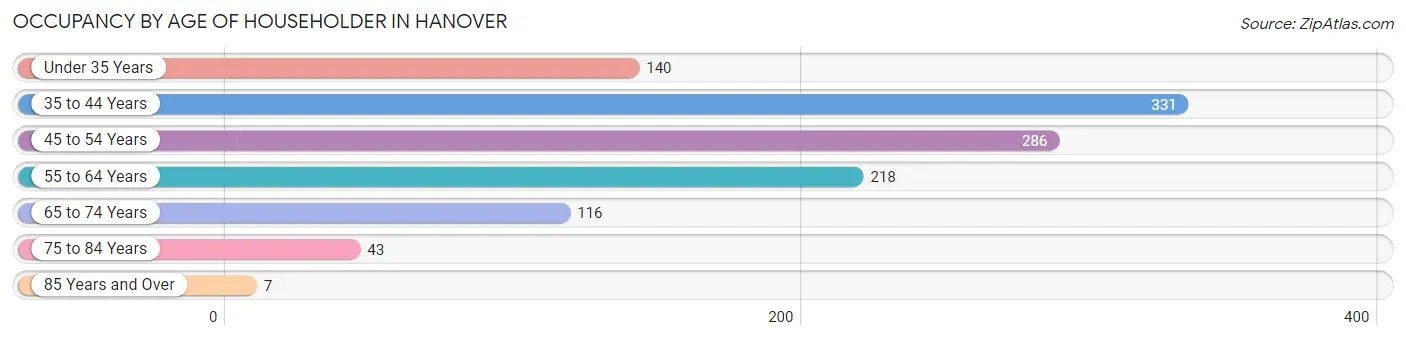
| Age Bracket | # Households | % Households |
| Under 35 Years | 140 | 12.3% |
| 35 to 44 Years | 331 | 29.0% |
| 45 to 54 Years | 286 | 25.1% |
| 55 to 64 Years | 218 | 19.1% |
| 65 to 74 Years | 116 | 10.2% |
| 75 to 84 Years | 43 | 3.8% |
| 85 Years and Over | 7 | 0.6% |
| Total | 1,141 | 100.0% |
Housing Finances in Hanover
Median Income by Occupancy in Hanover
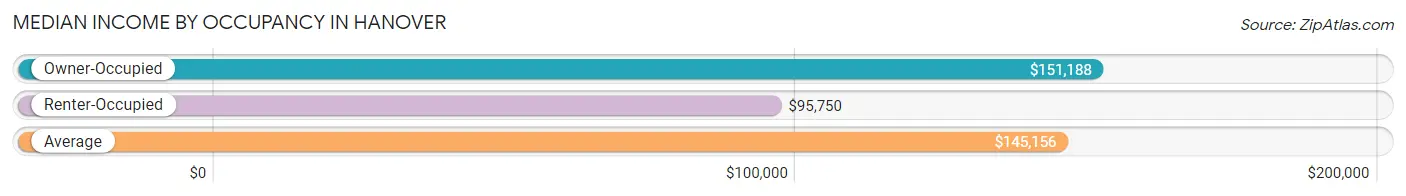
| Occupancy Type | # Households | Median Income |
| Owner-Occupied | 1,027 (90.0%) | $151,188 |
| Renter-Occupied | 114 (10.0%) | $95,750 |
| Average | 1,141 (100.0%) | $145,156 |
Occupancy by Householder Income Bracket in Hanover
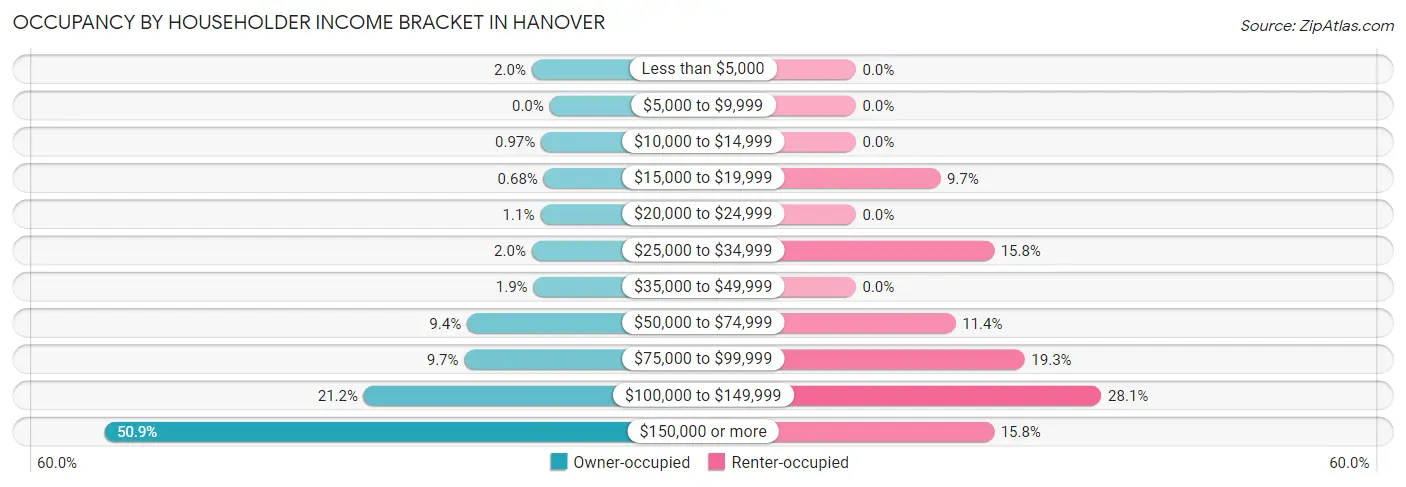
| Income Bracket | Owner-occupied | Renter-occupied |
| Less than $5,000 | 21 (2.0%) | 0 (0.0%) |
| $5,000 to $9,999 | 0 (0.0%) | 0 (0.0%) |
| $10,000 to $14,999 | 10 (1.0%) | 0 (0.0%) |
| $15,000 to $19,999 | 7 (0.7%) | 11 (9.7%) |
| $20,000 to $24,999 | 11 (1.1%) | 0 (0.0%) |
| $25,000 to $34,999 | 21 (2.0%) | 18 (15.8%) |
| $35,000 to $49,999 | 19 (1.8%) | 0 (0.0%) |
| $50,000 to $74,999 | 97 (9.4%) | 13 (11.4%) |
| $75,000 to $99,999 | 100 (9.7%) | 22 (19.3%) |
| $100,000 to $149,999 | 218 (21.2%) | 32 (28.1%) |
| $150,000 or more | 523 (50.9%) | 18 (15.8%) |
| Total | 1,027 (100.0%) | 114 (100.0%) |
Monthly Housing Cost Tiers in Hanover
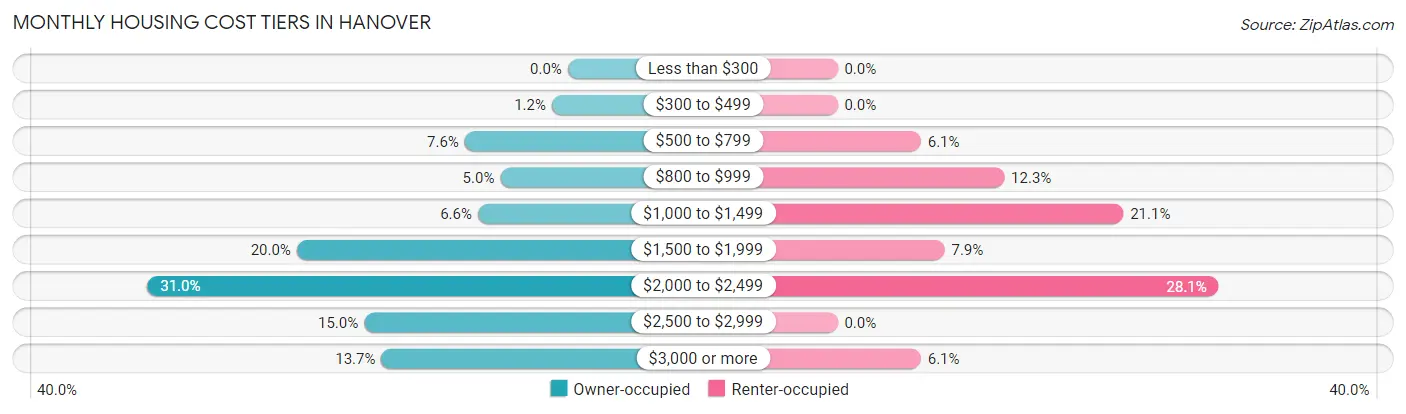
| Monthly Cost | Owner-occupied | Renter-occupied |
| Less than $300 | 0 (0.0%) | 0 (0.0%) |
| $300 to $499 | 12 (1.2%) | 0 (0.0%) |
| $500 to $799 | 78 (7.6%) | 7 (6.1%) |
| $800 to $999 | 51 (5.0%) | 14 (12.3%) |
| $1,000 to $1,499 | 68 (6.6%) | 24 (21.0%) |
| $1,500 to $1,999 | 205 (20.0%) | 9 (7.9%) |
| $2,000 to $2,499 | 318 (31.0%) | 32 (28.1%) |
| $2,500 to $2,999 | 154 (15.0%) | 0 (0.0%) |
| $3,000 or more | 141 (13.7%) | 7 (6.1%) |
| Total | 1,027 (100.0%) | 114 (100.0%) |
Physical Housing Characteristics in Hanover
Housing Structures in Hanover
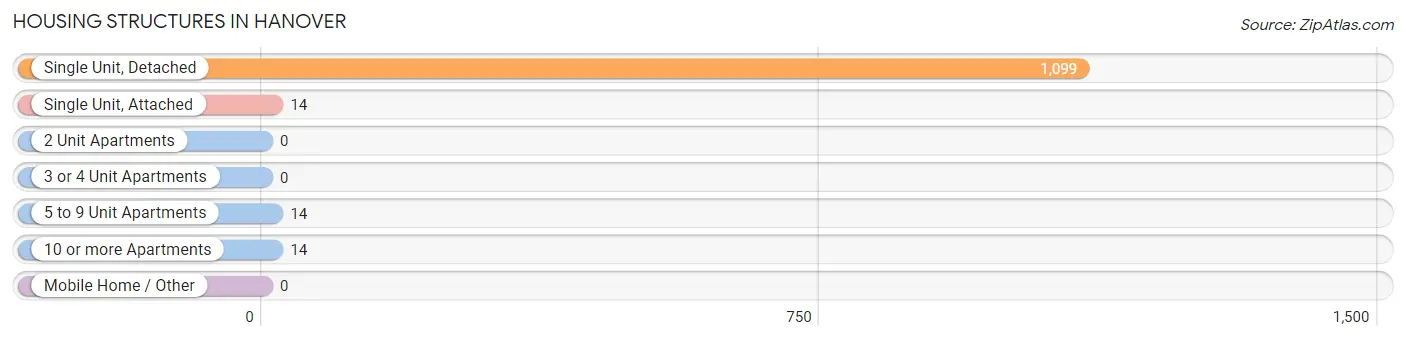
| Structure Type | # Housing Units | % Housing Units |
| Single Unit, Detached | 1,099 | 96.3% |
| Single Unit, Attached | 14 | 1.2% |
| 2 Unit Apartments | 0 | 0.0% |
| 3 or 4 Unit Apartments | 0 | 0.0% |
| 5 to 9 Unit Apartments | 14 | 1.2% |
| 10 or more Apartments | 14 | 1.2% |
| Mobile Home / Other | 0 | 0.0% |
| Total | 1,141 | 100.0% |
Housing Structures by Occupancy in Hanover
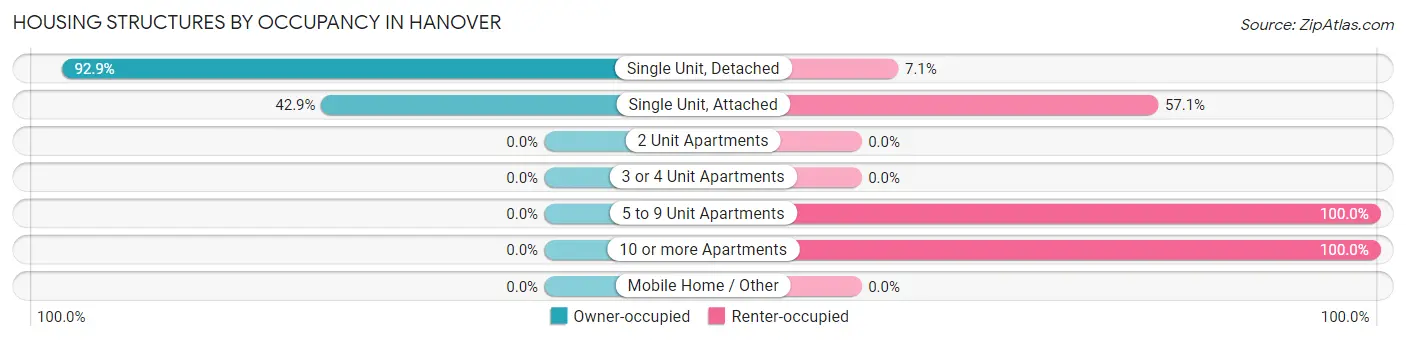
| Structure Type | Owner-occupied | Renter-occupied |
| Single Unit, Detached | 1,021 (92.9%) | 78 (7.1%) |
| Single Unit, Attached | 6 (42.9%) | 8 (57.1%) |
| 2 Unit Apartments | 0 (0.0%) | 0 (0.0%) |
| 3 or 4 Unit Apartments | 0 (0.0%) | 0 (0.0%) |
| 5 to 9 Unit Apartments | 0 (0.0%) | 14 (100.0%) |
| 10 or more Apartments | 0 (0.0%) | 14 (100.0%) |
| Mobile Home / Other | 0 (0.0%) | 0 (0.0%) |
| Total | 1,027 (90.0%) | 114 (10.0%) |
Housing Structures by Number of Rooms in Hanover
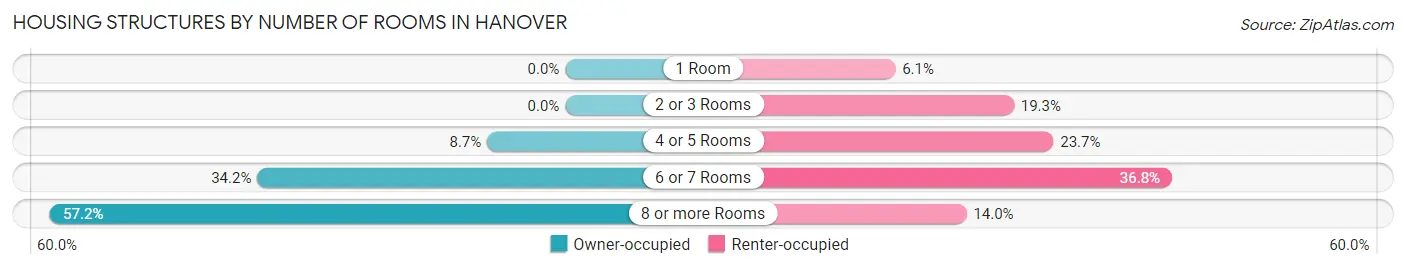
| Number of Rooms | Owner-occupied | Renter-occupied |
| 1 Room | 0 (0.0%) | 7 (6.1%) |
| 2 or 3 Rooms | 0 (0.0%) | 22 (19.3%) |
| 4 or 5 Rooms | 89 (8.7%) | 27 (23.7%) |
| 6 or 7 Rooms | 351 (34.2%) | 42 (36.8%) |
| 8 or more Rooms | 587 (57.2%) | 16 (14.0%) |
| Total | 1,027 (100.0%) | 114 (100.0%) |
Housing Structure by Heating Type in Hanover
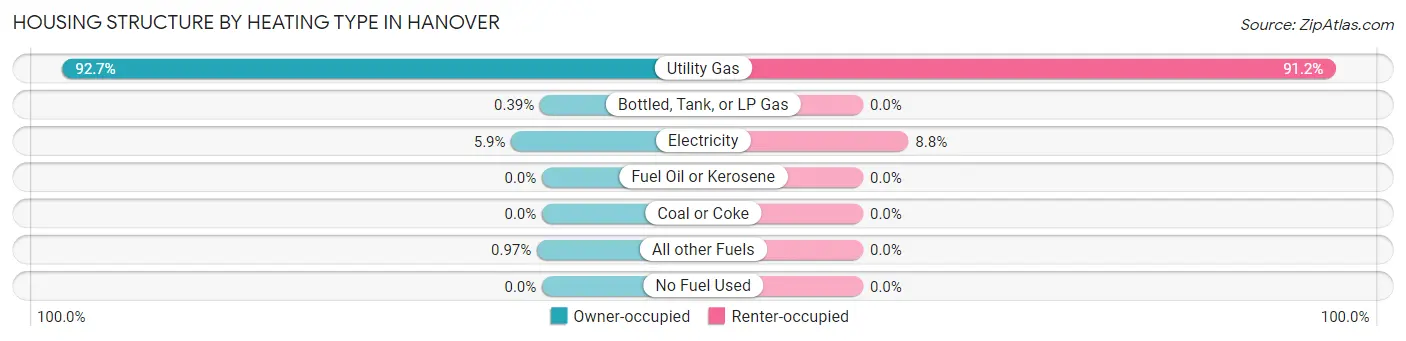
| Heating Type | Owner-occupied | Renter-occupied |
| Utility Gas | 952 (92.7%) | 104 (91.2%) |
| Bottled, Tank, or LP Gas | 4 (0.4%) | 0 (0.0%) |
| Electricity | 61 (5.9%) | 10 (8.8%) |
| Fuel Oil or Kerosene | 0 (0.0%) | 0 (0.0%) |
| Coal or Coke | 0 (0.0%) | 0 (0.0%) |
| All other Fuels | 10 (1.0%) | 0 (0.0%) |
| No Fuel Used | 0 (0.0%) | 0 (0.0%) |
| Total | 1,027 (100.0%) | 114 (100.0%) |
Household Vehicle Usage in Hanover
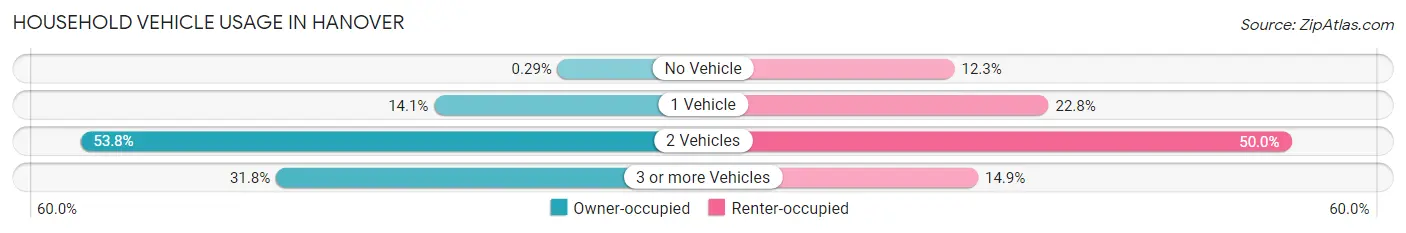
| Vehicles per Household | Owner-occupied | Renter-occupied |
| No Vehicle | 3 (0.3%) | 14 (12.3%) |
| 1 Vehicle | 145 (14.1%) | 26 (22.8%) |
| 2 Vehicles | 552 (53.7%) | 57 (50.0%) |
| 3 or more Vehicles | 327 (31.8%) | 17 (14.9%) |
| Total | 1,027 (100.0%) | 114 (100.0%) |
Real Estate & Mortgages in Hanover
Real Estate and Mortgage Overview in Hanover
| Characteristic | Without Mortgage | With Mortgage |
| Housing Units | 162 | 865 |
| Median Property Value | $392,000 | $397,200 |
| Median Household Income | $87,917 | $476 |
| Monthly Housing Costs | $786 | $141 |
| Real Estate Taxes | $4,829 | $3 |
Property Value by Mortgage Status in Hanover
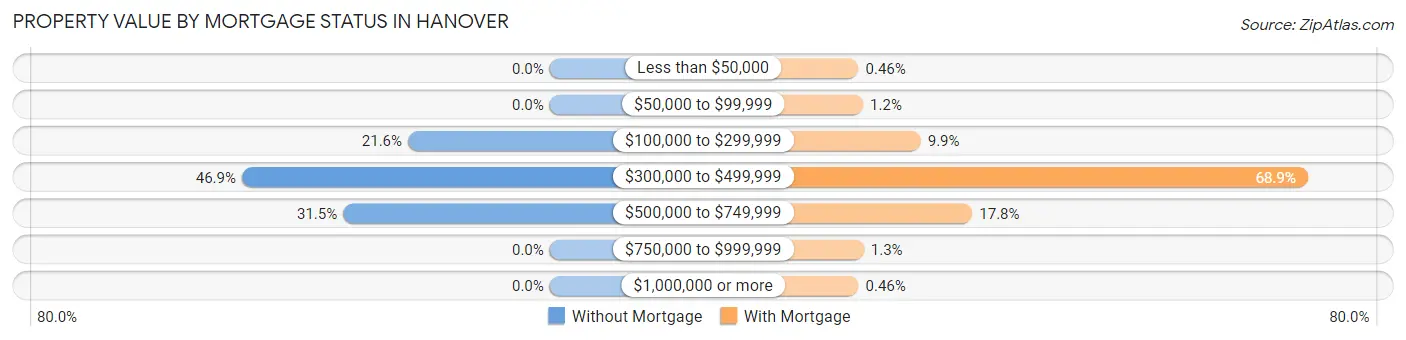
| Property Value | Without Mortgage | With Mortgage |
| Less than $50,000 | 0 (0.0%) | 4 (0.5%) |
| $50,000 to $99,999 | 0 (0.0%) | 10 (1.2%) |
| $100,000 to $299,999 | 35 (21.6%) | 86 (9.9%) |
| $300,000 to $499,999 | 76 (46.9%) | 596 (68.9%) |
| $500,000 to $749,999 | 51 (31.5%) | 154 (17.8%) |
| $750,000 to $999,999 | 0 (0.0%) | 11 (1.3%) |
| $1,000,000 or more | 0 (0.0%) | 4 (0.5%) |
| Total | 162 (100.0%) | 865 (100.0%) |
Household Income by Mortgage Status in Hanover
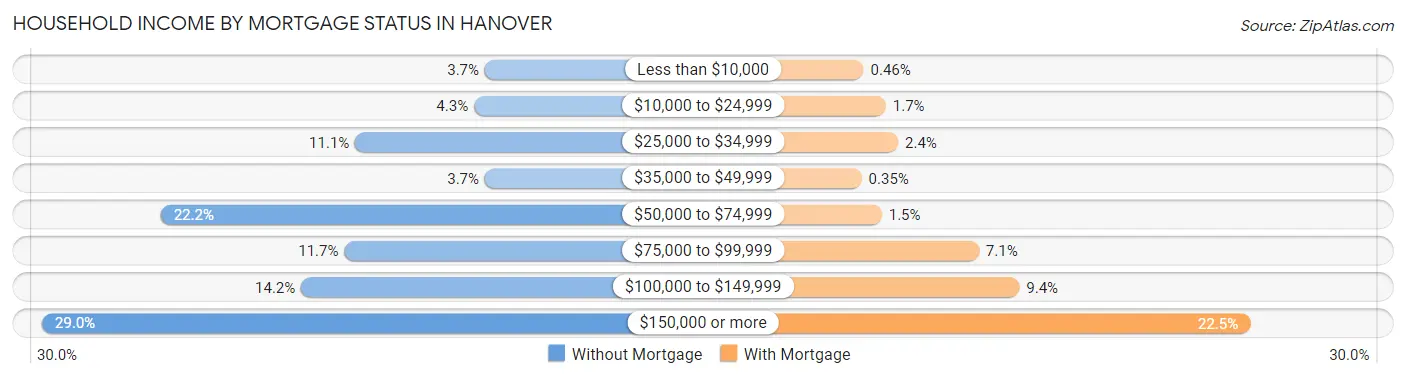
| Household Income | Without Mortgage | With Mortgage |
| Less than $10,000 | 6 (3.7%) | 4 (0.5%) |
| $10,000 to $24,999 | 7 (4.3%) | 15 (1.7%) |
| $25,000 to $34,999 | 18 (11.1%) | 21 (2.4%) |
| $35,000 to $49,999 | 6 (3.7%) | 3 (0.4%) |
| $50,000 to $74,999 | 36 (22.2%) | 13 (1.5%) |
| $75,000 to $99,999 | 19 (11.7%) | 61 (7.0%) |
| $100,000 to $149,999 | 23 (14.2%) | 81 (9.4%) |
| $150,000 or more | 47 (29.0%) | 195 (22.5%) |
| Total | 162 (100.0%) | 865 (100.0%) |
Property Value to Household Income Ratio in Hanover
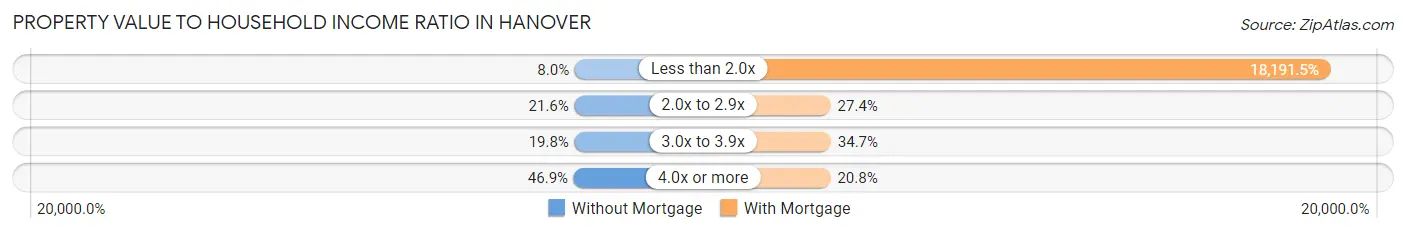
| Value-to-Income Ratio | Without Mortgage | With Mortgage |
| Less than 2.0x | 13 (8.0%) | 157,356 (18,191.5%) |
| 2.0x to 2.9x | 35 (21.6%) | 237 (27.4%) |
| 3.0x to 3.9x | 32 (19.8%) | 300 (34.7%) |
| 4.0x or more | 76 (46.9%) | 180 (20.8%) |
| Total | 162 (100.0%) | 865 (100.0%) |
Real Estate Taxes by Mortgage Status in Hanover
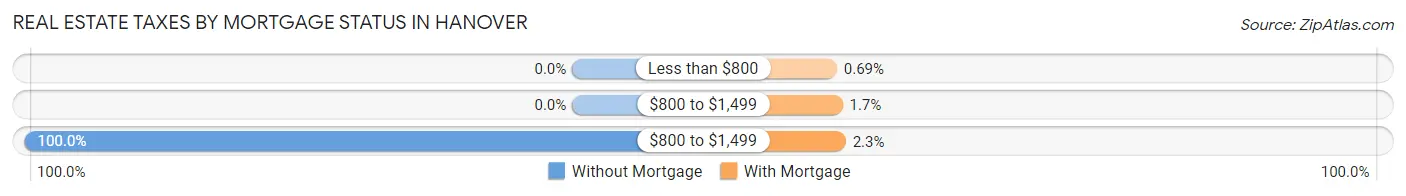
| Property Taxes | Without Mortgage | With Mortgage |
| Less than $800 | 0 (0.0%) | 6 (0.7%) |
| $800 to $1,499 | 0 (0.0%) | 15 (1.7%) |
| $800 to $1,499 | 162 (100.0%) | 20 (2.3%) |
| Total | 162 (100.0%) | 865 (100.0%) |
Health & Disability in Hanover
Health Insurance Coverage by Age in Hanover
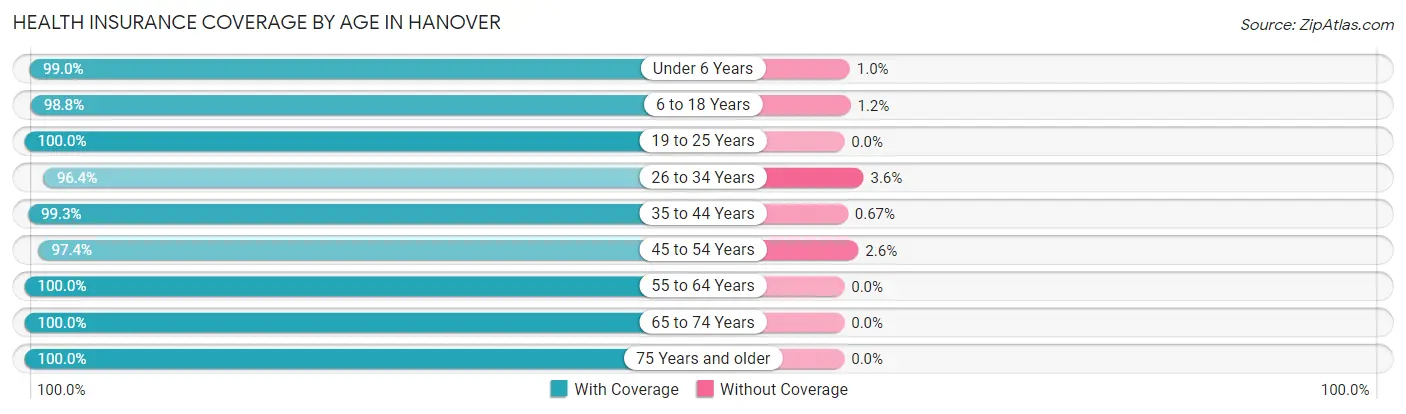
| Age Bracket | With Coverage | Without Coverage |
| Under 6 Years | 382 (99.0%) | 4 (1.0%) |
| 6 to 18 Years | 765 (98.8%) | 9 (1.2%) |
| 19 to 25 Years | 173 (100.0%) | 0 (0.0%) |
| 26 to 34 Years | 295 (96.4%) | 11 (3.6%) |
| 35 to 44 Years | 595 (99.3%) | 4 (0.7%) |
| 45 to 54 Years | 555 (97.4%) | 15 (2.6%) |
| 55 to 64 Years | 395 (100.0%) | 0 (0.0%) |
| 65 to 74 Years | 188 (100.0%) | 0 (0.0%) |
| 75 Years and older | 63 (100.0%) | 0 (0.0%) |
| Total | 3,411 (98.8%) | 43 (1.2%) |
Health Insurance Coverage by Citizenship Status in Hanover
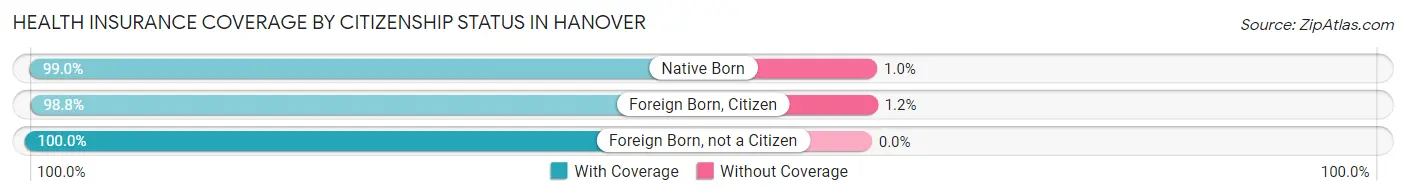
| Citizenship Status | With Coverage | Without Coverage |
| Native Born | 382 (99.0%) | 4 (1.0%) |
| Foreign Born, Citizen | 765 (98.8%) | 9 (1.2%) |
| Foreign Born, not a Citizen | 173 (100.0%) | 0 (0.0%) |
Health Insurance Coverage by Household Income in Hanover
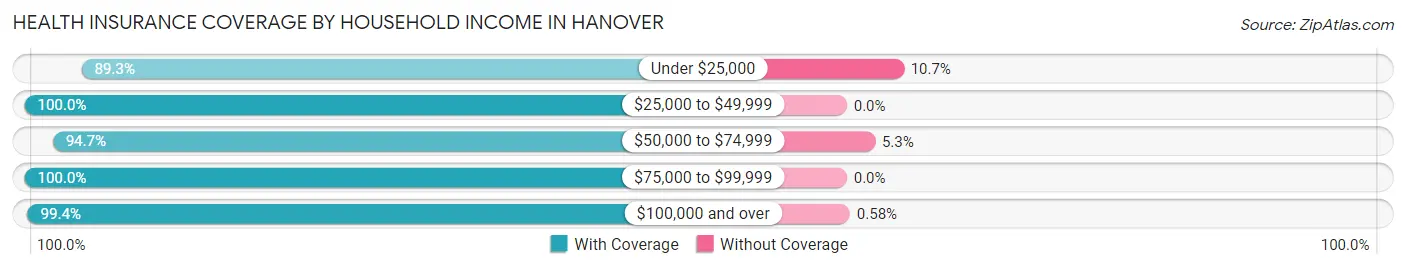
| Household Income | With Coverage | Without Coverage |
| Under $25,000 | 109 (89.3%) | 13 (10.7%) |
| $25,000 to $49,999 | 77 (100.0%) | 0 (0.0%) |
| $50,000 to $74,999 | 269 (94.7%) | 15 (5.3%) |
| $75,000 to $99,999 | 378 (100.0%) | 0 (0.0%) |
| $100,000 and over | 2,575 (99.4%) | 15 (0.6%) |
Public vs Private Health Insurance Coverage by Age in Hanover
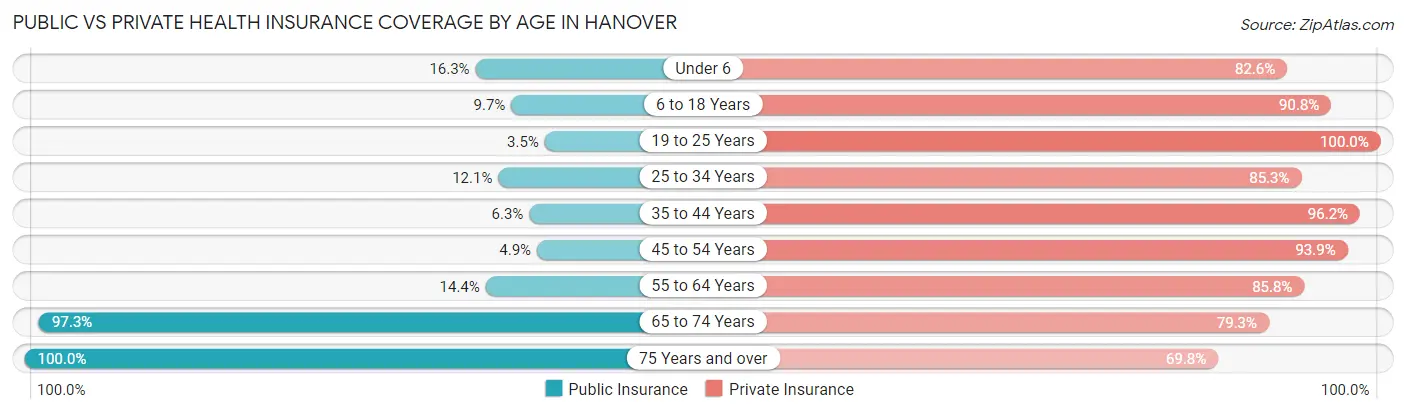
| Age Bracket | Public Insurance | Private Insurance |
| Under 6 | 63 (16.3%) | 319 (82.6%) |
| 6 to 18 Years | 75 (9.7%) | 703 (90.8%) |
| 19 to 25 Years | 6 (3.5%) | 173 (100.0%) |
| 25 to 34 Years | 37 (12.1%) | 261 (85.3%) |
| 35 to 44 Years | 38 (6.3%) | 576 (96.2%) |
| 45 to 54 Years | 28 (4.9%) | 535 (93.9%) |
| 55 to 64 Years | 57 (14.4%) | 339 (85.8%) |
| 65 to 74 Years | 183 (97.3%) | 149 (79.3%) |
| 75 Years and over | 63 (100.0%) | 44 (69.8%) |
| Total | 550 (15.9%) | 3,099 (89.7%) |
Disability Status by Sex by Age in Hanover
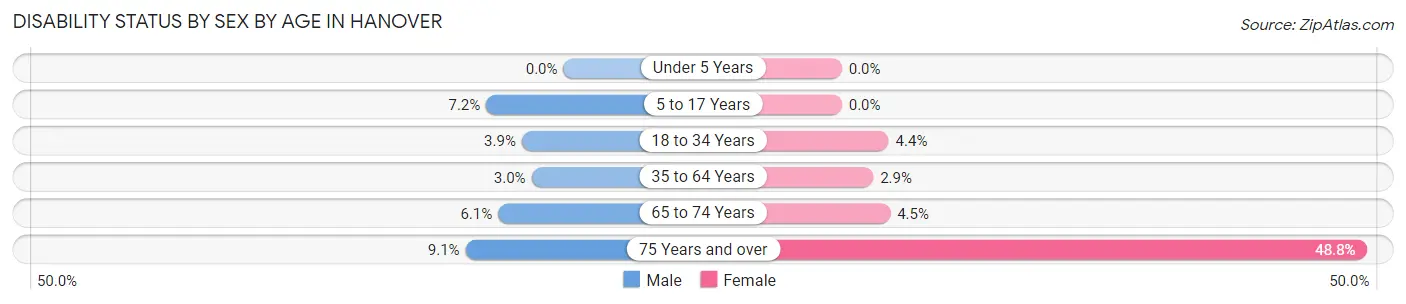
| Age Bracket | Male | Female |
| Under 5 Years | 0 (0.0%) | 0 (0.0%) |
| 5 to 17 Years | 32 (7.2%) | 0 (0.0%) |
| 18 to 34 Years | 10 (3.9%) | 12 (4.3%) |
| 35 to 64 Years | 23 (3.0%) | 23 (2.9%) |
| 65 to 74 Years | 6 (6.1%) | 4 (4.5%) |
| 75 Years and over | 2 (9.1%) | 20 (48.8%) |
Disability Class by Sex by Age in Hanover
Disability Class: Hearing Difficulty
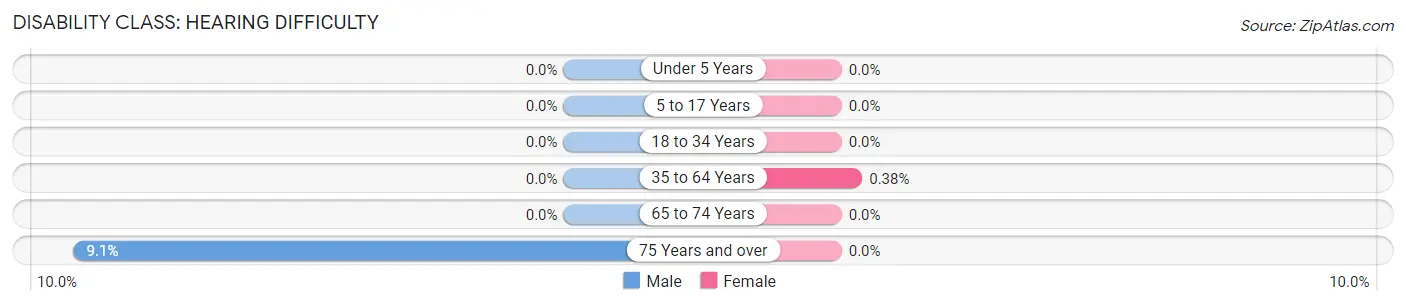
| Age Bracket | Male | Female |
| Under 5 Years | 0 (0.0%) | 0 (0.0%) |
| 5 to 17 Years | 0 (0.0%) | 0 (0.0%) |
| 18 to 34 Years | 0 (0.0%) | 0 (0.0%) |
| 35 to 64 Years | 0 (0.0%) | 3 (0.4%) |
| 65 to 74 Years | 0 (0.0%) | 0 (0.0%) |
| 75 Years and over | 2 (9.1%) | 0 (0.0%) |
Disability Class: Vision Difficulty
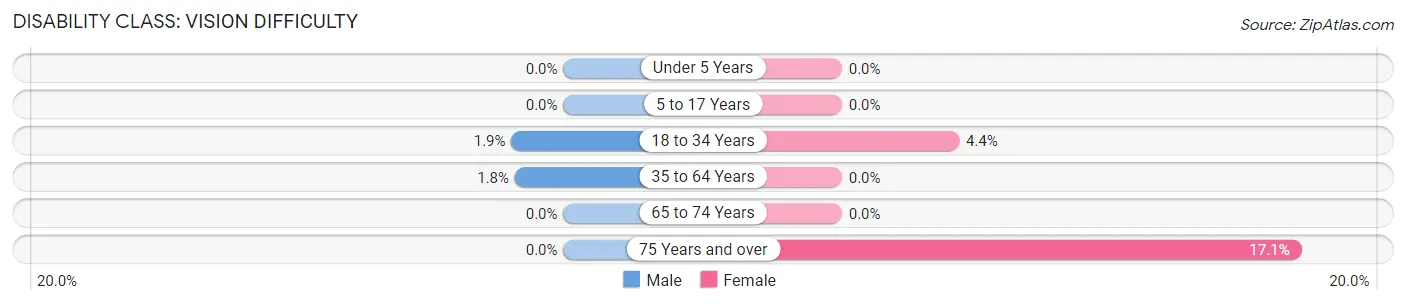
| Age Bracket | Male | Female |
| Under 5 Years | 0 (0.0%) | 0 (0.0%) |
| 5 to 17 Years | 0 (0.0%) | 0 (0.0%) |
| 18 to 34 Years | 5 (1.9%) | 12 (4.3%) |
| 35 to 64 Years | 14 (1.8%) | 0 (0.0%) |
| 65 to 74 Years | 0 (0.0%) | 0 (0.0%) |
| 75 Years and over | 0 (0.0%) | 7 (17.1%) |
Disability Class: Cognitive Difficulty
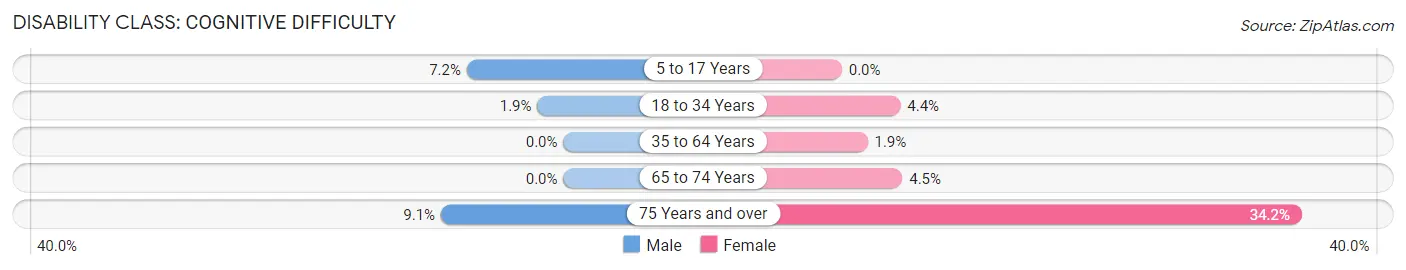
| Age Bracket | Male | Female |
| 5 to 17 Years | 32 (7.2%) | 0 (0.0%) |
| 18 to 34 Years | 5 (1.9%) | 12 (4.3%) |
| 35 to 64 Years | 0 (0.0%) | 15 (1.9%) |
| 65 to 74 Years | 0 (0.0%) | 4 (4.5%) |
| 75 Years and over | 2 (9.1%) | 14 (34.2%) |
Disability Class: Ambulatory Difficulty
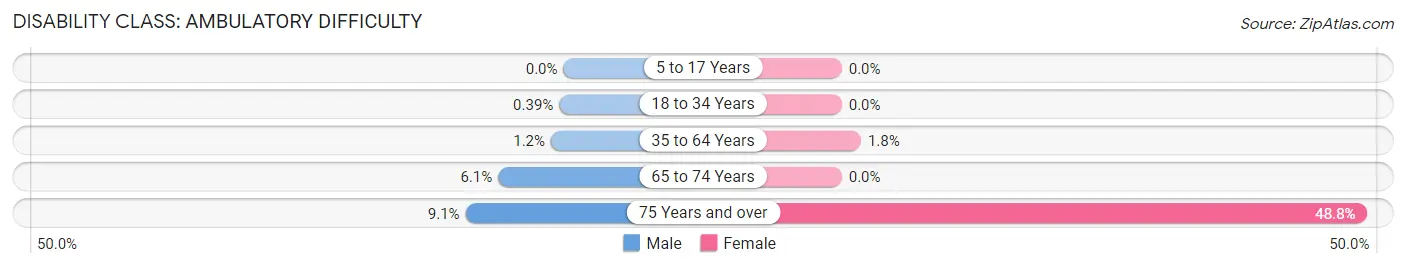
| Age Bracket | Male | Female |
| 5 to 17 Years | 0 (0.0%) | 0 (0.0%) |
| 18 to 34 Years | 1 (0.4%) | 0 (0.0%) |
| 35 to 64 Years | 9 (1.2%) | 14 (1.8%) |
| 65 to 74 Years | 6 (6.1%) | 0 (0.0%) |
| 75 Years and over | 2 (9.1%) | 20 (48.8%) |
Disability Class: Self-Care Difficulty
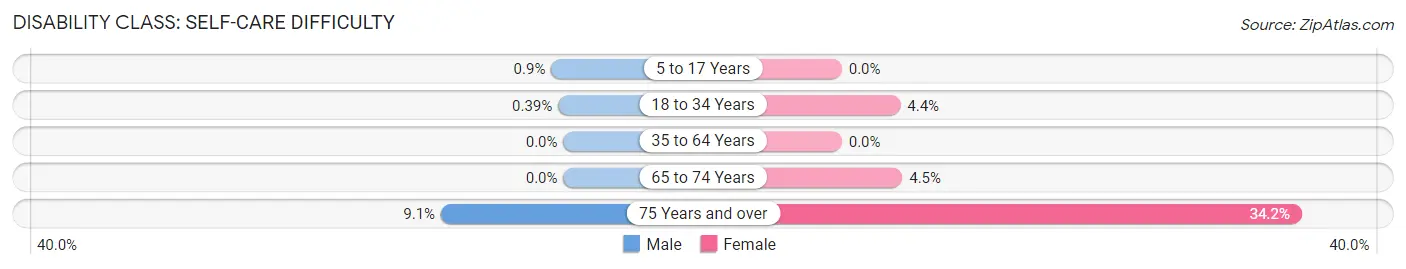
| Age Bracket | Male | Female |
| 5 to 17 Years | 4 (0.9%) | 0 (0.0%) |
| 18 to 34 Years | 1 (0.4%) | 12 (4.3%) |
| 35 to 64 Years | 0 (0.0%) | 0 (0.0%) |
| 65 to 74 Years | 0 (0.0%) | 4 (4.5%) |
| 75 Years and over | 2 (9.1%) | 14 (34.2%) |
Technology Access in Hanover
Computing Device Access in Hanover
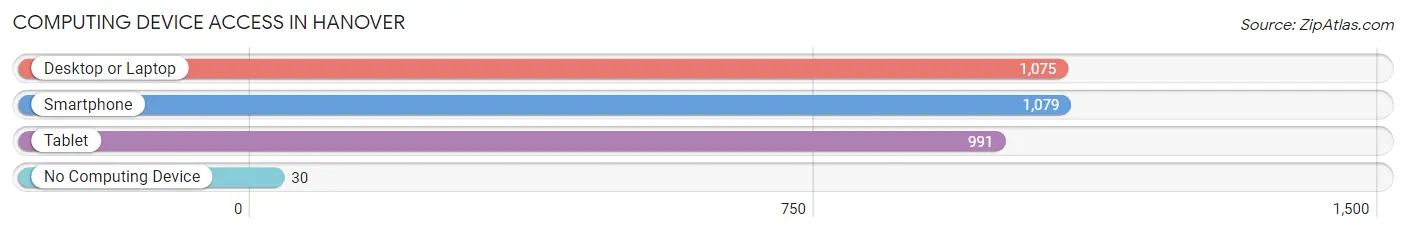
| Device Type | # Households | % Households |
| Desktop or Laptop | 1,075 | 94.2% |
| Smartphone | 1,079 | 94.6% |
| Tablet | 991 | 86.9% |
| No Computing Device | 30 | 2.6% |
| Total | 1,141 | 100.0% |
Internet Access in Hanover
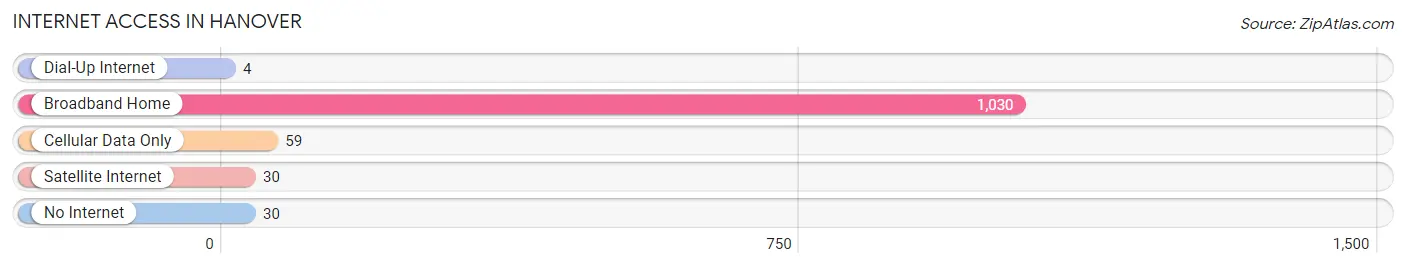
| Internet Type | # Households | % Households |
| Dial-Up Internet | 4 | 0.4% |
| Broadband Home | 1,030 | 90.3% |
| Cellular Data Only | 59 | 5.2% |
| Satellite Internet | 30 | 2.6% |
| No Internet | 30 | 2.6% |
| Total | 1,141 | 100.0% |
Hanover Summary
Hanover, Minnesota is a small city located in the northwestern corner of Hennepin County, Minnesota. It is part of the Twin Cities metropolitan area and is located about 20 miles northwest of Minneapolis. The city has a population of approximately 5,000 people and is home to a variety of businesses, including a large industrial park.
Geography
Hanover is located in the northwestern corner of Hennepin County, Minnesota. It is bordered by the cities of Dayton, Maple Grove, and Rogers. The city is situated on the banks of the Crow River, which flows through the city and is a popular recreational spot for fishing and boating. The city is also located near the Mississippi River, which is a major source of water for the city. The city is located in a flat, open area with rolling hills and is surrounded by farmland.
Economy
Hanover is home to a variety of businesses, including a large industrial park. The city is home to several manufacturing companies, including a plastics manufacturer, a metal fabricator, and a food processor. The city also has a number of retail stores, restaurants, and other businesses. The city is also home to a number of medical facilities, including a hospital and several clinics.
Demographics
As of the 2010 census, the population of Hanover was 5,000 people. The population is predominantly white, with a small percentage of African Americans, Asians, and Hispanics. The median household income is $60,000, and the median home value is $200,000. The city has a low unemployment rate of 3.5%.
History
Hanover was first settled in the late 1800s by German immigrants. The city was originally known as “New Hanover” and was incorporated in 1887. The city was named after the city of Hanover in Germany. The city grew rapidly in the early 1900s, and by the 1920s it was home to a variety of businesses, including a flour mill, a creamery, and a brickyard. The city continued to grow throughout the 20th century, and today it is a thriving community with a variety of businesses and amenities.
Common Questions
What is the Total Population of Hanover?
Total Population of Hanover is 3,454.
What is the Total Male Population of Hanover?
Total Male Population of Hanover is 1,696.
What is the Total Female Population of Hanover?
Total Female Population of Hanover is 1,758.
What is the Ratio of Males per 100 Females in Hanover?
There are 96.47 Males per 100 Females in Hanover.
What is the Ratio of Females per 100 Males in Hanover?
There are 103.66 Females per 100 Males in Hanover.
What is the Median Population Age in Hanover?
Median Population Age in Hanover is 36.4 Years.
What is the Average Family Size in Hanover
Average Family Size in Hanover is 3.4 People.
What is the Average Household Size in Hanover
Average Household Size in Hanover is 3.0 People.
What is Per Capita Income in Hanover?
Per Capita income in Hanover is $52,891.
What is the Median Family Income in Hanover?
Median Family Income in Hanover is $156,827.
What is the Median Household income in Hanover?
Median Household Income in Hanover is $145,156.
What is Income or Wage Gap in Hanover?
Income or Wage Gap in Hanover is 32.1%.
Women in Hanover earn 67.9 cents for every dollar earned by a man.
What is Inequality or Gini Index in Hanover?
Inequality or Gini Index in Hanover is 0.35.
How Large is the Labor Force in Hanover?
There are 1,987 People in the Labor Forcein in Hanover.
What is the Percentage of People in the Labor Force in Hanover?
79.8% of People are in the Labor Force in Hanover.
What is the Unemployment Rate in Hanover?
Unemployment Rate in Hanover is 0.8%.