Zip Codes with the Highest Percentage of Households with Income Above $100,000 in Indiana
RELATED REPORTS & OPTIONS
Household Income | $100k+
Indiana
Compare Zip Codes
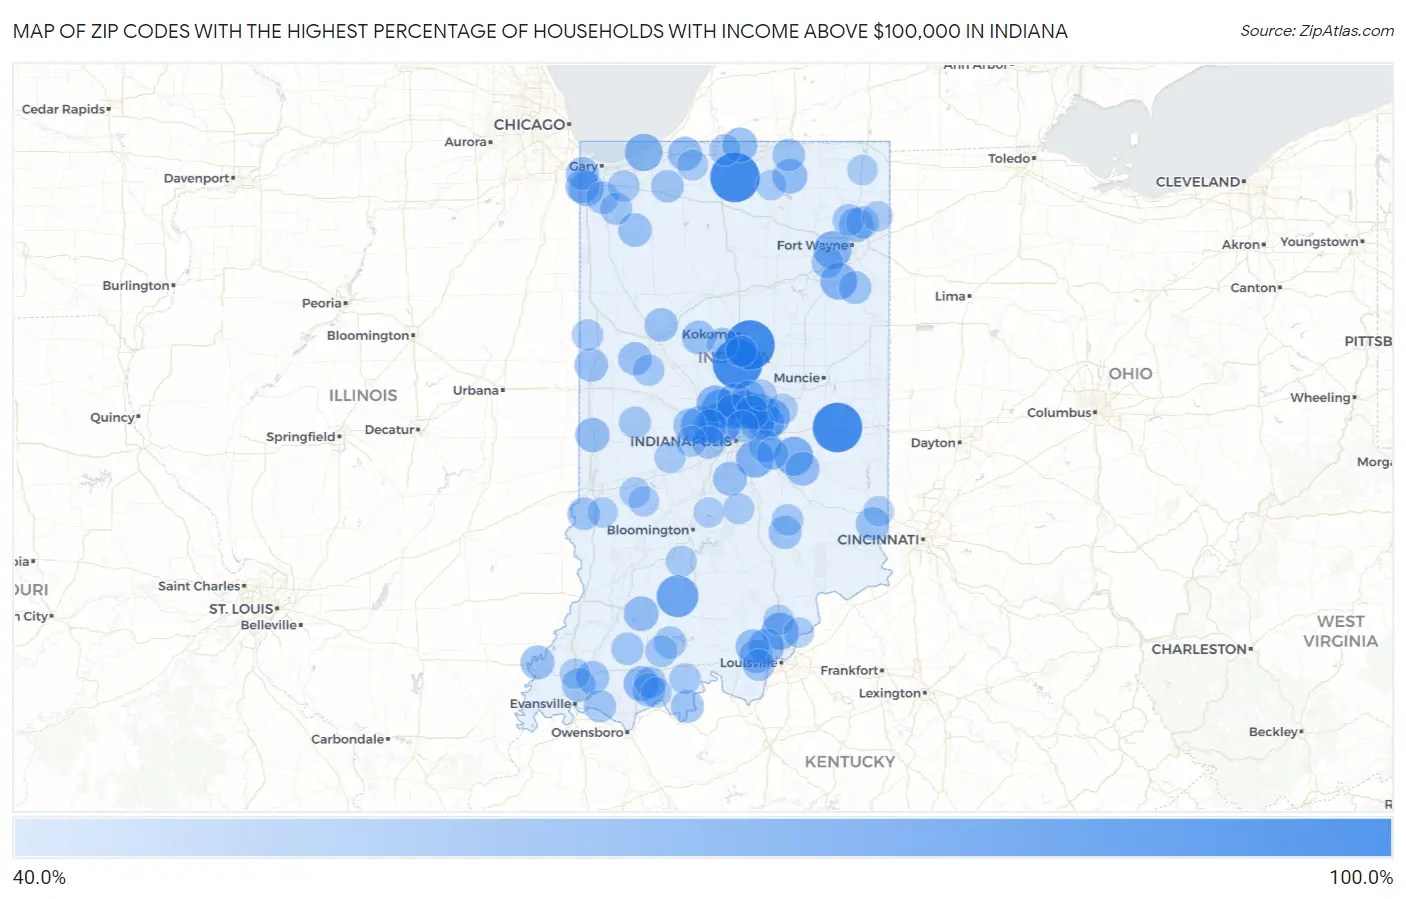
Map of Zip Codes with the Highest Percentage of Households with Income Above $100,000 in Indiana
0.0%
100.0%
Zip Codes with the Highest Percentage of Households with Income Above $100,000 in Indiana
| Zip Code | Households with Income > $100k | vs State | vs National | |
| 1. | 46045 | 100.0% | 30.7%(+69.3)#1 | 37.3%(+62.7)#28 |
| 2. | 46595 | 100.0% | 30.7%(+69.3)#2 | 37.3%(+62.7)#83 |
| 3. | 47366 | 100.0% | 30.7%(+69.3)#3 | 37.3%(+62.7)#103 |
| 4. | 46937 | 100.0% | 30.7%(+69.3)#4 | 37.3%(+62.7)#127 |
| 5. | 47437 | 76.7% | 30.7%(+46.0)#5 | 37.3%(+39.4)#486 |
| 6. | 46278 | 76.2% | 30.7%(+45.5)#6 | 37.3%(+38.9)#511 |
| 7. | 46077 | 68.8% | 30.7%(+38.1)#7 | 37.3%(+31.5)#1,073 |
| 8. | 46144 | 67.7% | 30.7%(+37.0)#8 | 37.3%(+30.4)#1,205 |
| 9. | 46033 | 66.9% | 30.7%(+36.2)#9 | 37.3%(+29.6)#1,271 |
| 10. | 46814 | 65.1% | 30.7%(+34.4)#10 | 37.3%(+27.8)#1,525 |
| 11. | 46167 | 65.0% | 30.7%(+34.3)#11 | 37.3%(+27.7)#1,541 |
| 12. | 46259 | 64.5% | 30.7%(+33.8)#12 | 37.3%(+27.2)#1,613 |
| 13. | 46301 | 64.0% | 30.7%(+33.3)#13 | 37.3%(+26.7)#1,689 |
| 14. | 46037 | 63.9% | 30.7%(+33.2)#14 | 37.3%(+26.6)#1,695 |
| 15. | 46040 | 63.5% | 30.7%(+32.8)#15 | 37.3%(+26.2)#1,755 |
| 16. | 47143 | 62.9% | 30.7%(+32.2)#16 | 37.3%(+25.6)#1,868 |
| 17. | 46791 | 62.1% | 30.7%(+31.4)#17 | 37.3%(+24.8)#1,994 |
| 18. | 46075 | 61.4% | 30.7%(+30.7)#18 | 37.3%(+24.1)#2,105 |
| 19. | 46074 | 60.0% | 30.7%(+29.3)#19 | 37.3%(+22.7)#2,356 |
| 20. | 46055 | 60.0% | 30.7%(+29.3)#20 | 37.3%(+22.7)#2,368 |
| 21. | 47119 | 58.4% | 30.7%(+27.7)#21 | 37.3%(+21.1)#2,688 |
| 22. | 47552 | 57.5% | 30.7%(+26.8)#22 | 37.3%(+20.2)#2,883 |
| 23. | 46032 | 57.0% | 30.7%(+26.3)#23 | 37.3%(+19.7)#2,971 |
| 24. | 46373 | 56.2% | 30.7%(+25.5)#24 | 37.3%(+18.9)#3,156 |
| 25. | 46530 | 55.9% | 30.7%(+25.2)#25 | 37.3%(+18.6)#3,205 |
| 26. | 46543 | 55.9% | 30.7%(+25.2)#26 | 37.3%(+18.6)#3,218 |
| 27. | 47519 | 55.8% | 30.7%(+25.1)#27 | 37.3%(+18.5)#3,259 |
| 28. | 46845 | 54.9% | 30.7%(+24.2)#28 | 37.3%(+17.6)#3,474 |
| 29. | 47854 | 54.9% | 30.7%(+24.2)#29 | 37.3%(+17.6)#3,490 |
| 30. | 46371 | 54.0% | 30.7%(+23.3)#30 | 37.3%(+16.7)#3,727 |
| 31. | 46146 | 54.0% | 30.7%(+23.3)#31 | 37.3%(+16.7)#3,734 |
| 32. | 47616 | 53.9% | 30.7%(+23.2)#32 | 37.3%(+16.6)#3,757 |
| 33. | 46062 | 53.6% | 30.7%(+22.9)#33 | 37.3%(+16.3)#3,801 |
| 34. | 46311 | 53.6% | 30.7%(+22.9)#34 | 37.3%(+16.3)#3,805 |
| 35. | 46106 | 53.6% | 30.7%(+22.9)#35 | 37.3%(+16.3)#3,812 |
| 36. | 46236 | 53.5% | 30.7%(+22.8)#36 | 37.3%(+16.2)#3,832 |
| 37. | 46112 | 53.3% | 30.7%(+22.6)#37 | 37.3%(+16.0)#3,882 |
| 38. | 47122 | 53.3% | 30.7%(+22.6)#38 | 37.3%(+16.0)#3,894 |
| 39. | 47124 | 53.3% | 30.7%(+22.6)#39 | 37.3%(+16.0)#3,899 |
| 40. | 46038 | 53.0% | 30.7%(+22.3)#40 | 37.3%(+15.7)#3,959 |
| 41. | 47725 | 52.8% | 30.7%(+22.1)#41 | 37.3%(+15.5)#4,025 |
| 42. | 46920 | 52.8% | 30.7%(+22.1)#42 | 37.3%(+15.5)#4,038 |
| 43. | 47991 | 52.7% | 30.7%(+22.0)#43 | 37.3%(+15.4)#4,074 |
| 44. | 46392 | 52.5% | 30.7%(+21.8)#44 | 37.3%(+15.2)#4,119 |
| 45. | 47920 | 52.3% | 30.7%(+21.6)#45 | 37.3%(+15.0)#4,178 |
| 46. | 47992 | 52.3% | 30.7%(+21.6)#46 | 37.3%(+15.0)#4,179 |
| 47. | 47022 | 52.2% | 30.7%(+21.5)#47 | 37.3%(+14.9)#4,196 |
| 48. | 47550 | 51.8% | 30.7%(+21.1)#48 | 37.3%(+14.5)#4,314 |
| 49. | 47613 | 51.7% | 30.7%(+21.0)#49 | 37.3%(+14.4)#4,344 |
| 50. | 47236 | 51.5% | 30.7%(+20.8)#50 | 37.3%(+14.2)#4,418 |
| 51. | 46149 | 51.3% | 30.7%(+20.6)#51 | 37.3%(+14.0)#4,463 |
| 52. | 46321 | 51.1% | 30.7%(+20.4)#52 | 37.3%(+13.8)#4,508 |
| 53. | 47574 | 50.8% | 30.7%(+20.1)#53 | 37.3%(+13.5)#4,619 |
| 54. | 46731 | 50.7% | 30.7%(+20.0)#54 | 37.3%(+13.4)#4,644 |
| 55. | 46123 | 50.1% | 30.7%(+19.4)#55 | 37.3%(+12.8)#4,793 |
| 56. | 47869 | 50.0% | 30.7%(+19.3)#56 | 37.3%(+12.7)#4,867 |
| 57. | 46163 | 49.8% | 30.7%(+19.1)#57 | 37.3%(+12.5)#4,925 |
| 58. | 46382 | 49.7% | 30.7%(+19.0)#58 | 37.3%(+12.4)#4,963 |
| 59. | 46540 | 49.6% | 30.7%(+18.9)#59 | 37.3%(+12.3)#4,985 |
| 60. | 47590 | 49.4% | 30.7%(+18.7)#60 | 37.3%(+12.1)#5,075 |
| 61. | 46307 | 49.2% | 30.7%(+18.5)#61 | 37.3%(+11.9)#5,101 |
| 62. | 46765 | 49.2% | 30.7%(+18.5)#62 | 37.3%(+11.9)#5,112 |
| 63. | 47630 | 49.1% | 30.7%(+18.4)#63 | 37.3%(+11.8)#5,132 |
| 64. | 47521 | 48.8% | 30.7%(+18.1)#64 | 37.3%(+11.5)#5,251 |
| 65. | 46341 | 48.4% | 30.7%(+17.7)#65 | 37.3%(+11.1)#5,356 |
| 66. | 46220 | 48.1% | 30.7%(+17.4)#66 | 37.3%(+10.8)#5,452 |
| 67. | 46748 | 48.1% | 30.7%(+17.4)#67 | 37.3%(+10.8)#5,467 |
| 68. | 47579 | 48.1% | 30.7%(+17.4)#68 | 37.3%(+10.8)#5,472 |
| 69. | 46783 | 47.9% | 30.7%(+17.2)#69 | 37.3%(+10.6)#5,543 |
| 70. | 47575 | 47.8% | 30.7%(+17.1)#70 | 37.3%(+10.5)#5,583 |
| 71. | 46130 | 47.5% | 30.7%(+16.8)#71 | 37.3%(+10.2)#5,681 |
| 72. | 46979 | 47.4% | 30.7%(+16.7)#72 | 37.3%(+10.1)#5,708 |
| 73. | 47989 | 47.3% | 30.7%(+16.6)#73 | 37.3%(+10.00)#5,754 |
| 74. | 47136 | 47.2% | 30.7%(+16.5)#74 | 37.3%(+9.90)#5,780 |
| 75. | 46385 | 47.0% | 30.7%(+16.3)#75 | 37.3%(+9.70)#5,821 |
| 76. | 47244 | 46.9% | 30.7%(+16.2)#76 | 37.3%(+9.60)#5,884 |
| 77. | 46624 | 46.9% | 30.7%(+16.2)#77 | 37.3%(+9.60)#5,896 |
| 78. | 47917 | 46.7% | 30.7%(+16.0)#78 | 37.3%(+9.40)#5,962 |
| 79. | 47981 | 46.6% | 30.7%(+15.9)#79 | 37.3%(+9.30)#5,994 |
| 80. | 46060 | 45.5% | 30.7%(+14.8)#80 | 37.3%(+8.20)#6,390 |
| 81. | 46068 | 45.5% | 30.7%(+14.8)#81 | 37.3%(+8.20)#6,419 |
| 82. | 46122 | 45.4% | 30.7%(+14.7)#82 | 37.3%(+8.10)#6,451 |
| 83. | 46164 | 45.4% | 30.7%(+14.7)#83 | 37.3%(+8.10)#6,465 |
| 84. | 47514 | 45.4% | 30.7%(+14.7)#84 | 37.3%(+8.10)#6,474 |
| 85. | 47462 | 45.0% | 30.7%(+14.3)#85 | 37.3%(+7.70)#6,632 |
| 86. | 46128 | 45.0% | 30.7%(+14.3)#86 | 37.3%(+7.70)#6,639 |
| 87. | 46365 | 45.0% | 30.7%(+14.3)#87 | 37.3%(+7.70)#6,646 |
| 88. | 47531 | 44.2% | 30.7%(+13.5)#88 | 37.3%(+6.90)#6,944 |
| 89. | 47126 | 44.0% | 30.7%(+13.3)#89 | 37.3%(+6.70)#7,020 |
| 90. | 46553 | 43.9% | 30.7%(+13.2)#90 | 37.3%(+6.60)#7,062 |
| 91. | 47840 | 43.9% | 30.7%(+13.2)#91 | 37.3%(+6.60)#7,066 |
| 92. | 47833 | 43.9% | 30.7%(+13.2)#92 | 37.3%(+6.60)#7,072 |
| 93. | 46779 | 43.8% | 30.7%(+13.1)#93 | 37.3%(+6.50)#7,095 |
| 94. | 47639 | 43.6% | 30.7%(+12.9)#94 | 37.3%(+6.30)#7,175 |
| 95. | 46788 | 43.5% | 30.7%(+12.8)#95 | 37.3%(+6.20)#7,219 |
| 96. | 46064 | 43.4% | 30.7%(+12.7)#96 | 37.3%(+6.10)#7,246 |
| 97. | 47060 | 43.3% | 30.7%(+12.6)#97 | 37.3%(+6.00)#7,302 |
| 98. | 47468 | 43.3% | 30.7%(+12.6)#98 | 37.3%(+6.00)#7,311 |
| 99. | 47866 | 43.3% | 30.7%(+12.6)#99 | 37.3%(+6.00)#7,315 |
| 100. | 47111 | 43.2% | 30.7%(+12.5)#100 | 37.3%(+5.90)#7,334 |
Common Questions
What are the Top 10 Zip Codes with the Highest Percentage of Households with Income Above $100,000 in Indiana?
Top 10 Zip Codes with the Highest Percentage of Households with Income Above $100,000 in Indiana are:
What zip code has the Highest Percentage of Households with Income Above $100,000 in Indiana?
46045 has the Highest Percentage of Households with Income Above $100,000 in Indiana with 100.0%.
What is the Percentage of Households with Income Above $100,000 in the State of Indiana?
Percentage of Households with Income Above $100,000 in Indiana is 30.7%.
What is the Percentage of Households with Income Above $100,000 in the United States?
Percentage of Households with Income Above $100,000 in the United States is 37.3%.