Cities with the Highest Percentage of Households with Income Above $100,000 in Nebraska
RELATED REPORTS & OPTIONS
Household Income | $100k+
Nebraska
Compare Cities
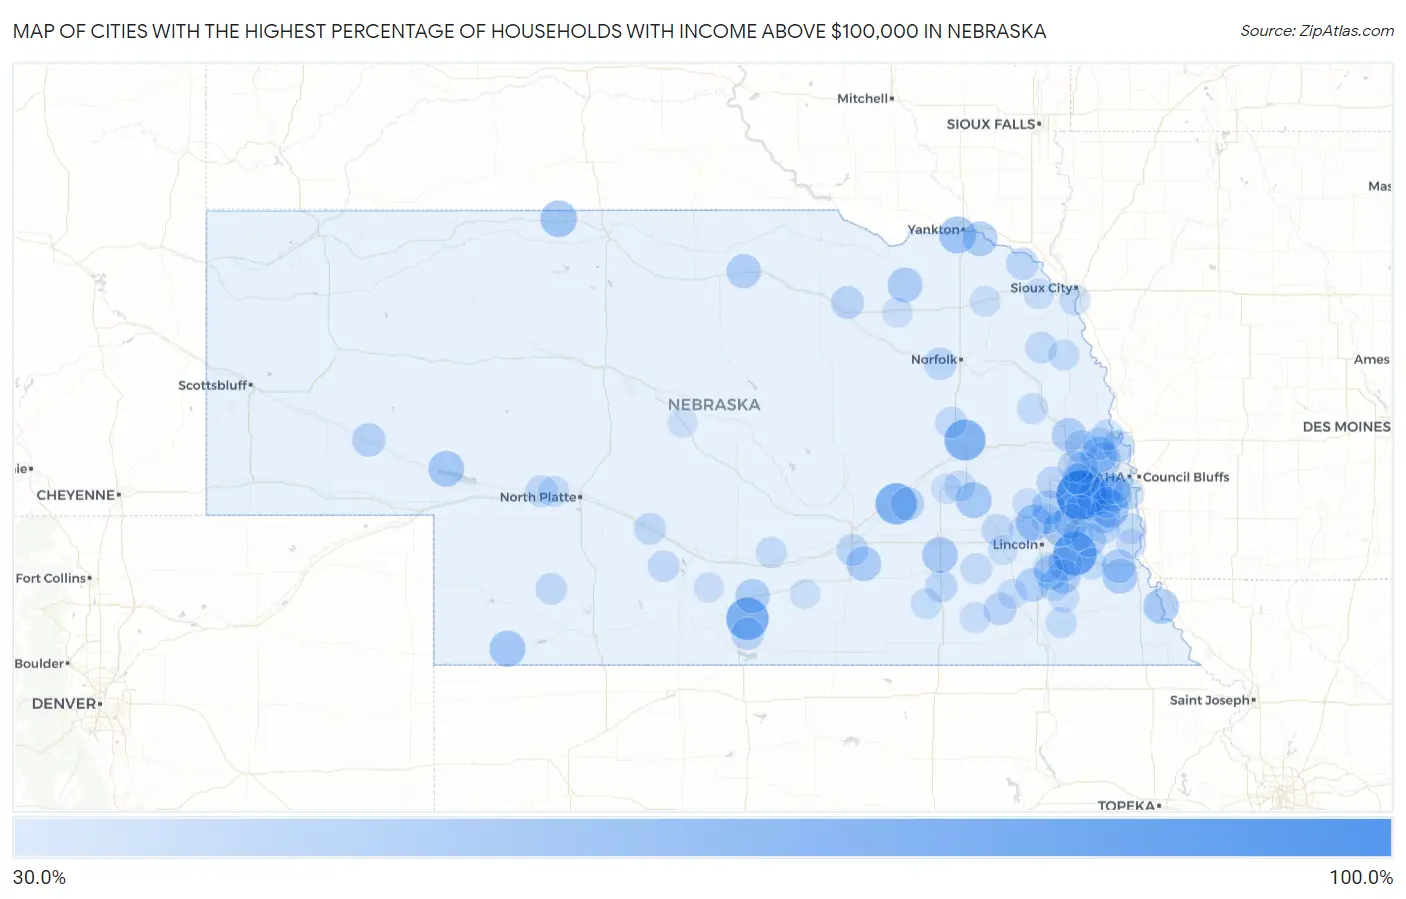
Map of Cities with the Highest Percentage of Households with Income Above $100,000 in Nebraska
0.0%
100.0%
Cities with the Highest Percentage of Households with Income Above $100,000 in Nebraska
| City | Households with Income > $100k | vs State | vs National | |
| 1. | Wann | 100.0% | 34.0%(+66.0)#1 | 37.3%(+62.7)#69 |
| 2. | Woodland Hills | 78.9% | 34.0%(+44.9)#2 | 37.3%(+41.6)#620 |
| 3. | Melia | 75.0% | 34.0%(+41.0)#3 | 37.3%(+37.7)#905 |
| 4. | Ragan | 75.0% | 34.0%(+41.0)#4 | 37.3%(+37.7)#911 |
| 5. | Overland | 71.3% | 34.0%(+37.3)#5 | 37.3%(+34.0)#1,226 |
| 6. | Lakeview | 70.7% | 34.0%(+36.7)#6 | 37.3%(+33.4)#1,274 |
| 7. | Linoma Beach | 68.8% | 34.0%(+34.8)#7 | 37.3%(+31.5)#1,471 |
| 8. | Princeton | 58.8% | 34.0%(+24.8)#8 | 37.3%(+21.5)#2,952 |
| 9. | Cedar Creek | 58.0% | 34.0%(+24.0)#9 | 37.3%(+20.7)#3,078 |
| 10. | Aten | 56.7% | 34.0%(+22.7)#10 | 37.3%(+19.4)#3,298 |
| 11. | Gretna | 55.8% | 34.0%(+21.8)#11 | 37.3%(+18.5)#3,455 |
| 12. | Kilgore | 55.3% | 34.0%(+21.3)#12 | 37.3%(+18.0)#3,559 |
| 13. | Washington | 53.8% | 34.0%(+19.8)#13 | 37.3%(+16.5)#3,859 |
| 14. | Max | 53.7% | 34.0%(+19.7)#14 | 37.3%(+16.4)#3,884 |
| 15. | Surprise | 53.4% | 34.0%(+19.4)#15 | 37.3%(+16.1)#3,946 |
| 16. | Raymond | 53.2% | 34.0%(+19.2)#16 | 37.3%(+15.9)#3,988 |
| 17. | Belmar | 53.1% | 34.0%(+19.1)#17 | 37.3%(+15.8)#4,001 |
| 18. | Waverly | 52.9% | 34.0%(+18.9)#18 | 37.3%(+15.6)#4,037 |
| 19. | Venice | 52.9% | 34.0%(+18.9)#19 | 37.3%(+15.6)#4,048 |
| 20. | Mccool Junction | 52.4% | 34.0%(+18.4)#20 | 37.3%(+15.1)#4,153 |
| 21. | Papillion | 52.2% | 34.0%(+18.2)#21 | 37.3%(+14.9)#4,194 |
| 22. | Brownville | 51.6% | 34.0%(+17.6)#22 | 37.3%(+14.3)#4,354 |
| 23. | Martell | 50.7% | 34.0%(+16.7)#23 | 37.3%(+13.4)#4,551 |
| 24. | Trumbull | 50.0% | 34.0%(+16.0)#24 | 37.3%(+12.7)#4,713 |
| 25. | St Helena | 50.0% | 34.0%(+16.0)#25 | 37.3%(+12.7)#4,724 |
| 26. | Lorton | 50.0% | 34.0%(+16.0)#26 | 37.3%(+12.7)#4,733 |
| 27. | Bazile Mills | 50.0% | 34.0%(+16.0)#27 | 37.3%(+12.7)#4,762 |
| 28. | Greenwood | 49.8% | 34.0%(+15.8)#28 | 37.3%(+12.5)#4,808 |
| 29. | Funk | 49.1% | 34.0%(+15.1)#29 | 37.3%(+11.8)#4,990 |
| 30. | Bennington | 48.4% | 34.0%(+14.4)#30 | 37.3%(+11.1)#5,152 |
| 31. | Ceresco | 48.2% | 34.0%(+14.2)#31 | 37.3%(+10.9)#5,199 |
| 32. | Hickman | 48.0% | 34.0%(+14.0)#32 | 37.3%(+10.7)#5,245 |
| 33. | Louisville | 48.0% | 34.0%(+14.0)#33 | 37.3%(+10.7)#5,246 |
| 34. | Bennet | 47.8% | 34.0%(+13.8)#34 | 37.3%(+10.5)#5,307 |
| 35. | Newport | 47.8% | 34.0%(+13.8)#35 | 37.3%(+10.5)#5,317 |
| 36. | Panama | 47.6% | 34.0%(+13.6)#36 | 37.3%(+10.3)#5,375 |
| 37. | Elmwood | 47.2% | 34.0%(+13.2)#37 | 37.3%(+9.90)#5,491 |
| 38. | Nickerson | 47.2% | 34.0%(+13.2)#38 | 37.3%(+9.90)#5,492 |
| 39. | Dunbar | 47.1% | 34.0%(+13.1)#39 | 37.3%(+9.80)#5,525 |
| 40. | Hallam | 46.3% | 34.0%(+12.3)#40 | 37.3%(+9.00)#5,757 |
| 41. | Hordville | 45.6% | 34.0%(+11.6)#41 | 37.3%(+8.30)#5,959 |
| 42. | Lisco | 45.5% | 34.0%(+11.5)#42 | 37.3%(+8.20)#5,988 |
| 43. | Swanton | 43.4% | 34.0%(+9.40)#43 | 37.3%(+6.10)#6,618 |
| 44. | Page | 43.4% | 34.0%(+9.40)#44 | 37.3%(+6.10)#6,619 |
| 45. | Arlington | 43.1% | 34.0%(+9.10)#45 | 37.3%(+5.80)#6,700 |
| 46. | Huntley | 42.8% | 34.0%(+8.80)#46 | 37.3%(+5.50)#6,809 |
| 47. | Chalco | 42.6% | 34.0%(+8.60)#47 | 37.3%(+5.30)#6,850 |
| 48. | Newcastle | 41.9% | 34.0%(+7.90)#48 | 37.3%(+4.60)#7,086 |
| 49. | Battle Creek | 41.7% | 34.0%(+7.70)#49 | 37.3%(+4.40)#7,132 |
| 50. | Kennard | 41.6% | 34.0%(+7.60)#50 | 37.3%(+4.30)#7,172 |
| 51. | Manley | 41.3% | 34.0%(+7.30)#51 | 37.3%(+4.00)#7,284 |
| 52. | Fort Calhoun | 41.1% | 34.0%(+7.10)#52 | 37.3%(+3.80)#7,346 |
| 53. | Doniphan | 41.0% | 34.0%(+7.00)#53 | 37.3%(+3.70)#7,373 |
| 54. | Wahoo | 40.9% | 34.0%(+6.90)#54 | 37.3%(+3.60)#7,394 |
| 55. | Geneva | 40.9% | 34.0%(+6.90)#55 | 37.3%(+3.60)#7,400 |
| 56. | Cheney | 40.8% | 34.0%(+6.80)#56 | 37.3%(+3.50)#7,440 |
| 57. | Valley | 40.6% | 34.0%(+6.60)#57 | 37.3%(+3.30)#7,502 |
| 58. | Seward | 40.5% | 34.0%(+6.50)#58 | 37.3%(+3.20)#7,528 |
| 59. | Gothenburg | 40.5% | 34.0%(+6.50)#59 | 37.3%(+3.20)#7,533 |
| 60. | Sutherland | 40.2% | 34.0%(+6.20)#60 | 37.3%(+2.90)#7,660 |
| 61. | Pender | 40.1% | 34.0%(+6.10)#61 | 37.3%(+2.80)#7,685 |
| 62. | Tarnov | 40.0% | 34.0%(+6.00)#62 | 37.3%(+2.70)#7,753 |
| 63. | Eustis | 39.6% | 34.0%(+5.60)#63 | 37.3%(+2.30)#7,881 |
| 64. | Hayes Center | 39.6% | 34.0%(+5.60)#64 | 37.3%(+2.30)#7,884 |
| 65. | Leshara | 39.5% | 34.0%(+5.50)#65 | 37.3%(+2.20)#7,911 |
| 66. | Friend | 39.1% | 34.0%(+5.10)#66 | 37.3%(+1.80)#8,037 |
| 67. | Shelby | 38.9% | 34.0%(+4.90)#67 | 37.3%(+1.60)#8,120 |
| 68. | Blair | 38.8% | 34.0%(+4.80)#68 | 37.3%(+1.50)#8,145 |
| 69. | Unadilla | 38.8% | 34.0%(+4.80)#69 | 37.3%(+1.50)#8,166 |
| 70. | Alvo | 38.7% | 34.0%(+4.70)#70 | 37.3%(+1.40)#8,219 |
| 71. | Firth | 38.6% | 34.0%(+4.60)#71 | 37.3%(+1.30)#8,249 |
| 72. | Springfield | 38.5% | 34.0%(+4.50)#72 | 37.3%(+1.20)#8,285 |
| 73. | Rosalie | 38.3% | 34.0%(+4.30)#73 | 37.3%(+1.000)#8,379 |
| 74. | Glenwood | 37.9% | 34.0%(+3.90)#74 | 37.3%(+0.600)#8,509 |
| 75. | Hershey | 37.8% | 34.0%(+3.80)#75 | 37.3%(+0.500)#8,548 |
| 76. | Bellevue | 37.6% | 34.0%(+3.60)#76 | 37.3%(+0.300)#8,593 |
| 77. | Yutan | 37.6% | 34.0%(+3.60)#77 | 37.3%(+0.300)#8,610 |
| 78. | Snyder | 37.6% | 34.0%(+3.60)#78 | 37.3%(+0.300)#8,624 |
| 79. | Filley | 37.5% | 34.0%(+3.50)#79 | 37.3%(+0.200)#8,680 |
| 80. | Shickley | 37.4% | 34.0%(+3.40)#80 | 37.3%(+0.100)#8,725 |
| 81. | Dakota City | 37.3% | 34.0%(+3.30)#81 | 37.3%(=0.000)#8,744 |
| 82. | Davey | 37.3% | 34.0%(+3.30)#82 | 37.3%(=0.000)#8,770 |
| 83. | Daykin | 37.2% | 34.0%(+3.20)#83 | 37.3%(-0.100)#8,811 |
| 84. | Adams | 36.8% | 34.0%(+2.80)#84 | 37.3%(-0.500)#8,955 |
| 85. | Waterbury | 36.8% | 34.0%(+2.80)#85 | 37.3%(-0.500)#8,968 |
| 86. | Malcolm | 36.7% | 34.0%(+2.70)#86 | 37.3%(-0.600)#8,992 |
| 87. | Belden | 36.3% | 34.0%(+2.30)#87 | 37.3%(-1.00)#9,155 |
| 88. | Murray | 36.2% | 34.0%(+2.20)#88 | 37.3%(-1.10)#9,183 |
| 89. | Ashland | 35.9% | 34.0%(+1.90)#89 | 37.3%(-1.40)#9,315 |
| 90. | Union | 35.8% | 34.0%(+1.80)#90 | 37.3%(-1.50)#9,369 |
| 91. | La Vista | 35.7% | 34.0%(+1.70)#91 | 37.3%(-1.60)#9,378 |
| 92. | Valparaiso | 35.7% | 34.0%(+1.70)#92 | 37.3%(-1.60)#9,398 |
| 93. | Osceola | 35.5% | 34.0%(+1.50)#93 | 37.3%(-1.80)#9,479 |
| 94. | Wilber | 35.3% | 34.0%(+1.30)#94 | 37.3%(-2.00)#9,568 |
| 95. | Bertrand | 35.3% | 34.0%(+1.30)#95 | 37.3%(-2.00)#9,574 |
| 96. | Brunswick | 35.3% | 34.0%(+1.30)#96 | 37.3%(-2.00)#9,589 |
| 97. | Milford | 35.1% | 34.0%(+1.10)#97 | 37.3%(-2.20)#9,648 |
| 98. | Norman | 35.0% | 34.0%(+1.000)#98 | 37.3%(-2.30)#9,717 |
| 99. | Roca | 34.7% | 34.0%(+0.700)#99 | 37.3%(-2.60)#9,859 |
| 100. | Anselmo | 34.5% | 34.0%(+0.500)#100 | 37.3%(-2.80)#9,965 |
Common Questions
What are the Top 10 Cities with the Highest Percentage of Households with Income Above $100,000 in Nebraska?
Top 10 Cities with the Highest Percentage of Households with Income Above $100,000 in Nebraska are:
#1
100.0%
#2
78.9%
#3
75.0%
#4
71.3%
#5
70.7%
#6
58.0%
#7
56.7%
#8
55.8%
#9
55.3%
#10
53.8%
What city has the Highest Percentage of Households with Income Above $100,000 in Nebraska?
Wann has the Highest Percentage of Households with Income Above $100,000 in Nebraska with 100.0%.
What is the Percentage of Households with Income Above $100,000 in the State of Nebraska?
Percentage of Households with Income Above $100,000 in Nebraska is 34.0%.
What is the Percentage of Households with Income Above $100,000 in the United States?
Percentage of Households with Income Above $100,000 in the United States is 37.3%.