Cities with the Highest Percentage of Households with Income Above $100,000 in Connecticut
RELATED REPORTS & OPTIONS
Household Income | $100k+
Connecticut
Compare Cities
Map of Cities with the Highest Percentage of Households with Income Above $100,000 in Connecticut
0.0%
100.0%
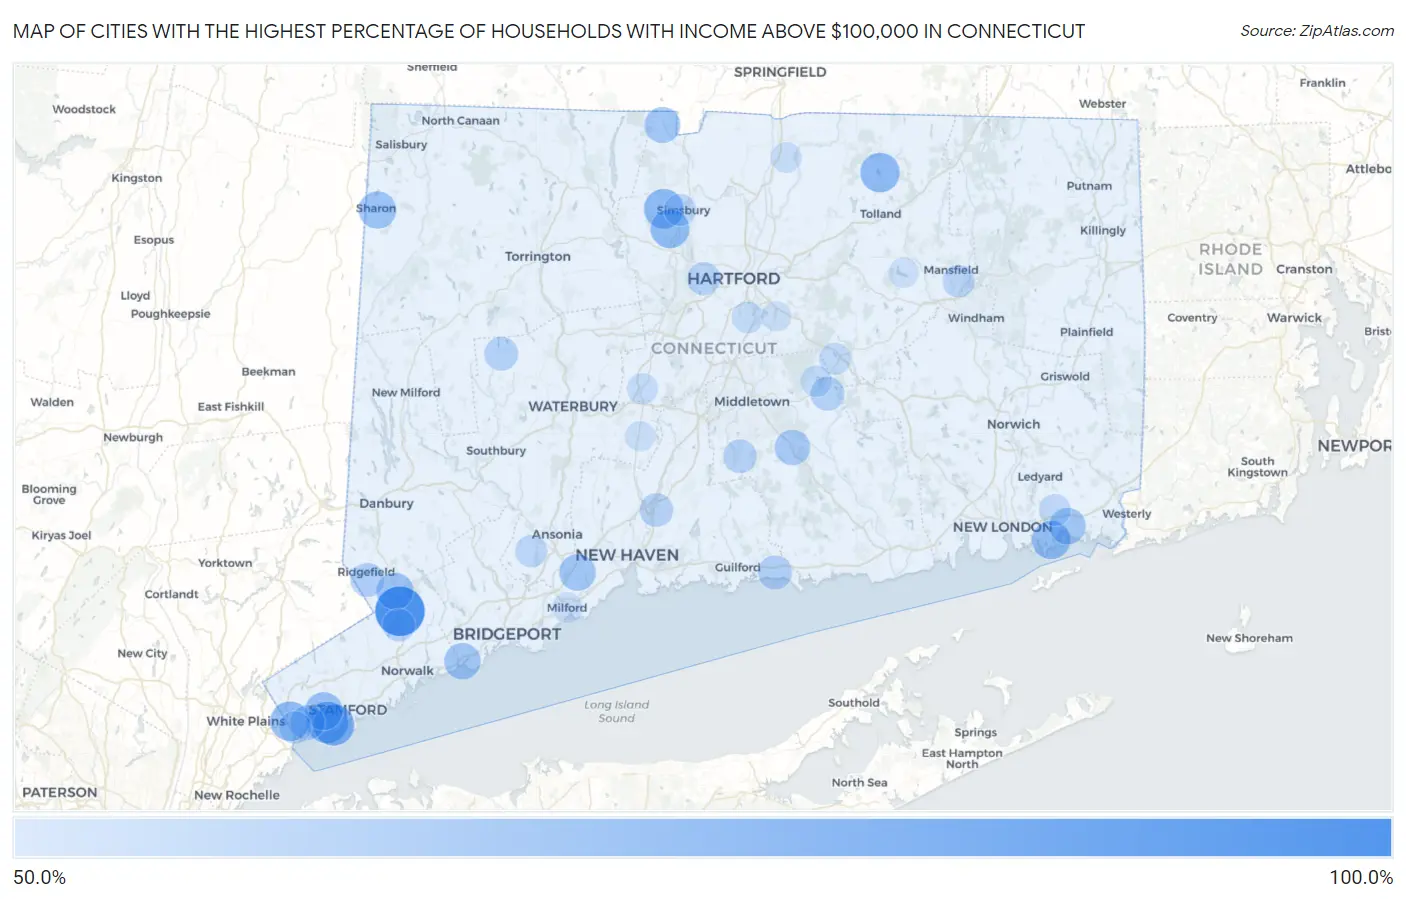
Cities with the Highest Percentage of Households with Income Above $100,000 in Connecticut
| City | Households with Income > $100k | vs State | vs National | |
| 1. | Cannondale | 100.0% | 45.6%(+54.4)#1 | 37.3%(+62.7)#7 |
| 2. | Brookfield Center | 100.0% | 45.6%(+54.4)#2 | 37.3%(+62.7)#29 |
| 3. | Hawleyville | 100.0% | 45.6%(+54.4)#3 | 37.3%(+62.7)#35 |
| 4. | Candlewood Lake Club | 100.0% | 45.6%(+54.4)#4 | 37.3%(+62.7)#37 |
| 5. | Weston | 97.3% | 45.6%(+51.7)#5 | 37.3%(+60.0)#202 |
| 6. | Candlewood Isle | 93.2% | 45.6%(+47.6)#6 | 37.3%(+55.9)#216 |
| 7. | Botsford | 91.8% | 45.6%(+46.2)#7 | 37.3%(+54.5)#225 |
| 8. | Lakes East | 90.1% | 45.6%(+44.5)#8 | 37.3%(+52.8)#251 |
| 9. | Witches Woods | 88.9% | 45.6%(+43.3)#9 | 37.3%(+51.6)#274 |
| 10. | Tokeneke | 86.9% | 45.6%(+41.3)#10 | 37.3%(+49.6)#305 |
| 11. | Old Hill | 86.1% | 45.6%(+40.5)#11 | 37.3%(+48.8)#322 |
| 12. | Mill Plain | 85.1% | 45.6%(+39.5)#12 | 37.3%(+47.8)#340 |
| 13. | Greens Farms | 84.1% | 45.6%(+38.5)#13 | 37.3%(+46.8)#369 |
| 14. | Coleytown | 83.7% | 45.6%(+38.1)#14 | 37.3%(+46.4)#377 |
| 15. | Fenwick Borough | 83.3% | 45.6%(+37.7)#15 | 37.3%(+46.0)#402 |
| 16. | Lakes West | 82.8% | 45.6%(+37.2)#16 | 37.3%(+45.5)#428 |
| 17. | West Mountain | 82.5% | 45.6%(+36.9)#17 | 37.3%(+45.2)#444 |
| 18. | Redding Center | 82.4% | 45.6%(+36.8)#18 | 37.3%(+45.1)#448 |
| 19. | Riverton | 81.2% | 45.6%(+35.6)#19 | 37.3%(+43.9)#493 |
| 20. | Riverside | 79.6% | 45.6%(+34.0)#20 | 37.3%(+42.3)#570 |
| 21. | Old Greenwich | 78.6% | 45.6%(+33.0)#21 | 37.3%(+41.3)#637 |
| 22. | Westport | 78.6% | 45.6%(+33.0)#22 | 37.3%(+41.3)#639 |
| 23. | Indian Field | 78.4% | 45.6%(+32.8)#23 | 37.3%(+41.1)#652 |
| 24. | Poplar Plains | 78.1% | 45.6%(+32.5)#24 | 37.3%(+40.8)#675 |
| 25. | Noroton | 77.1% | 45.6%(+31.5)#25 | 37.3%(+39.8)#751 |
| 26. | East | 77.1% | 45.6%(+31.5)#26 | 37.3%(+39.8)#755 |
| 27. | Mamanasco Lake | 75.6% | 45.6%(+30.0)#27 | 37.3%(+38.3)#847 |
| 28. | Glenville | 74.5% | 45.6%(+28.9)#28 | 37.3%(+37.2)#935 |
| 29. | West Simsbury | 74.5% | 45.6%(+28.9)#29 | 37.3%(+37.2)#937 |
| 30. | Daniels Farm | 73.9% | 45.6%(+28.3)#30 | 37.3%(+36.6)#985 |
| 31. | Crystal Lake | 73.7% | 45.6%(+28.1)#31 | 37.3%(+36.4)#1,012 |
| 32. | Plattsville | 73.6% | 45.6%(+28.0)#32 | 37.3%(+36.3)#1,018 |
| 33. | Murray | 73.5% | 45.6%(+27.9)#33 | 37.3%(+36.2)#1,030 |
| 34. | Lakeside Woods | 73.1% | 45.6%(+27.5)#34 | 37.3%(+35.8)#1,064 |
| 35. | Bigelow Corners | 73.0% | 45.6%(+27.4)#35 | 37.3%(+35.7)#1,071 |
| 36. | Sail Harbor | 72.9% | 45.6%(+27.3)#36 | 37.3%(+35.6)#1,080 |
| 37. | Weatogue | 72.8% | 45.6%(+27.2)#37 | 37.3%(+35.5)#1,083 |
| 38. | Saugatuck | 72.7% | 45.6%(+27.1)#38 | 37.3%(+35.4)#1,095 |
| 39. | Rock Ridge | 72.7% | 45.6%(+27.1)#39 | 37.3%(+35.4)#1,101 |
| 40. | Tashua | 72.0% | 45.6%(+26.4)#40 | 37.3%(+34.7)#1,156 |
| 41. | Noroton Heights | 72.0% | 45.6%(+26.4)#41 | 37.3%(+34.7)#1,157 |
| 42. | Noank | 71.8% | 45.6%(+26.2)#42 | 37.3%(+34.5)#1,182 |
| 43. | Compo | 71.5% | 45.6%(+25.9)#43 | 37.3%(+34.2)#1,202 |
| 44. | Cos Cob | 70.5% | 45.6%(+24.9)#44 | 37.3%(+33.2)#1,285 |
| 45. | Darien Downtown | 70.0% | 45.6%(+24.4)#45 | 37.3%(+32.7)#1,335 |
| 46. | Sharon | 69.1% | 45.6%(+23.5)#46 | 37.3%(+31.8)#1,436 |
| 47. | Bogus Hill | 68.3% | 45.6%(+22.7)#47 | 37.3%(+31.0)#1,543 |
| 48. | Georgetown | 67.9% | 45.6%(+22.3)#48 | 37.3%(+30.6)#1,594 |
| 49. | Sandy Hook | 67.8% | 45.6%(+22.2)#49 | 37.3%(+30.5)#1,603 |
| 50. | Newtown Borough | 67.0% | 45.6%(+21.4)#50 | 37.3%(+29.7)#1,671 |
| 51. | Mystic | 66.9% | 45.6%(+21.3)#51 | 37.3%(+29.6)#1,677 |
| 52. | New Canaan | 66.8% | 45.6%(+21.2)#52 | 37.3%(+29.5)#1,689 |
| 53. | Orange | 66.7% | 45.6%(+21.1)#53 | 37.3%(+29.4)#1,699 |
| 54. | Staples | 66.6% | 45.6%(+21.0)#54 | 37.3%(+29.3)#1,734 |
| 55. | Southport | 66.5% | 45.6%(+20.9)#55 | 37.3%(+29.2)#1,755 |
| 56. | Bridgewater | 65.5% | 45.6%(+19.9)#56 | 37.3%(+28.2)#1,883 |
| 57. | North Granby | 65.4% | 45.6%(+19.8)#57 | 37.3%(+28.1)#1,892 |
| 58. | Higganum | 64.1% | 45.6%(+18.5)#58 | 37.3%(+26.8)#2,058 |
| 59. | Greenwich | 62.3% | 45.6%(+16.7)#59 | 37.3%(+25.0)#2,327 |
| 60. | Ridgebury | 62.1% | 45.6%(+16.5)#60 | 37.3%(+24.8)#2,366 |
| 61. | Stepney | 62.0% | 45.6%(+16.4)#61 | 37.3%(+24.7)#2,385 |
| 62. | Route 7 Gateway | 61.4% | 45.6%(+15.8)#62 | 37.3%(+24.1)#2,496 |
| 63. | Trumbull Center | 61.1% | 45.6%(+15.5)#63 | 37.3%(+23.8)#2,545 |
| 64. | Ridgefield | 60.6% | 45.6%(+15.0)#64 | 37.3%(+23.3)#2,626 |
| 65. | Madison Center | 60.5% | 45.6%(+14.9)#65 | 37.3%(+23.2)#2,655 |
| 66. | East Hampton | 60.2% | 45.6%(+14.6)#66 | 37.3%(+22.9)#2,697 |
| 67. | Candlewood Orchards | 60.1% | 45.6%(+14.5)#67 | 37.3%(+22.8)#2,720 |
| 68. | Bethlehem Village | 60.0% | 45.6%(+14.4)#68 | 37.3%(+22.7)#2,731 |
| 69. | South Wilton | 59.6% | 45.6%(+14.0)#69 | 37.3%(+22.3)#2,820 |
| 70. | Topstone | 59.6% | 45.6%(+14.0)#70 | 37.3%(+22.3)#2,823 |
| 71. | North Haven | 59.5% | 45.6%(+13.9)#71 | 37.3%(+22.2)#2,825 |
| 72. | Durham | 59.4% | 45.6%(+13.8)#72 | 37.3%(+22.1)#2,852 |
| 73. | Inglenook | 58.7% | 45.6%(+13.1)#73 | 37.3%(+21.4)#2,964 |
| 74. | Litchfield Borough | 58.6% | 45.6%(+13.0)#74 | 37.3%(+21.3)#2,980 |
| 75. | West Hartford | 58.3% | 45.6%(+12.7)#75 | 37.3%(+21.0)#3,023 |
| 76. | Gaylordsville | 58.1% | 45.6%(+12.5)#76 | 37.3%(+20.8)#3,063 |
| 77. | Wilton Center | 57.4% | 45.6%(+11.8)#77 | 37.3%(+20.1)#3,171 |
| 78. | Pemberwick | 56.9% | 45.6%(+11.3)#78 | 37.3%(+19.6)#3,256 |
| 79. | Ball Pond | 56.9% | 45.6%(+11.3)#79 | 37.3%(+19.6)#3,257 |
| 80. | Mansfield Center | 56.6% | 45.6%(+11.0)#80 | 37.3%(+19.3)#3,311 |
| 81. | Groton Long Point Borough | 56.4% | 45.6%(+10.8)#81 | 37.3%(+19.1)#3,357 |
| 82. | Simsbury Center | 56.2% | 45.6%(+10.6)#82 | 37.3%(+18.9)#3,378 |
| 83. | Shelton | 56.0% | 45.6%(+10.4)#83 | 37.3%(+18.7)#3,413 |
| 84. | Candlewood Shores | 55.5% | 45.6%(+9.90)#84 | 37.3%(+18.2)#3,515 |
| 85. | Candlewood Knolls | 55.5% | 45.6%(+9.90)#85 | 37.3%(+18.2)#3,519 |
| 86. | Terramuggus | 55.3% | 45.6%(+9.70)#86 | 37.3%(+18.0)#3,553 |
| 87. | Old Mystic | 55.0% | 45.6%(+9.40)#87 | 37.3%(+17.7)#3,605 |
| 88. | Wethersfield | 54.5% | 45.6%(+8.90)#88 | 37.3%(+17.2)#3,706 |
| 89. | Sherman | 54.5% | 45.6%(+8.90)#89 | 37.3%(+17.2)#3,723 |
| 90. | Northford | 54.2% | 45.6%(+8.60)#90 | 37.3%(+16.9)#3,771 |
| 91. | Knollcrest | 54.2% | 45.6%(+8.60)#91 | 37.3%(+16.9)#3,785 |
| 92. | Lake Pocotopaug | 54.0% | 45.6%(+8.40)#92 | 37.3%(+16.7)#3,813 |
| 93. | Plantsville | 53.8% | 45.6%(+8.20)#93 | 37.3%(+16.5)#3,850 |
| 94. | West Cornwall | 53.8% | 45.6%(+8.20)#94 | 37.3%(+16.5)#3,862 |
| 95. | Southwood Acres | 52.5% | 45.6%(+6.90)#95 | 37.3%(+15.2)#4,115 |
| 96. | Milford City Balance | 52.0% | 45.6%(+6.40)#96 | 37.3%(+14.7)#4,243 |
| 97. | Cheshire Village | 51.5% | 45.6%(+5.90)#97 | 37.3%(+14.2)#4,360 |
| 98. | South Coventry | 51.4% | 45.6%(+5.80)#98 | 37.3%(+14.1)#4,394 |
| 99. | Cornwall | 51.3% | 45.6%(+5.70)#99 | 37.3%(+14.0)#4,419 |
| 100. | Glastonbury Center | 51.1% | 45.6%(+5.50)#100 | 37.3%(+13.8)#4,452 |
Common Questions
What are the Top 10 Cities with the Highest Percentage of Households with Income Above $100,000 in Connecticut?
Top 10 Cities with the Highest Percentage of Households with Income Above $100,000 in Connecticut are:
#1
100.0%
#2
79.6%
#3
78.6%
#4
74.5%
#5
74.5%
#6
73.7%
#7
72.8%
#8
71.8%
#9
70.5%
#10
69.1%
What city has the Highest Percentage of Households with Income Above $100,000 in Connecticut?
Cannondale has the Highest Percentage of Households with Income Above $100,000 in Connecticut with 100.0%.
What is the Percentage of Households with Income Above $100,000 in the State of Connecticut?
Percentage of Households with Income Above $100,000 in Connecticut is 45.6%.
What is the Percentage of Households with Income Above $100,000 in the United States?
Percentage of Households with Income Above $100,000 in the United States is 37.3%.