Cities with the Highest Percentage of Households with Income Above $100,000 in Missouri
RELATED REPORTS & OPTIONS
Household Income | $100k+
Missouri
Compare Cities
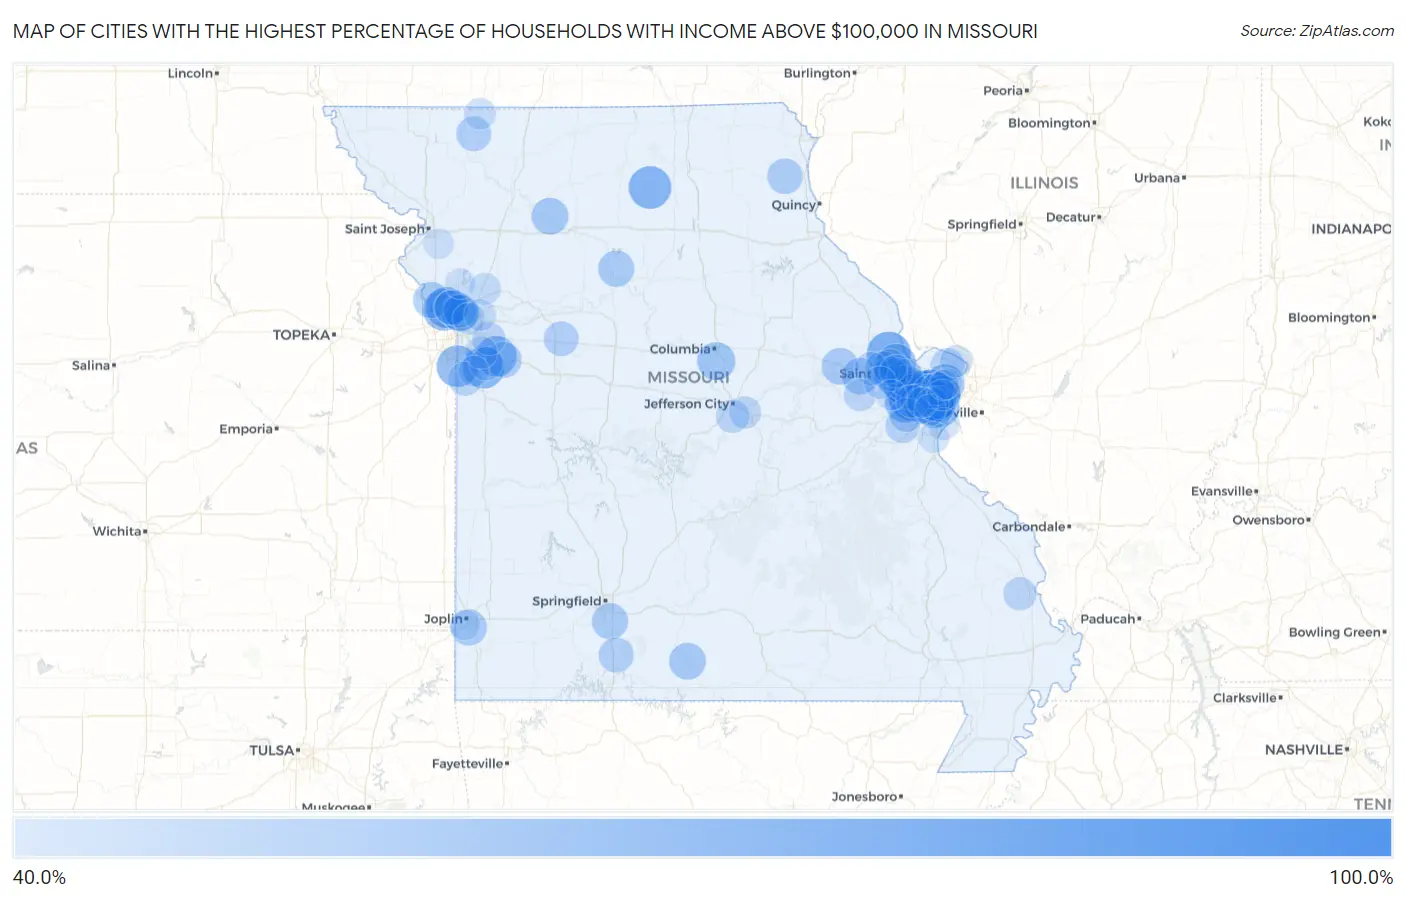
Map of Cities with the Highest Percentage of Households with Income Above $100,000 in Missouri
0.0%
100.0%
Cities with the Highest Percentage of Households with Income Above $100,000 in Missouri
| City | Households with Income > $100k | vs State | vs National | |
| 1. | Buell | 100.0% | 30.6%(+69.4)#1 | 37.3%(+62.7)#148 |
| 2. | Country Life Acres | 90.9% | 30.6%(+60.3)#2 | 37.3%(+53.6)#238 |
| 3. | Clarkson Valley | 88.6% | 30.6%(+58.0)#3 | 37.3%(+51.3)#280 |
| 4. | Westwood | 87.9% | 30.6%(+57.3)#4 | 37.3%(+50.6)#291 |
| 5. | Des Peres | 81.1% | 30.6%(+50.5)#5 | 37.3%(+43.8)#495 |
| 6. | Huntleigh | 81.0% | 30.6%(+50.4)#6 | 37.3%(+43.7)#503 |
| 7. | Chain Of Rocks | 78.2% | 30.6%(+47.6)#7 | 37.3%(+40.9)#669 |
| 8. | Frontenac | 78.1% | 30.6%(+47.5)#8 | 37.3%(+40.8)#674 |
| 9. | Ladue | 77.4% | 30.6%(+46.8)#9 | 37.3%(+40.1)#733 |
| 10. | Warson Woods | 75.9% | 30.6%(+45.3)#10 | 37.3%(+38.6)#816 |
| 11. | Denton | 75.0% | 30.6%(+44.4)#11 | 37.3%(+37.7)#903 |
| 12. | Winigan | 75.0% | 30.6%(+44.4)#12 | 37.3%(+37.7)#910 |
| 13. | Town And Country | 73.7% | 30.6%(+43.1)#13 | 37.3%(+36.4)#1,007 |
| 14. | Lake Winnebago | 73.3% | 30.6%(+42.7)#14 | 37.3%(+36.0)#1,048 |
| 15. | Loch Lloyd | 72.7% | 30.6%(+42.1)#15 | 37.3%(+35.4)#1,098 |
| 16. | Parkville | 71.8% | 30.6%(+41.2)#16 | 37.3%(+34.5)#1,177 |
| 17. | Weatherby Lake | 71.3% | 30.6%(+40.7)#17 | 37.3%(+34.0)#1,222 |
| 18. | Lake Lotawana | 70.8% | 30.6%(+40.2)#18 | 37.3%(+33.5)#1,267 |
| 19. | Wildwood | 69.3% | 30.6%(+38.7)#19 | 37.3%(+32.0)#1,400 |
| 20. | Glendale | 69.1% | 30.6%(+38.5)#20 | 37.3%(+31.8)#1,426 |
| 21. | St Paul | 68.5% | 30.6%(+37.9)#21 | 37.3%(+31.2)#1,508 |
| 22. | Crystal Lake Park | 68.5% | 30.6%(+37.9)#22 | 37.3%(+31.2)#1,514 |
| 23. | New Market | 67.8% | 30.6%(+37.2)#23 | 37.3%(+30.5)#1,611 |
| 24. | Dardenne Prairie | 67.3% | 30.6%(+36.7)#24 | 37.3%(+30.0)#1,643 |
| 25. | Grantwood Village | 66.9% | 30.6%(+36.3)#25 | 37.3%(+29.6)#1,679 |
| 26. | Bellerive Acres | 66.6% | 30.6%(+36.0)#26 | 37.3%(+29.3)#1,742 |
| 27. | Weldon Spring Heights | 65.9% | 30.6%(+35.3)#27 | 37.3%(+28.6)#1,832 |
| 28. | Pierpont | 64.2% | 30.6%(+33.6)#28 | 37.3%(+26.9)#2,046 |
| 29. | Oakwood | 63.7% | 30.6%(+33.1)#29 | 37.3%(+26.4)#2,111 |
| 30. | Briarwood Estates | 63.3% | 30.6%(+32.7)#30 | 37.3%(+26.0)#2,165 |
| 31. | Shawneetown | 63.0% | 30.6%(+32.4)#31 | 37.3%(+25.7)#2,230 |
| 32. | Chesterfield | 62.8% | 30.6%(+32.2)#32 | 37.3%(+25.5)#2,247 |
| 33. | Weldon Spring | 62.6% | 30.6%(+32.0)#33 | 37.3%(+25.3)#2,279 |
| 34. | Oaks | 62.5% | 30.6%(+31.9)#34 | 37.3%(+25.2)#2,294 |
| 35. | Cottleville | 62.0% | 30.6%(+31.4)#35 | 37.3%(+24.7)#2,382 |
| 36. | Twin Oaks | 61.9% | 30.6%(+31.3)#36 | 37.3%(+24.6)#2,409 |
| 37. | Wasola | 61.5% | 30.6%(+30.9)#37 | 37.3%(+24.2)#2,475 |
| 38. | Lock Springs | 61.5% | 30.6%(+30.9)#38 | 37.3%(+24.2)#2,478 |
| 39. | Pendleton | 61.1% | 30.6%(+30.5)#39 | 37.3%(+23.8)#2,558 |
| 40. | Innsbrook | 60.9% | 30.6%(+30.3)#40 | 37.3%(+23.6)#2,588 |
| 41. | Sunset Hills | 60.5% | 30.6%(+29.9)#41 | 37.3%(+23.2)#2,647 |
| 42. | Fremont Hills | 60.3% | 30.6%(+29.7)#42 | 37.3%(+23.0)#2,685 |
| 43. | Farley | 60.3% | 30.6%(+29.7)#43 | 37.3%(+23.0)#2,688 |
| 44. | Clayton | 60.0% | 30.6%(+29.4)#44 | 37.3%(+22.7)#2,725 |
| 45. | Shoal Creek Estates | 60.0% | 30.6%(+29.4)#45 | 37.3%(+22.7)#2,733 |
| 46. | Triplett | 60.0% | 30.6%(+29.4)#46 | 37.3%(+22.7)#2,748 |
| 47. | Lake Waukomis | 59.3% | 30.6%(+28.7)#47 | 37.3%(+22.0)#2,866 |
| 48. | Lone Jack | 59.1% | 30.6%(+28.5)#48 | 37.3%(+21.8)#2,905 |
| 49. | Vibbard | 58.9% | 30.6%(+28.3)#49 | 37.3%(+21.6)#2,935 |
| 50. | Oakland | 58.7% | 30.6%(+28.1)#50 | 37.3%(+21.4)#2,963 |
| 51. | Monticello | 58.7% | 30.6%(+28.1)#51 | 37.3%(+21.4)#2,966 |
| 52. | Saddlebrooke | 57.4% | 30.6%(+26.8)#52 | 37.3%(+20.1)#3,177 |
| 53. | Wentzville | 57.2% | 30.6%(+26.6)#53 | 37.3%(+19.9)#3,198 |
| 54. | Worth | 57.1% | 30.6%(+26.5)#54 | 37.3%(+19.8)#3,226 |
| 55. | Aullville | 56.8% | 30.6%(+26.2)#55 | 37.3%(+19.5)#3,282 |
| 56. | Lake St Louis | 56.7% | 30.6%(+26.1)#56 | 37.3%(+19.4)#3,288 |
| 57. | Crestwood | 56.4% | 30.6%(+25.8)#57 | 37.3%(+19.1)#3,346 |
| 58. | Ballwin | 55.8% | 30.6%(+25.2)#58 | 37.3%(+18.5)#3,449 |
| 59. | Creve Coeur | 55.1% | 30.6%(+24.5)#59 | 37.3%(+17.8)#3,584 |
| 60. | Josephville | 55.1% | 30.6%(+24.5)#60 | 37.3%(+17.8)#3,594 |
| 61. | Labarque Creek | 55.0% | 30.6%(+24.4)#61 | 37.3%(+17.7)#3,609 |
| 62. | Platte Woods | 55.0% | 30.6%(+24.4)#62 | 37.3%(+17.7)#3,611 |
| 63. | Eureka | 54.8% | 30.6%(+24.2)#63 | 37.3%(+17.5)#3,646 |
| 64. | Riverview Estates | 54.8% | 30.6%(+24.2)#64 | 37.3%(+17.5)#3,664 |
| 65. | Old Jamestown | 54.3% | 30.6%(+23.7)#65 | 37.3%(+17.0)#3,748 |
| 66. | Wardsville | 53.5% | 30.6%(+22.9)#66 | 37.3%(+16.2)#3,915 |
| 67. | Foristell | 53.5% | 30.6%(+22.9)#67 | 37.3%(+16.2)#3,920 |
| 68. | Dutchtown | 53.5% | 30.6%(+22.9)#68 | 37.3%(+16.2)#3,925 |
| 69. | Greenwood | 53.3% | 30.6%(+22.7)#69 | 37.3%(+16.0)#3,960 |
| 70. | Lake Tapawingo | 53.2% | 30.6%(+22.6)#70 | 37.3%(+15.9)#3,985 |
| 71. | Webster Groves | 52.8% | 30.6%(+22.2)#71 | 37.3%(+15.5)#4,051 |
| 72. | Olivette | 52.6% | 30.6%(+22.0)#72 | 37.3%(+15.3)#4,095 |
| 73. | Ellisville | 52.5% | 30.6%(+21.9)#73 | 37.3%(+15.2)#4,114 |
| 74. | Oakwood Park | 52.2% | 30.6%(+21.6)#74 | 37.3%(+14.9)#4,215 |
| 75. | O Fallon | 52.1% | 30.6%(+21.5)#75 | 37.3%(+14.8)#4,218 |
| 76. | Kirkwood | 52.0% | 30.6%(+21.4)#76 | 37.3%(+14.7)#4,247 |
| 77. | Marthasville | 51.9% | 30.6%(+21.3)#77 | 37.3%(+14.6)#4,272 |
| 78. | Taos | 51.5% | 30.6%(+20.9)#78 | 37.3%(+14.2)#4,370 |
| 79. | New Melle | 51.5% | 30.6%(+20.9)#79 | 37.3%(+14.2)#4,376 |
| 80. | Lee S Summit | 51.2% | 30.6%(+20.6)#80 | 37.3%(+13.9)#4,420 |
| 81. | Indian Lake | 51.0% | 30.6%(+20.4)#81 | 37.3%(+13.7)#4,479 |
| 82. | West Alton | 50.9% | 30.6%(+20.3)#82 | 37.3%(+13.6)#4,508 |
| 83. | Oakville | 50.4% | 30.6%(+19.8)#83 | 37.3%(+13.1)#4,593 |
| 84. | Summer Set | 50.2% | 30.6%(+19.6)#84 | 37.3%(+12.9)#4,650 |
| 85. | Kearney | 50.0% | 30.6%(+19.4)#85 | 37.3%(+12.7)#4,688 |
| 86. | Randolph | 50.0% | 30.6%(+19.4)#86 | 37.3%(+12.7)#4,755 |
| 87. | Irena | 50.0% | 30.6%(+19.4)#87 | 37.3%(+12.7)#4,765 |
| 88. | River Bend | 50.0% | 30.6%(+19.4)#88 | 37.3%(+12.7)#4,769 |
| 89. | Fenton | 49.4% | 30.6%(+18.8)#89 | 37.3%(+12.1)#4,903 |
| 90. | Raymore | 48.6% | 30.6%(+18.0)#90 | 37.3%(+11.3)#5,090 |
| 91. | Barnhart | 48.0% | 30.6%(+17.4)#91 | 37.3%(+10.7)#5,239 |
| 92. | Pasadena Hills | 48.0% | 30.6%(+17.4)#92 | 37.3%(+10.7)#5,248 |
| 93. | Richmond Heights | 47.9% | 30.6%(+17.3)#93 | 37.3%(+10.6)#5,267 |
| 94. | Smithville | 47.7% | 30.6%(+17.1)#94 | 37.3%(+10.4)#5,325 |
| 95. | Broseley | 47.6% | 30.6%(+17.0)#95 | 37.3%(+10.3)#5,380 |
| 96. | Agency | 47.3% | 30.6%(+16.7)#96 | 37.3%(+10.00)#5,469 |
| 97. | Defiance | 47.2% | 30.6%(+16.6)#97 | 37.3%(+9.90)#5,497 |
| 98. | Manchester | 46.7% | 30.6%(+16.1)#98 | 37.3%(+9.40)#5,622 |
| 99. | Bel Nor | 46.5% | 30.6%(+15.9)#99 | 37.3%(+9.20)#5,693 |
| 100. | Shoal Creek Drive | 46.5% | 30.6%(+15.9)#100 | 37.3%(+9.20)#5,696 |
Common Questions
What are the Top 10 Cities with the Highest Percentage of Households with Income Above $100,000 in Missouri?
Top 10 Cities with the Highest Percentage of Households with Income Above $100,000 in Missouri are:
#1
90.9%
#2
88.6%
#3
87.9%
#4
81.1%
#5
81.0%
#6
78.2%
#7
78.1%
#8
77.4%
#9
75.9%
#10
75.0%
What city has the Highest Percentage of Households with Income Above $100,000 in Missouri?
Country Life Acres has the Highest Percentage of Households with Income Above $100,000 in Missouri with 90.9%.
What is the Percentage of Households with Income Above $100,000 in the State of Missouri?
Percentage of Households with Income Above $100,000 in Missouri is 30.6%.
What is the Percentage of Households with Income Above $100,000 in the United States?
Percentage of Households with Income Above $100,000 in the United States is 37.3%.