Cities with the Highest Percentage of Households with Income Above $100,000 in Delaware
RELATED REPORTS & OPTIONS
Household Income | $100k+
Delaware
Compare Cities
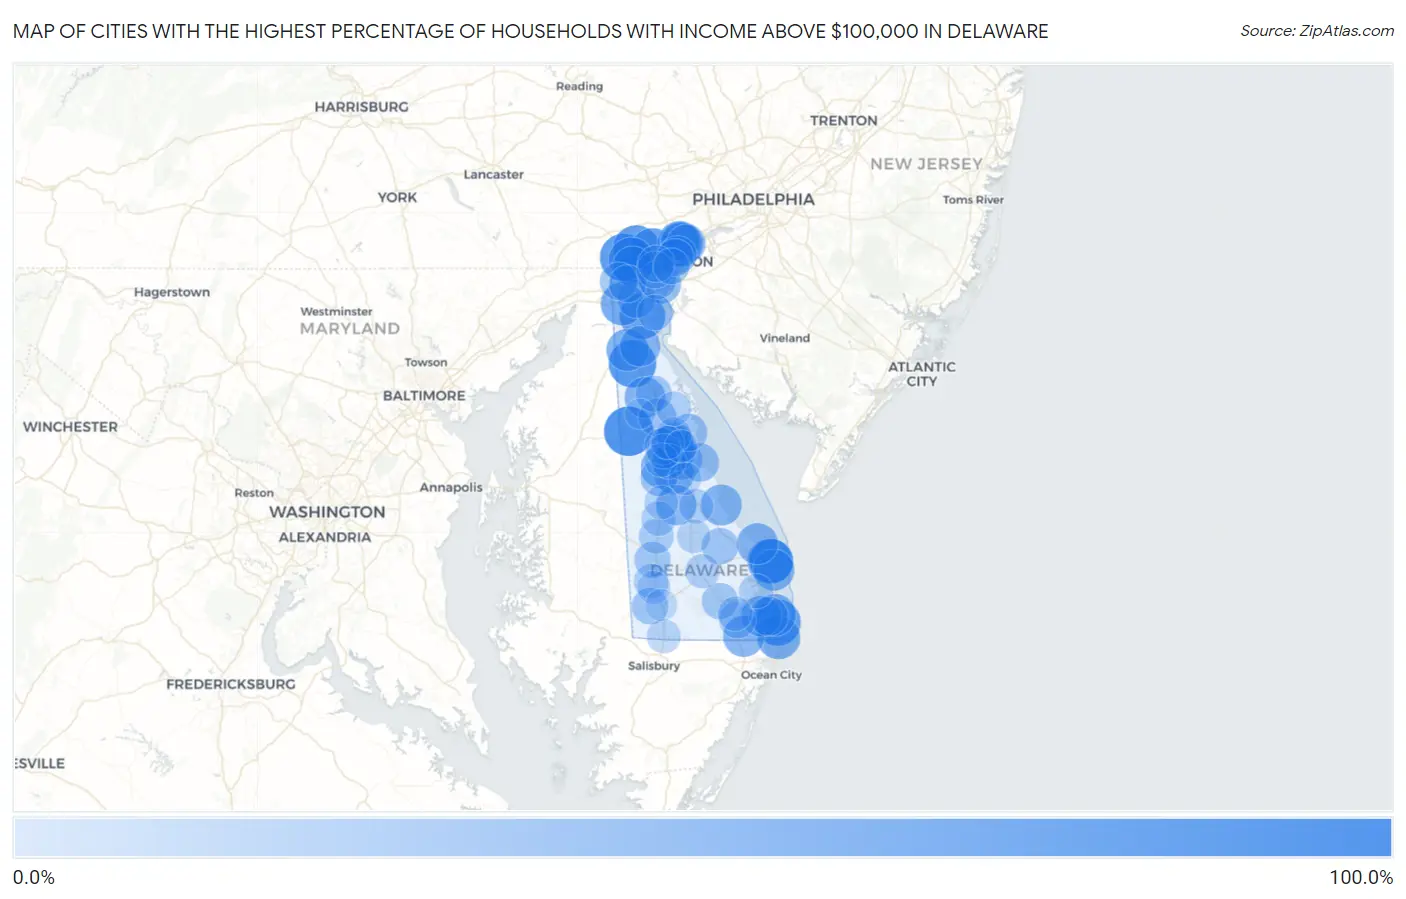
Map of Cities with the Highest Percentage of Households with Income Above $100,000 in Delaware
0.0%
100.0%
Cities with the Highest Percentage of Households with Income Above $100,000 in Delaware
| City | Households with Income > $100k | vs State | vs National | |
| 1. | Hartly | 83.1% | 38.6%(+44.5)#1 | 37.3%(+45.8)#412 |
| 2. | North Star | 75.0% | 38.6%(+36.4)#2 | 37.3%(+37.7)#889 |
| 3. | Townsend | 74.6% | 38.6%(+36.0)#3 | 37.3%(+37.3)#928 |
| 4. | Hockessin | 71.1% | 38.6%(+32.5)#4 | 37.3%(+33.8)#1,239 |
| 5. | South Bethany | 69.5% | 38.6%(+30.9)#5 | 37.3%(+32.2)#1,386 |
| 6. | Greenville | 68.2% | 38.6%(+29.6)#6 | 37.3%(+30.9)#1,553 |
| 7. | St Georges | 66.7% | 38.6%(+28.1)#7 | 37.3%(+29.4)#1,712 |
| 8. | Ardencroft | 65.9% | 38.6%(+27.3)#8 | 37.3%(+28.6)#1,831 |
| 9. | Pike Creek | 65.0% | 38.6%(+26.4)#9 | 37.3%(+27.7)#1,934 |
| 10. | Rehoboth Beach | 64.0% | 38.6%(+25.4)#10 | 37.3%(+26.7)#2,071 |
| 11. | Henlopen Acres | 61.1% | 38.6%(+22.5)#11 | 37.3%(+23.8)#2,556 |
| 12. | Glasgow | 57.4% | 38.6%(+18.8)#12 | 37.3%(+20.1)#3,166 |
| 13. | Fenwick Island | 55.9% | 38.6%(+17.3)#13 | 37.3%(+18.6)#3,445 |
| 14. | Highland Acres | 54.4% | 38.6%(+15.8)#14 | 37.3%(+17.1)#3,733 |
| 15. | Middletown | 51.9% | 38.6%(+13.3)#15 | 37.3%(+14.6)#4,265 |
| 16. | Bethany Beach | 51.0% | 38.6%(+12.4)#16 | 37.3%(+13.7)#4,478 |
| 17. | Dewey Beach | 48.5% | 38.6%(+9.90)#17 | 37.3%(+11.2)#5,137 |
| 18. | Viola | 48.4% | 38.6%(+9.80)#18 | 37.3%(+11.1)#5,165 |
| 19. | Selbyville | 48.1% | 38.6%(+9.50)#19 | 37.3%(+10.8)#5,219 |
| 20. | Lewes | 47.5% | 38.6%(+8.90)#20 | 37.3%(+10.2)#5,390 |
| 21. | Slaughter Beach | 47.2% | 38.6%(+8.60)#21 | 37.3%(+9.90)#5,495 |
| 22. | Clayton | 46.1% | 38.6%(+7.50)#22 | 37.3%(+8.80)#5,807 |
| 23. | Millville | 45.6% | 38.6%(+7.00)#23 | 37.3%(+8.30)#5,946 |
| 24. | Riverview | 45.5% | 38.6%(+6.90)#24 | 37.3%(+8.20)#5,978 |
| 25. | Odessa | 45.1% | 38.6%(+6.50)#25 | 37.3%(+7.80)#6,095 |
| 26. | Houston | 44.7% | 38.6%(+6.10)#26 | 37.3%(+7.40)#6,218 |
| 27. | Ardentown | 42.4% | 38.6%(+3.80)#27 | 37.3%(+5.10)#6,936 |
| 28. | New Castle | 42.0% | 38.6%(+3.40)#28 | 37.3%(+4.70)#7,045 |
| 29. | Pike Creek Valley | 41.9% | 38.6%(+3.30)#29 | 37.3%(+4.60)#7,067 |
| 30. | Kent Acres | 41.8% | 38.6%(+3.20)#30 | 37.3%(+4.50)#7,103 |
| 31. | Magnolia | 41.5% | 38.6%(+2.90)#31 | 37.3%(+4.20)#7,217 |
| 32. | Lincoln | 39.5% | 38.6%(+0.900)#32 | 37.3%(+2.20)#7,899 |
| 33. | Rising Sun Lebanon | 39.1% | 38.6%(+0.500)#33 | 37.3%(+1.80)#8,024 |
| 34. | Arden | 38.6% | 38.6%(=0.000)#34 | 37.3%(+1.30)#8,245 |
| 35. | Ocean View | 38.5% | 38.6%(-0.100)#35 | 37.3%(+1.20)#8,279 |
| 36. | Claymont | 36.9% | 38.6%(-1.70)#36 | 37.3%(-0.400)#8,903 |
| 37. | Bear | 36.5% | 38.6%(-2.10)#37 | 37.3%(-0.800)#9,038 |
| 38. | Bowers | 35.4% | 38.6%(-3.20)#38 | 37.3%(-1.90)#9,538 |
| 39. | Wilmington Manor | 35.3% | 38.6%(-3.30)#39 | 37.3%(-2.00)#9,560 |
| 40. | Cheswold | 35.1% | 38.6%(-3.50)#40 | 37.3%(-2.20)#9,654 |
| 41. | Bellefonte | 34.8% | 38.6%(-3.80)#41 | 37.3%(-2.50)#9,790 |
| 42. | Newark | 33.2% | 38.6%(-5.40)#42 | 37.3%(-4.10)#10,553 |
| 43. | Little Creek | 32.3% | 38.6%(-6.30)#43 | 37.3%(-5.00)#11,013 |
| 44. | Brookside | 31.7% | 38.6%(-6.90)#44 | 37.3%(-5.60)#11,266 |
| 45. | Edgemoor | 31.7% | 38.6%(-6.90)#45 | 37.3%(-5.60)#11,270 |
| 46. | Newport | 30.0% | 38.6%(-8.60)#46 | 37.3%(-7.30)#12,179 |
| 47. | Felton | 29.9% | 38.6%(-8.70)#47 | 37.3%(-7.40)#12,261 |
| 48. | Elsmere | 29.2% | 38.6%(-9.40)#48 | 37.3%(-8.10)#12,623 |
| 49. | Milton | 29.0% | 38.6%(-9.60)#49 | 37.3%(-8.30)#12,729 |
| 50. | Frankford | 29.0% | 38.6%(-9.60)#50 | 37.3%(-8.30)#12,756 |
| 51. | Millsboro | 28.1% | 38.6%(-10.5)#51 | 37.3%(-9.20)#13,341 |
| 52. | Bethel | 28.1% | 38.6%(-10.5)#52 | 37.3%(-9.20)#13,367 |
| 53. | Bridgeville | 27.5% | 38.6%(-11.1)#53 | 37.3%(-9.80)#13,720 |
| 54. | Smyrna | 27.2% | 38.6%(-11.4)#54 | 37.3%(-10.1)#13,909 |
| 55. | Wyoming | 26.3% | 38.6%(-12.3)#55 | 37.3%(-11.0)#14,544 |
| 56. | Wilmington | 25.9% | 38.6%(-12.7)#56 | 37.3%(-11.4)#14,805 |
| 57. | Delaware City | 24.7% | 38.6%(-13.9)#57 | 37.3%(-12.6)#15,706 |
| 58. | Dover | 22.8% | 38.6%(-15.8)#58 | 37.3%(-14.5)#17,058 |
| 59. | Greenwood | 21.9% | 38.6%(-16.7)#59 | 37.3%(-15.4)#17,780 |
| 60. | Woodside East | 21.8% | 38.6%(-16.8)#60 | 37.3%(-15.5)#17,850 |
| 61. | Seaford | 21.1% | 38.6%(-17.5)#61 | 37.3%(-16.2)#18,344 |
| 62. | Camden | 20.3% | 38.6%(-18.3)#62 | 37.3%(-17.0)#18,976 |
| 63. | Leipsic | 20.3% | 38.6%(-18.3)#63 | 37.3%(-17.0)#19,028 |
| 64. | Farmington | 20.2% | 38.6%(-18.4)#64 | 37.3%(-17.1)#19,100 |
| 65. | Long Neck | 20.1% | 38.6%(-18.5)#65 | 37.3%(-17.2)#19,135 |
| 66. | Milford | 19.9% | 38.6%(-18.7)#66 | 37.3%(-17.4)#19,311 |
| 67. | Port Penn | 19.7% | 38.6%(-18.9)#67 | 37.3%(-17.6)#19,525 |
| 68. | Dagsboro | 19.5% | 38.6%(-19.1)#68 | 37.3%(-17.8)#19,636 |
| 69. | Georgetown | 19.4% | 38.6%(-19.2)#69 | 37.3%(-17.9)#19,691 |
| 70. | Delmar | 17.3% | 38.6%(-21.3)#70 | 37.3%(-20.0)#21,355 |
| 71. | Harrington | 16.9% | 38.6%(-21.7)#71 | 37.3%(-20.4)#21,649 |
| 72. | Woodside | 16.7% | 38.6%(-21.9)#72 | 37.3%(-20.6)#21,855 |
| 73. | Ellendale | 16.6% | 38.6%(-22.0)#73 | 37.3%(-20.7)#21,960 |
| 74. | Rodney Village | 14.4% | 38.6%(-24.2)#74 | 37.3%(-22.9)#23,646 |
| 75. | Blades | 14.2% | 38.6%(-24.4)#75 | 37.3%(-23.1)#23,801 |
| 76. | Frederica | 13.1% | 38.6%(-25.5)#76 | 37.3%(-24.2)#24,561 |
| 77. | Dover Base Housing | 12.2% | 38.6%(-26.4)#77 | 37.3%(-25.1)#25,112 |
| 78. | Laurel | 9.2% | 38.6%(-29.4)#78 | 37.3%(-28.1)#26,890 |
| 79. | Kenton | 2.1% | 38.6%(-36.5)#79 | 37.3%(-35.2)#29,289 |
1
Common Questions
What are the Top 10 Cities with the Highest Percentage of Households with Income Above $100,000 in Delaware?
Top 10 Cities with the Highest Percentage of Households with Income Above $100,000 in Delaware are:
#1
83.1%
#2
75.0%
#3
74.6%
#4
71.1%
#5
69.5%
#6
68.2%
#7
66.7%
#8
65.9%
#9
65.0%
#10
64.0%
What city has the Highest Percentage of Households with Income Above $100,000 in Delaware?
Hartly has the Highest Percentage of Households with Income Above $100,000 in Delaware with 83.1%.
What is the Percentage of Households with Income Above $100,000 in the State of Delaware?
Percentage of Households with Income Above $100,000 in Delaware is 38.6%.
What is the Percentage of Households with Income Above $100,000 in the United States?
Percentage of Households with Income Above $100,000 in the United States is 37.3%.