Rome, GA
Rome Map
Rome Overview
37,621
TOTAL POPULATION
17,449
MALE POPULATION
20,172
FEMALE POPULATION
86.50
MALES / 100 FEMALES
115.61
FEMALES / 100 MALES
36.9
MEDIAN AGE
3.3
AVG FAMILY SIZE
2.5
AVG HOUSEHOLD SIZE
$29,996
PER CAPITA INCOME
$66,418
AVG FAMILY INCOME
$48,512
AVG HOUSEHOLD INCOME
25.6%
WAGE / INCOME GAP [ % ]
74.4¢/ $1
WAGE / INCOME GAP [ $ ]
$10,526
FAMILY INCOME DEFICIT
0.50
INEQUALITY / GINI INDEX
16,489
LABOR FORCE [ PEOPLE ]
56.1%
PERCENT IN LABOR FORCE
4.5%
UNEMPLOYMENT RATE
Rome Area Codes
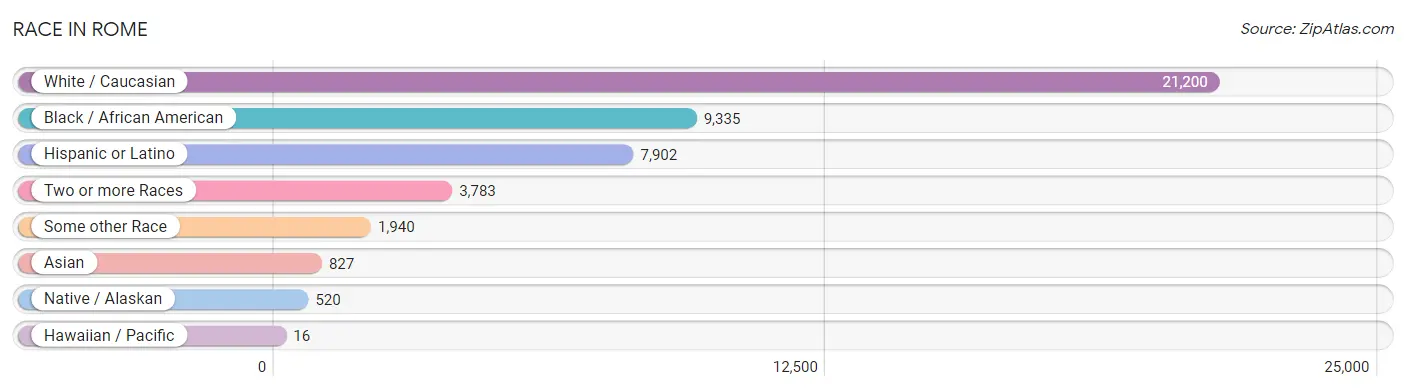
Race in Rome
The most populous races in Rome are White / Caucasian (21,200 | 56.4%), Black / African American (9,335 | 24.8%), and Hispanic or Latino (7,902 | 21.0%).
| Race | # Population | % Population |
| Asian | 827 | 2.2% |
| Black / African American | 9,335 | 24.8% |
| Hawaiian / Pacific | 16 | 0.0% |
| Hispanic or Latino | 7,902 | 21.0% |
| Native / Alaskan | 520 | 1.4% |
| White / Caucasian | 21,200 | 56.4% |
| Two or more Races | 3,783 | 10.1% |
| Some other Race | 1,940 | 5.2% |
| Total | 37,621 | 100.0% |
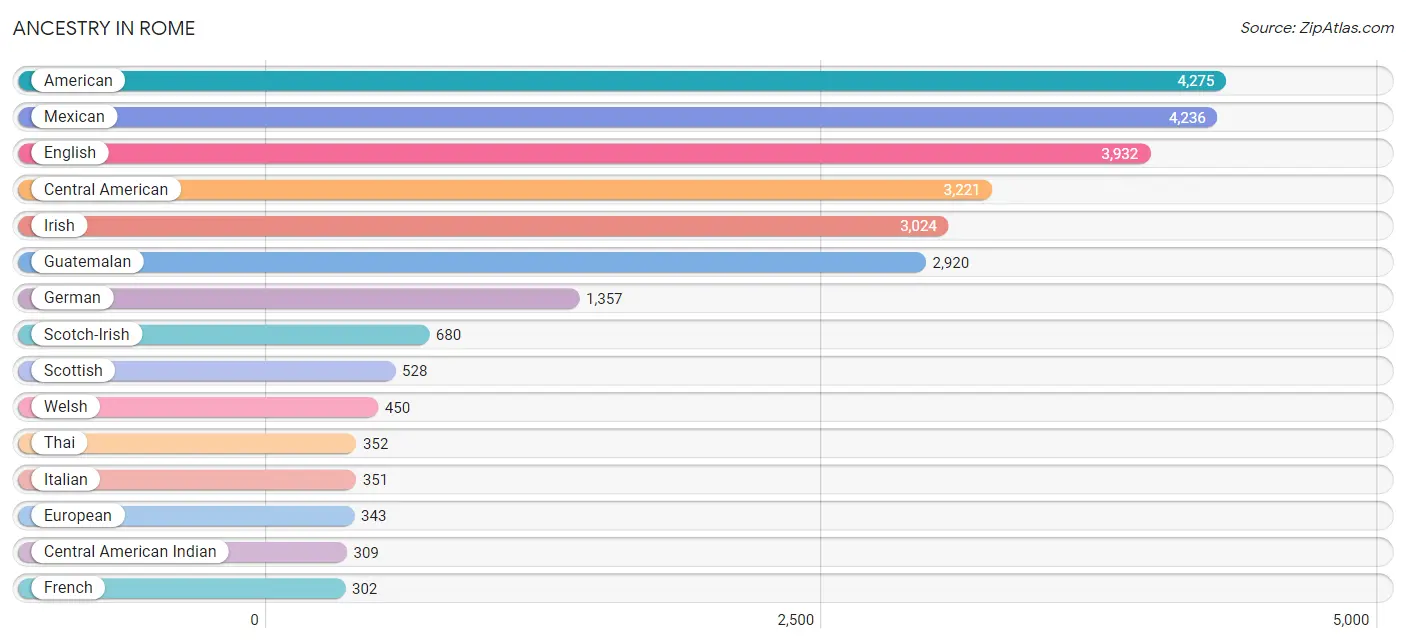
Ancestry in Rome
The most populous ancestries reported in Rome are American (4,275 | 11.4%), Mexican (4,236 | 11.3%), English (3,932 | 10.4%), Central American (3,221 | 8.6%), and Irish (3,024 | 8.0%), together accounting for 49.7% of all Rome residents.
| Ancestry | # Population | % Population |
| African | 69 | 0.2% |
| Alsatian | 1 | 0.0% |
| American | 4,275 | 11.4% |
| Arab | 133 | 0.4% |
| Argentinean | 12 | 0.0% |
| Australian | 9 | 0.0% |
| Austrian | 19 | 0.1% |
| Belgian | 21 | 0.1% |
| Bhutanese | 30 | 0.1% |
| Blackfeet | 15 | 0.0% |
| Brazilian | 9 | 0.0% |
| British | 265 | 0.7% |
| Burmese | 140 | 0.4% |
| Canadian | 11 | 0.0% |
| Central American | 3,221 | 8.6% |
| Central American Indian | 309 | 0.8% |
| Cherokee | 63 | 0.2% |
| Cheyenne | 81 | 0.2% |
| Costa Rican | 9 | 0.0% |
| Croatian | 11 | 0.0% |
| Cuban | 11 | 0.0% |
| Czech | 23 | 0.1% |
| Danish | 14 | 0.0% |
| Dominican | 9 | 0.0% |
| Dutch | 88 | 0.2% |
| Eastern European | 46 | 0.1% |
| English | 3,932 | 10.4% |
| European | 343 | 0.9% |
| Finnish | 4 | 0.0% |
| French | 302 | 0.8% |
| German | 1,357 | 3.6% |
| Greek | 45 | 0.1% |
| Guamanian / Chamorro | 22 | 0.1% |
| Guatemalan | 2,920 | 7.8% |
| Honduran | 42 | 0.1% |
| Hungarian | 39 | 0.1% |
| Indian (Asian) | 167 | 0.4% |
| Irish | 3,024 | 8.0% |
| Israeli | 132 | 0.4% |
| Italian | 351 | 0.9% |
| Jamaican | 7 | 0.0% |
| Korean | 31 | 0.1% |
| Latvian | 15 | 0.0% |
| Lebanese | 17 | 0.1% |
| Lithuanian | 5 | 0.0% |
| Mexican | 4,236 | 11.3% |
| Mexican American Indian | 214 | 0.6% |
| Northern European | 62 | 0.2% |
| Norwegian | 86 | 0.2% |
| Pakistani | 26 | 0.1% |
| Palestinian | 116 | 0.3% |
| Polish | 139 | 0.4% |
| Portuguese | 8 | 0.0% |
| Puerto Rican | 267 | 0.7% |
| Romanian | 21 | 0.1% |
| Salvadoran | 250 | 0.7% |
| Samoan | 12 | 0.0% |
| Scandinavian | 24 | 0.1% |
| Scotch-Irish | 680 | 1.8% |
| Scottish | 528 | 1.4% |
| South American | 36 | 0.1% |
| Spaniard | 39 | 0.1% |
| Spanish | 55 | 0.2% |
| Sri Lankan | 230 | 0.6% |
| Subsaharan African | 100 | 0.3% |
| Swedish | 52 | 0.1% |
| Swiss | 17 | 0.1% |
| Thai | 352 | 0.9% |
| Ukrainian | 27 | 0.1% |
| Venezuelan | 24 | 0.1% |
| Welsh | 450 | 1.2% | View All 71 Rows |
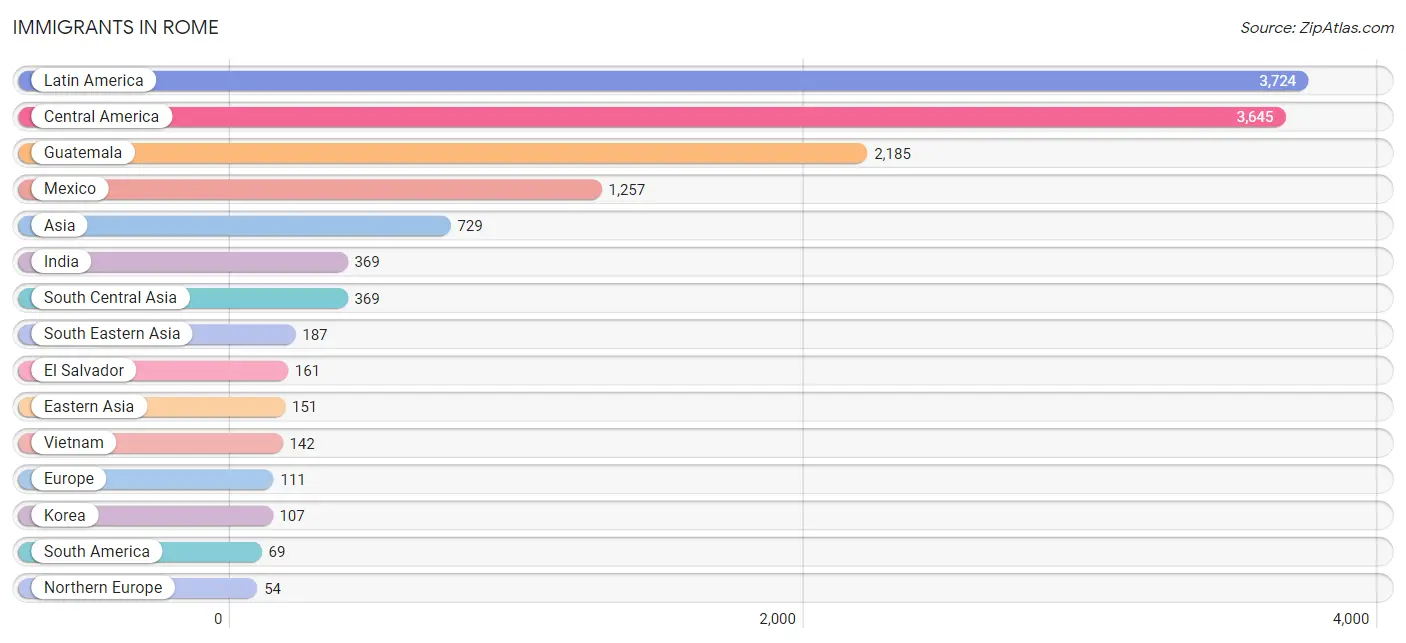
Immigrants in Rome
The most numerous immigrant groups reported in Rome came from Latin America (3,724 | 9.9%), Central America (3,645 | 9.7%), Guatemala (2,185 | 5.8%), Mexico (1,257 | 3.3%), and Asia (729 | 1.9%), together accounting for 30.7% of all Rome residents.
| Immigration Origin | # Population | % Population |
| Africa | 51 | 0.1% |
| Argentina | 12 | 0.0% |
| Asia | 729 | 1.9% |
| Australia | 9 | 0.0% |
| Brazil | 33 | 0.1% |
| Canada | 30 | 0.1% |
| Caribbean | 10 | 0.0% |
| Central America | 3,645 | 9.7% |
| China | 44 | 0.1% |
| Eastern Africa | 6 | 0.0% |
| Eastern Asia | 151 | 0.4% |
| El Salvador | 161 | 0.4% |
| England | 24 | 0.1% |
| Europe | 111 | 0.3% |
| Guatemala | 2,185 | 5.8% |
| Honduras | 42 | 0.1% |
| Hong Kong | 16 | 0.0% |
| India | 369 | 1.0% |
| Israel | 22 | 0.1% |
| Italy | 37 | 0.1% |
| Kenya | 6 | 0.0% |
| Korea | 107 | 0.3% |
| Latin America | 3,724 | 9.9% |
| Mexico | 1,257 | 3.3% |
| Middle Africa | 12 | 0.0% |
| Northern Africa | 8 | 0.0% |
| Northern Europe | 54 | 0.1% |
| Oceania | 9 | 0.0% |
| Philippines | 39 | 0.1% |
| South America | 69 | 0.2% |
| South Central Asia | 369 | 1.0% |
| South Eastern Asia | 187 | 0.5% |
| Southern Europe | 37 | 0.1% |
| Switzerland | 20 | 0.1% |
| Thailand | 6 | 0.0% |
| Venezuela | 24 | 0.1% |
| Vietnam | 142 | 0.4% |
| Western Africa | 25 | 0.1% |
| Western Asia | 22 | 0.1% |
| Western Europe | 20 | 0.1% | View All 40 Rows |
Sex and Age in Rome
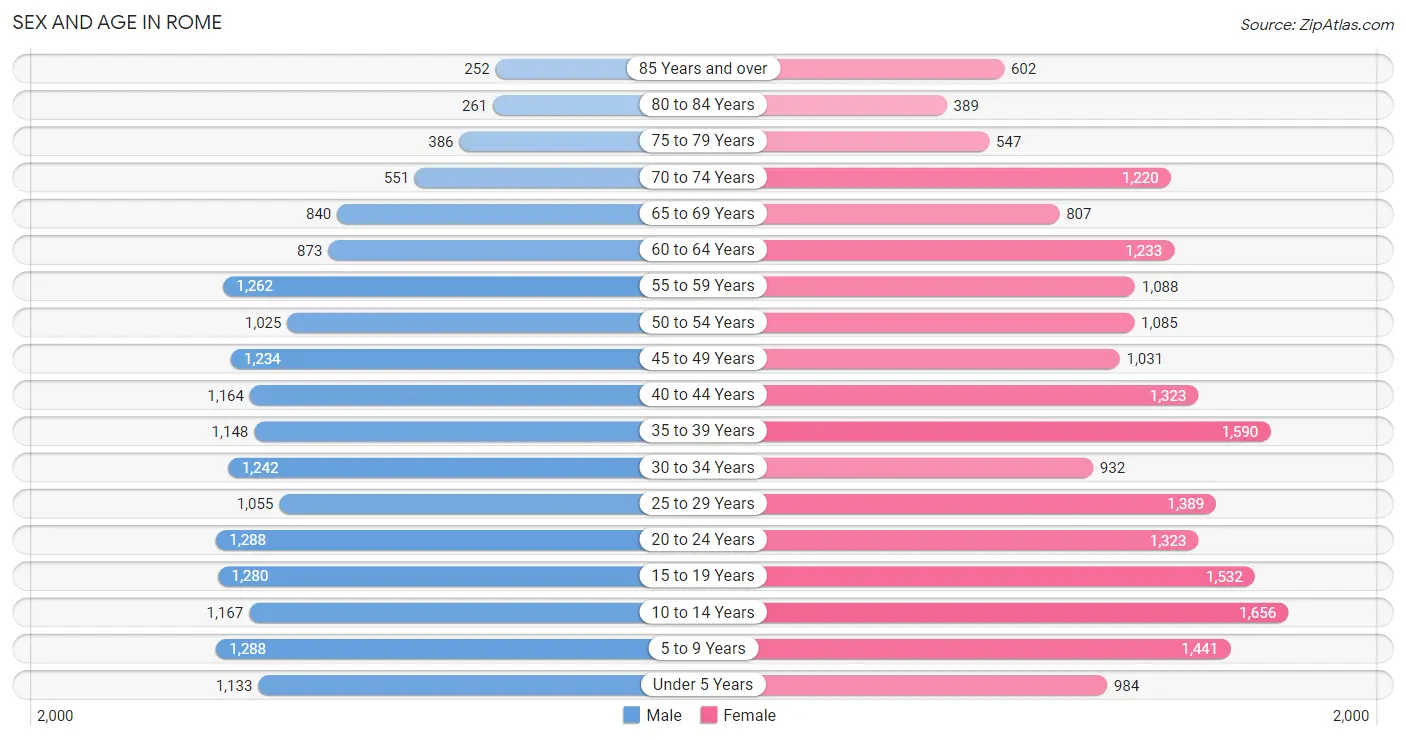
Sex and Age in Rome
The most populous age groups in Rome are 5 to 9 Years (1,288 | 7.4%) for men and 10 to 14 Years (1,656 | 8.2%) for women.
| Age Bracket | Male | Female |
| Under 5 Years | 1,133 (6.5%) | 984 (4.9%) |
| 5 to 9 Years | 1,288 (7.4%) | 1,441 (7.1%) |
| 10 to 14 Years | 1,167 (6.7%) | 1,656 (8.2%) |
| 15 to 19 Years | 1,280 (7.3%) | 1,532 (7.6%) |
| 20 to 24 Years | 1,288 (7.4%) | 1,323 (6.6%) |
| 25 to 29 Years | 1,055 (6.0%) | 1,389 (6.9%) |
| 30 to 34 Years | 1,242 (7.1%) | 932 (4.6%) |
| 35 to 39 Years | 1,148 (6.6%) | 1,590 (7.9%) |
| 40 to 44 Years | 1,164 (6.7%) | 1,323 (6.6%) |
| 45 to 49 Years | 1,234 (7.1%) | 1,031 (5.1%) |
| 50 to 54 Years | 1,025 (5.9%) | 1,085 (5.4%) |
| 55 to 59 Years | 1,262 (7.2%) | 1,088 (5.4%) |
| 60 to 64 Years | 873 (5.0%) | 1,233 (6.1%) |
| 65 to 69 Years | 840 (4.8%) | 807 (4.0%) |
| 70 to 74 Years | 551 (3.2%) | 1,220 (6.0%) |
| 75 to 79 Years | 386 (2.2%) | 547 (2.7%) |
| 80 to 84 Years | 261 (1.5%) | 389 (1.9%) |
| 85 Years and over | 252 (1.4%) | 602 (3.0%) |
| Total | 17,449 (100.0%) | 20,172 (100.0%) |
Families and Households in Rome
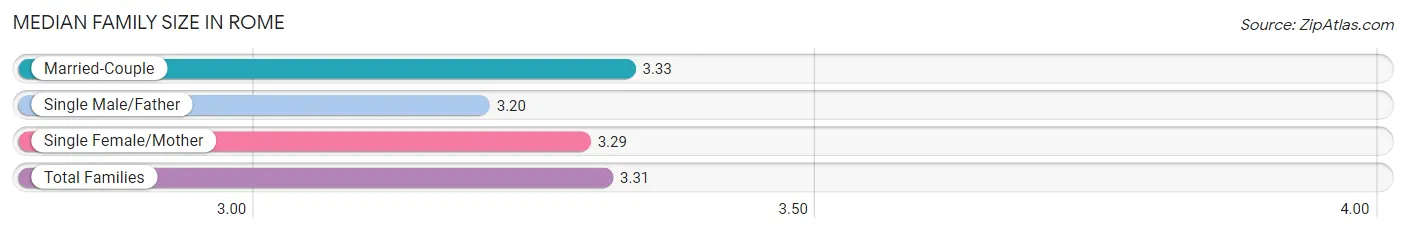
Median Family Size in Rome
The median family size in Rome is 3.31 persons per family, with married-couple families (5,313 | 61.6%) accounting for the largest median family size of 3.33 persons per family. On the other hand, single male/father families (600 | 7.0%) represent the smallest median family size with 3.20 persons per family.
| Family Type | # Families | Family Size |
| Married-Couple | 5,313 (61.6%) | 3.33 |
| Single Male/Father | 600 (7.0%) | 3.20 |
| Single Female/Mother | 2,718 (31.5%) | 3.29 |
| Total Families | 8,631 (100.0%) | 3.31 |
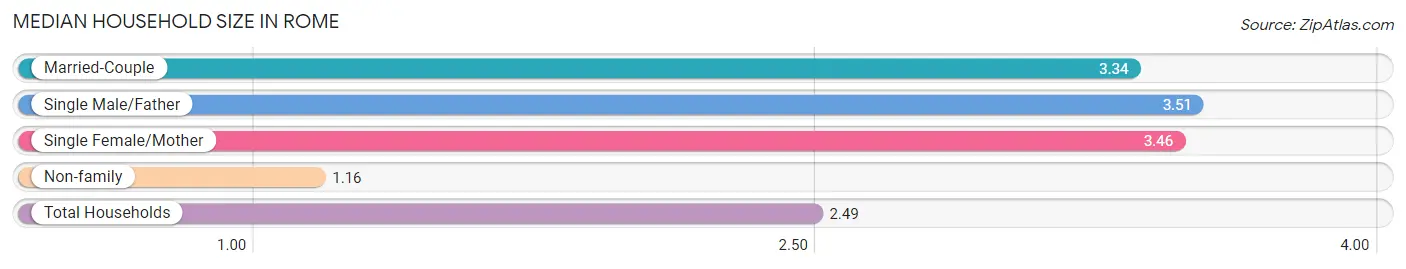
Median Household Size in Rome
The median household size in Rome is 2.49 persons per household, with single male/father households (600 | 4.1%) accounting for the largest median household size of 3.51 persons per household. non-family households (5,870 | 40.5%) represent the smallest median household size with 1.16 persons per household.
| Household Type | # Households | Household Size |
| Married-Couple | 5,313 (36.6%) | 3.34 |
| Single Male/Father | 600 (4.1%) | 3.51 |
| Single Female/Mother | 2,718 (18.7%) | 3.46 |
| Non-family | 5,870 (40.5%) | 1.16 |
| Total Households | 14,501 (100.0%) | 2.49 |
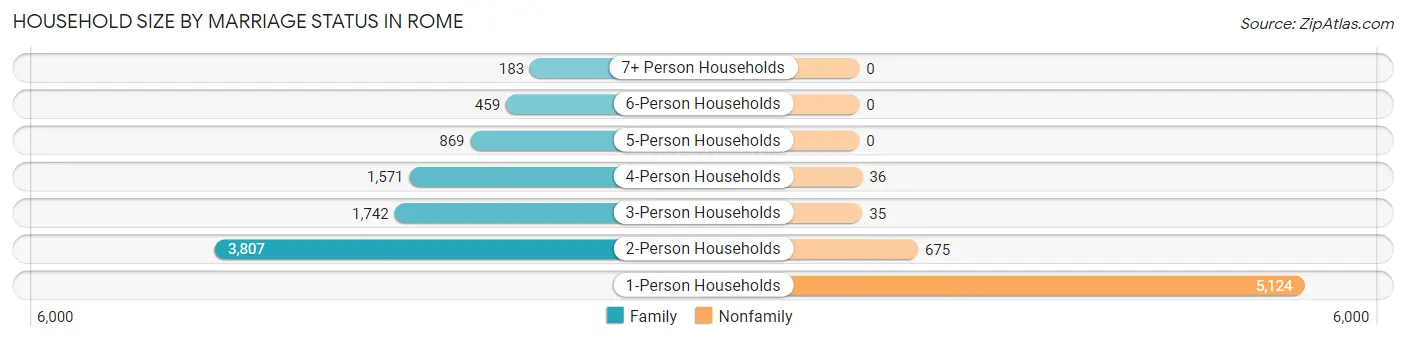
Household Size by Marriage Status in Rome
Out of a total of 14,501 households in Rome, 8,631 (59.5%) are family households, while 5,870 (40.5%) are nonfamily households. The most numerous type of family households are 2-person households, comprising 3,807, and the most common type of nonfamily households are 1-person households, comprising 5,124.
| Household Size | Family Households | Nonfamily Households |
| 1-Person Households | - | 5,124 (35.3%) |
| 2-Person Households | 3,807 (26.3%) | 675 (4.6%) |
| 3-Person Households | 1,742 (12.0%) | 35 (0.2%) |
| 4-Person Households | 1,571 (10.8%) | 36 (0.3%) |
| 5-Person Households | 869 (6.0%) | 0 (0.0%) |
| 6-Person Households | 459 (3.2%) | 0 (0.0%) |
| 7+ Person Households | 183 (1.3%) | 0 (0.0%) |
| Total | 8,631 (59.5%) | 5,870 (40.5%) |
Female Fertility in Rome
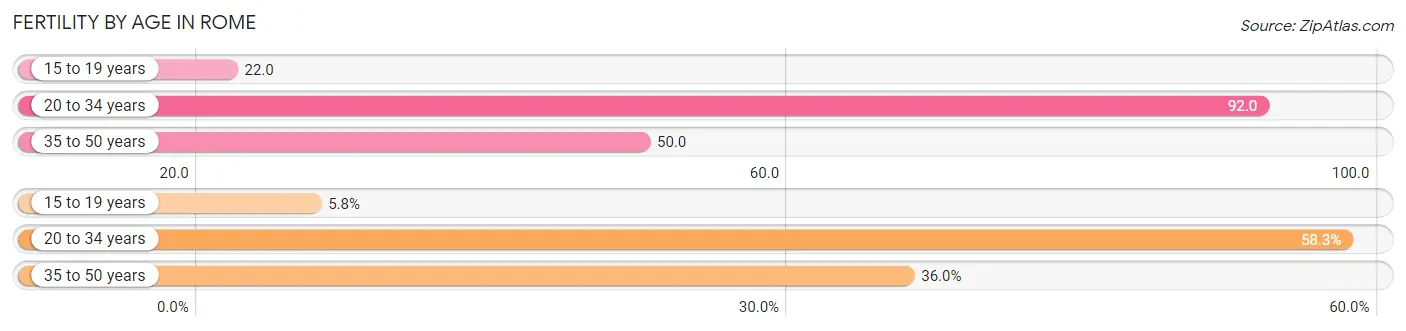
Fertility by Age in Rome
Average fertility rate in Rome is 62.0 births per 1,000 women. Women in the age bracket of 20 to 34 years have the highest fertility rate with 92.0 births per 1,000 women. Women in the age bracket of 20 to 34 years acount for 58.3% of all women with births.
| Age Bracket | Women with Births | Births / 1,000 Women |
| 15 to 19 years | 33 (5.8%) | 22.0 |
| 20 to 34 years | 334 (58.3%) | 92.0 |
| 35 to 50 years | 206 (35.9%) | 50.0 |
| Total | 573 (100.0%) | 62.0 |
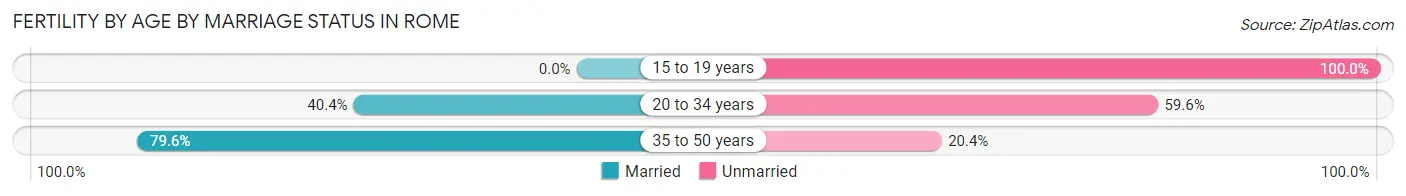
Fertility by Age by Marriage Status in Rome
52.2% of women with births (573) in Rome are married. The highest percentage of unmarried women with births falls into 15 to 19 years age bracket with 100.0% of them unmarried at the time of birth, while the lowest percentage of unmarried women with births belong to 35 to 50 years age bracket with 20.4% of them unmarried.
| Age Bracket | Married | Unmarried |
| 15 to 19 years | 0 (0.0%) | 33 (100.0%) |
| 20 to 34 years | 135 (40.4%) | 199 (59.6%) |
| 35 to 50 years | 164 (79.6%) | 42 (20.4%) |
| Total | 299 (52.2%) | 274 (47.8%) |
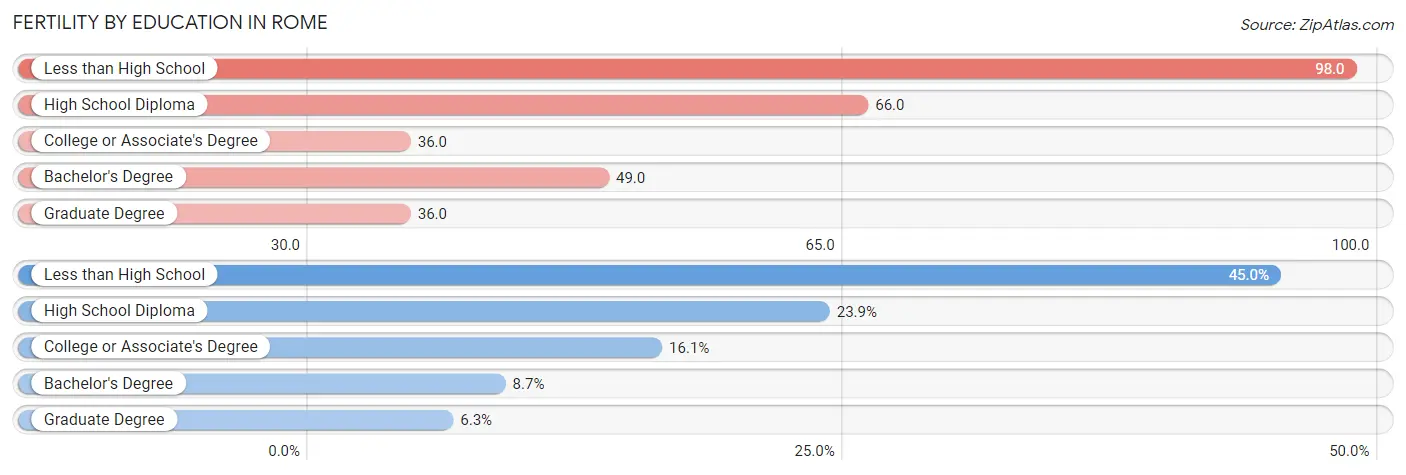
Fertility by Education in Rome
Average fertility rate in Rome is 62.0 births per 1,000 women. Women with the education attainment of less than high school have the highest fertility rate of 98.0 births per 1,000 women, while women with the education attainment of college or associate's degree have the lowest fertility at 36.0 births per 1,000 women. Women with the education attainment of less than high school represent 45.0% of all women with births.
| Educational Attainment | Women with Births | Births / 1,000 Women |
| Less than High School | 258 (45.0%) | 98.0 |
| High School Diploma | 137 (23.9%) | 66.0 |
| College or Associate's Degree | 92 (16.1%) | 36.0 |
| Bachelor's Degree | 50 (8.7%) | 49.0 |
| Graduate Degree | 36 (6.3%) | 36.0 |
| Total | 573 (100.0%) | 62.0 |
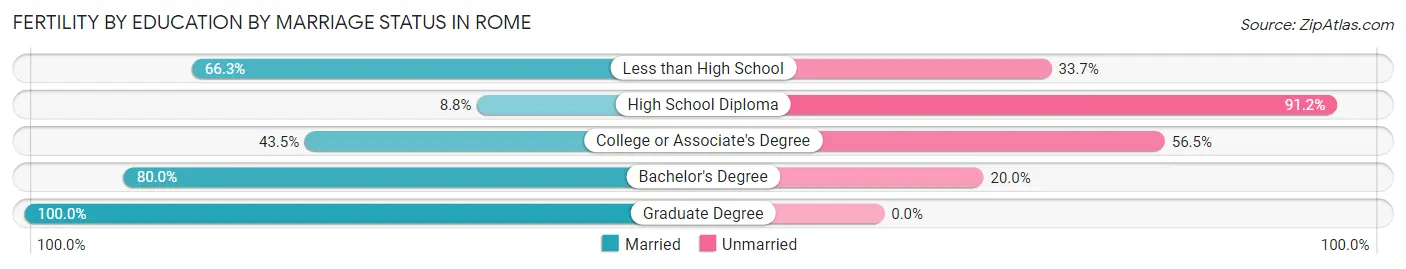
Fertility by Education by Marriage Status in Rome
47.8% of women with births in Rome are unmarried. Women with the educational attainment of graduate degree are most likely to be married with 100.0% of them married at childbirth, while women with the educational attainment of high school diploma are least likely to be married with 91.2% of them unmarried at childbirth.
| Educational Attainment | Married | Unmarried |
| Less than High School | 171 (66.3%) | 87 (33.7%) |
| High School Diploma | 12 (8.8%) | 125 (91.2%) |
| College or Associate's Degree | 40 (43.5%) | 52 (56.5%) |
| Bachelor's Degree | 40 (80.0%) | 10 (20.0%) |
| Graduate Degree | 36 (100.0%) | 0 (0.0%) |
| Total | 299 (52.2%) | 274 (47.8%) |
Income in Rome
Income Overview in Rome
Per Capita Income in Rome is $29,996, while median incomes of families and households are $66,418 and $48,512 respectively.
| Characteristic | Number | Measure |
| Per Capita Income | 37,621 | $29,996 |
| Median Family Income | 8,631 | $66,418 |
| Mean Family Income | 8,631 | $88,987 |
| Median Household Income | 14,501 | $48,512 |
| Mean Household Income | 14,501 | $74,034 |
| Income Deficit | 8,631 | $10,526 |
| Wage / Income Gap (%) | 37,621 | 25.59% |
| Wage / Income Gap ($) | 37,621 | 74.41¢ per $1 |
| Gini / Inequality Index | 37,621 | 0.50 |
Earnings by Sex in Rome
Average Earnings in Rome are $31,663, $36,136 for men and $26,887 for women, a difference of 25.6%.
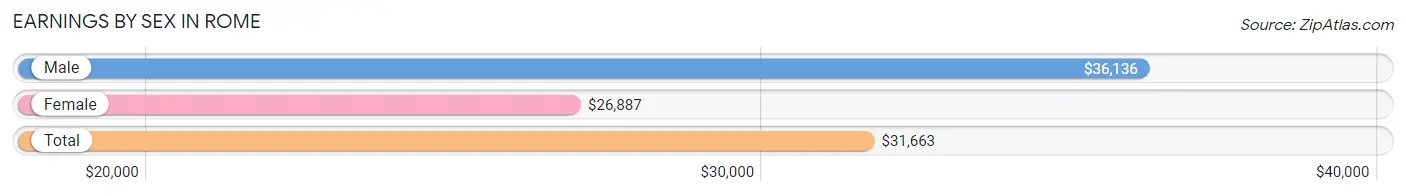
| Sex | Number | Average Earnings |
| Male | 9,018 (50.8%) | $36,136 |
| Female | 8,734 (49.2%) | $26,887 |
| Total | 17,752 (100.0%) | $31,663 |
Earnings by Sex by Income Bracket in Rome
The most common earnings brackets in Rome are $100,000+ for men (1,103 | 12.2%) and $30,000 to $34,999 for women (748 | 8.6%).
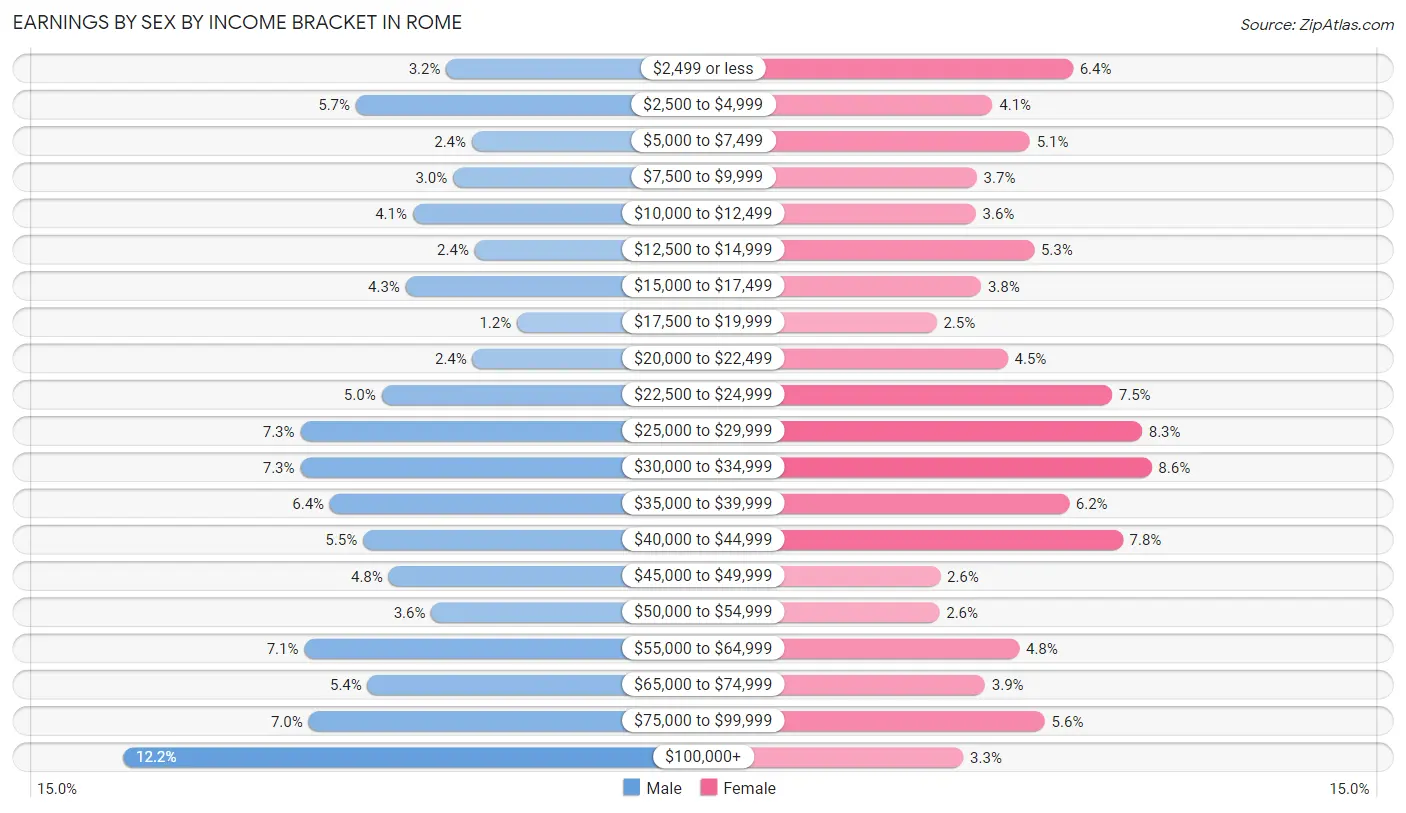
| Income | Male | Female |
| $2,499 or less | 284 (3.2%) | 555 (6.4%) |
| $2,500 to $4,999 | 513 (5.7%) | 357 (4.1%) |
| $5,000 to $7,499 | 219 (2.4%) | 449 (5.1%) |
| $7,500 to $9,999 | 267 (3.0%) | 319 (3.6%) |
| $10,000 to $12,499 | 369 (4.1%) | 316 (3.6%) |
| $12,500 to $14,999 | 212 (2.4%) | 459 (5.3%) |
| $15,000 to $17,499 | 387 (4.3%) | 329 (3.8%) |
| $17,500 to $19,999 | 105 (1.2%) | 220 (2.5%) |
| $20,000 to $22,499 | 217 (2.4%) | 395 (4.5%) |
| $22,500 to $24,999 | 448 (5.0%) | 651 (7.4%) |
| $25,000 to $29,999 | 654 (7.2%) | 724 (8.3%) |
| $30,000 to $34,999 | 654 (7.2%) | 748 (8.6%) |
| $35,000 to $39,999 | 579 (6.4%) | 545 (6.2%) |
| $40,000 to $44,999 | 495 (5.5%) | 677 (7.7%) |
| $45,000 to $49,999 | 430 (4.8%) | 229 (2.6%) |
| $50,000 to $54,999 | 322 (3.6%) | 227 (2.6%) |
| $55,000 to $64,999 | 644 (7.1%) | 423 (4.8%) |
| $65,000 to $74,999 | 483 (5.4%) | 339 (3.9%) |
| $75,000 to $99,999 | 633 (7.0%) | 486 (5.6%) |
| $100,000+ | 1,103 (12.2%) | 286 (3.3%) |
| Total | 9,018 (100.0%) | 8,734 (100.0%) |
Earnings by Sex by Educational Attainment in Rome
Average earnings in Rome are $39,874 for men and $31,668 for women, a difference of 20.6%. Men with an educational attainment of graduate degree enjoy the highest average annual earnings of $80,847, while those with less than high school education earn the least with $32,809. Women with an educational attainment of graduate degree earn the most with the average annual earnings of $65,077, while those with less than high school education have the smallest earnings of $22,014.
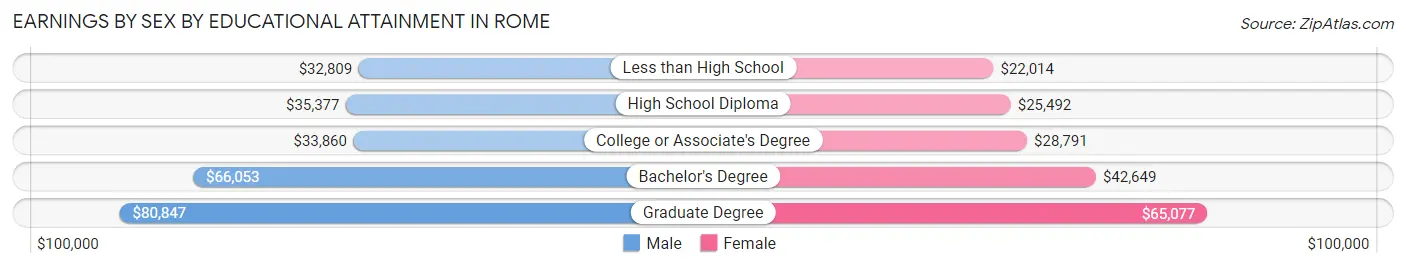
| Educational Attainment | Male Income | Female Income |
| Less than High School | $32,809 | $22,014 |
| High School Diploma | $35,377 | $25,492 |
| College or Associate's Degree | $33,860 | $28,791 |
| Bachelor's Degree | $66,053 | $42,649 |
| Graduate Degree | $80,847 | $65,077 |
| Total | $39,874 | $31,668 |
Family Income in Rome
Family Income Brackets in Rome
According to the Rome family income data, there are 1,493 families falling into the $100,000 to $149,999 income range, which is the most common income bracket and makes up 17.3% of all families. Conversely, the $10,000 to $14,999 income bracket is the least frequent group with only 371 families (4.3%) belonging to this category.
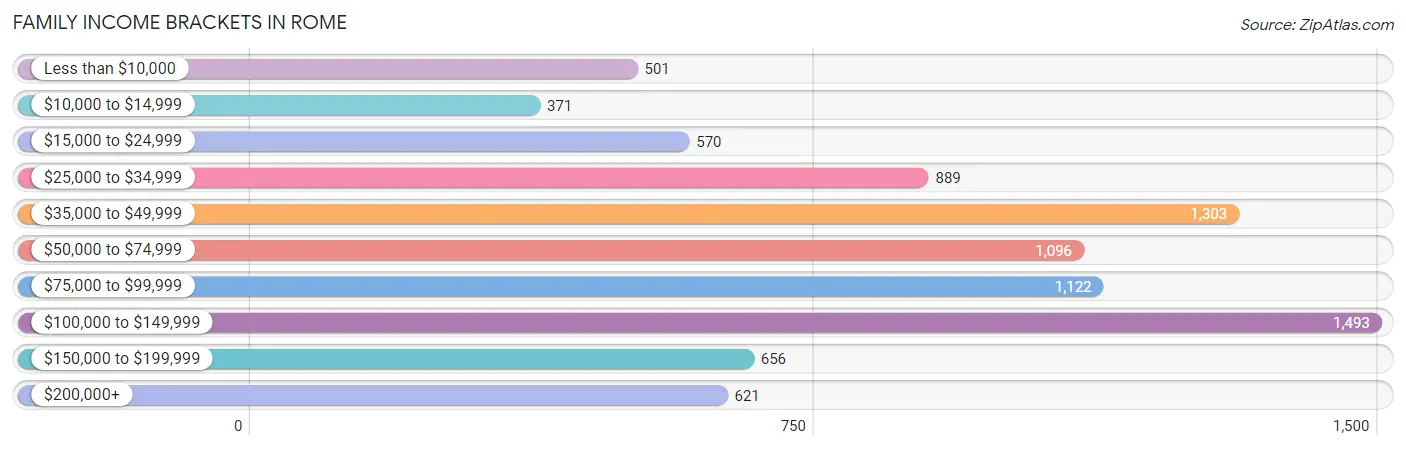
| Income Bracket | # Families | % Families |
| Less than $10,000 | 501 | 5.8% |
| $10,000 to $14,999 | 371 | 4.3% |
| $15,000 to $24,999 | 570 | 6.6% |
| $25,000 to $34,999 | 889 | 10.3% |
| $35,000 to $49,999 | 1,303 | 15.1% |
| $50,000 to $74,999 | 1,096 | 12.7% |
| $75,000 to $99,999 | 1,122 | 13.0% |
| $100,000 to $149,999 | 1,493 | 17.3% |
| $150,000 to $199,999 | 656 | 7.6% |
| $200,000+ | 621 | 7.2% |
Family Income by Famaliy Size in Rome
7+ person families (166 | 1.9%) account for the highest median family income in Rome with $152,615 per family, while 2-person families (3,979 | 46.1%) have the highest median income of $28,388 per family member.
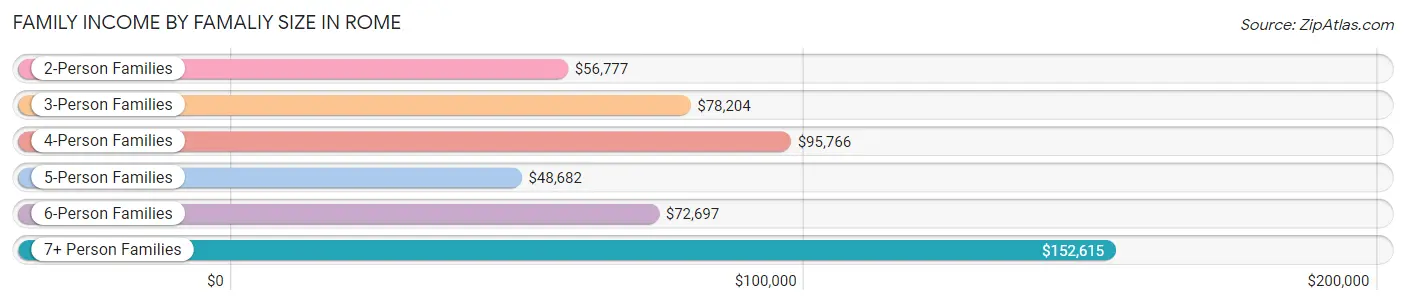
| Income Bracket | # Families | Median Income |
| 2-Person Families | 3,979 (46.1%) | $56,777 |
| 3-Person Families | 1,626 (18.8%) | $78,204 |
| 4-Person Families | 1,563 (18.1%) | $95,766 |
| 5-Person Families | 951 (11.0%) | $48,682 |
| 6-Person Families | 346 (4.0%) | $72,697 |
| 7+ Person Families | 166 (1.9%) | $152,615 |
| Total | 8,631 (100.0%) | $66,418 |
Family Income by Number of Earners in Rome
The median family income in Rome is $66,418, with families comprising 3+ earners (988) having the highest median family income of $130,463, while families with no earners (1,455) have the lowest median family income of $36,016, accounting for 11.5% and 16.9% of families, respectively.
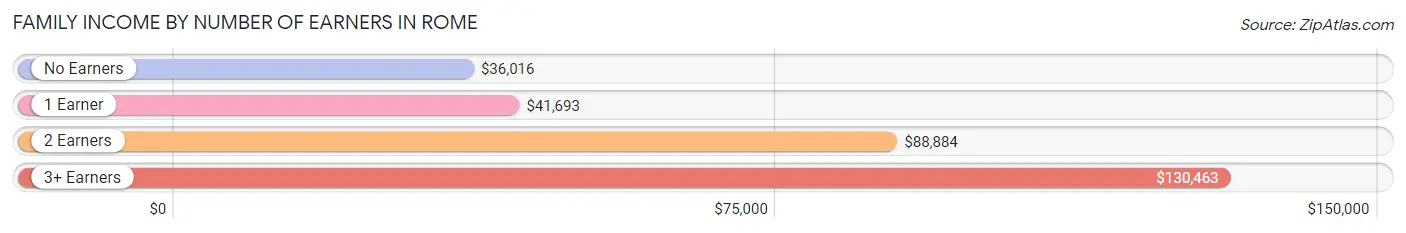
| Number of Earners | # Families | Median Income |
| No Earners | 1,455 (16.9%) | $36,016 |
| 1 Earner | 2,914 (33.8%) | $41,693 |
| 2 Earners | 3,274 (37.9%) | $88,884 |
| 3+ Earners | 988 (11.5%) | $130,463 |
| Total | 8,631 (100.0%) | $66,418 |
Household Income in Rome
Household Income Brackets in Rome
With 2,349 households falling in the category, the $35,000 to $49,999 income range is the most frequent in Rome, accounting for 16.2% of all households. In contrast, only 725 households (5.0%) fall into the $150,000 to $199,999 income bracket, making it the least populous group.
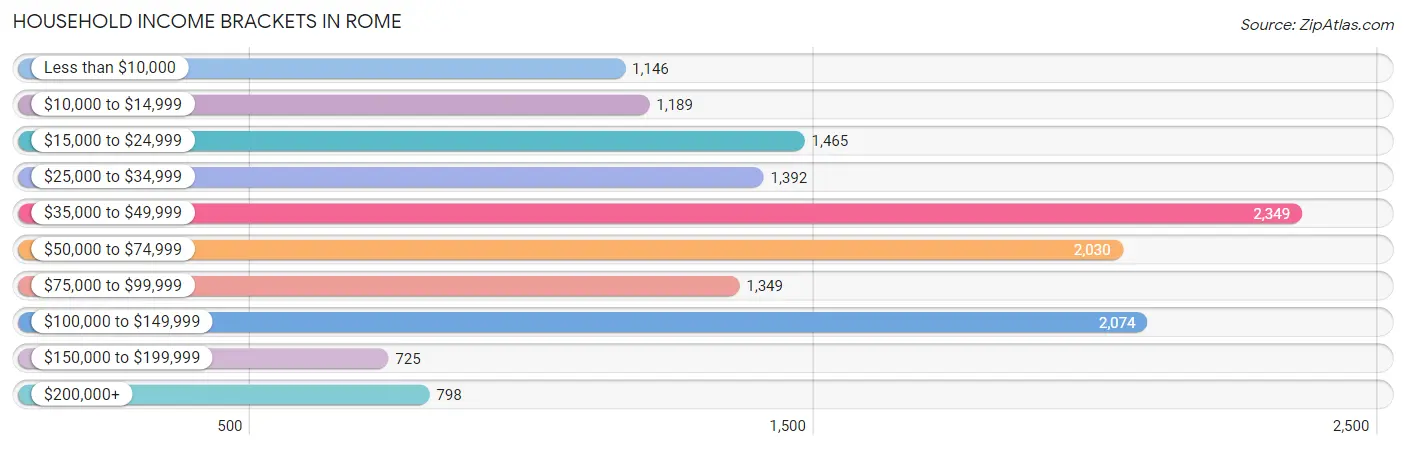
| Income Bracket | # Households | % Households |
| Less than $10,000 | 1,146 | 7.9% |
| $10,000 to $14,999 | 1,189 | 8.2% |
| $15,000 to $24,999 | 1,465 | 10.1% |
| $25,000 to $34,999 | 1,392 | 9.6% |
| $35,000 to $49,999 | 2,349 | 16.2% |
| $50,000 to $74,999 | 2,030 | 14.0% |
| $75,000 to $99,999 | 1,349 | 9.3% |
| $100,000 to $149,999 | 2,074 | 14.3% |
| $150,000 to $199,999 | 725 | 5.0% |
| $200,000+ | 798 | 5.5% |
Household Income by Householder Age in Rome
The median household income in Rome is $48,512, with the highest median household income of $49,630 found in the 25 to 44 years age bracket for the primary householder. A total of 4,774 households (32.9%) fall into this category. Meanwhile, the 15 to 24 years age bracket for the primary householder has the lowest median household income of $41,500, with 600 households (4.1%) in this group.
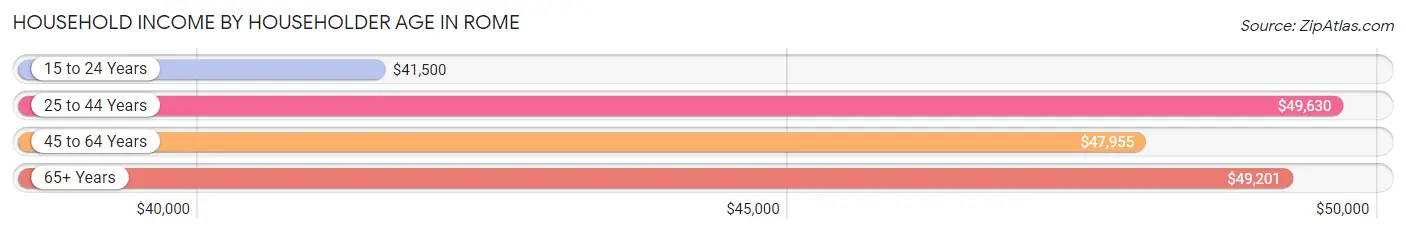
| Income Bracket | # Households | Median Income |
| 15 to 24 Years | 600 (4.1%) | $41,500 |
| 25 to 44 Years | 4,774 (32.9%) | $49,630 |
| 45 to 64 Years | 5,263 (36.3%) | $47,955 |
| 65+ Years | 3,864 (26.7%) | $49,201 |
| Total | 14,501 (100.0%) | $48,512 |
Poverty in Rome
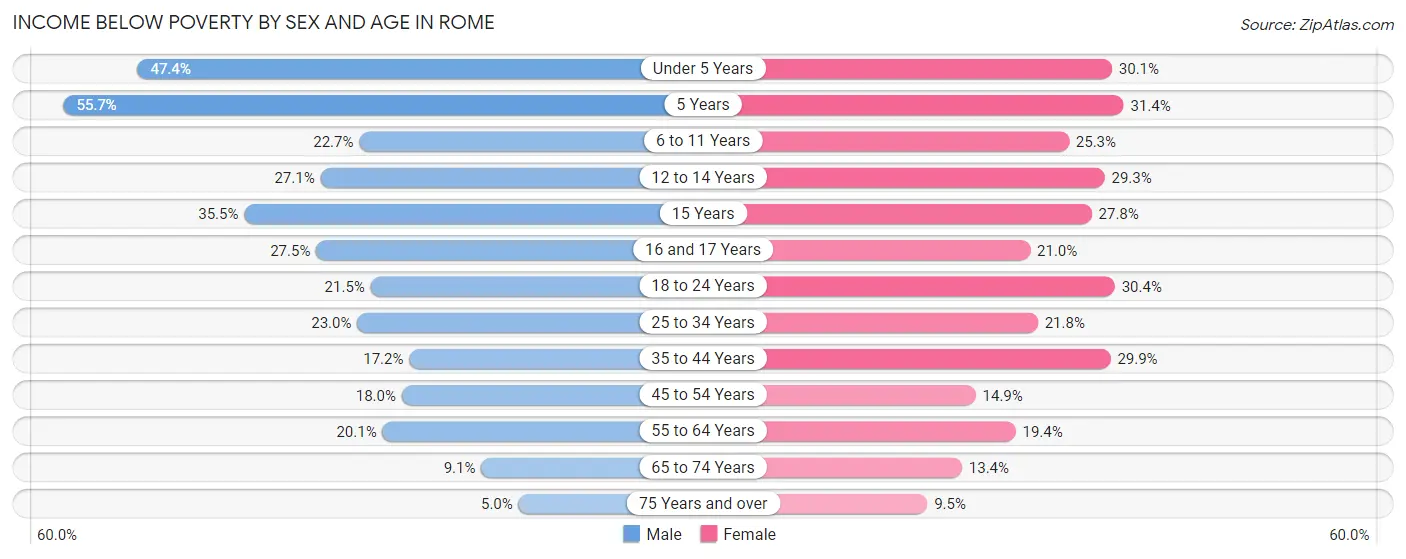
Income Below Poverty by Sex and Age in Rome
With 21.9% poverty level for males and 22.5% for females among the residents of Rome, 5 year old males and 5 year old females are the most vulnerable to poverty, with 216 males (55.7%) and 91 females (31.4%) in their respective age groups living below the poverty level.
| Age Bracket | Male | Female |
| Under 5 Years | 524 (47.4%) | 296 (30.1%) |
| 5 Years | 216 (55.7%) | 91 (31.4%) |
| 6 to 11 Years | 300 (22.7%) | 472 (25.3%) |
| 12 to 14 Years | 185 (27.1%) | 261 (29.3%) |
| 15 Years | 70 (35.5%) | 101 (27.8%) |
| 16 and 17 Years | 161 (27.5%) | 99 (21.0%) |
| 18 to 24 Years | 352 (21.5%) | 583 (30.4%) |
| 25 to 34 Years | 495 (23.0%) | 498 (21.8%) |
| 35 to 44 Years | 375 (17.2%) | 869 (29.9%) |
| 45 to 54 Years | 375 (18.0%) | 314 (14.9%) |
| 55 to 64 Years | 421 (20.1%) | 444 (19.4%) |
| 65 to 74 Years | 125 (9.1%) | 269 (13.4%) |
| 75 Years and over | 40 (5.0%) | 115 (9.5%) |
| Total | 3,639 (21.9%) | 4,412 (22.5%) |
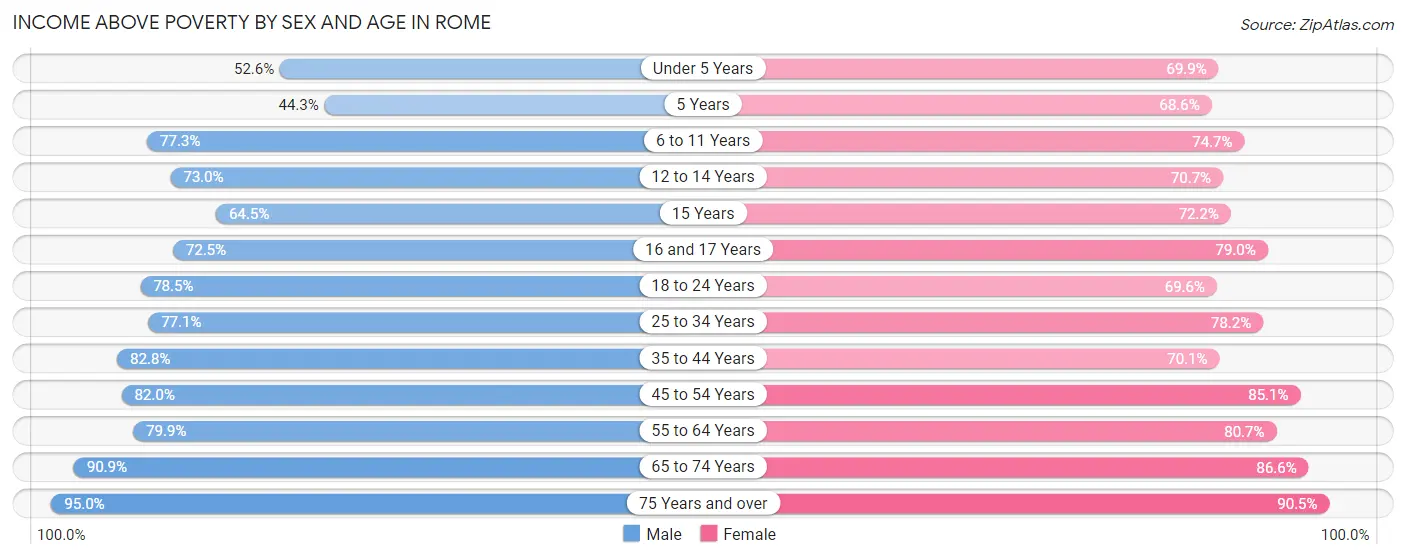
Income Above Poverty by Sex and Age in Rome
According to the poverty statistics in Rome, males aged 75 years and over and females aged 75 years and over are the age groups that are most secure financially, with 95.0% of males and 90.5% of females in these age groups living above the poverty line.
| Age Bracket | Male | Female |
| Under 5 Years | 581 (52.6%) | 688 (69.9%) |
| 5 Years | 172 (44.3%) | 199 (68.6%) |
| 6 to 11 Years | 1,020 (77.3%) | 1,394 (74.7%) |
| 12 to 14 Years | 499 (73.0%) | 631 (70.7%) |
| 15 Years | 127 (64.5%) | 262 (72.2%) |
| 16 and 17 Years | 424 (72.5%) | 373 (79.0%) |
| 18 to 24 Years | 1,288 (78.5%) | 1,335 (69.6%) |
| 25 to 34 Years | 1,662 (77.0%) | 1,784 (78.2%) |
| 35 to 44 Years | 1,810 (82.8%) | 2,035 (70.1%) |
| 45 to 54 Years | 1,709 (82.0%) | 1,793 (85.1%) |
| 55 to 64 Years | 1,669 (79.9%) | 1,851 (80.6%) |
| 65 to 74 Years | 1,243 (90.9%) | 1,743 (86.6%) |
| 75 Years and over | 763 (95.0%) | 1,094 (90.5%) |
| Total | 12,967 (78.1%) | 15,182 (77.5%) |
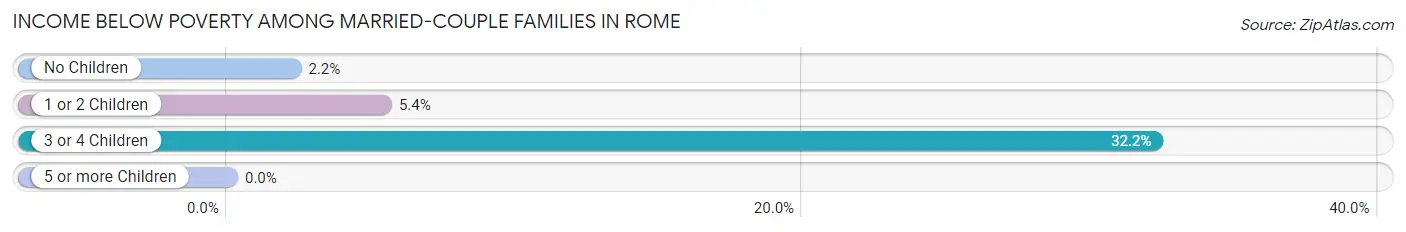
Income Below Poverty Among Married-Couple Families in Rome
The poverty statistics for married-couple families in Rome show that 6.8% or 363 of the total 5,313 families live below the poverty line. Families with 3 or 4 children have the highest poverty rate of 32.2%, comprising of 210 families. On the other hand, families with 5 or more children have the lowest poverty rate of 0.0%, which includes 0 families.
| Children | Above Poverty | Below Poverty |
| No Children | 2,791 (97.8%) | 63 (2.2%) |
| 1 or 2 Children | 1,590 (94.6%) | 90 (5.4%) |
| 3 or 4 Children | 442 (67.8%) | 210 (32.2%) |
| 5 or more Children | 127 (100.0%) | 0 (0.0%) |
| Total | 4,950 (93.2%) | 363 (6.8%) |
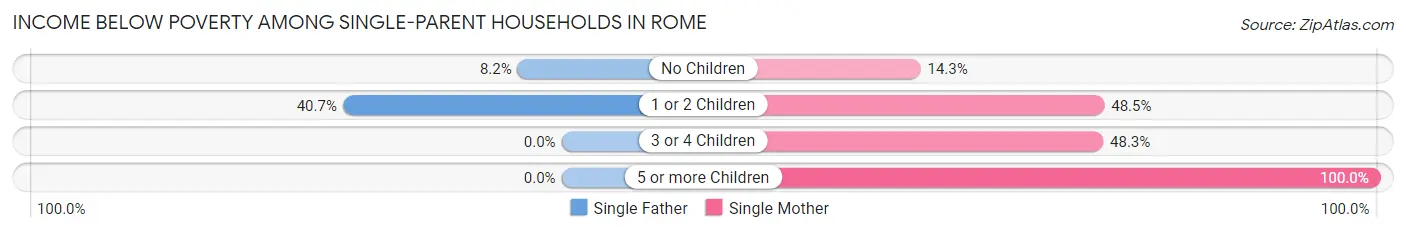
Income Below Poverty Among Single-Parent Households in Rome
According to the poverty data in Rome, 22.8% or 137 single-father households and 38.2% or 1,039 single-mother households are living below the poverty line. Among single-father households, those with 1 or 2 children have the highest poverty rate, with 110 households (40.7%) experiencing poverty. Likewise, among single-mother households, those with 5 or more children have the highest poverty rate, with 61 households (100.0%) falling below the poverty line.
| Children | Single Father | Single Mother |
| No Children | 27 (8.2%) | 130 (14.3%) |
| 1 or 2 Children | 110 (40.7%) | 631 (48.5%) |
| 3 or 4 Children | 0 (0.0%) | 217 (48.3%) |
| 5 or more Children | 0 (0.0%) | 61 (100.0%) |
| Total | 137 (22.8%) | 1,039 (38.2%) |
Income Below Poverty Among Married-Couple vs Single-Parent Households in Rome
The poverty data for Rome shows that 363 of the married-couple family households (6.8%) and 1,176 of the single-parent households (35.4%) are living below the poverty level. Within the married-couple family households, those with 3 or 4 children have the highest poverty rate, with 210 households (32.2%) falling below the poverty line. Among the single-parent households, those with 5 or more children have the highest poverty rate, with 61 household (100.0%) living below poverty.
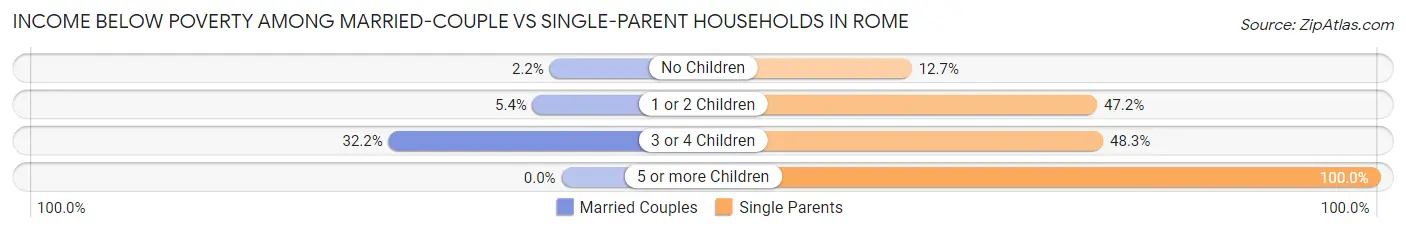
| Children | Married-Couple Families | Single-Parent Households |
| No Children | 63 (2.2%) | 157 (12.7%) |
| 1 or 2 Children | 90 (5.4%) | 741 (47.2%) |
| 3 or 4 Children | 210 (32.2%) | 217 (48.3%) |
| 5 or more Children | 0 (0.0%) | 61 (100.0%) |
| Total | 363 (6.8%) | 1,176 (35.4%) |
Employment Characteristics in Rome
Employment by Class of Employer in Rome
Among the 15,307 employed individuals in Rome, private company employees (10,601 | 69.3%), local government employees (1,119 | 7.3%), and not-for-profit organizations (1,056 | 6.9%) make up the most common classes of employment.
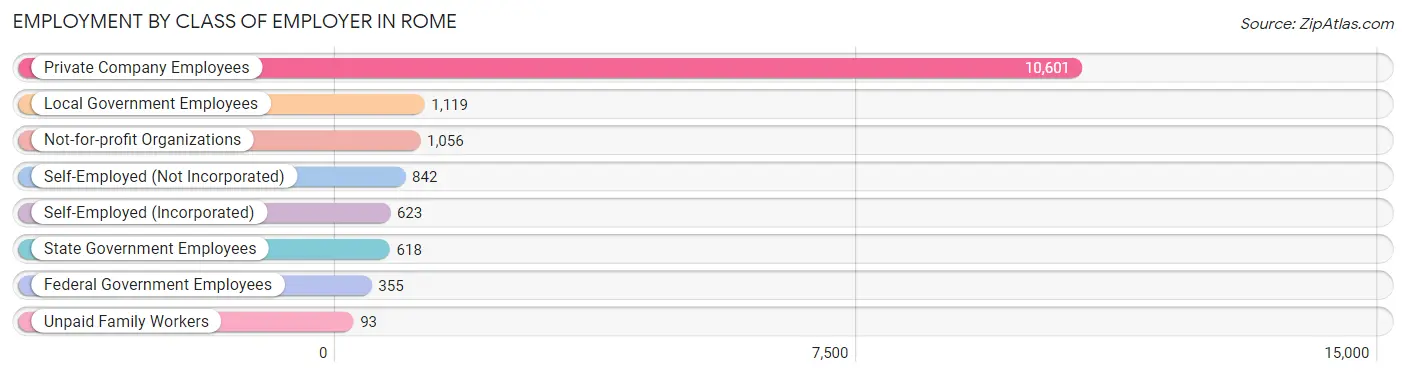
| Employer Class | # Employees | % Employees |
| Private Company Employees | 10,601 | 69.3% |
| Self-Employed (Incorporated) | 623 | 4.1% |
| Self-Employed (Not Incorporated) | 842 | 5.5% |
| Not-for-profit Organizations | 1,056 | 6.9% |
| Local Government Employees | 1,119 | 7.3% |
| State Government Employees | 618 | 4.0% |
| Federal Government Employees | 355 | 2.3% |
| Unpaid Family Workers | 93 | 0.6% |
| Total | 15,307 | 100.0% |
Employment Status by Age in Rome
According to the labor force statistics for Rome, out of the total population over 16 years of age (29,392), 56.1% or 16,489 individuals are in the labor force, with 4.5% or 742 of them unemployed. The age group with the highest labor force participation rate is 25 to 29 years, with 80.7% or 1,972 individuals in the labor force. Within the labor force, the 16 to 19 years age range has the highest percentage of unemployed individuals, with 20.7% or 192 of them being unemployed.
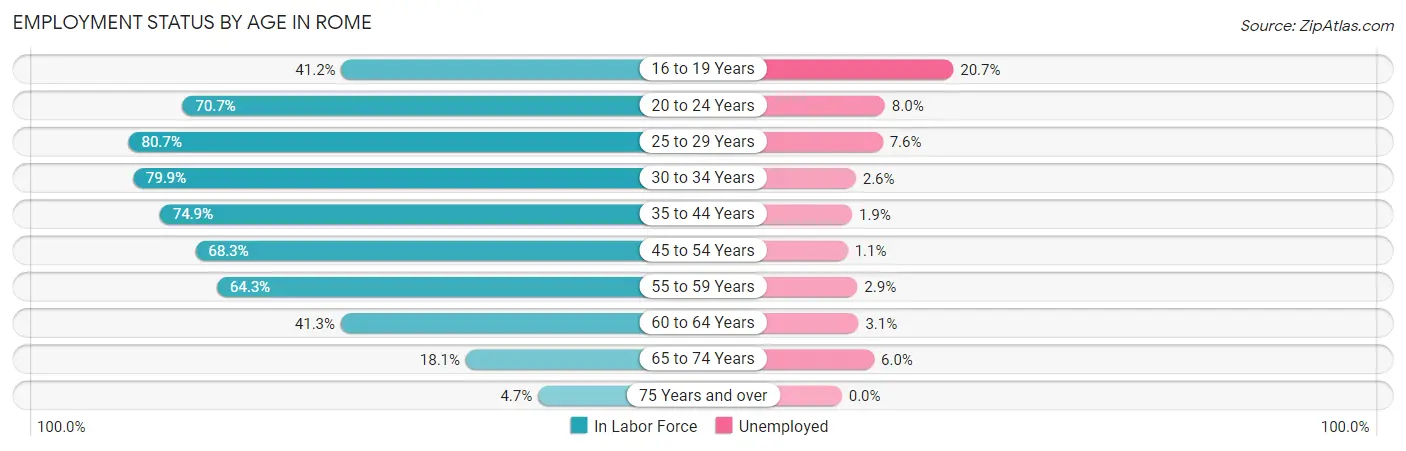
| Age Bracket | In Labor Force | Unemployed |
| 16 to 19 Years | 928 (41.2%) | 192 (20.7%) |
| 20 to 24 Years | 1,846 (70.7%) | 148 (8.0%) |
| 25 to 29 Years | 1,972 (80.7%) | 150 (7.6%) |
| 30 to 34 Years | 1,737 (79.9%) | 45 (2.6%) |
| 35 to 44 Years | 3,914 (74.9%) | 74 (1.9%) |
| 45 to 54 Years | 2,988 (68.3%) | 33 (1.1%) |
| 55 to 59 Years | 1,511 (64.3%) | 44 (2.9%) |
| 60 to 64 Years | 870 (41.3%) | 27 (3.1%) |
| 65 to 74 Years | 619 (18.1%) | 37 (6.0%) |
| 75 Years and over | 115 (4.7%) | 0 (0.0%) |
| Total | 16,489 (56.1%) | 742 (4.5%) |
Employment Status by Educational Attainment in Rome
According to labor force statistics for Rome, 69.6% of individuals (12,997) out of the total population between 25 and 64 years of age (18,674) are in the labor force, with 2.9% or 377 of them being unemployed. The group with the highest labor force participation rate are those with the educational attainment of bachelor's degree or higher, with 84.6% or 4,085 individuals in the labor force. Within the labor force, individuals with college / associate degree education have the highest percentage of unemployment, with 6.2% or 213 of them being unemployed.
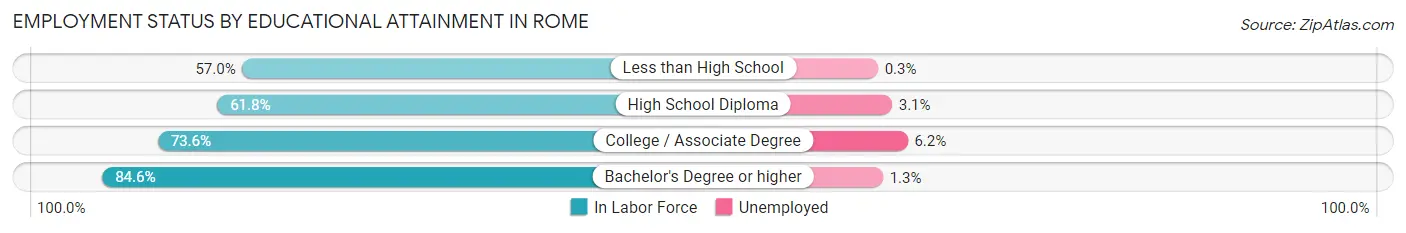
| Educational Attainment | In Labor Force | Unemployed |
| Less than High School | 2,339 (57.0%) | 12 (0.3%) |
| High School Diploma | 3,132 (61.8%) | 157 (3.1%) |
| College / Associate Degree | 3,439 (73.6%) | 290 (6.2%) |
| Bachelor's Degree or higher | 4,085 (84.6%) | 63 (1.3%) |
| Total | 12,997 (69.6%) | 542 (2.9%) |
Employment Occupations by Sex in Rome
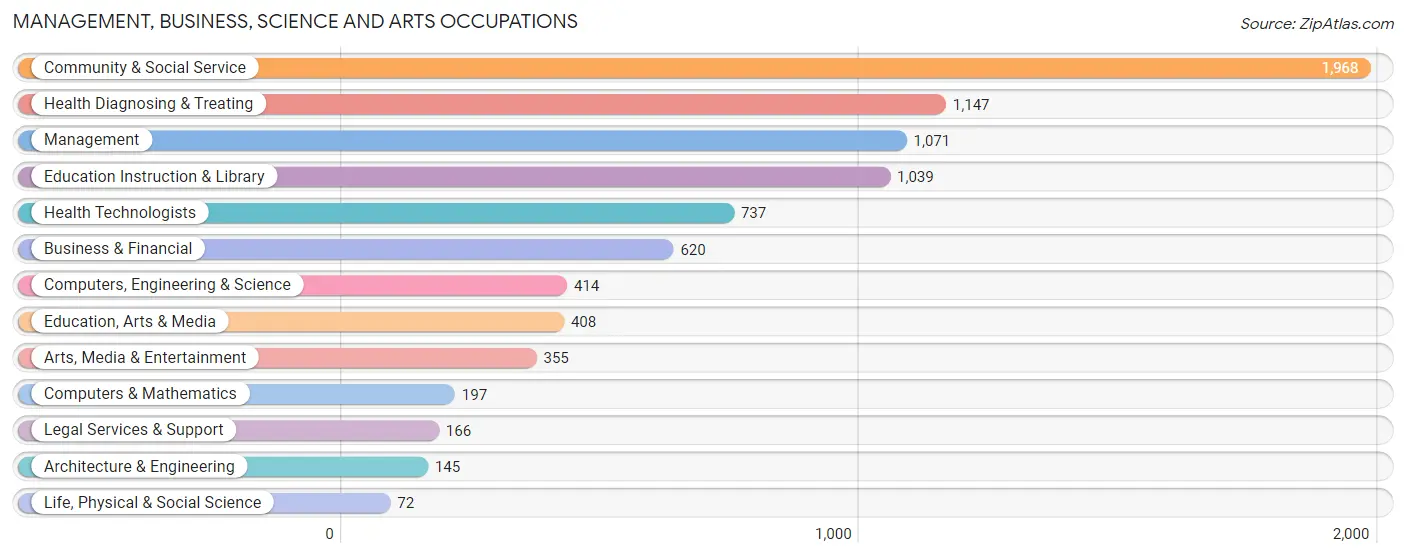
Management, Business, Science and Arts Occupations
The most common Management, Business, Science and Arts occupations in Rome are Community & Social Service (1,968 | 12.5%), Health Diagnosing & Treating (1,147 | 7.3%), Management (1,071 | 6.8%), Education Instruction & Library (1,039 | 6.6%), and Health Technologists (737 | 4.7%).
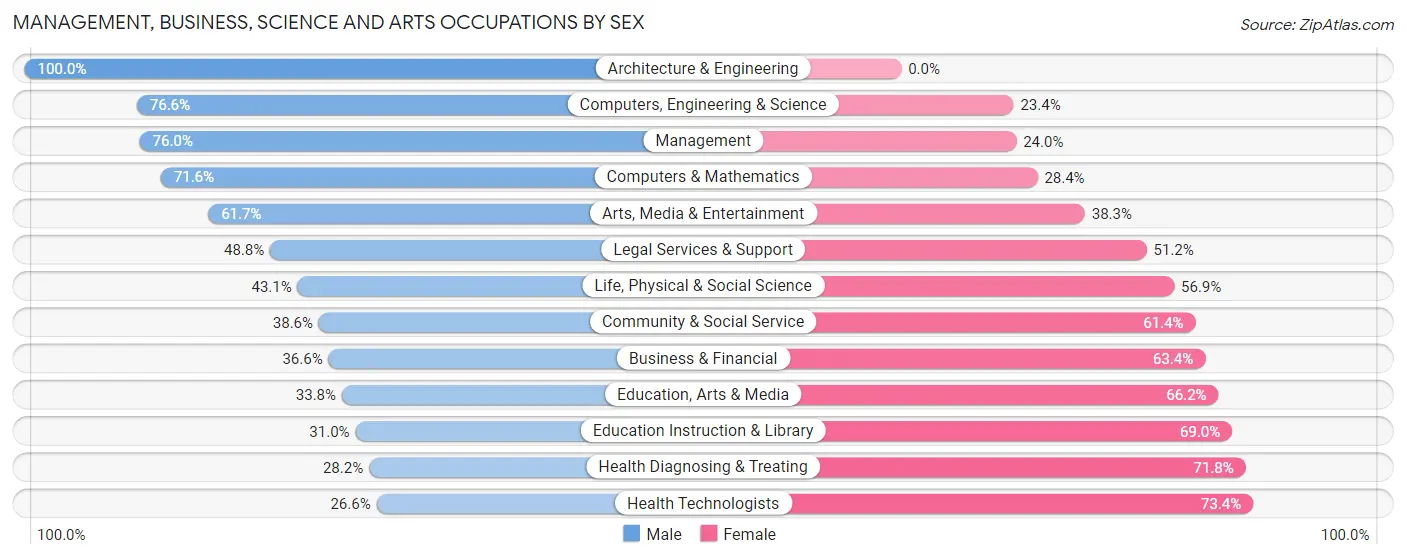
Management, Business, Science and Arts Occupations by Sex
Within the Management, Business, Science and Arts occupations in Rome, the most male-oriented occupations are Architecture & Engineering (100.0%), Computers, Engineering & Science (76.6%), and Management (76.0%), while the most female-oriented occupations are Health Technologists (73.4%), Health Diagnosing & Treating (71.8%), and Education Instruction & Library (69.0%).
| Occupation | Male | Female |
| Management | 814 (76.0%) | 257 (24.0%) |
| Business & Financial | 227 (36.6%) | 393 (63.4%) |
| Computers, Engineering & Science | 317 (76.6%) | 97 (23.4%) |
| Computers & Mathematics | 141 (71.6%) | 56 (28.4%) |
| Architecture & Engineering | 145 (100.0%) | 0 (0.0%) |
| Life, Physical & Social Science | 31 (43.1%) | 41 (56.9%) |
| Community & Social Service | 760 (38.6%) | 1,208 (61.4%) |
| Education, Arts & Media | 138 (33.8%) | 270 (66.2%) |
| Legal Services & Support | 81 (48.8%) | 85 (51.2%) |
| Education Instruction & Library | 322 (31.0%) | 717 (69.0%) |
| Arts, Media & Entertainment | 219 (61.7%) | 136 (38.3%) |
| Health Diagnosing & Treating | 323 (28.2%) | 824 (71.8%) |
| Health Technologists | 196 (26.6%) | 541 (73.4%) |
| Total (Category) | 2,441 (46.8%) | 2,779 (53.2%) |
| Total (Overall) | 7,975 (50.6%) | 7,776 (49.4%) |
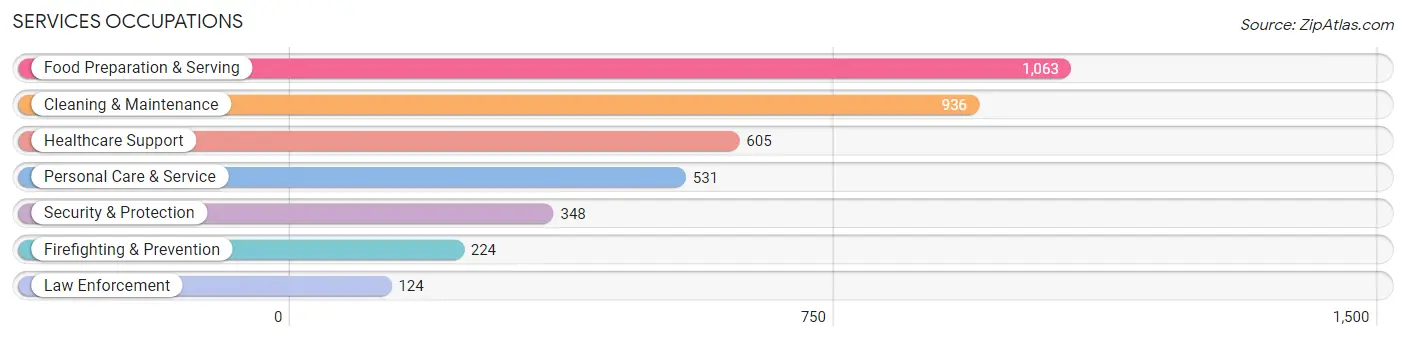
Services Occupations
The most common Services occupations in Rome are Food Preparation & Serving (1,063 | 6.8%), Cleaning & Maintenance (936 | 5.9%), Healthcare Support (605 | 3.8%), Personal Care & Service (531 | 3.4%), and Security & Protection (348 | 2.2%).
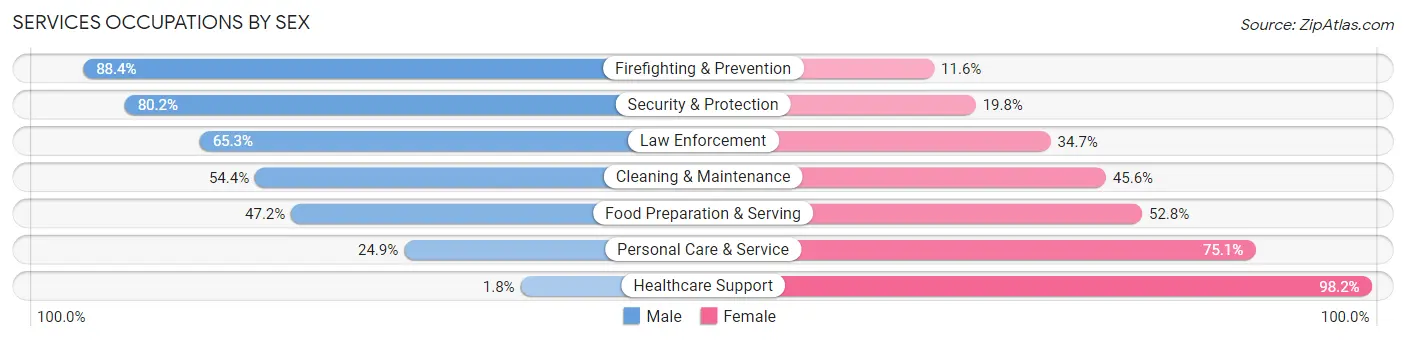
Services Occupations by Sex
Within the Services occupations in Rome, the most male-oriented occupations are Firefighting & Prevention (88.4%), Security & Protection (80.2%), and Law Enforcement (65.3%), while the most female-oriented occupations are Healthcare Support (98.2%), Personal Care & Service (75.1%), and Food Preparation & Serving (52.8%).
| Occupation | Male | Female |
| Healthcare Support | 11 (1.8%) | 594 (98.2%) |
| Security & Protection | 279 (80.2%) | 69 (19.8%) |
| Firefighting & Prevention | 198 (88.4%) | 26 (11.6%) |
| Law Enforcement | 81 (65.3%) | 43 (34.7%) |
| Food Preparation & Serving | 502 (47.2%) | 561 (52.8%) |
| Cleaning & Maintenance | 509 (54.4%) | 427 (45.6%) |
| Personal Care & Service | 132 (24.9%) | 399 (75.1%) |
| Total (Category) | 1,433 (41.1%) | 2,050 (58.9%) |
| Total (Overall) | 7,975 (50.6%) | 7,776 (49.4%) |
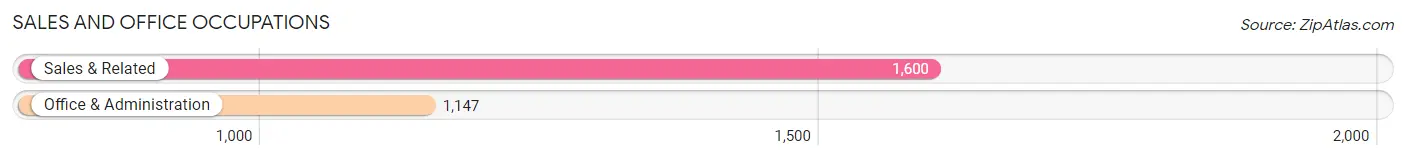
Sales and Office Occupations
The most common Sales and Office occupations in Rome are Sales & Related (1,600 | 10.2%), and Office & Administration (1,147 | 7.3%).
Sales and Office Occupations by Sex
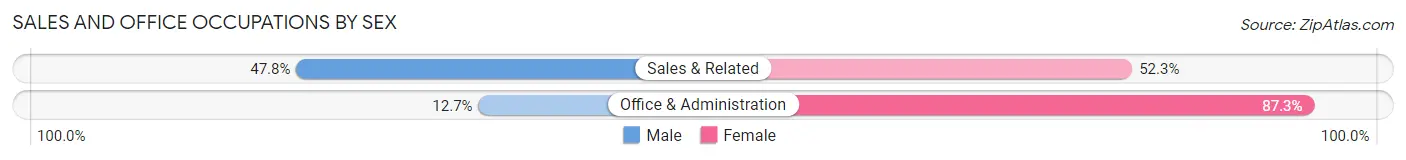
| Occupation | Male | Female |
| Sales & Related | 764 (47.7%) | 836 (52.2%) |
| Office & Administration | 146 (12.7%) | 1,001 (87.3%) |
| Total (Category) | 910 (33.1%) | 1,837 (66.9%) |
| Total (Overall) | 7,975 (50.6%) | 7,776 (49.4%) |
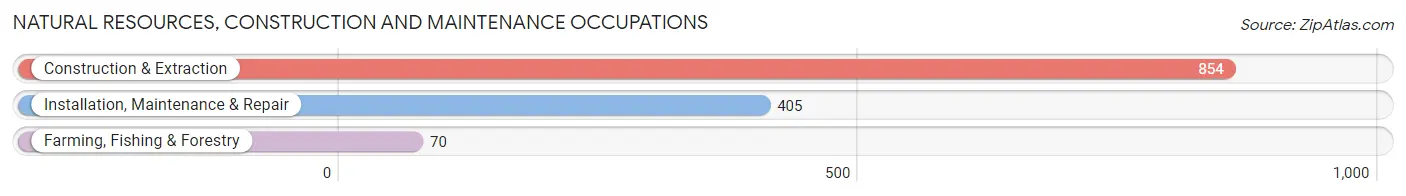
Natural Resources, Construction and Maintenance Occupations
The most common Natural Resources, Construction and Maintenance occupations in Rome are Construction & Extraction (854 | 5.4%), Installation, Maintenance & Repair (405 | 2.6%), and Farming, Fishing & Forestry (70 | 0.4%).
Natural Resources, Construction and Maintenance Occupations by Sex
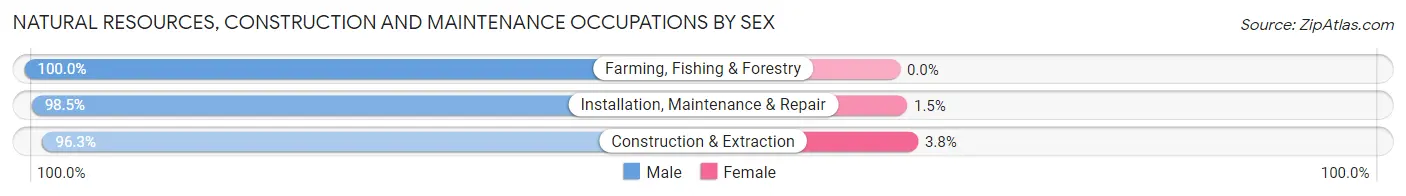
| Occupation | Male | Female |
| Farming, Fishing & Forestry | 70 (100.0%) | 0 (0.0%) |
| Construction & Extraction | 822 (96.3%) | 32 (3.7%) |
| Installation, Maintenance & Repair | 399 (98.5%) | 6 (1.5%) |
| Total (Category) | 1,291 (97.1%) | 38 (2.9%) |
| Total (Overall) | 7,975 (50.6%) | 7,776 (49.4%) |
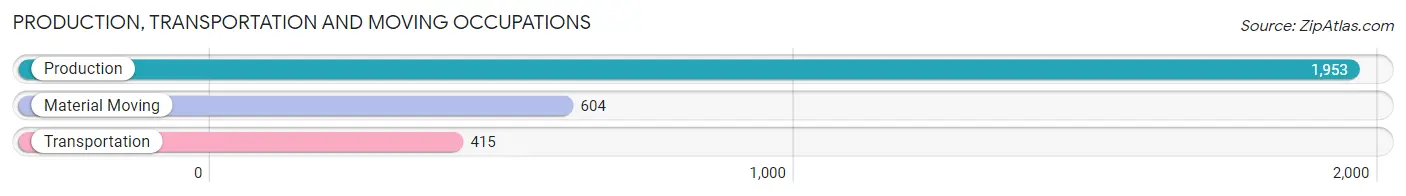
Production, Transportation and Moving Occupations
The most common Production, Transportation and Moving occupations in Rome are Production (1,953 | 12.4%), Material Moving (604 | 3.8%), and Transportation (415 | 2.6%).
Production, Transportation and Moving Occupations by Sex
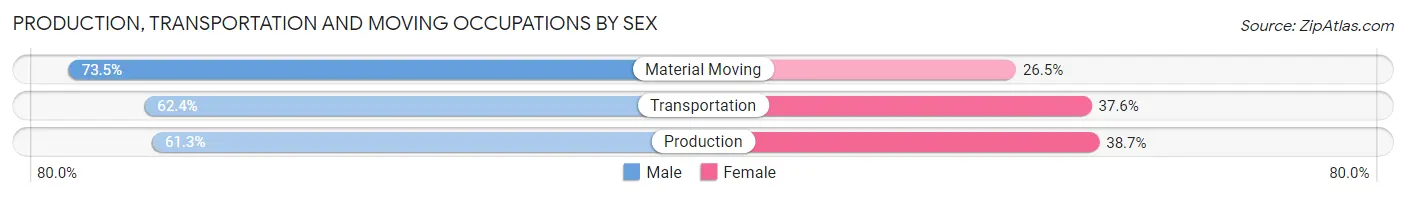
| Occupation | Male | Female |
| Production | 1,197 (61.3%) | 756 (38.7%) |
| Transportation | 259 (62.4%) | 156 (37.6%) |
| Material Moving | 444 (73.5%) | 160 (26.5%) |
| Total (Category) | 1,900 (63.9%) | 1,072 (36.1%) |
| Total (Overall) | 7,975 (50.6%) | 7,776 (49.4%) |
Employment Industries by Sex in Rome
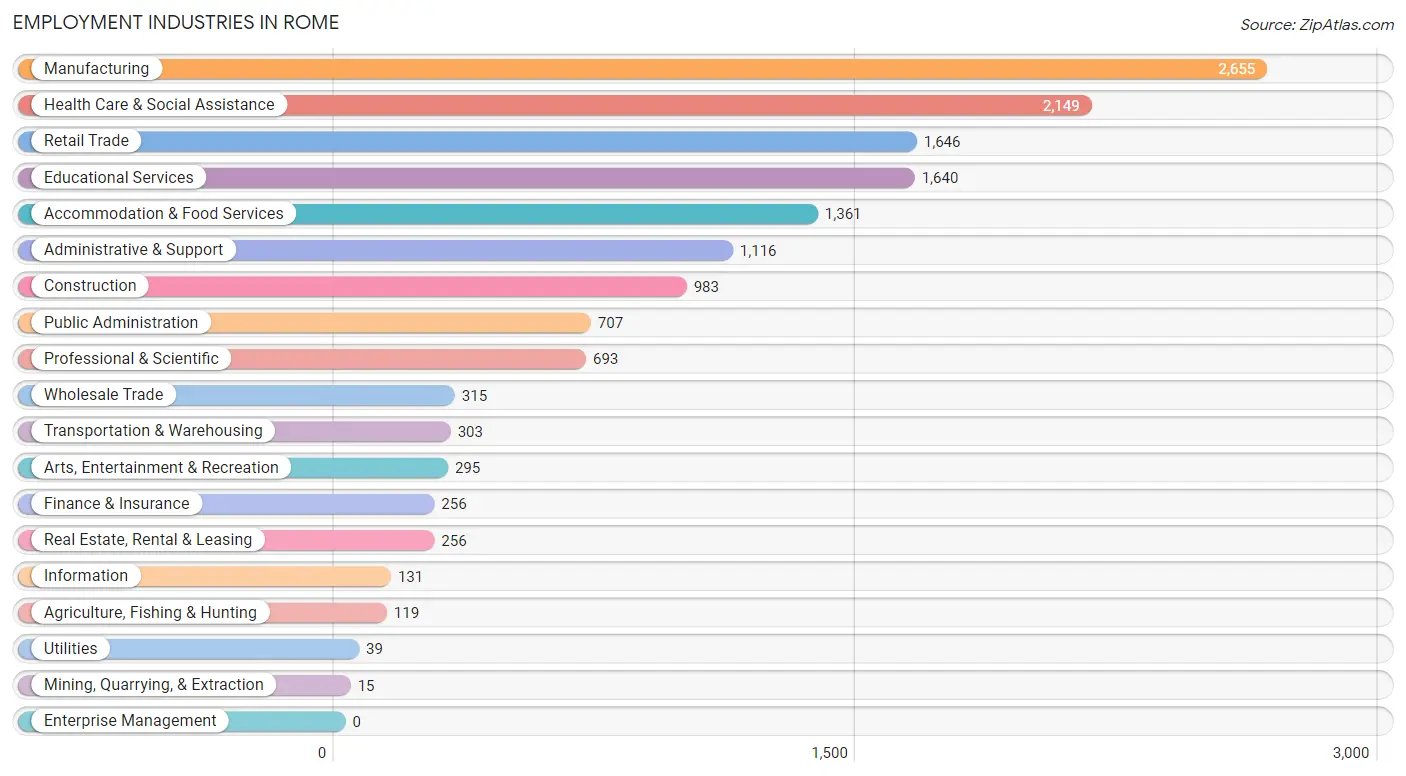
Employment Industries in Rome
The major employment industries in Rome include Manufacturing (2,655 | 16.9%), Health Care & Social Assistance (2,149 | 13.6%), Retail Trade (1,646 | 10.4%), Educational Services (1,640 | 10.4%), and Accommodation & Food Services (1,361 | 8.6%).
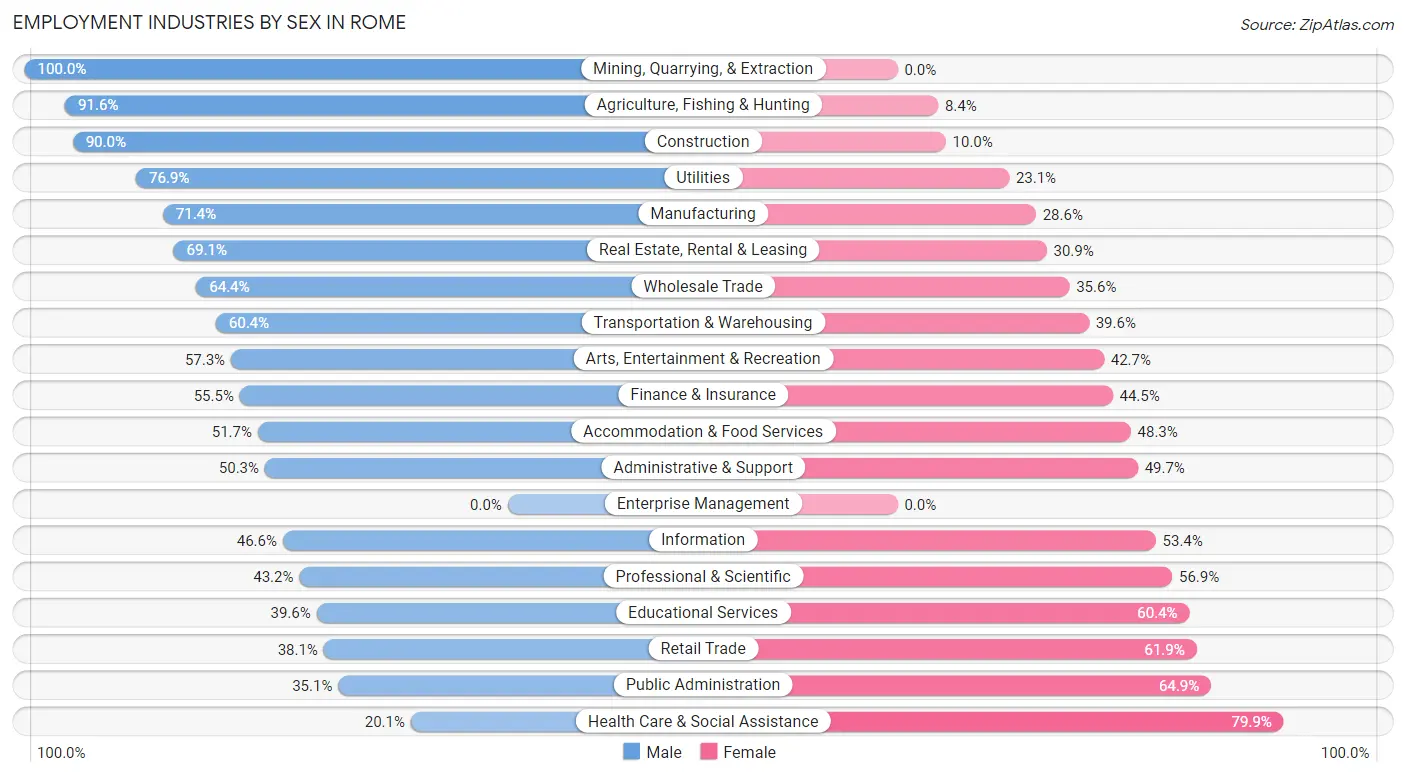
Employment Industries by Sex in Rome
The Rome industries that see more men than women are Mining, Quarrying, & Extraction (100.0%), Agriculture, Fishing & Hunting (91.6%), and Construction (90.0%), whereas the industries that tend to have a higher number of women are Health Care & Social Assistance (79.9%), Public Administration (64.9%), and Retail Trade (61.9%).
| Industry | Male | Female |
| Agriculture, Fishing & Hunting | 109 (91.6%) | 10 (8.4%) |
| Mining, Quarrying, & Extraction | 15 (100.0%) | 0 (0.0%) |
| Construction | 885 (90.0%) | 98 (10.0%) |
| Manufacturing | 1,895 (71.4%) | 760 (28.6%) |
| Wholesale Trade | 203 (64.4%) | 112 (35.6%) |
| Retail Trade | 627 (38.1%) | 1,019 (61.9%) |
| Transportation & Warehousing | 183 (60.4%) | 120 (39.6%) |
| Utilities | 30 (76.9%) | 9 (23.1%) |
| Information | 61 (46.6%) | 70 (53.4%) |
| Finance & Insurance | 142 (55.5%) | 114 (44.5%) |
| Real Estate, Rental & Leasing | 177 (69.1%) | 79 (30.9%) |
| Professional & Scientific | 299 (43.1%) | 394 (56.9%) |
| Enterprise Management | 0 (0.0%) | 0 (0.0%) |
| Administrative & Support | 561 (50.3%) | 555 (49.7%) |
| Educational Services | 649 (39.6%) | 991 (60.4%) |
| Health Care & Social Assistance | 431 (20.1%) | 1,718 (79.9%) |
| Arts, Entertainment & Recreation | 169 (57.3%) | 126 (42.7%) |
| Accommodation & Food Services | 704 (51.7%) | 657 (48.3%) |
| Public Administration | 248 (35.1%) | 459 (64.9%) |
| Total | 7,975 (50.6%) | 7,776 (49.4%) |
Education in Rome
School Enrollment in Rome
The most common levels of schooling among the 9,552 students in Rome are middle school (2,485 | 26.0%), elementary school (1,868 | 19.6%), and high school (1,864 | 19.5%).
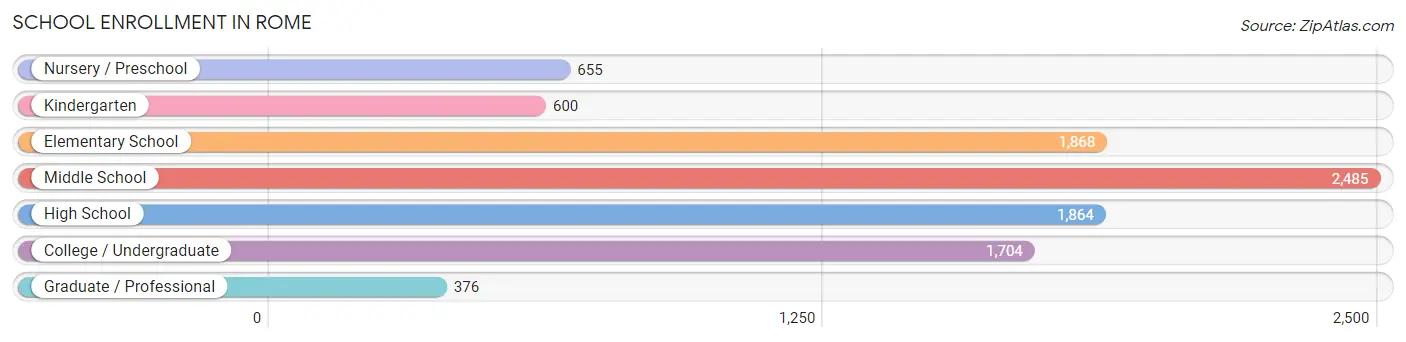
| School Level | # Students | % Students |
| Nursery / Preschool | 655 | 6.9% |
| Kindergarten | 600 | 6.3% |
| Elementary School | 1,868 | 19.6% |
| Middle School | 2,485 | 26.0% |
| High School | 1,864 | 19.5% |
| College / Undergraduate | 1,704 | 17.8% |
| Graduate / Professional | 376 | 3.9% |
| Total | 9,552 | 100.0% |
School Enrollment by Age by Funding Source in Rome
Out of a total of 9,552 students who are enrolled in schools in Rome, 1,681 (17.6%) attend a private institution, while the remaining 7,871 (82.4%) are enrolled in public schools. The age group of 35 years and over has the highest likelihood of being enrolled in private schools, with 130 (37.9% in the age bracket) enrolled. Conversely, the age group of 10 to 14 year olds has the lowest likelihood of being enrolled in a private school, with 2,382 (88.3% in the age bracket) attending a public institution.
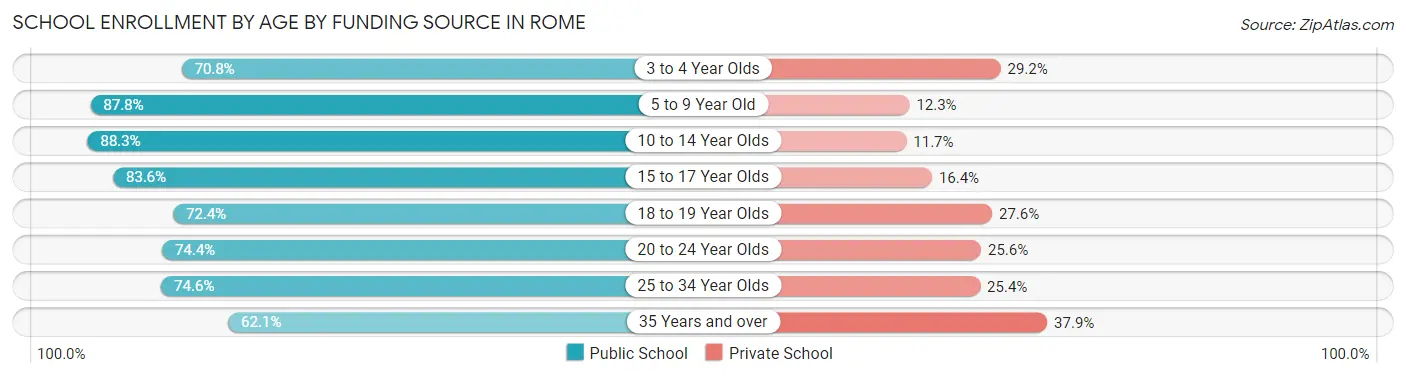
| Age Bracket | Public School | Private School |
| 3 to 4 Year Olds | 327 (70.8%) | 135 (29.2%) |
| 5 to 9 Year Old | 2,200 (87.7%) | 307 (12.2%) |
| 10 to 14 Year Olds | 2,382 (88.3%) | 315 (11.7%) |
| 15 to 17 Year Olds | 1,164 (83.6%) | 229 (16.4%) |
| 18 to 19 Year Olds | 555 (72.4%) | 212 (27.6%) |
| 20 to 24 Year Olds | 634 (74.4%) | 218 (25.6%) |
| 25 to 34 Year Olds | 396 (74.6%) | 135 (25.4%) |
| 35 Years and over | 213 (62.1%) | 130 (37.9%) |
| Total | 7,871 (82.4%) | 1,681 (17.6%) |
Educational Attainment by Field of Study in Rome
Education (1,389 | 20.2%), business (1,028 | 14.9%), bio, nature & agricultural (652 | 9.5%), science & technology (601 | 8.7%), and arts & humanities (518 | 7.5%) are the most common fields of study among 6,892 individuals in Rome who have obtained a bachelor's degree or higher.
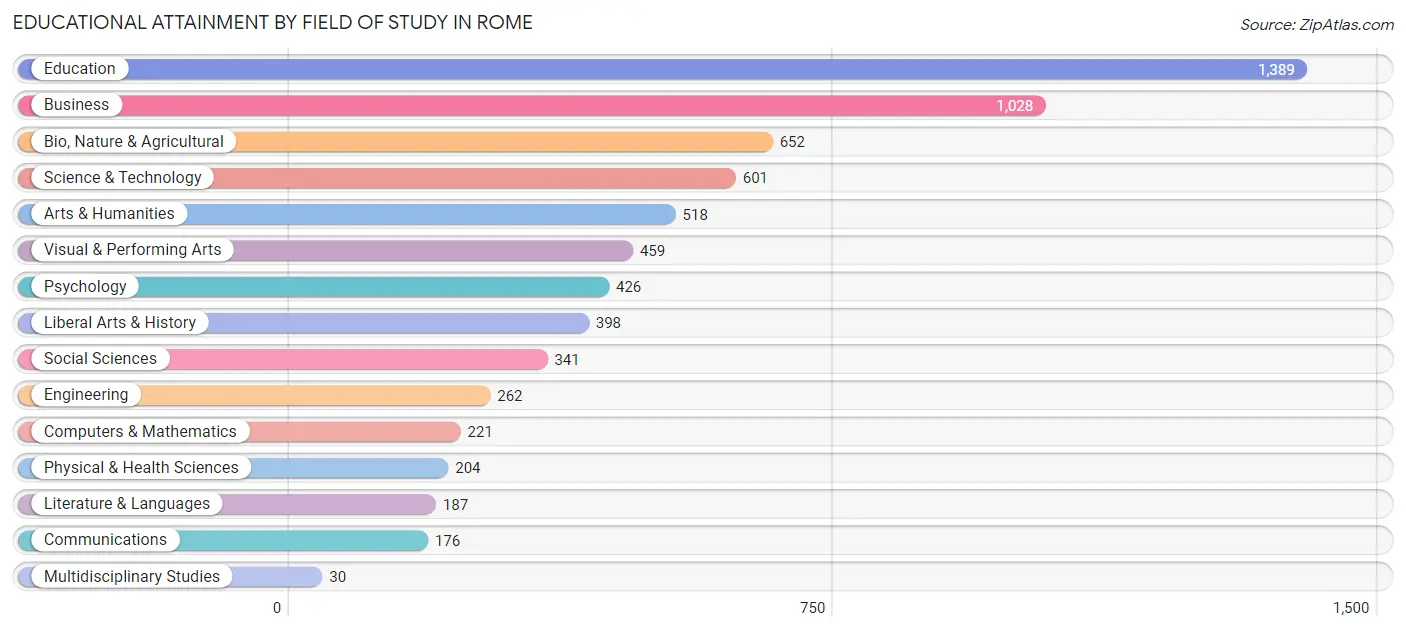
| Field of Study | # Graduates | % Graduates |
| Computers & Mathematics | 221 | 3.2% |
| Bio, Nature & Agricultural | 652 | 9.5% |
| Physical & Health Sciences | 204 | 3.0% |
| Psychology | 426 | 6.2% |
| Social Sciences | 341 | 5.0% |
| Engineering | 262 | 3.8% |
| Multidisciplinary Studies | 30 | 0.4% |
| Science & Technology | 601 | 8.7% |
| Business | 1,028 | 14.9% |
| Education | 1,389 | 20.2% |
| Literature & Languages | 187 | 2.7% |
| Liberal Arts & History | 398 | 5.8% |
| Visual & Performing Arts | 459 | 6.7% |
| Communications | 176 | 2.5% |
| Arts & Humanities | 518 | 7.5% |
| Total | 6,892 | 100.0% |
Transportation & Commute in Rome
Vehicle Availability by Sex in Rome
The most prevalent vehicle ownership categories in Rome are males with 2 vehicles (3,349, accounting for 42.8%) and females with 2 vehicles (2,480, making up 45.1%).
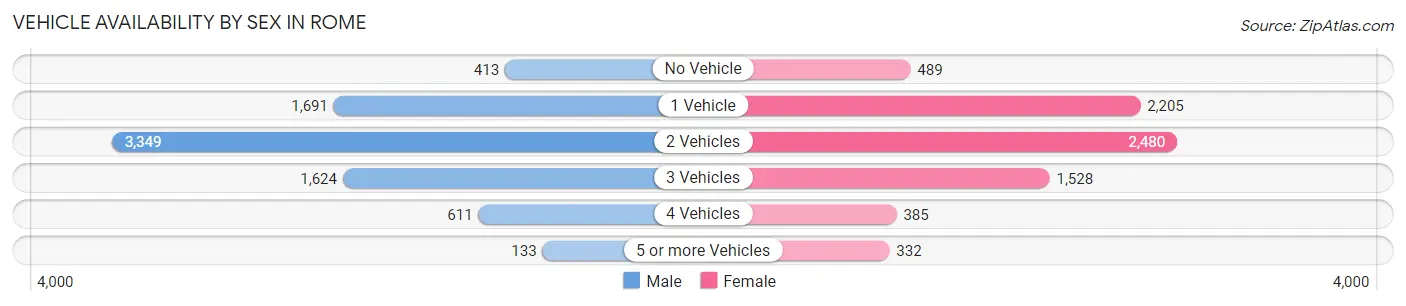
| Vehicles Available | Male | Female |
| No Vehicle | 413 (5.3%) | 489 (6.6%) |
| 1 Vehicle | 1,691 (21.6%) | 2,205 (29.7%) |
| 2 Vehicles | 3,349 (42.8%) | 2,480 (33.4%) |
| 3 Vehicles | 1,624 (20.8%) | 1,528 (20.6%) |
| 4 Vehicles | 611 (7.8%) | 385 (5.2%) |
| 5 or more Vehicles | 133 (1.7%) | 332 (4.5%) |
| Total | 7,821 (100.0%) | 7,419 (100.0%) |
Commute Time in Rome
The most frequently occuring commute durations in Rome are 10 to 14 minutes (3,459 commuters, 24.1%), 15 to 19 minutes (2,782 commuters, 19.4%), and 5 to 9 minutes (1,609 commuters, 11.2%).
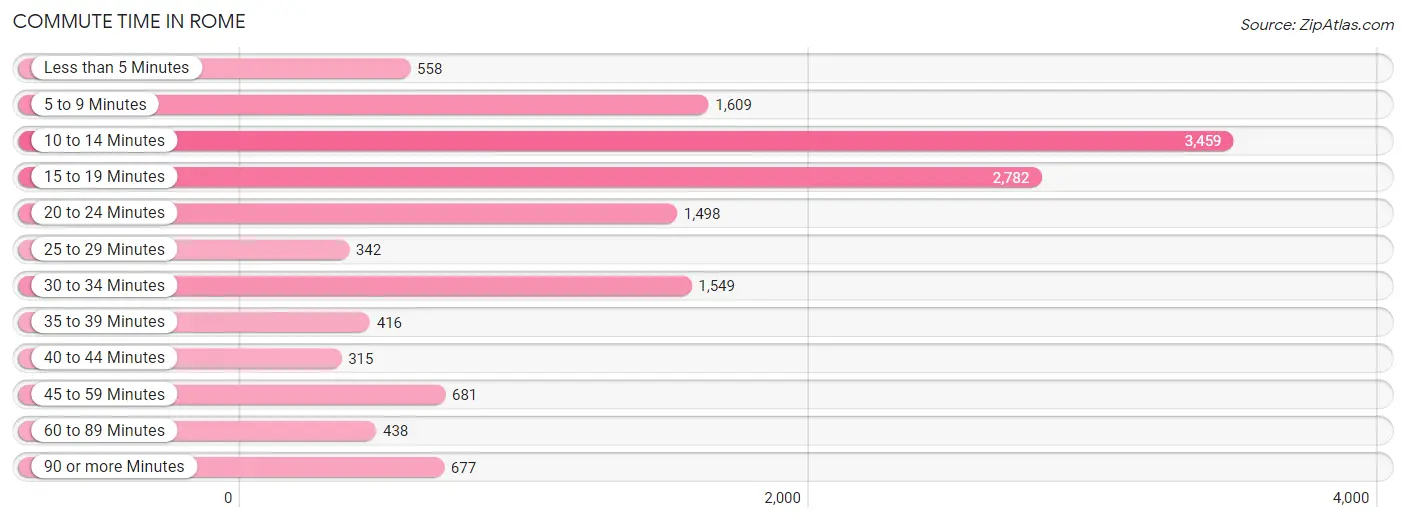
| Commute Time | # Commuters | % Commuters |
| Less than 5 Minutes | 558 | 3.9% |
| 5 to 9 Minutes | 1,609 | 11.2% |
| 10 to 14 Minutes | 3,459 | 24.1% |
| 15 to 19 Minutes | 2,782 | 19.4% |
| 20 to 24 Minutes | 1,498 | 10.5% |
| 25 to 29 Minutes | 342 | 2.4% |
| 30 to 34 Minutes | 1,549 | 10.8% |
| 35 to 39 Minutes | 416 | 2.9% |
| 40 to 44 Minutes | 315 | 2.2% |
| 45 to 59 Minutes | 681 | 4.8% |
| 60 to 89 Minutes | 438 | 3.1% |
| 90 or more Minutes | 677 | 4.7% |
Commute Time by Sex in Rome
The most common commute times in Rome are 10 to 14 minutes (1,570 commuters, 21.3%) for males and 10 to 14 minutes (1,889 commuters, 27.1%) for females.
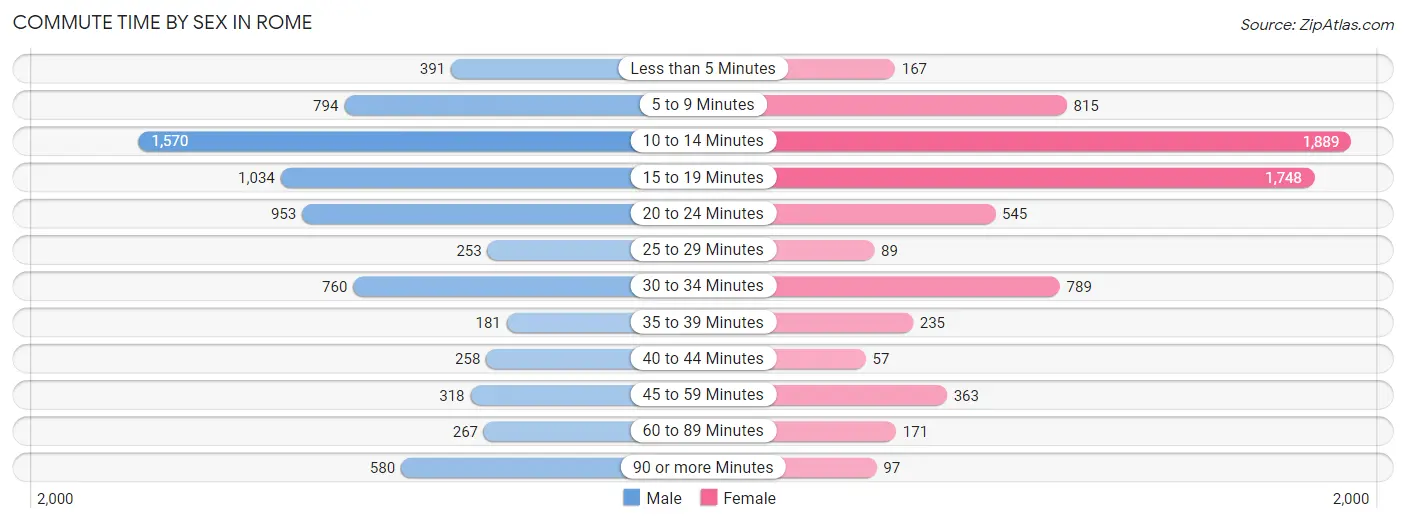
| Commute Time | Male | Female |
| Less than 5 Minutes | 391 (5.3%) | 167 (2.4%) |
| 5 to 9 Minutes | 794 (10.8%) | 815 (11.7%) |
| 10 to 14 Minutes | 1,570 (21.3%) | 1,889 (27.1%) |
| 15 to 19 Minutes | 1,034 (14.1%) | 1,748 (25.1%) |
| 20 to 24 Minutes | 953 (13.0%) | 545 (7.8%) |
| 25 to 29 Minutes | 253 (3.4%) | 89 (1.3%) |
| 30 to 34 Minutes | 760 (10.3%) | 789 (11.3%) |
| 35 to 39 Minutes | 181 (2.5%) | 235 (3.4%) |
| 40 to 44 Minutes | 258 (3.5%) | 57 (0.8%) |
| 45 to 59 Minutes | 318 (4.3%) | 363 (5.2%) |
| 60 to 89 Minutes | 267 (3.6%) | 171 (2.5%) |
| 90 or more Minutes | 580 (7.9%) | 97 (1.4%) |
Time of Departure to Work by Sex in Rome
The most frequent times of departure to work in Rome are 7:00 AM to 7:29 AM (1,010, 13.7%) for males and 7:30 AM to 7:59 AM (1,132, 16.3%) for females.
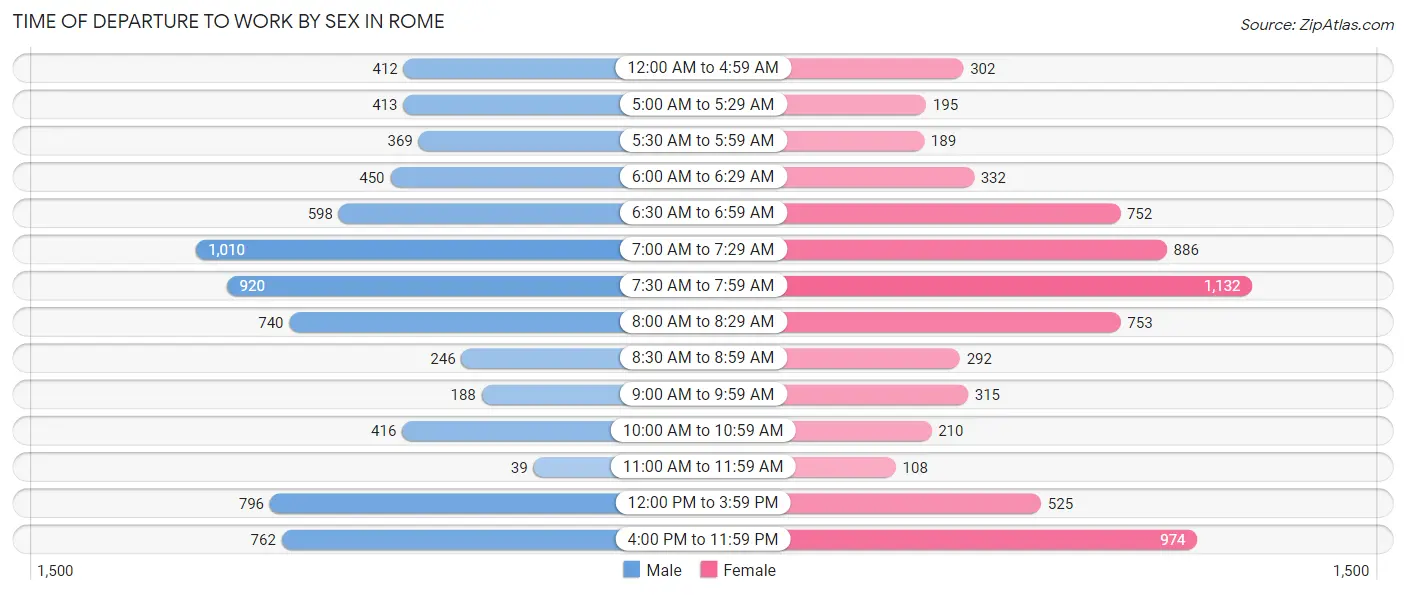
| Time of Departure | Male | Female |
| 12:00 AM to 4:59 AM | 412 (5.6%) | 302 (4.3%) |
| 5:00 AM to 5:29 AM | 413 (5.6%) | 195 (2.8%) |
| 5:30 AM to 5:59 AM | 369 (5.0%) | 189 (2.7%) |
| 6:00 AM to 6:29 AM | 450 (6.1%) | 332 (4.8%) |
| 6:30 AM to 6:59 AM | 598 (8.1%) | 752 (10.8%) |
| 7:00 AM to 7:29 AM | 1,010 (13.7%) | 886 (12.7%) |
| 7:30 AM to 7:59 AM | 920 (12.5%) | 1,132 (16.3%) |
| 8:00 AM to 8:29 AM | 740 (10.1%) | 753 (10.8%) |
| 8:30 AM to 8:59 AM | 246 (3.3%) | 292 (4.2%) |
| 9:00 AM to 9:59 AM | 188 (2.5%) | 315 (4.5%) |
| 10:00 AM to 10:59 AM | 416 (5.7%) | 210 (3.0%) |
| 11:00 AM to 11:59 AM | 39 (0.5%) | 108 (1.5%) |
| 12:00 PM to 3:59 PM | 796 (10.8%) | 525 (7.5%) |
| 4:00 PM to 11:59 PM | 762 (10.3%) | 974 (14.0%) |
| Total | 7,359 (100.0%) | 6,965 (100.0%) |
Housing Occupancy in Rome
Occupancy by Ownership in Rome
Of the total 14,501 dwellings in Rome, owner-occupied units account for 7,379 (50.9%), while renter-occupied units make up 7,122 (49.1%).
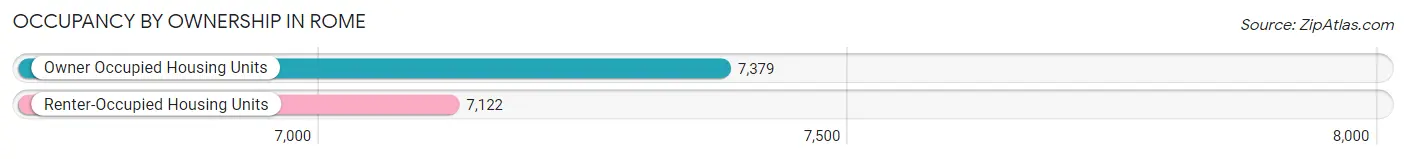
| Occupancy | # Housing Units | % Housing Units |
| Owner Occupied Housing Units | 7,379 | 50.9% |
| Renter-Occupied Housing Units | 7,122 | 49.1% |
| Total Occupied Housing Units | 14,501 | 100.0% |
Occupancy by Household Size in Rome
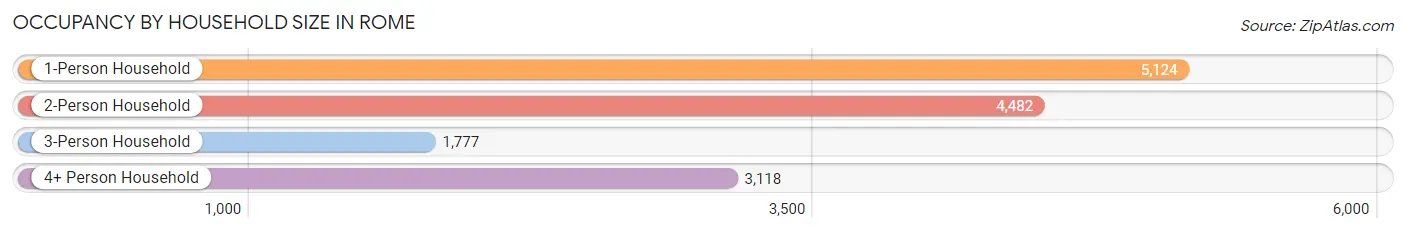
| Household Size | # Housing Units | % Housing Units |
| 1-Person Household | 5,124 | 35.3% |
| 2-Person Household | 4,482 | 30.9% |
| 3-Person Household | 1,777 | 12.2% |
| 4+ Person Household | 3,118 | 21.5% |
| Total Housing Units | 14,501 | 100.0% |
Occupancy by Ownership by Household Size in Rome
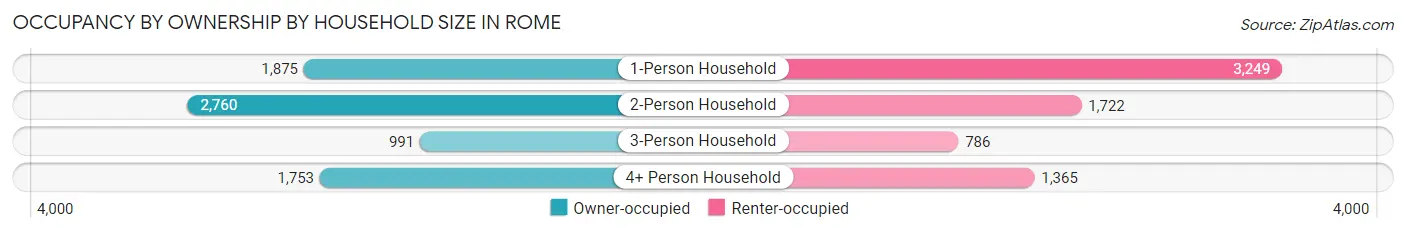
| Household Size | Owner-occupied | Renter-occupied |
| 1-Person Household | 1,875 (36.6%) | 3,249 (63.4%) |
| 2-Person Household | 2,760 (61.6%) | 1,722 (38.4%) |
| 3-Person Household | 991 (55.8%) | 786 (44.2%) |
| 4+ Person Household | 1,753 (56.2%) | 1,365 (43.8%) |
| Total Housing Units | 7,379 (50.9%) | 7,122 (49.1%) |
Occupancy by Educational Attainment in Rome
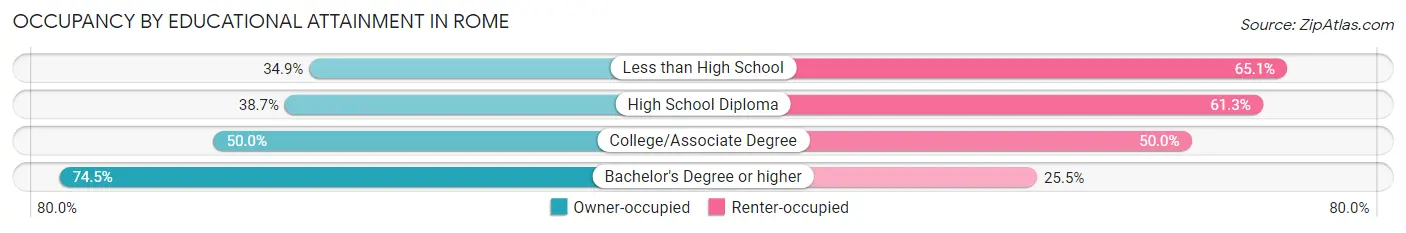
| Household Size | Owner-occupied | Renter-occupied |
| Less than High School | 906 (34.9%) | 1,693 (65.1%) |
| High School Diploma | 1,435 (38.7%) | 2,270 (61.3%) |
| College/Associate Degree | 2,182 (50.0%) | 2,180 (50.0%) |
| Bachelor's Degree or higher | 2,856 (74.5%) | 979 (25.5%) |
Occupancy by Age of Householder in Rome
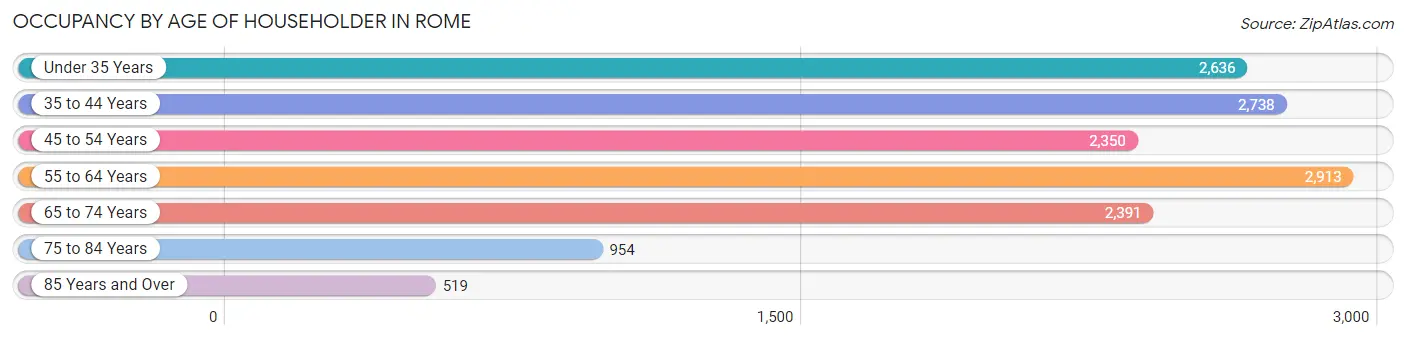
| Age Bracket | # Households | % Households |
| Under 35 Years | 2,636 | 18.2% |
| 35 to 44 Years | 2,738 | 18.9% |
| 45 to 54 Years | 2,350 | 16.2% |
| 55 to 64 Years | 2,913 | 20.1% |
| 65 to 74 Years | 2,391 | 16.5% |
| 75 to 84 Years | 954 | 6.6% |
| 85 Years and Over | 519 | 3.6% |
| Total | 14,501 | 100.0% |
Housing Finances in Rome
Median Income by Occupancy in Rome
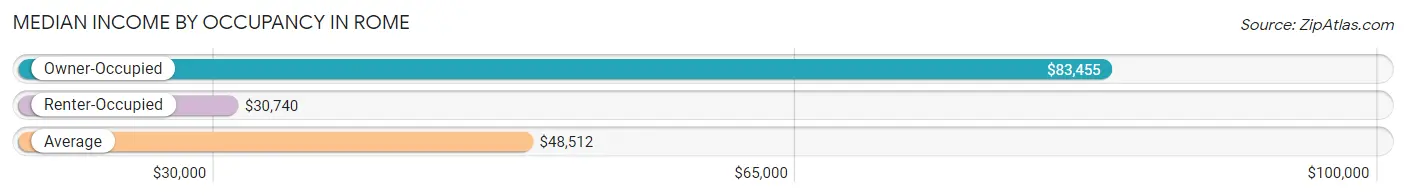
| Occupancy Type | # Households | Median Income |
| Owner-Occupied | 7,379 (50.9%) | $83,455 |
| Renter-Occupied | 7,122 (49.1%) | $30,740 |
| Average | 14,501 (100.0%) | $48,512 |
Occupancy by Householder Income Bracket in Rome
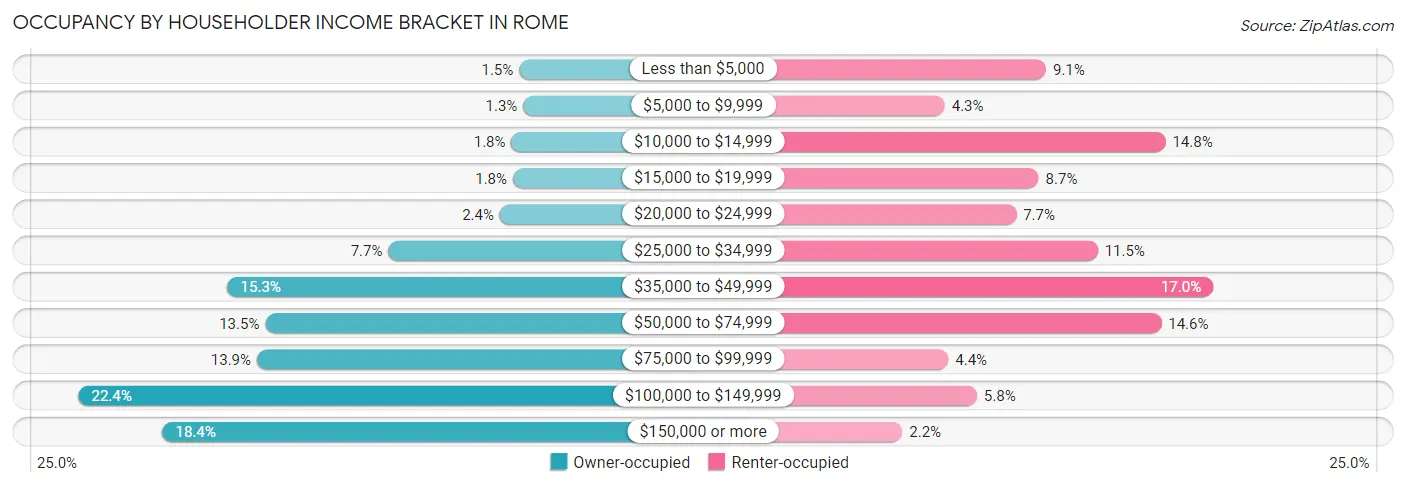
| Income Bracket | Owner-occupied | Renter-occupied |
| Less than $5,000 | 107 (1.5%) | 646 (9.1%) |
| $5,000 to $9,999 | 93 (1.3%) | 303 (4.3%) |
| $10,000 to $14,999 | 134 (1.8%) | 1,051 (14.8%) |
| $15,000 to $19,999 | 129 (1.8%) | 621 (8.7%) |
| $20,000 to $24,999 | 175 (2.4%) | 545 (7.6%) |
| $25,000 to $34,999 | 567 (7.7%) | 821 (11.5%) |
| $35,000 to $49,999 | 1,131 (15.3%) | 1,212 (17.0%) |
| $50,000 to $74,999 | 999 (13.5%) | 1,037 (14.6%) |
| $75,000 to $99,999 | 1,029 (13.9%) | 315 (4.4%) |
| $100,000 to $149,999 | 1,655 (22.4%) | 412 (5.8%) |
| $150,000 or more | 1,360 (18.4%) | 159 (2.2%) |
| Total | 7,379 (100.0%) | 7,122 (100.0%) |
Monthly Housing Cost Tiers in Rome
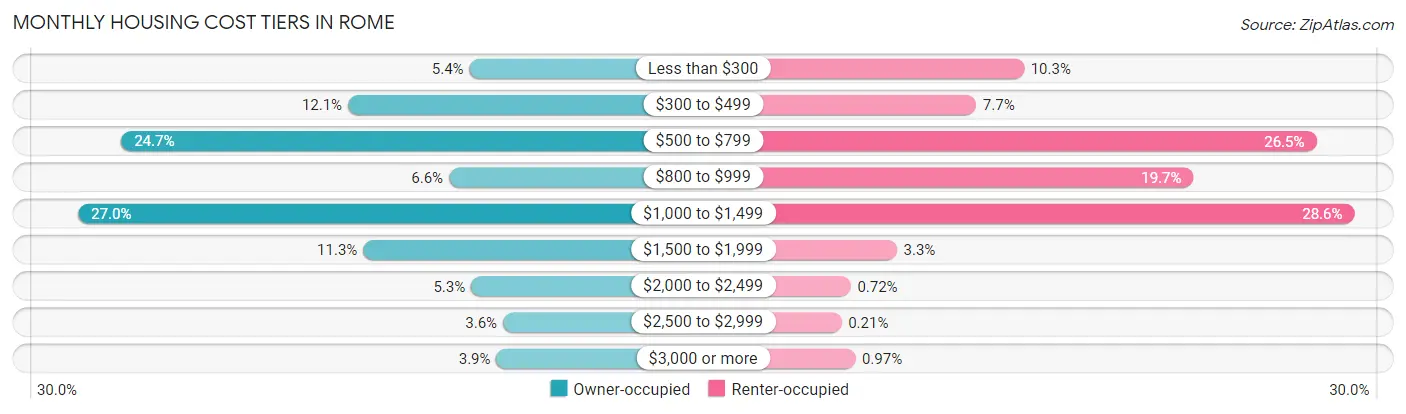
| Monthly Cost | Owner-occupied | Renter-occupied |
| Less than $300 | 401 (5.4%) | 733 (10.3%) |
| $300 to $499 | 896 (12.1%) | 545 (7.6%) |
| $500 to $799 | 1,820 (24.7%) | 1,884 (26.5%) |
| $800 to $999 | 484 (6.6%) | 1,400 (19.7%) |
| $1,000 to $1,499 | 1,995 (27.0%) | 2,033 (28.5%) |
| $1,500 to $1,999 | 834 (11.3%) | 233 (3.3%) |
| $2,000 to $2,499 | 394 (5.3%) | 51 (0.7%) |
| $2,500 to $2,999 | 264 (3.6%) | 15 (0.2%) |
| $3,000 or more | 291 (3.9%) | 69 (1.0%) |
| Total | 7,379 (100.0%) | 7,122 (100.0%) |
Physical Housing Characteristics in Rome
Housing Structures in Rome
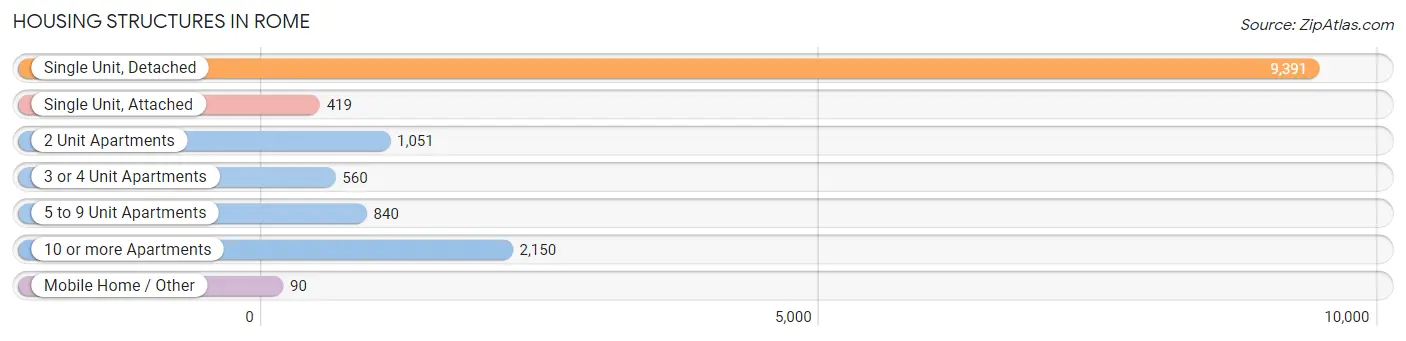
| Structure Type | # Housing Units | % Housing Units |
| Single Unit, Detached | 9,391 | 64.8% |
| Single Unit, Attached | 419 | 2.9% |
| 2 Unit Apartments | 1,051 | 7.2% |
| 3 or 4 Unit Apartments | 560 | 3.9% |
| 5 to 9 Unit Apartments | 840 | 5.8% |
| 10 or more Apartments | 2,150 | 14.8% |
| Mobile Home / Other | 90 | 0.6% |
| Total | 14,501 | 100.0% |
Housing Structures by Occupancy in Rome
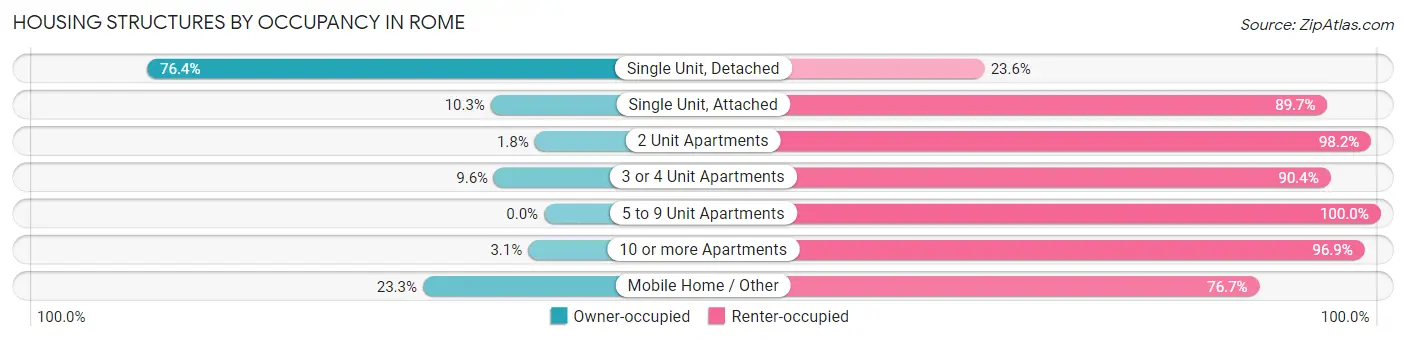
| Structure Type | Owner-occupied | Renter-occupied |
| Single Unit, Detached | 7,176 (76.4%) | 2,215 (23.6%) |
| Single Unit, Attached | 43 (10.3%) | 376 (89.7%) |
| 2 Unit Apartments | 19 (1.8%) | 1,032 (98.2%) |
| 3 or 4 Unit Apartments | 54 (9.6%) | 506 (90.4%) |
| 5 to 9 Unit Apartments | 0 (0.0%) | 840 (100.0%) |
| 10 or more Apartments | 66 (3.1%) | 2,084 (96.9%) |
| Mobile Home / Other | 21 (23.3%) | 69 (76.7%) |
| Total | 7,379 (50.9%) | 7,122 (49.1%) |
Housing Structures by Number of Rooms in Rome
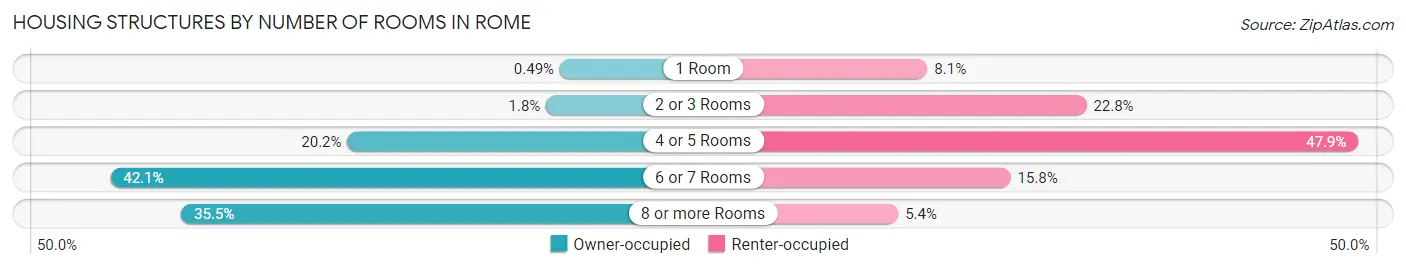
| Number of Rooms | Owner-occupied | Renter-occupied |
| 1 Room | 36 (0.5%) | 576 (8.1%) |
| 2 or 3 Rooms | 130 (1.8%) | 1,624 (22.8%) |
| 4 or 5 Rooms | 1,487 (20.2%) | 3,414 (47.9%) |
| 6 or 7 Rooms | 3,104 (42.1%) | 1,124 (15.8%) |
| 8 or more Rooms | 2,622 (35.5%) | 384 (5.4%) |
| Total | 7,379 (100.0%) | 7,122 (100.0%) |
Housing Structure by Heating Type in Rome
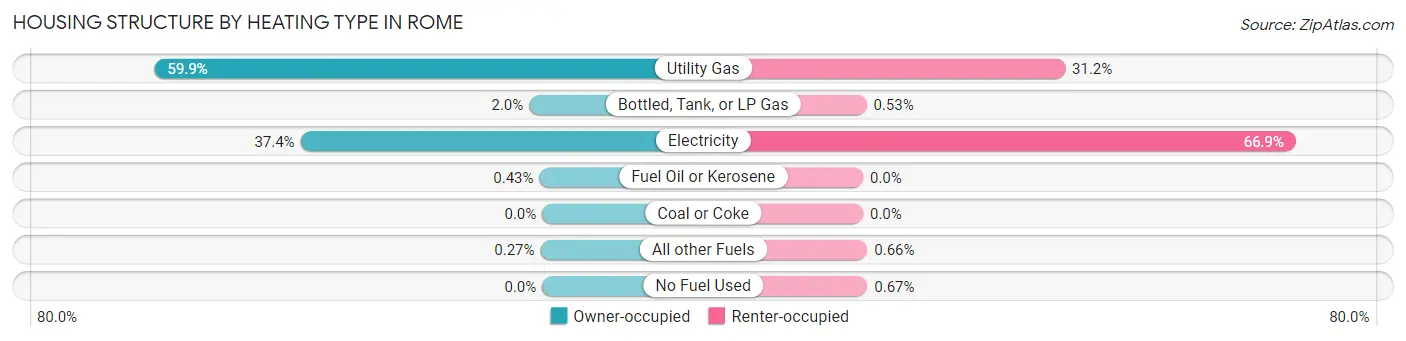
| Heating Type | Owner-occupied | Renter-occupied |
| Utility Gas | 4,422 (59.9%) | 2,225 (31.2%) |
| Bottled, Tank, or LP Gas | 148 (2.0%) | 38 (0.5%) |
| Electricity | 2,757 (37.4%) | 4,764 (66.9%) |
| Fuel Oil or Kerosene | 32 (0.4%) | 0 (0.0%) |
| Coal or Coke | 0 (0.0%) | 0 (0.0%) |
| All other Fuels | 20 (0.3%) | 47 (0.7%) |
| No Fuel Used | 0 (0.0%) | 48 (0.7%) |
| Total | 7,379 (100.0%) | 7,122 (100.0%) |
Household Vehicle Usage in Rome
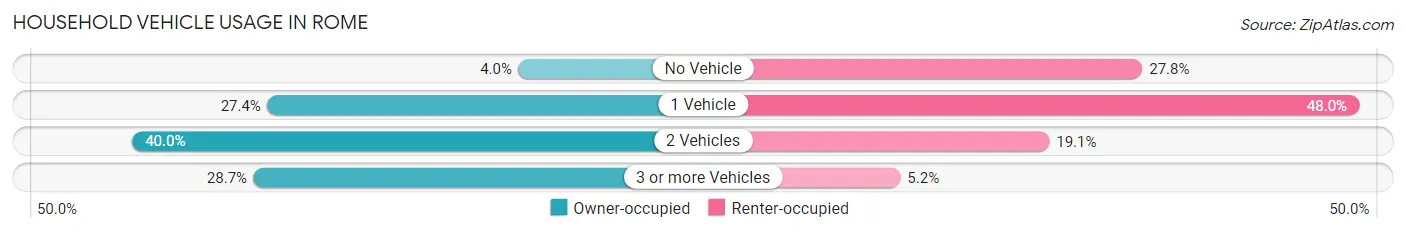
| Vehicles per Household | Owner-occupied | Renter-occupied |
| No Vehicle | 292 (4.0%) | 1,977 (27.8%) |
| 1 Vehicle | 2,022 (27.4%) | 3,417 (48.0%) |
| 2 Vehicles | 2,948 (40.0%) | 1,359 (19.1%) |
| 3 or more Vehicles | 2,117 (28.7%) | 369 (5.2%) |
| Total | 7,379 (100.0%) | 7,122 (100.0%) |
Real Estate & Mortgages in Rome
Real Estate and Mortgage Overview in Rome
| Characteristic | Without Mortgage | With Mortgage |
| Housing Units | 3,327 | 4,052 |
| Median Property Value | $174,800 | $205,200 |
| Median Household Income | $73,165 | $797 |
| Monthly Housing Costs | $557 | $291 |
| Real Estate Taxes | $1,498 | $22 |
Property Value by Mortgage Status in Rome
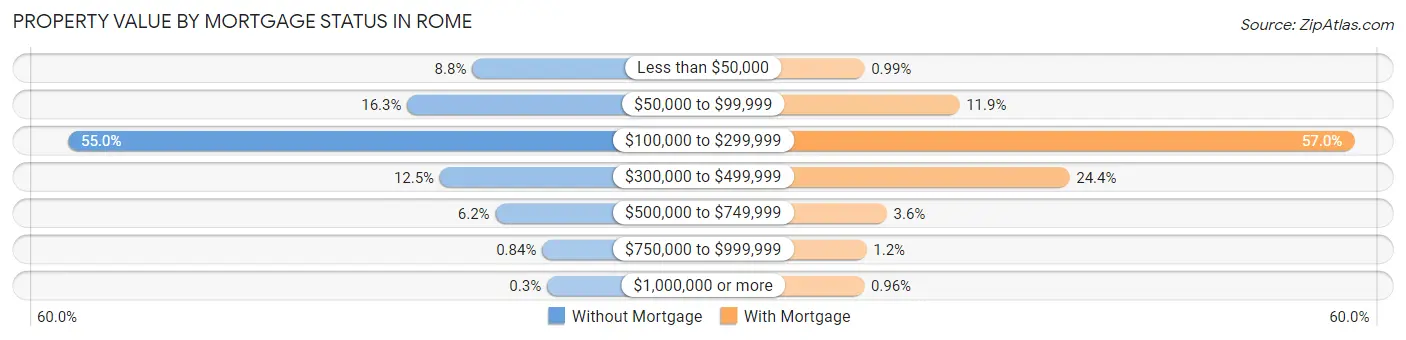
| Property Value | Without Mortgage | With Mortgage |
| Less than $50,000 | 294 (8.8%) | 40 (1.0%) |
| $50,000 to $99,999 | 541 (16.3%) | 480 (11.8%) |
| $100,000 to $299,999 | 1,831 (55.0%) | 2,309 (57.0%) |
| $300,000 to $499,999 | 417 (12.5%) | 990 (24.4%) |
| $500,000 to $749,999 | 206 (6.2%) | 144 (3.5%) |
| $750,000 to $999,999 | 28 (0.8%) | 50 (1.2%) |
| $1,000,000 or more | 10 (0.3%) | 39 (1.0%) |
| Total | 3,327 (100.0%) | 4,052 (100.0%) |
Household Income by Mortgage Status in Rome
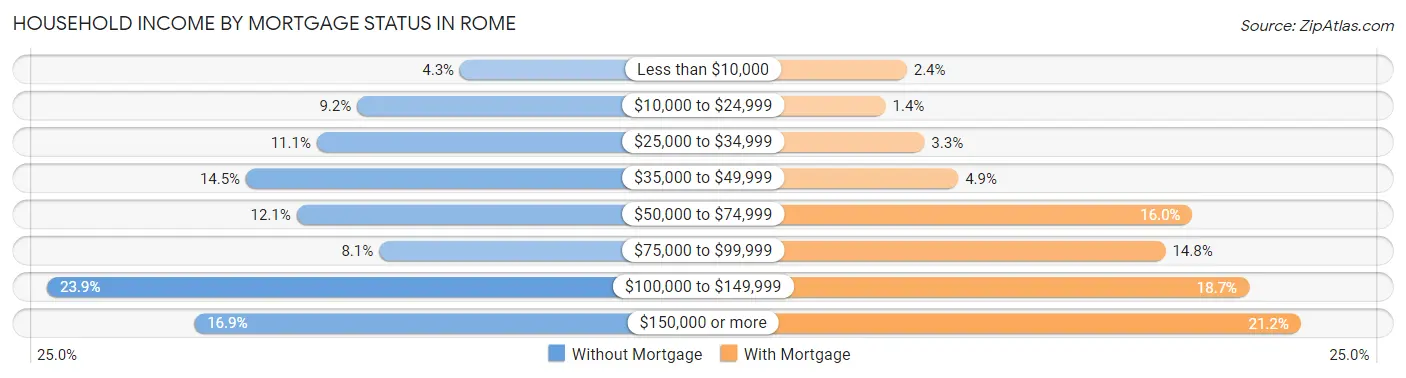
| Household Income | Without Mortgage | With Mortgage |
| Less than $10,000 | 142 (4.3%) | 99 (2.4%) |
| $10,000 to $24,999 | 305 (9.2%) | 58 (1.4%) |
| $25,000 to $34,999 | 369 (11.1%) | 133 (3.3%) |
| $35,000 to $49,999 | 481 (14.5%) | 198 (4.9%) |
| $50,000 to $74,999 | 401 (12.0%) | 650 (16.0%) |
| $75,000 to $99,999 | 270 (8.1%) | 598 (14.8%) |
| $100,000 to $149,999 | 796 (23.9%) | 759 (18.7%) |
| $150,000 or more | 563 (16.9%) | 859 (21.2%) |
| Total | 3,327 (100.0%) | 4,052 (100.0%) |
Property Value to Household Income Ratio in Rome
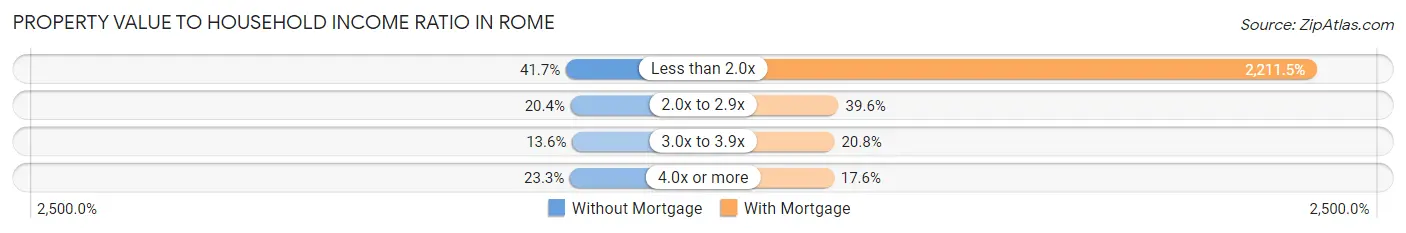
| Value-to-Income Ratio | Without Mortgage | With Mortgage |
| Less than 2.0x | 1,387 (41.7%) | 89,609 (2,211.5%) |
| 2.0x to 2.9x | 679 (20.4%) | 1,604 (39.6%) |
| 3.0x to 3.9x | 453 (13.6%) | 843 (20.8%) |
| 4.0x or more | 774 (23.3%) | 712 (17.6%) |
| Total | 3,327 (100.0%) | 4,052 (100.0%) |
Real Estate Taxes by Mortgage Status in Rome
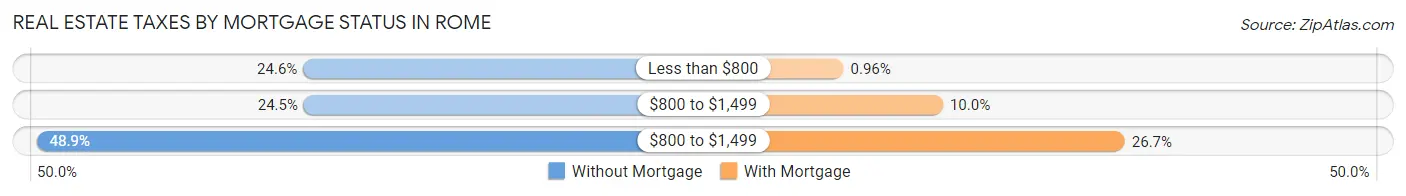
| Property Taxes | Without Mortgage | With Mortgage |
| Less than $800 | 817 (24.6%) | 39 (1.0%) |
| $800 to $1,499 | 815 (24.5%) | 407 (10.0%) |
| $800 to $1,499 | 1,627 (48.9%) | 1,080 (26.7%) |
| Total | 3,327 (100.0%) | 4,052 (100.0%) |
Health & Disability in Rome
Health Insurance Coverage by Age in Rome
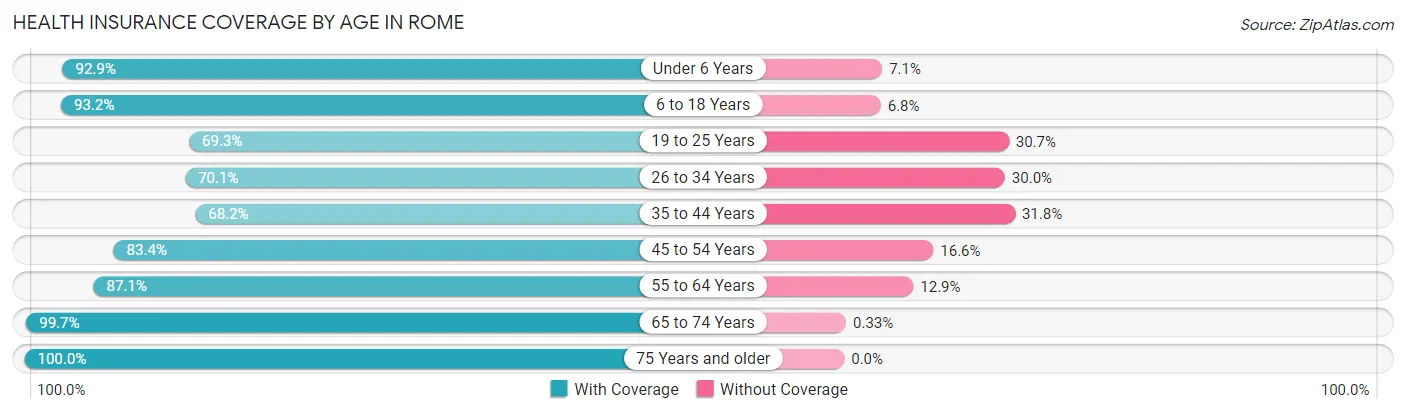
| Age Bracket | With Coverage | Without Coverage |
| Under 6 Years | 2,597 (92.9%) | 198 (7.1%) |
| 6 to 18 Years | 6,790 (93.2%) | 496 (6.8%) |
| 19 to 25 Years | 2,273 (69.3%) | 1,006 (30.7%) |
| 26 to 34 Years | 2,825 (70.1%) | 1,208 (29.9%) |
| 35 to 44 Years | 3,469 (68.2%) | 1,620 (31.8%) |
| 45 to 54 Years | 3,495 (83.4%) | 696 (16.6%) |
| 55 to 64 Years | 3,820 (87.1%) | 565 (12.9%) |
| 65 to 74 Years | 3,369 (99.7%) | 11 (0.3%) |
| 75 Years and older | 2,012 (100.0%) | 0 (0.0%) |
| Total | 30,650 (84.1%) | 5,800 (15.9%) |
Health Insurance Coverage by Citizenship Status in Rome
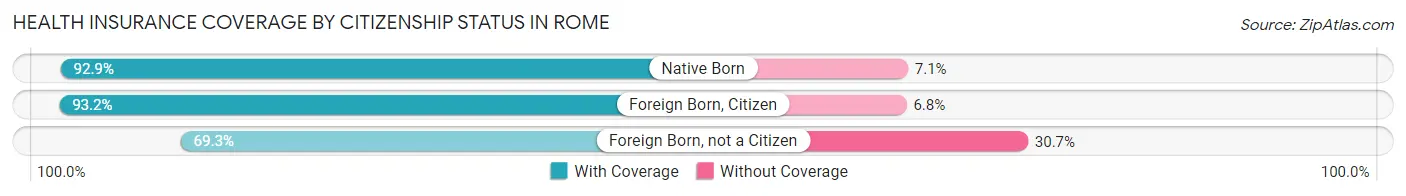
| Citizenship Status | With Coverage | Without Coverage |
| Native Born | 2,597 (92.9%) | 198 (7.1%) |
| Foreign Born, Citizen | 6,790 (93.2%) | 496 (6.8%) |
| Foreign Born, not a Citizen | 2,273 (69.3%) | 1,006 (30.7%) |
Health Insurance Coverage by Household Income in Rome
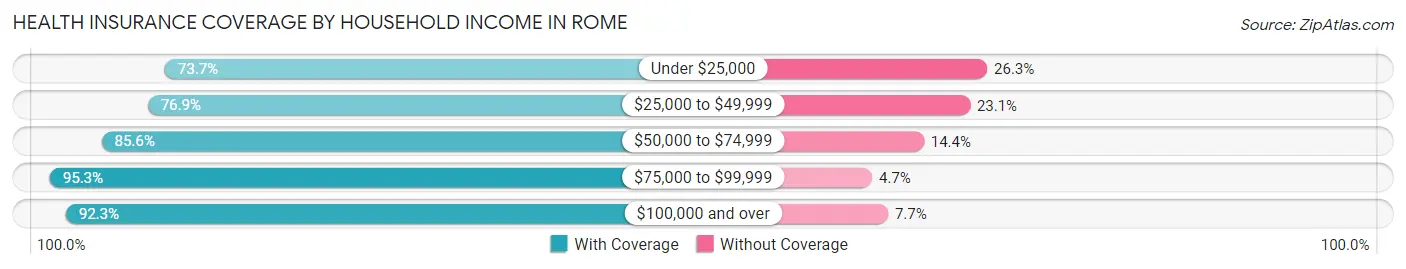
| Household Income | With Coverage | Without Coverage |
| Under $25,000 | 5,209 (73.7%) | 1,858 (26.3%) |
| $25,000 to $49,999 | 6,822 (76.9%) | 2,046 (23.1%) |
| $50,000 to $74,999 | 4,440 (85.6%) | 748 (14.4%) |
| $75,000 to $99,999 | 3,617 (95.3%) | 180 (4.7%) |
| $100,000 and over | 10,286 (92.3%) | 861 (7.7%) |
Public vs Private Health Insurance Coverage by Age in Rome
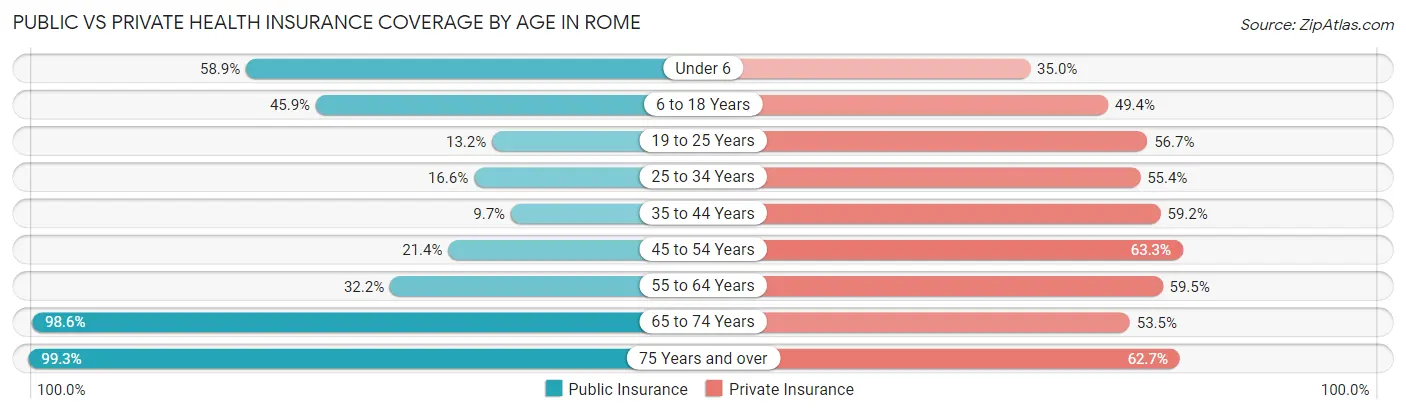
| Age Bracket | Public Insurance | Private Insurance |
| Under 6 | 1,646 (58.9%) | 977 (35.0%) |
| 6 to 18 Years | 3,346 (45.9%) | 3,598 (49.4%) |
| 19 to 25 Years | 434 (13.2%) | 1,859 (56.7%) |
| 25 to 34 Years | 669 (16.6%) | 2,234 (55.4%) |
| 35 to 44 Years | 495 (9.7%) | 3,011 (59.2%) |
| 45 to 54 Years | 895 (21.4%) | 2,653 (63.3%) |
| 55 to 64 Years | 1,411 (32.2%) | 2,611 (59.5%) |
| 65 to 74 Years | 3,333 (98.6%) | 1,807 (53.5%) |
| 75 Years and over | 1,998 (99.3%) | 1,262 (62.7%) |
| Total | 14,227 (39.0%) | 20,012 (54.9%) |
Disability Status by Sex by Age in Rome
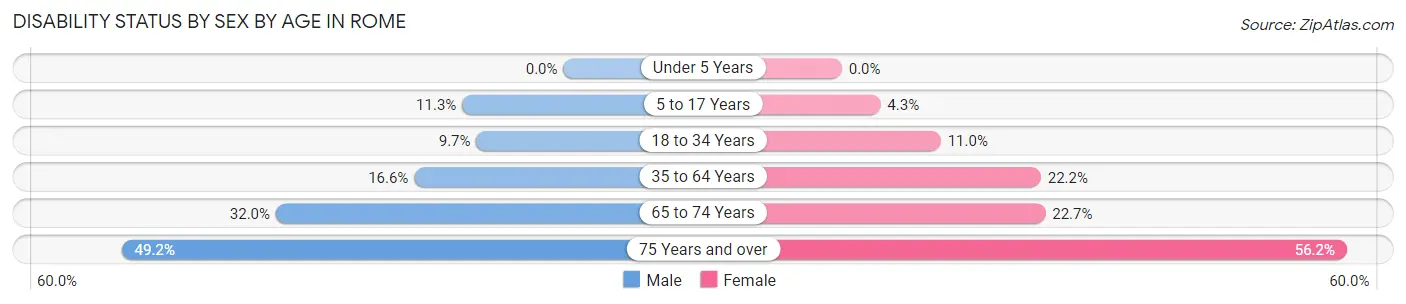
| Age Bracket | Male | Female |
| Under 5 Years | 0 (0.0%) | 0 (0.0%) |
| 5 to 17 Years | 364 (11.3%) | 169 (4.3%) |
| 18 to 34 Years | 373 (9.7%) | 470 (11.0%) |
| 35 to 64 Years | 1,056 (16.6%) | 1,619 (22.2%) |
| 65 to 74 Years | 438 (32.0%) | 456 (22.7%) |
| 75 Years and over | 395 (49.2%) | 680 (56.2%) |
Disability Class by Sex by Age in Rome
Disability Class: Hearing Difficulty
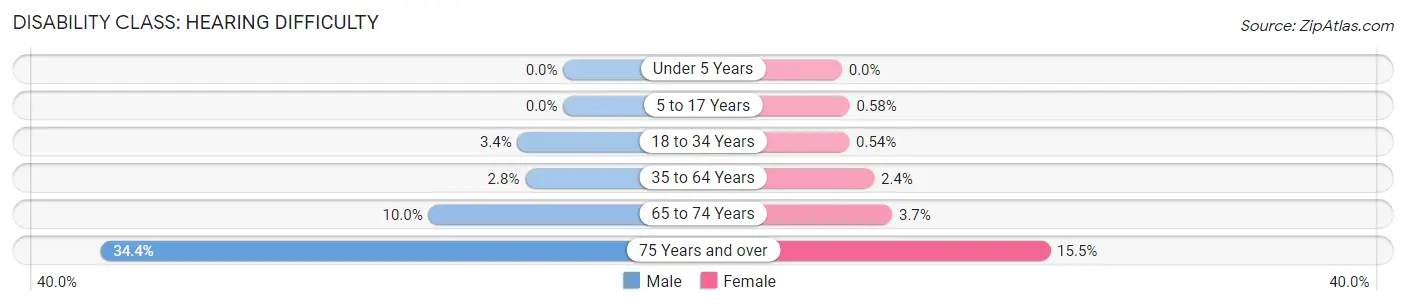
| Age Bracket | Male | Female |
| Under 5 Years | 0 (0.0%) | 0 (0.0%) |
| 5 to 17 Years | 0 (0.0%) | 23 (0.6%) |
| 18 to 34 Years | 131 (3.4%) | 23 (0.5%) |
| 35 to 64 Years | 180 (2.8%) | 175 (2.4%) |
| 65 to 74 Years | 137 (10.0%) | 75 (3.7%) |
| 75 Years and over | 276 (34.4%) | 187 (15.5%) |
Disability Class: Vision Difficulty
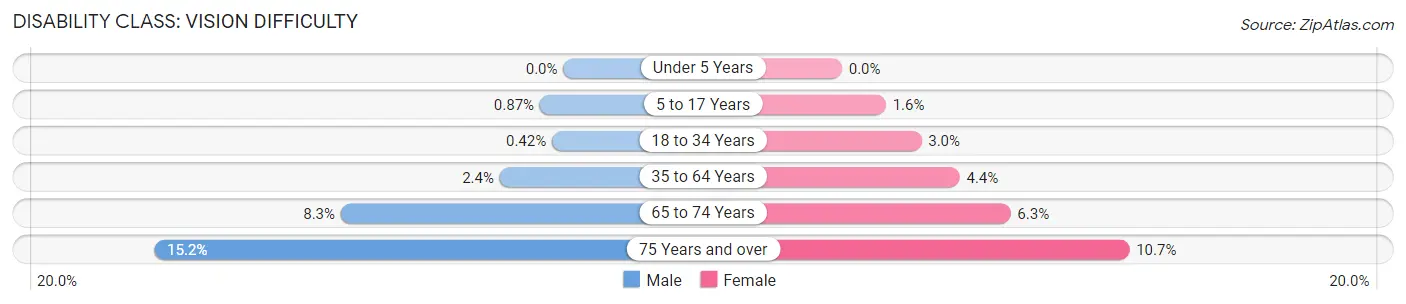
| Age Bracket | Male | Female |
| Under 5 Years | 0 (0.0%) | 0 (0.0%) |
| 5 to 17 Years | 28 (0.9%) | 64 (1.6%) |
| 18 to 34 Years | 16 (0.4%) | 126 (2.9%) |
| 35 to 64 Years | 150 (2.4%) | 319 (4.4%) |
| 65 to 74 Years | 113 (8.3%) | 126 (6.3%) |
| 75 Years and over | 122 (15.2%) | 129 (10.7%) |
Disability Class: Cognitive Difficulty
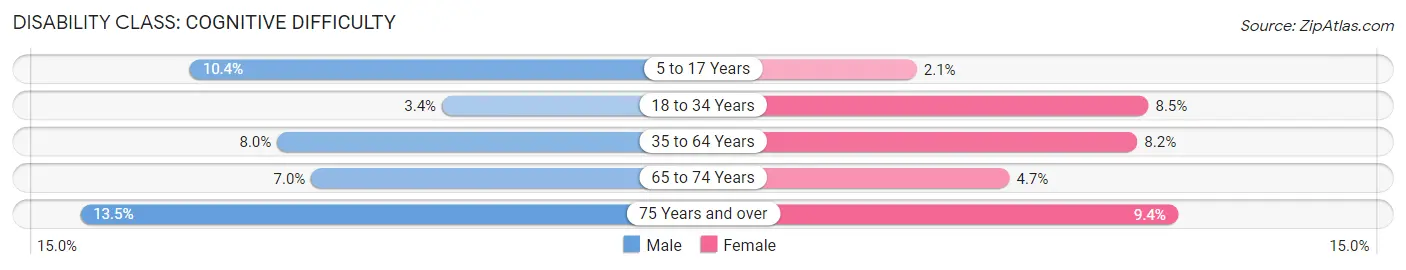
| Age Bracket | Male | Female |
| 5 to 17 Years | 336 (10.4%) | 82 (2.1%) |
| 18 to 34 Years | 130 (3.4%) | 364 (8.5%) |
| 35 to 64 Years | 507 (8.0%) | 601 (8.2%) |
| 65 to 74 Years | 96 (7.0%) | 94 (4.7%) |
| 75 Years and over | 108 (13.5%) | 113 (9.3%) |
Disability Class: Ambulatory Difficulty
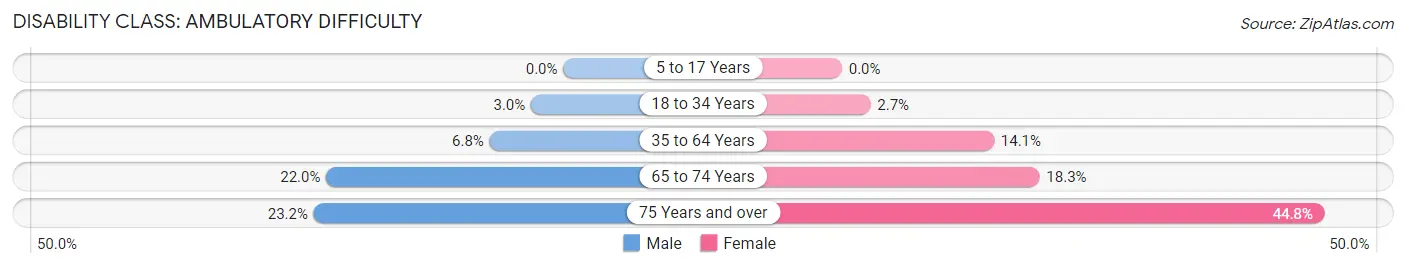
| Age Bracket | Male | Female |
| 5 to 17 Years | 0 (0.0%) | 0 (0.0%) |
| 18 to 34 Years | 115 (3.0%) | 113 (2.6%) |
| 35 to 64 Years | 435 (6.8%) | 1,031 (14.1%) |
| 65 to 74 Years | 301 (22.0%) | 369 (18.3%) |
| 75 Years and over | 186 (23.2%) | 542 (44.8%) |
Disability Class: Self-Care Difficulty
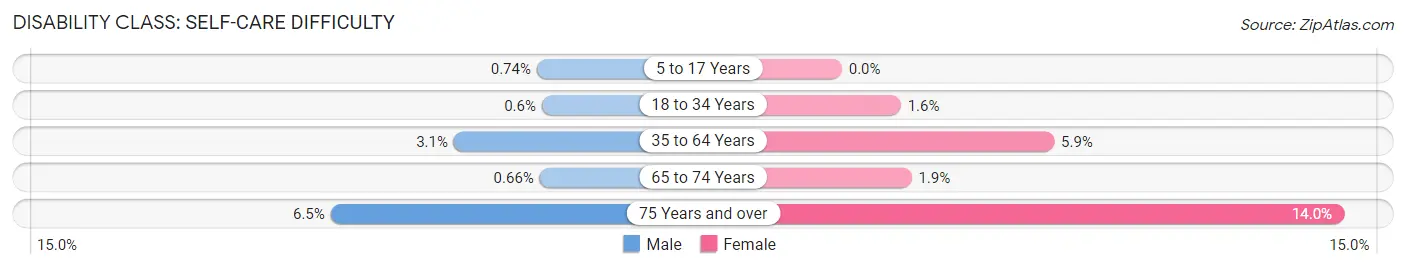
| Age Bracket | Male | Female |
| 5 to 17 Years | 24 (0.7%) | 0 (0.0%) |
| 18 to 34 Years | 23 (0.6%) | 70 (1.6%) |
| 35 to 64 Years | 194 (3.0%) | 432 (5.9%) |
| 65 to 74 Years | 9 (0.7%) | 39 (1.9%) |
| 75 Years and over | 52 (6.5%) | 169 (14.0%) |
Technology Access in Rome
Computing Device Access in Rome
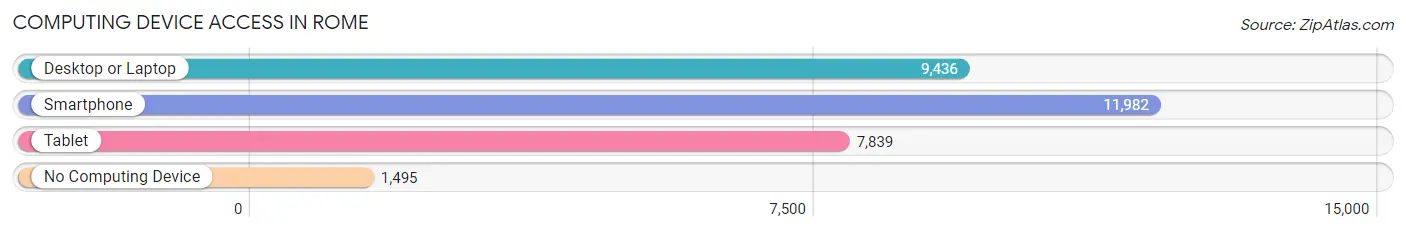
| Device Type | # Households | % Households |
| Desktop or Laptop | 9,436 | 65.1% |
| Smartphone | 11,982 | 82.6% |
| Tablet | 7,839 | 54.1% |
| No Computing Device | 1,495 | 10.3% |
| Total | 14,501 | 100.0% |
Internet Access in Rome
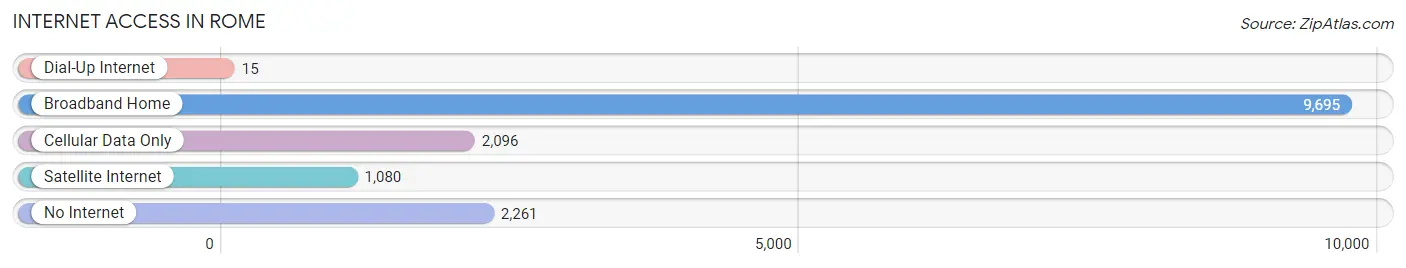
| Internet Type | # Households | % Households |
| Dial-Up Internet | 15 | 0.1% |
| Broadband Home | 9,695 | 66.9% |
| Cellular Data Only | 2,096 | 14.4% |
| Satellite Internet | 1,080 | 7.4% |
| No Internet | 2,261 | 15.6% |
| Total | 14,501 | 100.0% |
Rome Summary
Rome, Georgia is a city located in the northwestern part of the state, in Floyd County. It is the county seat and the largest city in the county. Rome is situated along the Oostanaula and Etowah Rivers, and is the largest city in the Coosa Valley region. The city has a population of 36,303 as of the 2010 census, and is the principal city of the Rome, Georgia Metropolitan Statistical Area, which encompasses all of Floyd County.
History
Rome was founded in 1834 as a trading post along the Oostanaula River. The city was named after Rome, Italy, and was incorporated in 1849. During the Civil War, Rome was a major supply center for the Confederate Army, and was the site of several battles. After the war, the city experienced a period of growth and prosperity, and by the early 1900s, it had become a major industrial center.
Geography
Rome is located at the confluence of the Oostanaula and Etowah Rivers, in the foothills of the Appalachian Mountains. The city has a total area of 33.3 square miles, of which 32.9 square miles is land and 0.4 square miles is water. The city is located in the humid subtropical climate zone, and has hot, humid summers and mild winters.
Economy
Rome’s economy is largely based on manufacturing and healthcare. The city is home to several large manufacturing companies, including Mohawk Industries, Shaw Industries, and Georgia-Pacific. The city is also home to several healthcare facilities, including Redmond Regional Medical Center and Floyd Medical Center. Other major employers in the city include Berry College, the Rome City School System, and the Floyd County government.
Demographics
As of the 2010 census, Rome had a population of 36,303. The racial makeup of the city was 73.2% White, 19.3% African American, 0.3% Native American, 1.2% Asian, 0.1% Pacific Islander, 3.7% from other races, and 2.4% from two or more races. Hispanic or Latino of any race were 8.2% of the population.
The median income for a household in the city was $35,945, and the median income for a family was $45,945. The per capita income for the city was $20,945. About 17.2% of families and 21.2% of the population were below the poverty line, including 28.2% of those under age 18 and 14.2% of those age 65 or over.
Common Questions
What is the Total Population of Rome?
Total Population of Rome is 37,621.
What is the Total Male Population of Rome?
Total Male Population of Rome is 17,449.
What is the Total Female Population of Rome?
Total Female Population of Rome is 20,172.
What is the Ratio of Males per 100 Females in Rome?
There are 86.50 Males per 100 Females in Rome.
What is the Ratio of Females per 100 Males in Rome?
There are 115.61 Females per 100 Males in Rome.
What is the Median Population Age in Rome?
Median Population Age in Rome is 36.9 Years.
What is the Average Family Size in Rome
Average Family Size in Rome is 3.3 People.
What is the Average Household Size in Rome
Average Household Size in Rome is 2.5 People.
What is Per Capita Income in Rome?
Per Capita income in Rome is $29,996.
What is the Median Family Income in Rome?
Median Family Income in Rome is $66,418.
What is the Median Household income in Rome?
Median Household Income in Rome is $48,512.
What is Income or Wage Gap in Rome?
Income or Wage Gap in Rome is 25.6%.
Women in Rome earn 74.4 cents for every dollar earned by a man.
What is Family Income Deficit in Rome?
Family Income Deficit in Rome is $10,526.
Families that are below poverty line in Rome earn $10,526 less on average than the poverty threshold level.
What is Inequality or Gini Index in Rome?
Inequality or Gini Index in Rome is 0.50.
How Large is the Labor Force in Rome?
There are 16,489 People in the Labor Forcein in Rome.
What is the Percentage of People in the Labor Force in Rome?
56.1% of People are in the Labor Force in Rome.
What is the Unemployment Rate in Rome?
Unemployment Rate in Rome is 4.5%.