Albany, GA
Albany Map
Albany Overview
68,926
TOTAL POPULATION
31,598
MALE POPULATION
37,328
FEMALE POPULATION
84.65
MALES / 100 FEMALES
118.13
FEMALES / 100 MALES
34.7
MEDIAN AGE
3.1
AVG FAMILY SIZE
2.3
AVG HOUSEHOLD SIZE
$23,824
PER CAPITA INCOME
$47,032
AVG FAMILY INCOME
$43,724
AVG HOUSEHOLD INCOME
21.5%
WAGE / INCOME GAP [ % ]
78.5¢/ $1
WAGE / INCOME GAP [ $ ]
$12,347
FAMILY INCOME DEFICIT
0.48
INEQUALITY / GINI INDEX
29,949
LABOR FORCE [ PEOPLE ]
55.7%
PERCENT IN LABOR FORCE
10.3%
UNEMPLOYMENT RATE
Albany Area Codes
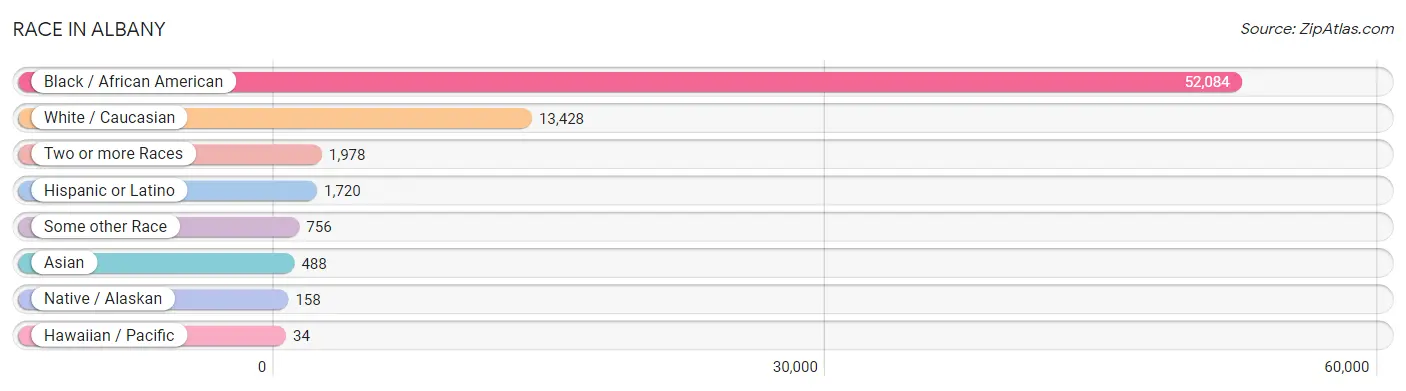
Race in Albany
The most populous races in Albany are Black / African American (52,084 | 75.6%), White / Caucasian (13,428 | 19.5%), and Two or more Races (1,978 | 2.9%).
| Race | # Population | % Population |
| Asian | 488 | 0.7% |
| Black / African American | 52,084 | 75.6% |
| Hawaiian / Pacific | 34 | 0.1% |
| Hispanic or Latino | 1,720 | 2.5% |
| Native / Alaskan | 158 | 0.2% |
| White / Caucasian | 13,428 | 19.5% |
| Two or more Races | 1,978 | 2.9% |
| Some other Race | 756 | 1.1% |
| Total | 68,926 | 100.0% |
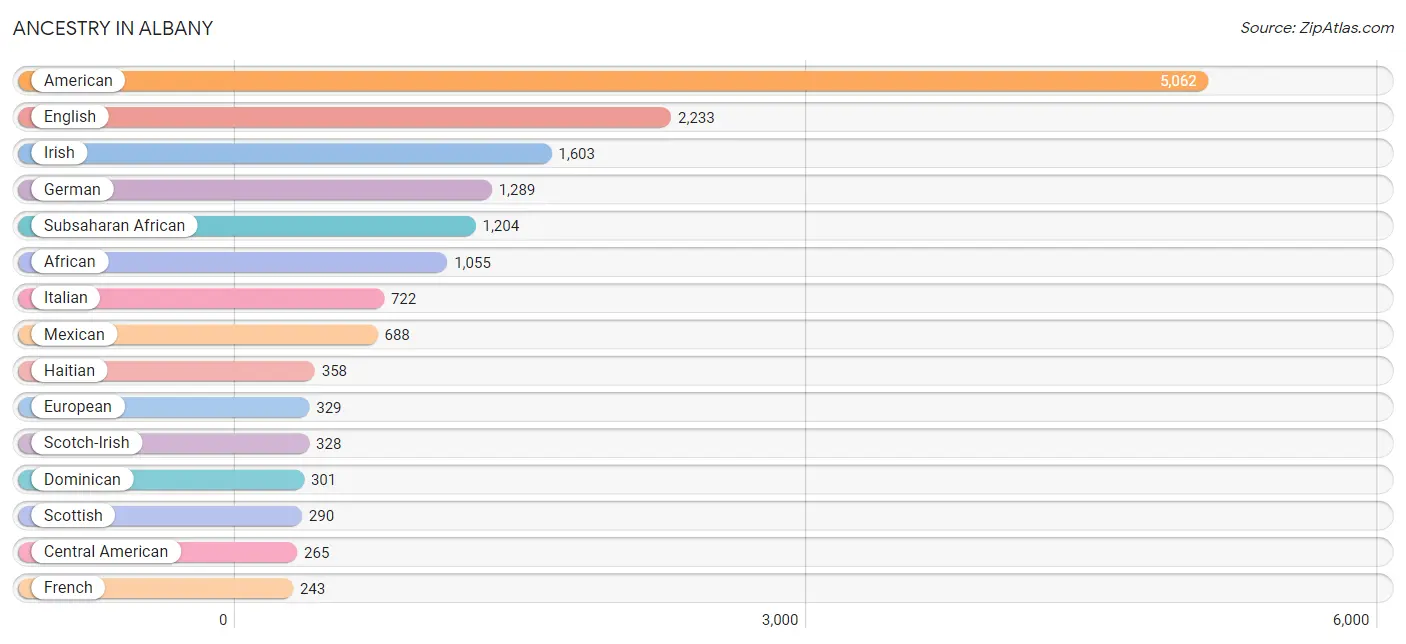
Ancestry in Albany
The most populous ancestries reported in Albany are American (5,062 | 7.3%), English (2,233 | 3.2%), Irish (1,603 | 2.3%), German (1,289 | 1.9%), and Subsaharan African (1,204 | 1.8%), together accounting for 16.5% of all Albany residents.
| Ancestry | # Population | % Population |
| Afghan | 24 | 0.0% |
| African | 1,055 | 1.5% |
| American | 5,062 | 7.3% |
| Arab | 39 | 0.1% |
| Australian | 181 | 0.3% |
| Austrian | 29 | 0.0% |
| Bahamian | 215 | 0.3% |
| Barbadian | 5 | 0.0% |
| Bhutanese | 64 | 0.1% |
| Blackfeet | 16 | 0.0% |
| British | 81 | 0.1% |
| British West Indian | 7 | 0.0% |
| Burmese | 24 | 0.0% |
| Canadian | 6 | 0.0% |
| Central American | 265 | 0.4% |
| Cherokee | 63 | 0.1% |
| Choctaw | 10 | 0.0% |
| Colombian | 9 | 0.0% |
| Creek | 6 | 0.0% |
| Cuban | 49 | 0.1% |
| Czech | 126 | 0.2% |
| Danish | 10 | 0.0% |
| Dominican | 301 | 0.4% |
| Dutch | 168 | 0.2% |
| Ecuadorian | 37 | 0.1% |
| Egyptian | 10 | 0.0% |
| English | 2,233 | 3.2% |
| Ethiopian | 7 | 0.0% |
| European | 329 | 0.5% |
| French | 243 | 0.4% |
| German | 1,289 | 1.9% |
| Greek | 51 | 0.1% |
| Guatemalan | 124 | 0.2% |
| Haitian | 358 | 0.5% |
| Hungarian | 8 | 0.0% |
| Indian (Asian) | 158 | 0.2% |
| Irish | 1,603 | 2.3% |
| Iroquois | 5 | 0.0% |
| Israeli | 76 | 0.1% |
| Italian | 722 | 1.1% |
| Jamaican | 64 | 0.1% |
| Kenyan | 26 | 0.0% |
| Korean | 197 | 0.3% |
| Lebanese | 29 | 0.0% |
| Mexican | 688 | 1.0% |
| Mexican American Indian | 30 | 0.0% |
| Native Hawaiian | 44 | 0.1% |
| Navajo | 19 | 0.0% |
| Nicaraguan | 31 | 0.0% |
| Nigerian | 62 | 0.1% |
| Northern European | 9 | 0.0% |
| Norwegian | 17 | 0.0% |
| Pakistani | 12 | 0.0% |
| Panamanian | 44 | 0.1% |
| Peruvian | 2 | 0.0% |
| Polish | 170 | 0.3% |
| Portuguese | 8 | 0.0% |
| Puerto Rican | 129 | 0.2% |
| Russian | 37 | 0.1% |
| Salvadoran | 66 | 0.1% |
| Scandinavian | 57 | 0.1% |
| Scotch-Irish | 328 | 0.5% |
| Scottish | 290 | 0.4% |
| Seminole | 7 | 0.0% |
| Sioux | 4 | 0.0% |
| South American | 102 | 0.2% |
| South American Indian | 26 | 0.0% |
| Spaniard | 146 | 0.2% |
| Sri Lankan | 192 | 0.3% |
| Subsaharan African | 1,204 | 1.8% |
| Swedish | 73 | 0.1% |
| Swiss | 21 | 0.0% |
| Trinidadian and Tobagonian | 7 | 0.0% |
| U.S. Virgin Islander | 11 | 0.0% |
| Venezuelan | 54 | 0.1% |
| Welsh | 36 | 0.1% |
| West Indian | 26 | 0.0% |
| Yugoslavian | 9 | 0.0% | View All 78 Rows |
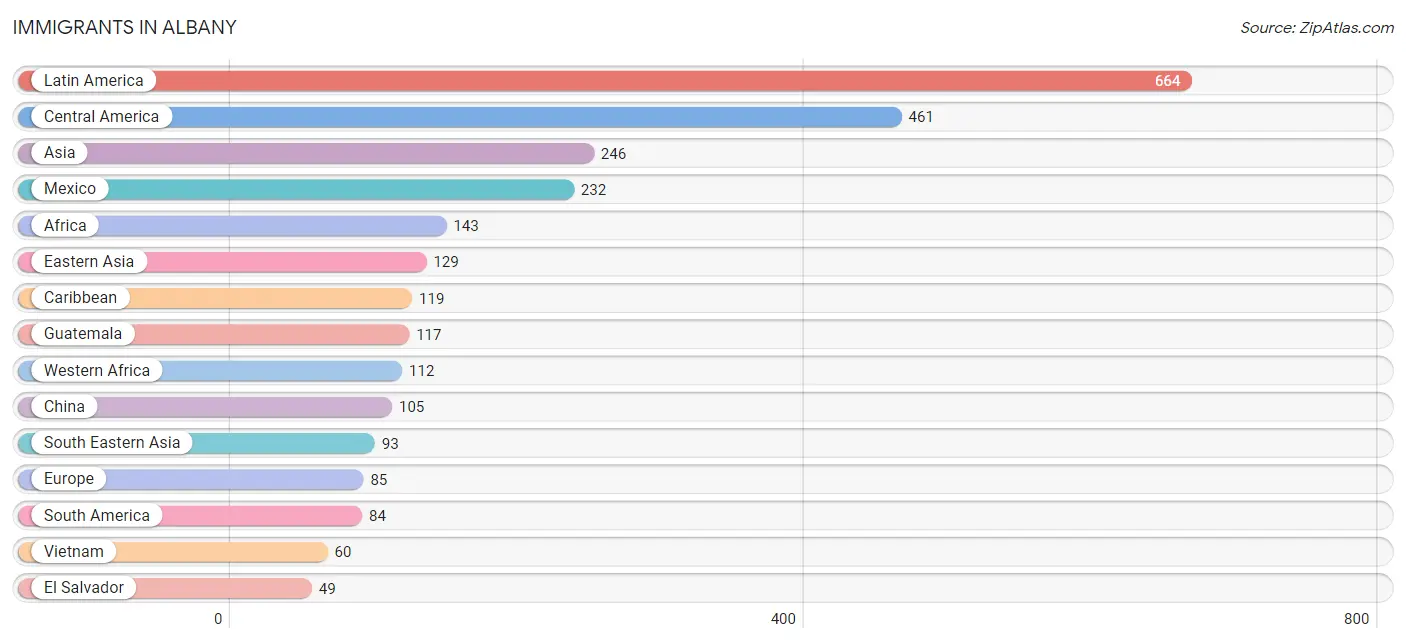
Immigrants in Albany
The most numerous immigrant groups reported in Albany came from Latin America (664 | 1.0%), Central America (461 | 0.7%), Asia (246 | 0.4%), Mexico (232 | 0.3%), and Africa (143 | 0.2%), together accounting for 2.5% of all Albany residents.
| Immigration Origin | # Population | % Population |
| Afghanistan | 24 | 0.0% |
| Africa | 143 | 0.2% |
| Asia | 246 | 0.4% |
| Australia | 43 | 0.1% |
| Canada | 26 | 0.0% |
| Caribbean | 119 | 0.2% |
| Central America | 461 | 0.7% |
| China | 105 | 0.2% |
| Cuba | 15 | 0.0% |
| Dominican Republic | 42 | 0.1% |
| Eastern Africa | 31 | 0.0% |
| Eastern Asia | 129 | 0.2% |
| Eastern Europe | 9 | 0.0% |
| Ecuador | 37 | 0.1% |
| El Salvador | 49 | 0.1% |
| Ethiopia | 5 | 0.0% |
| Europe | 85 | 0.1% |
| Germany | 40 | 0.1% |
| Ghana | 34 | 0.1% |
| Greece | 13 | 0.0% |
| Guatemala | 117 | 0.2% |
| Haiti | 3 | 0.0% |
| Jamaica | 37 | 0.1% |
| Kenya | 26 | 0.0% |
| Korea | 24 | 0.0% |
| Latin America | 664 | 1.0% |
| Liberia | 30 | 0.0% |
| Mexico | 232 | 0.3% |
| Nicaragua | 19 | 0.0% |
| Nigeria | 48 | 0.1% |
| Northern Europe | 23 | 0.0% |
| Oceania | 43 | 0.1% |
| Panama | 44 | 0.1% |
| Peru | 32 | 0.1% |
| Philippines | 21 | 0.0% |
| Russia | 9 | 0.0% |
| South America | 84 | 0.1% |
| South Central Asia | 24 | 0.0% |
| South Eastern Asia | 93 | 0.1% |
| Southern Europe | 13 | 0.0% |
| Thailand | 12 | 0.0% |
| Trinidad and Tobago | 22 | 0.0% |
| Vietnam | 60 | 0.1% |
| Western Africa | 112 | 0.2% |
| Western Europe | 40 | 0.1% | View All 45 Rows |
Sex and Age in Albany
Sex and Age in Albany
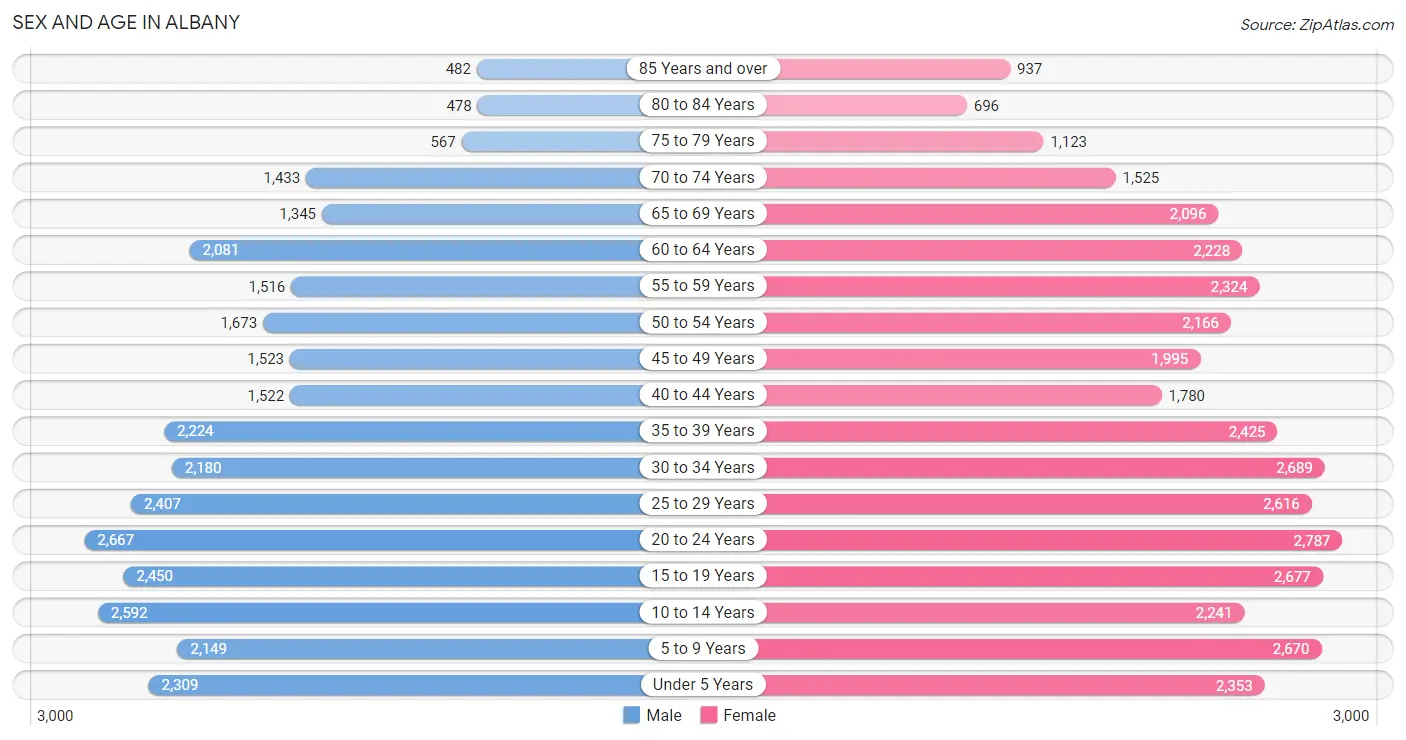
The most populous age groups in Albany are 20 to 24 Years (2,667 | 8.4%) for men and 20 to 24 Years (2,787 | 7.5%) for women.
| Age Bracket | Male | Female |
| Under 5 Years | 2,309 (7.3%) | 2,353 (6.3%) |
| 5 to 9 Years | 2,149 (6.8%) | 2,670 (7.1%) |
| 10 to 14 Years | 2,592 (8.2%) | 2,241 (6.0%) |
| 15 to 19 Years | 2,450 (7.7%) | 2,677 (7.2%) |
| 20 to 24 Years | 2,667 (8.4%) | 2,787 (7.5%) |
| 25 to 29 Years | 2,407 (7.6%) | 2,616 (7.0%) |
| 30 to 34 Years | 2,180 (6.9%) | 2,689 (7.2%) |
| 35 to 39 Years | 2,224 (7.0%) | 2,425 (6.5%) |
| 40 to 44 Years | 1,522 (4.8%) | 1,780 (4.8%) |
| 45 to 49 Years | 1,523 (4.8%) | 1,995 (5.3%) |
| 50 to 54 Years | 1,673 (5.3%) | 2,166 (5.8%) |
| 55 to 59 Years | 1,516 (4.8%) | 2,324 (6.2%) |
| 60 to 64 Years | 2,081 (6.6%) | 2,228 (6.0%) |
| 65 to 69 Years | 1,345 (4.3%) | 2,096 (5.6%) |
| 70 to 74 Years | 1,433 (4.5%) | 1,525 (4.1%) |
| 75 to 79 Years | 567 (1.8%) | 1,123 (3.0%) |
| 80 to 84 Years | 478 (1.5%) | 696 (1.9%) |
| 85 Years and over | 482 (1.5%) | 937 (2.5%) |
| Total | 31,598 (100.0%) | 37,328 (100.0%) |
Families and Households in Albany
Median Family Size in Albany
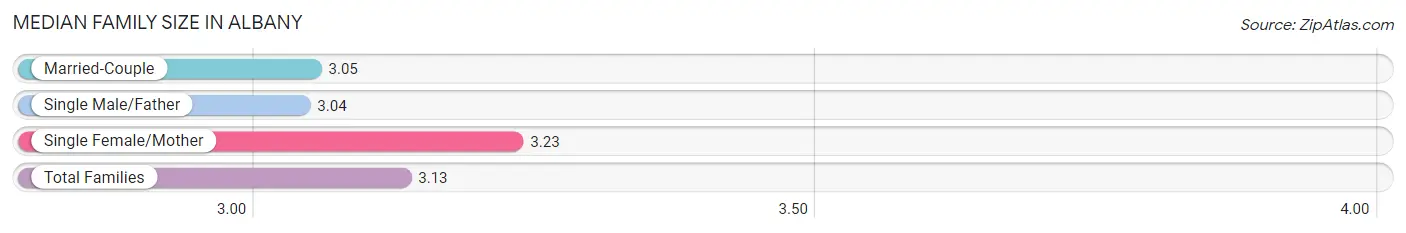
The median family size in Albany is 3.13 persons per family, with single female/mother families (7,366 | 47.6%) accounting for the largest median family size of 3.23 persons per family. On the other hand, single male/father families (1,464 | 9.5%) represent the smallest median family size with 3.04 persons per family.
| Family Type | # Families | Family Size |
| Married-Couple | 6,659 (43.0%) | 3.05 |
| Single Male/Father | 1,464 (9.5%) | 3.04 |
| Single Female/Mother | 7,366 (47.6%) | 3.23 |
| Total Families | 15,489 (100.0%) | 3.13 |
Median Household Size in Albany
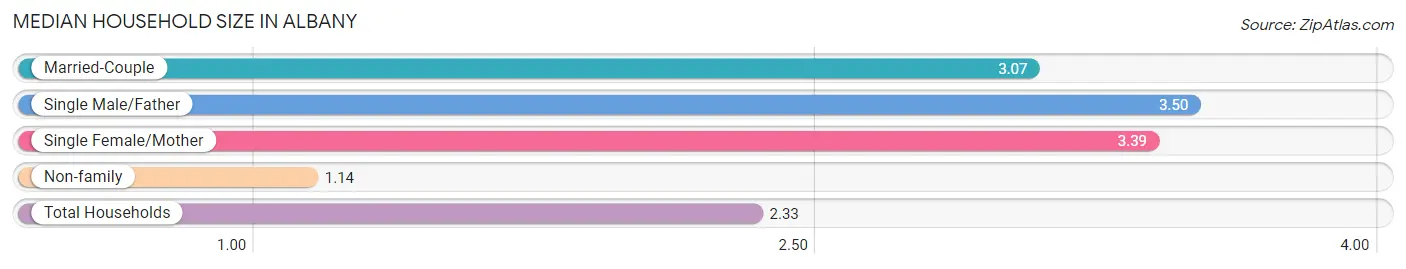
The median household size in Albany is 2.33 persons per household, with single male/father households (1,464 | 5.3%) accounting for the largest median household size of 3.5 persons per household. non-family households (12,220 | 44.1%) represent the smallest median household size with 1.14 persons per household.
| Household Type | # Households | Household Size |
| Married-Couple | 6,659 (24.0%) | 3.07 |
| Single Male/Father | 1,464 (5.3%) | 3.50 |
| Single Female/Mother | 7,366 (26.6%) | 3.39 |
| Non-family | 12,220 (44.1%) | 1.14 |
| Total Households | 27,709 (100.0%) | 2.33 |
Household Size by Marriage Status in Albany
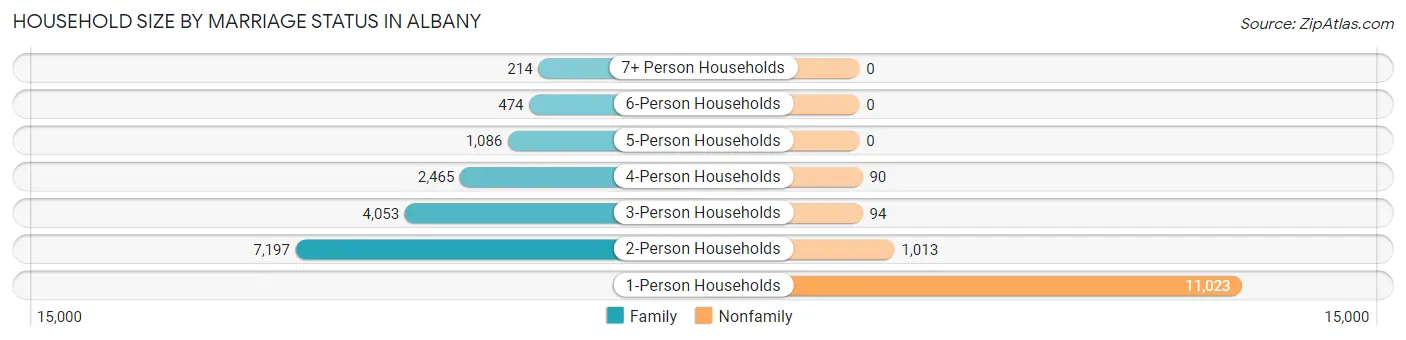
Out of a total of 27,709 households in Albany, 15,489 (55.9%) are family households, while 12,220 (44.1%) are nonfamily households. The most numerous type of family households are 2-person households, comprising 7,197, and the most common type of nonfamily households are 1-person households, comprising 11,023.
| Household Size | Family Households | Nonfamily Households |
| 1-Person Households | - | 11,023 (39.8%) |
| 2-Person Households | 7,197 (26.0%) | 1,013 (3.7%) |
| 3-Person Households | 4,053 (14.6%) | 94 (0.3%) |
| 4-Person Households | 2,465 (8.9%) | 90 (0.3%) |
| 5-Person Households | 1,086 (3.9%) | 0 (0.0%) |
| 6-Person Households | 474 (1.7%) | 0 (0.0%) |
| 7+ Person Households | 214 (0.8%) | 0 (0.0%) |
| Total | 15,489 (55.9%) | 12,220 (44.1%) |
Female Fertility in Albany
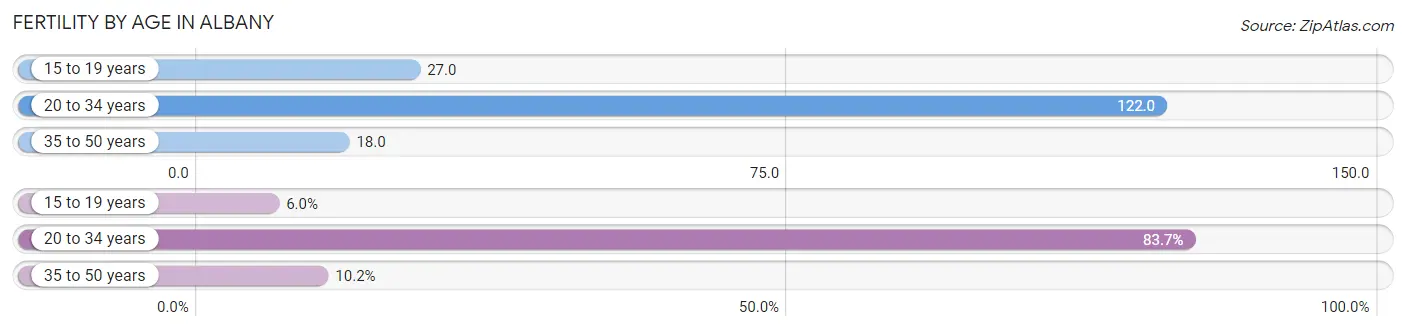
Fertility by Age in Albany
Average fertility rate in Albany is 68.0 births per 1,000 women. Women in the age bracket of 20 to 34 years have the highest fertility rate with 122.0 births per 1,000 women. Women in the age bracket of 20 to 34 years acount for 83.7% of all women with births.
| Age Bracket | Women with Births | Births / 1,000 Women |
| 15 to 19 years | 71 (6.0%) | 27.0 |
| 20 to 34 years | 984 (83.7%) | 122.0 |
| 35 to 50 years | 120 (10.2%) | 18.0 |
| Total | 1,175 (100.0%) | 68.0 |
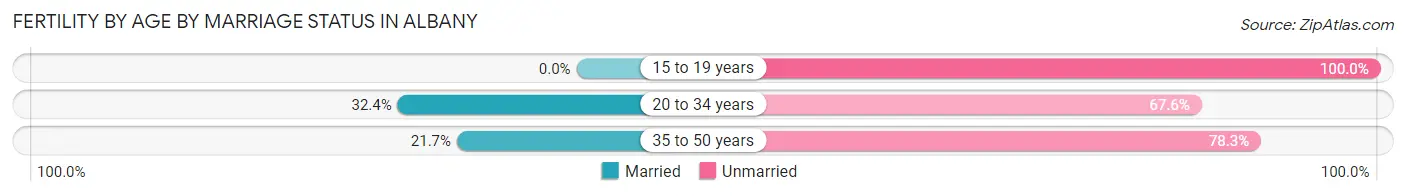
Fertility by Age by Marriage Status in Albany
29.4% of women with births (1,175) in Albany are married. The highest percentage of unmarried women with births falls into 15 to 19 years age bracket with 100.0% of them unmarried at the time of birth, while the lowest percentage of unmarried women with births belong to 20 to 34 years age bracket with 67.6% of them unmarried.
| Age Bracket | Married | Unmarried |
| 15 to 19 years | 0 (0.0%) | 71 (100.0%) |
| 20 to 34 years | 319 (32.4%) | 665 (67.6%) |
| 35 to 50 years | 26 (21.7%) | 94 (78.3%) |
| Total | 345 (29.4%) | 830 (70.6%) |
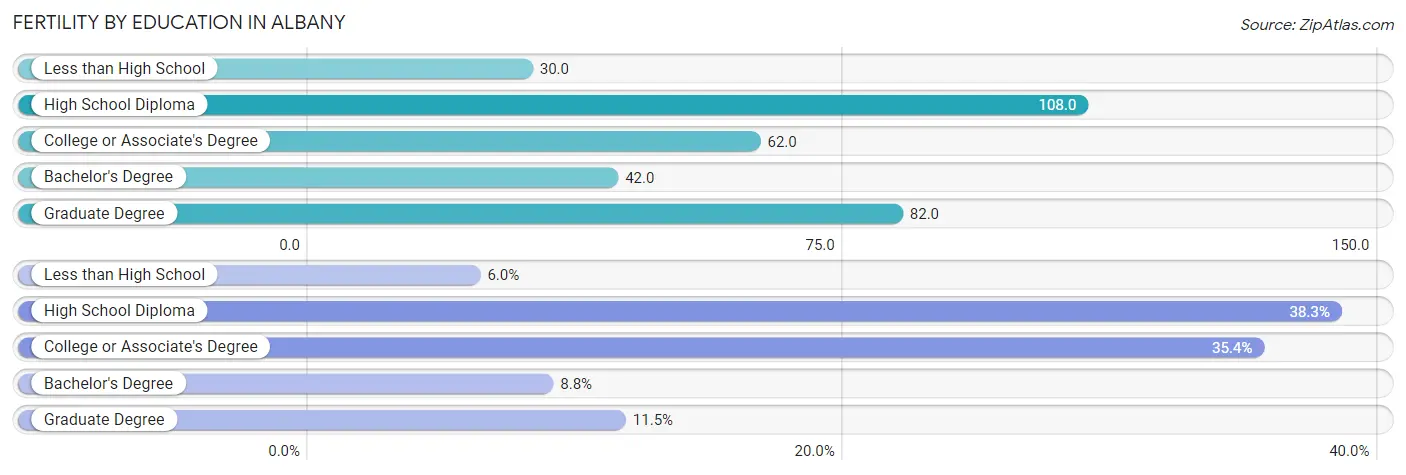
Fertility by Education in Albany
Average fertility rate in Albany is 68.0 births per 1,000 women. Women with the education attainment of high school diploma have the highest fertility rate of 108.0 births per 1,000 women, while women with the education attainment of less than high school have the lowest fertility at 30.0 births per 1,000 women. Women with the education attainment of high school diploma represent 38.3% of all women with births.
| Educational Attainment | Women with Births | Births / 1,000 Women |
| Less than High School | 71 (6.0%) | 30.0 |
| High School Diploma | 450 (38.3%) | 108.0 |
| College or Associate's Degree | 416 (35.4%) | 62.0 |
| Bachelor's Degree | 103 (8.8%) | 42.0 |
| Graduate Degree | 135 (11.5%) | 82.0 |
| Total | 1,175 (100.0%) | 68.0 |
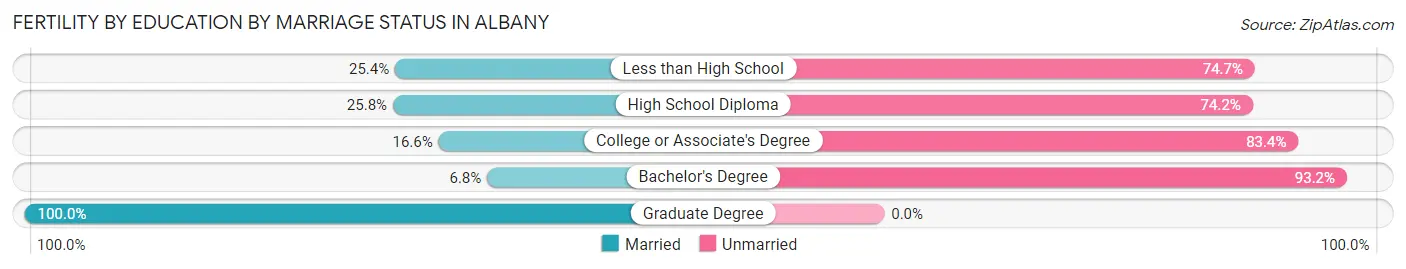
Fertility by Education by Marriage Status in Albany
70.6% of women with births in Albany are unmarried. Women with the educational attainment of graduate degree are most likely to be married with 100.0% of them married at childbirth, while women with the educational attainment of bachelor's degree are least likely to be married with 93.2% of them unmarried at childbirth.
| Educational Attainment | Married | Unmarried |
| Less than High School | 18 (25.4%) | 53 (74.7%) |
| High School Diploma | 116 (25.8%) | 334 (74.2%) |
| College or Associate's Degree | 69 (16.6%) | 347 (83.4%) |
| Bachelor's Degree | 7 (6.8%) | 96 (93.2%) |
| Graduate Degree | 135 (100.0%) | 0 (0.0%) |
| Total | 345 (29.4%) | 830 (70.6%) |
Income in Albany
Income Overview in Albany
Per Capita Income in Albany is $23,824, while median incomes of families and households are $47,032 and $43,724 respectively.
| Characteristic | Number | Measure |
| Per Capita Income | 68,926 | $23,824 |
| Median Family Income | 15,489 | $47,032 |
| Mean Family Income | 15,489 | $65,254 |
| Median Household Income | 27,709 | $43,724 |
| Mean Household Income | 27,709 | $55,299 |
| Income Deficit | 15,489 | $12,347 |
| Wage / Income Gap (%) | 68,926 | 21.47% |
| Wage / Income Gap ($) | 68,926 | 78.53¢ per $1 |
| Gini / Inequality Index | 68,926 | 0.48 |
Earnings by Sex in Albany
Average Earnings in Albany are $29,580, $34,721 for men and $27,267 for women, a difference of 21.5%.
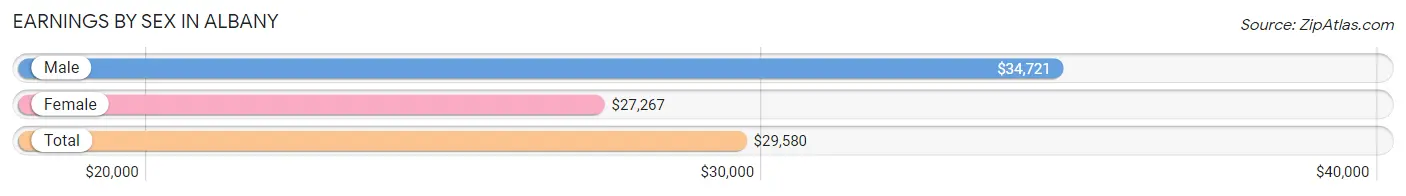
| Sex | Number | Average Earnings |
| Male | 13,781 (44.3%) | $34,721 |
| Female | 17,343 (55.7%) | $27,267 |
| Total | 31,124 (100.0%) | $29,580 |
Earnings by Sex by Income Bracket in Albany
The most common earnings brackets in Albany are $45,000 to $49,999 for men (1,104 | 8.0%) and $25,000 to $29,999 for women (1,699 | 9.8%).
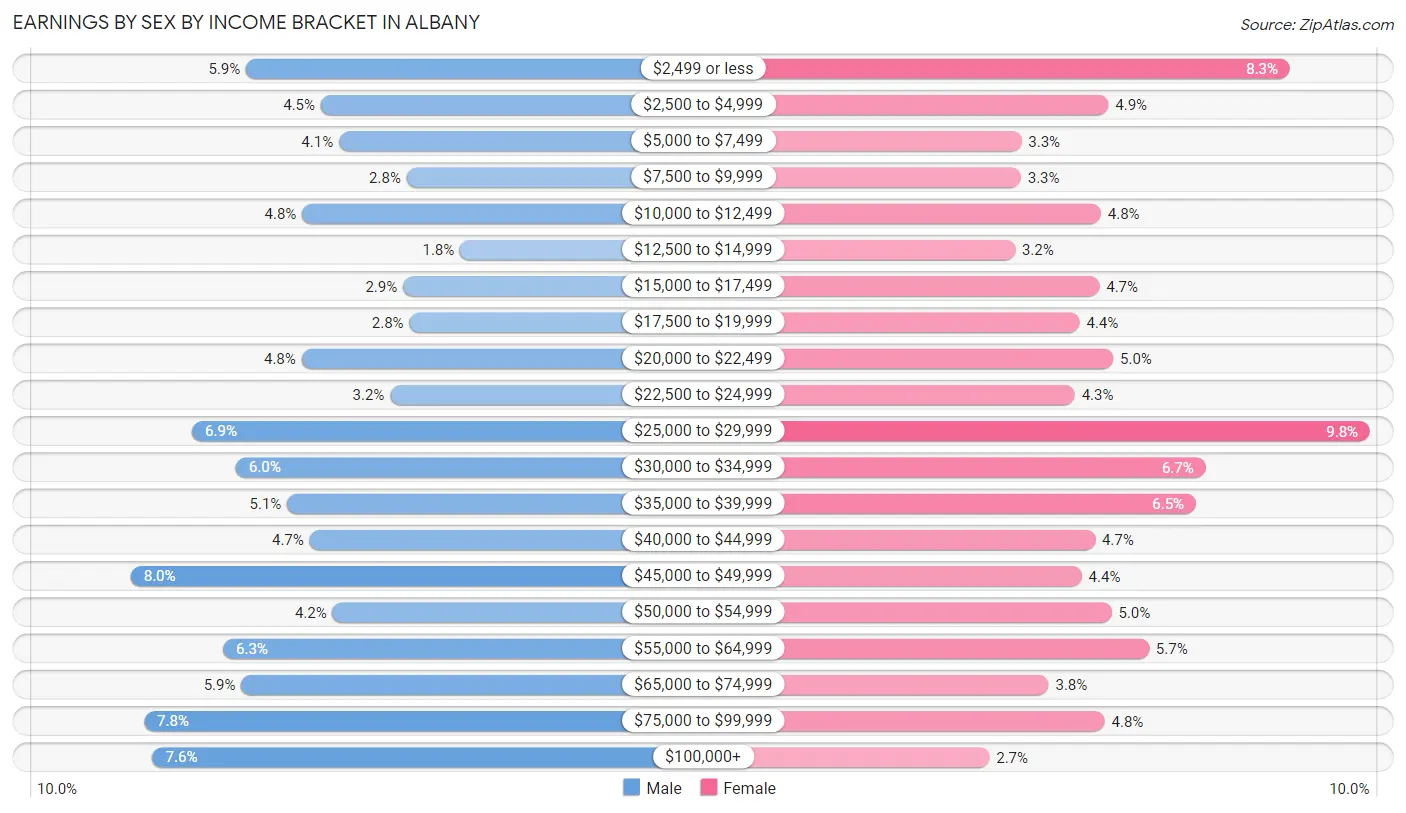
| Income | Male | Female |
| $2,499 or less | 806 (5.9%) | 1,440 (8.3%) |
| $2,500 to $4,999 | 613 (4.4%) | 849 (4.9%) |
| $5,000 to $7,499 | 567 (4.1%) | 567 (3.3%) |
| $7,500 to $9,999 | 392 (2.8%) | 565 (3.3%) |
| $10,000 to $12,499 | 661 (4.8%) | 825 (4.8%) |
| $12,500 to $14,999 | 253 (1.8%) | 546 (3.2%) |
| $15,000 to $17,499 | 401 (2.9%) | 821 (4.7%) |
| $17,500 to $19,999 | 384 (2.8%) | 756 (4.4%) |
| $20,000 to $22,499 | 663 (4.8%) | 866 (5.0%) |
| $22,500 to $24,999 | 434 (3.2%) | 740 (4.3%) |
| $25,000 to $29,999 | 945 (6.9%) | 1,699 (9.8%) |
| $30,000 to $34,999 | 833 (6.0%) | 1,166 (6.7%) |
| $35,000 to $39,999 | 700 (5.1%) | 1,134 (6.5%) |
| $40,000 to $44,999 | 642 (4.7%) | 807 (4.6%) |
| $45,000 to $49,999 | 1,104 (8.0%) | 763 (4.4%) |
| $50,000 to $54,999 | 583 (4.2%) | 861 (5.0%) |
| $55,000 to $64,999 | 865 (6.3%) | 982 (5.7%) |
| $65,000 to $74,999 | 819 (5.9%) | 655 (3.8%) |
| $75,000 to $99,999 | 1,069 (7.8%) | 838 (4.8%) |
| $100,000+ | 1,047 (7.6%) | 463 (2.7%) |
| Total | 13,781 (100.0%) | 17,343 (100.0%) |
Earnings by Sex by Educational Attainment in Albany
Average earnings in Albany are $41,186 for men and $31,292 for women, a difference of 24.0%. Men with an educational attainment of graduate degree enjoy the highest average annual earnings of $80,197, while those with high school diploma education earn the least with $31,940. Women with an educational attainment of graduate degree earn the most with the average annual earnings of $61,271, while those with less than high school education have the smallest earnings of $17,113.
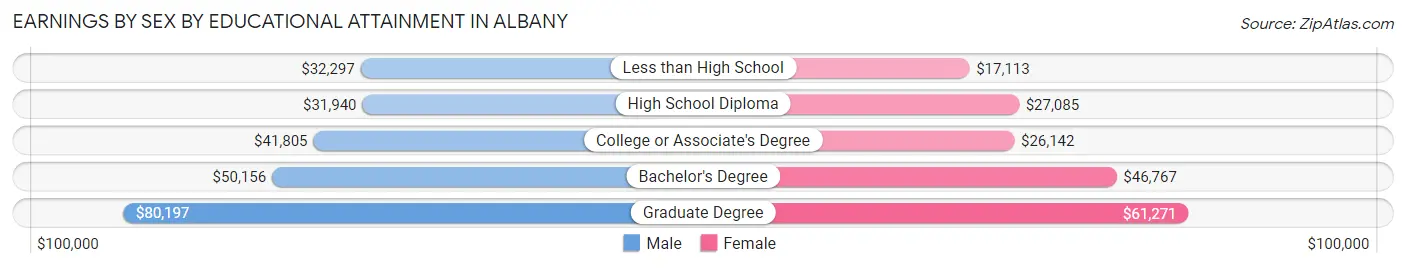
| Educational Attainment | Male Income | Female Income |
| Less than High School | $32,297 | $17,113 |
| High School Diploma | $31,940 | $27,085 |
| College or Associate's Degree | $41,805 | $26,142 |
| Bachelor's Degree | $50,156 | $46,767 |
| Graduate Degree | $80,197 | $61,271 |
| Total | $41,186 | $31,292 |
Family Income in Albany
Family Income Brackets in Albany
According to the Albany family income data, there are 2,819 families falling into the $50,000 to $74,999 income range, which is the most common income bracket and makes up 18.2% of all families. Conversely, the $150,000 to $199,999 income bracket is the least frequent group with only 496 families (3.2%) belonging to this category.
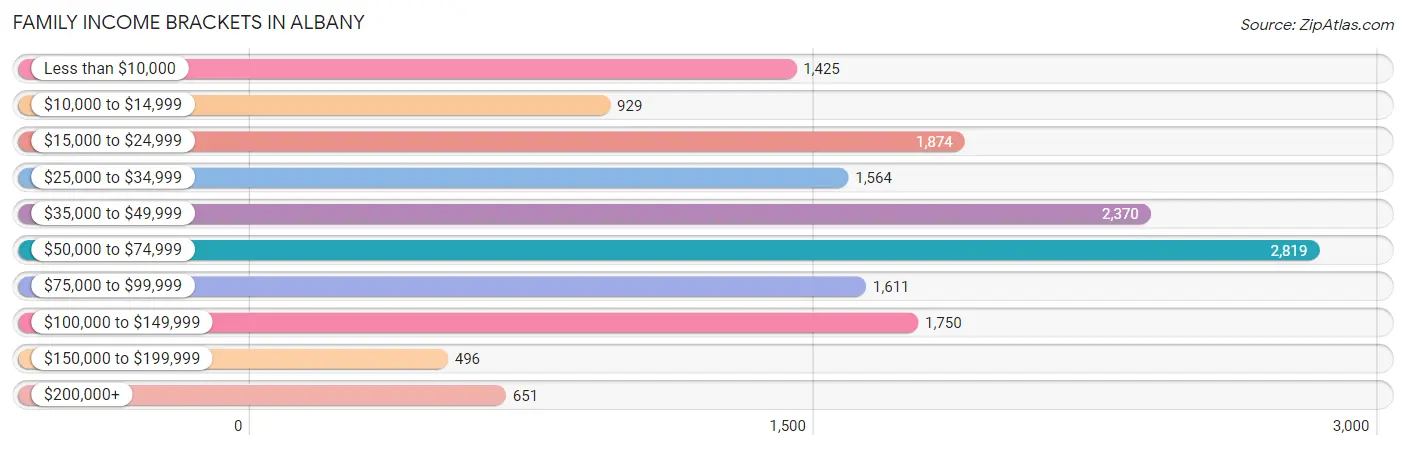
| Income Bracket | # Families | % Families |
| Less than $10,000 | 1,425 | 9.2% |
| $10,000 to $14,999 | 929 | 6.0% |
| $15,000 to $24,999 | 1,874 | 12.1% |
| $25,000 to $34,999 | 1,564 | 10.1% |
| $35,000 to $49,999 | 2,370 | 15.3% |
| $50,000 to $74,999 | 2,819 | 18.2% |
| $75,000 to $99,999 | 1,611 | 10.4% |
| $100,000 to $149,999 | 1,750 | 11.3% |
| $150,000 to $199,999 | 496 | 3.2% |
| $200,000+ | 651 | 4.2% |
Family Income by Famaliy Size in Albany
5-person families (1,057 | 6.8%) account for the highest median family income in Albany with $49,923 per family, while 2-person families (8,014 | 51.7%) have the highest median income of $23,720 per family member.
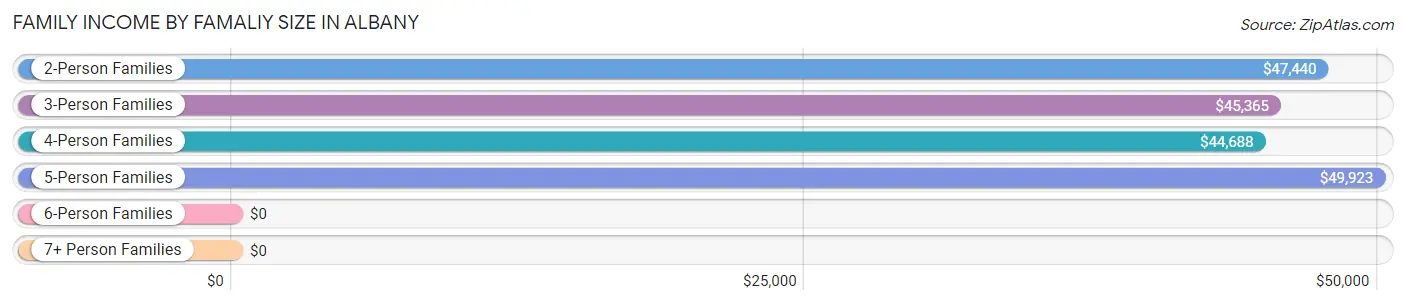
| Income Bracket | # Families | Median Income |
| 2-Person Families | 8,014 (51.7%) | $47,440 |
| 3-Person Families | 3,748 (24.2%) | $45,365 |
| 4-Person Families | 2,110 (13.6%) | $44,688 |
| 5-Person Families | 1,057 (6.8%) | $49,923 |
| 6-Person Families | 390 (2.5%) | $0 |
| 7+ Person Families | 170 (1.1%) | $0 |
| Total | 15,489 (100.0%) | $47,032 |
Family Income by Number of Earners in Albany
The median family income in Albany is $47,032, with families comprising 3+ earners (841) having the highest median family income of $91,641, while families with no earners (3,165) have the lowest median family income of $23,467, accounting for 5.4% and 20.4% of families, respectively.
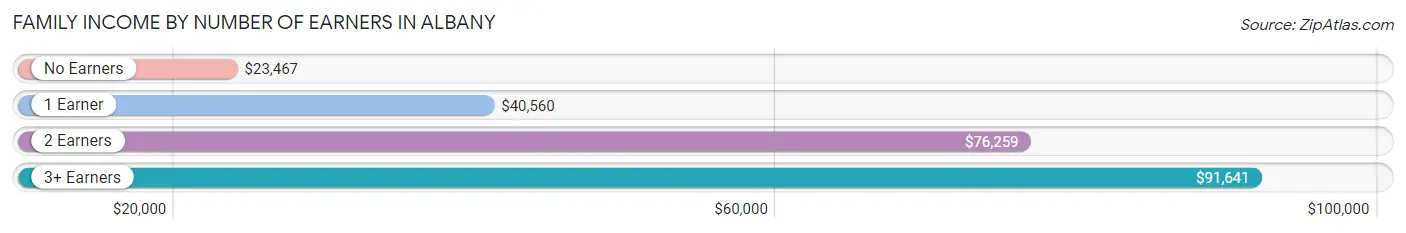
| Number of Earners | # Families | Median Income |
| No Earners | 3,165 (20.4%) | $23,467 |
| 1 Earner | 7,061 (45.6%) | $40,560 |
| 2 Earners | 4,422 (28.5%) | $76,259 |
| 3+ Earners | 841 (5.4%) | $91,641 |
| Total | 15,489 (100.0%) | $47,032 |
Household Income in Albany
Household Income Brackets in Albany
With 4,821 households falling in the category, the $50,000 to $74,999 income range is the most frequent in Albany, accounting for 17.4% of all households. In contrast, only 693 households (2.5%) fall into the $200,000+ income bracket, making it the least populous group.
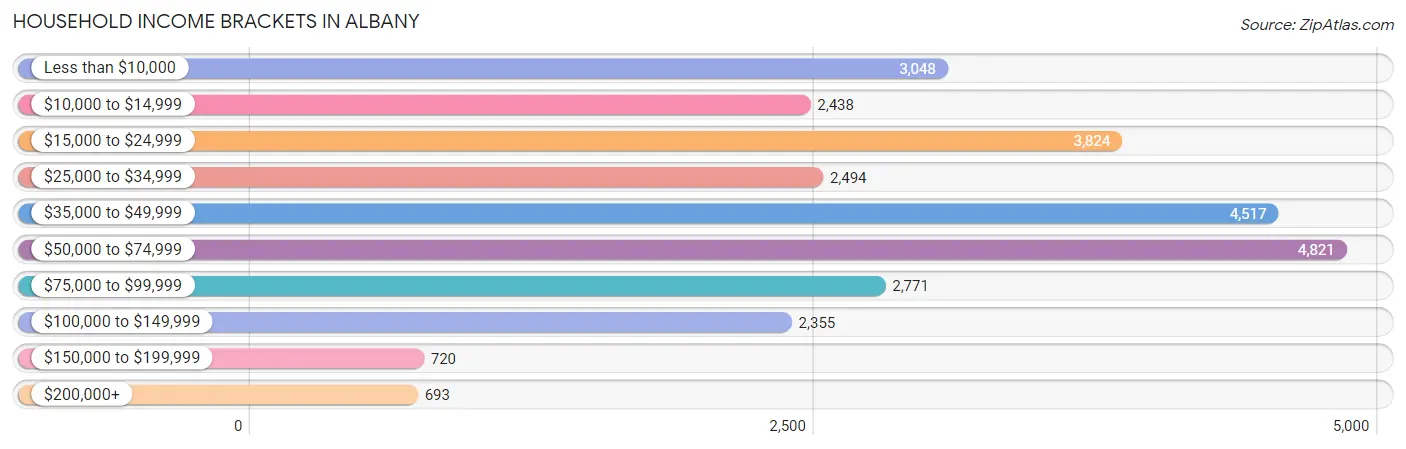
| Income Bracket | # Households | % Households |
| Less than $10,000 | 3,048 | 11.0% |
| $10,000 to $14,999 | 2,438 | 8.8% |
| $15,000 to $24,999 | 3,824 | 13.8% |
| $25,000 to $34,999 | 2,494 | 9.0% |
| $35,000 to $49,999 | 4,517 | 16.3% |
| $50,000 to $74,999 | 4,821 | 17.4% |
| $75,000 to $99,999 | 2,771 | 10.0% |
| $100,000 to $149,999 | 2,355 | 8.5% |
| $150,000 to $199,999 | 720 | 2.6% |
| $200,000+ | 693 | 2.5% |
Household Income by Householder Age in Albany
The median household income in Albany is $43,724, with the highest median household income of $46,646 found in the 45 to 64 years age bracket for the primary householder. A total of 9,670 households (34.9%) fall into this category. Meanwhile, the 15 to 24 years age bracket for the primary householder has the lowest median household income of $23,750, with 1,609 households (5.8%) in this group.
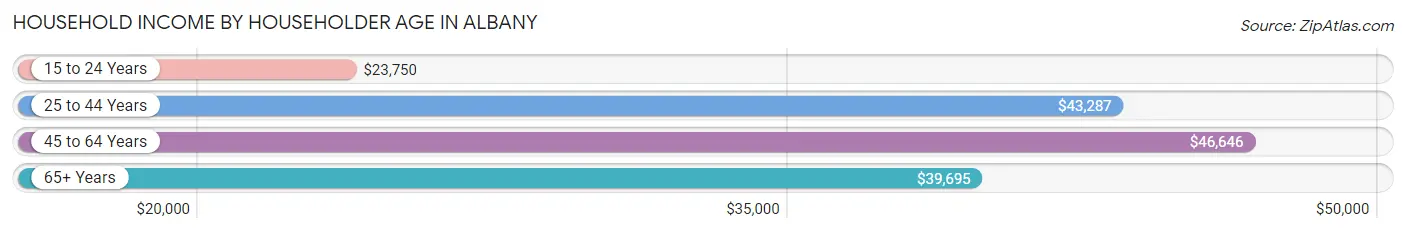
| Income Bracket | # Households | Median Income |
| 15 to 24 Years | 1,609 (5.8%) | $23,750 |
| 25 to 44 Years | 9,394 (33.9%) | $43,287 |
| 45 to 64 Years | 9,670 (34.9%) | $46,646 |
| 65+ Years | 7,036 (25.4%) | $39,695 |
| Total | 27,709 (100.0%) | $43,724 |
Poverty in Albany
Income Below Poverty by Sex and Age in Albany
With 28.4% poverty level for males and 30.5% for females among the residents of Albany, under 5 year old males and 5 year old females are the most vulnerable to poverty, with 1,163 males (51.1%) and 232 females (56.6%) in their respective age groups living below the poverty level.
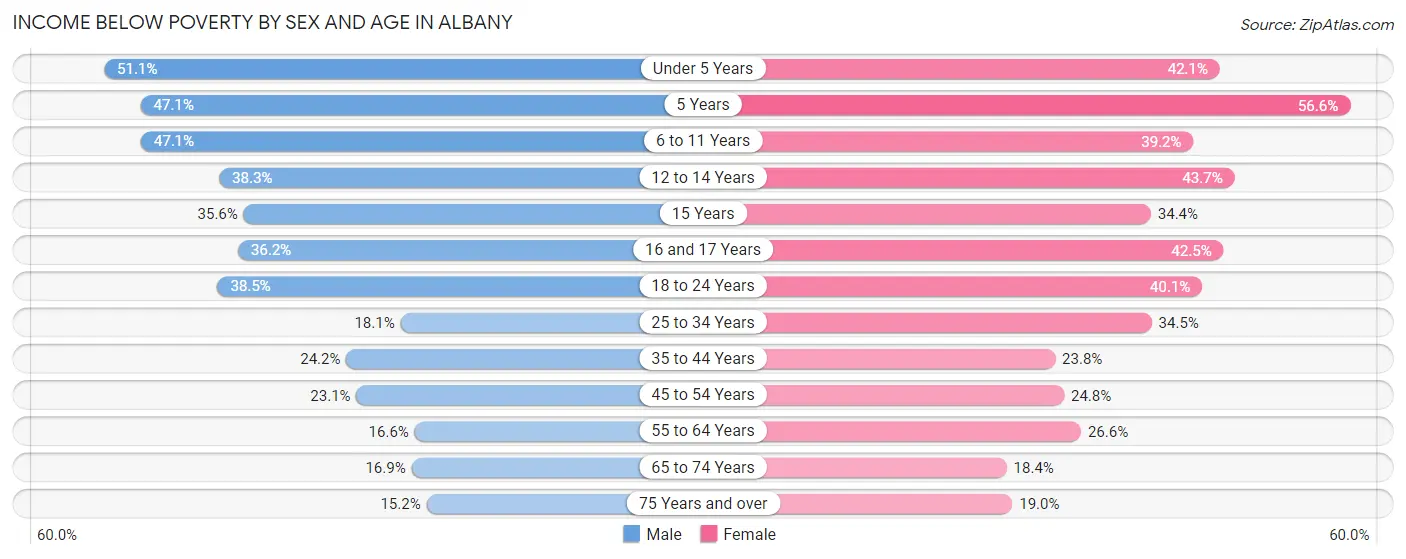
| Age Bracket | Male | Female |
| Under 5 Years | 1,163 (51.1%) | 984 (42.1%) |
| 5 Years | 186 (47.1%) | 232 (56.6%) |
| 6 to 11 Years | 1,373 (47.0%) | 1,260 (39.2%) |
| 12 to 14 Years | 547 (38.3%) | 541 (43.7%) |
| 15 Years | 125 (35.6%) | 169 (34.4%) |
| 16 and 17 Years | 333 (36.2%) | 287 (42.5%) |
| 18 to 24 Years | 1,114 (38.5%) | 1,259 (40.1%) |
| 25 to 34 Years | 763 (18.1%) | 1,818 (34.5%) |
| 35 to 44 Years | 860 (24.2%) | 990 (23.8%) |
| 45 to 54 Years | 716 (23.1%) | 1,030 (24.7%) |
| 55 to 64 Years | 582 (16.6%) | 1,208 (26.6%) |
| 65 to 74 Years | 467 (16.9%) | 649 (18.4%) |
| 75 Years and over | 213 (15.2%) | 503 (19.0%) |
| Total | 8,442 (28.4%) | 10,930 (30.5%) |
Income Above Poverty by Sex and Age in Albany
According to the poverty statistics in Albany, males aged 75 years and over and females aged 65 to 74 years are the age groups that are most secure financially, with 84.8% of males and 81.6% of females in these age groups living above the poverty line.
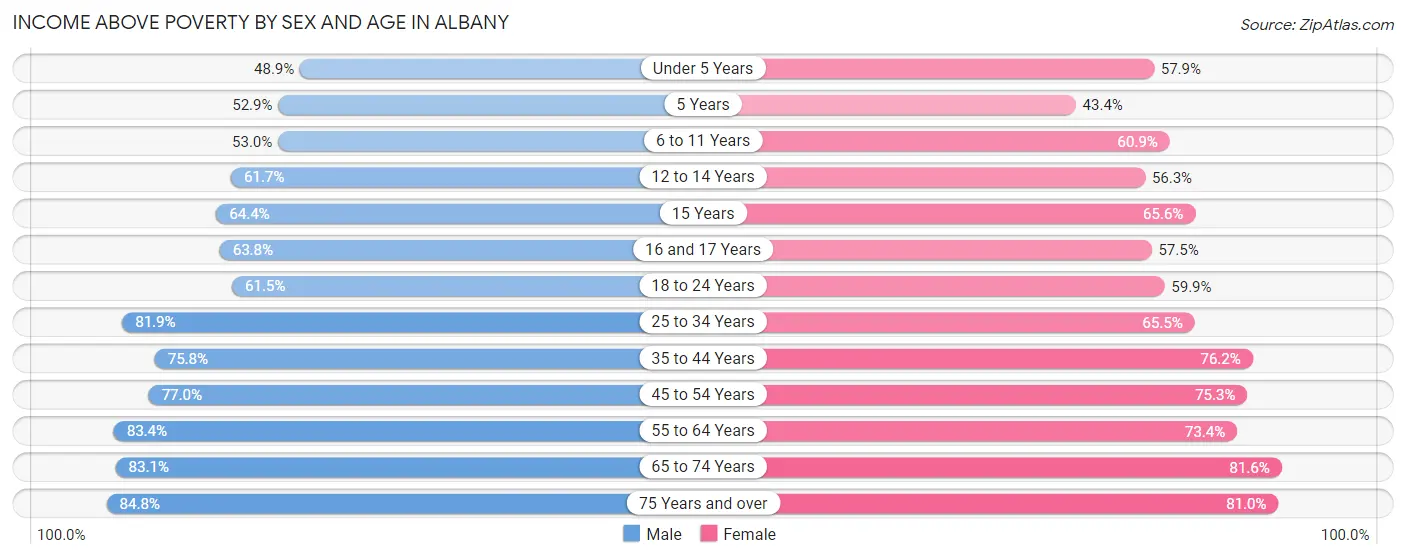
| Age Bracket | Male | Female |
| Under 5 Years | 1,111 (48.9%) | 1,354 (57.9%) |
| 5 Years | 209 (52.9%) | 178 (43.4%) |
| 6 to 11 Years | 1,545 (52.9%) | 1,958 (60.9%) |
| 12 to 14 Years | 880 (61.7%) | 696 (56.3%) |
| 15 Years | 226 (64.4%) | 322 (65.6%) |
| 16 and 17 Years | 586 (63.8%) | 388 (57.5%) |
| 18 to 24 Years | 1,778 (61.5%) | 1,878 (59.9%) |
| 25 to 34 Years | 3,443 (81.9%) | 3,450 (65.5%) |
| 35 to 44 Years | 2,698 (75.8%) | 3,177 (76.2%) |
| 45 to 54 Years | 2,390 (76.9%) | 3,131 (75.2%) |
| 55 to 64 Years | 2,933 (83.4%) | 3,326 (73.4%) |
| 65 to 74 Years | 2,295 (83.1%) | 2,885 (81.6%) |
| 75 Years and over | 1,185 (84.8%) | 2,146 (81.0%) |
| Total | 21,279 (71.6%) | 24,889 (69.5%) |
Income Below Poverty Among Married-Couple Families in Albany
The poverty statistics for married-couple families in Albany show that 9.1% or 607 of the total 6,659 families live below the poverty line. Families with 3 or 4 children have the highest poverty rate of 33.0%, comprising of 191 families. On the other hand, families with 5 or more children have the lowest poverty rate of 0.0%, which includes 0 families.
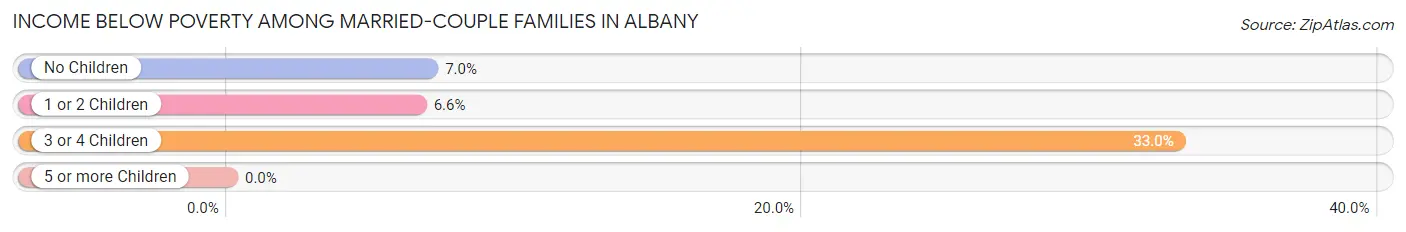
| Children | Above Poverty | Below Poverty |
| No Children | 4,112 (93.0%) | 308 (7.0%) |
| 1 or 2 Children | 1,535 (93.4%) | 108 (6.6%) |
| 3 or 4 Children | 388 (67.0%) | 191 (33.0%) |
| 5 or more Children | 17 (100.0%) | 0 (0.0%) |
| Total | 6,052 (90.9%) | 607 (9.1%) |
Income Below Poverty Among Single-Parent Households in Albany
According to the poverty data in Albany, 31.7% or 464 single-father households and 36.7% or 2,703 single-mother households are living below the poverty line. Among single-father households, those with 5 or more children have the highest poverty rate, with 14 households (100.0%) experiencing poverty. Likewise, among single-mother households, those with 3 or 4 children have the highest poverty rate, with 655 households (84.0%) falling below the poverty line.
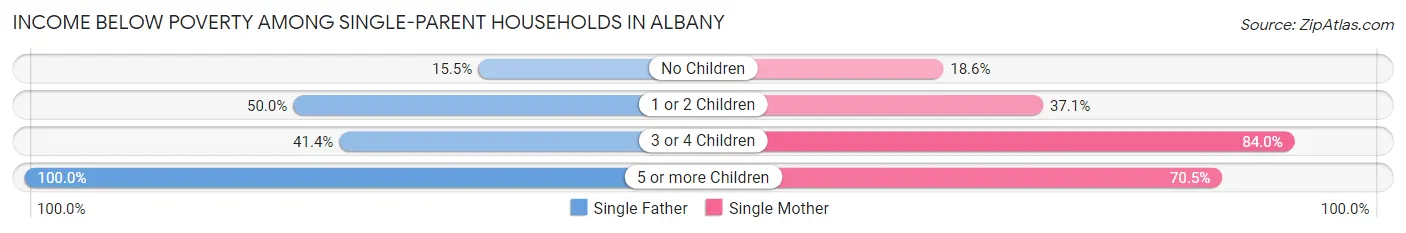
| Children | Single Father | Single Mother |
| No Children | 119 (15.5%) | 418 (18.6%) |
| 1 or 2 Children | 278 (50.0%) | 1,587 (37.1%) |
| 3 or 4 Children | 53 (41.4%) | 655 (84.0%) |
| 5 or more Children | 14 (100.0%) | 43 (70.5%) |
| Total | 464 (31.7%) | 2,703 (36.7%) |
Income Below Poverty Among Married-Couple vs Single-Parent Households in Albany
The poverty data for Albany shows that 607 of the married-couple family households (9.1%) and 3,167 of the single-parent households (35.9%) are living below the poverty level. Within the married-couple family households, those with 3 or 4 children have the highest poverty rate, with 191 households (33.0%) falling below the poverty line. Among the single-parent households, those with 3 or 4 children have the highest poverty rate, with 708 household (78.0%) living below poverty.
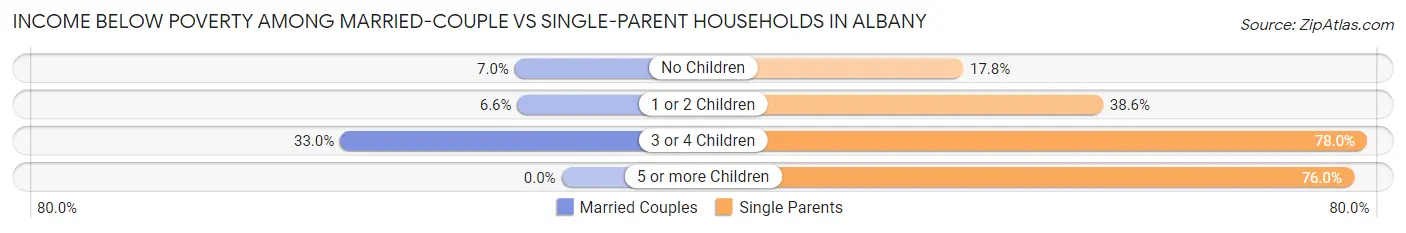
| Children | Married-Couple Families | Single-Parent Households |
| No Children | 308 (7.0%) | 537 (17.8%) |
| 1 or 2 Children | 108 (6.6%) | 1,865 (38.6%) |
| 3 or 4 Children | 191 (33.0%) | 708 (78.0%) |
| 5 or more Children | 0 (0.0%) | 57 (76.0%) |
| Total | 607 (9.1%) | 3,167 (35.9%) |
Employment Characteristics in Albany
Employment by Class of Employer in Albany
Among the 26,137 employed individuals in Albany, private company employees (16,821 | 64.4%), not-for-profit organizations (2,487 | 9.5%), and local government employees (2,040 | 7.8%) make up the most common classes of employment.
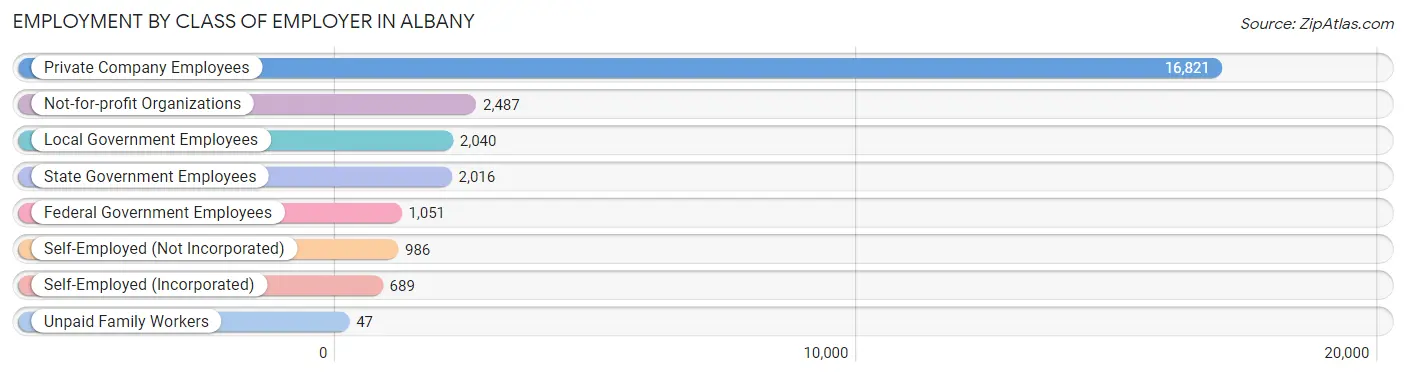
| Employer Class | # Employees | % Employees |
| Private Company Employees | 16,821 | 64.4% |
| Self-Employed (Incorporated) | 689 | 2.6% |
| Self-Employed (Not Incorporated) | 986 | 3.8% |
| Not-for-profit Organizations | 2,487 | 9.5% |
| Local Government Employees | 2,040 | 7.8% |
| State Government Employees | 2,016 | 7.7% |
| Federal Government Employees | 1,051 | 4.0% |
| Unpaid Family Workers | 47 | 0.2% |
| Total | 26,137 | 100.0% |
Employment Status by Age in Albany
According to the labor force statistics for Albany, out of the total population over 16 years of age (53,768), 55.7% or 29,949 individuals are in the labor force, with 10.3% or 3,085 of them unemployed. The age group with the highest labor force participation rate is 35 to 44 years, with 80.1% or 6,369 individuals in the labor force. Within the labor force, the 16 to 19 years age range has the highest percentage of unemployed individuals, with 38.8% or 485 of them being unemployed.
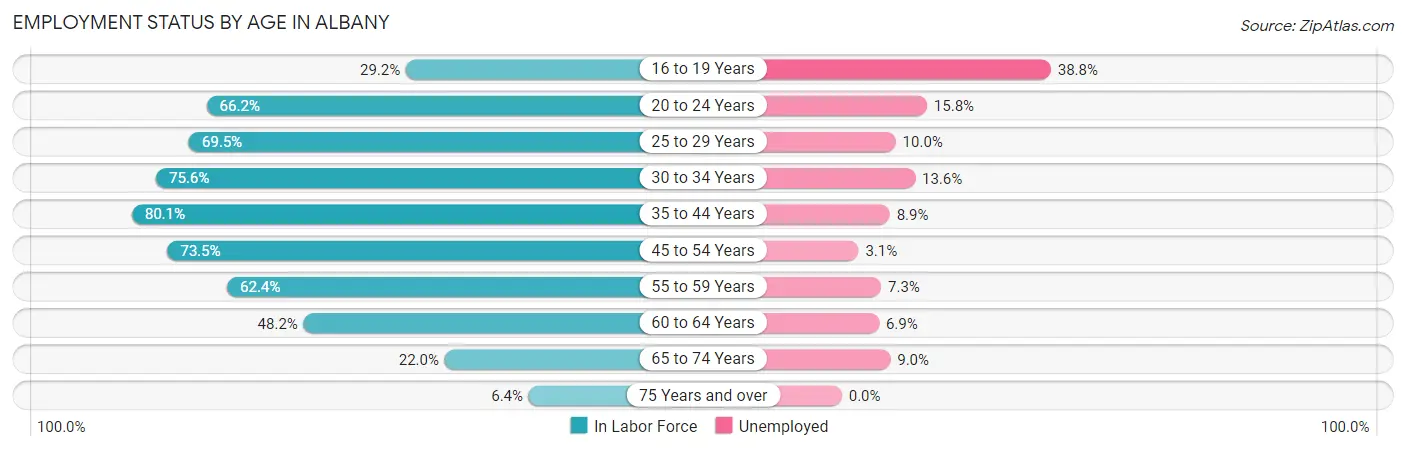
| Age Bracket | In Labor Force | Unemployed |
| 16 to 19 Years | 1,251 (29.2%) | 485 (38.8%) |
| 20 to 24 Years | 3,611 (66.2%) | 571 (15.8%) |
| 25 to 29 Years | 3,491 (69.5%) | 349 (10.0%) |
| 30 to 34 Years | 3,681 (75.6%) | 501 (13.6%) |
| 35 to 44 Years | 6,369 (80.1%) | 567 (8.9%) |
| 45 to 54 Years | 5,407 (73.5%) | 168 (3.1%) |
| 55 to 59 Years | 2,396 (62.4%) | 175 (7.3%) |
| 60 to 64 Years | 2,077 (48.2%) | 143 (6.9%) |
| 65 to 74 Years | 1,408 (22.0%) | 127 (9.0%) |
| 75 Years and over | 274 (6.4%) | 0 (0.0%) |
| Total | 29,949 (55.7%) | 3,085 (10.3%) |
Employment Status by Educational Attainment in Albany
According to labor force statistics for Albany, 70.2% of individuals (23,411) out of the total population between 25 and 64 years of age (33,349) are in the labor force, with 8.2% or 1,920 of them being unemployed. The group with the highest labor force participation rate are those with the educational attainment of bachelor's degree or higher, with 84.6% or 6,095 individuals in the labor force. Within the labor force, individuals with less than high school education have the highest percentage of unemployment, with 23.9% or 480 of them being unemployed.
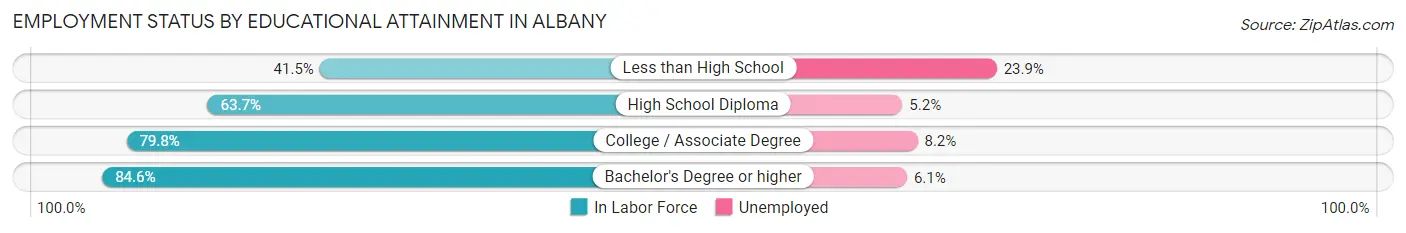
| Educational Attainment | In Labor Force | Unemployed |
| Less than High School | 2,010 (41.5%) | 1,157 (23.9%) |
| High School Diploma | 6,638 (63.7%) | 542 (5.2%) |
| College / Associate Degree | 8,682 (79.8%) | 892 (8.2%) |
| Bachelor's Degree or higher | 6,095 (84.6%) | 440 (6.1%) |
| Total | 23,411 (70.2%) | 2,735 (8.2%) |
Employment Occupations by Sex in Albany
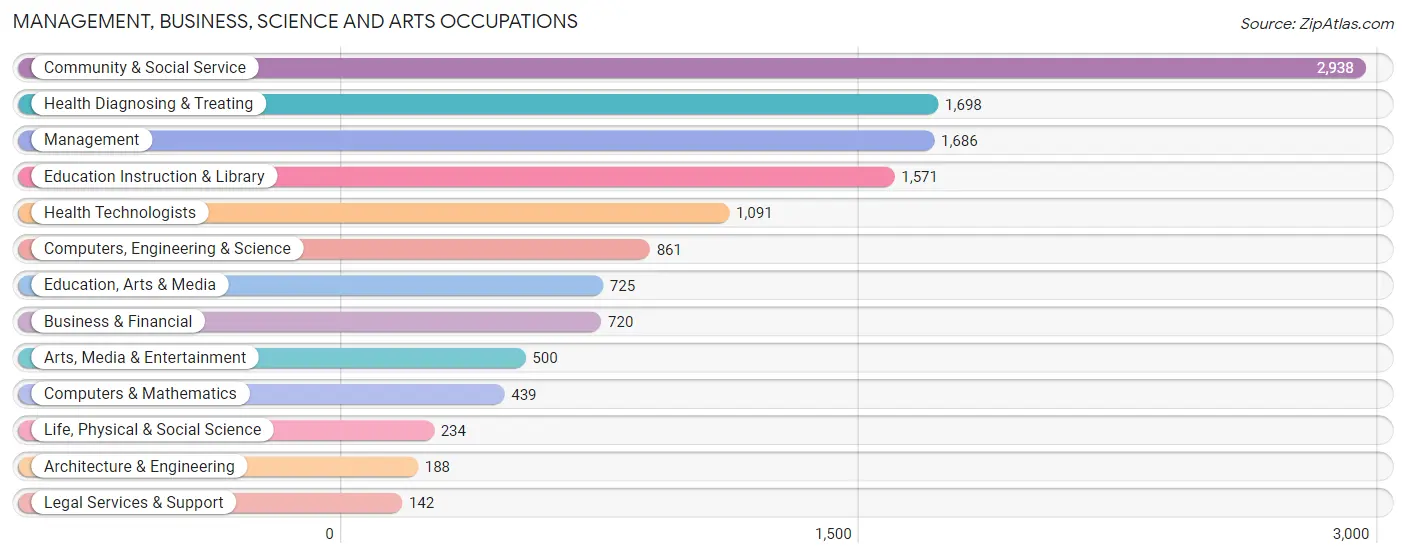
Management, Business, Science and Arts Occupations
The most common Management, Business, Science and Arts occupations in Albany are Community & Social Service (2,938 | 11.0%), Health Diagnosing & Treating (1,698 | 6.4%), Management (1,686 | 6.3%), Education Instruction & Library (1,571 | 5.9%), and Health Technologists (1,091 | 4.1%).
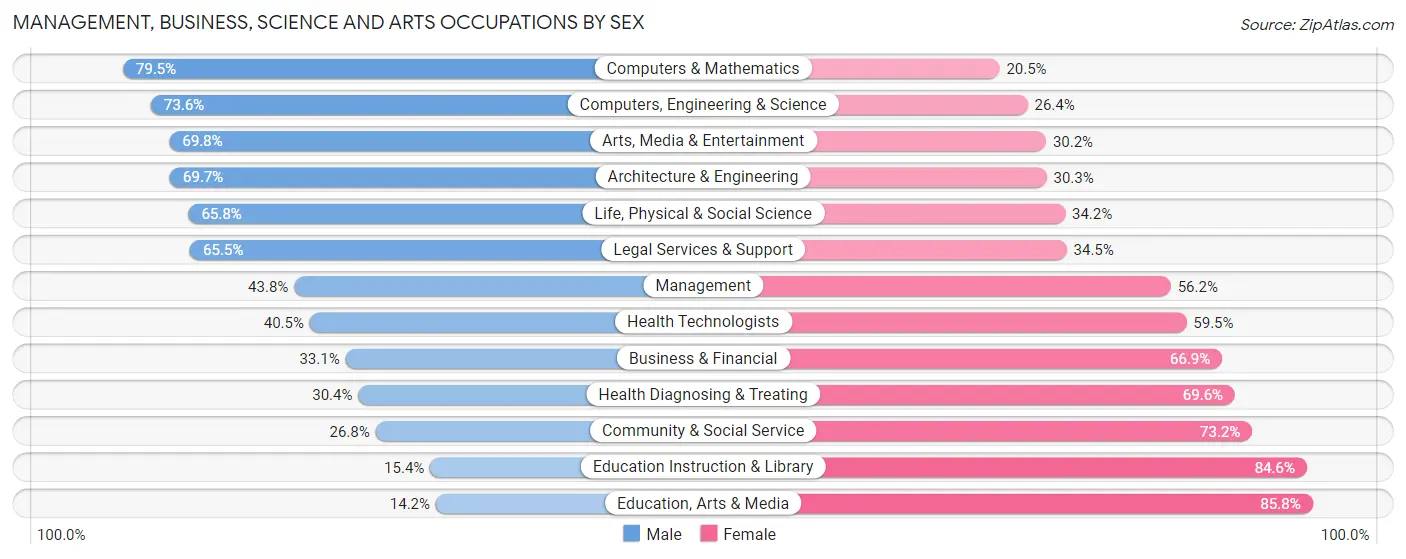
Management, Business, Science and Arts Occupations by Sex
Within the Management, Business, Science and Arts occupations in Albany, the most male-oriented occupations are Computers & Mathematics (79.5%), Computers, Engineering & Science (73.6%), and Arts, Media & Entertainment (69.8%), while the most female-oriented occupations are Education, Arts & Media (85.8%), Education Instruction & Library (84.6%), and Community & Social Service (73.2%).
| Occupation | Male | Female |
| Management | 738 (43.8%) | 948 (56.2%) |
| Business & Financial | 238 (33.1%) | 482 (66.9%) |
| Computers, Engineering & Science | 634 (73.6%) | 227 (26.4%) |
| Computers & Mathematics | 349 (79.5%) | 90 (20.5%) |
| Architecture & Engineering | 131 (69.7%) | 57 (30.3%) |
| Life, Physical & Social Science | 154 (65.8%) | 80 (34.2%) |
| Community & Social Service | 787 (26.8%) | 2,151 (73.2%) |
| Education, Arts & Media | 103 (14.2%) | 622 (85.8%) |
| Legal Services & Support | 93 (65.5%) | 49 (34.5%) |
| Education Instruction & Library | 242 (15.4%) | 1,329 (84.6%) |
| Arts, Media & Entertainment | 349 (69.8%) | 151 (30.2%) |
| Health Diagnosing & Treating | 516 (30.4%) | 1,182 (69.6%) |
| Health Technologists | 442 (40.5%) | 649 (59.5%) |
| Total (Category) | 2,913 (36.9%) | 4,990 (63.1%) |
| Total (Overall) | 11,444 (42.8%) | 15,281 (57.2%) |
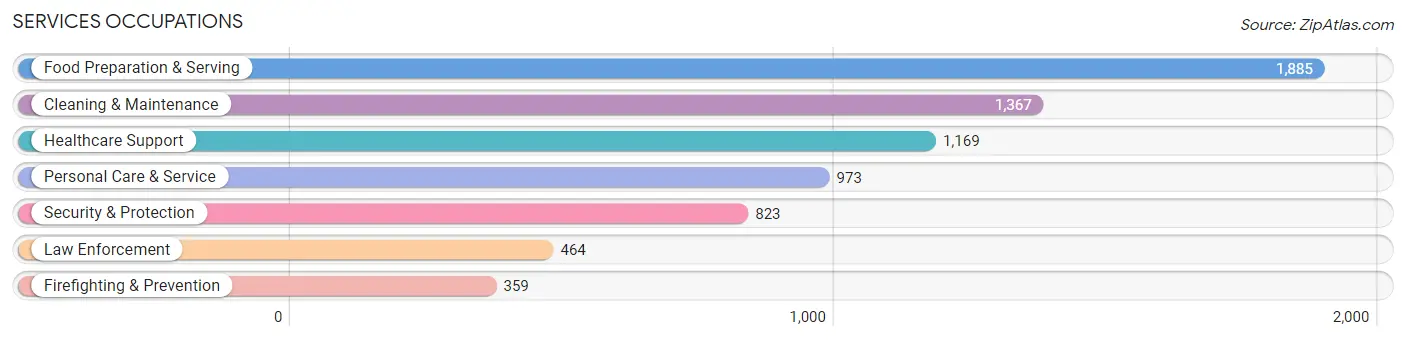
Services Occupations
The most common Services occupations in Albany are Food Preparation & Serving (1,885 | 7.0%), Cleaning & Maintenance (1,367 | 5.1%), Healthcare Support (1,169 | 4.4%), Personal Care & Service (973 | 3.6%), and Security & Protection (823 | 3.1%).
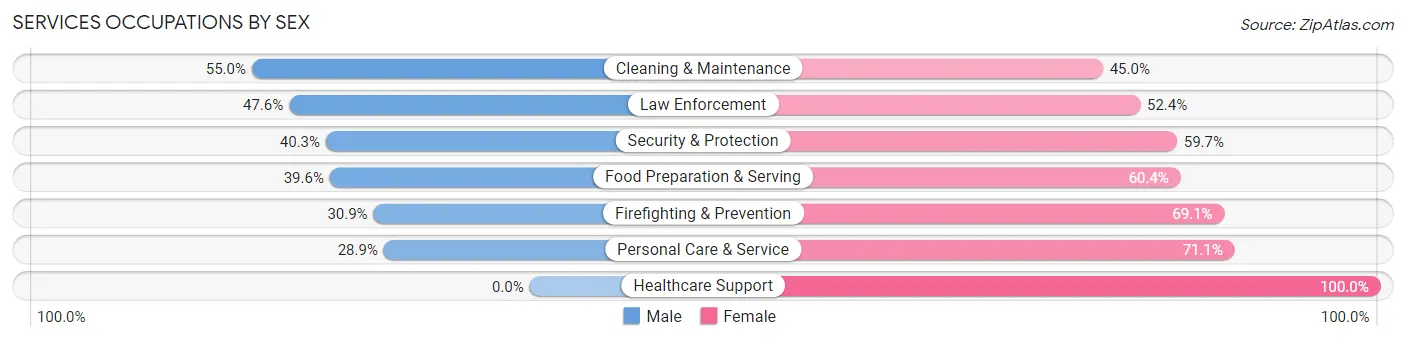
Services Occupations by Sex
Within the Services occupations in Albany, the most male-oriented occupations are Cleaning & Maintenance (55.0%), Law Enforcement (47.6%), and Security & Protection (40.3%), while the most female-oriented occupations are Healthcare Support (100.0%), Personal Care & Service (71.1%), and Firefighting & Prevention (69.1%).
| Occupation | Male | Female |
| Healthcare Support | 0 (0.0%) | 1,169 (100.0%) |
| Security & Protection | 332 (40.3%) | 491 (59.7%) |
| Firefighting & Prevention | 111 (30.9%) | 248 (69.1%) |
| Law Enforcement | 221 (47.6%) | 243 (52.4%) |
| Food Preparation & Serving | 746 (39.6%) | 1,139 (60.4%) |
| Cleaning & Maintenance | 752 (55.0%) | 615 (45.0%) |
| Personal Care & Service | 281 (28.9%) | 692 (71.1%) |
| Total (Category) | 2,111 (34.0%) | 4,106 (66.0%) |
| Total (Overall) | 11,444 (42.8%) | 15,281 (57.2%) |
Sales and Office Occupations
The most common Sales and Office occupations in Albany are Office & Administration (3,765 | 14.1%), and Sales & Related (2,519 | 9.4%).
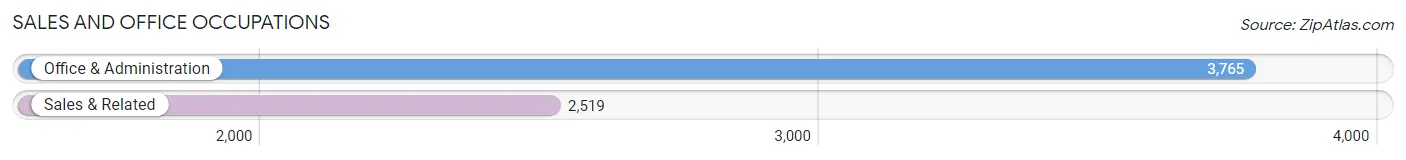
Sales and Office Occupations by Sex
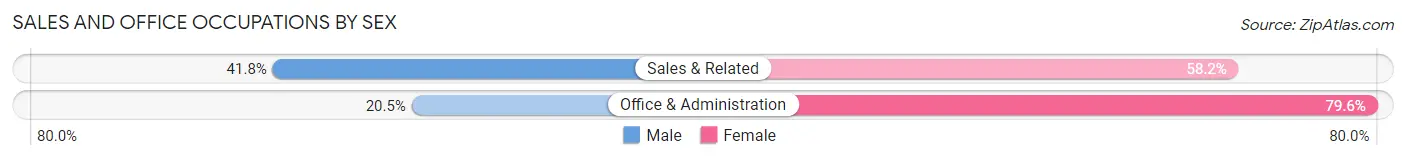
| Occupation | Male | Female |
| Sales & Related | 1,054 (41.8%) | 1,465 (58.2%) |
| Office & Administration | 770 (20.4%) | 2,995 (79.5%) |
| Total (Category) | 1,824 (29.0%) | 4,460 (71.0%) |
| Total (Overall) | 11,444 (42.8%) | 15,281 (57.2%) |
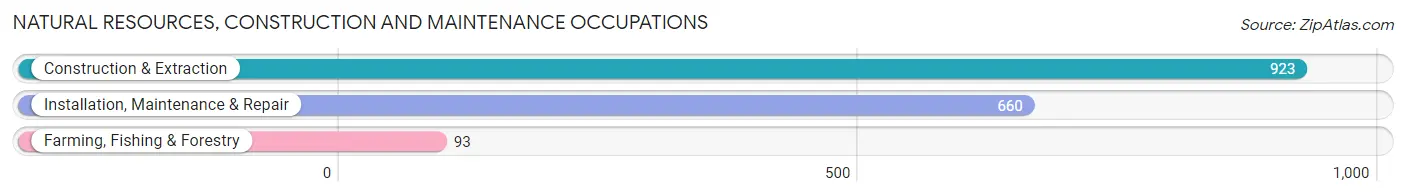
Natural Resources, Construction and Maintenance Occupations
The most common Natural Resources, Construction and Maintenance occupations in Albany are Construction & Extraction (923 | 3.5%), Installation, Maintenance & Repair (660 | 2.5%), and Farming, Fishing & Forestry (93 | 0.4%).
Natural Resources, Construction and Maintenance Occupations by Sex
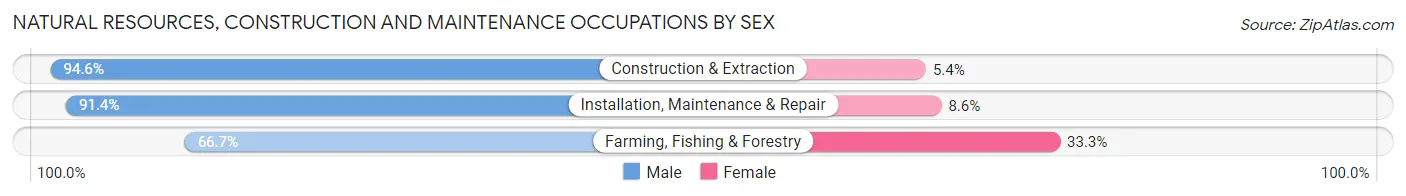
| Occupation | Male | Female |
| Farming, Fishing & Forestry | 62 (66.7%) | 31 (33.3%) |
| Construction & Extraction | 873 (94.6%) | 50 (5.4%) |
| Installation, Maintenance & Repair | 603 (91.4%) | 57 (8.6%) |
| Total (Category) | 1,538 (91.8%) | 138 (8.2%) |
| Total (Overall) | 11,444 (42.8%) | 15,281 (57.2%) |
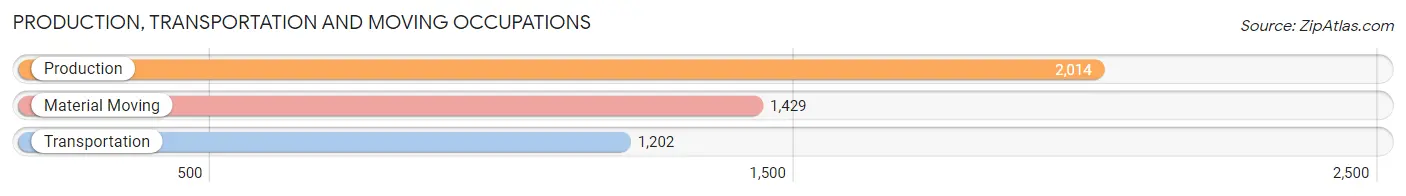
Production, Transportation and Moving Occupations
The most common Production, Transportation and Moving occupations in Albany are Production (2,014 | 7.5%), Material Moving (1,429 | 5.3%), and Transportation (1,202 | 4.5%).
Production, Transportation and Moving Occupations by Sex
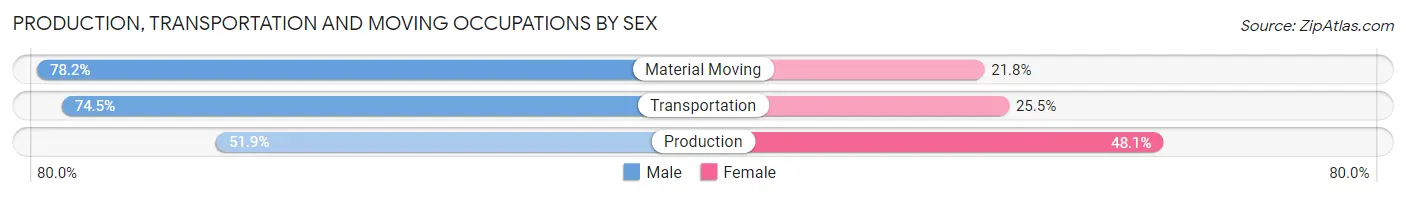
| Occupation | Male | Female |
| Production | 1,045 (51.9%) | 969 (48.1%) |
| Transportation | 896 (74.5%) | 306 (25.5%) |
| Material Moving | 1,117 (78.2%) | 312 (21.8%) |
| Total (Category) | 3,058 (65.8%) | 1,587 (34.2%) |
| Total (Overall) | 11,444 (42.8%) | 15,281 (57.2%) |
Employment Industries by Sex in Albany
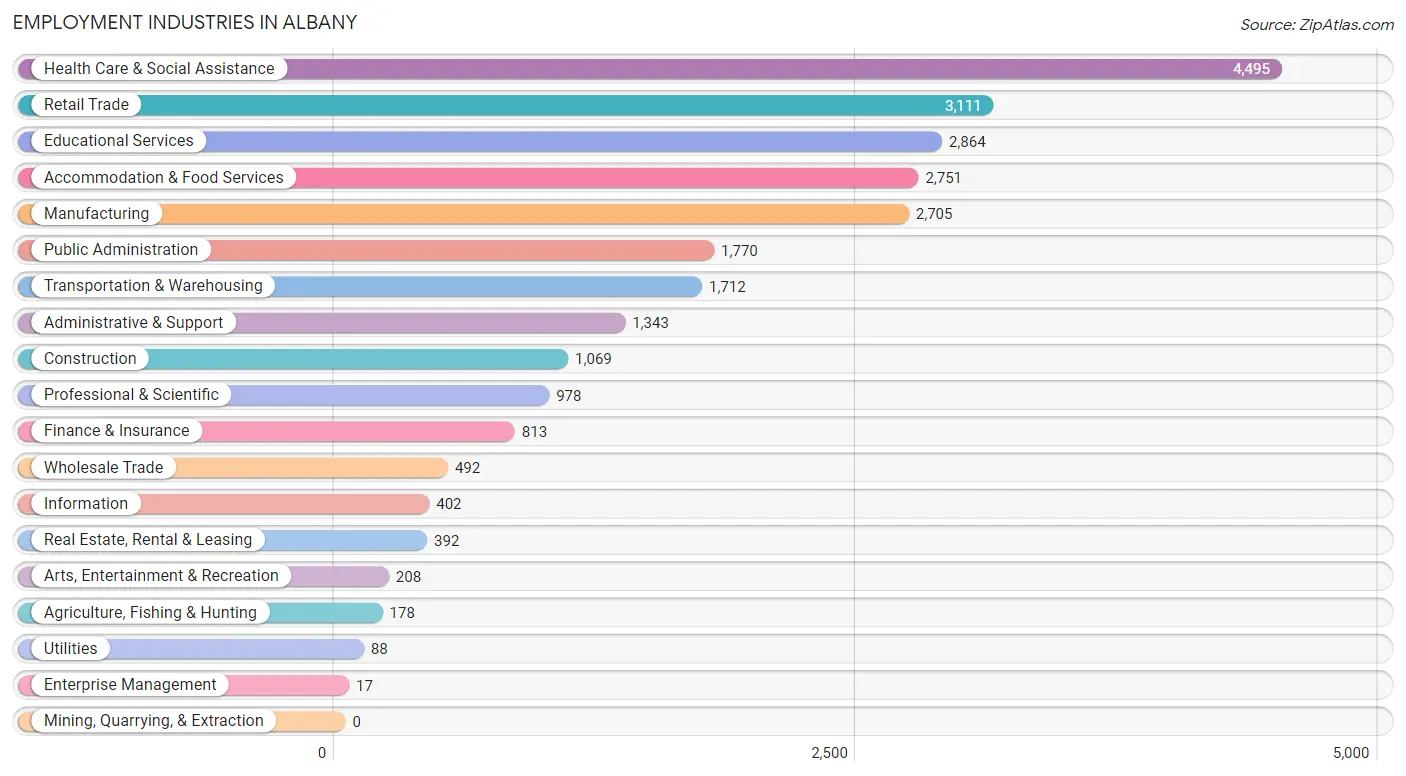
Employment Industries in Albany
The major employment industries in Albany include Health Care & Social Assistance (4,495 | 16.8%), Retail Trade (3,111 | 11.6%), Educational Services (2,864 | 10.7%), Accommodation & Food Services (2,751 | 10.3%), and Manufacturing (2,705 | 10.1%).
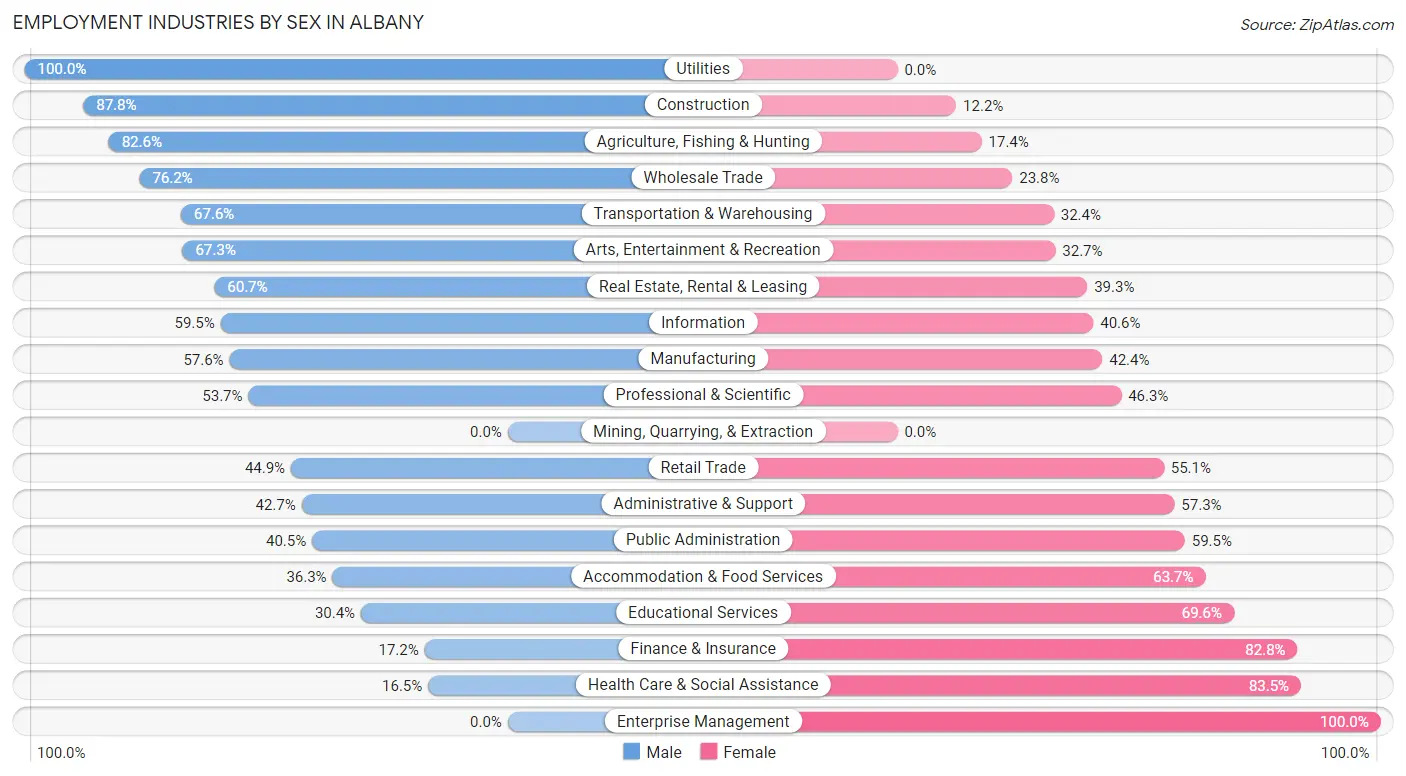
Employment Industries by Sex in Albany
The Albany industries that see more men than women are Utilities (100.0%), Construction (87.8%), and Agriculture, Fishing & Hunting (82.6%), whereas the industries that tend to have a higher number of women are Enterprise Management (100.0%), Health Care & Social Assistance (83.5%), and Finance & Insurance (82.8%).
| Industry | Male | Female |
| Agriculture, Fishing & Hunting | 147 (82.6%) | 31 (17.4%) |
| Mining, Quarrying, & Extraction | 0 (0.0%) | 0 (0.0%) |
| Construction | 939 (87.8%) | 130 (12.2%) |
| Manufacturing | 1,558 (57.6%) | 1,147 (42.4%) |
| Wholesale Trade | 375 (76.2%) | 117 (23.8%) |
| Retail Trade | 1,396 (44.9%) | 1,715 (55.1%) |
| Transportation & Warehousing | 1,158 (67.6%) | 554 (32.4%) |
| Utilities | 88 (100.0%) | 0 (0.0%) |
| Information | 239 (59.5%) | 163 (40.6%) |
| Finance & Insurance | 140 (17.2%) | 673 (82.8%) |
| Real Estate, Rental & Leasing | 238 (60.7%) | 154 (39.3%) |
| Professional & Scientific | 525 (53.7%) | 453 (46.3%) |
| Enterprise Management | 0 (0.0%) | 17 (100.0%) |
| Administrative & Support | 573 (42.7%) | 770 (57.3%) |
| Educational Services | 870 (30.4%) | 1,994 (69.6%) |
| Health Care & Social Assistance | 741 (16.5%) | 3,754 (83.5%) |
| Arts, Entertainment & Recreation | 140 (67.3%) | 68 (32.7%) |
| Accommodation & Food Services | 998 (36.3%) | 1,753 (63.7%) |
| Public Administration | 717 (40.5%) | 1,053 (59.5%) |
| Total | 11,444 (42.8%) | 15,281 (57.2%) |
Education in Albany
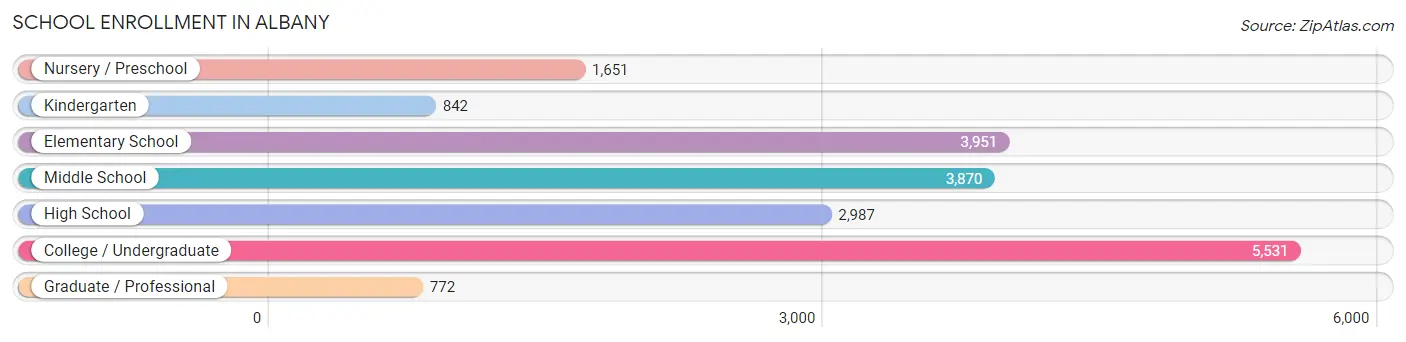
School Enrollment in Albany
The most common levels of schooling among the 19,604 students in Albany are college / undergraduate (5,531 | 28.2%), elementary school (3,951 | 20.2%), and middle school (3,870 | 19.7%).
| School Level | # Students | % Students |
| Nursery / Preschool | 1,651 | 8.4% |
| Kindergarten | 842 | 4.3% |
| Elementary School | 3,951 | 20.2% |
| Middle School | 3,870 | 19.7% |
| High School | 2,987 | 15.2% |
| College / Undergraduate | 5,531 | 28.2% |
| Graduate / Professional | 772 | 3.9% |
| Total | 19,604 | 100.0% |
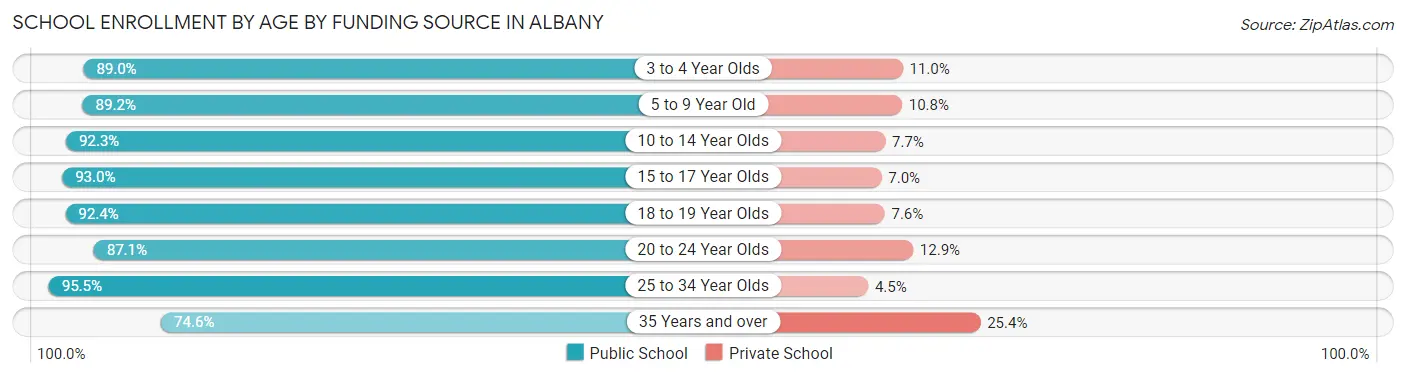
School Enrollment by Age by Funding Source in Albany
Out of a total of 19,604 students who are enrolled in schools in Albany, 2,000 (10.2%) attend a private institution, while the remaining 17,604 (89.8%) are enrolled in public schools. The age group of 35 years and over has the highest likelihood of being enrolled in private schools, with 344 (25.4% in the age bracket) enrolled. Conversely, the age group of 25 to 34 year olds has the lowest likelihood of being enrolled in a private school, with 1,267 (95.5% in the age bracket) attending a public institution.
| Age Bracket | Public School | Private School |
| 3 to 4 Year Olds | 1,169 (89.0%) | 144 (11.0%) |
| 5 to 9 Year Old | 4,029 (89.2%) | 489 (10.8%) |
| 10 to 14 Year Olds | 4,202 (92.3%) | 351 (7.7%) |
| 15 to 17 Year Olds | 2,198 (93.0%) | 166 (7.0%) |
| 18 to 19 Year Olds | 1,711 (92.4%) | 141 (7.6%) |
| 20 to 24 Year Olds | 2,025 (87.1%) | 300 (12.9%) |
| 25 to 34 Year Olds | 1,267 (95.5%) | 60 (4.5%) |
| 35 Years and over | 1,008 (74.6%) | 344 (25.4%) |
| Total | 17,604 (89.8%) | 2,000 (10.2%) |
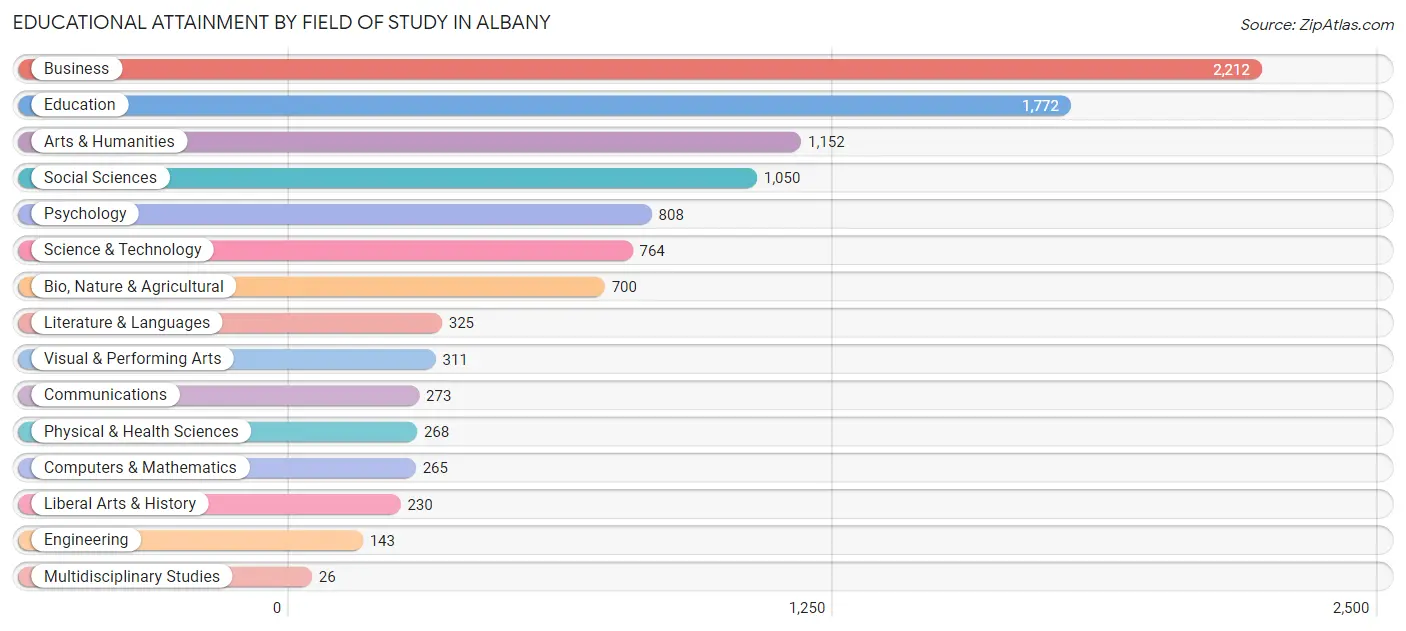
Educational Attainment by Field of Study in Albany
Business (2,212 | 21.5%), education (1,772 | 17.2%), arts & humanities (1,152 | 11.2%), social sciences (1,050 | 10.2%), and psychology (808 | 7.9%) are the most common fields of study among 10,299 individuals in Albany who have obtained a bachelor's degree or higher.
| Field of Study | # Graduates | % Graduates |
| Computers & Mathematics | 265 | 2.6% |
| Bio, Nature & Agricultural | 700 | 6.8% |
| Physical & Health Sciences | 268 | 2.6% |
| Psychology | 808 | 7.9% |
| Social Sciences | 1,050 | 10.2% |
| Engineering | 143 | 1.4% |
| Multidisciplinary Studies | 26 | 0.3% |
| Science & Technology | 764 | 7.4% |
| Business | 2,212 | 21.5% |
| Education | 1,772 | 17.2% |
| Literature & Languages | 325 | 3.2% |
| Liberal Arts & History | 230 | 2.2% |
| Visual & Performing Arts | 311 | 3.0% |
| Communications | 273 | 2.6% |
| Arts & Humanities | 1,152 | 11.2% |
| Total | 10,299 | 100.0% |
Transportation & Commute in Albany
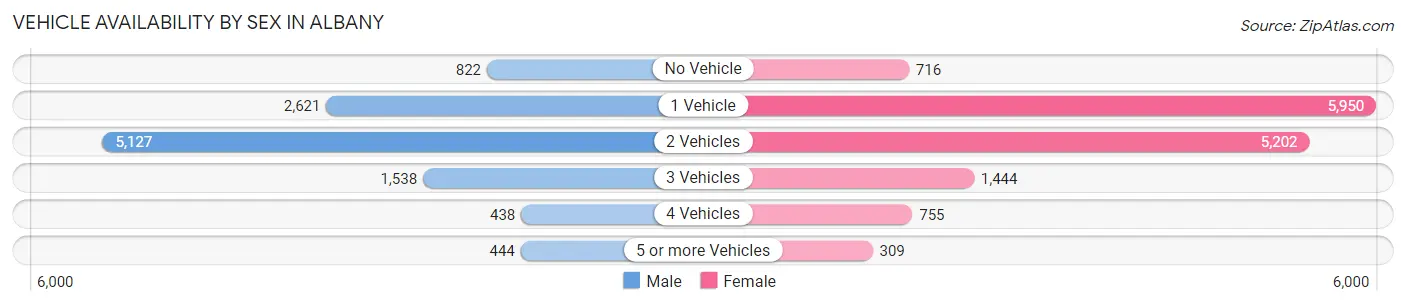
Vehicle Availability by Sex in Albany
The most prevalent vehicle ownership categories in Albany are males with 2 vehicles (5,127, accounting for 46.7%) and females with 2 vehicles (5,202, making up 35.7%).
| Vehicles Available | Male | Female |
| No Vehicle | 822 (7.5%) | 716 (5.0%) |
| 1 Vehicle | 2,621 (23.8%) | 5,950 (41.4%) |
| 2 Vehicles | 5,127 (46.7%) | 5,202 (36.2%) |
| 3 Vehicles | 1,538 (14.0%) | 1,444 (10.0%) |
| 4 Vehicles | 438 (4.0%) | 755 (5.2%) |
| 5 or more Vehicles | 444 (4.0%) | 309 (2.1%) |
| Total | 10,990 (100.0%) | 14,376 (100.0%) |
Commute Time in Albany
The most frequently occuring commute durations in Albany are 10 to 14 minutes (6,149 commuters, 24.8%), 15 to 19 minutes (6,029 commuters, 24.4%), and 20 to 24 minutes (3,261 commuters, 13.2%).
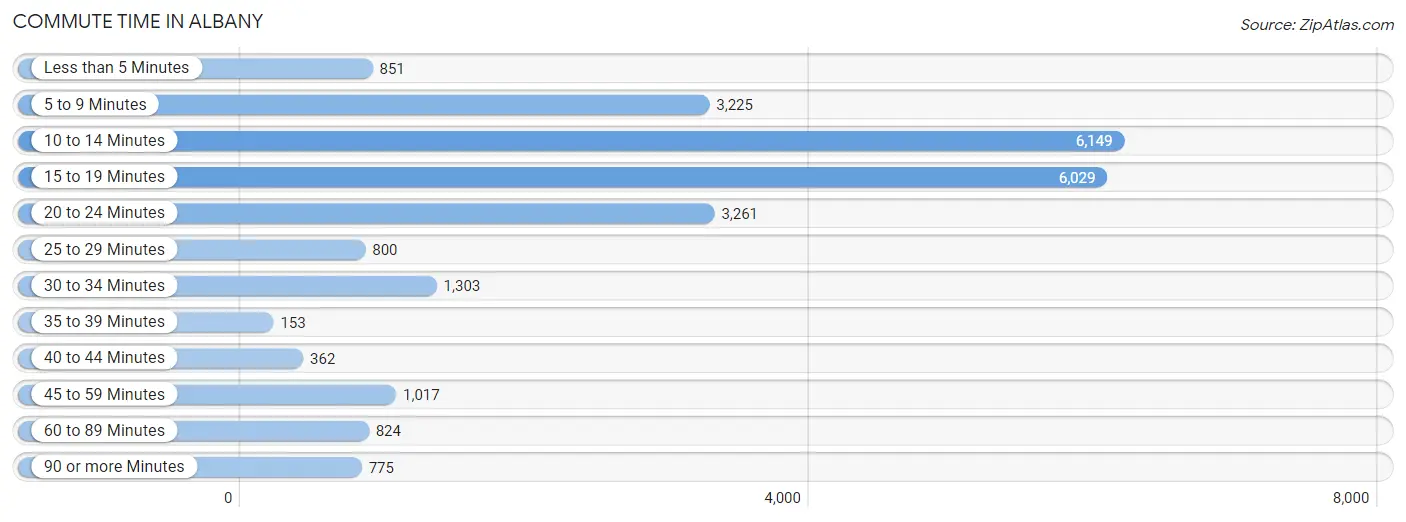
| Commute Time | # Commuters | % Commuters |
| Less than 5 Minutes | 851 | 3.4% |
| 5 to 9 Minutes | 3,225 | 13.0% |
| 10 to 14 Minutes | 6,149 | 24.8% |
| 15 to 19 Minutes | 6,029 | 24.4% |
| 20 to 24 Minutes | 3,261 | 13.2% |
| 25 to 29 Minutes | 800 | 3.2% |
| 30 to 34 Minutes | 1,303 | 5.3% |
| 35 to 39 Minutes | 153 | 0.6% |
| 40 to 44 Minutes | 362 | 1.5% |
| 45 to 59 Minutes | 1,017 | 4.1% |
| 60 to 89 Minutes | 824 | 3.3% |
| 90 or more Minutes | 775 | 3.1% |
Commute Time by Sex in Albany
The most common commute times in Albany are 10 to 14 minutes (2,627 commuters, 24.1%) for males and 10 to 14 minutes (3,522 commuters, 25.4%) for females.
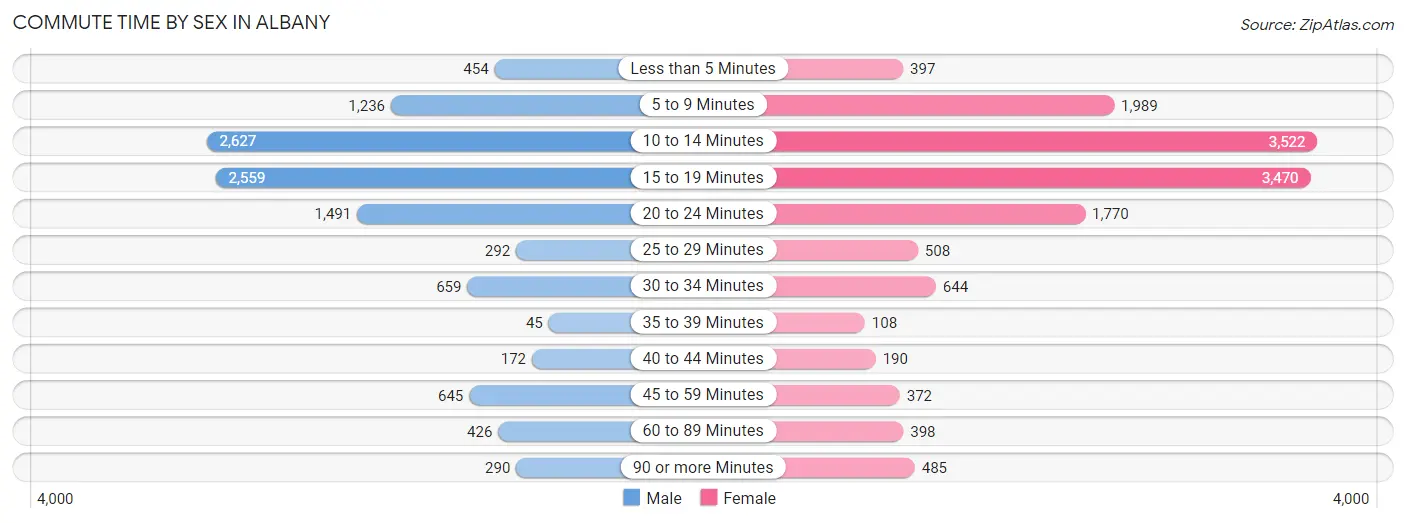
| Commute Time | Male | Female |
| Less than 5 Minutes | 454 (4.2%) | 397 (2.9%) |
| 5 to 9 Minutes | 1,236 (11.3%) | 1,989 (14.4%) |
| 10 to 14 Minutes | 2,627 (24.1%) | 3,522 (25.4%) |
| 15 to 19 Minutes | 2,559 (23.5%) | 3,470 (25.1%) |
| 20 to 24 Minutes | 1,491 (13.7%) | 1,770 (12.8%) |
| 25 to 29 Minutes | 292 (2.7%) | 508 (3.7%) |
| 30 to 34 Minutes | 659 (6.0%) | 644 (4.6%) |
| 35 to 39 Minutes | 45 (0.4%) | 108 (0.8%) |
| 40 to 44 Minutes | 172 (1.6%) | 190 (1.4%) |
| 45 to 59 Minutes | 645 (5.9%) | 372 (2.7%) |
| 60 to 89 Minutes | 426 (3.9%) | 398 (2.9%) |
| 90 or more Minutes | 290 (2.7%) | 485 (3.5%) |
Time of Departure to Work by Sex in Albany
The most frequent times of departure to work in Albany are 6:30 AM to 6:59 AM (1,649, 15.1%) for males and 7:30 AM to 7:59 AM (2,501, 18.0%) for females.
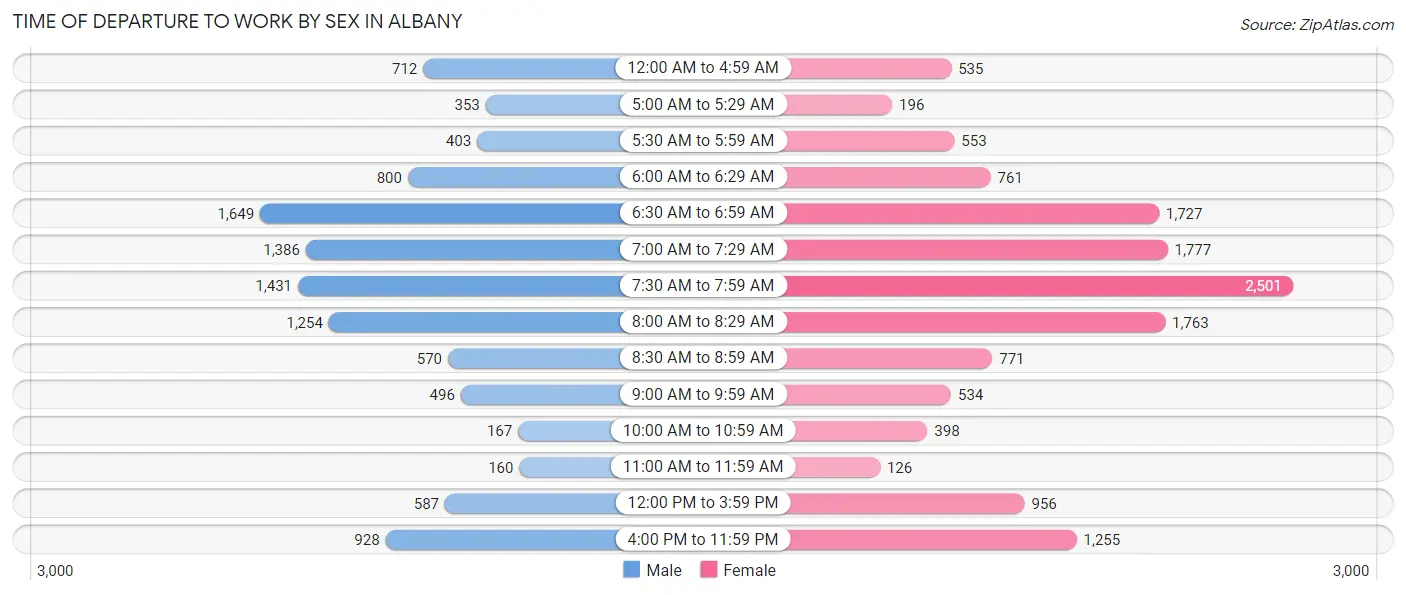
| Time of Departure | Male | Female |
| 12:00 AM to 4:59 AM | 712 (6.5%) | 535 (3.9%) |
| 5:00 AM to 5:29 AM | 353 (3.2%) | 196 (1.4%) |
| 5:30 AM to 5:59 AM | 403 (3.7%) | 553 (4.0%) |
| 6:00 AM to 6:29 AM | 800 (7.3%) | 761 (5.5%) |
| 6:30 AM to 6:59 AM | 1,649 (15.1%) | 1,727 (12.5%) |
| 7:00 AM to 7:29 AM | 1,386 (12.7%) | 1,777 (12.8%) |
| 7:30 AM to 7:59 AM | 1,431 (13.1%) | 2,501 (18.0%) |
| 8:00 AM to 8:29 AM | 1,254 (11.5%) | 1,763 (12.7%) |
| 8:30 AM to 8:59 AM | 570 (5.2%) | 771 (5.6%) |
| 9:00 AM to 9:59 AM | 496 (4.5%) | 534 (3.8%) |
| 10:00 AM to 10:59 AM | 167 (1.5%) | 398 (2.9%) |
| 11:00 AM to 11:59 AM | 160 (1.5%) | 126 (0.9%) |
| 12:00 PM to 3:59 PM | 587 (5.4%) | 956 (6.9%) |
| 4:00 PM to 11:59 PM | 928 (8.5%) | 1,255 (9.1%) |
| Total | 10,896 (100.0%) | 13,853 (100.0%) |
Housing Occupancy in Albany
Occupancy by Ownership in Albany
Of the total 27,709 dwellings in Albany, owner-occupied units account for 11,144 (40.2%), while renter-occupied units make up 16,565 (59.8%).
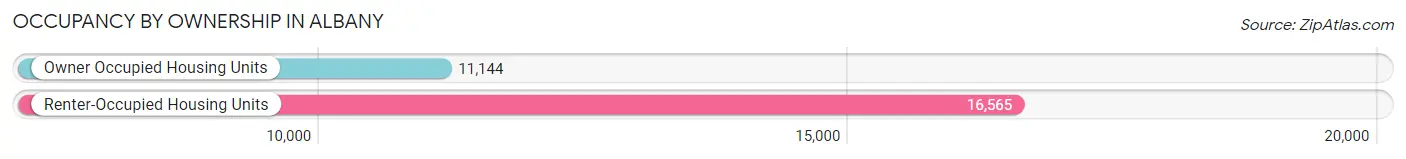
| Occupancy | # Housing Units | % Housing Units |
| Owner Occupied Housing Units | 11,144 | 40.2% |
| Renter-Occupied Housing Units | 16,565 | 59.8% |
| Total Occupied Housing Units | 27,709 | 100.0% |
Occupancy by Household Size in Albany
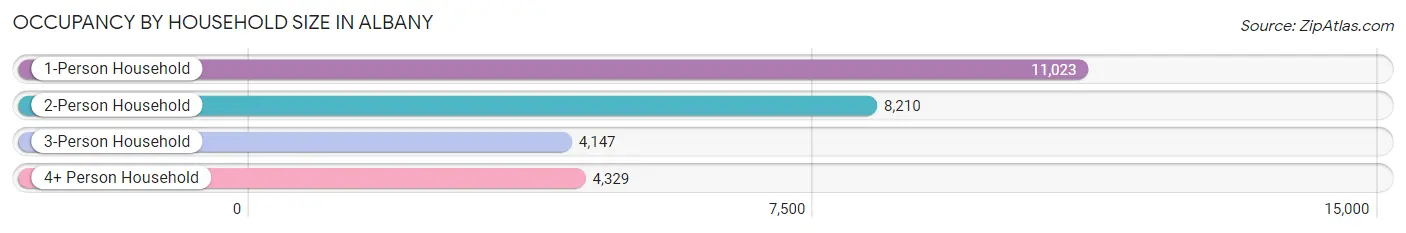
| Household Size | # Housing Units | % Housing Units |
| 1-Person Household | 11,023 | 39.8% |
| 2-Person Household | 8,210 | 29.6% |
| 3-Person Household | 4,147 | 15.0% |
| 4+ Person Household | 4,329 | 15.6% |
| Total Housing Units | 27,709 | 100.0% |
Occupancy by Ownership by Household Size in Albany
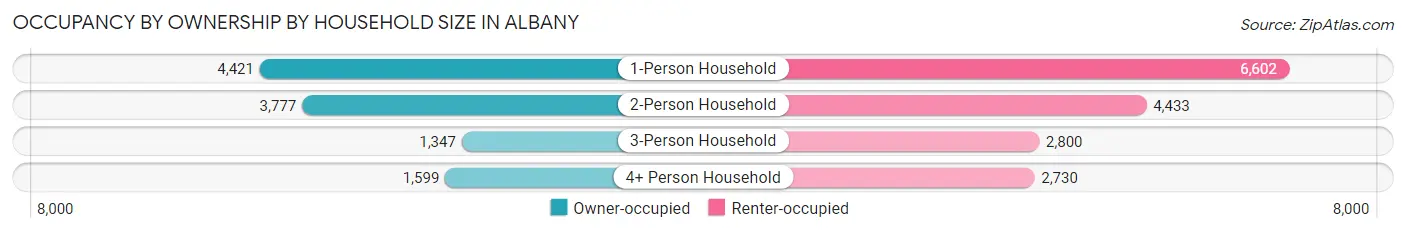
| Household Size | Owner-occupied | Renter-occupied |
| 1-Person Household | 4,421 (40.1%) | 6,602 (59.9%) |
| 2-Person Household | 3,777 (46.0%) | 4,433 (54.0%) |
| 3-Person Household | 1,347 (32.5%) | 2,800 (67.5%) |
| 4+ Person Household | 1,599 (36.9%) | 2,730 (63.1%) |
| Total Housing Units | 11,144 (40.2%) | 16,565 (59.8%) |
Occupancy by Educational Attainment in Albany
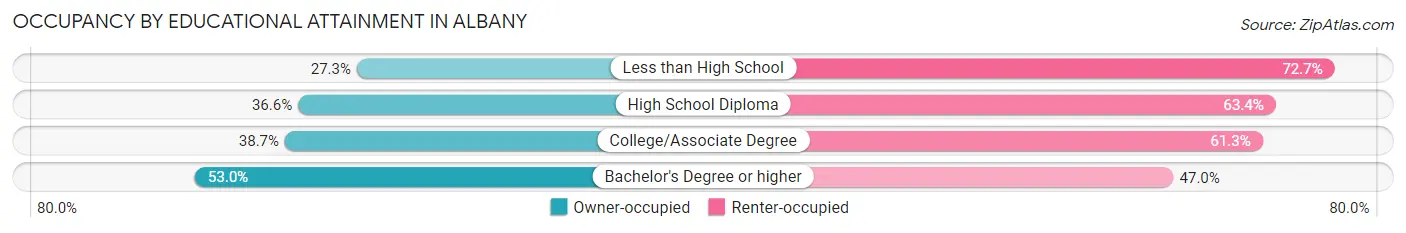
| Household Size | Owner-occupied | Renter-occupied |
| Less than High School | 1,007 (27.3%) | 2,680 (72.7%) |
| High School Diploma | 2,786 (36.6%) | 4,818 (63.4%) |
| College/Associate Degree | 3,658 (38.7%) | 5,789 (61.3%) |
| Bachelor's Degree or higher | 3,693 (53.0%) | 3,278 (47.0%) |
Occupancy by Age of Householder in Albany
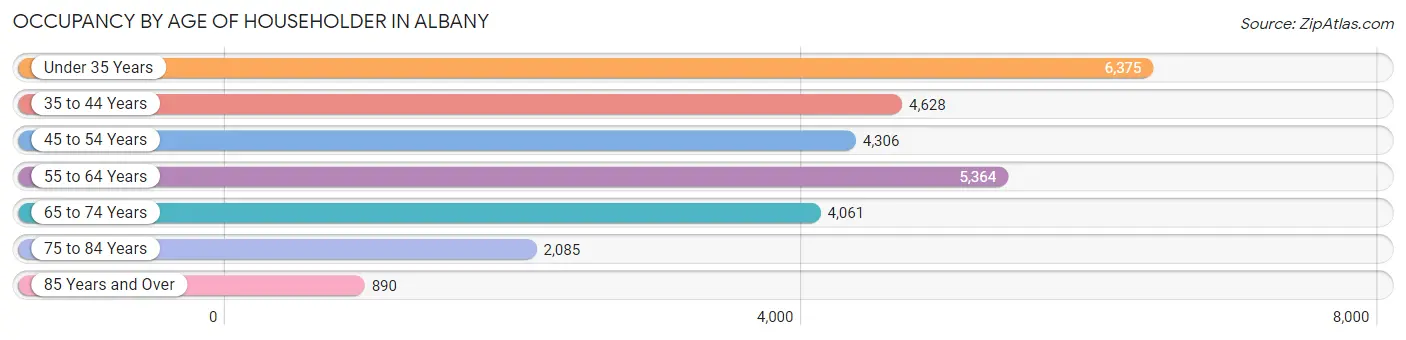
| Age Bracket | # Households | % Households |
| Under 35 Years | 6,375 | 23.0% |
| 35 to 44 Years | 4,628 | 16.7% |
| 45 to 54 Years | 4,306 | 15.5% |
| 55 to 64 Years | 5,364 | 19.4% |
| 65 to 74 Years | 4,061 | 14.7% |
| 75 to 84 Years | 2,085 | 7.5% |
| 85 Years and Over | 890 | 3.2% |
| Total | 27,709 | 100.0% |
Housing Finances in Albany
Median Income by Occupancy in Albany
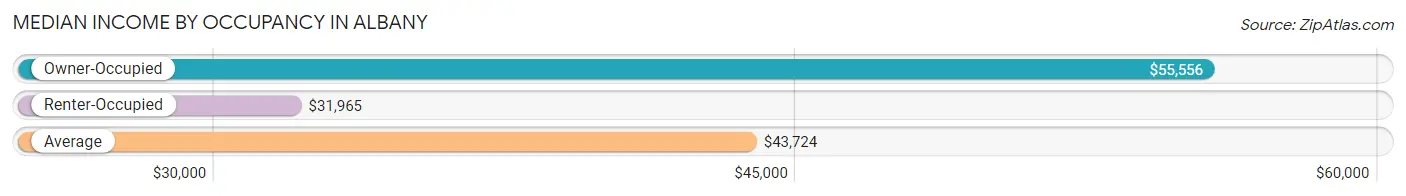
| Occupancy Type | # Households | Median Income |
| Owner-Occupied | 11,144 (40.2%) | $55,556 |
| Renter-Occupied | 16,565 (59.8%) | $31,965 |
| Average | 27,709 (100.0%) | $43,724 |
Occupancy by Householder Income Bracket in Albany
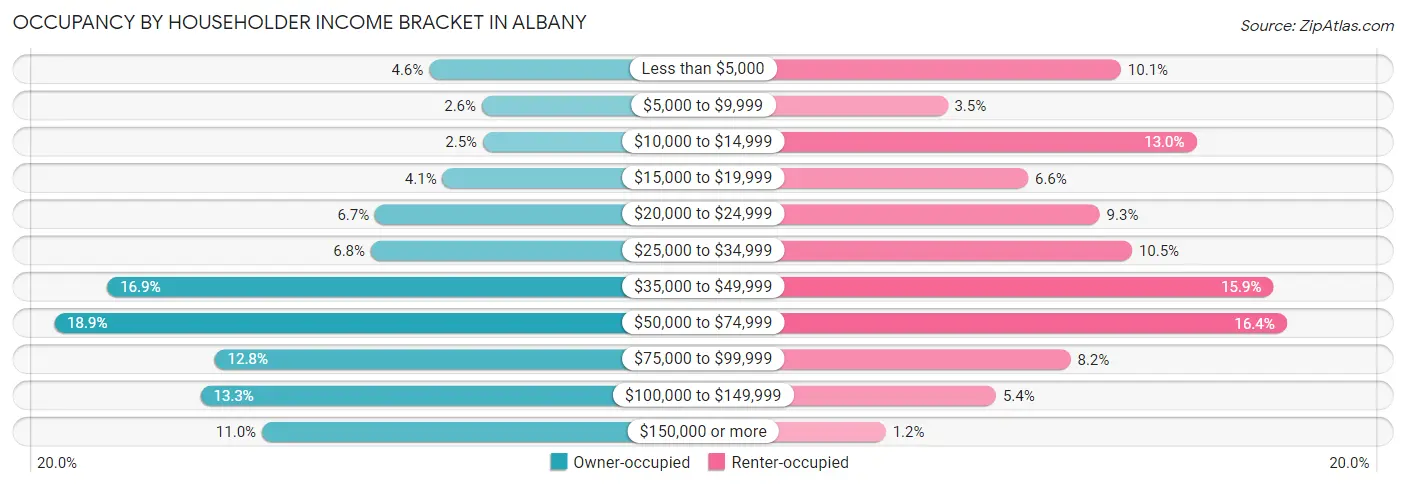
| Income Bracket | Owner-occupied | Renter-occupied |
| Less than $5,000 | 512 (4.6%) | 1,674 (10.1%) |
| $5,000 to $9,999 | 287 (2.6%) | 580 (3.5%) |
| $10,000 to $14,999 | 283 (2.5%) | 2,150 (13.0%) |
| $15,000 to $19,999 | 455 (4.1%) | 1,088 (6.6%) |
| $20,000 to $24,999 | 741 (6.7%) | 1,541 (9.3%) |
| $25,000 to $34,999 | 759 (6.8%) | 1,744 (10.5%) |
| $35,000 to $49,999 | 1,878 (16.9%) | 2,636 (15.9%) |
| $50,000 to $74,999 | 2,104 (18.9%) | 2,720 (16.4%) |
| $75,000 to $99,999 | 1,422 (12.8%) | 1,356 (8.2%) |
| $100,000 to $149,999 | 1,482 (13.3%) | 886 (5.3%) |
| $150,000 or more | 1,221 (11.0%) | 190 (1.1%) |
| Total | 11,144 (100.0%) | 16,565 (100.0%) |
Monthly Housing Cost Tiers in Albany
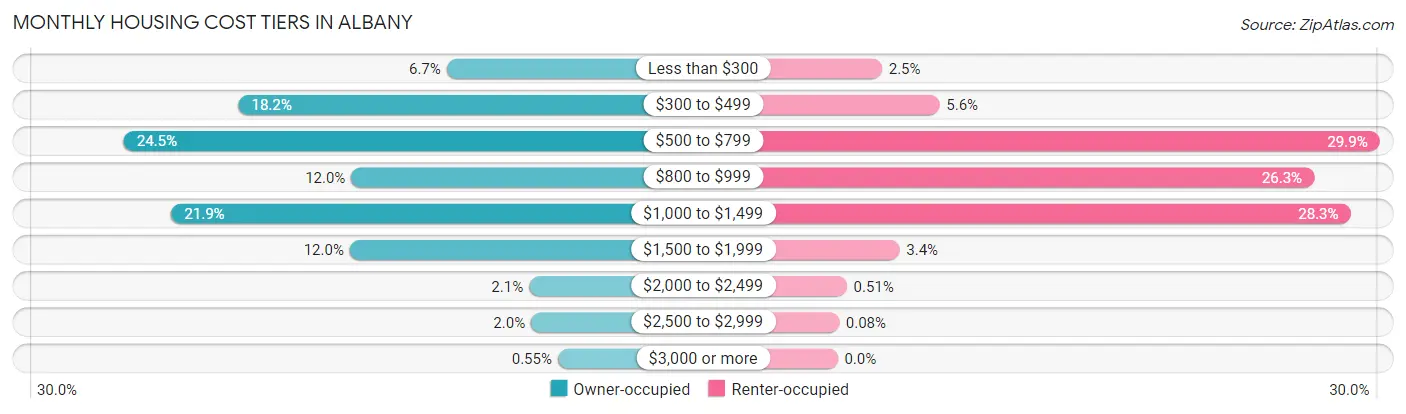
| Monthly Cost | Owner-occupied | Renter-occupied |
| Less than $300 | 745 (6.7%) | 406 (2.5%) |
| $300 to $499 | 2,026 (18.2%) | 932 (5.6%) |
| $500 to $799 | 2,733 (24.5%) | 4,959 (29.9%) |
| $800 to $999 | 1,333 (12.0%) | 4,360 (26.3%) |
| $1,000 to $1,499 | 2,439 (21.9%) | 4,693 (28.3%) |
| $1,500 to $1,999 | 1,342 (12.0%) | 567 (3.4%) |
| $2,000 to $2,499 | 239 (2.1%) | 85 (0.5%) |
| $2,500 to $2,999 | 226 (2.0%) | 13 (0.1%) |
| $3,000 or more | 61 (0.5%) | 0 (0.0%) |
| Total | 11,144 (100.0%) | 16,565 (100.0%) |
Physical Housing Characteristics in Albany
Housing Structures in Albany
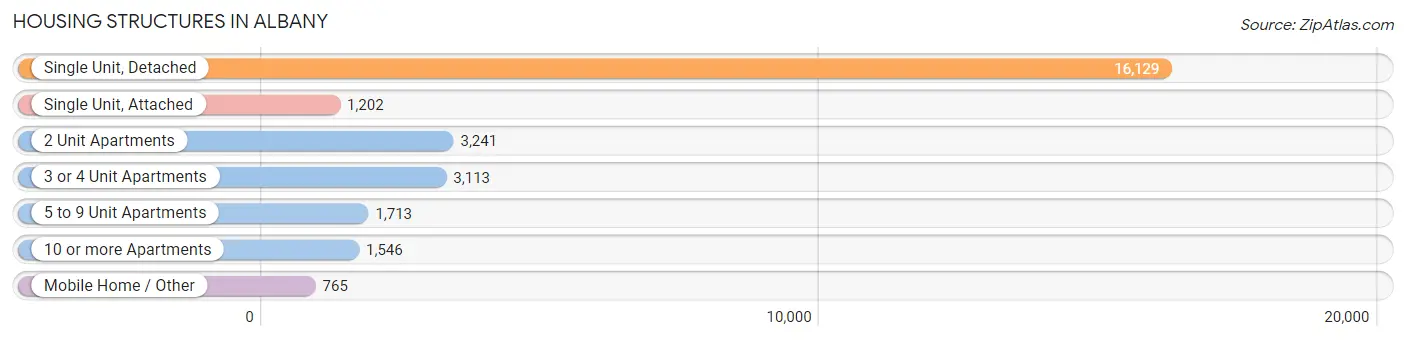
| Structure Type | # Housing Units | % Housing Units |
| Single Unit, Detached | 16,129 | 58.2% |
| Single Unit, Attached | 1,202 | 4.3% |
| 2 Unit Apartments | 3,241 | 11.7% |
| 3 or 4 Unit Apartments | 3,113 | 11.2% |
| 5 to 9 Unit Apartments | 1,713 | 6.2% |
| 10 or more Apartments | 1,546 | 5.6% |
| Mobile Home / Other | 765 | 2.8% |
| Total | 27,709 | 100.0% |
Housing Structures by Occupancy in Albany
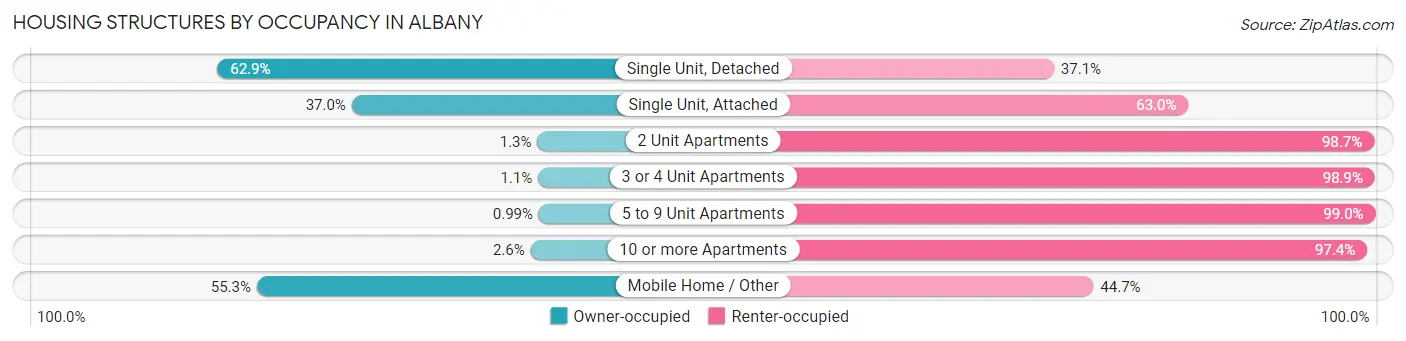
| Structure Type | Owner-occupied | Renter-occupied |
| Single Unit, Detached | 10,143 (62.9%) | 5,986 (37.1%) |
| Single Unit, Attached | 445 (37.0%) | 757 (63.0%) |
| 2 Unit Apartments | 41 (1.3%) | 3,200 (98.7%) |
| 3 or 4 Unit Apartments | 35 (1.1%) | 3,078 (98.9%) |
| 5 to 9 Unit Apartments | 17 (1.0%) | 1,696 (99.0%) |
| 10 or more Apartments | 40 (2.6%) | 1,506 (97.4%) |
| Mobile Home / Other | 423 (55.3%) | 342 (44.7%) |
| Total | 11,144 (40.2%) | 16,565 (59.8%) |
Housing Structures by Number of Rooms in Albany
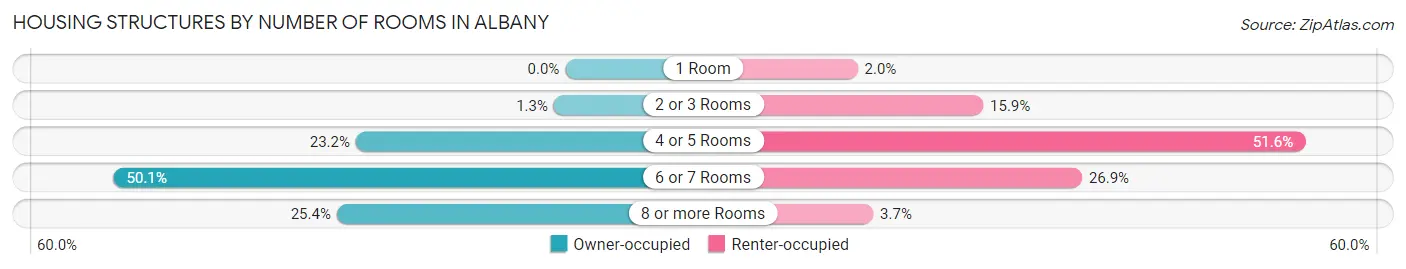
| Number of Rooms | Owner-occupied | Renter-occupied |
| 1 Room | 0 (0.0%) | 324 (2.0%) |
| 2 or 3 Rooms | 142 (1.3%) | 2,632 (15.9%) |
| 4 or 5 Rooms | 2,590 (23.2%) | 8,549 (51.6%) |
| 6 or 7 Rooms | 5,586 (50.1%) | 4,449 (26.9%) |
| 8 or more Rooms | 2,826 (25.4%) | 611 (3.7%) |
| Total | 11,144 (100.0%) | 16,565 (100.0%) |
Housing Structure by Heating Type in Albany
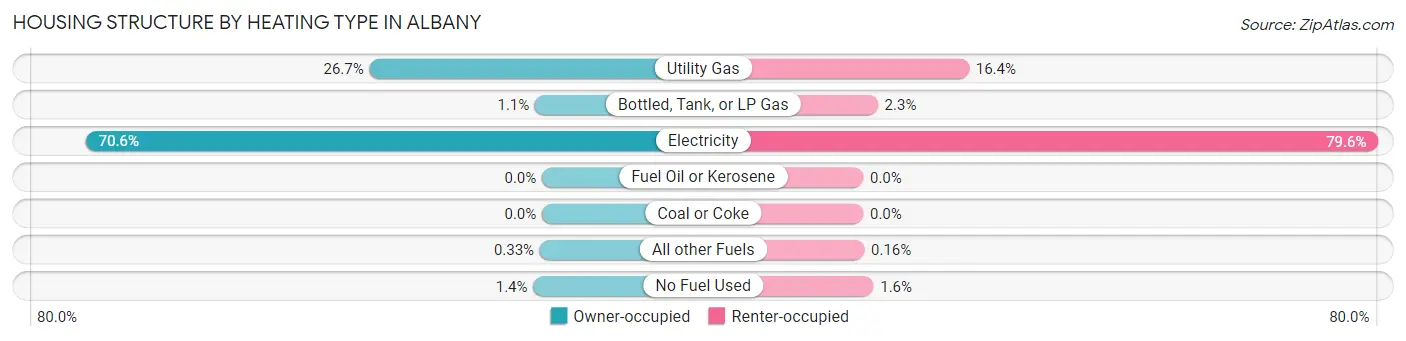
| Heating Type | Owner-occupied | Renter-occupied |
| Utility Gas | 2,973 (26.7%) | 2,709 (16.4%) |
| Bottled, Tank, or LP Gas | 120 (1.1%) | 375 (2.3%) |
| Electricity | 7,863 (70.6%) | 13,193 (79.6%) |
| Fuel Oil or Kerosene | 0 (0.0%) | 0 (0.0%) |
| Coal or Coke | 0 (0.0%) | 0 (0.0%) |
| All other Fuels | 37 (0.3%) | 27 (0.2%) |
| No Fuel Used | 151 (1.3%) | 261 (1.6%) |
| Total | 11,144 (100.0%) | 16,565 (100.0%) |
Household Vehicle Usage in Albany
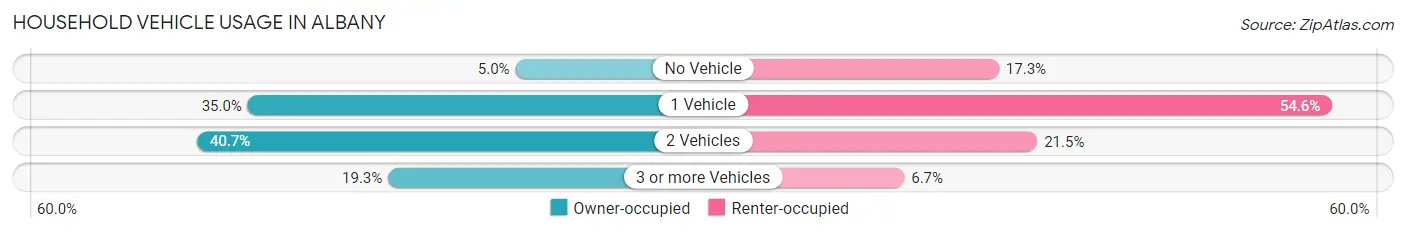
| Vehicles per Household | Owner-occupied | Renter-occupied |
| No Vehicle | 559 (5.0%) | 2,858 (17.2%) |
| 1 Vehicle | 3,902 (35.0%) | 9,038 (54.6%) |
| 2 Vehicles | 4,534 (40.7%) | 3,568 (21.5%) |
| 3 or more Vehicles | 2,149 (19.3%) | 1,101 (6.7%) |
| Total | 11,144 (100.0%) | 16,565 (100.0%) |
Real Estate & Mortgages in Albany
Real Estate and Mortgage Overview in Albany
| Characteristic | Without Mortgage | With Mortgage |
| Housing Units | 5,048 | 6,096 |
| Median Property Value | $93,500 | $128,500 |
| Median Household Income | $47,645 | $815 |
| Monthly Housing Costs | $488 | $61 |
| Real Estate Taxes | $1,414 | $246 |
Property Value by Mortgage Status in Albany
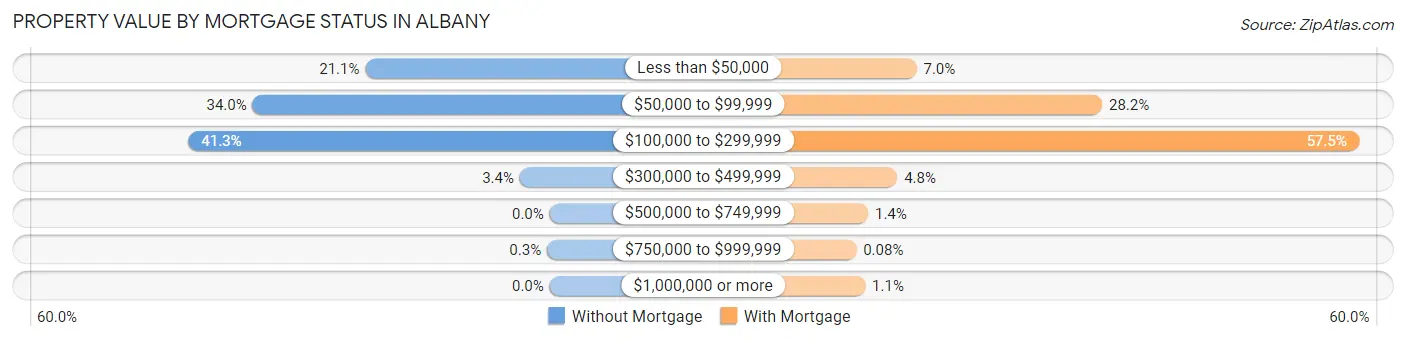
| Property Value | Without Mortgage | With Mortgage |
| Less than $50,000 | 1,063 (21.1%) | 425 (7.0%) |
| $50,000 to $99,999 | 1,714 (34.0%) | 1,717 (28.2%) |
| $100,000 to $299,999 | 2,084 (41.3%) | 3,505 (57.5%) |
| $300,000 to $499,999 | 172 (3.4%) | 290 (4.8%) |
| $500,000 to $749,999 | 0 (0.0%) | 87 (1.4%) |
| $750,000 to $999,999 | 15 (0.3%) | 5 (0.1%) |
| $1,000,000 or more | 0 (0.0%) | 67 (1.1%) |
| Total | 5,048 (100.0%) | 6,096 (100.0%) |
Household Income by Mortgage Status in Albany
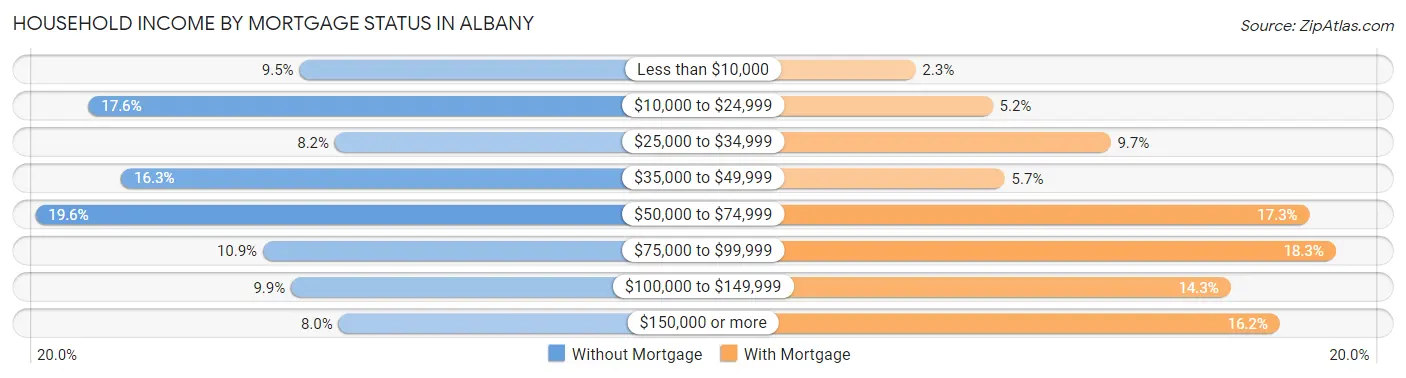
| Household Income | Without Mortgage | With Mortgage |
| Less than $10,000 | 481 (9.5%) | 139 (2.3%) |
| $10,000 to $24,999 | 887 (17.6%) | 318 (5.2%) |
| $25,000 to $34,999 | 413 (8.2%) | 592 (9.7%) |
| $35,000 to $49,999 | 824 (16.3%) | 346 (5.7%) |
| $50,000 to $74,999 | 989 (19.6%) | 1,054 (17.3%) |
| $75,000 to $99,999 | 551 (10.9%) | 1,115 (18.3%) |
| $100,000 to $149,999 | 497 (9.9%) | 871 (14.3%) |
| $150,000 or more | 406 (8.0%) | 985 (16.2%) |
| Total | 5,048 (100.0%) | 6,096 (100.0%) |
Property Value to Household Income Ratio in Albany
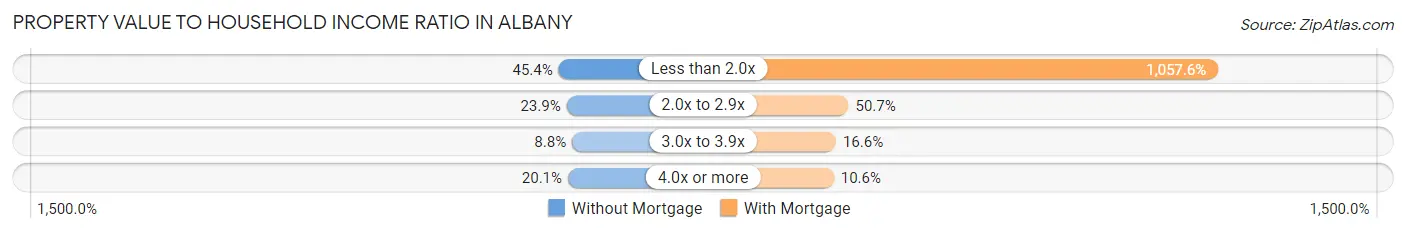
| Value-to-Income Ratio | Without Mortgage | With Mortgage |
| Less than 2.0x | 2,293 (45.4%) | 64,474 (1,057.6%) |
| 2.0x to 2.9x | 1,204 (23.8%) | 3,091 (50.7%) |
| 3.0x to 3.9x | 445 (8.8%) | 1,010 (16.6%) |
| 4.0x or more | 1,013 (20.1%) | 647 (10.6%) |
| Total | 5,048 (100.0%) | 6,096 (100.0%) |
Real Estate Taxes by Mortgage Status in Albany
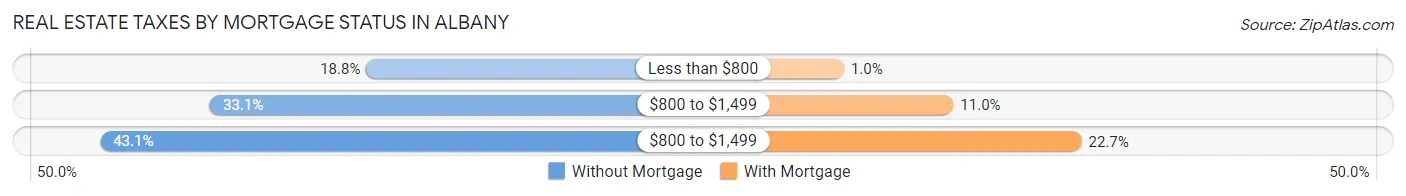
| Property Taxes | Without Mortgage | With Mortgage |
| Less than $800 | 949 (18.8%) | 61 (1.0%) |
| $800 to $1,499 | 1,669 (33.1%) | 670 (11.0%) |
| $800 to $1,499 | 2,175 (43.1%) | 1,384 (22.7%) |
| Total | 5,048 (100.0%) | 6,096 (100.0%) |
Health & Disability in Albany
Health Insurance Coverage by Age in Albany
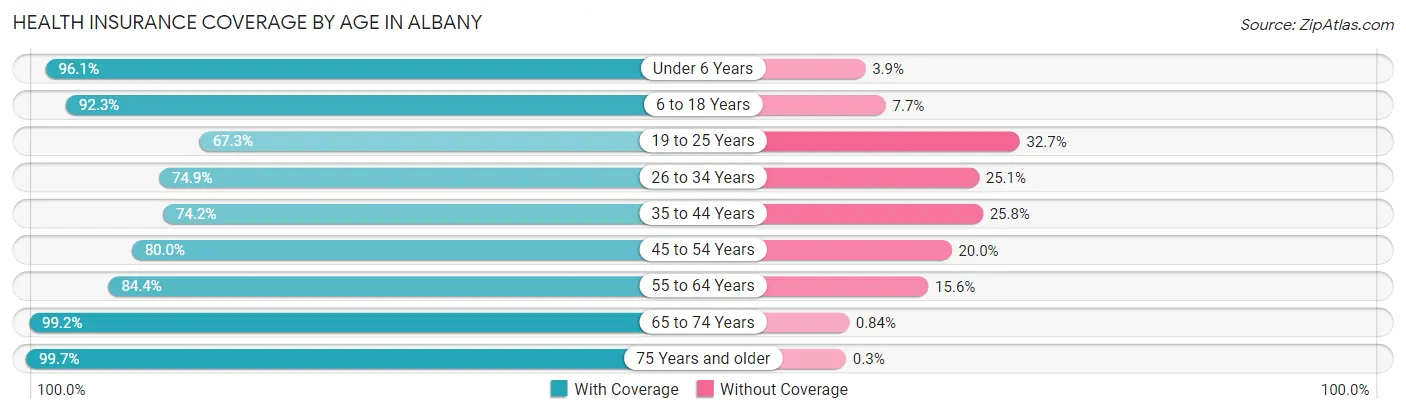
| Age Bracket | With Coverage | Without Coverage |
| Under 6 Years | 5,272 (96.1%) | 214 (3.9%) |
| 6 to 18 Years | 11,316 (92.3%) | 945 (7.7%) |
| 19 to 25 Years | 5,079 (67.3%) | 2,465 (32.7%) |
| 26 to 34 Years | 6,463 (74.9%) | 2,164 (25.1%) |
| 35 to 44 Years | 5,735 (74.2%) | 1,995 (25.8%) |
| 45 to 54 Years | 5,778 (80.0%) | 1,443 (20.0%) |
| 55 to 64 Years | 6,790 (84.4%) | 1,259 (15.6%) |
| 65 to 74 Years | 6,243 (99.2%) | 53 (0.8%) |
| 75 Years and older | 4,035 (99.7%) | 12 (0.3%) |
| Total | 56,711 (84.3%) | 10,550 (15.7%) |
Health Insurance Coverage by Citizenship Status in Albany
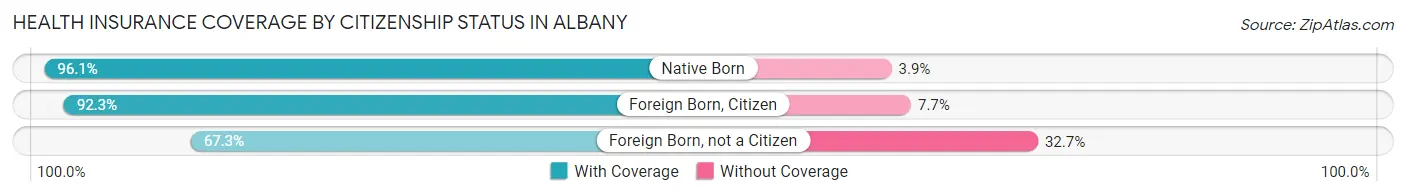
| Citizenship Status | With Coverage | Without Coverage |
| Native Born | 5,272 (96.1%) | 214 (3.9%) |
| Foreign Born, Citizen | 11,316 (92.3%) | 945 (7.7%) |
| Foreign Born, not a Citizen | 5,079 (67.3%) | 2,465 (32.7%) |
Health Insurance Coverage by Household Income in Albany
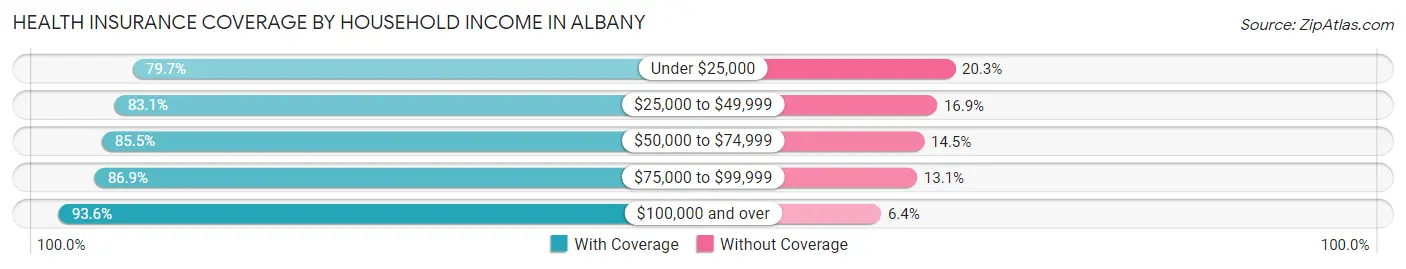
| Household Income | With Coverage | Without Coverage |
| Under $25,000 | 14,732 (79.7%) | 3,749 (20.3%) |
| $25,000 to $49,999 | 12,952 (83.1%) | 2,632 (16.9%) |
| $50,000 to $74,999 | 9,421 (85.5%) | 1,596 (14.5%) |
| $75,000 to $99,999 | 6,499 (86.9%) | 983 (13.1%) |
| $100,000 and over | 11,031 (93.6%) | 755 (6.4%) |
Public vs Private Health Insurance Coverage by Age in Albany
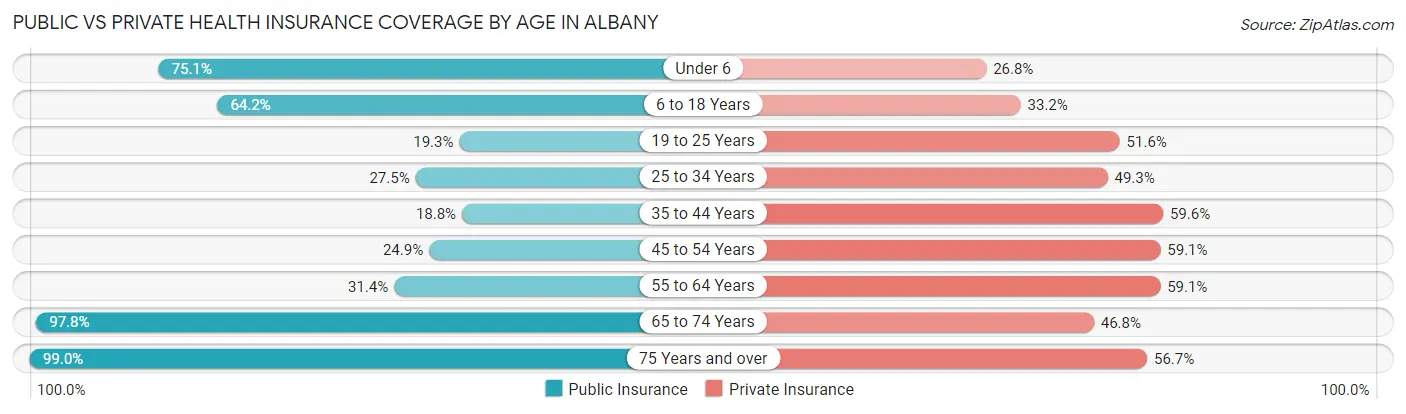
| Age Bracket | Public Insurance | Private Insurance |
| Under 6 | 4,121 (75.1%) | 1,470 (26.8%) |
| 6 to 18 Years | 7,872 (64.2%) | 4,070 (33.2%) |
| 19 to 25 Years | 1,457 (19.3%) | 3,891 (51.6%) |
| 25 to 34 Years | 2,368 (27.5%) | 4,255 (49.3%) |
| 35 to 44 Years | 1,455 (18.8%) | 4,609 (59.6%) |
| 45 to 54 Years | 1,801 (24.9%) | 4,270 (59.1%) |
| 55 to 64 Years | 2,529 (31.4%) | 4,757 (59.1%) |
| 65 to 74 Years | 6,159 (97.8%) | 2,945 (46.8%) |
| 75 Years and over | 4,007 (99.0%) | 2,293 (56.7%) |
| Total | 31,769 (47.2%) | 32,560 (48.4%) |
Disability Status by Sex by Age in Albany
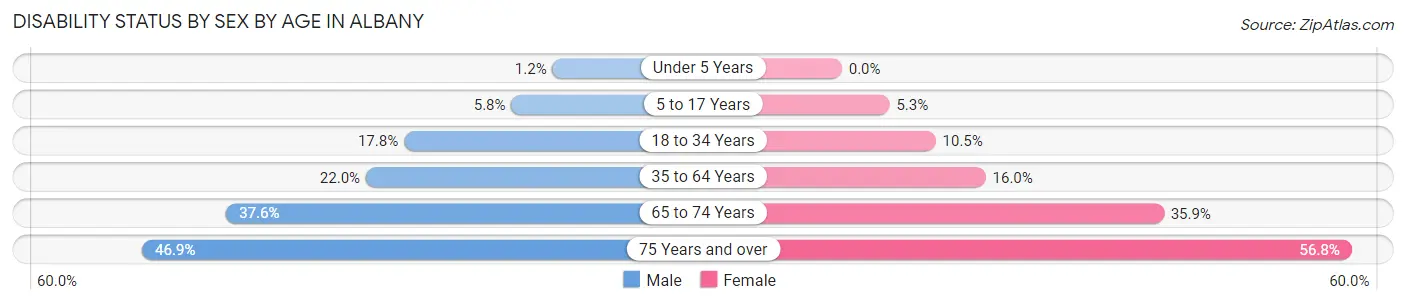
| Age Bracket | Male | Female |
| Under 5 Years | 28 (1.2%) | 0 (0.0%) |
| 5 to 17 Years | 348 (5.8%) | 324 (5.3%) |
| 18 to 34 Years | 1,359 (17.7%) | 992 (10.4%) |
| 35 to 64 Years | 2,229 (22.0%) | 2,061 (16.0%) |
| 65 to 74 Years | 1,037 (37.6%) | 1,267 (35.8%) |
| 75 Years and over | 656 (46.9%) | 1,504 (56.8%) |
Disability Class by Sex by Age in Albany
Disability Class: Hearing Difficulty
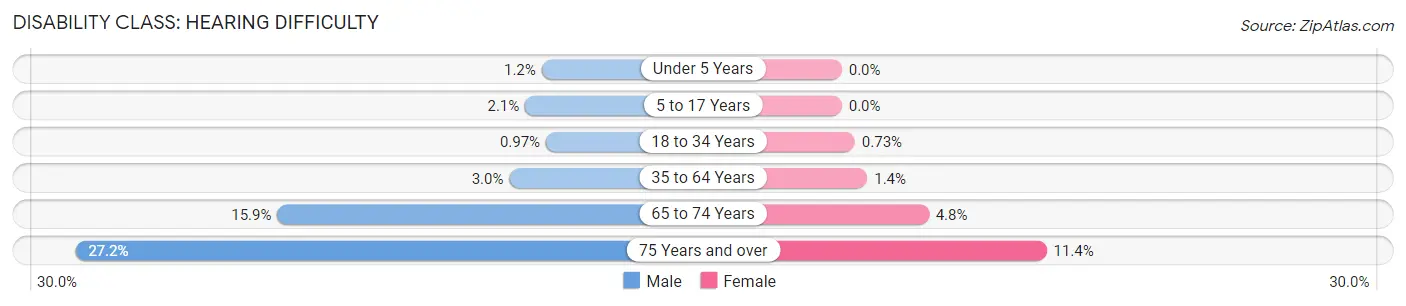
| Age Bracket | Male | Female |
| Under 5 Years | 28 (1.2%) | 0 (0.0%) |
| 5 to 17 Years | 128 (2.1%) | 0 (0.0%) |
| 18 to 34 Years | 74 (1.0%) | 69 (0.7%) |
| 35 to 64 Years | 305 (3.0%) | 182 (1.4%) |
| 65 to 74 Years | 440 (15.9%) | 171 (4.8%) |
| 75 Years and over | 380 (27.2%) | 302 (11.4%) |
Disability Class: Vision Difficulty
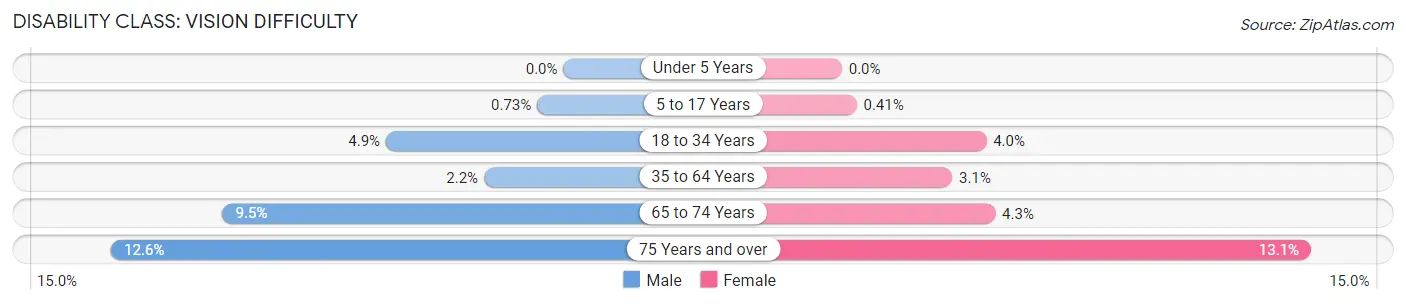
| Age Bracket | Male | Female |
| Under 5 Years | 0 (0.0%) | 0 (0.0%) |
| 5 to 17 Years | 44 (0.7%) | 25 (0.4%) |
| 18 to 34 Years | 378 (4.9%) | 382 (4.0%) |
| 35 to 64 Years | 224 (2.2%) | 395 (3.1%) |
| 65 to 74 Years | 262 (9.5%) | 151 (4.3%) |
| 75 Years and over | 176 (12.6%) | 346 (13.1%) |
Disability Class: Cognitive Difficulty
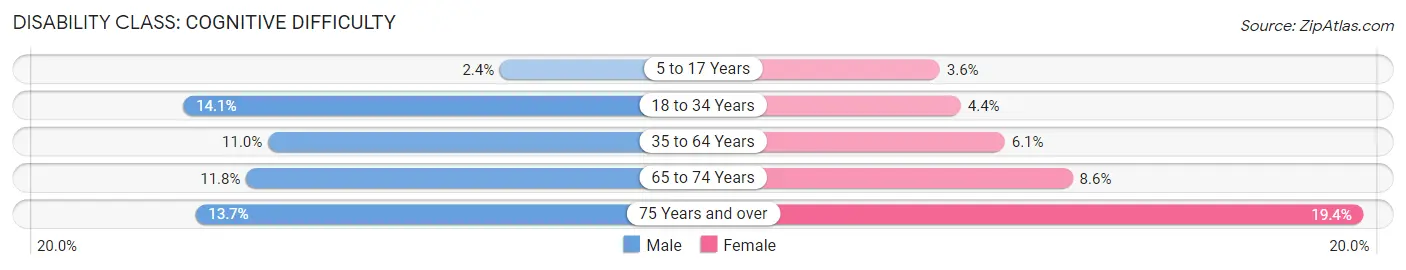
| Age Bracket | Male | Female |
| 5 to 17 Years | 141 (2.4%) | 222 (3.6%) |
| 18 to 34 Years | 1,080 (14.1%) | 420 (4.4%) |
| 35 to 64 Years | 1,111 (11.0%) | 778 (6.0%) |
| 65 to 74 Years | 325 (11.8%) | 303 (8.6%) |
| 75 Years and over | 191 (13.7%) | 513 (19.4%) |
Disability Class: Ambulatory Difficulty
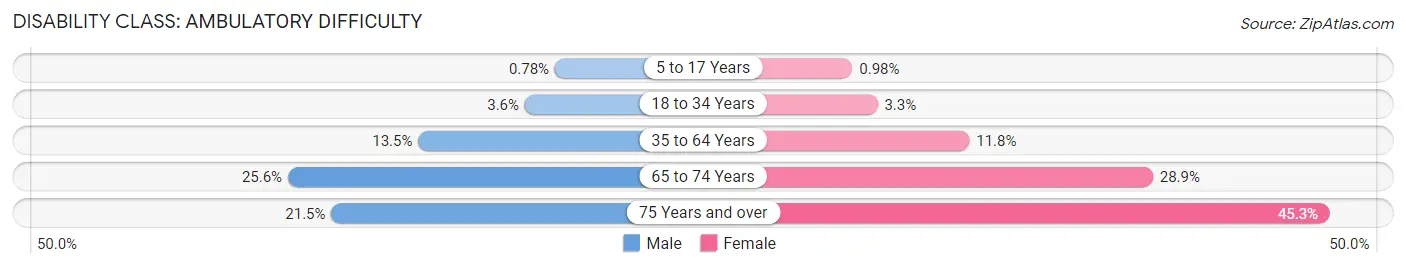
| Age Bracket | Male | Female |
| 5 to 17 Years | 47 (0.8%) | 60 (1.0%) |
| 18 to 34 Years | 273 (3.6%) | 314 (3.3%) |
| 35 to 64 Years | 1,365 (13.5%) | 1,522 (11.8%) |
| 65 to 74 Years | 706 (25.6%) | 1,020 (28.9%) |
| 75 Years and over | 301 (21.5%) | 1,200 (45.3%) |
Disability Class: Self-Care Difficulty
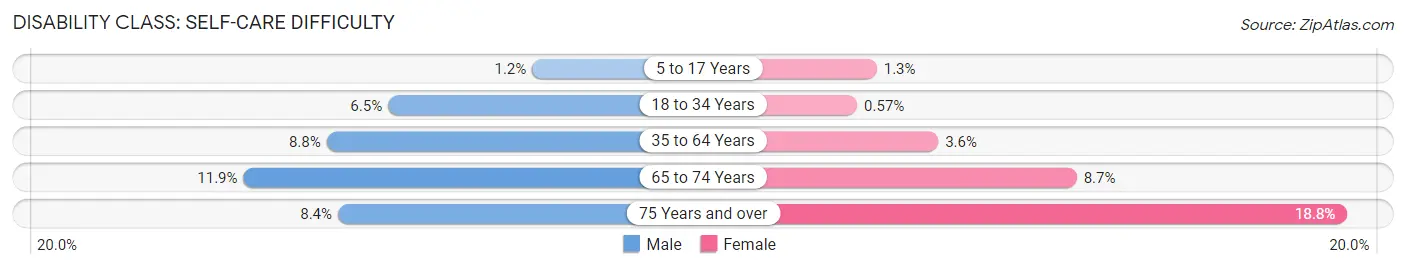
| Age Bracket | Male | Female |
| 5 to 17 Years | 70 (1.2%) | 79 (1.3%) |
| 18 to 34 Years | 498 (6.5%) | 54 (0.6%) |
| 35 to 64 Years | 891 (8.8%) | 461 (3.6%) |
| 65 to 74 Years | 328 (11.9%) | 308 (8.7%) |
| 75 Years and over | 117 (8.4%) | 497 (18.8%) |
Technology Access in Albany
Computing Device Access in Albany
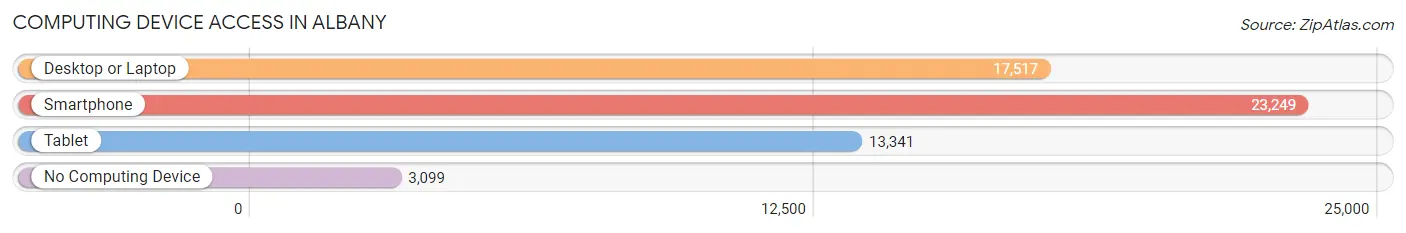
| Device Type | # Households | % Households |
| Desktop or Laptop | 17,517 | 63.2% |
| Smartphone | 23,249 | 83.9% |
| Tablet | 13,341 | 48.1% |
| No Computing Device | 3,099 | 11.2% |
| Total | 27,709 | 100.0% |
Internet Access in Albany
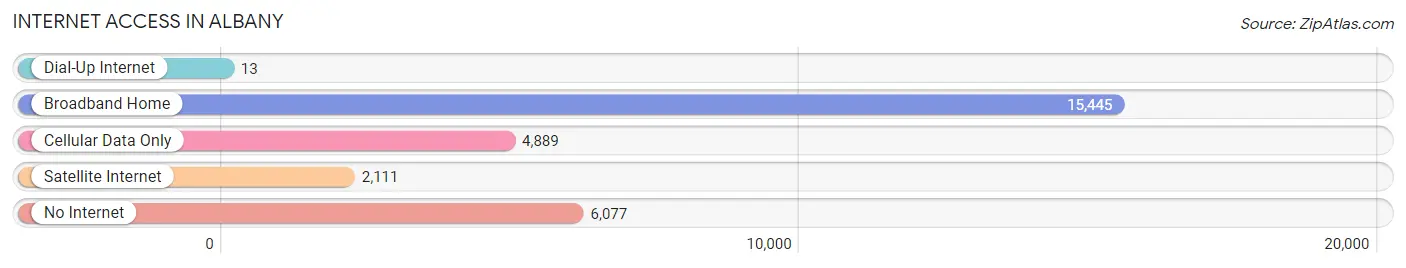
| Internet Type | # Households | % Households |
| Dial-Up Internet | 13 | 0.1% |
| Broadband Home | 15,445 | 55.7% |
| Cellular Data Only | 4,889 | 17.6% |
| Satellite Internet | 2,111 | 7.6% |
| No Internet | 6,077 | 21.9% |
| Total | 27,709 | 100.0% |
Albany Summary
Albany, Georgia is a city located in the southwestern part of the state, in Dougherty County. It is the county seat and the largest city in the county. Albany is the principal city of the Albany, Georgia metropolitan area, which encompasses all of Dougherty County and is the second largest metropolitan area in the state. The city is located on the Flint River, approximately 140 miles south of Atlanta.
History
Albany was founded in 1836 by Nelson Tift, a cotton merchant from Connecticut. Tift named the city after his hometown of Albany, New York. The city was incorporated in 1838 and quickly became a major center for cotton production and processing. During the Civil War, Albany was a major supply center for the Confederate Army. After the war, the city experienced a period of growth and prosperity, becoming a major railroad hub and a center for the timber and naval stores industries.
In the early 20th century, Albany was a major center for the pecan industry, and the city was known as the “Pecan Capital of the World.” The city also became a major center for the production of paper products, and the city’s economy was further diversified with the establishment of the Marine Corps Logistics Base in the 1950s.
Geography
Albany is located in the southwestern part of the state, in Dougherty County. The city is situated on the Flint River, approximately 140 miles south of Atlanta. The city covers an area of approximately 40 square miles and has an elevation of approximately 200 feet. The city is located in a humid subtropical climate zone, with hot, humid summers and mild winters.
Economy
Albany’s economy is largely based on the service sector, with healthcare, education, and government being the largest employers. The city is also home to several manufacturing companies, including Procter & Gamble, MillerCoors, and Georgia-Pacific. The city is also a major center for the production of paper products, and the city’s economy is further diversified with the presence of the Marine Corps Logistics Base.
Demographics
As of the 2010 census, Albany had a population of 77,434. The racial makeup of the city was 54.2% African American, 37.3% White, 0.3% Native American, 1.2% Asian, 0.1% Pacific Islander, and 6.9% from other races. The median household income was $30,912, and the median family income was $37,845. The per capita income was $17,845.
Albany is home to a diverse population, with a variety of religious denominations represented. The city is also home to a large number of military personnel, due to the presence of the Marine Corps Logistics Base. The city is served by several public and private schools, as well as Albany State University.
Common Questions
What is the Total Population of Albany?
Total Population of Albany is 68,926.
What is the Total Male Population of Albany?
Total Male Population of Albany is 31,598.
What is the Total Female Population of Albany?
Total Female Population of Albany is 37,328.
What is the Ratio of Males per 100 Females in Albany?
There are 84.65 Males per 100 Females in Albany.
What is the Ratio of Females per 100 Males in Albany?
There are 118.13 Females per 100 Males in Albany.
What is the Median Population Age in Albany?
Median Population Age in Albany is 34.7 Years.
What is the Average Family Size in Albany
Average Family Size in Albany is 3.1 People.
What is the Average Household Size in Albany
Average Household Size in Albany is 2.3 People.
What is Per Capita Income in Albany?
Per Capita income in Albany is $23,824.
What is the Median Family Income in Albany?
Median Family Income in Albany is $47,032.
What is the Median Household income in Albany?
Median Household Income in Albany is $43,724.
What is Income or Wage Gap in Albany?
Income or Wage Gap in Albany is 21.5%.
Women in Albany earn 78.5 cents for every dollar earned by a man.
What is Family Income Deficit in Albany?
Family Income Deficit in Albany is $12,347.
Families that are below poverty line in Albany earn $12,347 less on average than the poverty threshold level.
What is Inequality or Gini Index in Albany?
Inequality or Gini Index in Albany is 0.48.
How Large is the Labor Force in Albany?
There are 29,949 People in the Labor Forcein in Albany.
What is the Percentage of People in the Labor Force in Albany?
55.7% of People are in the Labor Force in Albany.
What is the Unemployment Rate in Albany?
Unemployment Rate in Albany is 10.3%.