Mableton, GA
Mableton Map
Mableton Overview
41,647
TOTAL POPULATION
20,224
MALE POPULATION
21,423
FEMALE POPULATION
94.40
MALES / 100 FEMALES
105.93
FEMALES / 100 MALES
38.2
MEDIAN AGE
3.4
AVG FAMILY SIZE
2.8
AVG HOUSEHOLD SIZE
$39,584
PER CAPITA INCOME
$99,815
AVG FAMILY INCOME
$79,069
AVG HOUSEHOLD INCOME
8.0%
WAGE / INCOME GAP [ % ]
92.0¢/ $1
WAGE / INCOME GAP [ $ ]
$12,015
FAMILY INCOME DEFICIT
0.42
INEQUALITY / GINI INDEX
23,461
LABOR FORCE [ PEOPLE ]
72.4%
PERCENT IN LABOR FORCE
6.7%
UNEMPLOYMENT RATE
Mableton Zip Codes
Mableton Area Codes
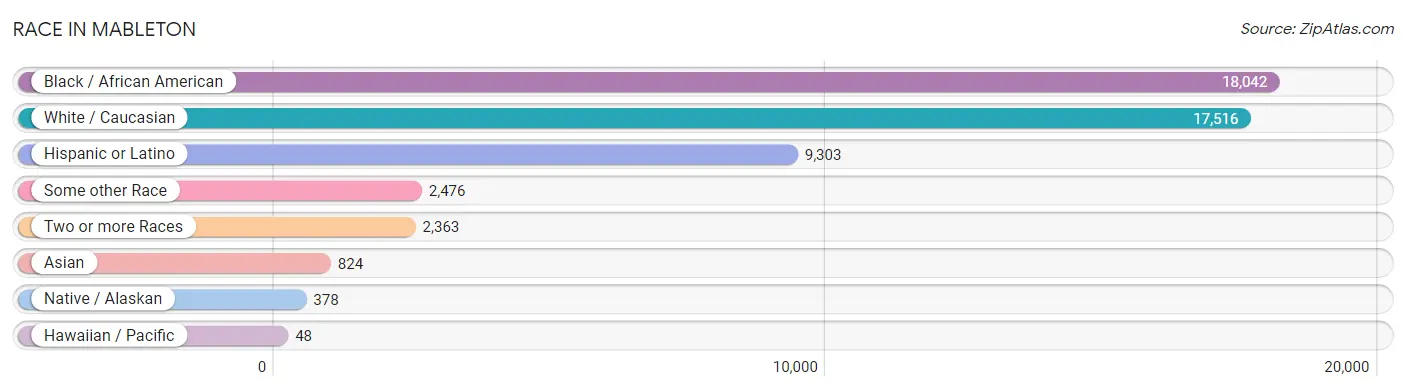
Race in Mableton
The most populous races in Mableton are Black / African American (18,042 | 43.3%), White / Caucasian (17,516 | 42.1%), and Hispanic or Latino (9,303 | 22.3%).
| Race | # Population | % Population |
| Asian | 824 | 2.0% |
| Black / African American | 18,042 | 43.3% |
| Hawaiian / Pacific | 48 | 0.1% |
| Hispanic or Latino | 9,303 | 22.3% |
| Native / Alaskan | 378 | 0.9% |
| White / Caucasian | 17,516 | 42.1% |
| Two or more Races | 2,363 | 5.7% |
| Some other Race | 2,476 | 5.9% |
| Total | 41,647 | 100.0% |
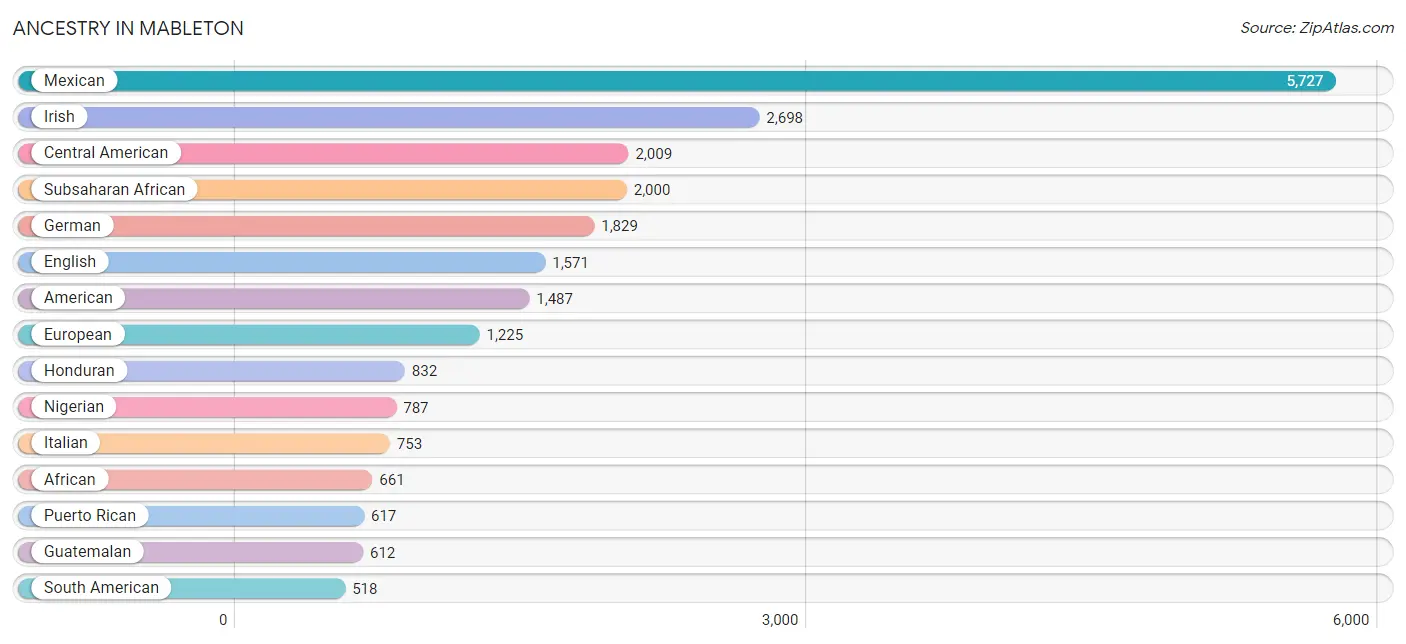
Ancestry in Mableton
The most populous ancestries reported in Mableton are Mexican (5,727 | 13.8%), Irish (2,698 | 6.5%), Central American (2,009 | 4.8%), Subsaharan African (2,000 | 4.8%), and German (1,829 | 4.4%), together accounting for 34.2% of all Mableton residents.
| Ancestry | # Population | % Population |
| African | 661 | 1.6% |
| American | 1,487 | 3.6% |
| Arab | 33 | 0.1% |
| Barbadian | 12 | 0.0% |
| Belizean | 41 | 0.1% |
| Bermudan | 12 | 0.0% |
| Bhutanese | 54 | 0.1% |
| Brazilian | 33 | 0.1% |
| British | 165 | 0.4% |
| British West Indian | 39 | 0.1% |
| Bulgarian | 6 | 0.0% |
| Canadian | 95 | 0.2% |
| Central American | 2,009 | 4.8% |
| Central American Indian | 7 | 0.0% |
| Cherokee | 112 | 0.3% |
| Chilean | 38 | 0.1% |
| Choctaw | 42 | 0.1% |
| Colombian | 357 | 0.9% |
| Costa Rican | 38 | 0.1% |
| Cuban | 338 | 0.8% |
| Czech | 22 | 0.1% |
| Dominican | 44 | 0.1% |
| Dutch | 30 | 0.1% |
| Eastern European | 80 | 0.2% |
| Ecuadorian | 2 | 0.0% |
| English | 1,571 | 3.8% |
| Ethiopian | 23 | 0.1% |
| European | 1,225 | 2.9% |
| French | 287 | 0.7% |
| German | 1,829 | 4.4% |
| Ghanaian | 167 | 0.4% |
| Greek | 114 | 0.3% |
| Guamanian / Chamorro | 6 | 0.0% |
| Guatemalan | 612 | 1.5% |
| Guyanese | 118 | 0.3% |
| Haitian | 178 | 0.4% |
| Honduran | 832 | 2.0% |
| Hungarian | 35 | 0.1% |
| Indian (Asian) | 187 | 0.4% |
| Irish | 2,698 | 6.5% |
| Italian | 753 | 1.8% |
| Jamaican | 420 | 1.0% |
| Japanese | 41 | 0.1% |
| Kenyan | 29 | 0.1% |
| Korean | 101 | 0.2% |
| Lebanese | 12 | 0.0% |
| Liberian | 33 | 0.1% |
| Lithuanian | 6 | 0.0% |
| Mexican | 5,727 | 13.8% |
| Mexican American Indian | 34 | 0.1% |
| Native Hawaiian | 36 | 0.1% |
| Navajo | 6 | 0.0% |
| Nigerian | 787 | 1.9% |
| Northern European | 53 | 0.1% |
| Norwegian | 150 | 0.4% |
| Panamanian | 79 | 0.2% |
| Peruvian | 82 | 0.2% |
| Polish | 356 | 0.9% |
| Portuguese | 67 | 0.2% |
| Puerto Rican | 617 | 1.5% |
| Romanian | 19 | 0.1% |
| Russian | 176 | 0.4% |
| Salvadoran | 448 | 1.1% |
| Scandinavian | 94 | 0.2% |
| Scotch-Irish | 112 | 0.3% |
| Scottish | 281 | 0.7% |
| Serbian | 12 | 0.0% |
| South American | 518 | 1.2% |
| Spaniard | 42 | 0.1% |
| Sri Lankan | 90 | 0.2% |
| Subsaharan African | 2,000 | 4.8% |
| Swedish | 126 | 0.3% |
| Thai | 402 | 1.0% |
| Trinidadian and Tobagonian | 29 | 0.1% |
| Ugandan | 11 | 0.0% |
| Venezuelan | 17 | 0.0% |
| Welsh | 130 | 0.3% |
| West Indian | 51 | 0.1% | View All 78 Rows |
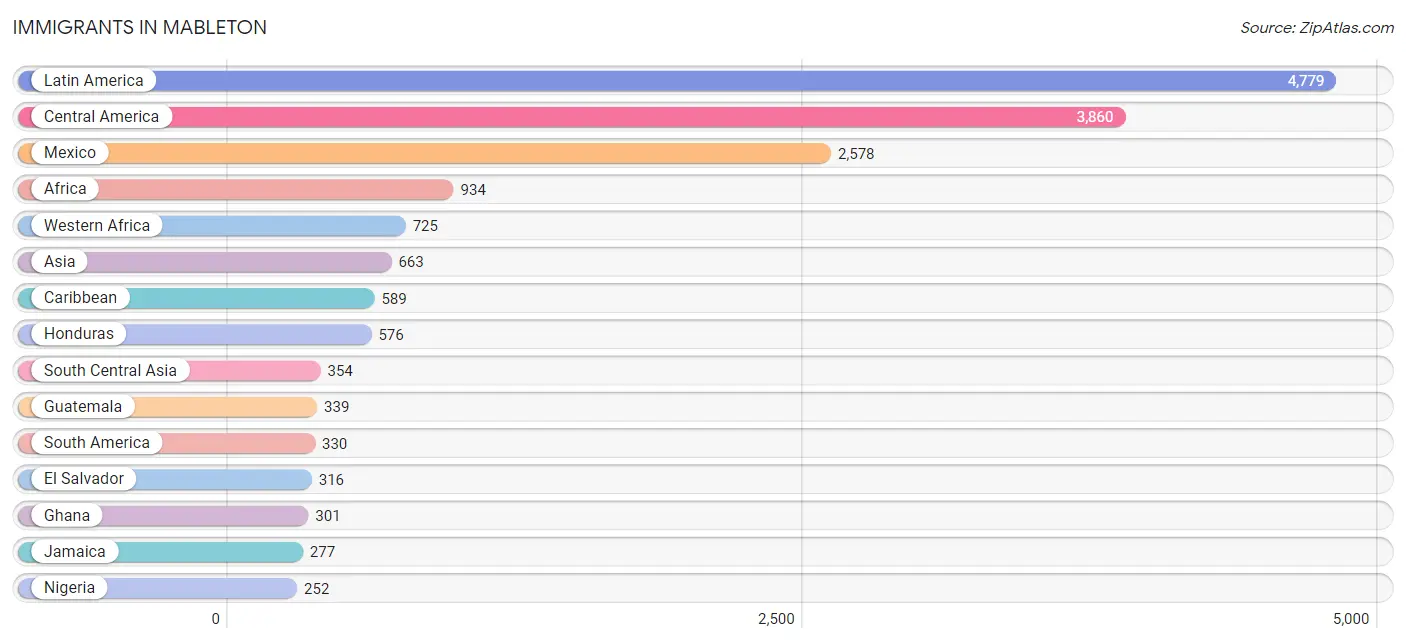
Immigrants in Mableton
The most numerous immigrant groups reported in Mableton came from Latin America (4,779 | 11.5%), Central America (3,860 | 9.3%), Mexico (2,578 | 6.2%), Africa (934 | 2.2%), and Western Africa (725 | 1.7%), together accounting for 30.9% of all Mableton residents.
| Immigration Origin | # Population | % Population |
| Africa | 934 | 2.2% |
| Asia | 663 | 1.6% |
| Austria | 3 | 0.0% |
| Brazil | 69 | 0.2% |
| Bulgaria | 6 | 0.0% |
| Cambodia | 14 | 0.0% |
| Cameroon | 29 | 0.1% |
| Canada | 27 | 0.1% |
| Caribbean | 589 | 1.4% |
| Central America | 3,860 | 9.3% |
| China | 117 | 0.3% |
| Colombia | 94 | 0.2% |
| Costa Rica | 38 | 0.1% |
| Cuba | 132 | 0.3% |
| Dominica | 16 | 0.0% |
| Dominican Republic | 5 | 0.0% |
| Eastern Africa | 81 | 0.2% |
| Eastern Asia | 117 | 0.3% |
| Eastern Europe | 25 | 0.1% |
| Ecuador | 22 | 0.1% |
| Egypt | 8 | 0.0% |
| El Salvador | 316 | 0.8% |
| England | 26 | 0.1% |
| Europe | 112 | 0.3% |
| France | 35 | 0.1% |
| Germany | 23 | 0.1% |
| Ghana | 301 | 0.7% |
| Grenada | 7 | 0.0% |
| Guatemala | 339 | 0.8% |
| Guyana | 46 | 0.1% |
| Haiti | 148 | 0.4% |
| Honduras | 576 | 1.4% |
| India | 198 | 0.5% |
| Indonesia | 10 | 0.0% |
| Jamaica | 277 | 0.7% |
| Kazakhstan | 32 | 0.1% |
| Kenya | 60 | 0.1% |
| Latin America | 4,779 | 11.5% |
| Liberia | 35 | 0.1% |
| Mexico | 2,578 | 6.2% |
| Middle Africa | 74 | 0.2% |
| Nigeria | 252 | 0.6% |
| Northern Africa | 8 | 0.0% |
| Northern Europe | 26 | 0.1% |
| Pakistan | 36 | 0.1% |
| Panama | 13 | 0.0% |
| Peru | 82 | 0.2% |
| Philippines | 70 | 0.2% |
| Romania | 19 | 0.1% |
| Singapore | 18 | 0.0% |
| South America | 330 | 0.8% |
| South Central Asia | 354 | 0.9% |
| South Eastern Asia | 171 | 0.4% |
| Sri Lanka | 88 | 0.2% |
| Syria | 21 | 0.1% |
| Trinidad and Tobago | 4 | 0.0% |
| Venezuela | 17 | 0.0% |
| Vietnam | 59 | 0.1% |
| Western Africa | 725 | 1.7% |
| Western Asia | 21 | 0.1% |
| Western Europe | 61 | 0.2% | View All 61 Rows |
Sex and Age in Mableton
Sex and Age in Mableton
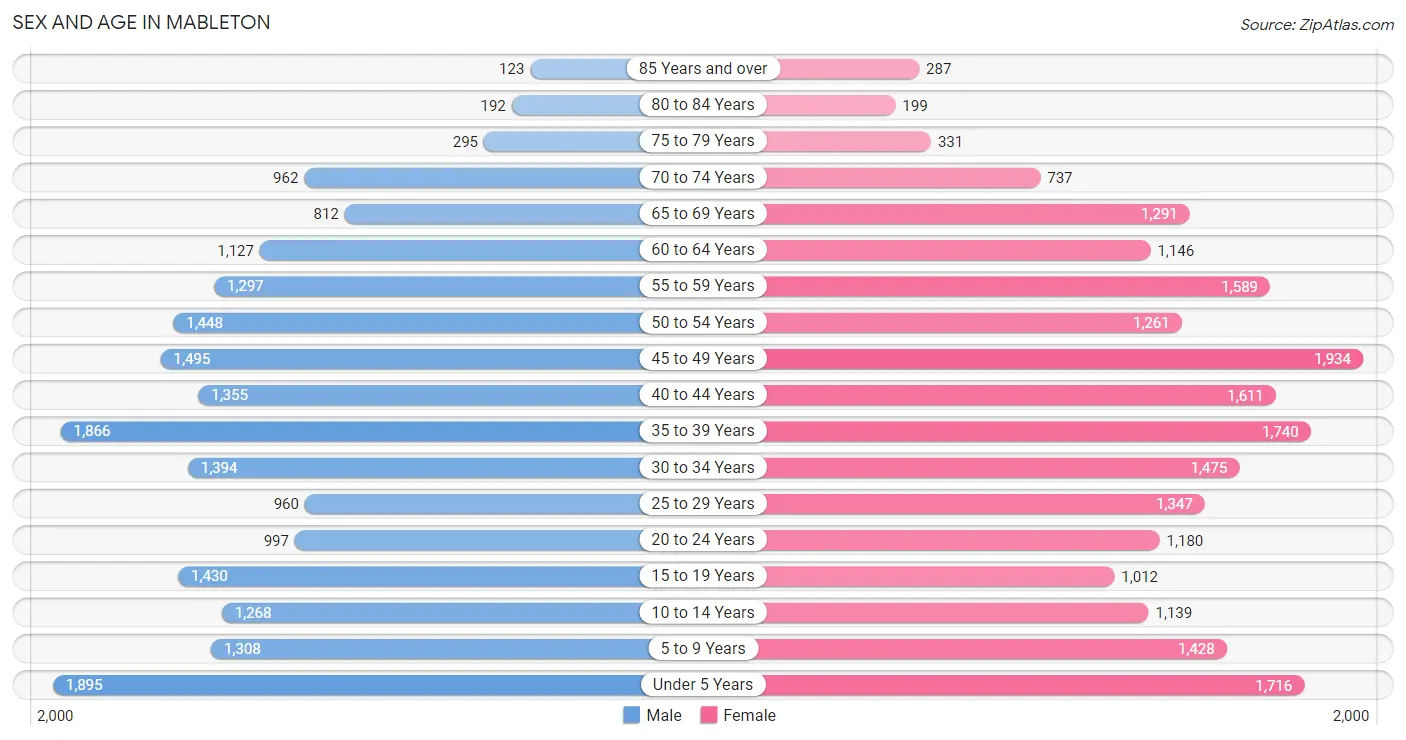
The most populous age groups in Mableton are Under 5 Years (1,895 | 9.4%) for men and 45 to 49 Years (1,934 | 9.0%) for women.
| Age Bracket | Male | Female |
| Under 5 Years | 1,895 (9.4%) | 1,716 (8.0%) |
| 5 to 9 Years | 1,308 (6.5%) | 1,428 (6.7%) |
| 10 to 14 Years | 1,268 (6.3%) | 1,139 (5.3%) |
| 15 to 19 Years | 1,430 (7.1%) | 1,012 (4.7%) |
| 20 to 24 Years | 997 (4.9%) | 1,180 (5.5%) |
| 25 to 29 Years | 960 (4.8%) | 1,347 (6.3%) |
| 30 to 34 Years | 1,394 (6.9%) | 1,475 (6.9%) |
| 35 to 39 Years | 1,866 (9.2%) | 1,740 (8.1%) |
| 40 to 44 Years | 1,355 (6.7%) | 1,611 (7.5%) |
| 45 to 49 Years | 1,495 (7.4%) | 1,934 (9.0%) |
| 50 to 54 Years | 1,448 (7.2%) | 1,261 (5.9%) |
| 55 to 59 Years | 1,297 (6.4%) | 1,589 (7.4%) |
| 60 to 64 Years | 1,127 (5.6%) | 1,146 (5.3%) |
| 65 to 69 Years | 812 (4.0%) | 1,291 (6.0%) |
| 70 to 74 Years | 962 (4.8%) | 737 (3.4%) |
| 75 to 79 Years | 295 (1.5%) | 331 (1.5%) |
| 80 to 84 Years | 192 (0.9%) | 199 (0.9%) |
| 85 Years and over | 123 (0.6%) | 287 (1.3%) |
| Total | 20,224 (100.0%) | 21,423 (100.0%) |
Families and Households in Mableton
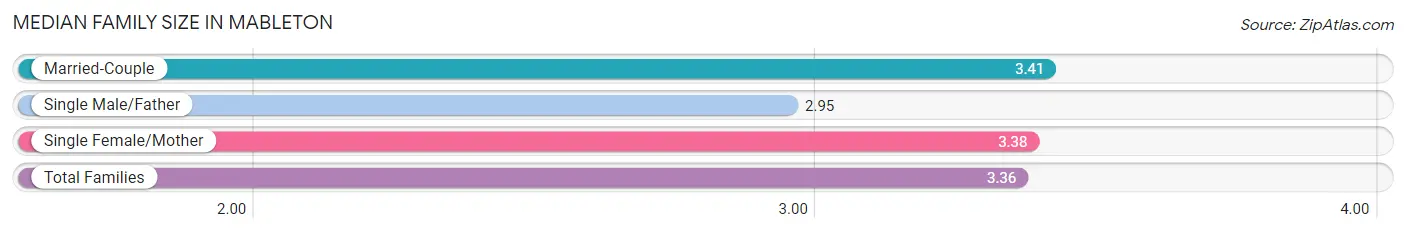
Median Family Size in Mableton
The median family size in Mableton is 3.36 persons per family, with married-couple families (7,586 | 72.4%) accounting for the largest median family size of 3.41 persons per family. On the other hand, single male/father families (921 | 8.8%) represent the smallest median family size with 2.95 persons per family.
| Family Type | # Families | Family Size |
| Married-Couple | 7,586 (72.4%) | 3.41 |
| Single Male/Father | 921 (8.8%) | 2.95 |
| Single Female/Mother | 1,973 (18.8%) | 3.38 |
| Total Families | 10,480 (100.0%) | 3.36 |
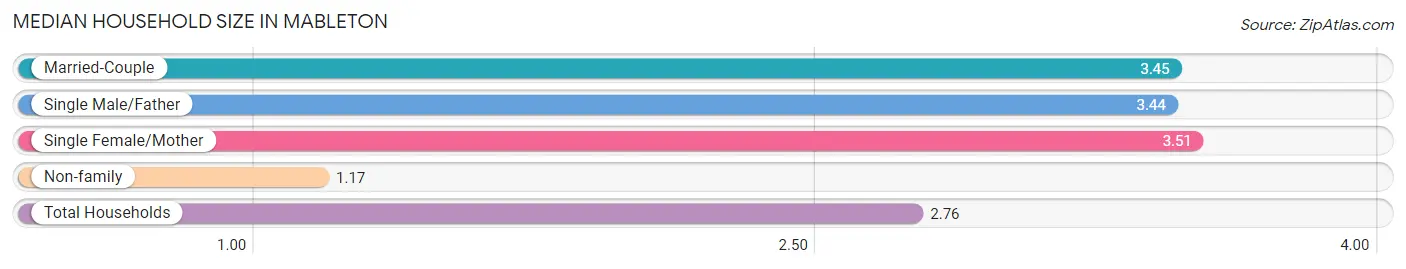
Median Household Size in Mableton
The median household size in Mableton is 2.76 persons per household, with single female/mother households (1,973 | 13.1%) accounting for the largest median household size of 3.51 persons per household. non-family households (4,574 | 30.4%) represent the smallest median household size with 1.17 persons per household.
| Household Type | # Households | Household Size |
| Married-Couple | 7,586 (50.4%) | 3.45 |
| Single Male/Father | 921 (6.1%) | 3.44 |
| Single Female/Mother | 1,973 (13.1%) | 3.51 |
| Non-family | 4,574 (30.4%) | 1.17 |
| Total Households | 15,054 (100.0%) | 2.76 |
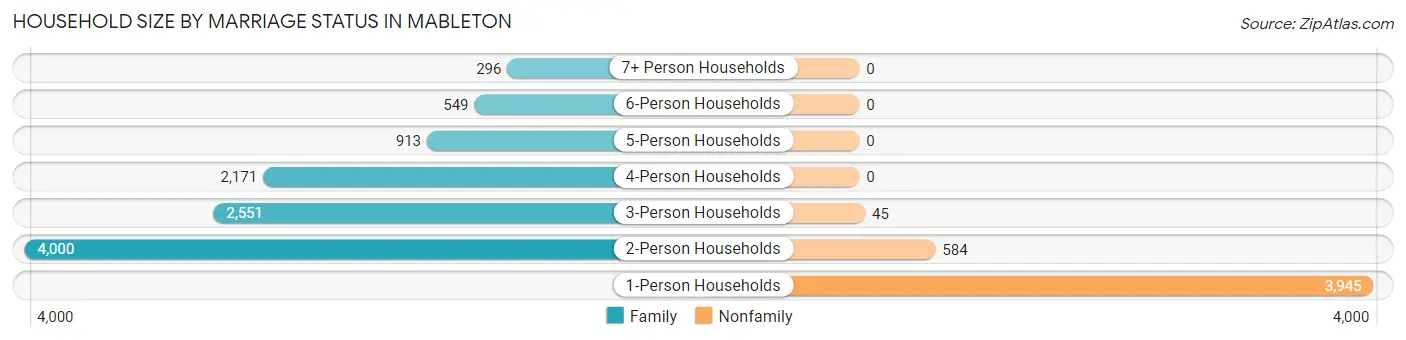
Household Size by Marriage Status in Mableton
Out of a total of 15,054 households in Mableton, 10,480 (69.6%) are family households, while 4,574 (30.4%) are nonfamily households. The most numerous type of family households are 2-person households, comprising 4,000, and the most common type of nonfamily households are 1-person households, comprising 3,945.
| Household Size | Family Households | Nonfamily Households |
| 1-Person Households | - | 3,945 (26.2%) |
| 2-Person Households | 4,000 (26.6%) | 584 (3.9%) |
| 3-Person Households | 2,551 (17.0%) | 45 (0.3%) |
| 4-Person Households | 2,171 (14.4%) | 0 (0.0%) |
| 5-Person Households | 913 (6.1%) | 0 (0.0%) |
| 6-Person Households | 549 (3.6%) | 0 (0.0%) |
| 7+ Person Households | 296 (2.0%) | 0 (0.0%) |
| Total | 10,480 (69.6%) | 4,574 (30.4%) |
Female Fertility in Mableton
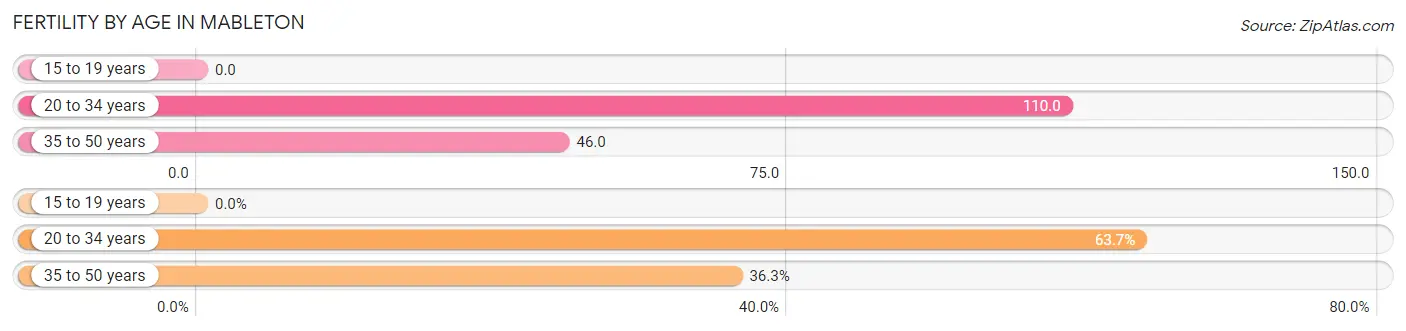
Fertility by Age in Mableton
Average fertility rate in Mableton is 66.0 births per 1,000 women. Women in the age bracket of 20 to 34 years have the highest fertility rate with 110.0 births per 1,000 women. Women in the age bracket of 20 to 34 years acount for 63.7% of all women with births.
| Age Bracket | Women with Births | Births / 1,000 Women |
| 15 to 19 years | 0 (0.0%) | 0.0 |
| 20 to 34 years | 441 (63.7%) | 110.0 |
| 35 to 50 years | 251 (36.3%) | 46.0 |
| Total | 692 (100.0%) | 66.0 |
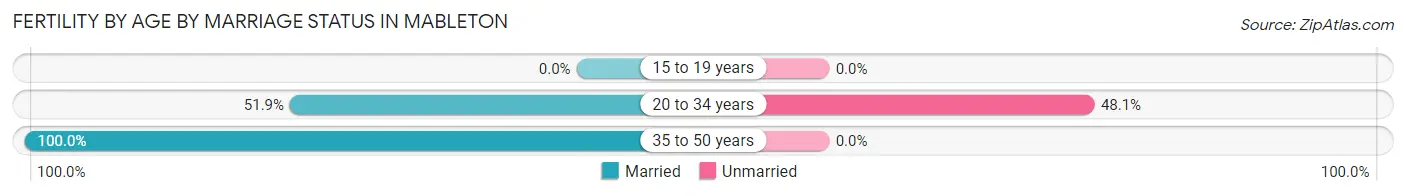
Fertility by Age by Marriage Status in Mableton
69.4% of women with births (692) in Mableton are married. The highest percentage of unmarried women with births falls into 20 to 34 years age bracket with 48.1% of them unmarried at the time of birth, while the lowest percentage of unmarried women with births belong to 35 to 50 years age bracket with 0.0% of them unmarried.
| Age Bracket | Married | Unmarried |
| 15 to 19 years | 0 (0.0%) | 0 (0.0%) |
| 20 to 34 years | 229 (51.9%) | 212 (48.1%) |
| 35 to 50 years | 251 (100.0%) | 0 (0.0%) |
| Total | 480 (69.4%) | 212 (30.6%) |
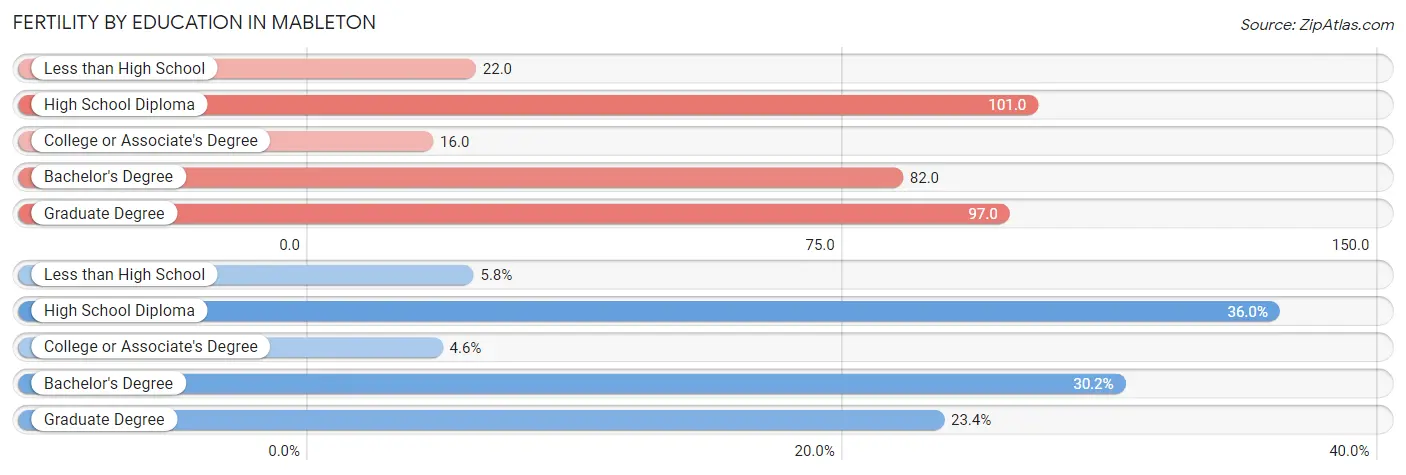
Fertility by Education in Mableton
Average fertility rate in Mableton is 66.0 births per 1,000 women. Women with the education attainment of high school diploma have the highest fertility rate of 101.0 births per 1,000 women, while women with the education attainment of college or associate's degree have the lowest fertility at 16.0 births per 1,000 women. Women with the education attainment of high school diploma represent 36.0% of all women with births.
| Educational Attainment | Women with Births | Births / 1,000 Women |
| Less than High School | 40 (5.8%) | 22.0 |
| High School Diploma | 249 (36.0%) | 101.0 |
| College or Associate's Degree | 32 (4.6%) | 16.0 |
| Bachelor's Degree | 209 (30.2%) | 82.0 |
| Graduate Degree | 162 (23.4%) | 97.0 |
| Total | 692 (100.0%) | 66.0 |
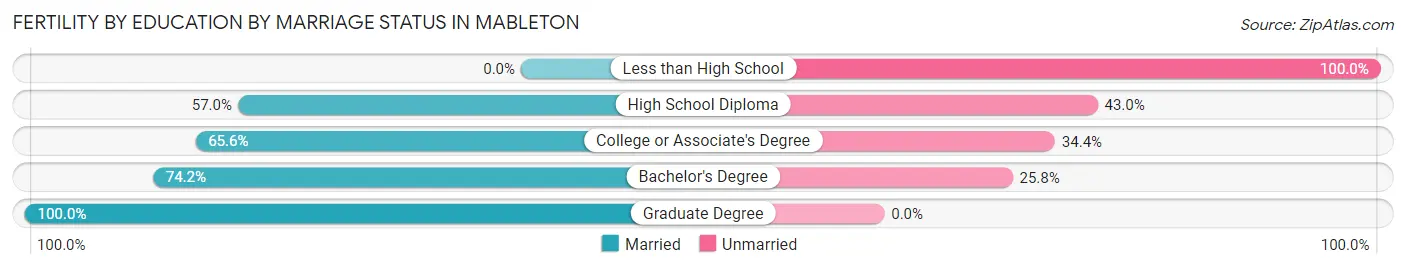
Fertility by Education by Marriage Status in Mableton
30.6% of women with births in Mableton are unmarried. Women with the educational attainment of graduate degree are most likely to be married with 100.0% of them married at childbirth, while women with the educational attainment of less than high school are least likely to be married with 100.0% of them unmarried at childbirth.
| Educational Attainment | Married | Unmarried |
| Less than High School | 0 (0.0%) | 40 (100.0%) |
| High School Diploma | 142 (57.0%) | 107 (43.0%) |
| College or Associate's Degree | 21 (65.6%) | 11 (34.4%) |
| Bachelor's Degree | 155 (74.2%) | 54 (25.8%) |
| Graduate Degree | 162 (100.0%) | 0 (0.0%) |
| Total | 480 (69.4%) | 212 (30.6%) |
Income in Mableton
Income Overview in Mableton
Per Capita Income in Mableton is $39,584, while median incomes of families and households are $99,815 and $79,069 respectively.
| Characteristic | Number | Measure |
| Per Capita Income | 41,647 | $39,584 |
| Median Family Income | 10,480 | $99,815 |
| Mean Family Income | 10,480 | $121,249 |
| Median Household Income | 15,054 | $79,069 |
| Mean Household Income | 15,054 | $106,227 |
| Income Deficit | 10,480 | $12,015 |
| Wage / Income Gap (%) | 41,647 | 8.03% |
| Wage / Income Gap ($) | 41,647 | 91.97¢ per $1 |
| Gini / Inequality Index | 41,647 | 0.42 |
Earnings by Sex in Mableton
Average Earnings in Mableton are $45,086, $46,386 for men and $42,659 for women, a difference of 8.0%.
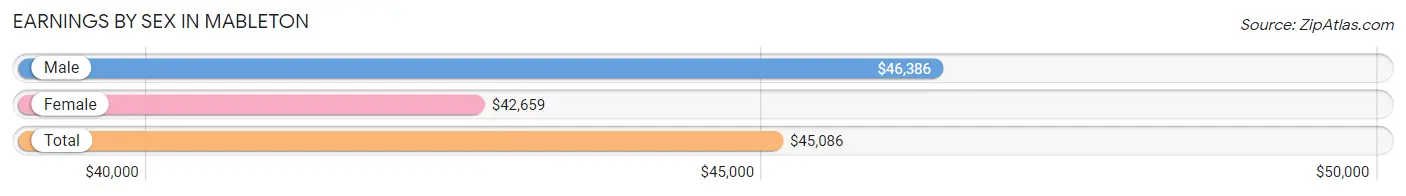
| Sex | Number | Average Earnings |
| Male | 11,948 (50.8%) | $46,386 |
| Female | 11,557 (49.2%) | $42,659 |
| Total | 23,505 (100.0%) | $45,086 |
Earnings by Sex by Income Bracket in Mableton
The most common earnings brackets in Mableton are $100,000+ for men (2,624 | 22.0%) and $100,000+ for women (1,553 | 13.4%).
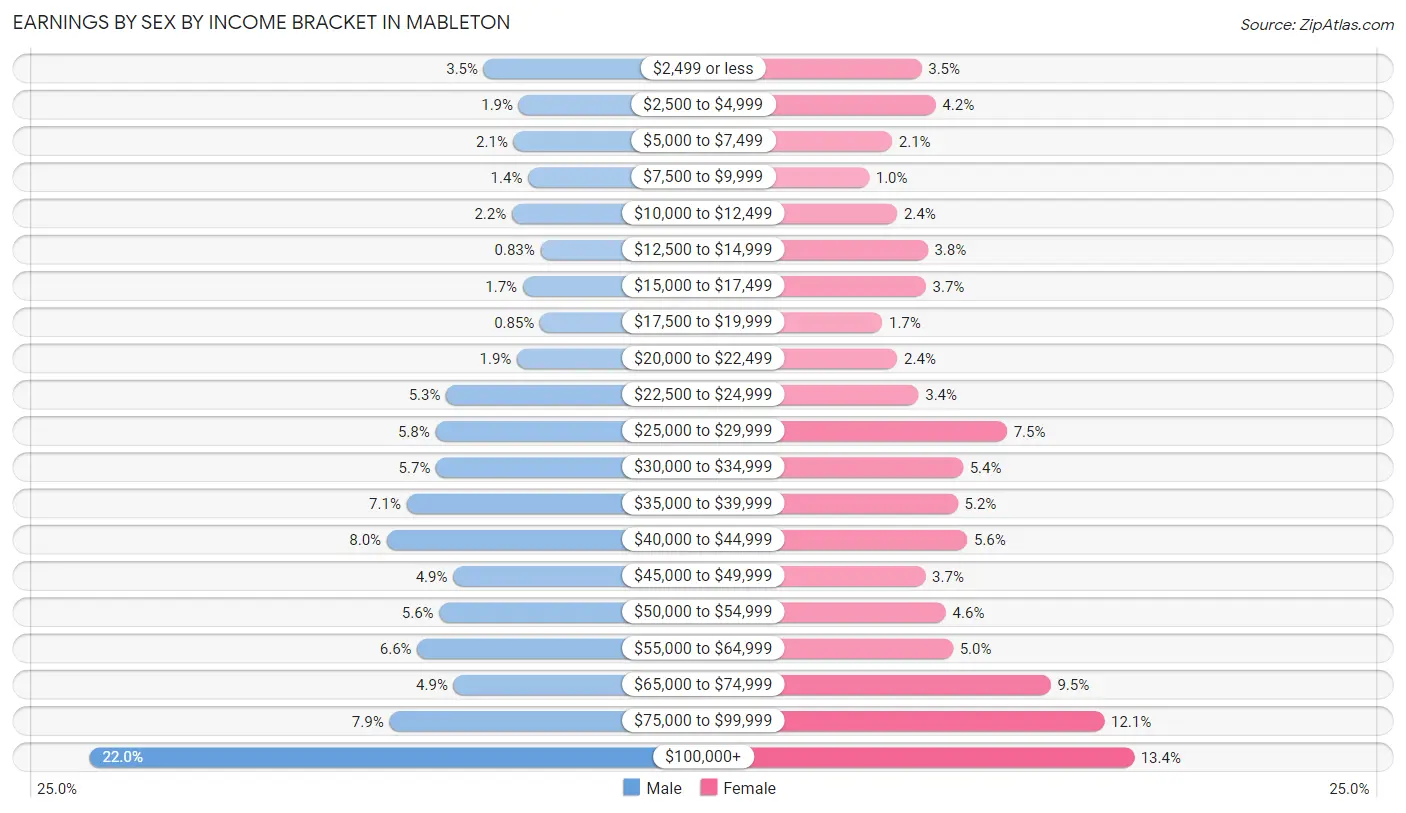
| Income | Male | Female |
| $2,499 or less | 417 (3.5%) | 403 (3.5%) |
| $2,500 to $4,999 | 221 (1.8%) | 480 (4.2%) |
| $5,000 to $7,499 | 250 (2.1%) | 244 (2.1%) |
| $7,500 to $9,999 | 169 (1.4%) | 119 (1.0%) |
| $10,000 to $12,499 | 259 (2.2%) | 272 (2.4%) |
| $12,500 to $14,999 | 99 (0.8%) | 437 (3.8%) |
| $15,000 to $17,499 | 198 (1.7%) | 427 (3.7%) |
| $17,500 to $19,999 | 101 (0.9%) | 191 (1.7%) |
| $20,000 to $22,499 | 230 (1.9%) | 273 (2.4%) |
| $22,500 to $24,999 | 627 (5.2%) | 387 (3.4%) |
| $25,000 to $29,999 | 687 (5.8%) | 866 (7.5%) |
| $30,000 to $34,999 | 684 (5.7%) | 627 (5.4%) |
| $35,000 to $39,999 | 848 (7.1%) | 600 (5.2%) |
| $40,000 to $44,999 | 960 (8.0%) | 651 (5.6%) |
| $45,000 to $49,999 | 588 (4.9%) | 424 (3.7%) |
| $50,000 to $54,999 | 666 (5.6%) | 535 (4.6%) |
| $55,000 to $64,999 | 789 (6.6%) | 573 (5.0%) |
| $65,000 to $74,999 | 586 (4.9%) | 1,102 (9.5%) |
| $75,000 to $99,999 | 945 (7.9%) | 1,393 (12.0%) |
| $100,000+ | 2,624 (22.0%) | 1,553 (13.4%) |
| Total | 11,948 (100.0%) | 11,557 (100.0%) |
Earnings by Sex by Educational Attainment in Mableton
Average earnings in Mableton are $51,676 for men and $47,010 for women, a difference of 9.0%. Men with an educational attainment of graduate degree enjoy the highest average annual earnings of $101,094, while those with less than high school education earn the least with $39,249. Women with an educational attainment of graduate degree earn the most with the average annual earnings of $77,092, while those with high school diploma education have the smallest earnings of $25,805.
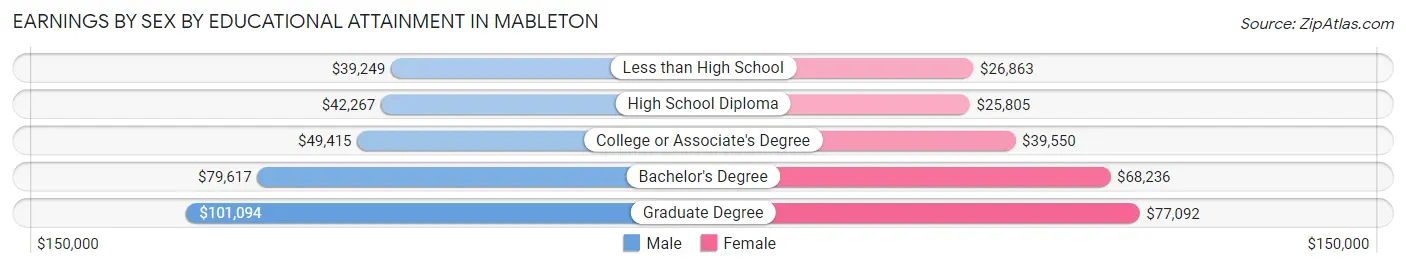
| Educational Attainment | Male Income | Female Income |
| Less than High School | $39,249 | $26,863 |
| High School Diploma | $42,267 | $25,805 |
| College or Associate's Degree | $49,415 | $39,550 |
| Bachelor's Degree | $79,617 | $68,236 |
| Graduate Degree | $101,094 | $77,092 |
| Total | $51,676 | $47,010 |
Family Income in Mableton
Family Income Brackets in Mableton
According to the Mableton family income data, there are 2,138 families falling into the $100,000 to $149,999 income range, which is the most common income bracket and makes up 20.4% of all families. Conversely, the $10,000 to $14,999 income bracket is the least frequent group with only 147 families (1.4%) belonging to this category.
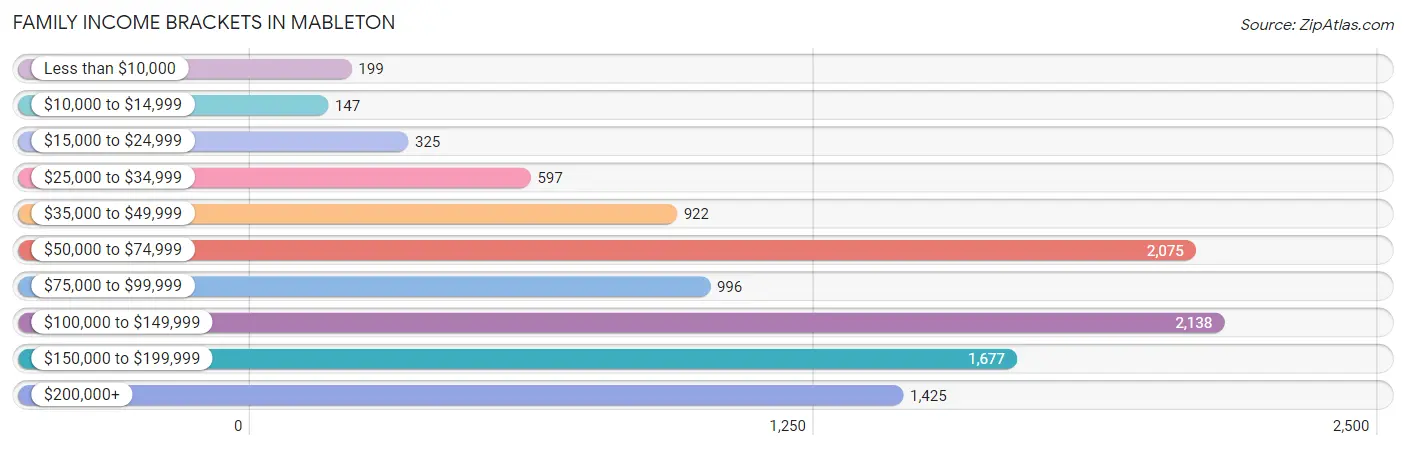
| Income Bracket | # Families | % Families |
| Less than $10,000 | 199 | 1.9% |
| $10,000 to $14,999 | 147 | 1.4% |
| $15,000 to $24,999 | 325 | 3.1% |
| $25,000 to $34,999 | 597 | 5.7% |
| $35,000 to $49,999 | 922 | 8.8% |
| $50,000 to $74,999 | 2,075 | 19.8% |
| $75,000 to $99,999 | 996 | 9.5% |
| $100,000 to $149,999 | 2,138 | 20.4% |
| $150,000 to $199,999 | 1,677 | 16.0% |
| $200,000+ | 1,425 | 13.6% |
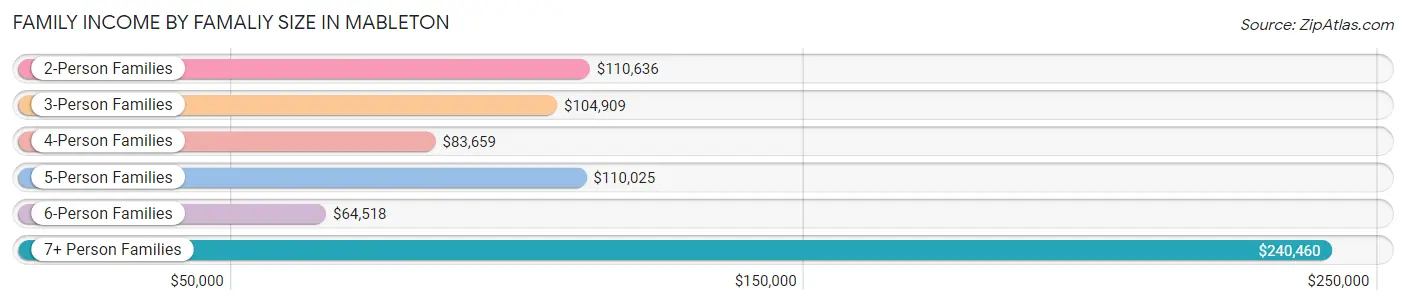
Family Income by Famaliy Size in Mableton
7+ person families (265 | 2.5%) account for the highest median family income in Mableton with $240,460 per family, while 2-person families (4,245 | 40.5%) have the highest median income of $55,318 per family member.
| Income Bracket | # Families | Median Income |
| 2-Person Families | 4,245 (40.5%) | $110,636 |
| 3-Person Families | 2,681 (25.6%) | $104,909 |
| 4-Person Families | 1,916 (18.3%) | $83,659 |
| 5-Person Families | 909 (8.7%) | $110,025 |
| 6-Person Families | 464 (4.4%) | $64,518 |
| 7+ Person Families | 265 (2.5%) | $240,460 |
| Total | 10,480 (100.0%) | $99,815 |
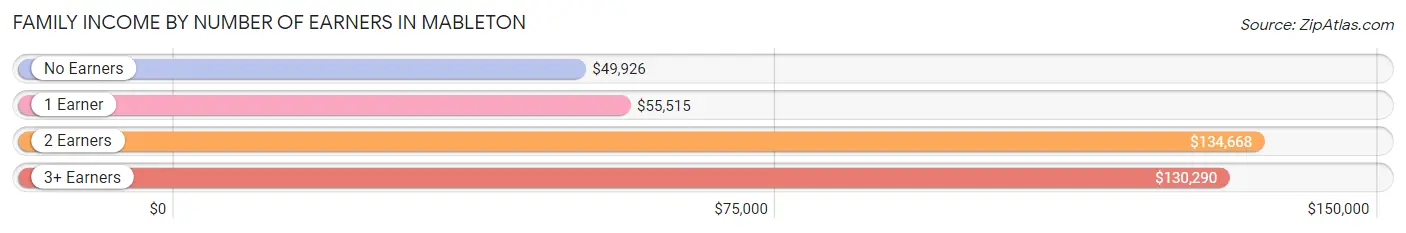
Family Income by Number of Earners in Mableton
The median family income in Mableton is $99,815, with families comprising 2 earners (4,717) having the highest median family income of $134,668, while families with no earners (950) have the lowest median family income of $49,926, accounting for 45.0% and 9.1% of families, respectively.
| Number of Earners | # Families | Median Income |
| No Earners | 950 (9.1%) | $49,926 |
| 1 Earner | 3,137 (29.9%) | $55,515 |
| 2 Earners | 4,717 (45.0%) | $134,668 |
| 3+ Earners | 1,676 (16.0%) | $130,290 |
| Total | 10,480 (100.0%) | $99,815 |
Household Income in Mableton
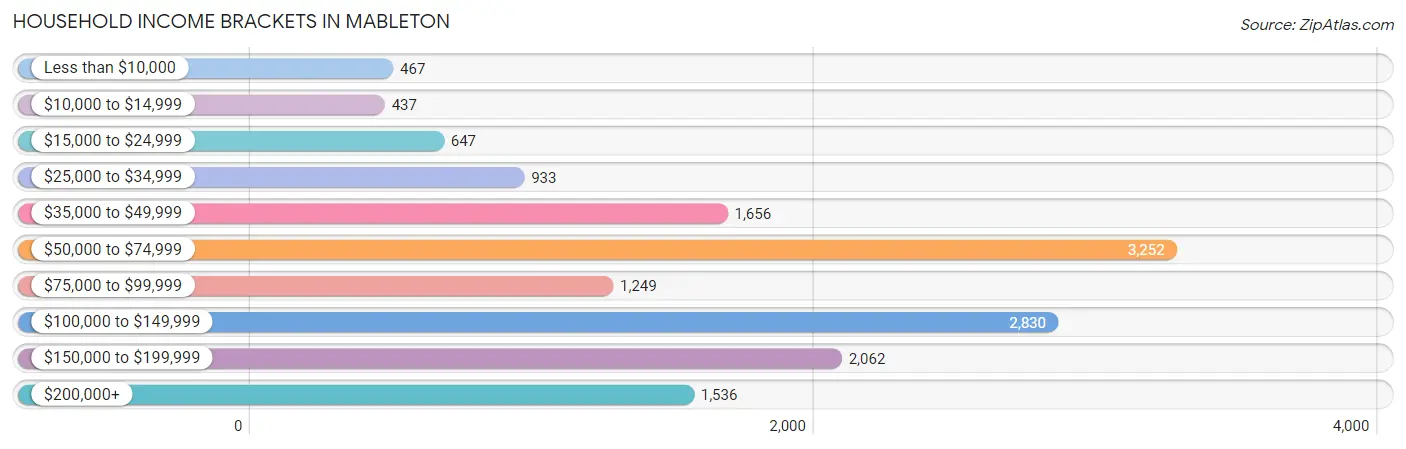
Household Income Brackets in Mableton
With 3,252 households falling in the category, the $50,000 to $74,999 income range is the most frequent in Mableton, accounting for 21.6% of all households. In contrast, only 437 households (2.9%) fall into the $10,000 to $14,999 income bracket, making it the least populous group.
| Income Bracket | # Households | % Households |
| Less than $10,000 | 467 | 3.1% |
| $10,000 to $14,999 | 437 | 2.9% |
| $15,000 to $24,999 | 647 | 4.3% |
| $25,000 to $34,999 | 933 | 6.2% |
| $35,000 to $49,999 | 1,656 | 11.0% |
| $50,000 to $74,999 | 3,252 | 21.6% |
| $75,000 to $99,999 | 1,249 | 8.3% |
| $100,000 to $149,999 | 2,830 | 18.8% |
| $150,000 to $199,999 | 2,062 | 13.7% |
| $200,000+ | 1,536 | 10.2% |
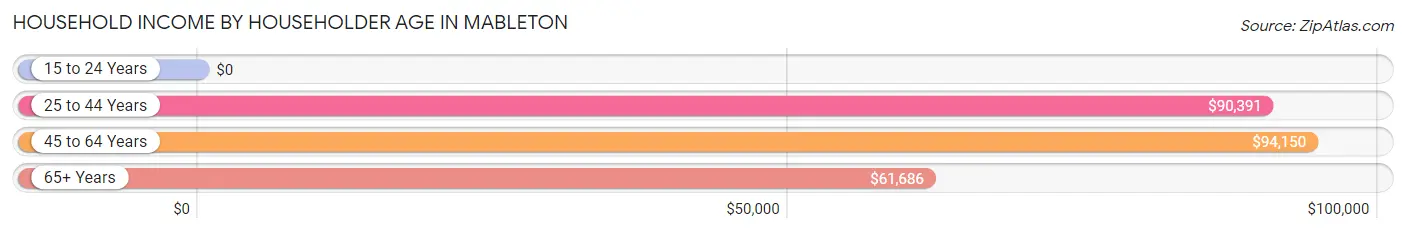
Household Income by Householder Age in Mableton
The median household income in Mableton is $79,069, with the highest median household income of $94,150 found in the 45 to 64 years age bracket for the primary householder. A total of 6,388 households (42.4%) fall into this category. Meanwhile, the 15 to 24 years age bracket for the primary householder has the lowest median household income of $0, with 372 households (2.5%) in this group.
| Income Bracket | # Households | Median Income |
| 15 to 24 Years | 372 (2.5%) | $0 |
| 25 to 44 Years | 5,716 (38.0%) | $90,391 |
| 45 to 64 Years | 6,388 (42.4%) | $94,150 |
| 65+ Years | 2,578 (17.1%) | $61,686 |
| Total | 15,054 (100.0%) | $79,069 |
Poverty in Mableton
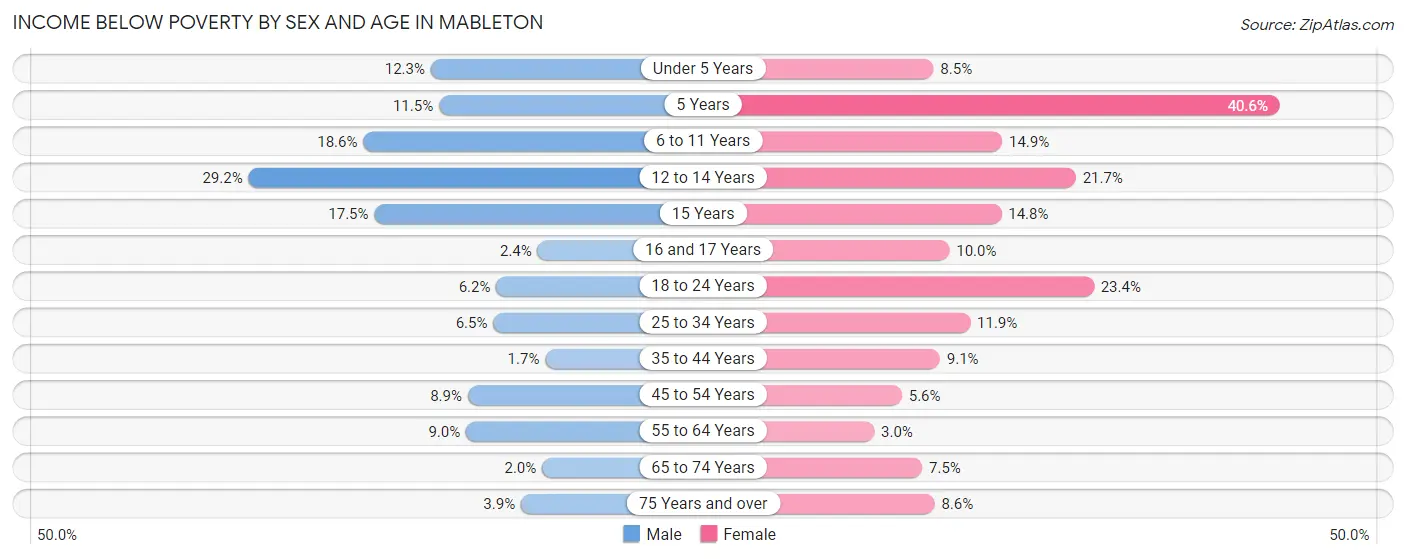
Income Below Poverty by Sex and Age in Mableton
With 8.3% poverty level for males and 10.1% for females among the residents of Mableton, 12 to 14 year old males and 5 year old females are the most vulnerable to poverty, with 206 males (29.2%) and 76 females (40.6%) in their respective age groups living below the poverty level.
| Age Bracket | Male | Female |
| Under 5 Years | 233 (12.3%) | 141 (8.5%) |
| 5 Years | 27 (11.5%) | 76 (40.6%) |
| 6 to 11 Years | 302 (18.6%) | 236 (14.9%) |
| 12 to 14 Years | 206 (29.2%) | 150 (21.7%) |
| 15 Years | 37 (17.5%) | 41 (14.8%) |
| 16 and 17 Years | 13 (2.4%) | 49 (10.0%) |
| 18 to 24 Years | 104 (6.2%) | 333 (23.4%) |
| 25 to 34 Years | 153 (6.5%) | 336 (11.9%) |
| 35 to 44 Years | 54 (1.7%) | 305 (9.1%) |
| 45 to 54 Years | 261 (8.9%) | 178 (5.6%) |
| 55 to 64 Years | 219 (9.0%) | 82 (3.0%) |
| 65 to 74 Years | 35 (2.0%) | 151 (7.4%) |
| 75 Years and over | 24 (3.9%) | 70 (8.6%) |
| Total | 1,668 (8.3%) | 2,148 (10.1%) |
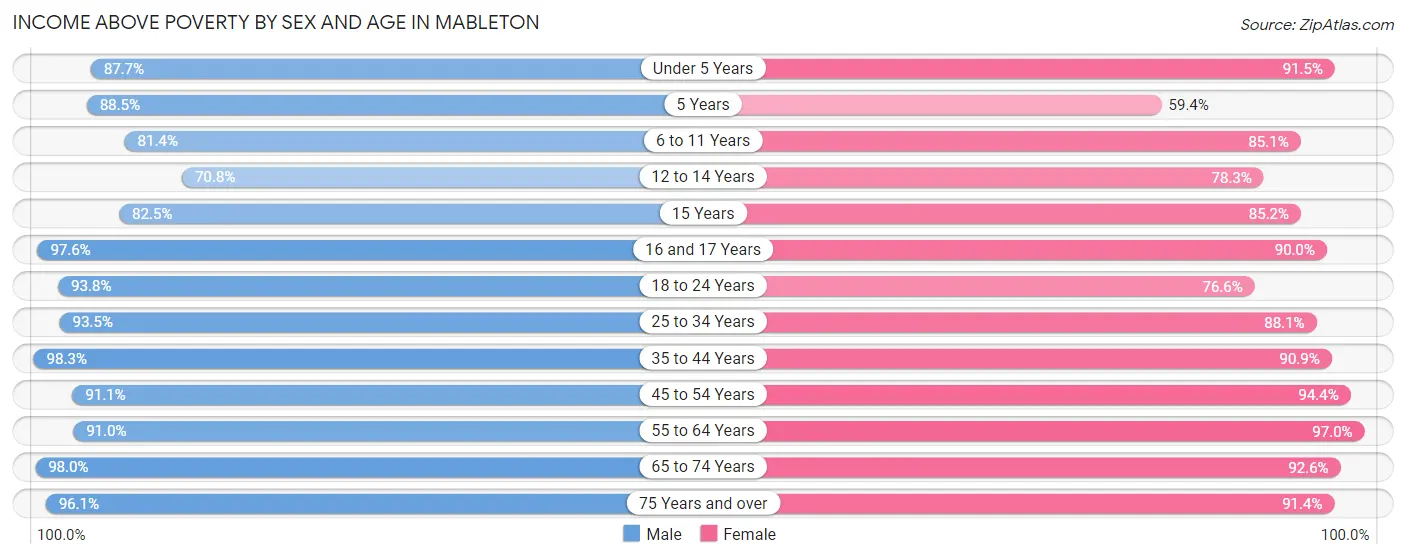
Income Above Poverty by Sex and Age in Mableton
According to the poverty statistics in Mableton, males aged 35 to 44 years and females aged 55 to 64 years are the age groups that are most secure financially, with 98.3% of males and 97.0% of females in these age groups living above the poverty line.
| Age Bracket | Male | Female |
| Under 5 Years | 1,662 (87.7%) | 1,518 (91.5%) |
| 5 Years | 207 (88.5%) | 111 (59.4%) |
| 6 to 11 Years | 1,324 (81.4%) | 1,351 (85.1%) |
| 12 to 14 Years | 499 (70.8%) | 541 (78.3%) |
| 15 Years | 174 (82.5%) | 236 (85.2%) |
| 16 and 17 Years | 531 (97.6%) | 442 (90.0%) |
| 18 to 24 Years | 1,568 (93.8%) | 1,091 (76.6%) |
| 25 to 34 Years | 2,201 (93.5%) | 2,486 (88.1%) |
| 35 to 44 Years | 3,167 (98.3%) | 3,046 (90.9%) |
| 45 to 54 Years | 2,682 (91.1%) | 3,017 (94.4%) |
| 55 to 64 Years | 2,205 (91.0%) | 2,651 (97.0%) |
| 65 to 74 Years | 1,739 (98.0%) | 1,875 (92.5%) |
| 75 Years and over | 586 (96.1%) | 744 (91.4%) |
| Total | 18,545 (91.7%) | 19,109 (89.9%) |
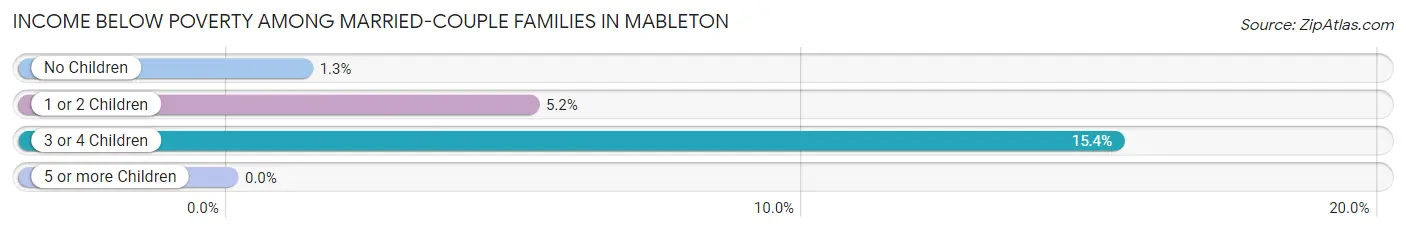
Income Below Poverty Among Married-Couple Families in Mableton
The poverty statistics for married-couple families in Mableton show that 4.1% or 308 of the total 7,586 families live below the poverty line. Families with 3 or 4 children have the highest poverty rate of 15.4%, comprising of 128 families. On the other hand, families with 5 or more children have the lowest poverty rate of 0.0%, which includes 0 families.
| Children | Above Poverty | Below Poverty |
| No Children | 4,246 (98.7%) | 56 (1.3%) |
| 1 or 2 Children | 2,241 (94.8%) | 124 (5.2%) |
| 3 or 4 Children | 702 (84.6%) | 128 (15.4%) |
| 5 or more Children | 89 (100.0%) | 0 (0.0%) |
| Total | 7,278 (95.9%) | 308 (4.1%) |
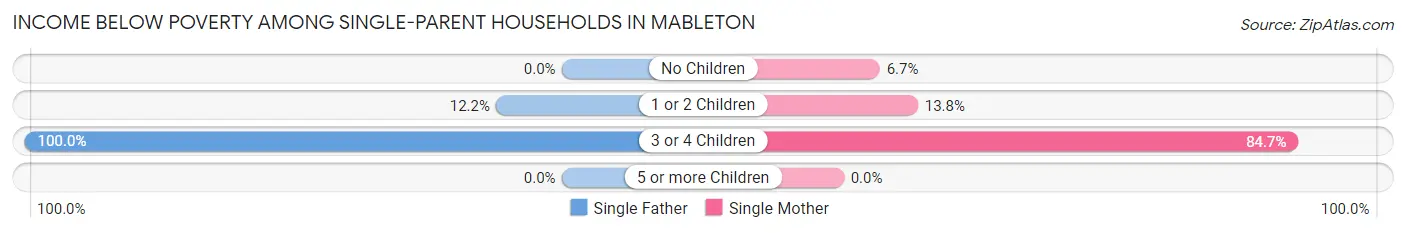
Income Below Poverty Among Single-Parent Households in Mableton
According to the poverty data in Mableton, 7.5% or 69 single-father households and 16.9% or 333 single-mother households are living below the poverty line. Among single-father households, those with 3 or 4 children have the highest poverty rate, with 17 households (100.0%) experiencing poverty. Likewise, among single-mother households, those with 3 or 4 children have the highest poverty rate, with 138 households (84.7%) falling below the poverty line.
| Children | Single Father | Single Mother |
| No Children | 0 (0.0%) | 52 (6.7%) |
| 1 or 2 Children | 52 (12.2%) | 143 (13.8%) |
| 3 or 4 Children | 17 (100.0%) | 138 (84.7%) |
| 5 or more Children | 0 (0.0%) | 0 (0.0%) |
| Total | 69 (7.5%) | 333 (16.9%) |
Income Below Poverty Among Married-Couple vs Single-Parent Households in Mableton
The poverty data for Mableton shows that 308 of the married-couple family households (4.1%) and 402 of the single-parent households (13.9%) are living below the poverty level. Within the married-couple family households, those with 3 or 4 children have the highest poverty rate, with 128 households (15.4%) falling below the poverty line. Among the single-parent households, those with 3 or 4 children have the highest poverty rate, with 155 household (86.1%) living below poverty.
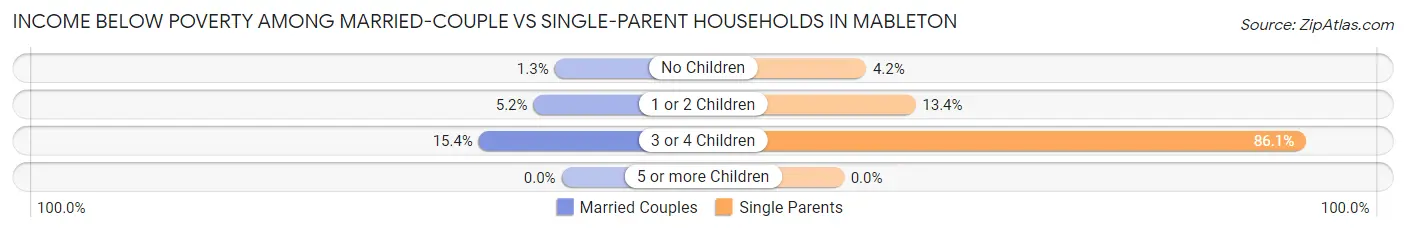
| Children | Married-Couple Families | Single-Parent Households |
| No Children | 56 (1.3%) | 52 (4.2%) |
| 1 or 2 Children | 124 (5.2%) | 195 (13.4%) |
| 3 or 4 Children | 128 (15.4%) | 155 (86.1%) |
| 5 or more Children | 0 (0.0%) | 0 (0.0%) |
| Total | 308 (4.1%) | 402 (13.9%) |
Employment Characteristics in Mableton
Employment by Class of Employer in Mableton
Among the 21,178 employed individuals in Mableton, private company employees (15,153 | 71.6%), not-for-profit organizations (1,737 | 8.2%), and self-employed (incorporated) (1,057 | 5.0%) make up the most common classes of employment.
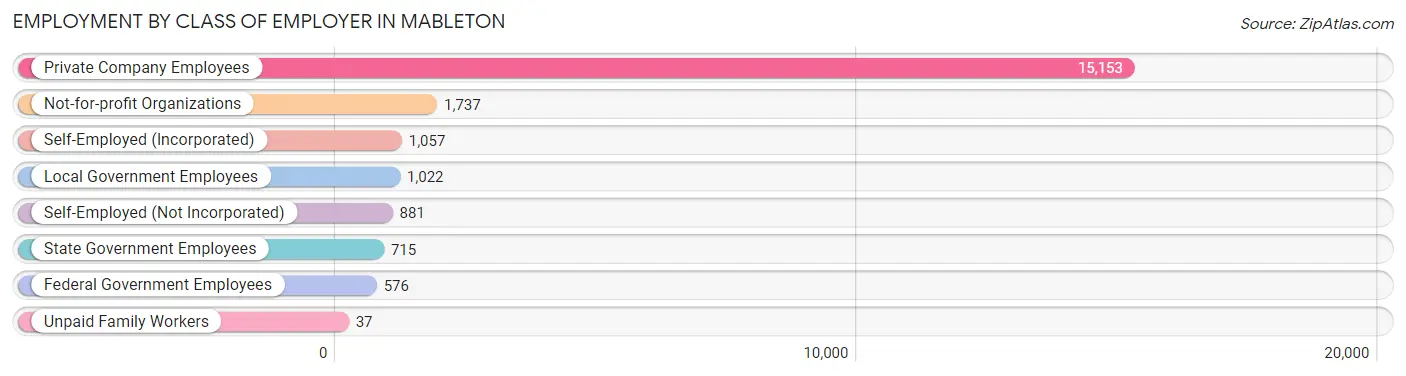
| Employer Class | # Employees | % Employees |
| Private Company Employees | 15,153 | 71.6% |
| Self-Employed (Incorporated) | 1,057 | 5.0% |
| Self-Employed (Not Incorporated) | 881 | 4.2% |
| Not-for-profit Organizations | 1,737 | 8.2% |
| Local Government Employees | 1,022 | 4.8% |
| State Government Employees | 715 | 3.4% |
| Federal Government Employees | 576 | 2.7% |
| Unpaid Family Workers | 37 | 0.2% |
| Total | 21,178 | 100.0% |
Employment Status by Age in Mableton
According to the labor force statistics for Mableton, out of the total population over 16 years of age (32,405), 72.4% or 23,461 individuals are in the labor force, with 6.7% or 1,572 of them unemployed. The age group with the highest labor force participation rate is 30 to 34 years, with 96.0% or 2,754 individuals in the labor force. Within the labor force, the 25 to 29 years age range has the highest percentage of unemployed individuals, with 13.6% or 266 of them being unemployed.
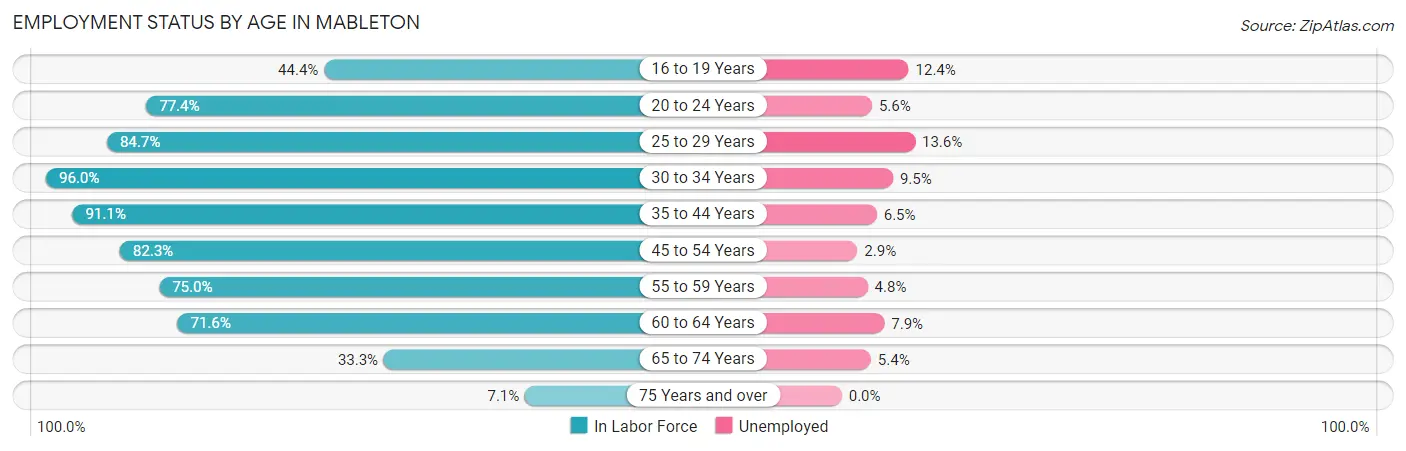
| Age Bracket | In Labor Force | Unemployed |
| 16 to 19 Years | 868 (44.4%) | 108 (12.4%) |
| 20 to 24 Years | 1,685 (77.4%) | 94 (5.6%) |
| 25 to 29 Years | 1,954 (84.7%) | 266 (13.6%) |
| 30 to 34 Years | 2,754 (96.0%) | 262 (9.5%) |
| 35 to 44 Years | 5,987 (91.1%) | 389 (6.5%) |
| 45 to 54 Years | 5,052 (82.3%) | 147 (2.9%) |
| 55 to 59 Years | 2,164 (75.0%) | 104 (4.8%) |
| 60 to 64 Years | 1,627 (71.6%) | 129 (7.9%) |
| 65 to 74 Years | 1,266 (33.3%) | 68 (5.4%) |
| 75 Years and over | 101 (7.1%) | 0 (0.0%) |
| Total | 23,461 (72.4%) | 1,572 (6.7%) |
Employment Status by Educational Attainment in Mableton
According to labor force statistics for Mableton, 84.8% of individuals (19,542) out of the total population between 25 and 64 years of age (23,045) are in the labor force, with 6.6% or 1,290 of them being unemployed. The group with the highest labor force participation rate are those with the educational attainment of bachelor's degree or higher, with 89.7% or 8,269 individuals in the labor force. Within the labor force, individuals with less than high school education have the highest percentage of unemployment, with 10.1% or 207 of them being unemployed.
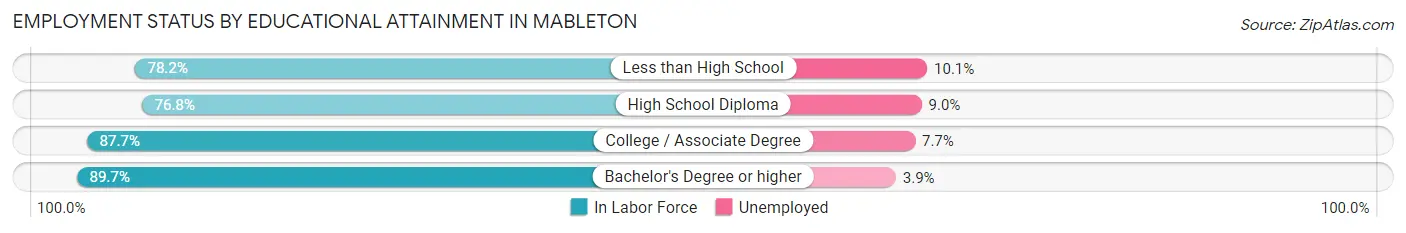
| Educational Attainment | In Labor Force | Unemployed |
| Less than High School | 2,052 (78.2%) | 265 (10.1%) |
| High School Diploma | 4,243 (76.8%) | 497 (9.0%) |
| College / Associate Degree | 4,980 (87.7%) | 437 (7.7%) |
| Bachelor's Degree or higher | 8,269 (89.7%) | 360 (3.9%) |
| Total | 19,542 (84.8%) | 1,521 (6.6%) |
Employment Occupations by Sex in Mableton
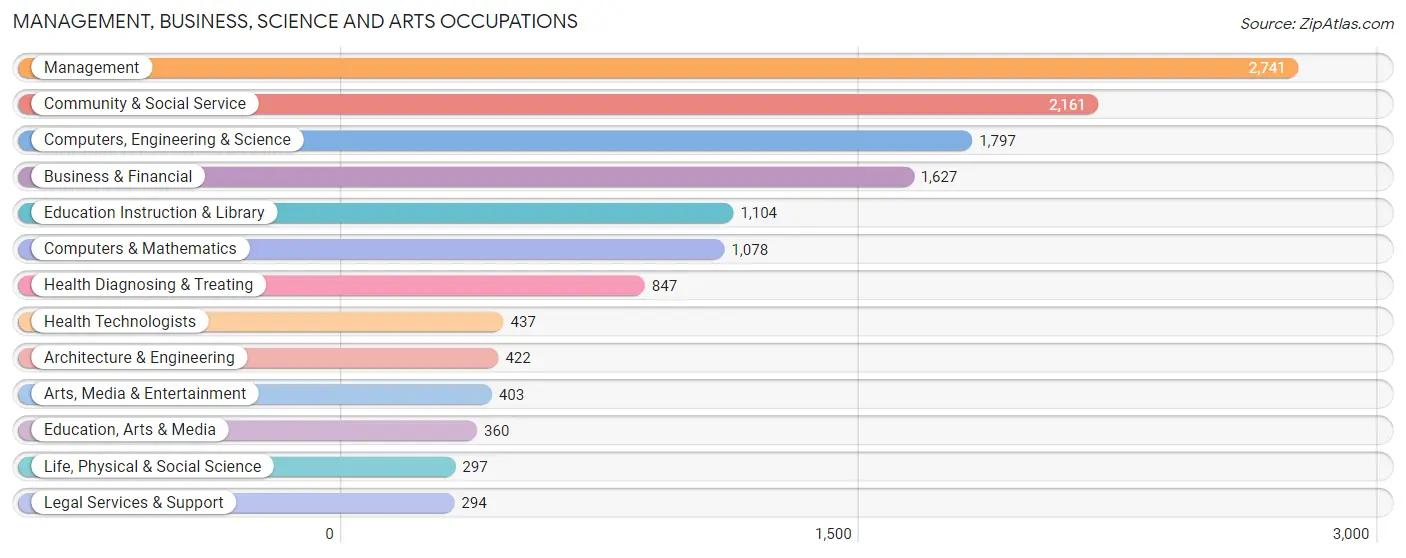
Management, Business, Science and Arts Occupations
The most common Management, Business, Science and Arts occupations in Mableton are Management (2,741 | 12.5%), Community & Social Service (2,161 | 9.9%), Computers, Engineering & Science (1,797 | 8.2%), Business & Financial (1,627 | 7.4%), and Education Instruction & Library (1,104 | 5.1%).
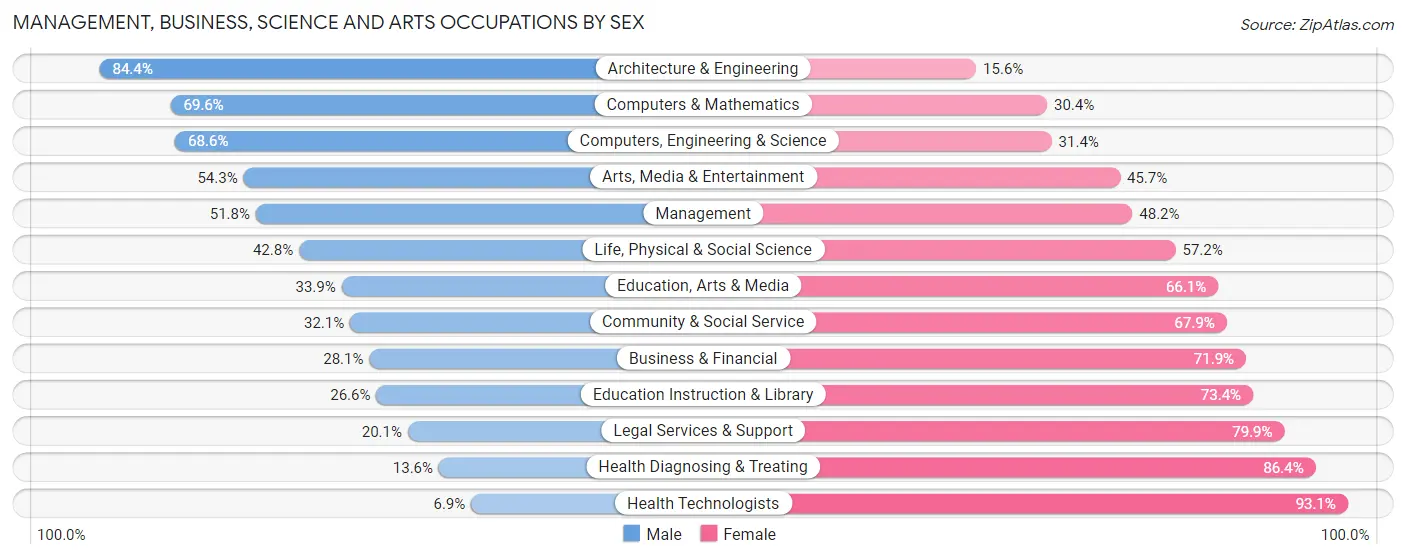
Management, Business, Science and Arts Occupations by Sex
Within the Management, Business, Science and Arts occupations in Mableton, the most male-oriented occupations are Architecture & Engineering (84.4%), Computers & Mathematics (69.6%), and Computers, Engineering & Science (68.6%), while the most female-oriented occupations are Health Technologists (93.1%), Health Diagnosing & Treating (86.4%), and Legal Services & Support (79.9%).
| Occupation | Male | Female |
| Management | 1,419 (51.8%) | 1,322 (48.2%) |
| Business & Financial | 457 (28.1%) | 1,170 (71.9%) |
| Computers, Engineering & Science | 1,233 (68.6%) | 564 (31.4%) |
| Computers & Mathematics | 750 (69.6%) | 328 (30.4%) |
| Architecture & Engineering | 356 (84.4%) | 66 (15.6%) |
| Life, Physical & Social Science | 127 (42.8%) | 170 (57.2%) |
| Community & Social Service | 694 (32.1%) | 1,467 (67.9%) |
| Education, Arts & Media | 122 (33.9%) | 238 (66.1%) |
| Legal Services & Support | 59 (20.1%) | 235 (79.9%) |
| Education Instruction & Library | 294 (26.6%) | 810 (73.4%) |
| Arts, Media & Entertainment | 219 (54.3%) | 184 (45.7%) |
| Health Diagnosing & Treating | 115 (13.6%) | 732 (86.4%) |
| Health Technologists | 30 (6.9%) | 407 (93.1%) |
| Total (Category) | 3,918 (42.7%) | 5,255 (57.3%) |
| Total (Overall) | 11,309 (51.7%) | 10,573 (48.3%) |
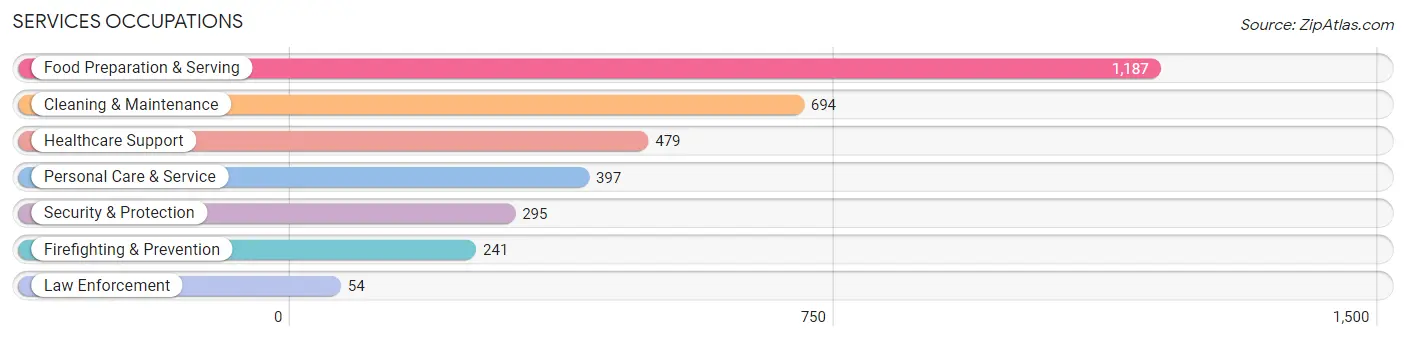
Services Occupations
The most common Services occupations in Mableton are Food Preparation & Serving (1,187 | 5.4%), Cleaning & Maintenance (694 | 3.2%), Healthcare Support (479 | 2.2%), Personal Care & Service (397 | 1.8%), and Security & Protection (295 | 1.3%).
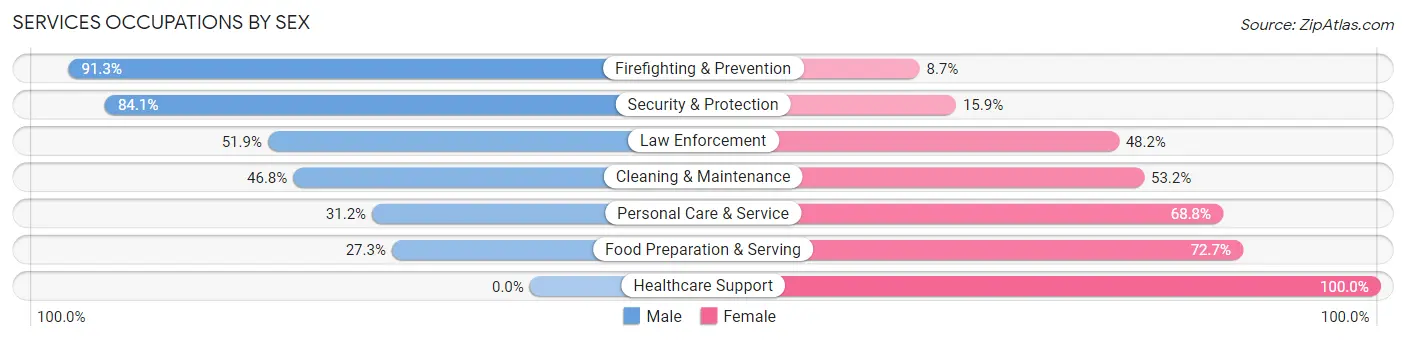
Services Occupations by Sex
Within the Services occupations in Mableton, the most male-oriented occupations are Firefighting & Prevention (91.3%), Security & Protection (84.1%), and Law Enforcement (51.8%), while the most female-oriented occupations are Healthcare Support (100.0%), Food Preparation & Serving (72.7%), and Personal Care & Service (68.8%).
| Occupation | Male | Female |
| Healthcare Support | 0 (0.0%) | 479 (100.0%) |
| Security & Protection | 248 (84.1%) | 47 (15.9%) |
| Firefighting & Prevention | 220 (91.3%) | 21 (8.7%) |
| Law Enforcement | 28 (51.8%) | 26 (48.1%) |
| Food Preparation & Serving | 324 (27.3%) | 863 (72.7%) |
| Cleaning & Maintenance | 325 (46.8%) | 369 (53.2%) |
| Personal Care & Service | 124 (31.2%) | 273 (68.8%) |
| Total (Category) | 1,021 (33.5%) | 2,031 (66.5%) |
| Total (Overall) | 11,309 (51.7%) | 10,573 (48.3%) |
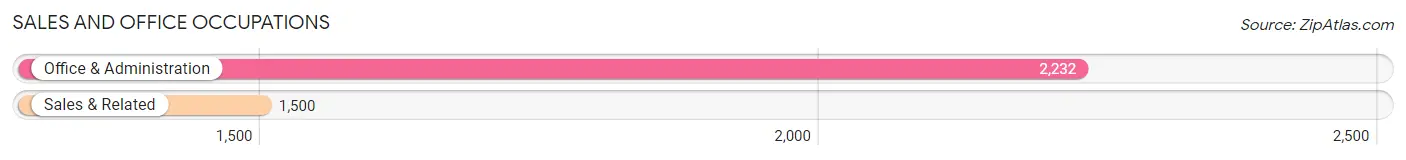
Sales and Office Occupations
The most common Sales and Office occupations in Mableton are Office & Administration (2,232 | 10.2%), and Sales & Related (1,500 | 6.9%).
Sales and Office Occupations by Sex
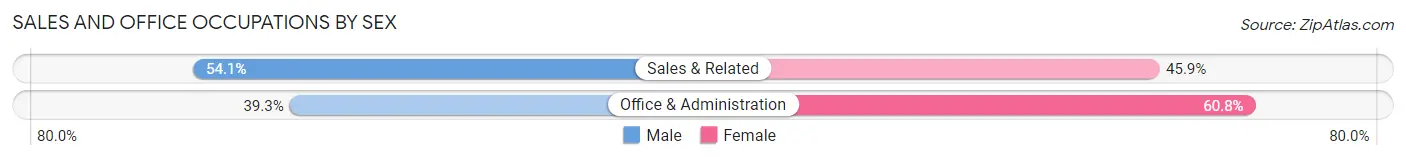
| Occupation | Male | Female |
| Sales & Related | 811 (54.1%) | 689 (45.9%) |
| Office & Administration | 876 (39.3%) | 1,356 (60.8%) |
| Total (Category) | 1,687 (45.2%) | 2,045 (54.8%) |
| Total (Overall) | 11,309 (51.7%) | 10,573 (48.3%) |
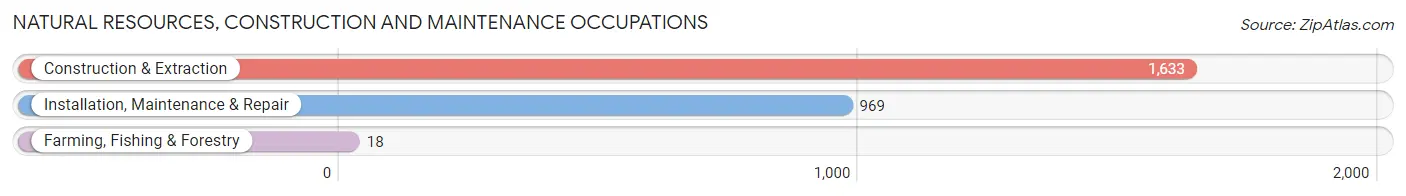
Natural Resources, Construction and Maintenance Occupations
The most common Natural Resources, Construction and Maintenance occupations in Mableton are Construction & Extraction (1,633 | 7.5%), Installation, Maintenance & Repair (969 | 4.4%), and Farming, Fishing & Forestry (18 | 0.1%).
Natural Resources, Construction and Maintenance Occupations by Sex
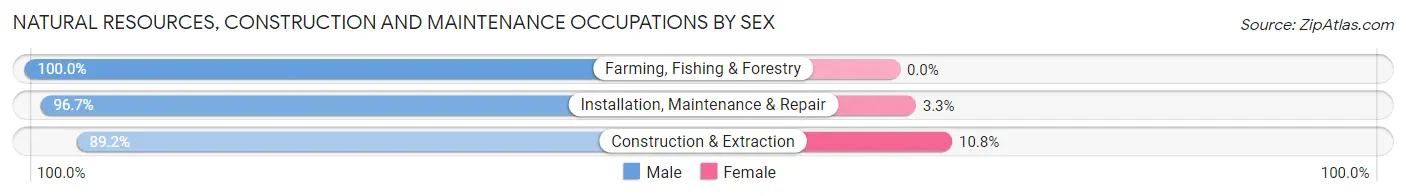
| Occupation | Male | Female |
| Farming, Fishing & Forestry | 18 (100.0%) | 0 (0.0%) |
| Construction & Extraction | 1,456 (89.2%) | 177 (10.8%) |
| Installation, Maintenance & Repair | 937 (96.7%) | 32 (3.3%) |
| Total (Category) | 2,411 (92.0%) | 209 (8.0%) |
| Total (Overall) | 11,309 (51.7%) | 10,573 (48.3%) |
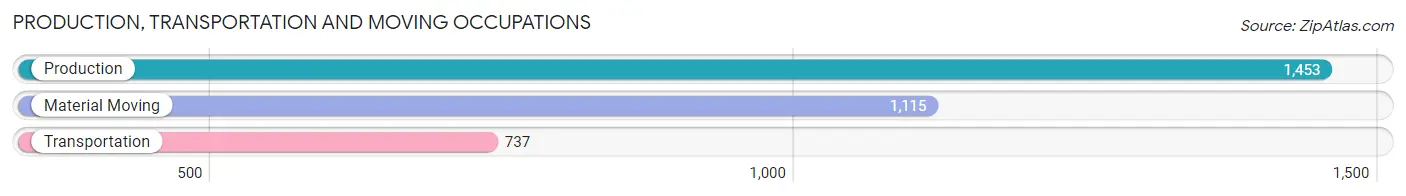
Production, Transportation and Moving Occupations
The most common Production, Transportation and Moving occupations in Mableton are Production (1,453 | 6.6%), Material Moving (1,115 | 5.1%), and Transportation (737 | 3.4%).
Production, Transportation and Moving Occupations by Sex
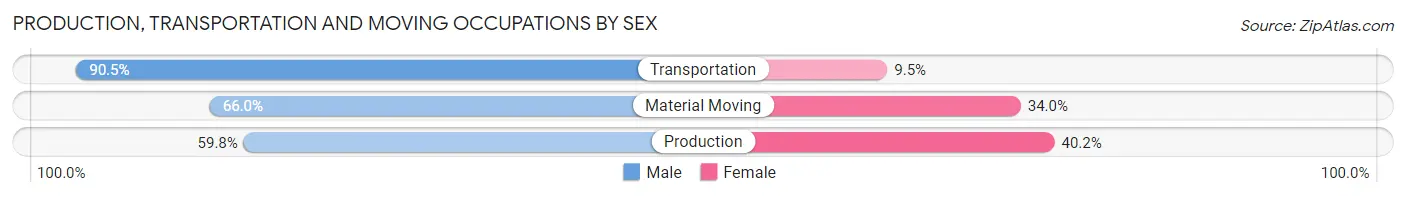
| Occupation | Male | Female |
| Production | 869 (59.8%) | 584 (40.2%) |
| Transportation | 667 (90.5%) | 70 (9.5%) |
| Material Moving | 736 (66.0%) | 379 (34.0%) |
| Total (Category) | 2,272 (68.7%) | 1,033 (31.3%) |
| Total (Overall) | 11,309 (51.7%) | 10,573 (48.3%) |
Employment Industries by Sex in Mableton
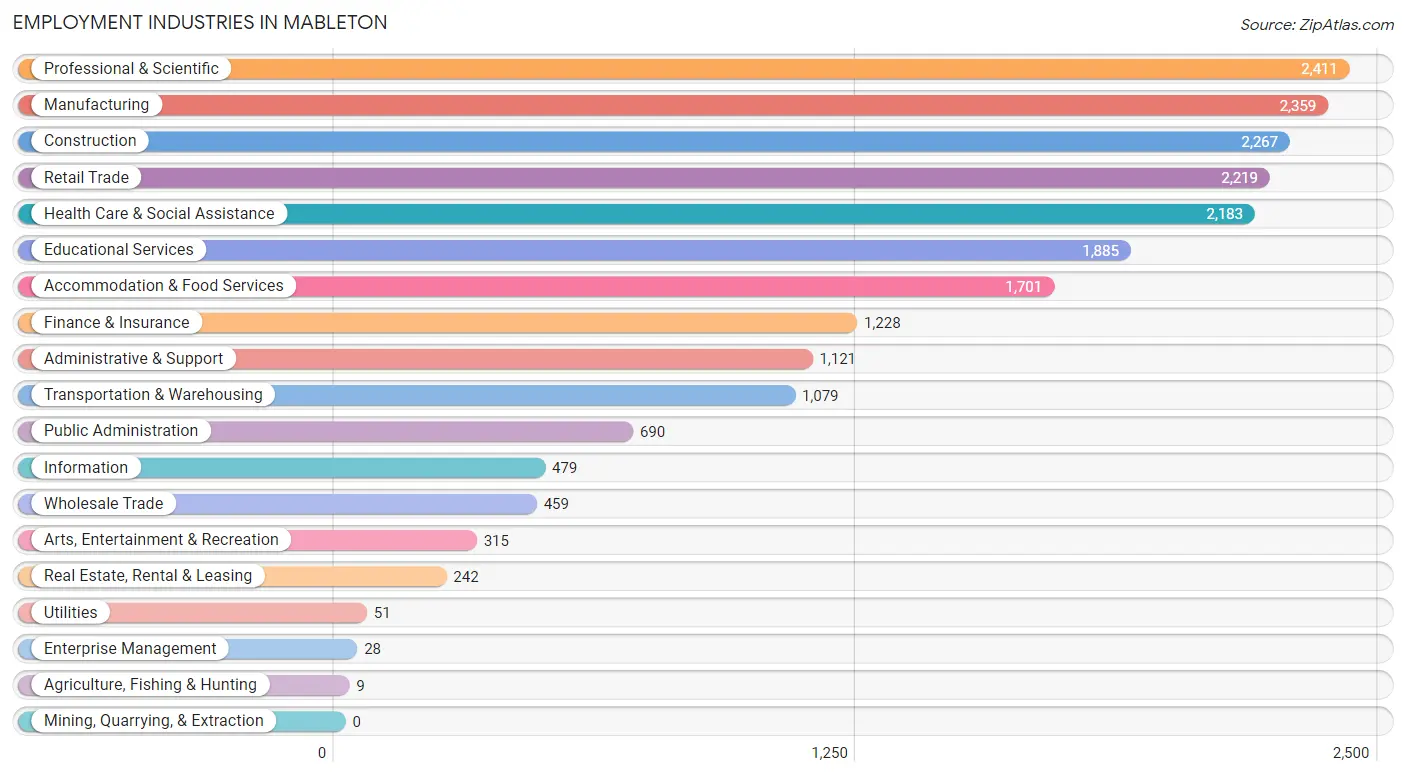
Employment Industries in Mableton
The major employment industries in Mableton include Professional & Scientific (2,411 | 11.0%), Manufacturing (2,359 | 10.8%), Construction (2,267 | 10.4%), Retail Trade (2,219 | 10.1%), and Health Care & Social Assistance (2,183 | 10.0%).
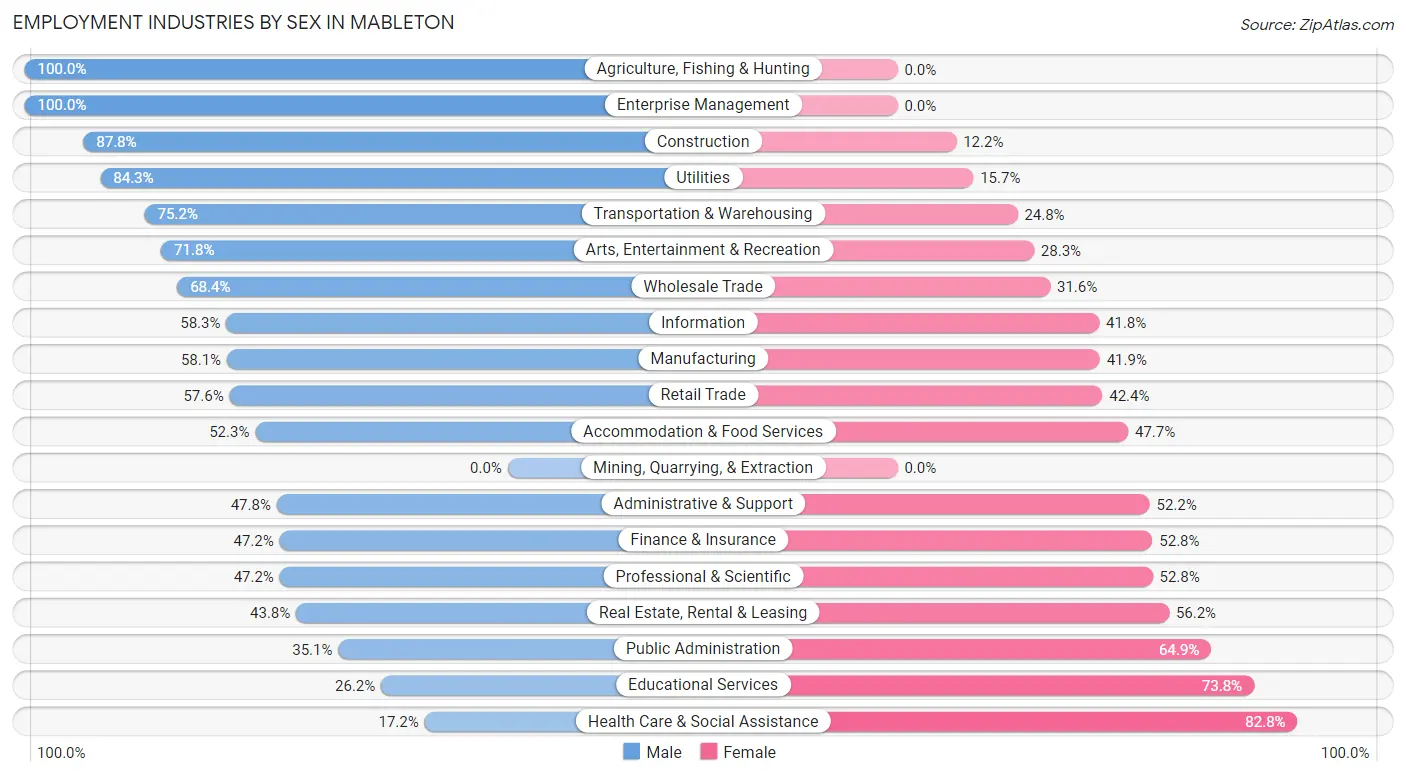
Employment Industries by Sex in Mableton
The Mableton industries that see more men than women are Agriculture, Fishing & Hunting (100.0%), Enterprise Management (100.0%), and Construction (87.8%), whereas the industries that tend to have a higher number of women are Health Care & Social Assistance (82.8%), Educational Services (73.8%), and Public Administration (64.9%).
| Industry | Male | Female |
| Agriculture, Fishing & Hunting | 9 (100.0%) | 0 (0.0%) |
| Mining, Quarrying, & Extraction | 0 (0.0%) | 0 (0.0%) |
| Construction | 1,991 (87.8%) | 276 (12.2%) |
| Manufacturing | 1,371 (58.1%) | 988 (41.9%) |
| Wholesale Trade | 314 (68.4%) | 145 (31.6%) |
| Retail Trade | 1,278 (57.6%) | 941 (42.4%) |
| Transportation & Warehousing | 811 (75.2%) | 268 (24.8%) |
| Utilities | 43 (84.3%) | 8 (15.7%) |
| Information | 279 (58.3%) | 200 (41.7%) |
| Finance & Insurance | 580 (47.2%) | 648 (52.8%) |
| Real Estate, Rental & Leasing | 106 (43.8%) | 136 (56.2%) |
| Professional & Scientific | 1,138 (47.2%) | 1,273 (52.8%) |
| Enterprise Management | 28 (100.0%) | 0 (0.0%) |
| Administrative & Support | 536 (47.8%) | 585 (52.2%) |
| Educational Services | 494 (26.2%) | 1,391 (73.8%) |
| Health Care & Social Assistance | 376 (17.2%) | 1,807 (82.8%) |
| Arts, Entertainment & Recreation | 226 (71.8%) | 89 (28.2%) |
| Accommodation & Food Services | 889 (52.3%) | 812 (47.7%) |
| Public Administration | 242 (35.1%) | 448 (64.9%) |
| Total | 11,309 (51.7%) | 10,573 (48.3%) |
Education in Mableton
School Enrollment in Mableton
The most common levels of schooling among the 9,192 students in Mableton are elementary school (2,280 | 24.8%), high school (2,280 | 24.8%), and middle school (1,863 | 20.3%).
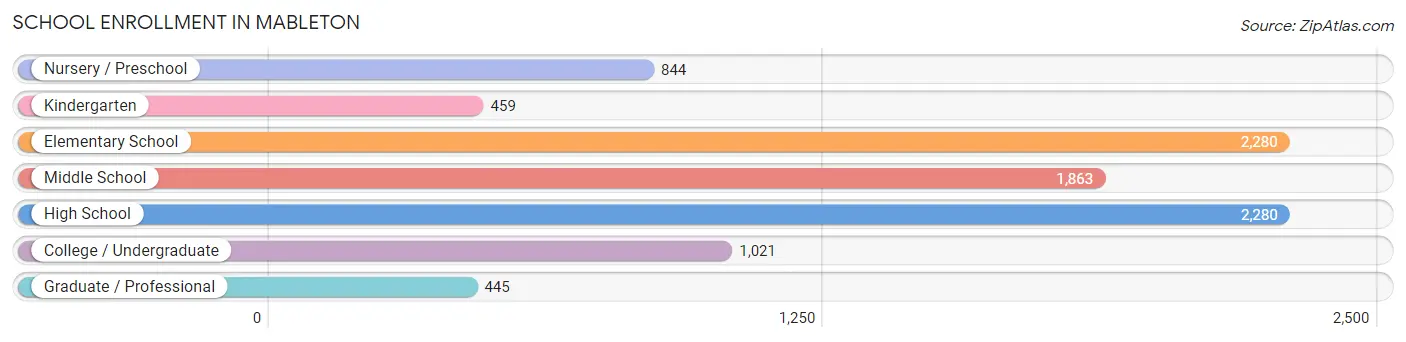
| School Level | # Students | % Students |
| Nursery / Preschool | 844 | 9.2% |
| Kindergarten | 459 | 5.0% |
| Elementary School | 2,280 | 24.8% |
| Middle School | 1,863 | 20.3% |
| High School | 2,280 | 24.8% |
| College / Undergraduate | 1,021 | 11.1% |
| Graduate / Professional | 445 | 4.8% |
| Total | 9,192 | 100.0% |
School Enrollment by Age by Funding Source in Mableton
Out of a total of 9,192 students who are enrolled in schools in Mableton, 1,268 (13.8%) attend a private institution, while the remaining 7,924 (86.2%) are enrolled in public schools. The age group of 3 to 4 year olds has the highest likelihood of being enrolled in private schools, with 260 (39.9% in the age bracket) enrolled. Conversely, the age group of 18 to 19 year olds has the lowest likelihood of being enrolled in a private school, with 658 (98.7% in the age bracket) attending a public institution.
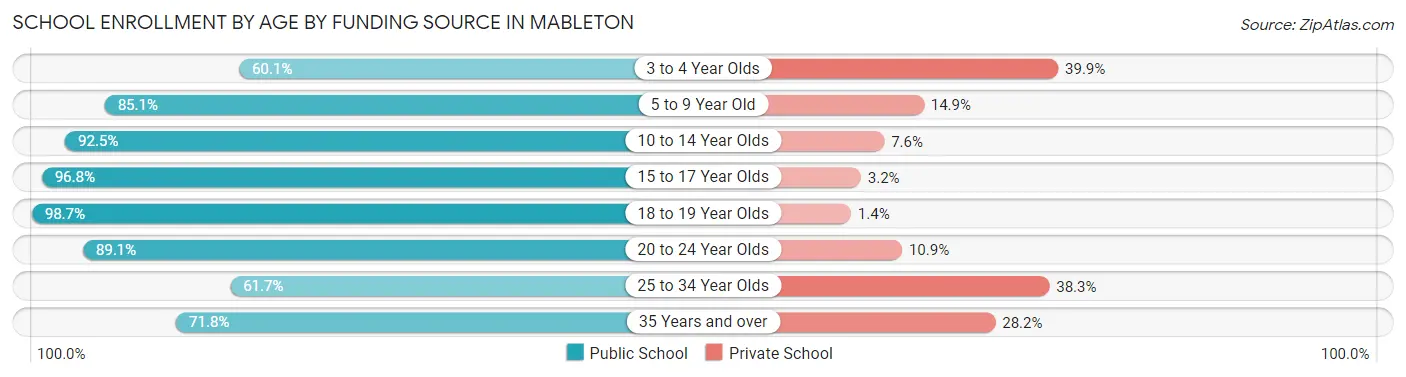
| Age Bracket | Public School | Private School |
| 3 to 4 Year Olds | 391 (60.1%) | 260 (39.9%) |
| 5 to 9 Year Old | 2,222 (85.1%) | 390 (14.9%) |
| 10 to 14 Year Olds | 2,181 (92.4%) | 178 (7.5%) |
| 15 to 17 Year Olds | 1,422 (96.8%) | 47 (3.2%) |
| 18 to 19 Year Olds | 658 (98.7%) | 9 (1.3%) |
| 20 to 24 Year Olds | 279 (89.1%) | 34 (10.9%) |
| 25 to 34 Year Olds | 211 (61.7%) | 131 (38.3%) |
| 35 Years and over | 559 (71.8%) | 220 (28.2%) |
| Total | 7,924 (86.2%) | 1,268 (13.8%) |
Educational Attainment by Field of Study in Mableton
Business (3,446 | 31.2%), arts & humanities (1,002 | 9.1%), education (977 | 8.8%), science & technology (886 | 8.0%), and social sciences (873 | 7.9%) are the most common fields of study among 11,044 individuals in Mableton who have obtained a bachelor's degree or higher.
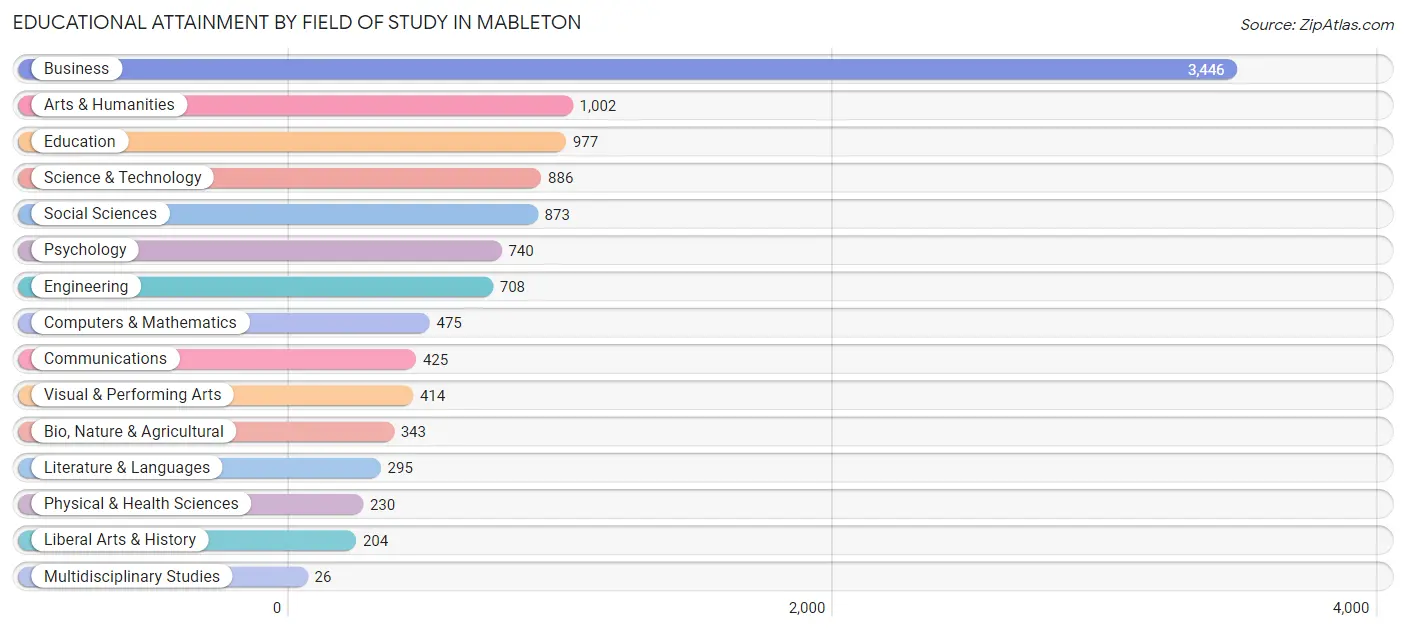
| Field of Study | # Graduates | % Graduates |
| Computers & Mathematics | 475 | 4.3% |
| Bio, Nature & Agricultural | 343 | 3.1% |
| Physical & Health Sciences | 230 | 2.1% |
| Psychology | 740 | 6.7% |
| Social Sciences | 873 | 7.9% |
| Engineering | 708 | 6.4% |
| Multidisciplinary Studies | 26 | 0.2% |
| Science & Technology | 886 | 8.0% |
| Business | 3,446 | 31.2% |
| Education | 977 | 8.8% |
| Literature & Languages | 295 | 2.7% |
| Liberal Arts & History | 204 | 1.8% |
| Visual & Performing Arts | 414 | 3.7% |
| Communications | 425 | 3.8% |
| Arts & Humanities | 1,002 | 9.1% |
| Total | 11,044 | 100.0% |
Transportation & Commute in Mableton
Vehicle Availability by Sex in Mableton
The most prevalent vehicle ownership categories in Mableton are males with 2 vehicles (5,256, accounting for 47.8%) and females with 2 vehicles (4,837, making up 51.7%).
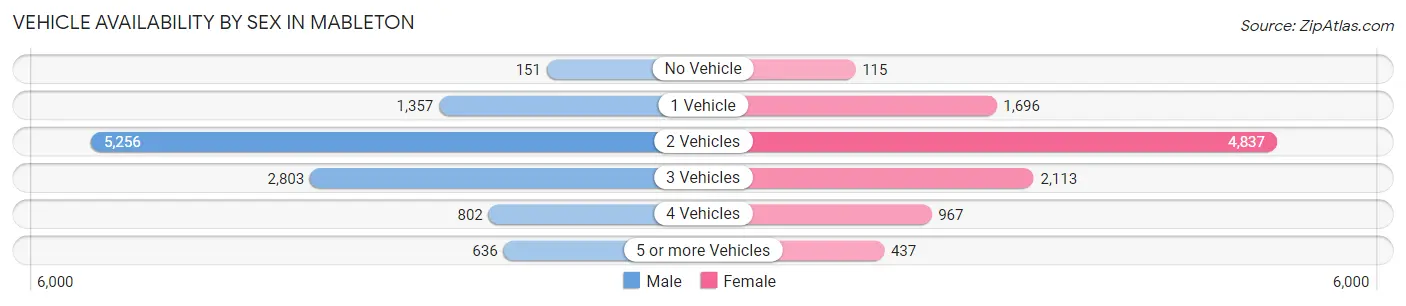
| Vehicles Available | Male | Female |
| No Vehicle | 151 (1.4%) | 115 (1.1%) |
| 1 Vehicle | 1,357 (12.3%) | 1,696 (16.7%) |
| 2 Vehicles | 5,256 (47.8%) | 4,837 (47.6%) |
| 3 Vehicles | 2,803 (25.5%) | 2,113 (20.8%) |
| 4 Vehicles | 802 (7.3%) | 967 (9.5%) |
| 5 or more Vehicles | 636 (5.8%) | 437 (4.3%) |
| Total | 11,005 (100.0%) | 10,165 (100.0%) |
Commute Time in Mableton
The most frequently occuring commute durations in Mableton are 30 to 34 minutes (3,370 commuters, 18.8%), 15 to 19 minutes (2,247 commuters, 12.5%), and 45 to 59 minutes (2,196 commuters, 12.2%).
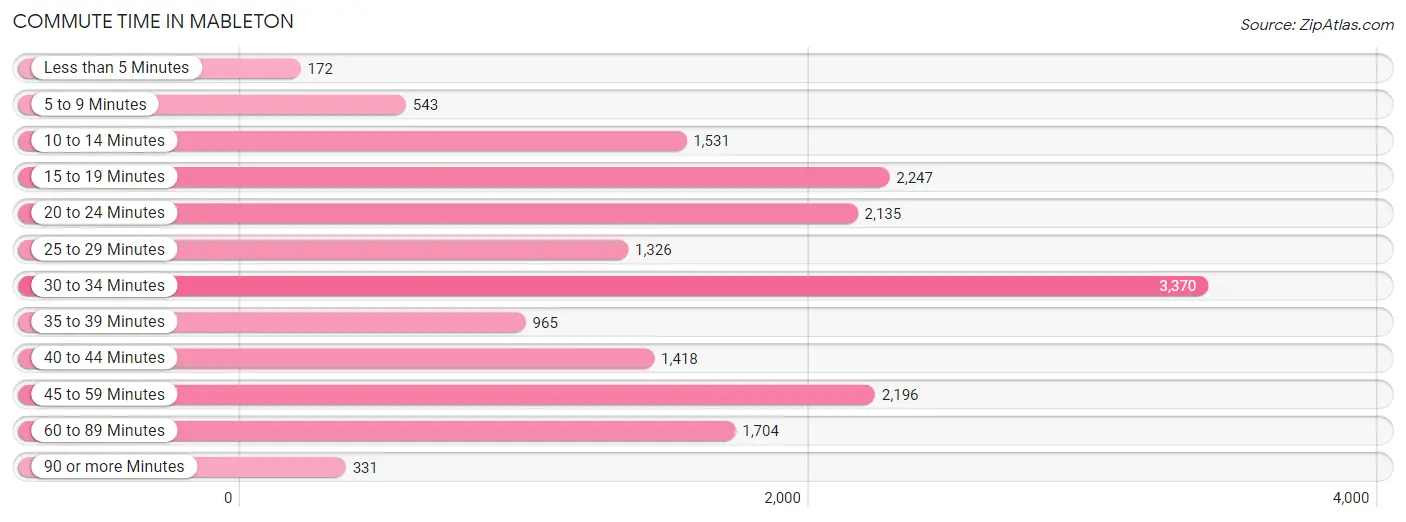
| Commute Time | # Commuters | % Commuters |
| Less than 5 Minutes | 172 | 1.0% |
| 5 to 9 Minutes | 543 | 3.0% |
| 10 to 14 Minutes | 1,531 | 8.5% |
| 15 to 19 Minutes | 2,247 | 12.5% |
| 20 to 24 Minutes | 2,135 | 11.9% |
| 25 to 29 Minutes | 1,326 | 7.4% |
| 30 to 34 Minutes | 3,370 | 18.8% |
| 35 to 39 Minutes | 965 | 5.4% |
| 40 to 44 Minutes | 1,418 | 7.9% |
| 45 to 59 Minutes | 2,196 | 12.2% |
| 60 to 89 Minutes | 1,704 | 9.5% |
| 90 or more Minutes | 331 | 1.8% |
Commute Time by Sex in Mableton
The most common commute times in Mableton are 30 to 34 minutes (1,631 commuters, 17.1%) for males and 30 to 34 minutes (1,739 commuters, 20.7%) for females.
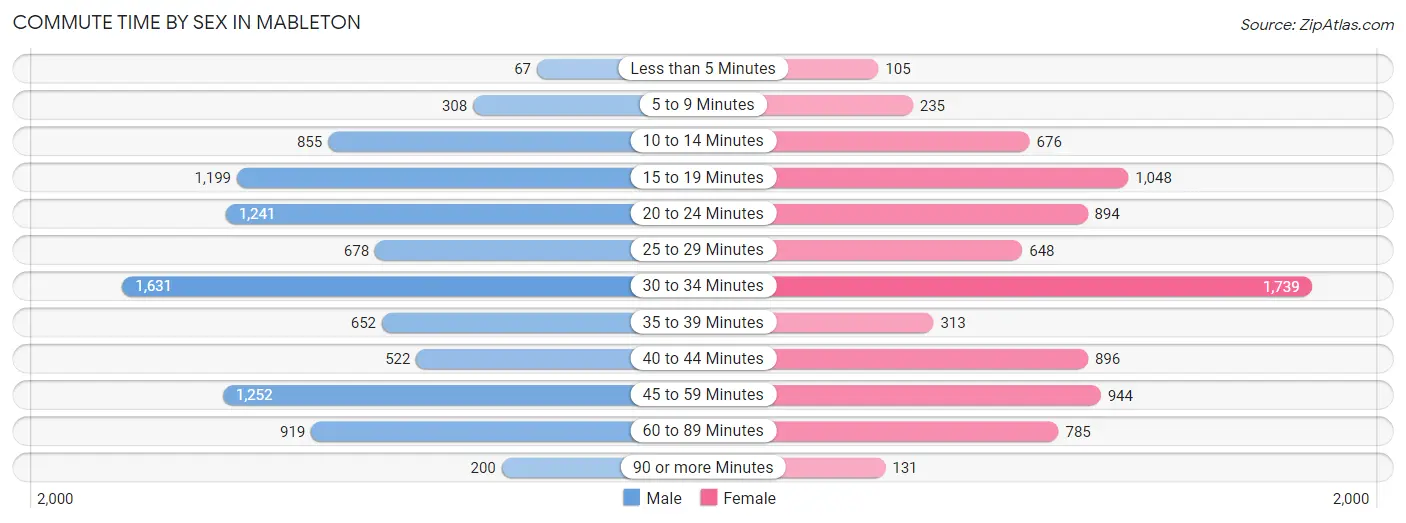
| Commute Time | Male | Female |
| Less than 5 Minutes | 67 (0.7%) | 105 (1.3%) |
| 5 to 9 Minutes | 308 (3.2%) | 235 (2.8%) |
| 10 to 14 Minutes | 855 (9.0%) | 676 (8.0%) |
| 15 to 19 Minutes | 1,199 (12.6%) | 1,048 (12.5%) |
| 20 to 24 Minutes | 1,241 (13.0%) | 894 (10.6%) |
| 25 to 29 Minutes | 678 (7.1%) | 648 (7.7%) |
| 30 to 34 Minutes | 1,631 (17.1%) | 1,739 (20.7%) |
| 35 to 39 Minutes | 652 (6.9%) | 313 (3.7%) |
| 40 to 44 Minutes | 522 (5.5%) | 896 (10.6%) |
| 45 to 59 Minutes | 1,252 (13.2%) | 944 (11.2%) |
| 60 to 89 Minutes | 919 (9.7%) | 785 (9.3%) |
| 90 or more Minutes | 200 (2.1%) | 131 (1.6%) |
Time of Departure to Work by Sex in Mableton
The most frequent times of departure to work in Mableton are 7:00 AM to 7:29 AM (1,395, 14.6%) for males and 7:00 AM to 7:29 AM (1,414, 16.8%) for females.
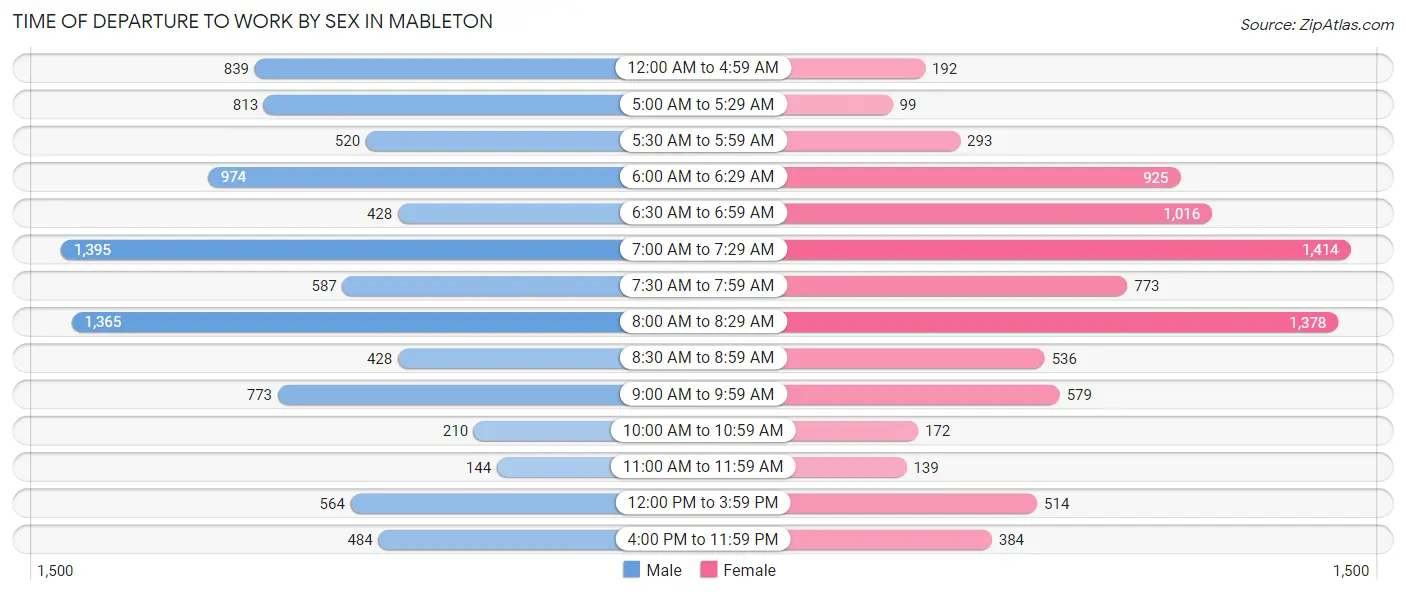
| Time of Departure | Male | Female |
| 12:00 AM to 4:59 AM | 839 (8.8%) | 192 (2.3%) |
| 5:00 AM to 5:29 AM | 813 (8.5%) | 99 (1.2%) |
| 5:30 AM to 5:59 AM | 520 (5.5%) | 293 (3.5%) |
| 6:00 AM to 6:29 AM | 974 (10.2%) | 925 (11.0%) |
| 6:30 AM to 6:59 AM | 428 (4.5%) | 1,016 (12.1%) |
| 7:00 AM to 7:29 AM | 1,395 (14.6%) | 1,414 (16.8%) |
| 7:30 AM to 7:59 AM | 587 (6.2%) | 773 (9.2%) |
| 8:00 AM to 8:29 AM | 1,365 (14.3%) | 1,378 (16.4%) |
| 8:30 AM to 8:59 AM | 428 (4.5%) | 536 (6.4%) |
| 9:00 AM to 9:59 AM | 773 (8.1%) | 579 (6.9%) |
| 10:00 AM to 10:59 AM | 210 (2.2%) | 172 (2.0%) |
| 11:00 AM to 11:59 AM | 144 (1.5%) | 139 (1.7%) |
| 12:00 PM to 3:59 PM | 564 (5.9%) | 514 (6.1%) |
| 4:00 PM to 11:59 PM | 484 (5.1%) | 384 (4.6%) |
| Total | 9,524 (100.0%) | 8,414 (100.0%) |
Housing Occupancy in Mableton
Occupancy by Ownership in Mableton
Of the total 15,054 dwellings in Mableton, owner-occupied units account for 11,222 (74.5%), while renter-occupied units make up 3,832 (25.5%).
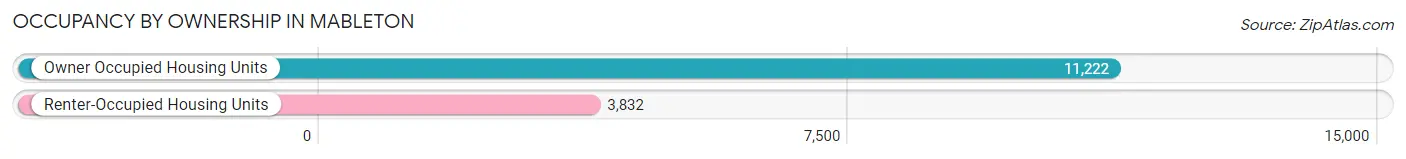
| Occupancy | # Housing Units | % Housing Units |
| Owner Occupied Housing Units | 11,222 | 74.5% |
| Renter-Occupied Housing Units | 3,832 | 25.5% |
| Total Occupied Housing Units | 15,054 | 100.0% |
Occupancy by Household Size in Mableton
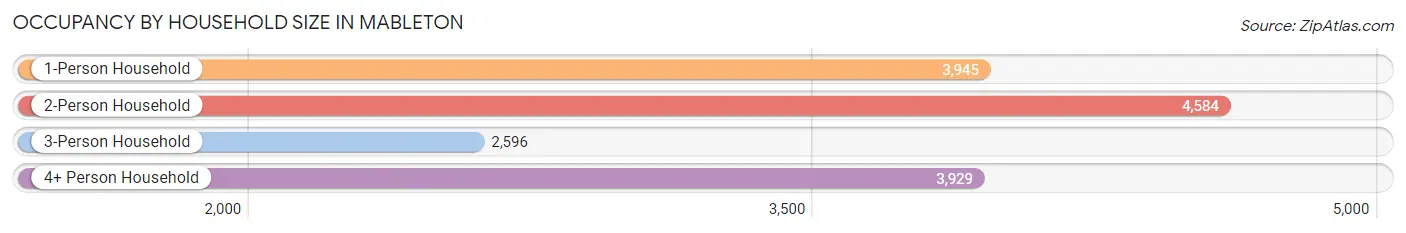
| Household Size | # Housing Units | % Housing Units |
| 1-Person Household | 3,945 | 26.2% |
| 2-Person Household | 4,584 | 30.4% |
| 3-Person Household | 2,596 | 17.2% |
| 4+ Person Household | 3,929 | 26.1% |
| Total Housing Units | 15,054 | 100.0% |
Occupancy by Ownership by Household Size in Mableton
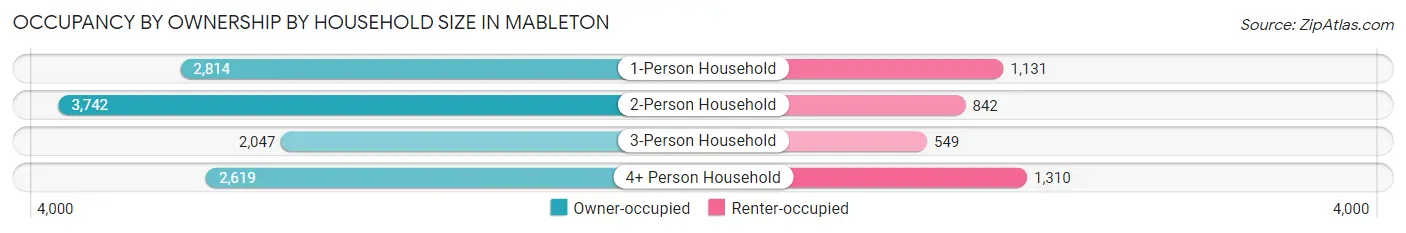
| Household Size | Owner-occupied | Renter-occupied |
| 1-Person Household | 2,814 (71.3%) | 1,131 (28.7%) |
| 2-Person Household | 3,742 (81.6%) | 842 (18.4%) |
| 3-Person Household | 2,047 (78.8%) | 549 (21.1%) |
| 4+ Person Household | 2,619 (66.7%) | 1,310 (33.3%) |
| Total Housing Units | 11,222 (74.5%) | 3,832 (25.5%) |
Occupancy by Educational Attainment in Mableton
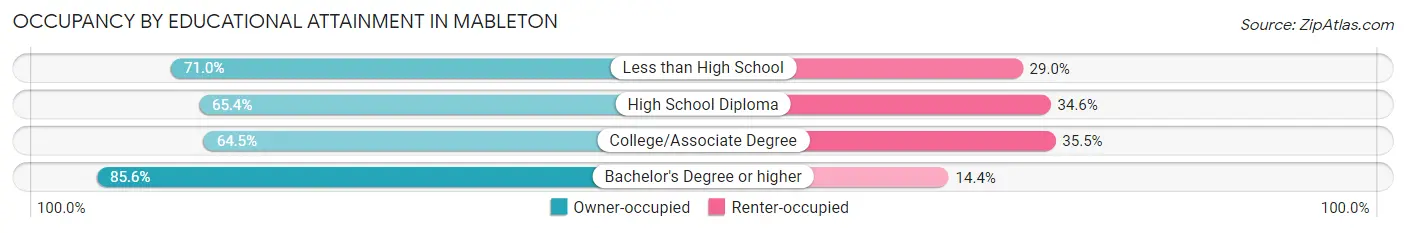
| Household Size | Owner-occupied | Renter-occupied |
| Less than High School | 1,014 (71.0%) | 415 (29.0%) |
| High School Diploma | 2,046 (65.4%) | 1,082 (34.6%) |
| College/Associate Degree | 2,518 (64.5%) | 1,388 (35.5%) |
| Bachelor's Degree or higher | 5,644 (85.6%) | 947 (14.4%) |
Occupancy by Age of Householder in Mableton
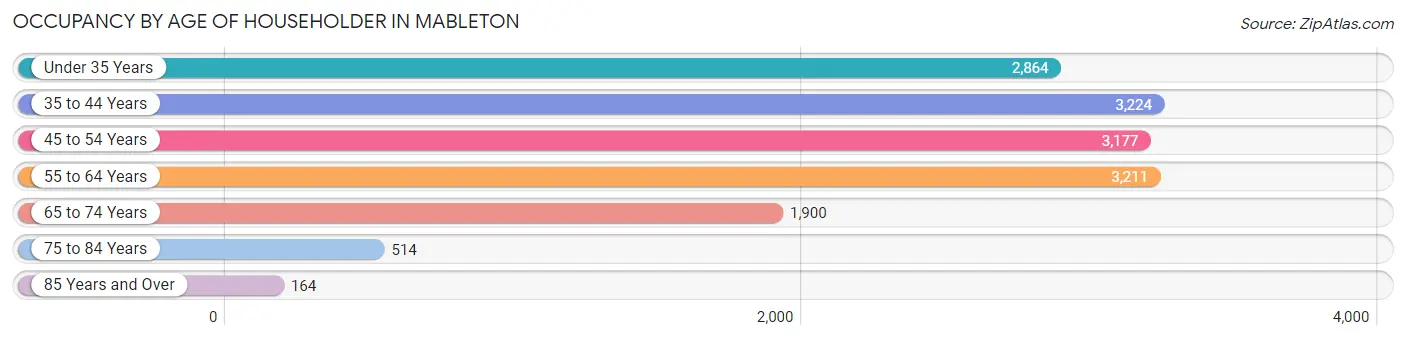
| Age Bracket | # Households | % Households |
| Under 35 Years | 2,864 | 19.0% |
| 35 to 44 Years | 3,224 | 21.4% |
| 45 to 54 Years | 3,177 | 21.1% |
| 55 to 64 Years | 3,211 | 21.3% |
| 65 to 74 Years | 1,900 | 12.6% |
| 75 to 84 Years | 514 | 3.4% |
| 85 Years and Over | 164 | 1.1% |
| Total | 15,054 | 100.0% |
Housing Finances in Mableton
Median Income by Occupancy in Mableton
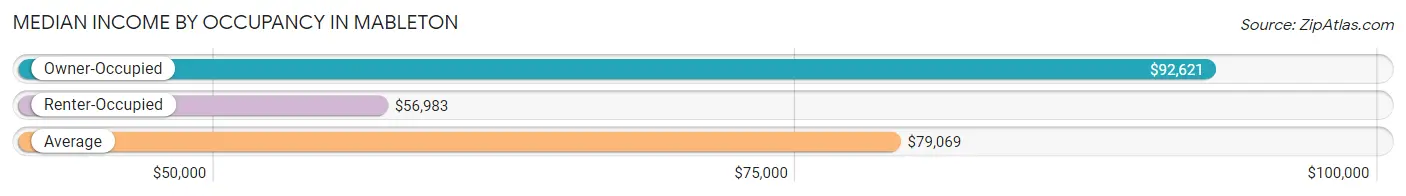
| Occupancy Type | # Households | Median Income |
| Owner-Occupied | 11,222 (74.5%) | $92,621 |
| Renter-Occupied | 3,832 (25.5%) | $56,983 |
| Average | 15,054 (100.0%) | $79,069 |
Occupancy by Householder Income Bracket in Mableton
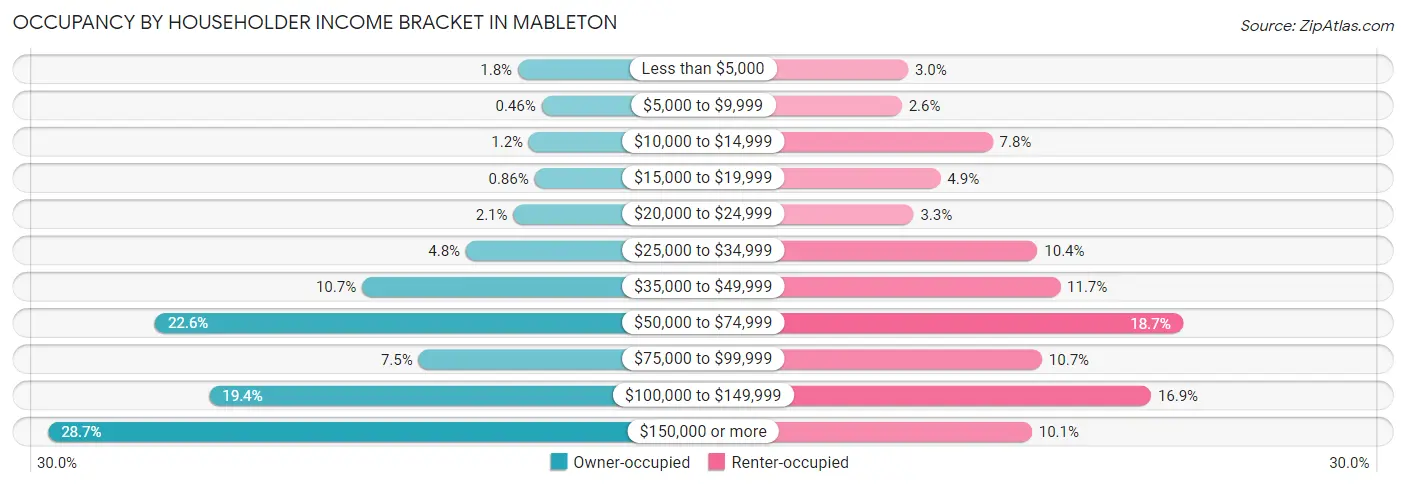
| Income Bracket | Owner-occupied | Renter-occupied |
| Less than $5,000 | 203 (1.8%) | 115 (3.0%) |
| $5,000 to $9,999 | 52 (0.5%) | 101 (2.6%) |
| $10,000 to $14,999 | 132 (1.2%) | 300 (7.8%) |
| $15,000 to $19,999 | 97 (0.9%) | 186 (4.9%) |
| $20,000 to $24,999 | 232 (2.1%) | 127 (3.3%) |
| $25,000 to $34,999 | 536 (4.8%) | 398 (10.4%) |
| $35,000 to $49,999 | 1,203 (10.7%) | 448 (11.7%) |
| $50,000 to $74,999 | 2,530 (22.6%) | 716 (18.7%) |
| $75,000 to $99,999 | 841 (7.5%) | 408 (10.6%) |
| $100,000 to $149,999 | 2,181 (19.4%) | 647 (16.9%) |
| $150,000 or more | 3,215 (28.6%) | 386 (10.1%) |
| Total | 11,222 (100.0%) | 3,832 (100.0%) |
Monthly Housing Cost Tiers in Mableton
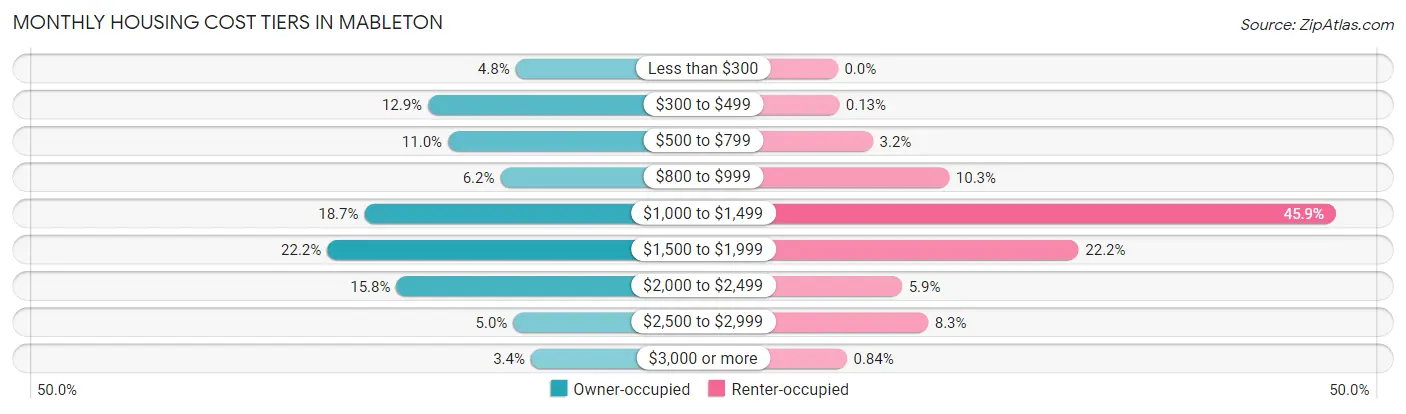
| Monthly Cost | Owner-occupied | Renter-occupied |
| Less than $300 | 540 (4.8%) | 0 (0.0%) |
| $300 to $499 | 1,444 (12.9%) | 5 (0.1%) |
| $500 to $799 | 1,238 (11.0%) | 124 (3.2%) |
| $800 to $999 | 697 (6.2%) | 393 (10.3%) |
| $1,000 to $1,499 | 2,102 (18.7%) | 1,758 (45.9%) |
| $1,500 to $1,999 | 2,486 (22.2%) | 850 (22.2%) |
| $2,000 to $2,499 | 1,771 (15.8%) | 227 (5.9%) |
| $2,500 to $2,999 | 563 (5.0%) | 319 (8.3%) |
| $3,000 or more | 381 (3.4%) | 32 (0.8%) |
| Total | 11,222 (100.0%) | 3,832 (100.0%) |
Physical Housing Characteristics in Mableton
Housing Structures in Mableton
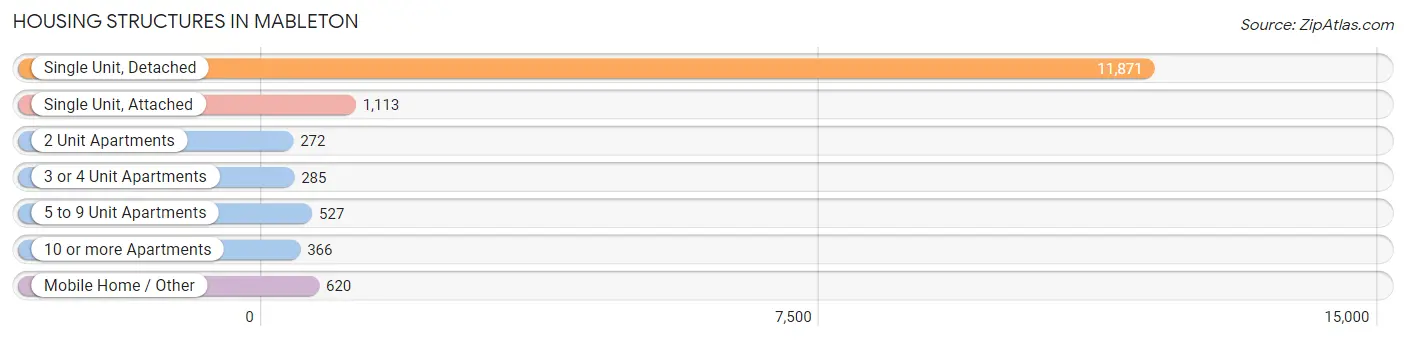
| Structure Type | # Housing Units | % Housing Units |
| Single Unit, Detached | 11,871 | 78.9% |
| Single Unit, Attached | 1,113 | 7.4% |
| 2 Unit Apartments | 272 | 1.8% |
| 3 or 4 Unit Apartments | 285 | 1.9% |
| 5 to 9 Unit Apartments | 527 | 3.5% |
| 10 or more Apartments | 366 | 2.4% |
| Mobile Home / Other | 620 | 4.1% |
| Total | 15,054 | 100.0% |
Housing Structures by Occupancy in Mableton
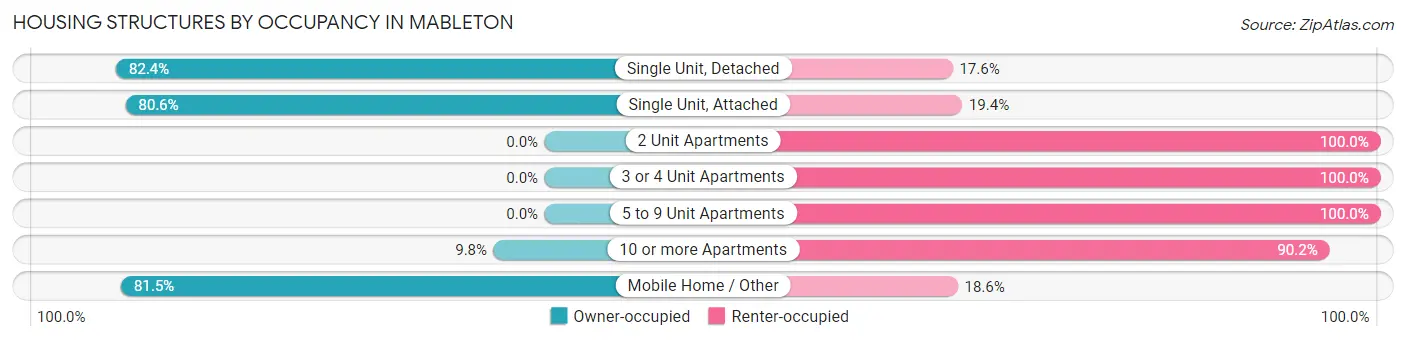
| Structure Type | Owner-occupied | Renter-occupied |
| Single Unit, Detached | 9,784 (82.4%) | 2,087 (17.6%) |
| Single Unit, Attached | 897 (80.6%) | 216 (19.4%) |
| 2 Unit Apartments | 0 (0.0%) | 272 (100.0%) |
| 3 or 4 Unit Apartments | 0 (0.0%) | 285 (100.0%) |
| 5 to 9 Unit Apartments | 0 (0.0%) | 527 (100.0%) |
| 10 or more Apartments | 36 (9.8%) | 330 (90.2%) |
| Mobile Home / Other | 505 (81.5%) | 115 (18.5%) |
| Total | 11,222 (74.5%) | 3,832 (25.5%) |
Housing Structures by Number of Rooms in Mableton
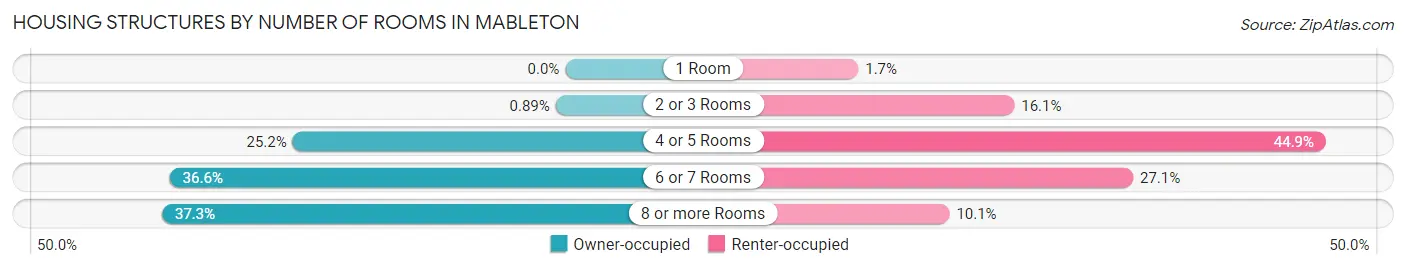
| Number of Rooms | Owner-occupied | Renter-occupied |
| 1 Room | 0 (0.0%) | 65 (1.7%) |
| 2 or 3 Rooms | 100 (0.9%) | 618 (16.1%) |
| 4 or 5 Rooms | 2,830 (25.2%) | 1,722 (44.9%) |
| 6 or 7 Rooms | 4,105 (36.6%) | 1,039 (27.1%) |
| 8 or more Rooms | 4,187 (37.3%) | 388 (10.1%) |
| Total | 11,222 (100.0%) | 3,832 (100.0%) |
Housing Structure by Heating Type in Mableton
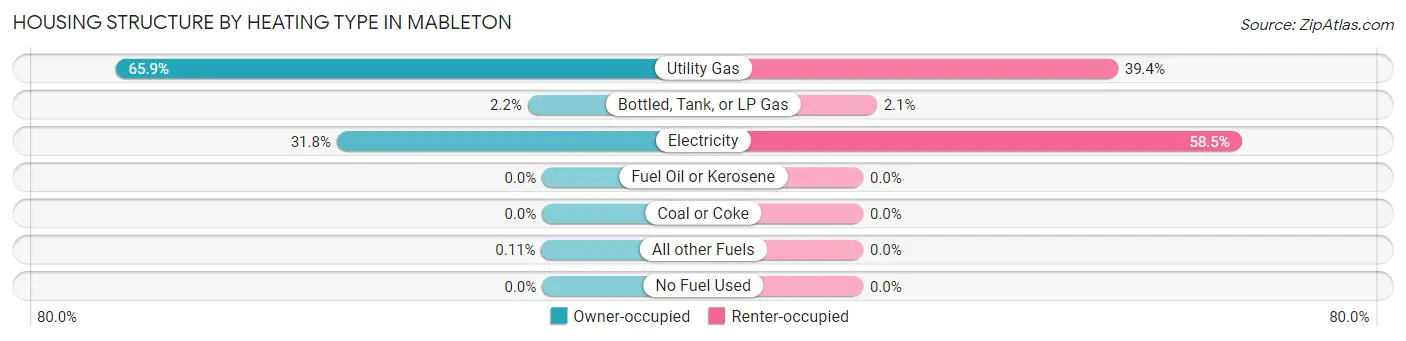
| Heating Type | Owner-occupied | Renter-occupied |
| Utility Gas | 7,398 (65.9%) | 1,509 (39.4%) |
| Bottled, Tank, or LP Gas | 249 (2.2%) | 81 (2.1%) |
| Electricity | 3,563 (31.8%) | 2,242 (58.5%) |
| Fuel Oil or Kerosene | 0 (0.0%) | 0 (0.0%) |
| Coal or Coke | 0 (0.0%) | 0 (0.0%) |
| All other Fuels | 12 (0.1%) | 0 (0.0%) |
| No Fuel Used | 0 (0.0%) | 0 (0.0%) |
| Total | 11,222 (100.0%) | 3,832 (100.0%) |
Household Vehicle Usage in Mableton
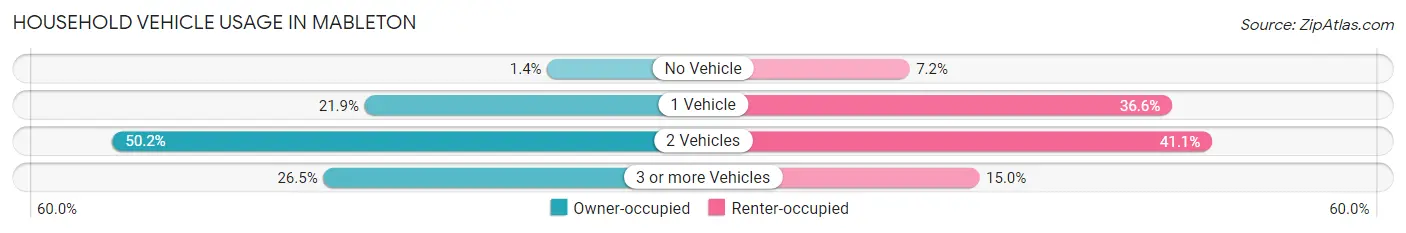
| Vehicles per Household | Owner-occupied | Renter-occupied |
| No Vehicle | 161 (1.4%) | 276 (7.2%) |
| 1 Vehicle | 2,456 (21.9%) | 1,404 (36.6%) |
| 2 Vehicles | 5,629 (50.2%) | 1,576 (41.1%) |
| 3 or more Vehicles | 2,976 (26.5%) | 576 (15.0%) |
| Total | 11,222 (100.0%) | 3,832 (100.0%) |
Real Estate & Mortgages in Mableton
Real Estate and Mortgage Overview in Mableton
| Characteristic | Without Mortgage | With Mortgage |
| Housing Units | 3,076 | 8,146 |
| Median Property Value | $222,400 | $296,700 |
| Median Household Income | $79,028 | $2,476 |
| Monthly Housing Costs | $435 | $381 |
| Real Estate Taxes | $1,014 | $101 |
Property Value by Mortgage Status in Mableton
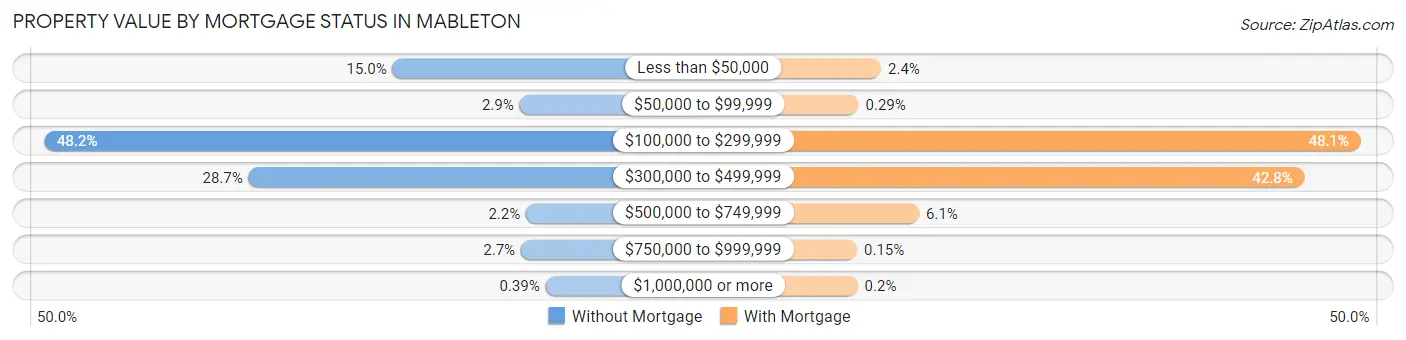
| Property Value | Without Mortgage | With Mortgage |
| Less than $50,000 | 460 (14.9%) | 198 (2.4%) |
| $50,000 to $99,999 | 88 (2.9%) | 24 (0.3%) |
| $100,000 to $299,999 | 1,481 (48.1%) | 3,920 (48.1%) |
| $300,000 to $499,999 | 882 (28.7%) | 3,483 (42.8%) |
| $500,000 to $749,999 | 69 (2.2%) | 493 (6.0%) |
| $750,000 to $999,999 | 84 (2.7%) | 12 (0.2%) |
| $1,000,000 or more | 12 (0.4%) | 16 (0.2%) |
| Total | 3,076 (100.0%) | 8,146 (100.0%) |
Household Income by Mortgage Status in Mableton
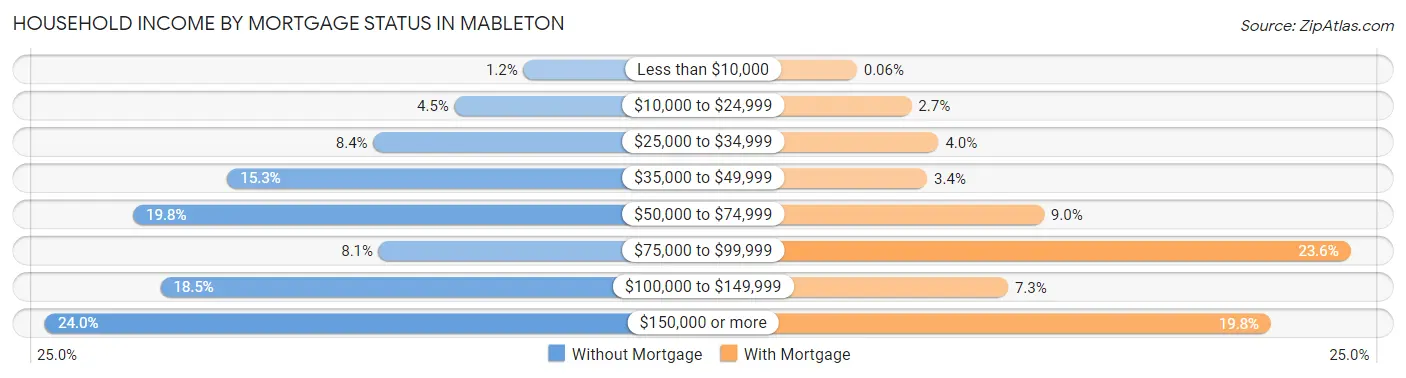
| Household Income | Without Mortgage | With Mortgage |
| Less than $10,000 | 38 (1.2%) | 5 (0.1%) |
| $10,000 to $24,999 | 139 (4.5%) | 217 (2.7%) |
| $25,000 to $34,999 | 258 (8.4%) | 322 (4.0%) |
| $35,000 to $49,999 | 472 (15.3%) | 278 (3.4%) |
| $50,000 to $74,999 | 610 (19.8%) | 731 (9.0%) |
| $75,000 to $99,999 | 250 (8.1%) | 1,920 (23.6%) |
| $100,000 to $149,999 | 570 (18.5%) | 591 (7.3%) |
| $150,000 or more | 739 (24.0%) | 1,611 (19.8%) |
| Total | 3,076 (100.0%) | 8,146 (100.0%) |
Property Value to Household Income Ratio in Mableton
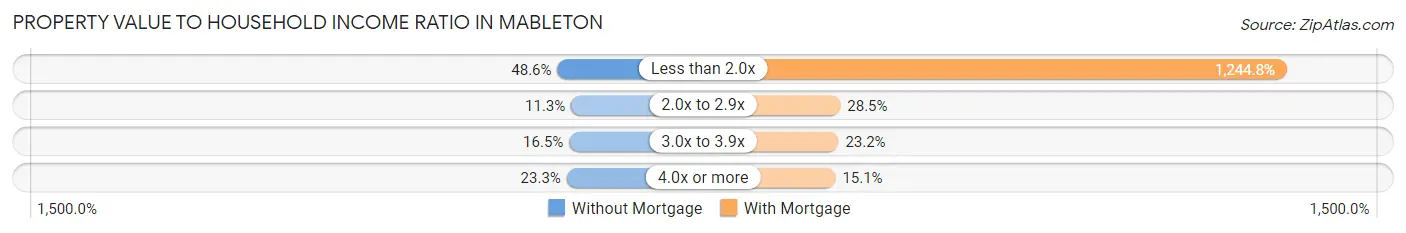
| Value-to-Income Ratio | Without Mortgage | With Mortgage |
| Less than 2.0x | 1,495 (48.6%) | 101,400 (1,244.8%) |
| 2.0x to 2.9x | 346 (11.3%) | 2,321 (28.5%) |
| 3.0x to 3.9x | 508 (16.5%) | 1,891 (23.2%) |
| 4.0x or more | 717 (23.3%) | 1,229 (15.1%) |
| Total | 3,076 (100.0%) | 8,146 (100.0%) |
Real Estate Taxes by Mortgage Status in Mableton
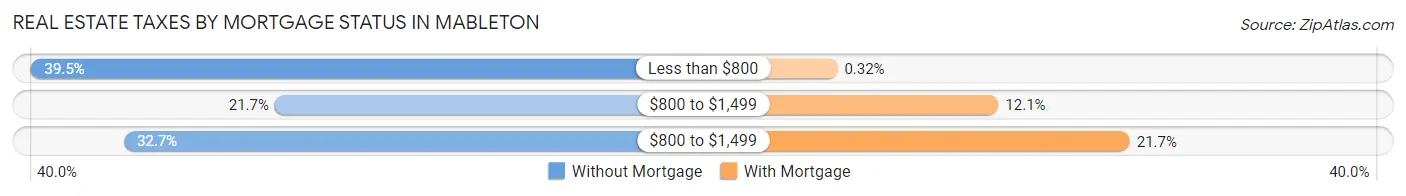
| Property Taxes | Without Mortgage | With Mortgage |
| Less than $800 | 1,215 (39.5%) | 26 (0.3%) |
| $800 to $1,499 | 668 (21.7%) | 984 (12.1%) |
| $800 to $1,499 | 1,007 (32.7%) | 1,766 (21.7%) |
| Total | 3,076 (100.0%) | 8,146 (100.0%) |
Health & Disability in Mableton
Health Insurance Coverage by Age in Mableton
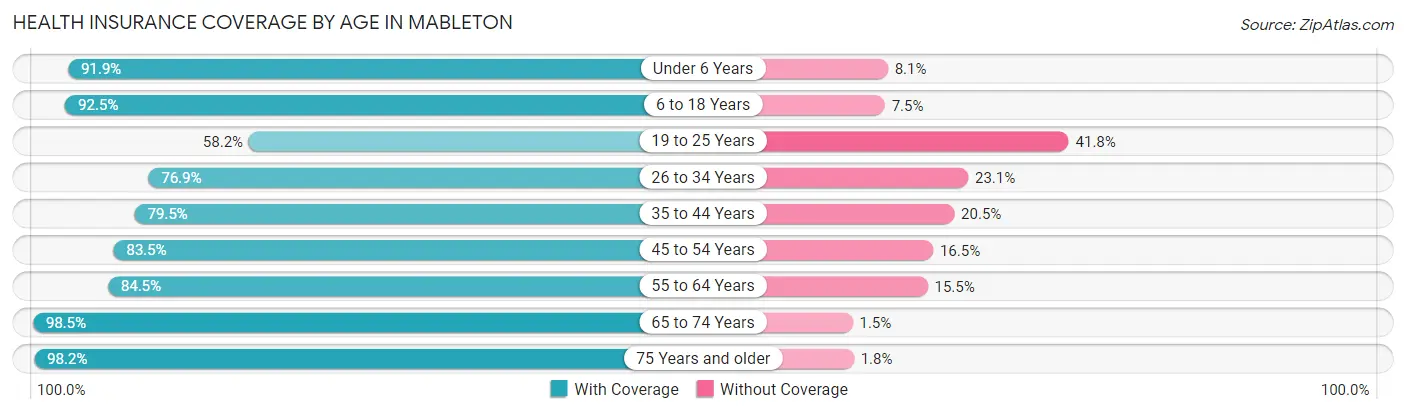
| Age Bracket | With Coverage | Without Coverage |
| Under 6 Years | 3,706 (91.9%) | 326 (8.1%) |
| 6 to 18 Years | 6,323 (92.5%) | 516 (7.5%) |
| 19 to 25 Years | 1,719 (58.2%) | 1,236 (41.8%) |
| 26 to 34 Years | 3,633 (76.9%) | 1,090 (23.1%) |
| 35 to 44 Years | 5,214 (79.5%) | 1,344 (20.5%) |
| 45 to 54 Years | 5,123 (83.5%) | 1,015 (16.5%) |
| 55 to 64 Years | 4,356 (84.5%) | 801 (15.5%) |
| 65 to 74 Years | 3,742 (98.5%) | 58 (1.5%) |
| 75 Years and older | 1,399 (98.2%) | 25 (1.8%) |
| Total | 35,215 (84.6%) | 6,411 (15.4%) |
Health Insurance Coverage by Citizenship Status in Mableton
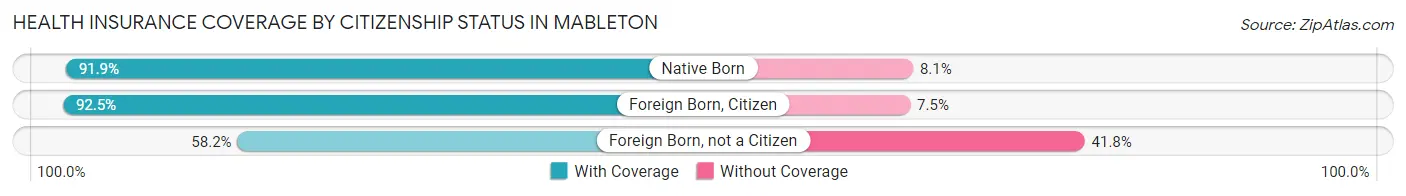
| Citizenship Status | With Coverage | Without Coverage |
| Native Born | 3,706 (91.9%) | 326 (8.1%) |
| Foreign Born, Citizen | 6,323 (92.5%) | 516 (7.5%) |
| Foreign Born, not a Citizen | 1,719 (58.2%) | 1,236 (41.8%) |
Health Insurance Coverage by Household Income in Mableton
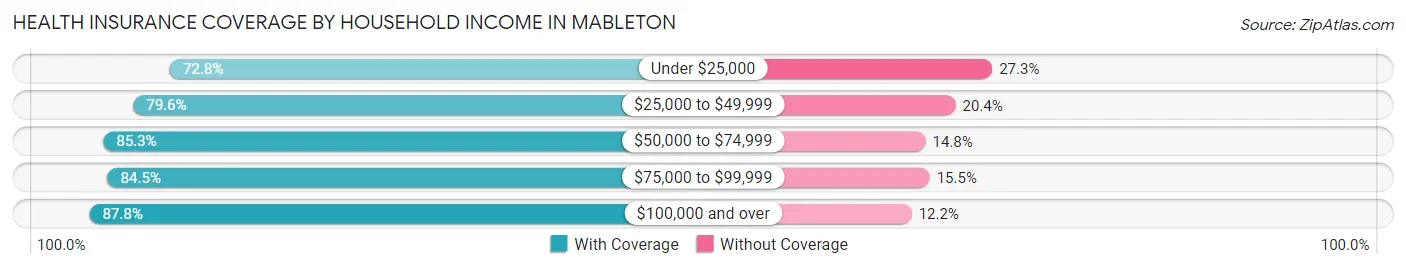
| Household Income | With Coverage | Without Coverage |
| Under $25,000 | 2,422 (72.8%) | 907 (27.3%) |
| $25,000 to $49,999 | 4,554 (79.6%) | 1,165 (20.4%) |
| $50,000 to $74,999 | 7,869 (85.3%) | 1,362 (14.7%) |
| $75,000 to $99,999 | 3,086 (84.5%) | 568 (15.5%) |
| $100,000 and over | 17,267 (87.8%) | 2,391 (12.2%) |
Public vs Private Health Insurance Coverage by Age in Mableton
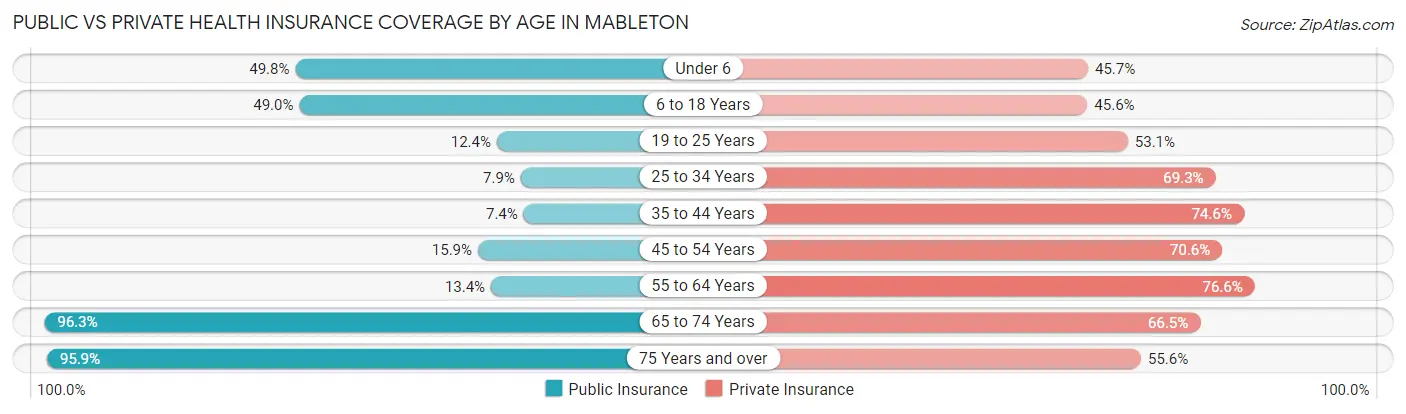
| Age Bracket | Public Insurance | Private Insurance |
| Under 6 | 2,006 (49.7%) | 1,843 (45.7%) |
| 6 to 18 Years | 3,352 (49.0%) | 3,118 (45.6%) |
| 19 to 25 Years | 365 (12.3%) | 1,569 (53.1%) |
| 25 to 34 Years | 374 (7.9%) | 3,275 (69.3%) |
| 35 to 44 Years | 484 (7.4%) | 4,892 (74.6%) |
| 45 to 54 Years | 974 (15.9%) | 4,333 (70.6%) |
| 55 to 64 Years | 693 (13.4%) | 3,952 (76.6%) |
| 65 to 74 Years | 3,661 (96.3%) | 2,527 (66.5%) |
| 75 Years and over | 1,365 (95.9%) | 791 (55.5%) |
| Total | 13,274 (31.9%) | 26,300 (63.2%) |
Disability Status by Sex by Age in Mableton
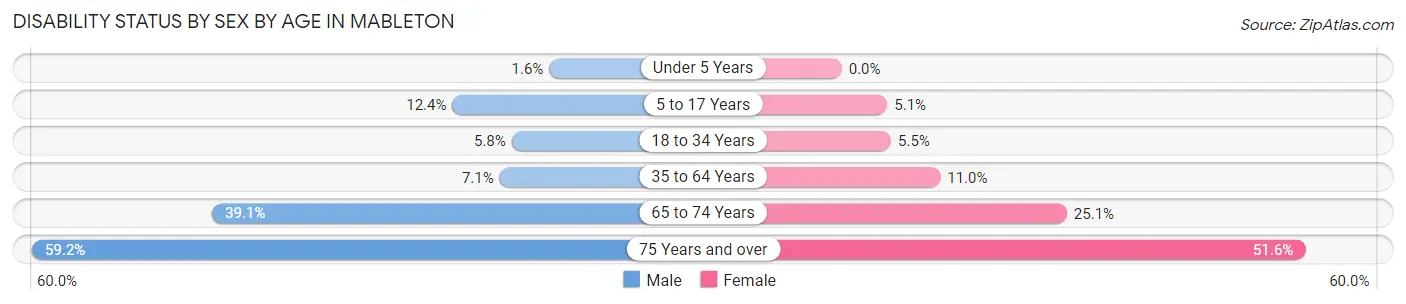
| Age Bracket | Male | Female |
| Under 5 Years | 30 (1.6%) | 0 (0.0%) |
| 5 to 17 Years | 412 (12.4%) | 169 (5.1%) |
| 18 to 34 Years | 232 (5.8%) | 233 (5.5%) |
| 35 to 64 Years | 611 (7.1%) | 1,016 (11.0%) |
| 65 to 74 Years | 694 (39.1%) | 508 (25.1%) |
| 75 Years and over | 361 (59.2%) | 420 (51.6%) |
Disability Class by Sex by Age in Mableton
Disability Class: Hearing Difficulty
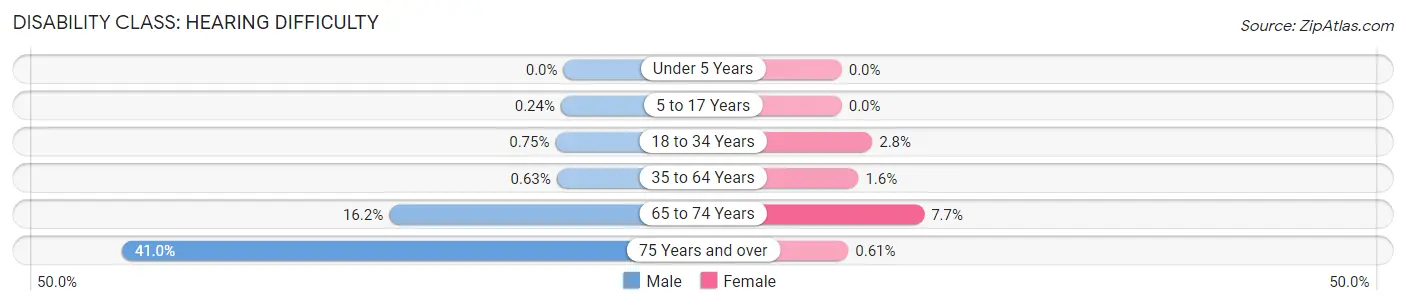
| Age Bracket | Male | Female |
| Under 5 Years | 0 (0.0%) | 0 (0.0%) |
| 5 to 17 Years | 8 (0.2%) | 0 (0.0%) |
| 18 to 34 Years | 30 (0.7%) | 120 (2.8%) |
| 35 to 64 Years | 54 (0.6%) | 144 (1.5%) |
| 65 to 74 Years | 287 (16.2%) | 155 (7.6%) |
| 75 Years and over | 250 (41.0%) | 5 (0.6%) |
Disability Class: Vision Difficulty
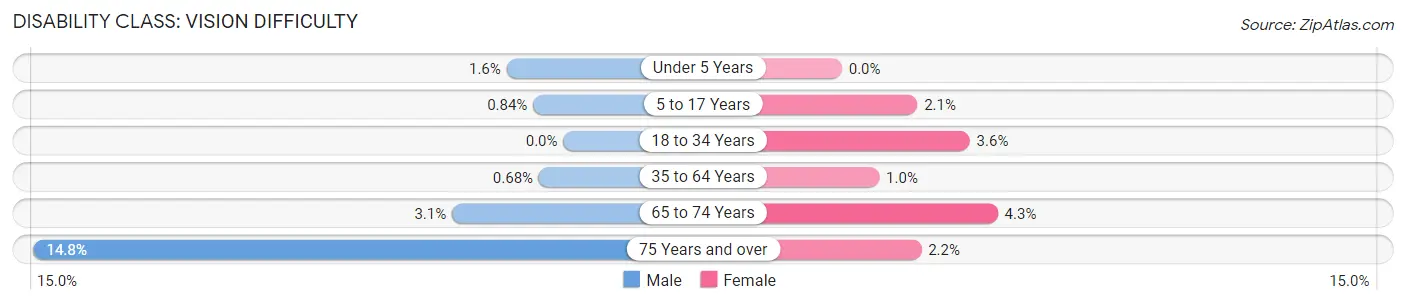
| Age Bracket | Male | Female |
| Under 5 Years | 30 (1.6%) | 0 (0.0%) |
| 5 to 17 Years | 28 (0.8%) | 70 (2.1%) |
| 18 to 34 Years | 0 (0.0%) | 151 (3.6%) |
| 35 to 64 Years | 58 (0.7%) | 96 (1.0%) |
| 65 to 74 Years | 55 (3.1%) | 88 (4.3%) |
| 75 Years and over | 90 (14.7%) | 18 (2.2%) |
Disability Class: Cognitive Difficulty
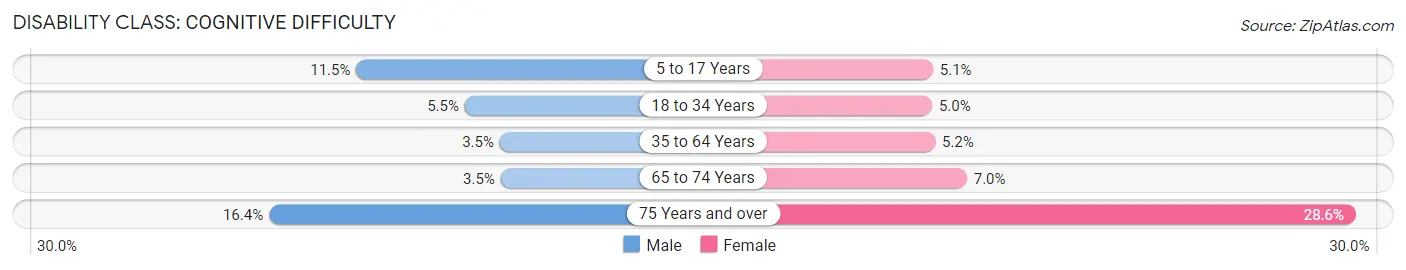
| Age Bracket | Male | Female |
| 5 to 17 Years | 384 (11.5%) | 169 (5.1%) |
| 18 to 34 Years | 221 (5.5%) | 213 (5.0%) |
| 35 to 64 Years | 304 (3.5%) | 481 (5.2%) |
| 65 to 74 Years | 62 (3.5%) | 141 (7.0%) |
| 75 Years and over | 100 (16.4%) | 233 (28.6%) |
Disability Class: Ambulatory Difficulty
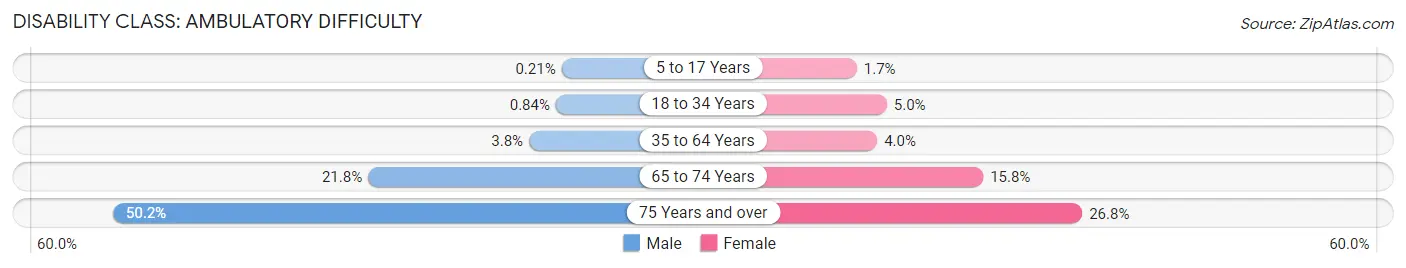
| Age Bracket | Male | Female |
| 5 to 17 Years | 7 (0.2%) | 56 (1.7%) |
| 18 to 34 Years | 34 (0.8%) | 213 (5.0%) |
| 35 to 64 Years | 329 (3.8%) | 366 (4.0%) |
| 65 to 74 Years | 386 (21.8%) | 319 (15.8%) |
| 75 Years and over | 306 (50.2%) | 218 (26.8%) |
Disability Class: Self-Care Difficulty
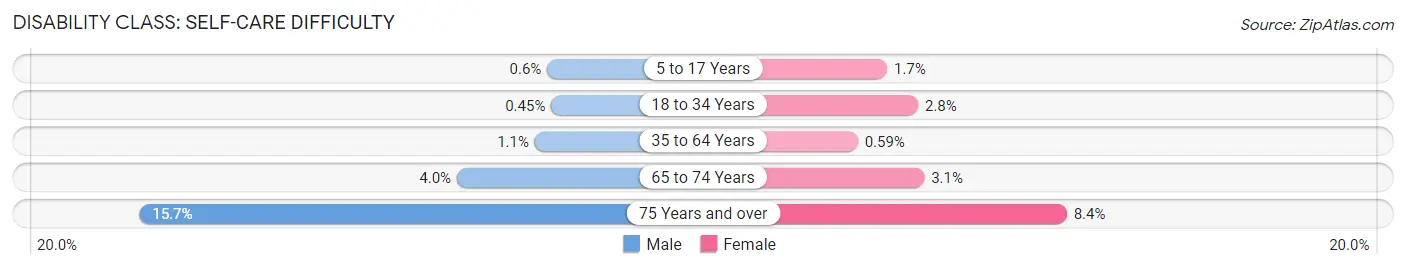
| Age Bracket | Male | Female |
| 5 to 17 Years | 20 (0.6%) | 56 (1.7%) |
| 18 to 34 Years | 18 (0.4%) | 120 (2.8%) |
| 35 to 64 Years | 91 (1.1%) | 55 (0.6%) |
| 65 to 74 Years | 70 (4.0%) | 62 (3.1%) |
| 75 Years and over | 96 (15.7%) | 68 (8.4%) |
Technology Access in Mableton
Computing Device Access in Mableton
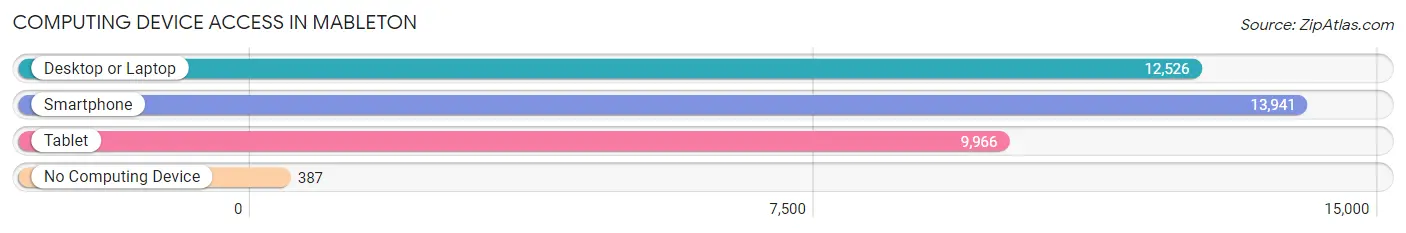
| Device Type | # Households | % Households |
| Desktop or Laptop | 12,526 | 83.2% |
| Smartphone | 13,941 | 92.6% |
| Tablet | 9,966 | 66.2% |
| No Computing Device | 387 | 2.6% |
| Total | 15,054 | 100.0% |
Internet Access in Mableton
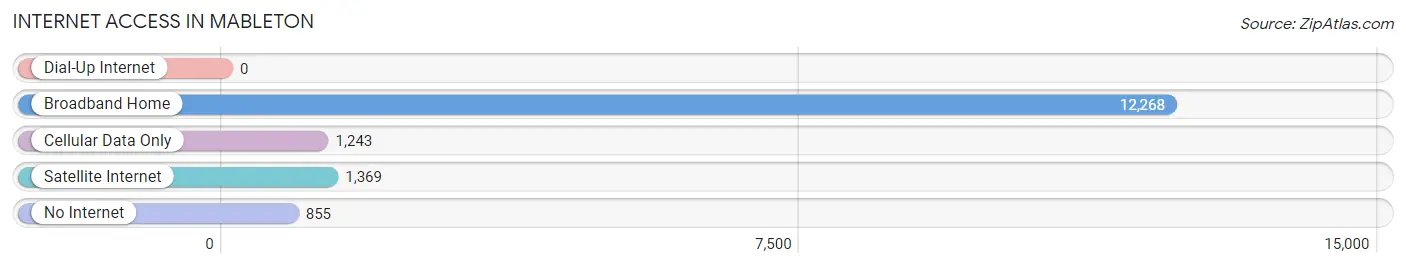
| Internet Type | # Households | % Households |
| Dial-Up Internet | 0 | 0.0% |
| Broadband Home | 12,268 | 81.5% |
| Cellular Data Only | 1,243 | 8.3% |
| Satellite Internet | 1,369 | 9.1% |
| No Internet | 855 | 5.7% |
| Total | 15,054 | 100.0% |
Mableton Summary
Mableton is a census-designated place (CDP) located in Cobb County, Georgia, United States. It is an unincorporated community located just outside of Atlanta, and is part of the Atlanta metropolitan area. As of the 2010 census, the population of Mableton was 37,115.
History
Mableton was founded in 1843 by Robert Mable, a former slave who purchased the land from the Georgia Railroad. The town was originally known as Mable’s Station, and was later renamed Mableton in 1881. The town was incorporated in 1912, and was the first incorporated town in Cobb County.
Mableton was a rural farming community until the 1950s, when the area began to experience rapid growth due to the expansion of Atlanta. The town was annexed by the City of Atlanta in 1972, but was later de-annexed in 1974.
Geography
Mableton is located in northwestern Cobb County, at 33°51'25" North, 84°32'17" West (33.857, -84.538). It is bordered to the north by the City of Atlanta, to the east by Powder Springs, to the south by Austell, and to the west by Smyrna.
The town has a total area of 8.3 square miles, of which 8.2 square miles is land and 0.1 square miles is water.
Economy
Mableton’s economy is largely based on retail and services. The town is home to several large shopping centers, including the Mableton Square Shopping Center, the Mableton Town Center, and the Mableton Marketplace.
The town is also home to several large employers, including the Cobb County School District, WellStar Health System, and the Cobb County Government.
Demographics
As of the 2010 census, there were 37,115 people, 13,845 households, and 9,945 families residing in Mableton. The population density was 4,500 people per square mile. The racial makeup of the town was 63.2% White, 28.2% African American, 0.3% Native American, 2.3% Asian, 0.1% Pacific Islander, 3.7% from other races, and 2.2% from two or more races. Hispanic or Latino of any race were 8.3% of the population.
The median income for a household in Mableton was $50,945, and the median income for a family was $60,945. The per capita income for the town was $25,945. About 8.2% of families and 10.2% of the population were below the poverty line, including 14.2% of those under age 18 and 8.2% of those age 65 or over.
Common Questions
What is the Total Population of Mableton?
Total Population of Mableton is 41,647.
What is the Total Male Population of Mableton?
Total Male Population of Mableton is 20,224.
What is the Total Female Population of Mableton?
Total Female Population of Mableton is 21,423.
What is the Ratio of Males per 100 Females in Mableton?
There are 94.40 Males per 100 Females in Mableton.
What is the Ratio of Females per 100 Males in Mableton?
There are 105.93 Females per 100 Males in Mableton.
What is the Median Population Age in Mableton?
Median Population Age in Mableton is 38.2 Years.
What is the Average Family Size in Mableton
Average Family Size in Mableton is 3.4 People.
What is the Average Household Size in Mableton
Average Household Size in Mableton is 2.8 People.
What is Per Capita Income in Mableton?
Per Capita income in Mableton is $39,584.
What is the Median Family Income in Mableton?
Median Family Income in Mableton is $99,815.
What is the Median Household income in Mableton?
Median Household Income in Mableton is $79,069.
What is Income or Wage Gap in Mableton?
Income or Wage Gap in Mableton is 8.0%.
Women in Mableton earn 92.0 cents for every dollar earned by a man.
What is Family Income Deficit in Mableton?
Family Income Deficit in Mableton is $12,015.
Families that are below poverty line in Mableton earn $12,015 less on average than the poverty threshold level.
What is Inequality or Gini Index in Mableton?
Inequality or Gini Index in Mableton is 0.42.
How Large is the Labor Force in Mableton?
There are 23,461 People in the Labor Forcein in Mableton.
What is the Percentage of People in the Labor Force in Mableton?
72.4% of People are in the Labor Force in Mableton.
What is the Unemployment Rate in Mableton?
Unemployment Rate in Mableton is 6.7%.