Baxley, GA
Baxley Map
Baxley Overview
4,971
TOTAL POPULATION
2,150
MALE POPULATION
2,821
FEMALE POPULATION
76.21
MALES / 100 FEMALES
131.21
FEMALES / 100 MALES
39.5
MEDIAN AGE
3.3
AVG FAMILY SIZE
2.5
AVG HOUSEHOLD SIZE
$19,623
PER CAPITA INCOME
$53,456
AVG FAMILY INCOME
$27,303
AVG HOUSEHOLD INCOME
35.0%
WAGE / INCOME GAP [ % ]
65.0¢/ $1
WAGE / INCOME GAP [ $ ]
$13,856
FAMILY INCOME DEFICIT
0.51
INEQUALITY / GINI INDEX
1,601
LABOR FORCE [ PEOPLE ]
43.1%
PERCENT IN LABOR FORCE
9.9%
UNEMPLOYMENT RATE
Baxley Zip Codes
Baxley Area Codes
Race in Baxley
The most populous races in Baxley are White / Caucasian (3,113 | 62.6%), Black / African American (1,244 | 25.0%), and Hispanic or Latino (676 | 13.6%).
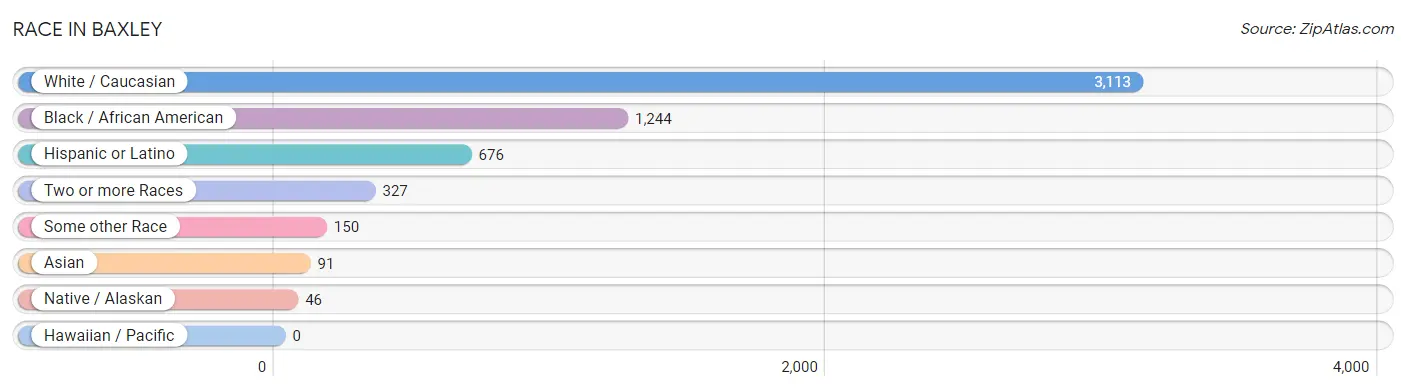
| Race | # Population | % Population |
| Asian | 91 | 1.8% |
| Black / African American | 1,244 | 25.0% |
| Hawaiian / Pacific | 0 | 0.0% |
| Hispanic or Latino | 676 | 13.6% |
| Native / Alaskan | 46 | 0.9% |
| White / Caucasian | 3,113 | 62.6% |
| Two or more Races | 327 | 6.6% |
| Some other Race | 150 | 3.0% |
| Total | 4,971 | 100.0% |
Ancestry in Baxley
The most populous ancestries reported in Baxley are Mexican (642 | 12.9%), American (385 | 7.7%), Irish (206 | 4.1%), French (113 | 2.3%), and Blackfeet (84 | 1.7%), together accounting for 28.7% of all Baxley residents.
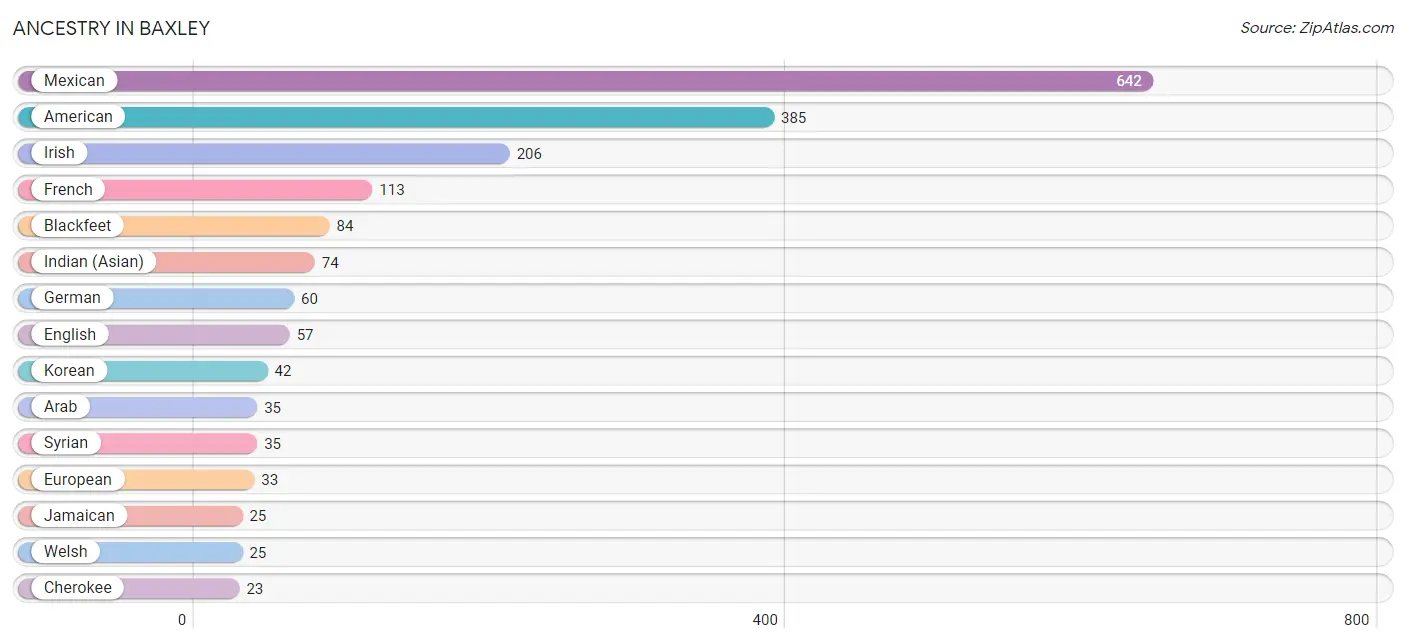
| Ancestry | # Population | % Population |
| African | 2 | 0.0% |
| American | 385 | 7.7% |
| Arab | 35 | 0.7% |
| Blackfeet | 84 | 1.7% |
| Cherokee | 23 | 0.5% |
| Colombian | 14 | 0.3% |
| English | 57 | 1.1% |
| European | 33 | 0.7% |
| French | 113 | 2.3% |
| German | 60 | 1.2% |
| Indian (Asian) | 74 | 1.5% |
| Irish | 206 | 4.1% |
| Jamaican | 25 | 0.5% |
| Korean | 42 | 0.8% |
| Mexican | 642 | 12.9% |
| Scotch-Irish | 13 | 0.3% |
| South American | 14 | 0.3% |
| Subsaharan African | 2 | 0.0% |
| Swedish | 18 | 0.4% |
| Syrian | 35 | 0.7% |
| Welsh | 25 | 0.5% | View All 21 Rows |
Immigrants in Baxley
The most numerous immigrant groups reported in Baxley came from Latin America (416 | 8.4%), Central America (377 | 7.6%), Mexico (377 | 7.6%), Asia (126 | 2.5%), and China (74 | 1.5%), together accounting for 27.6% of all Baxley residents.
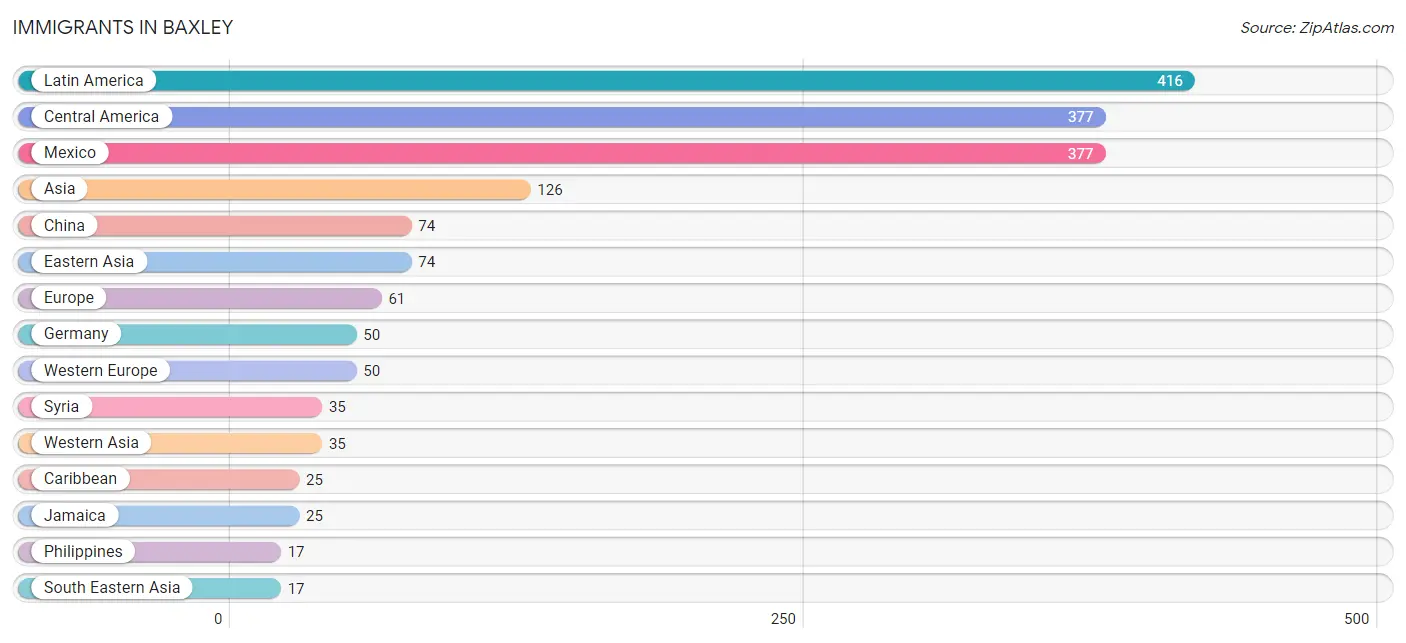
| Immigration Origin | # Population | % Population |
| Asia | 126 | 2.5% |
| Caribbean | 25 | 0.5% |
| Central America | 377 | 7.6% |
| China | 74 | 1.5% |
| Colombia | 14 | 0.3% |
| Eastern Asia | 74 | 1.5% |
| Eastern Europe | 11 | 0.2% |
| Europe | 61 | 1.2% |
| Germany | 50 | 1.0% |
| Jamaica | 25 | 0.5% |
| Latin America | 416 | 8.4% |
| Mexico | 377 | 7.6% |
| Philippines | 17 | 0.3% |
| Romania | 11 | 0.2% |
| South America | 14 | 0.3% |
| South Eastern Asia | 17 | 0.3% |
| Syria | 35 | 0.7% |
| Western Asia | 35 | 0.7% |
| Western Europe | 50 | 1.0% | View All 19 Rows |
Sex and Age in Baxley
Sex and Age in Baxley
The most populous age groups in Baxley are 15 to 19 Years (281 | 13.1%) for men and 45 to 49 Years (273 | 9.7%) for women.
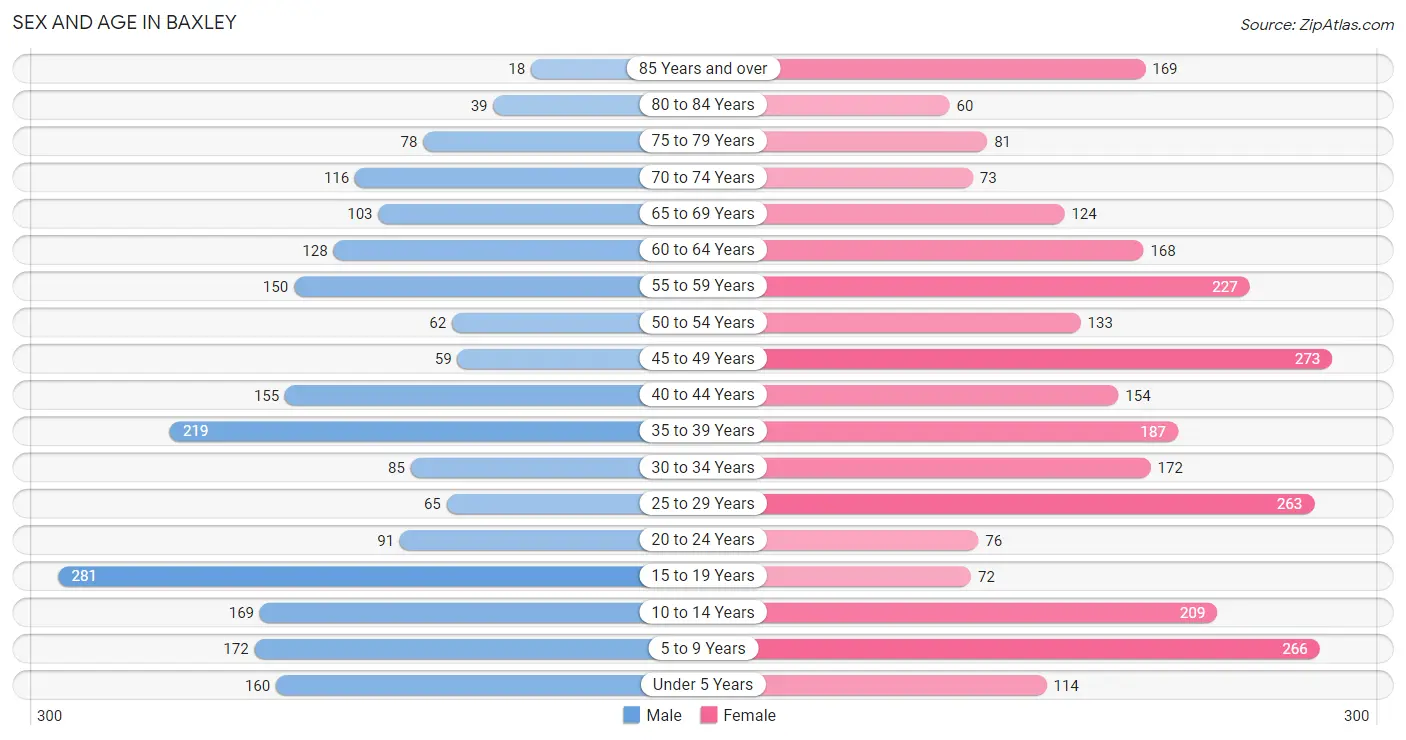
| Age Bracket | Male | Female |
| Under 5 Years | 160 (7.4%) | 114 (4.0%) |
| 5 to 9 Years | 172 (8.0%) | 266 (9.4%) |
| 10 to 14 Years | 169 (7.9%) | 209 (7.4%) |
| 15 to 19 Years | 281 (13.1%) | 72 (2.5%) |
| 20 to 24 Years | 91 (4.2%) | 76 (2.7%) |
| 25 to 29 Years | 65 (3.0%) | 263 (9.3%) |
| 30 to 34 Years | 85 (4.0%) | 172 (6.1%) |
| 35 to 39 Years | 219 (10.2%) | 187 (6.6%) |
| 40 to 44 Years | 155 (7.2%) | 154 (5.5%) |
| 45 to 49 Years | 59 (2.7%) | 273 (9.7%) |
| 50 to 54 Years | 62 (2.9%) | 133 (4.7%) |
| 55 to 59 Years | 150 (7.0%) | 227 (8.1%) |
| 60 to 64 Years | 128 (5.9%) | 168 (6.0%) |
| 65 to 69 Years | 103 (4.8%) | 124 (4.4%) |
| 70 to 74 Years | 116 (5.4%) | 73 (2.6%) |
| 75 to 79 Years | 78 (3.6%) | 81 (2.9%) |
| 80 to 84 Years | 39 (1.8%) | 60 (2.1%) |
| 85 Years and over | 18 (0.8%) | 169 (6.0%) |
| Total | 2,150 (100.0%) | 2,821 (100.0%) |
Families and Households in Baxley
Median Family Size in Baxley
The median family size in Baxley is 3.27 persons per family, with single female/mother families (261 | 22.0%) accounting for the largest median family size of 4.24 persons per family. On the other hand, single male/father families (49 | 4.1%) represent the smallest median family size with 2.53 persons per family.
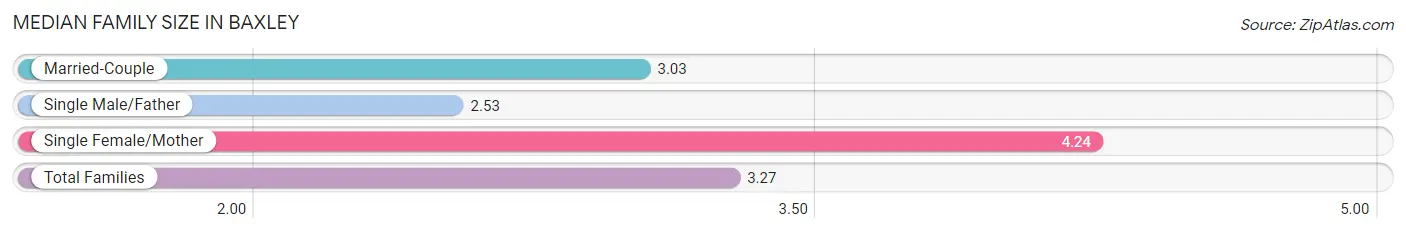
| Family Type | # Families | Family Size |
| Married-Couple | 877 (73.9%) | 3.03 |
| Single Male/Father | 49 (4.1%) | 2.53 |
| Single Female/Mother | 261 (22.0%) | 4.24 |
| Total Families | 1,187 (100.0%) | 3.27 |
Median Household Size in Baxley
The median household size in Baxley is 2.48 persons per household, with single female/mother households (261 | 13.5%) accounting for the largest median household size of 4.59 persons per household. non-family households (741 | 38.4%) represent the smallest median household size with 1.02 persons per household.
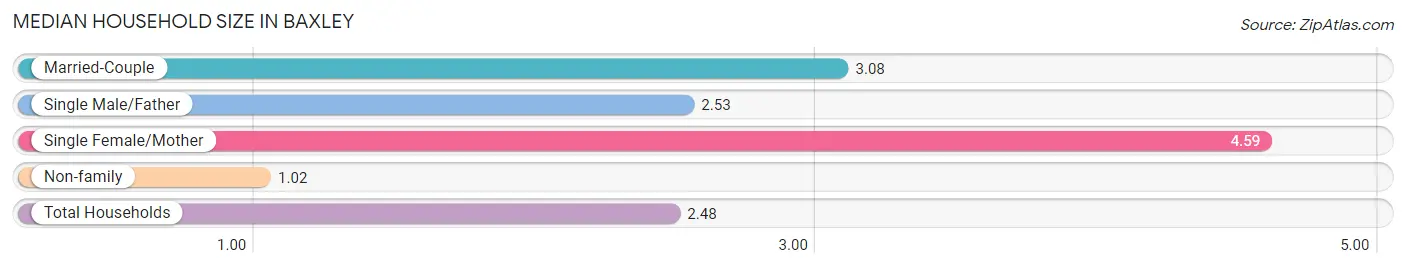
| Household Type | # Households | Household Size |
| Married-Couple | 877 (45.5%) | 3.08 |
| Single Male/Father | 49 (2.5%) | 2.53 |
| Single Female/Mother | 261 (13.5%) | 4.59 |
| Non-family | 741 (38.4%) | 1.02 |
| Total Households | 1,928 (100.0%) | 2.48 |
Household Size by Marriage Status in Baxley
Out of a total of 1,928 households in Baxley, 1,187 (61.6%) are family households, while 741 (38.4%) are nonfamily households. The most numerous type of family households are 2-person households, comprising 388, and the most common type of nonfamily households are 1-person households, comprising 727.
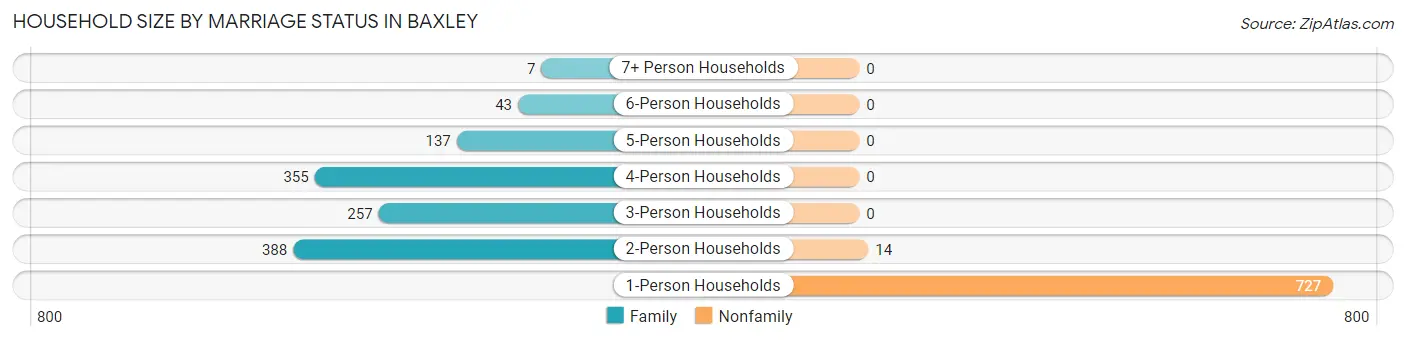
| Household Size | Family Households | Nonfamily Households |
| 1-Person Households | - | 727 (37.7%) |
| 2-Person Households | 388 (20.1%) | 14 (0.7%) |
| 3-Person Households | 257 (13.3%) | 0 (0.0%) |
| 4-Person Households | 355 (18.4%) | 0 (0.0%) |
| 5-Person Households | 137 (7.1%) | 0 (0.0%) |
| 6-Person Households | 43 (2.2%) | 0 (0.0%) |
| 7+ Person Households | 7 (0.4%) | 0 (0.0%) |
| Total | 1,187 (61.6%) | 741 (38.4%) |
Female Fertility in Baxley
Fertility by Age in Baxley
Average fertility rate in Baxley is 30.0 births per 1,000 women. Women in the age bracket of 20 to 34 years have the highest fertility rate with 74.0 births per 1,000 women. Women in the age bracket of 20 to 34 years acount for 100.0% of all women with births.
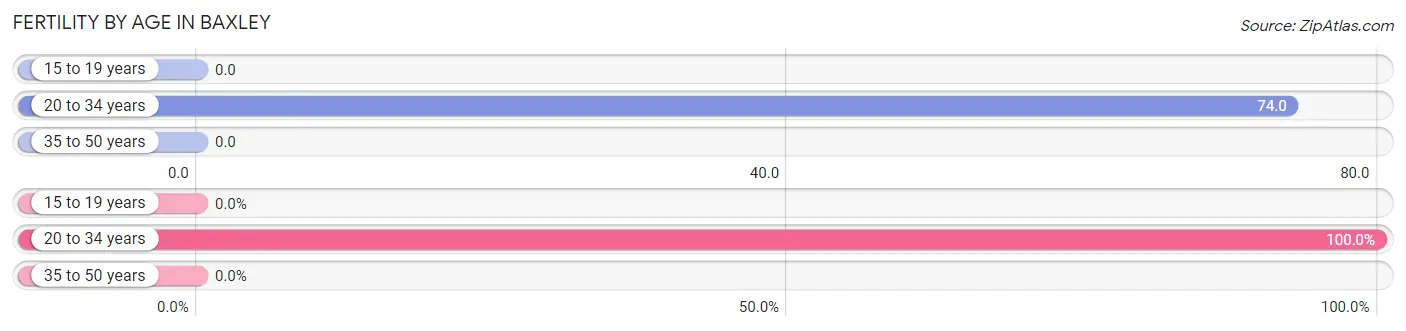
| Age Bracket | Women with Births | Births / 1,000 Women |
| 15 to 19 years | 0 (0.0%) | 0.0 |
| 20 to 34 years | 38 (100.0%) | 74.0 |
| 35 to 50 years | 0 (0.0%) | 0.0 |
| Total | 38 (100.0%) | 30.0 |
Fertility by Age by Marriage Status in Baxley
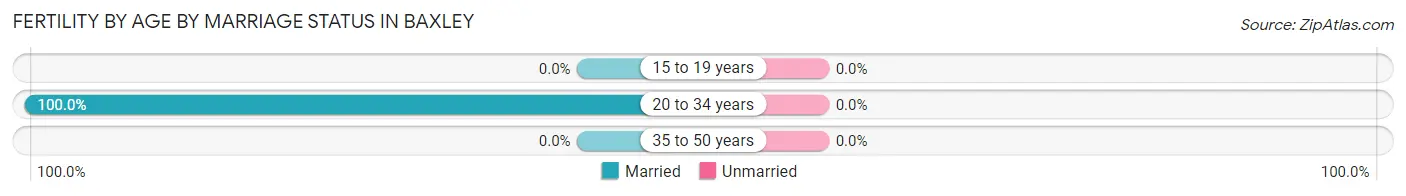
| Age Bracket | Married | Unmarried |
| 15 to 19 years | 0 (0.0%) | 0 (0.0%) |
| 20 to 34 years | 38 (100.0%) | 0 (0.0%) |
| 35 to 50 years | 0 (0.0%) | 0 (0.0%) |
| Total | 38 (100.0%) | 0 (0.0%) |
Fertility by Education in Baxley
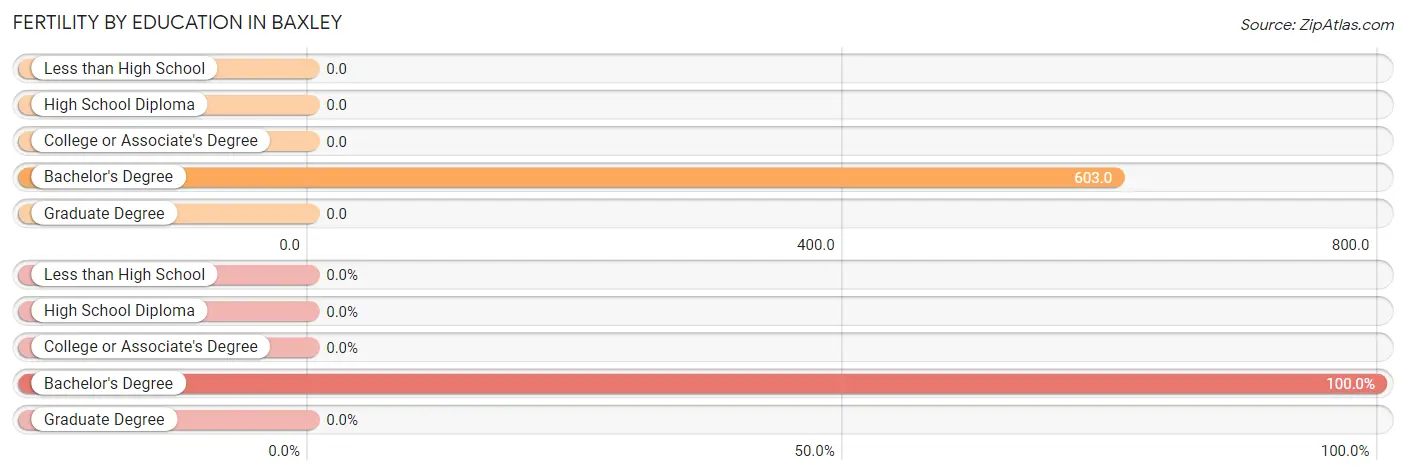
| Educational Attainment | Women with Births | Births / 1,000 Women |
| Less than High School | 0 (0.0%) | 0.0 |
| High School Diploma | 0 (0.0%) | 0.0 |
| College or Associate's Degree | 0 (0.0%) | 0.0 |
| Bachelor's Degree | 38 (100.0%) | 603.0 |
| Graduate Degree | 0 (0.0%) | 0.0 |
| Total | 38 (100.0%) | 30.0 |
Fertility by Education by Marriage Status in Baxley
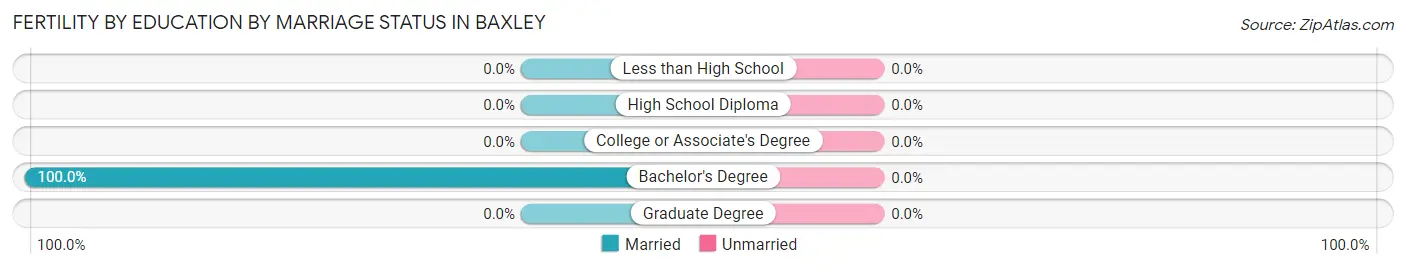
| Educational Attainment | Married | Unmarried |
| Less than High School | 0 (0.0%) | 0 (0.0%) |
| High School Diploma | 0 (0.0%) | 0 (0.0%) |
| College or Associate's Degree | 0 (0.0%) | 0 (0.0%) |
| Bachelor's Degree | 38 (100.0%) | 0 (0.0%) |
| Graduate Degree | 0 (0.0%) | 0 (0.0%) |
| Total | 38 (100.0%) | 0 (0.0%) |
Income in Baxley
Income Overview in Baxley
Per Capita Income in Baxley is $19,623, while median incomes of families and households are $53,456 and $27,303 respectively.
| Characteristic | Number | Measure |
| Per Capita Income | 4,971 | $19,623 |
| Median Family Income | 1,187 | $53,456 |
| Mean Family Income | 1,187 | $64,215 |
| Median Household Income | 1,928 | $27,303 |
| Mean Household Income | 1,928 | $47,570 |
| Income Deficit | 1,187 | $13,856 |
| Wage / Income Gap (%) | 4,971 | 34.98% |
| Wage / Income Gap ($) | 4,971 | 65.02¢ per $1 |
| Gini / Inequality Index | 4,971 | 0.51 |
Earnings by Sex in Baxley
Average Earnings in Baxley are $28,125, $34,335 for men and $22,323 for women, a difference of 35.0%.
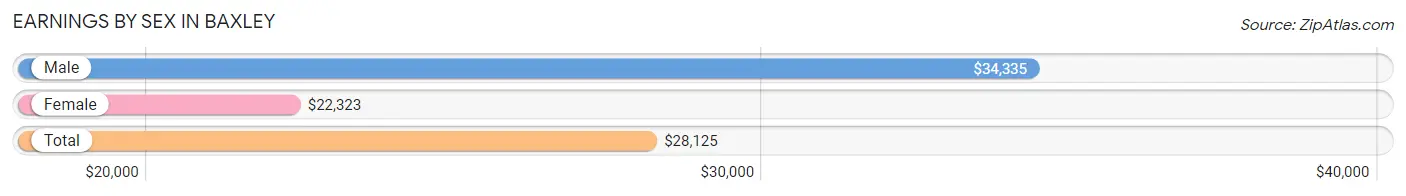
| Sex | Number | Average Earnings |
| Male | 771 (45.2%) | $34,335 |
| Female | 935 (54.8%) | $22,323 |
| Total | 1,706 (100.0%) | $28,125 |
Earnings by Sex by Income Bracket in Baxley
The most common earnings brackets in Baxley are $30,000 to $34,999 for men (126 | 16.3%) and $20,000 to $22,499 for women (148 | 15.8%).
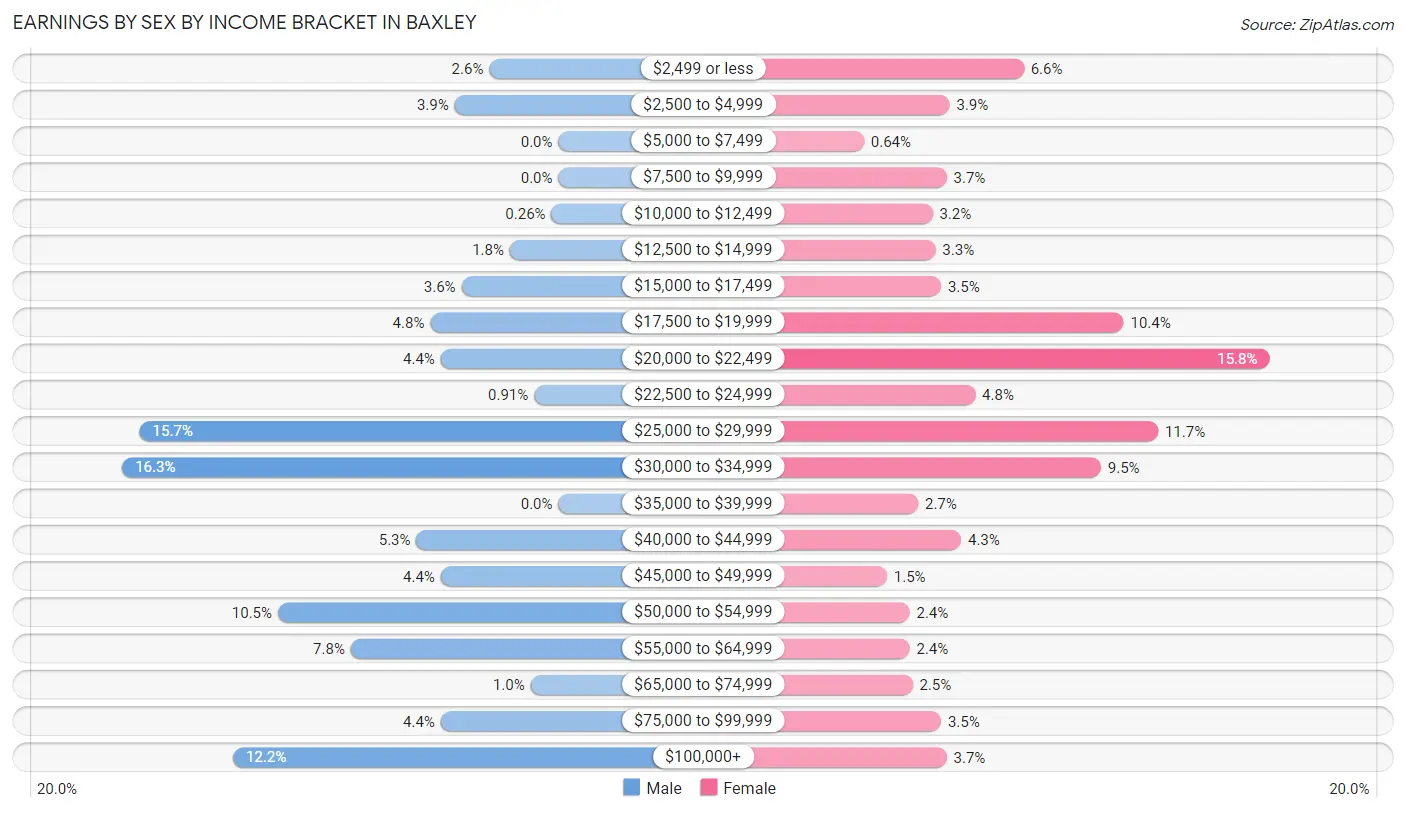
| Income | Male | Female |
| $2,499 or less | 20 (2.6%) | 62 (6.6%) |
| $2,500 to $4,999 | 30 (3.9%) | 36 (3.8%) |
| $5,000 to $7,499 | 0 (0.0%) | 6 (0.6%) |
| $7,500 to $9,999 | 0 (0.0%) | 35 (3.7%) |
| $10,000 to $12,499 | 2 (0.3%) | 30 (3.2%) |
| $12,500 to $14,999 | 14 (1.8%) | 31 (3.3%) |
| $15,000 to $17,499 | 28 (3.6%) | 33 (3.5%) |
| $17,500 to $19,999 | 37 (4.8%) | 97 (10.4%) |
| $20,000 to $22,499 | 34 (4.4%) | 148 (15.8%) |
| $22,500 to $24,999 | 7 (0.9%) | 45 (4.8%) |
| $25,000 to $29,999 | 121 (15.7%) | 109 (11.7%) |
| $30,000 to $34,999 | 126 (16.3%) | 89 (9.5%) |
| $35,000 to $39,999 | 0 (0.0%) | 25 (2.7%) |
| $40,000 to $44,999 | 41 (5.3%) | 40 (4.3%) |
| $45,000 to $49,999 | 34 (4.4%) | 14 (1.5%) |
| $50,000 to $54,999 | 81 (10.5%) | 22 (2.4%) |
| $55,000 to $64,999 | 60 (7.8%) | 22 (2.4%) |
| $65,000 to $74,999 | 8 (1.0%) | 23 (2.5%) |
| $75,000 to $99,999 | 34 (4.4%) | 33 (3.5%) |
| $100,000+ | 94 (12.2%) | 35 (3.7%) |
| Total | 771 (100.0%) | 935 (100.0%) |
Earnings by Sex by Educational Attainment in Baxley
Average earnings in Baxley are $42,821 for men and $22,188 for women, a difference of 48.2%. Men with an educational attainment of college or associate's degree enjoy the highest average annual earnings of $54,602, while those with less than high school education earn the least with $29,243. Women with an educational attainment of graduate degree earn the most with the average annual earnings of $71,848, while those with high school diploma education have the smallest earnings of $19,286.
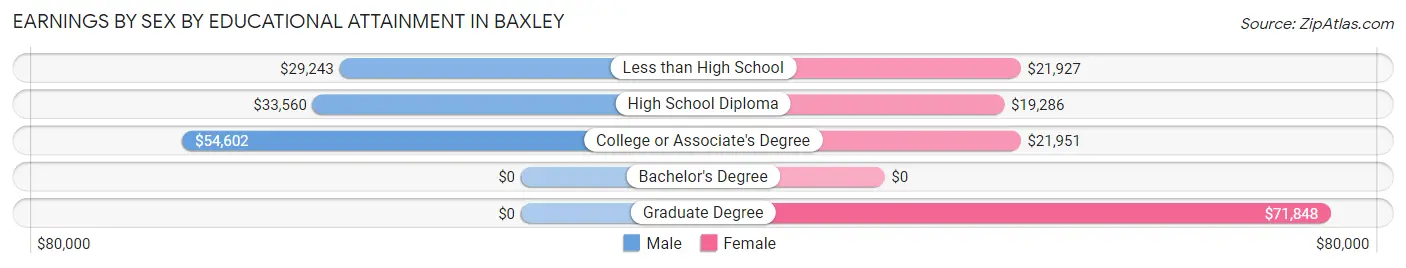
| Educational Attainment | Male Income | Female Income |
| Less than High School | $29,243 | $21,927 |
| High School Diploma | $33,560 | $19,286 |
| College or Associate's Degree | $54,602 | $21,951 |
| Bachelor's Degree | - | - |
| Graduate Degree | - | - |
| Total | $42,821 | $22,188 |
Family Income in Baxley
Family Income Brackets in Baxley
According to the Baxley family income data, there are 407 families falling into the $50,000 to $74,999 income range, which is the most common income bracket and makes up 34.3% of all families. Conversely, the $10,000 to $14,999 income bracket is the least frequent group with only 23 families (1.9%) belonging to this category.
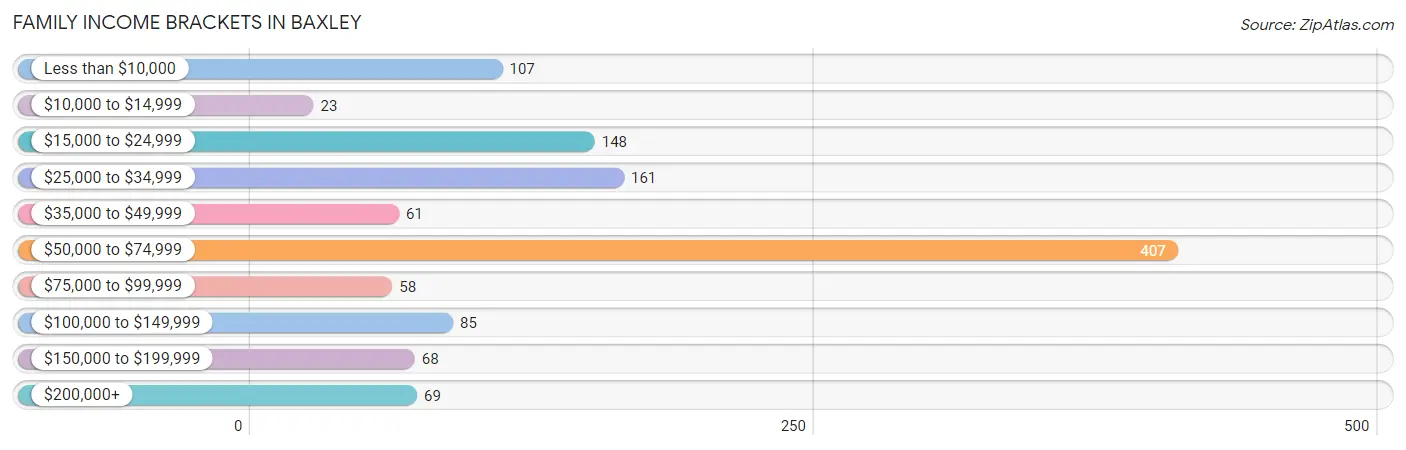
| Income Bracket | # Families | % Families |
| Less than $10,000 | 107 | 9.0% |
| $10,000 to $14,999 | 23 | 1.9% |
| $15,000 to $24,999 | 148 | 12.5% |
| $25,000 to $34,999 | 161 | 13.6% |
| $35,000 to $49,999 | 61 | 5.1% |
| $50,000 to $74,999 | 407 | 34.3% |
| $75,000 to $99,999 | 58 | 4.9% |
| $100,000 to $149,999 | 85 | 7.2% |
| $150,000 to $199,999 | 68 | 5.7% |
| $200,000+ | 69 | 5.8% |
Family Income by Famaliy Size in Baxley
4-person families (357 | 30.1%) account for the highest median family income in Baxley with $51,969 per family, while 2-person families (414 | 34.9%) have the highest median income of $17,280 per family member.
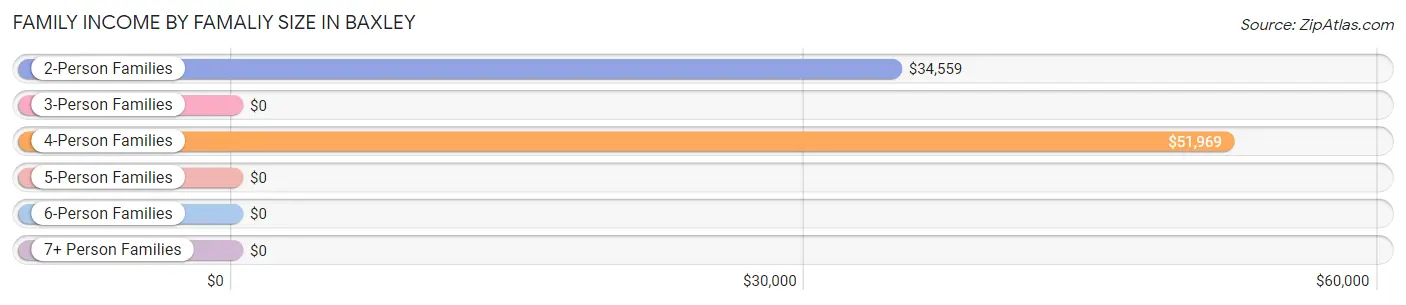
| Income Bracket | # Families | Median Income |
| 2-Person Families | 414 (34.9%) | $34,559 |
| 3-Person Families | 258 (21.7%) | $0 |
| 4-Person Families | 357 (30.1%) | $51,969 |
| 5-Person Families | 108 (9.1%) | $0 |
| 6-Person Families | 43 (3.6%) | $0 |
| 7+ Person Families | 7 (0.6%) | $0 |
| Total | 1,187 (100.0%) | $53,456 |
Family Income by Number of Earners in Baxley
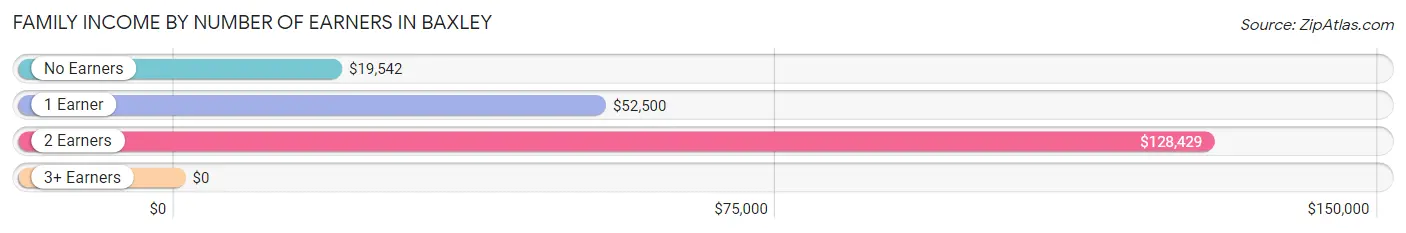
| Number of Earners | # Families | Median Income |
| No Earners | 284 (23.9%) | $19,542 |
| 1 Earner | 526 (44.3%) | $52,500 |
| 2 Earners | 329 (27.7%) | $128,429 |
| 3+ Earners | 48 (4.0%) | $0 |
| Total | 1,187 (100.0%) | $53,456 |
Household Income in Baxley
Household Income Brackets in Baxley
With 478 households falling in the category, the $15,000 to $24,999 income range is the most frequent in Baxley, accounting for 24.8% of all households. In contrast, only 40 households (2.1%) fall into the $35,000 to $49,999 income bracket, making it the least populous group.
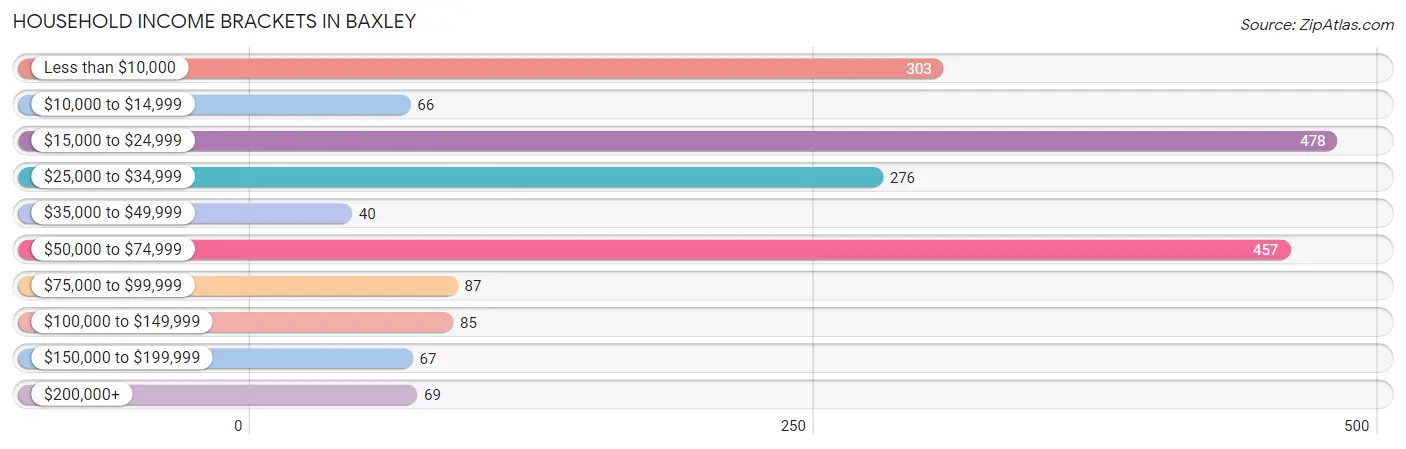
| Income Bracket | # Households | % Households |
| Less than $10,000 | 303 | 15.7% |
| $10,000 to $14,999 | 66 | 3.4% |
| $15,000 to $24,999 | 478 | 24.8% |
| $25,000 to $34,999 | 276 | 14.3% |
| $35,000 to $49,999 | 40 | 2.1% |
| $50,000 to $74,999 | 457 | 23.7% |
| $75,000 to $99,999 | 87 | 4.5% |
| $100,000 to $149,999 | 85 | 4.4% |
| $150,000 to $199,999 | 67 | 3.5% |
| $200,000+ | 69 | 3.6% |
Household Income by Householder Age in Baxley
The median household income in Baxley is $27,303, with the highest median household income of $50,750 found in the 25 to 44 years age bracket for the primary householder. A total of 704 households (36.5%) fall into this category. Meanwhile, the 15 to 24 years age bracket for the primary householder has the lowest median household income of $0, with 62 households (3.2%) in this group.
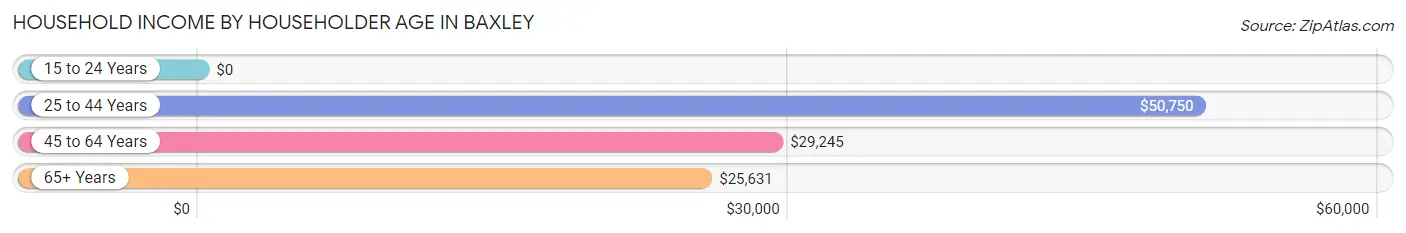
| Income Bracket | # Households | Median Income |
| 15 to 24 Years | 62 (3.2%) | $0 |
| 25 to 44 Years | 704 (36.5%) | $50,750 |
| 45 to 64 Years | 573 (29.7%) | $29,245 |
| 65+ Years | 589 (30.5%) | $25,631 |
| Total | 1,928 (100.0%) | $27,303 |
Poverty in Baxley
Income Below Poverty by Sex and Age in Baxley
With 28.4% poverty level for males and 21.6% for females among the residents of Baxley, 5 year old males and 35 to 44 year old females are the most vulnerable to poverty, with 42 males (100.0%) and 138 females (40.7%) in their respective age groups living below the poverty level.
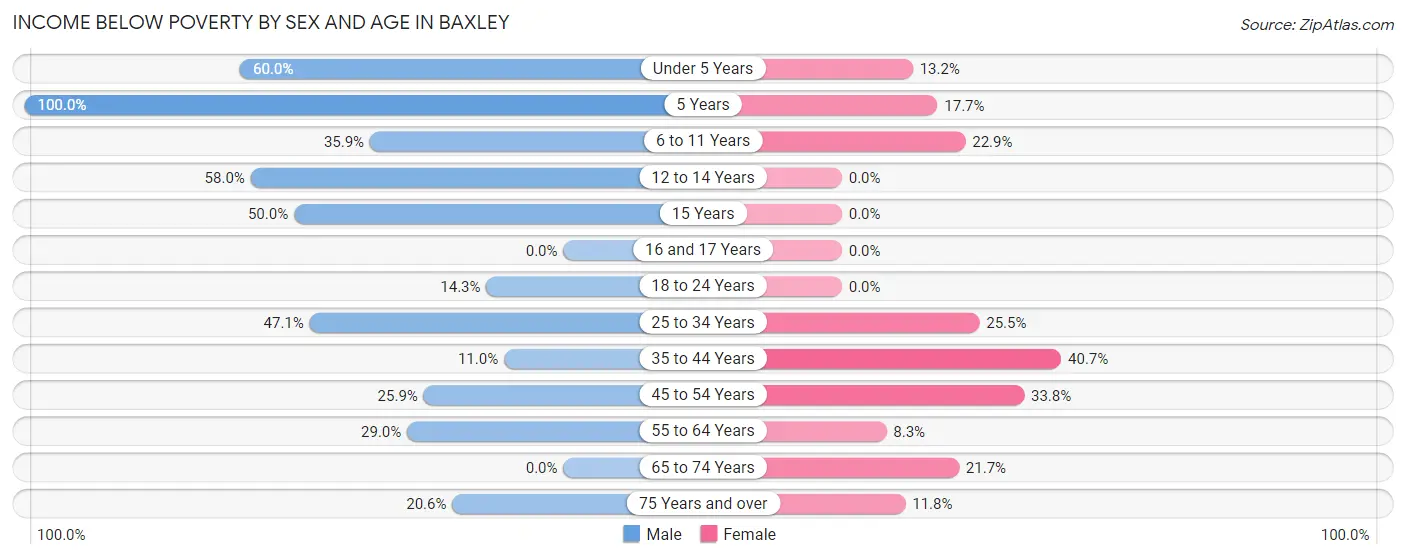
| Age Bracket | Male | Female |
| Under 5 Years | 96 (60.0%) | 15 (13.2%) |
| 5 Years | 42 (100.0%) | 11 (17.7%) |
| 6 to 11 Years | 56 (35.9%) | 80 (22.9%) |
| 12 to 14 Years | 83 (58.0%) | 0 (0.0%) |
| 15 Years | 59 (50.0%) | 0 (0.0%) |
| 16 and 17 Years | 0 (0.0%) | 0 (0.0%) |
| 18 to 24 Years | 18 (14.3%) | 0 (0.0%) |
| 25 to 34 Years | 65 (47.1%) | 111 (25.5%) |
| 35 to 44 Years | 40 (11.0%) | 138 (40.7%) |
| 45 to 54 Years | 28 (25.9%) | 135 (33.8%) |
| 55 to 64 Years | 78 (29.0%) | 32 (8.3%) |
| 65 to 74 Years | 0 (0.0%) | 35 (21.7%) |
| 75 Years and over | 27 (20.6%) | 31 (11.8%) |
| Total | 592 (28.4%) | 588 (21.6%) |
Income Above Poverty by Sex and Age in Baxley
According to the poverty statistics in Baxley, males aged 16 and 17 years and females aged 12 to 14 years are the age groups that are most secure financially, with 100.0% of males and 100.0% of females in these age groups living above the poverty line.
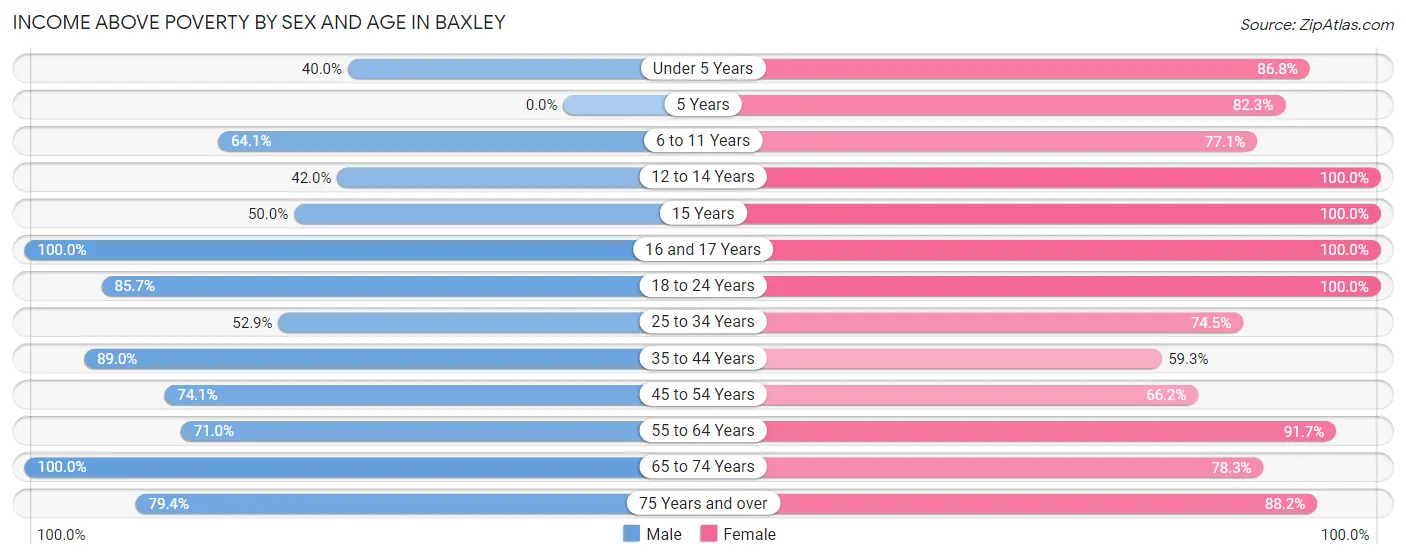
| Age Bracket | Male | Female |
| Under 5 Years | 64 (40.0%) | 99 (86.8%) |
| 5 Years | 0 (0.0%) | 51 (82.3%) |
| 6 to 11 Years | 100 (64.1%) | 269 (77.1%) |
| 12 to 14 Years | 60 (42.0%) | 64 (100.0%) |
| 15 Years | 59 (50.0%) | 49 (100.0%) |
| 16 and 17 Years | 126 (100.0%) | 6 (100.0%) |
| 18 to 24 Years | 108 (85.7%) | 93 (100.0%) |
| 25 to 34 Years | 73 (52.9%) | 324 (74.5%) |
| 35 to 44 Years | 323 (89.0%) | 201 (59.3%) |
| 45 to 54 Years | 80 (74.1%) | 264 (66.2%) |
| 55 to 64 Years | 191 (71.0%) | 355 (91.7%) |
| 65 to 74 Years | 205 (100.0%) | 126 (78.3%) |
| 75 Years and over | 104 (79.4%) | 232 (88.2%) |
| Total | 1,493 (71.6%) | 2,133 (78.4%) |
Income Below Poverty Among Married-Couple Families in Baxley
The poverty statistics for married-couple families in Baxley show that 23.5% or 206 of the total 877 families live below the poverty line. Families with 3 or 4 children have the highest poverty rate of 41.1%, comprising of 37 families. On the other hand, families with 5 or more children have the lowest poverty rate of 0.0%, which includes 0 families.
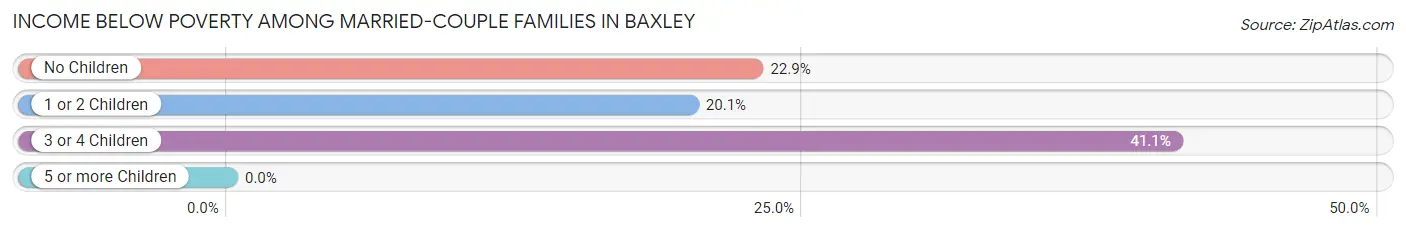
| Children | Above Poverty | Below Poverty |
| No Children | 344 (77.1%) | 102 (22.9%) |
| 1 or 2 Children | 267 (79.9%) | 67 (20.1%) |
| 3 or 4 Children | 53 (58.9%) | 37 (41.1%) |
| 5 or more Children | 7 (100.0%) | 0 (0.0%) |
| Total | 671 (76.5%) | 206 (23.5%) |
Income Below Poverty Among Single-Parent Households in Baxley
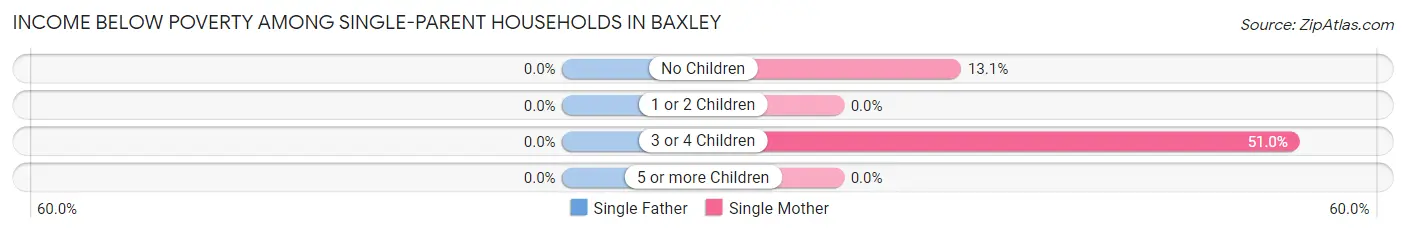
| Children | Single Father | Single Mother |
| No Children | 0 (0.0%) | 8 (13.1%) |
| 1 or 2 Children | 0 (0.0%) | 0 (0.0%) |
| 3 or 4 Children | 0 (0.0%) | 53 (51.0%) |
| 5 or more Children | 0 (0.0%) | 0 (0.0%) |
| Total | 0 (0.0%) | 61 (23.4%) |
Income Below Poverty Among Married-Couple vs Single-Parent Households in Baxley
The poverty data for Baxley shows that 206 of the married-couple family households (23.5%) and 61 of the single-parent households (19.7%) are living below the poverty level. Within the married-couple family households, those with 3 or 4 children have the highest poverty rate, with 37 households (41.1%) falling below the poverty line. Among the single-parent households, those with 3 or 4 children have the highest poverty rate, with 53 household (51.0%) living below poverty.
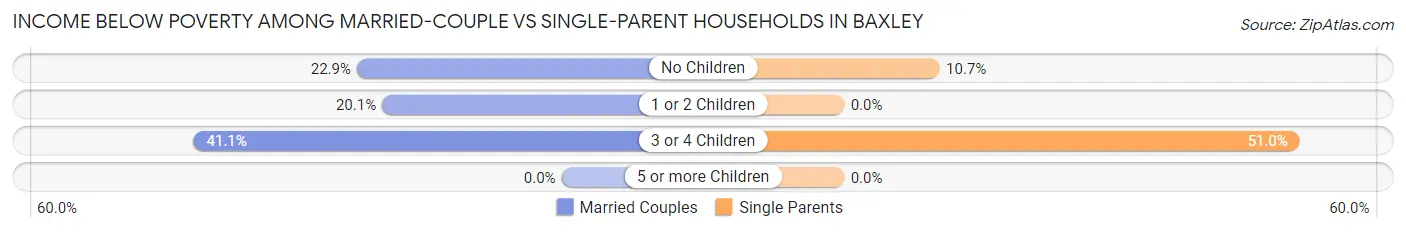
| Children | Married-Couple Families | Single-Parent Households |
| No Children | 102 (22.9%) | 8 (10.7%) |
| 1 or 2 Children | 67 (20.1%) | 0 (0.0%) |
| 3 or 4 Children | 37 (41.1%) | 53 (51.0%) |
| 5 or more Children | 0 (0.0%) | 0 (0.0%) |
| Total | 206 (23.5%) | 61 (19.7%) |
Employment Characteristics in Baxley
Employment by Class of Employer in Baxley
Among the 1,444 employed individuals in Baxley, private company employees (1,065 | 73.8%), local government employees (124 | 8.6%), and not-for-profit organizations (84 | 5.8%) make up the most common classes of employment.
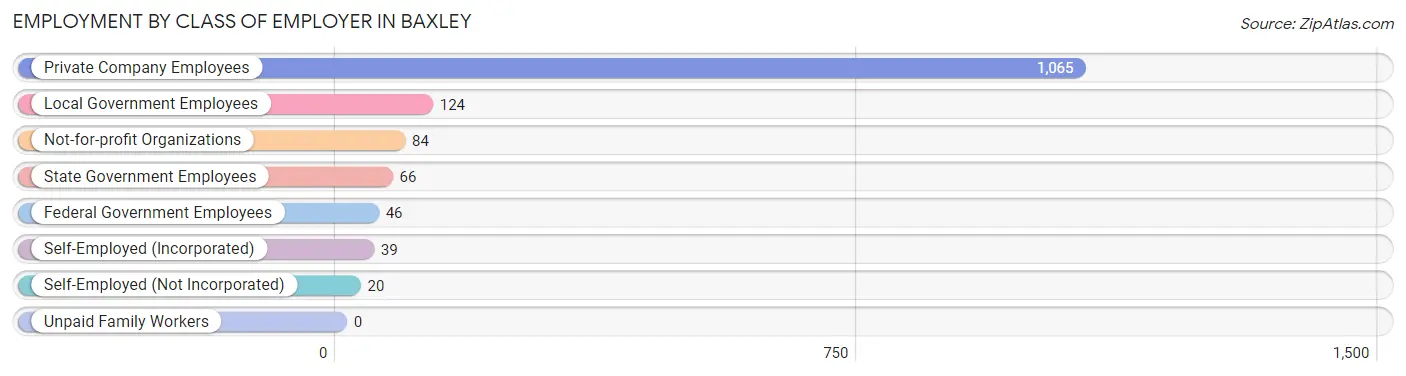
| Employer Class | # Employees | % Employees |
| Private Company Employees | 1,065 | 73.8% |
| Self-Employed (Incorporated) | 39 | 2.7% |
| Self-Employed (Not Incorporated) | 20 | 1.4% |
| Not-for-profit Organizations | 84 | 5.8% |
| Local Government Employees | 124 | 8.6% |
| State Government Employees | 66 | 4.6% |
| Federal Government Employees | 46 | 3.2% |
| Unpaid Family Workers | 0 | 0.0% |
| Total | 1,444 | 100.0% |
Employment Status by Age in Baxley
According to the labor force statistics for Baxley, out of the total population over 16 years of age (3,714), 43.1% or 1,601 individuals are in the labor force, with 9.9% or 158 of them unemployed. The age group with the highest labor force participation rate is 25 to 29 years, with 73.8% or 242 individuals in the labor force. Within the labor force, the 20 to 24 years age range has the highest percentage of unemployed individuals, with 56.1% or 69 of them being unemployed.
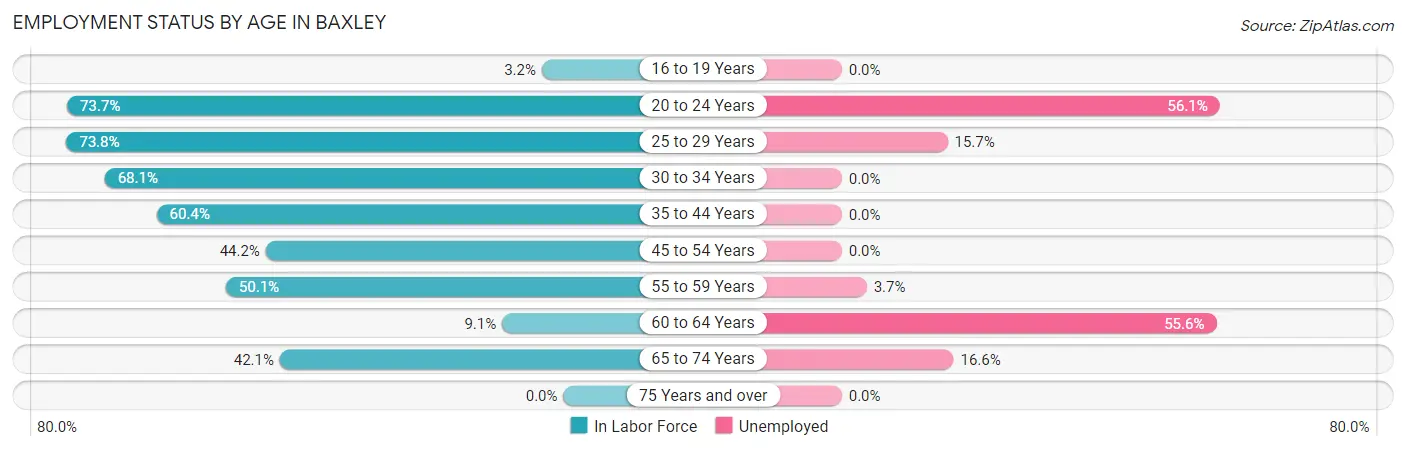
| Age Bracket | In Labor Force | Unemployed |
| 16 to 19 Years | 6 (3.2%) | 0 (0.0%) |
| 20 to 24 Years | 123 (73.7%) | 69 (56.1%) |
| 25 to 29 Years | 242 (73.8%) | 38 (15.7%) |
| 30 to 34 Years | 175 (68.1%) | 0 (0.0%) |
| 35 to 44 Years | 432 (60.4%) | 0 (0.0%) |
| 45 to 54 Years | 233 (44.2%) | 0 (0.0%) |
| 55 to 59 Years | 189 (50.1%) | 7 (3.7%) |
| 60 to 64 Years | 27 (9.1%) | 15 (55.6%) |
| 65 to 74 Years | 175 (42.1%) | 29 (16.6%) |
| 75 Years and over | 0 (0.0%) | 0 (0.0%) |
| Total | 1,601 (43.1%) | 158 (9.9%) |
Employment Status by Educational Attainment in Baxley
According to labor force statistics for Baxley, 51.9% of individuals (1,298) out of the total population between 25 and 64 years of age (2,500) are in the labor force, with 4.7% or 61 of them being unemployed. The group with the highest labor force participation rate are those with the educational attainment of bachelor's degree or higher, with 75.8% or 201 individuals in the labor force. Within the labor force, individuals with bachelor's degree or higher education have the highest percentage of unemployment, with 22.4% or 45 of them being unemployed.
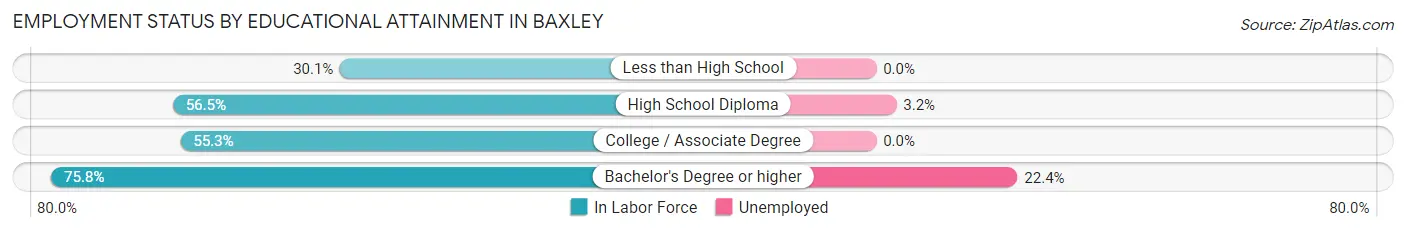
| Educational Attainment | In Labor Force | Unemployed |
| Less than High School | 178 (30.1%) | 0 (0.0%) |
| High School Diploma | 462 (56.5%) | 26 (3.2%) |
| College / Associate Degree | 457 (55.3%) | 0 (0.0%) |
| Bachelor's Degree or higher | 201 (75.8%) | 59 (22.4%) |
| Total | 1,298 (51.9%) | 118 (4.7%) |
Employment Occupations by Sex in Baxley
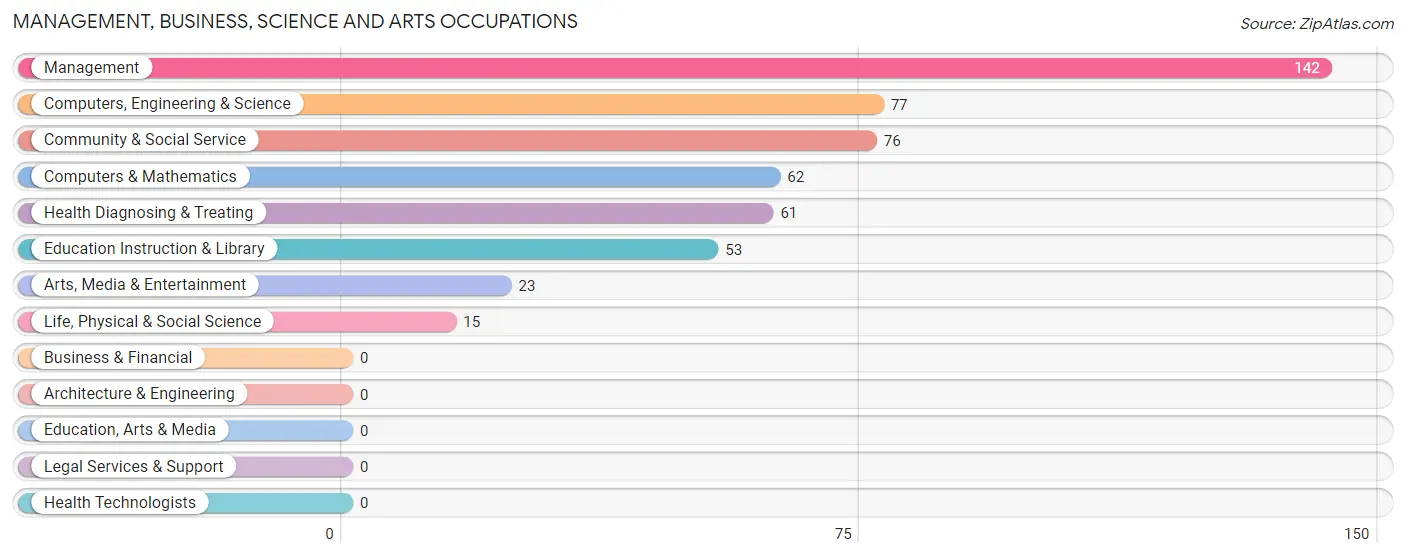
Management, Business, Science and Arts Occupations
The most common Management, Business, Science and Arts occupations in Baxley are Management (142 | 9.9%), Computers, Engineering & Science (77 | 5.4%), Community & Social Service (76 | 5.3%), Computers & Mathematics (62 | 4.3%), and Health Diagnosing & Treating (61 | 4.3%).
Management, Business, Science and Arts Occupations by Sex
Within the Management, Business, Science and Arts occupations in Baxley, the most male-oriented occupations are Life, Physical & Social Science (100.0%), Computers, Engineering & Science (72.7%), and Computers & Mathematics (66.1%), while the most female-oriented occupations are Health Diagnosing & Treating (100.0%), Education Instruction & Library (64.1%), and Community & Social Service (60.5%).
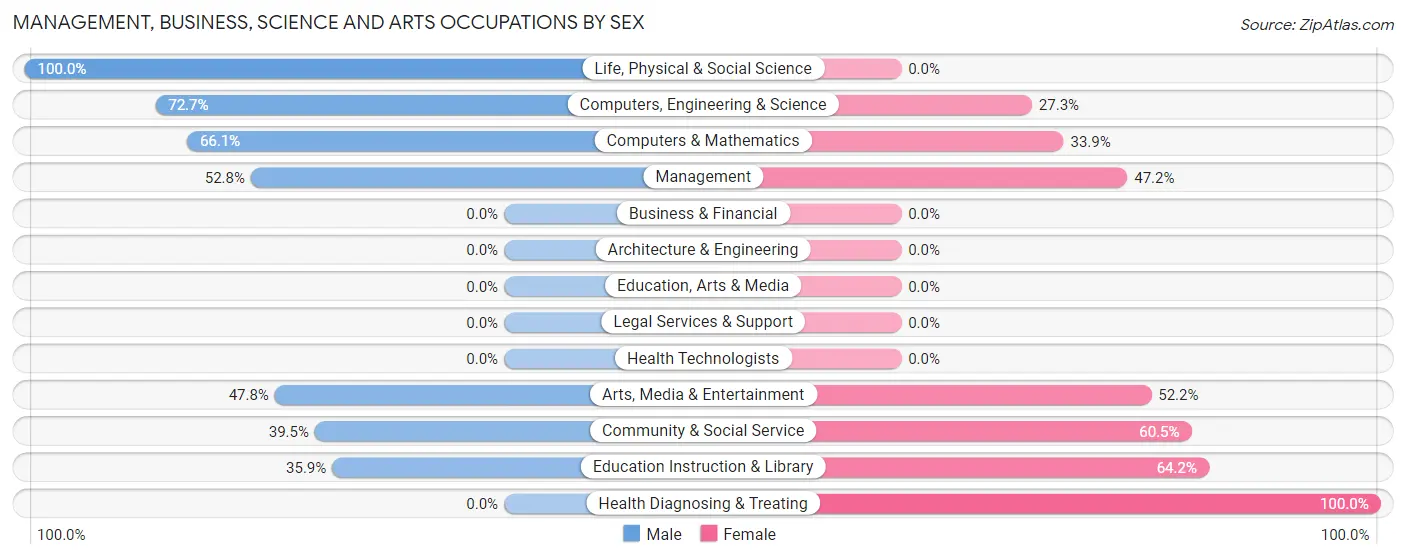
| Occupation | Male | Female |
| Management | 75 (52.8%) | 67 (47.2%) |
| Business & Financial | 0 (0.0%) | 0 (0.0%) |
| Computers, Engineering & Science | 56 (72.7%) | 21 (27.3%) |
| Computers & Mathematics | 41 (66.1%) | 21 (33.9%) |
| Architecture & Engineering | 0 (0.0%) | 0 (0.0%) |
| Life, Physical & Social Science | 15 (100.0%) | 0 (0.0%) |
| Community & Social Service | 30 (39.5%) | 46 (60.5%) |
| Education, Arts & Media | 0 (0.0%) | 0 (0.0%) |
| Legal Services & Support | 0 (0.0%) | 0 (0.0%) |
| Education Instruction & Library | 19 (35.8%) | 34 (64.1%) |
| Arts, Media & Entertainment | 11 (47.8%) | 12 (52.2%) |
| Health Diagnosing & Treating | 0 (0.0%) | 61 (100.0%) |
| Health Technologists | 0 (0.0%) | 0 (0.0%) |
| Total (Category) | 161 (45.2%) | 195 (54.8%) |
| Total (Overall) | 657 (45.8%) | 777 (54.2%) |
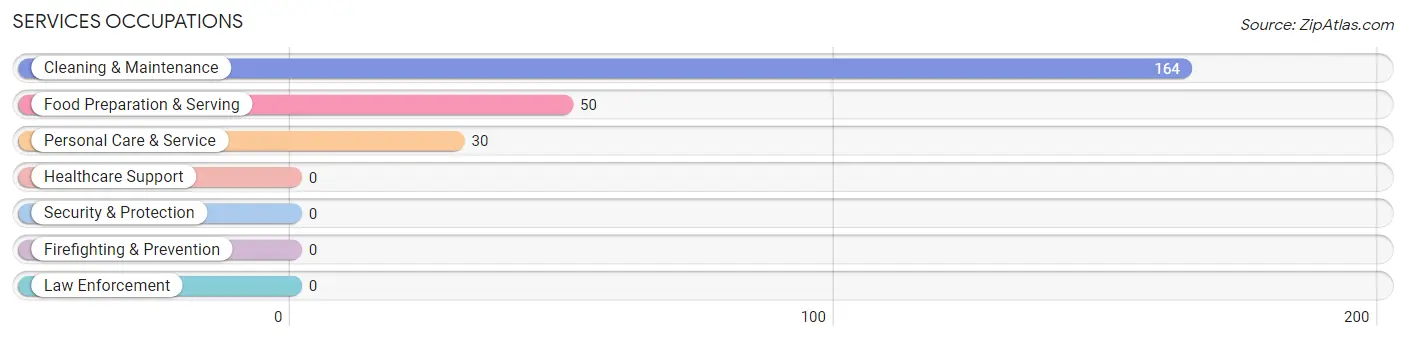
Services Occupations
The most common Services occupations in Baxley are Cleaning & Maintenance (164 | 11.4%), Food Preparation & Serving (50 | 3.5%), and Personal Care & Service (30 | 2.1%).
Services Occupations by Sex
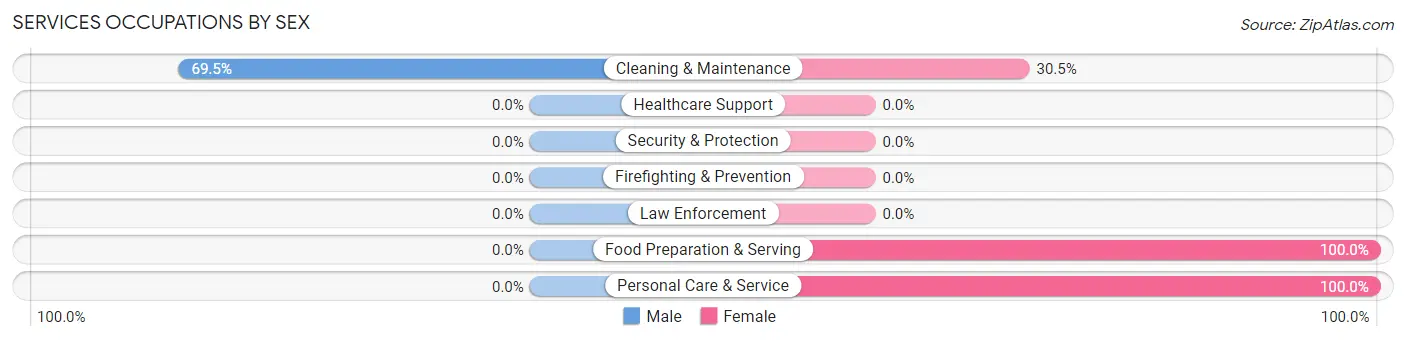
| Occupation | Male | Female |
| Healthcare Support | 0 (0.0%) | 0 (0.0%) |
| Security & Protection | 0 (0.0%) | 0 (0.0%) |
| Firefighting & Prevention | 0 (0.0%) | 0 (0.0%) |
| Law Enforcement | 0 (0.0%) | 0 (0.0%) |
| Food Preparation & Serving | 0 (0.0%) | 50 (100.0%) |
| Cleaning & Maintenance | 114 (69.5%) | 50 (30.5%) |
| Personal Care & Service | 0 (0.0%) | 30 (100.0%) |
| Total (Category) | 114 (46.7%) | 130 (53.3%) |
| Total (Overall) | 657 (45.8%) | 777 (54.2%) |
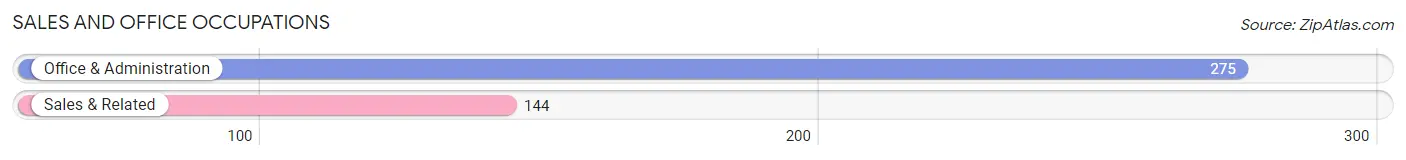
Sales and Office Occupations
The most common Sales and Office occupations in Baxley are Office & Administration (275 | 19.2%), and Sales & Related (144 | 10.0%).
Sales and Office Occupations by Sex
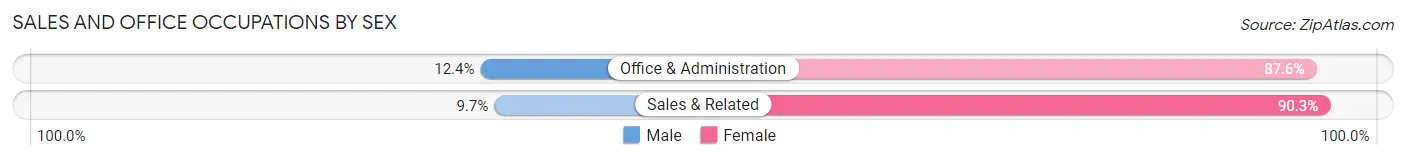
| Occupation | Male | Female |
| Sales & Related | 14 (9.7%) | 130 (90.3%) |
| Office & Administration | 34 (12.4%) | 241 (87.6%) |
| Total (Category) | 48 (11.5%) | 371 (88.5%) |
| Total (Overall) | 657 (45.8%) | 777 (54.2%) |
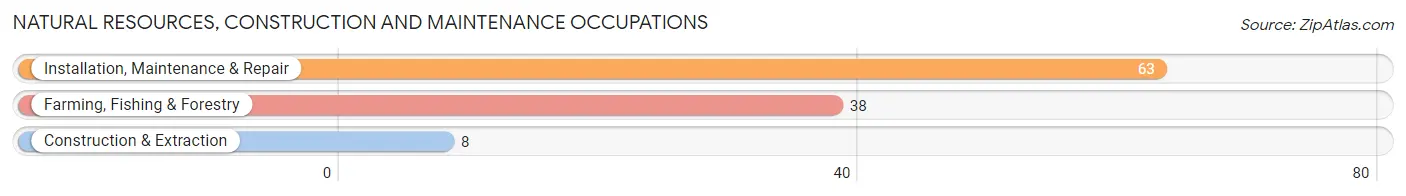
Natural Resources, Construction and Maintenance Occupations
The most common Natural Resources, Construction and Maintenance occupations in Baxley are Installation, Maintenance & Repair (63 | 4.4%), Farming, Fishing & Forestry (38 | 2.6%), and Construction & Extraction (8 | 0.6%).
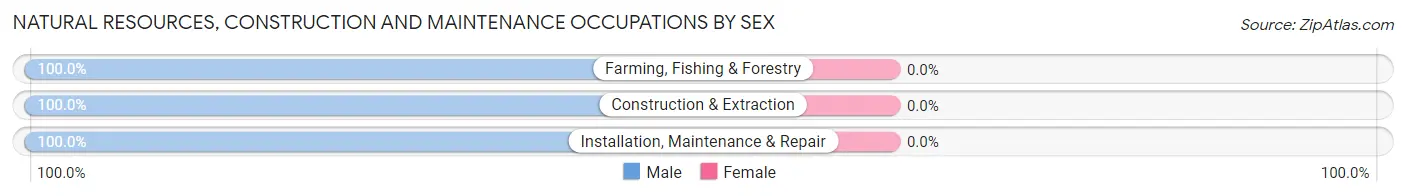
Natural Resources, Construction and Maintenance Occupations by Sex
| Occupation | Male | Female |
| Farming, Fishing & Forestry | 38 (100.0%) | 0 (0.0%) |
| Construction & Extraction | 8 (100.0%) | 0 (0.0%) |
| Installation, Maintenance & Repair | 63 (100.0%) | 0 (0.0%) |
| Total (Category) | 109 (100.0%) | 0 (0.0%) |
| Total (Overall) | 657 (45.8%) | 777 (54.2%) |
Production, Transportation and Moving Occupations
The most common Production, Transportation and Moving occupations in Baxley are Material Moving (197 | 13.7%), Production (97 | 6.8%), and Transportation (12 | 0.8%).
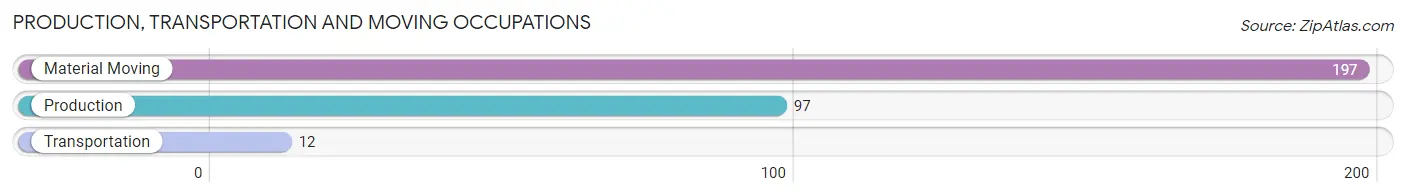
Production, Transportation and Moving Occupations by Sex
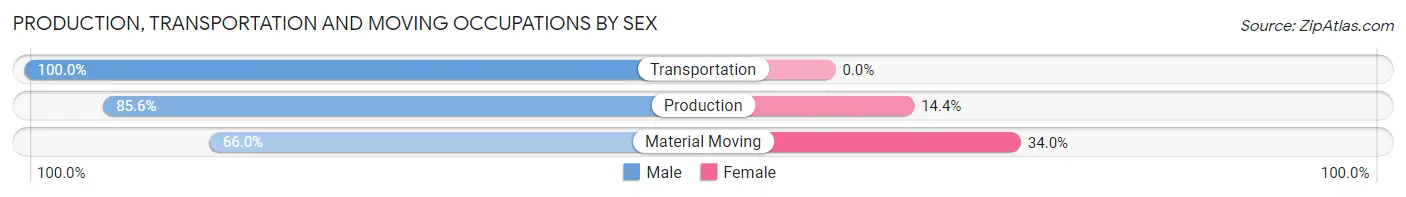
| Occupation | Male | Female |
| Production | 83 (85.6%) | 14 (14.4%) |
| Transportation | 12 (100.0%) | 0 (0.0%) |
| Material Moving | 130 (66.0%) | 67 (34.0%) |
| Total (Category) | 225 (73.5%) | 81 (26.5%) |
| Total (Overall) | 657 (45.8%) | 777 (54.2%) |
Employment Industries by Sex in Baxley
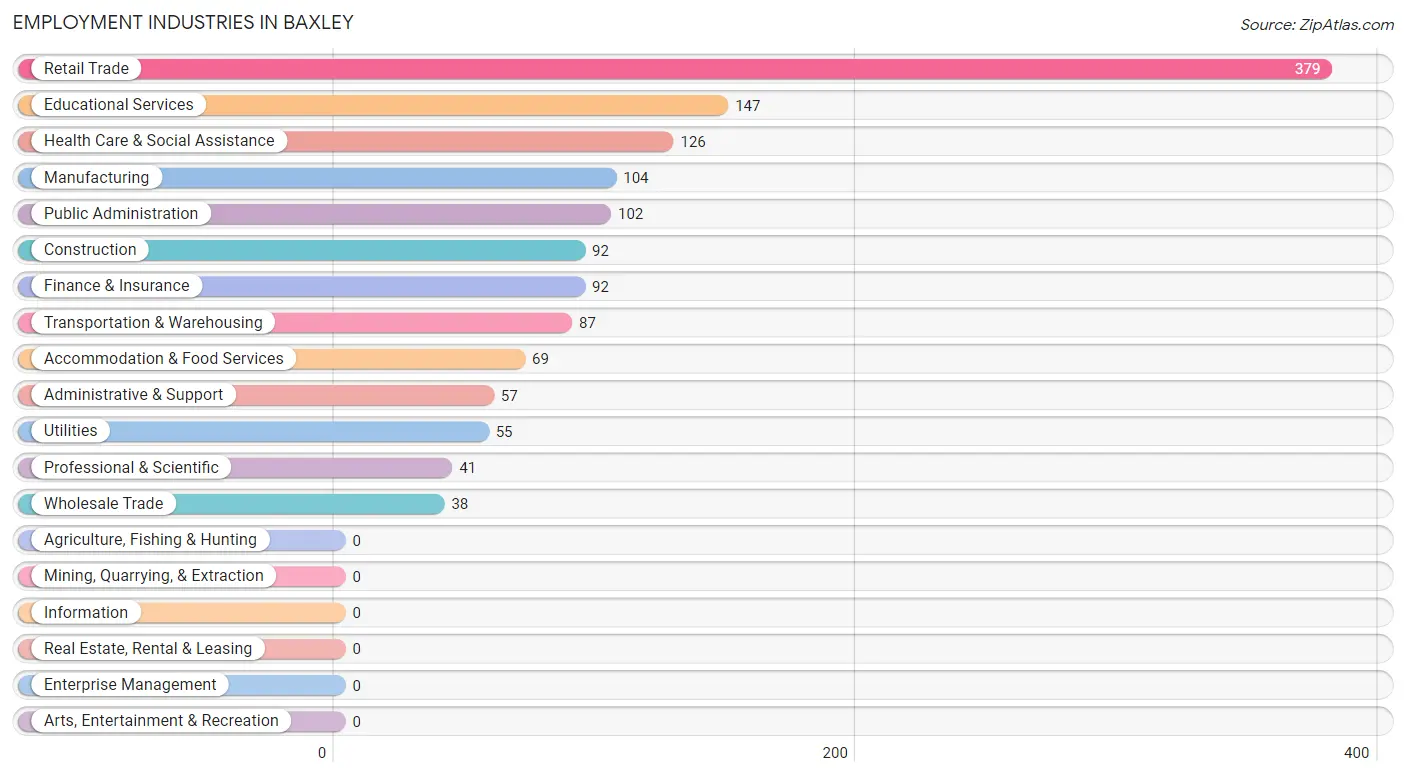
Employment Industries in Baxley
The major employment industries in Baxley include Retail Trade (379 | 26.4%), Educational Services (147 | 10.2%), Health Care & Social Assistance (126 | 8.8%), Manufacturing (104 | 7.2%), and Public Administration (102 | 7.1%).
Employment Industries by Sex in Baxley
The Baxley industries that see more men than women are Manufacturing (100.0%), Wholesale Trade (100.0%), and Transportation & Warehousing (100.0%), whereas the industries that tend to have a higher number of women are Finance & Insurance (100.0%), Accommodation & Food Services (100.0%), and Retail Trade (83.1%).
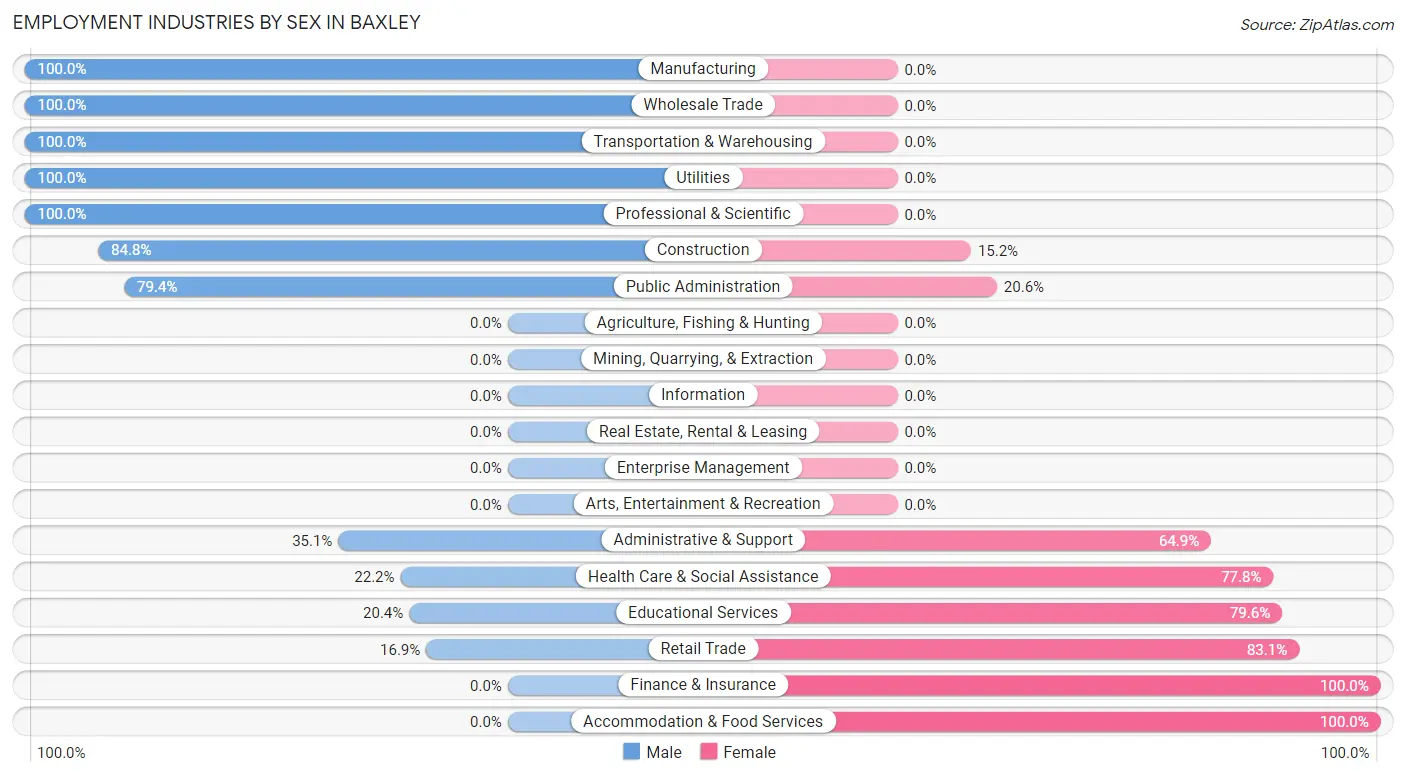
| Industry | Male | Female |
| Agriculture, Fishing & Hunting | 0 (0.0%) | 0 (0.0%) |
| Mining, Quarrying, & Extraction | 0 (0.0%) | 0 (0.0%) |
| Construction | 78 (84.8%) | 14 (15.2%) |
| Manufacturing | 104 (100.0%) | 0 (0.0%) |
| Wholesale Trade | 38 (100.0%) | 0 (0.0%) |
| Retail Trade | 64 (16.9%) | 315 (83.1%) |
| Transportation & Warehousing | 87 (100.0%) | 0 (0.0%) |
| Utilities | 55 (100.0%) | 0 (0.0%) |
| Information | 0 (0.0%) | 0 (0.0%) |
| Finance & Insurance | 0 (0.0%) | 92 (100.0%) |
| Real Estate, Rental & Leasing | 0 (0.0%) | 0 (0.0%) |
| Professional & Scientific | 41 (100.0%) | 0 (0.0%) |
| Enterprise Management | 0 (0.0%) | 0 (0.0%) |
| Administrative & Support | 20 (35.1%) | 37 (64.9%) |
| Educational Services | 30 (20.4%) | 117 (79.6%) |
| Health Care & Social Assistance | 28 (22.2%) | 98 (77.8%) |
| Arts, Entertainment & Recreation | 0 (0.0%) | 0 (0.0%) |
| Accommodation & Food Services | 0 (0.0%) | 69 (100.0%) |
| Public Administration | 81 (79.4%) | 21 (20.6%) |
| Total | 657 (45.8%) | 777 (54.2%) |
Education in Baxley
School Enrollment in Baxley
The most common levels of schooling among the 1,277 students in Baxley are elementary school (393 | 30.8%), middle school (351 | 27.5%), and high school (215 | 16.8%).
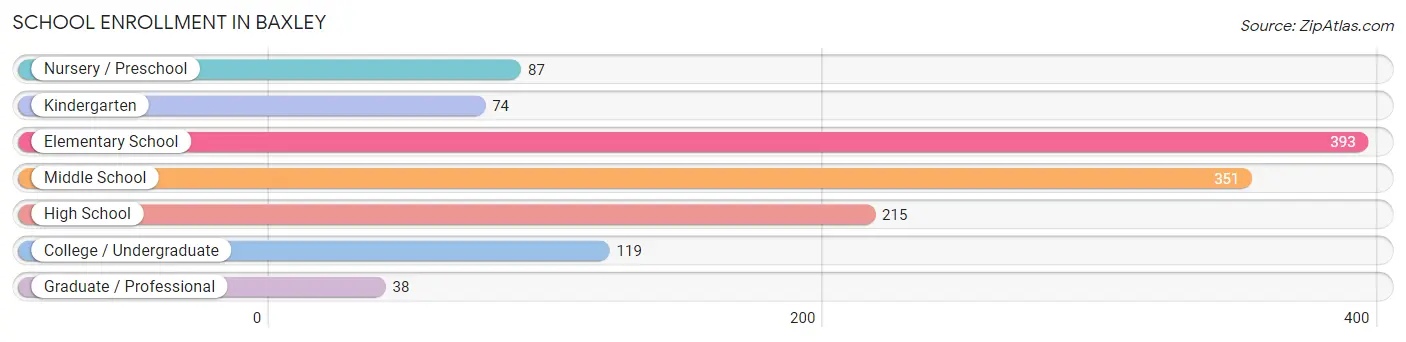
| School Level | # Students | % Students |
| Nursery / Preschool | 87 | 6.8% |
| Kindergarten | 74 | 5.8% |
| Elementary School | 393 | 30.8% |
| Middle School | 351 | 27.5% |
| High School | 215 | 16.8% |
| College / Undergraduate | 119 | 9.3% |
| Graduate / Professional | 38 | 3.0% |
| Total | 1,277 | 100.0% |
School Enrollment by Age by Funding Source in Baxley
Out of a total of 1,277 students who are enrolled in schools in Baxley, 45 (3.5%) attend a private institution, while the remaining 1,232 (96.5%) are enrolled in public schools. The age group of 3 to 4 year olds has the highest likelihood of being enrolled in private schools, with 20 (35.1% in the age bracket) enrolled. Conversely, the age group of 10 to 14 year olds has the lowest likelihood of being enrolled in a private school, with 378 (100.0% in the age bracket) attending a public institution.
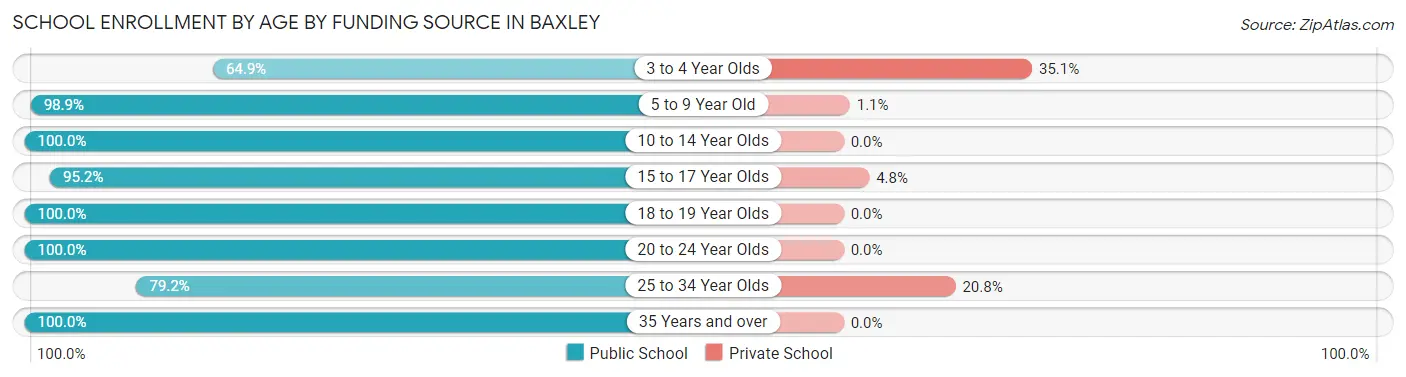
| Age Bracket | Public School | Private School |
| 3 to 4 Year Olds | 37 (64.9%) | 20 (35.1%) |
| 5 to 9 Year Old | 433 (98.9%) | 5 (1.1%) |
| 10 to 14 Year Olds | 378 (100.0%) | 0 (0.0%) |
| 15 to 17 Year Olds | 200 (95.2%) | 10 (4.8%) |
| 18 to 19 Year Olds | 54 (100.0%) | 0 (0.0%) |
| 20 to 24 Year Olds | 30 (100.0%) | 0 (0.0%) |
| 25 to 34 Year Olds | 38 (79.2%) | 10 (20.8%) |
| 35 Years and over | 62 (100.0%) | 0 (0.0%) |
| Total | 1,232 (96.5%) | 45 (3.5%) |
Educational Attainment by Field of Study in Baxley
Business (78 | 20.6%), education (74 | 19.6%), bio, nature & agricultural (44 | 11.6%), computers & mathematics (38 | 10.1%), and engineering (38 | 10.1%) are the most common fields of study among 378 individuals in Baxley who have obtained a bachelor's degree or higher.
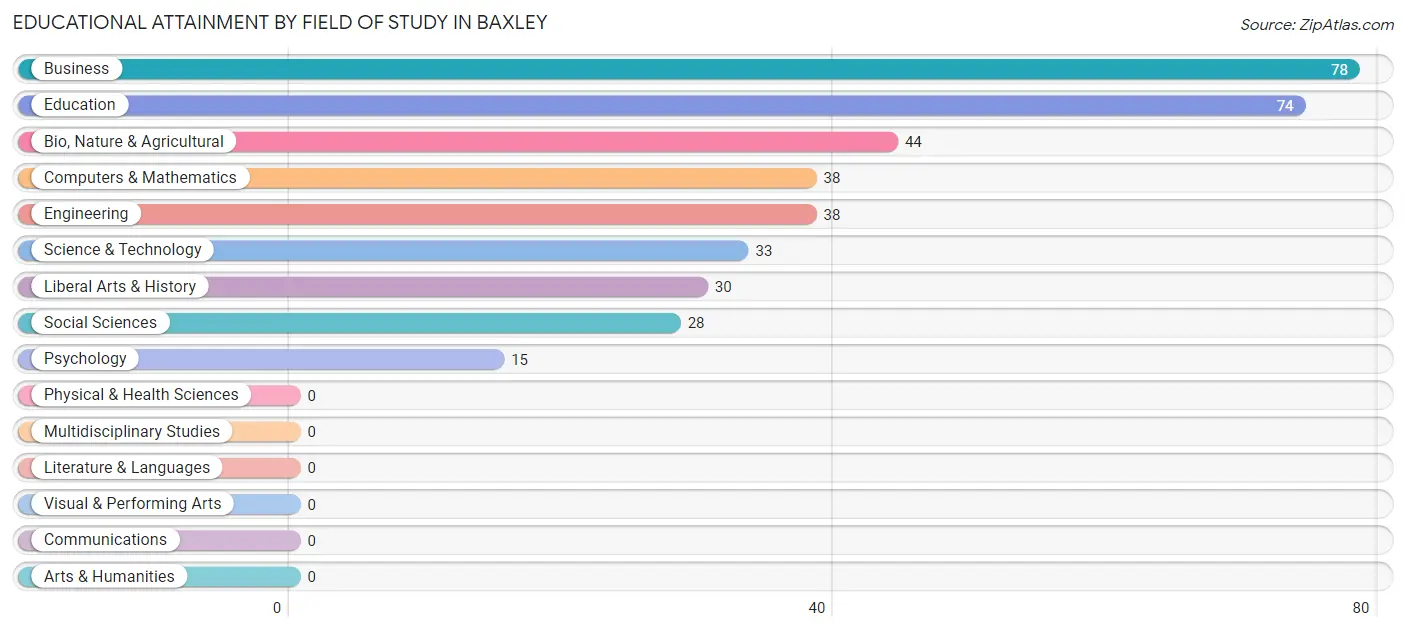
| Field of Study | # Graduates | % Graduates |
| Computers & Mathematics | 38 | 10.1% |
| Bio, Nature & Agricultural | 44 | 11.6% |
| Physical & Health Sciences | 0 | 0.0% |
| Psychology | 15 | 4.0% |
| Social Sciences | 28 | 7.4% |
| Engineering | 38 | 10.1% |
| Multidisciplinary Studies | 0 | 0.0% |
| Science & Technology | 33 | 8.7% |
| Business | 78 | 20.6% |
| Education | 74 | 19.6% |
| Literature & Languages | 0 | 0.0% |
| Liberal Arts & History | 30 | 7.9% |
| Visual & Performing Arts | 0 | 0.0% |
| Communications | 0 | 0.0% |
| Arts & Humanities | 0 | 0.0% |
| Total | 378 | 100.0% |
Transportation & Commute in Baxley
Vehicle Availability by Sex in Baxley
The most prevalent vehicle ownership categories in Baxley are males with 2 vehicles (452, accounting for 70.7%) and females with 2 vehicles (263, making up 58.2%).
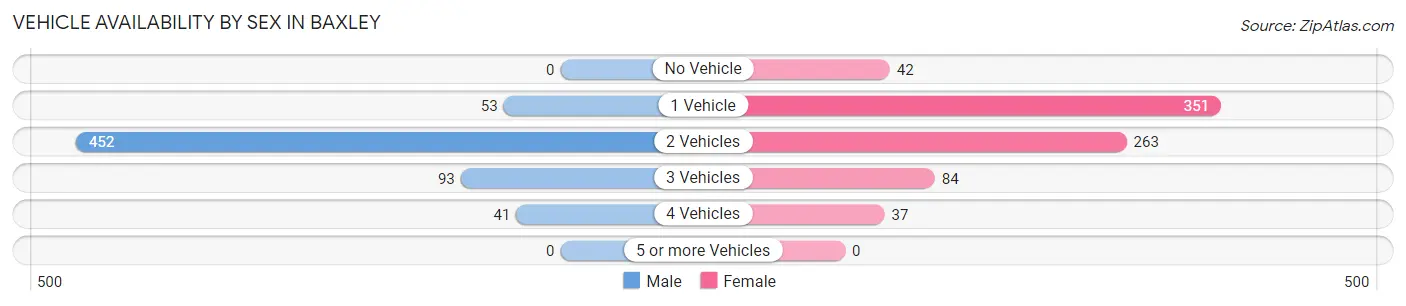
| Vehicles Available | Male | Female |
| No Vehicle | 0 (0.0%) | 42 (5.4%) |
| 1 Vehicle | 53 (8.3%) | 351 (45.2%) |
| 2 Vehicles | 452 (70.7%) | 263 (33.9%) |
| 3 Vehicles | 93 (14.5%) | 84 (10.8%) |
| 4 Vehicles | 41 (6.4%) | 37 (4.8%) |
| 5 or more Vehicles | 0 (0.0%) | 0 (0.0%) |
| Total | 639 (100.0%) | 777 (100.0%) |
Commute Time in Baxley
The most frequently occuring commute durations in Baxley are 10 to 14 minutes (537 commuters, 37.2%), 5 to 9 minutes (277 commuters, 19.2%), and 45 to 59 minutes (190 commuters, 13.2%).
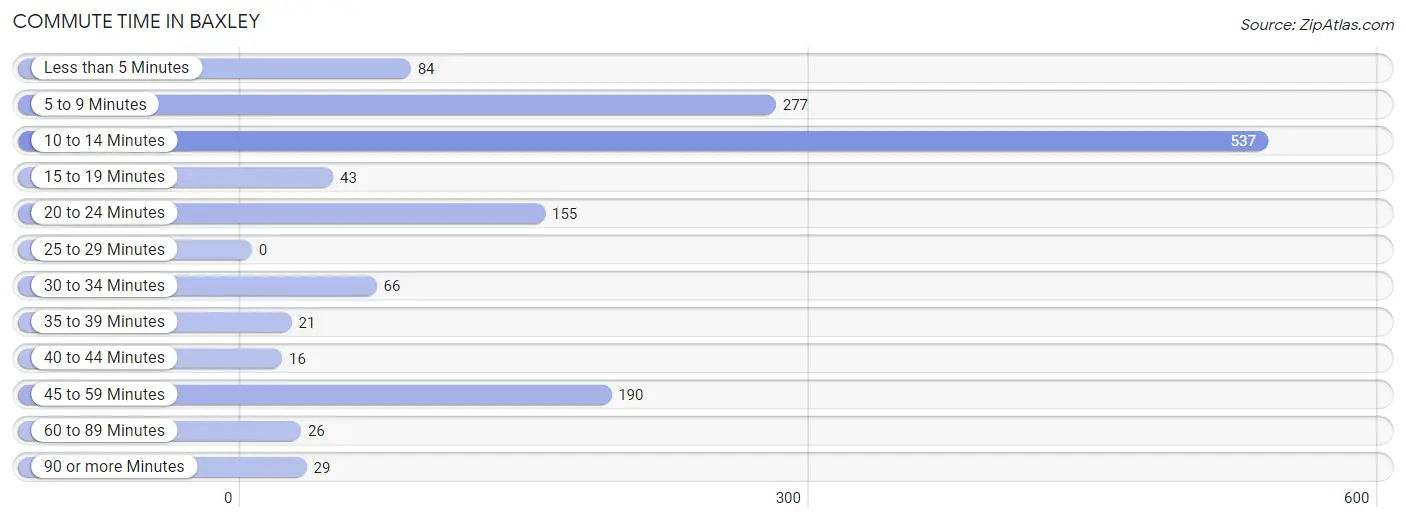
| Commute Time | # Commuters | % Commuters |
| Less than 5 Minutes | 84 | 5.8% |
| 5 to 9 Minutes | 277 | 19.2% |
| 10 to 14 Minutes | 537 | 37.2% |
| 15 to 19 Minutes | 43 | 3.0% |
| 20 to 24 Minutes | 155 | 10.7% |
| 25 to 29 Minutes | 0 | 0.0% |
| 30 to 34 Minutes | 66 | 4.6% |
| 35 to 39 Minutes | 21 | 1.5% |
| 40 to 44 Minutes | 16 | 1.1% |
| 45 to 59 Minutes | 190 | 13.2% |
| 60 to 89 Minutes | 26 | 1.8% |
| 90 or more Minutes | 29 | 2.0% |
Commute Time by Sex in Baxley
The most common commute times in Baxley are 10 to 14 minutes (281 commuters, 42.1%) for males and 10 to 14 minutes (256 commuters, 33.0%) for females.
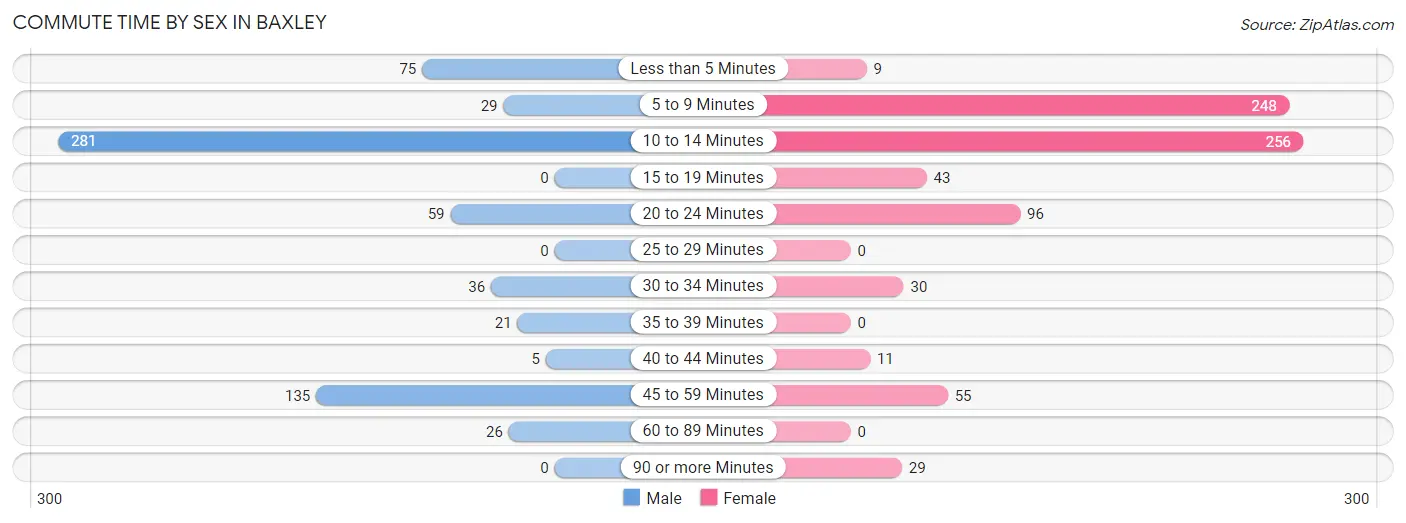
| Commute Time | Male | Female |
| Less than 5 Minutes | 75 (11.2%) | 9 (1.2%) |
| 5 to 9 Minutes | 29 (4.3%) | 248 (31.9%) |
| 10 to 14 Minutes | 281 (42.1%) | 256 (33.0%) |
| 15 to 19 Minutes | 0 (0.0%) | 43 (5.5%) |
| 20 to 24 Minutes | 59 (8.8%) | 96 (12.4%) |
| 25 to 29 Minutes | 0 (0.0%) | 0 (0.0%) |
| 30 to 34 Minutes | 36 (5.4%) | 30 (3.9%) |
| 35 to 39 Minutes | 21 (3.2%) | 0 (0.0%) |
| 40 to 44 Minutes | 5 (0.7%) | 11 (1.4%) |
| 45 to 59 Minutes | 135 (20.2%) | 55 (7.1%) |
| 60 to 89 Minutes | 26 (3.9%) | 0 (0.0%) |
| 90 or more Minutes | 0 (0.0%) | 29 (3.7%) |
Time of Departure to Work by Sex in Baxley
The most frequent times of departure to work in Baxley are 6:30 AM to 6:59 AM (175, 26.2%) for males and 8:00 AM to 8:29 AM (173, 22.3%) for females.
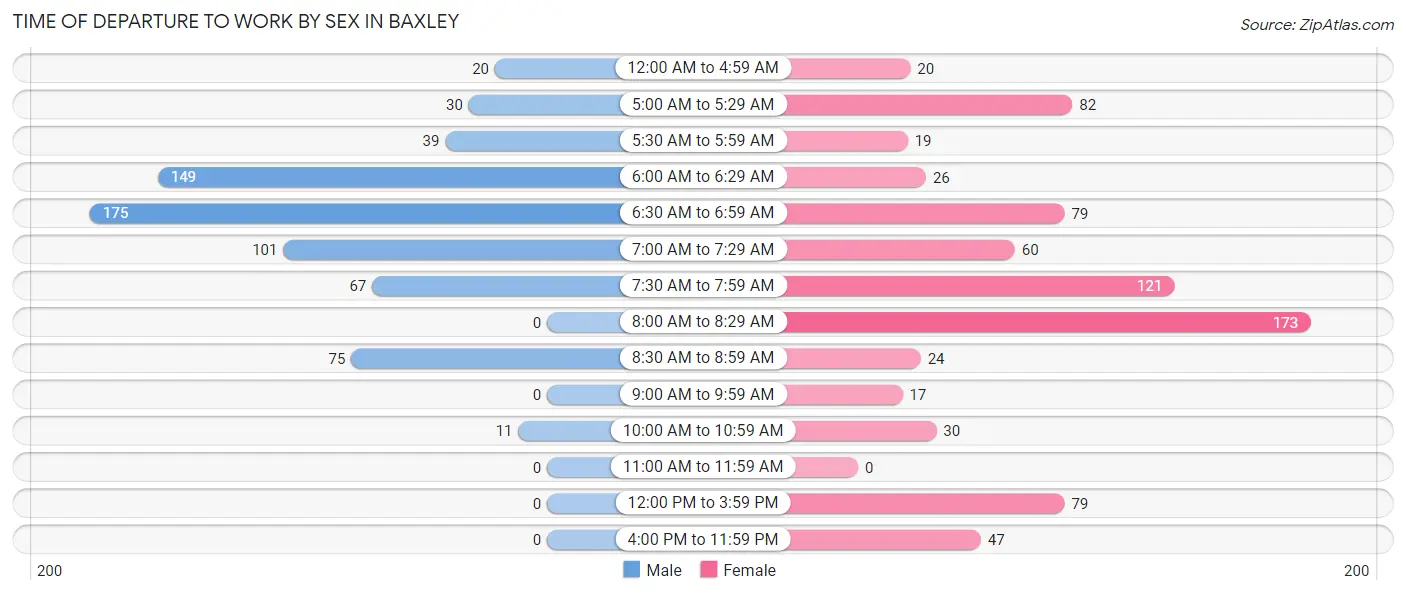
| Time of Departure | Male | Female |
| 12:00 AM to 4:59 AM | 20 (3.0%) | 20 (2.6%) |
| 5:00 AM to 5:29 AM | 30 (4.5%) | 82 (10.5%) |
| 5:30 AM to 5:59 AM | 39 (5.9%) | 19 (2.5%) |
| 6:00 AM to 6:29 AM | 149 (22.3%) | 26 (3.4%) |
| 6:30 AM to 6:59 AM | 175 (26.2%) | 79 (10.2%) |
| 7:00 AM to 7:29 AM | 101 (15.1%) | 60 (7.7%) |
| 7:30 AM to 7:59 AM | 67 (10.0%) | 121 (15.6%) |
| 8:00 AM to 8:29 AM | 0 (0.0%) | 173 (22.3%) |
| 8:30 AM to 8:59 AM | 75 (11.2%) | 24 (3.1%) |
| 9:00 AM to 9:59 AM | 0 (0.0%) | 17 (2.2%) |
| 10:00 AM to 10:59 AM | 11 (1.7%) | 30 (3.9%) |
| 11:00 AM to 11:59 AM | 0 (0.0%) | 0 (0.0%) |
| 12:00 PM to 3:59 PM | 0 (0.0%) | 79 (10.2%) |
| 4:00 PM to 11:59 PM | 0 (0.0%) | 47 (6.0%) |
| Total | 667 (100.0%) | 777 (100.0%) |
Housing Occupancy in Baxley
Occupancy by Ownership in Baxley
Of the total 1,928 dwellings in Baxley, owner-occupied units account for 1,040 (53.9%), while renter-occupied units make up 888 (46.1%).
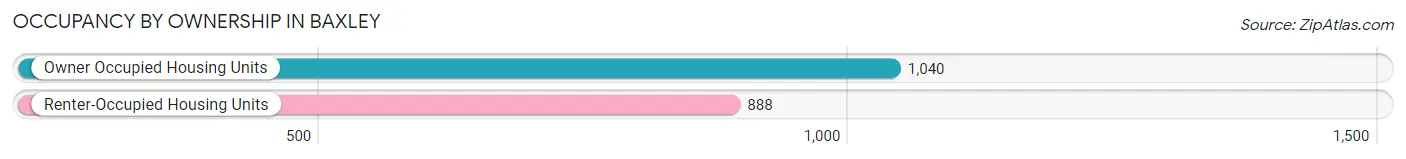
| Occupancy | # Housing Units | % Housing Units |
| Owner Occupied Housing Units | 1,040 | 53.9% |
| Renter-Occupied Housing Units | 888 | 46.1% |
| Total Occupied Housing Units | 1,928 | 100.0% |
Occupancy by Household Size in Baxley
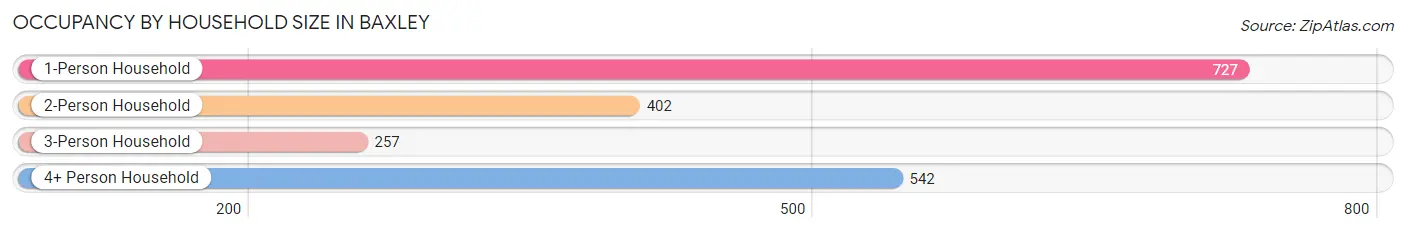
| Household Size | # Housing Units | % Housing Units |
| 1-Person Household | 727 | 37.7% |
| 2-Person Household | 402 | 20.8% |
| 3-Person Household | 257 | 13.3% |
| 4+ Person Household | 542 | 28.1% |
| Total Housing Units | 1,928 | 100.0% |
Occupancy by Ownership by Household Size in Baxley
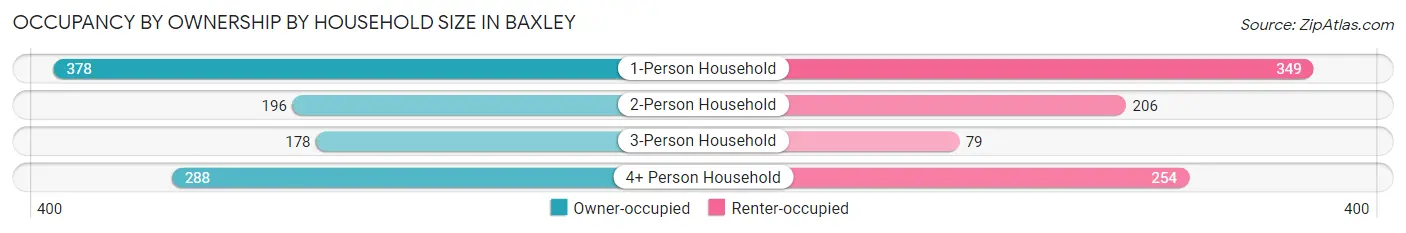
| Household Size | Owner-occupied | Renter-occupied |
| 1-Person Household | 378 (52.0%) | 349 (48.0%) |
| 2-Person Household | 196 (48.8%) | 206 (51.2%) |
| 3-Person Household | 178 (69.3%) | 79 (30.7%) |
| 4+ Person Household | 288 (53.1%) | 254 (46.9%) |
| Total Housing Units | 1,040 (53.9%) | 888 (46.1%) |
Occupancy by Educational Attainment in Baxley
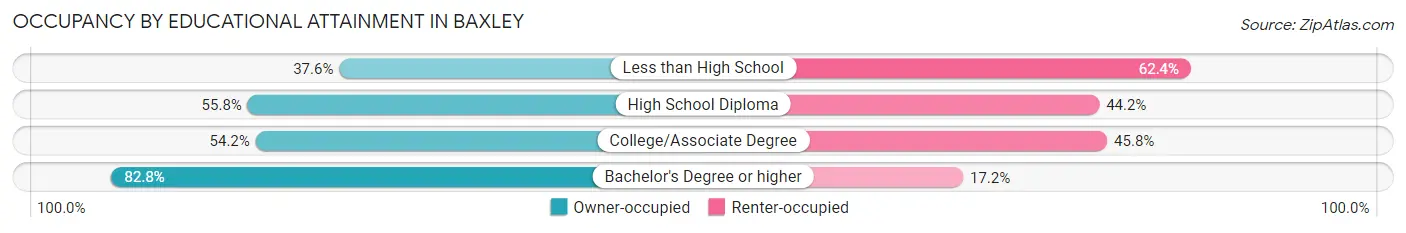
| Household Size | Owner-occupied | Renter-occupied |
| Less than High School | 155 (37.6%) | 257 (62.4%) |
| High School Diploma | 420 (55.8%) | 333 (44.2%) |
| College/Associate Degree | 316 (54.2%) | 267 (45.8%) |
| Bachelor's Degree or higher | 149 (82.8%) | 31 (17.2%) |
Occupancy by Age of Householder in Baxley
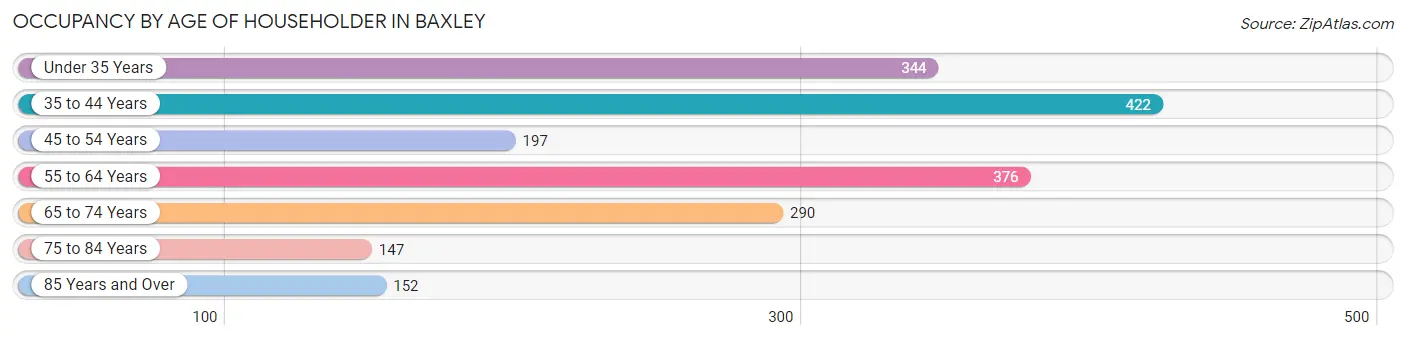
| Age Bracket | # Households | % Households |
| Under 35 Years | 344 | 17.8% |
| 35 to 44 Years | 422 | 21.9% |
| 45 to 54 Years | 197 | 10.2% |
| 55 to 64 Years | 376 | 19.5% |
| 65 to 74 Years | 290 | 15.0% |
| 75 to 84 Years | 147 | 7.6% |
| 85 Years and Over | 152 | 7.9% |
| Total | 1,928 | 100.0% |
Housing Finances in Baxley
Median Income by Occupancy in Baxley
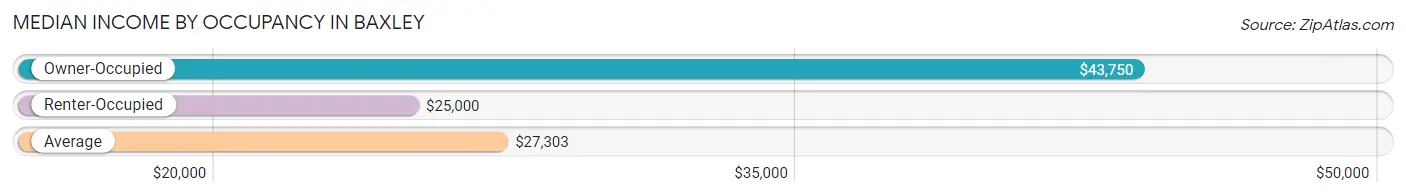
| Occupancy Type | # Households | Median Income |
| Owner-Occupied | 1,040 (53.9%) | $43,750 |
| Renter-Occupied | 888 (46.1%) | $25,000 |
| Average | 1,928 (100.0%) | $27,303 |
Occupancy by Householder Income Bracket in Baxley
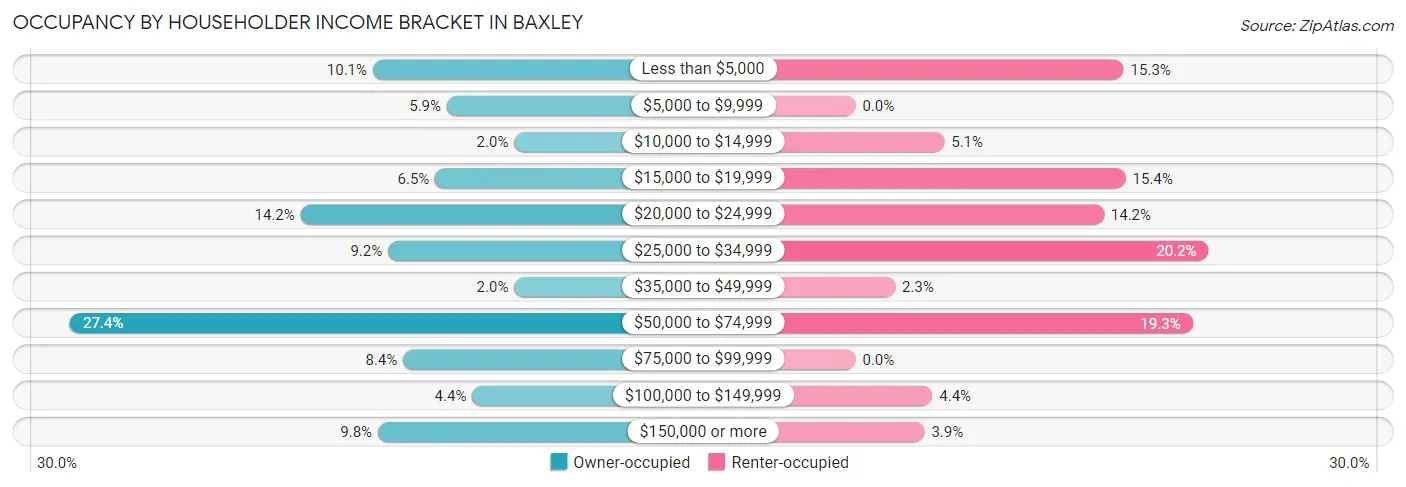
| Income Bracket | Owner-occupied | Renter-occupied |
| Less than $5,000 | 105 (10.1%) | 136 (15.3%) |
| $5,000 to $9,999 | 61 (5.9%) | 0 (0.0%) |
| $10,000 to $14,999 | 21 (2.0%) | 45 (5.1%) |
| $15,000 to $19,999 | 68 (6.5%) | 137 (15.4%) |
| $20,000 to $24,999 | 148 (14.2%) | 126 (14.2%) |
| $25,000 to $34,999 | 96 (9.2%) | 179 (20.2%) |
| $35,000 to $49,999 | 21 (2.0%) | 20 (2.2%) |
| $50,000 to $74,999 | 285 (27.4%) | 171 (19.3%) |
| $75,000 to $99,999 | 87 (8.4%) | 0 (0.0%) |
| $100,000 to $149,999 | 46 (4.4%) | 39 (4.4%) |
| $150,000 or more | 102 (9.8%) | 35 (3.9%) |
| Total | 1,040 (100.0%) | 888 (100.0%) |
Monthly Housing Cost Tiers in Baxley
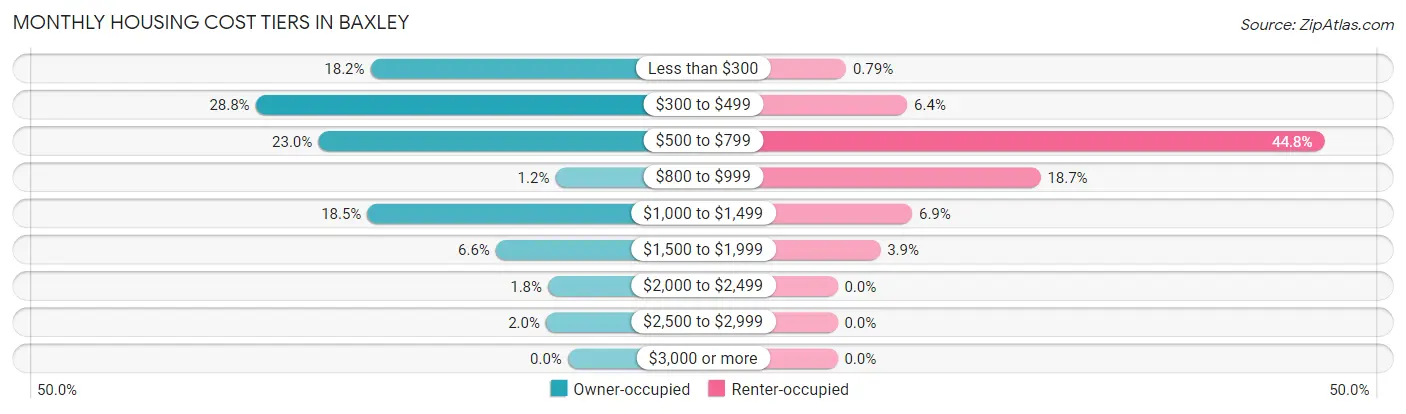
| Monthly Cost | Owner-occupied | Renter-occupied |
| Less than $300 | 189 (18.2%) | 7 (0.8%) |
| $300 to $499 | 299 (28.7%) | 57 (6.4%) |
| $500 to $799 | 239 (23.0%) | 398 (44.8%) |
| $800 to $999 | 12 (1.1%) | 166 (18.7%) |
| $1,000 to $1,499 | 192 (18.5%) | 61 (6.9%) |
| $1,500 to $1,999 | 69 (6.6%) | 35 (3.9%) |
| $2,000 to $2,499 | 19 (1.8%) | 0 (0.0%) |
| $2,500 to $2,999 | 21 (2.0%) | 0 (0.0%) |
| $3,000 or more | 0 (0.0%) | 0 (0.0%) |
| Total | 1,040 (100.0%) | 888 (100.0%) |
Physical Housing Characteristics in Baxley
Housing Structures in Baxley
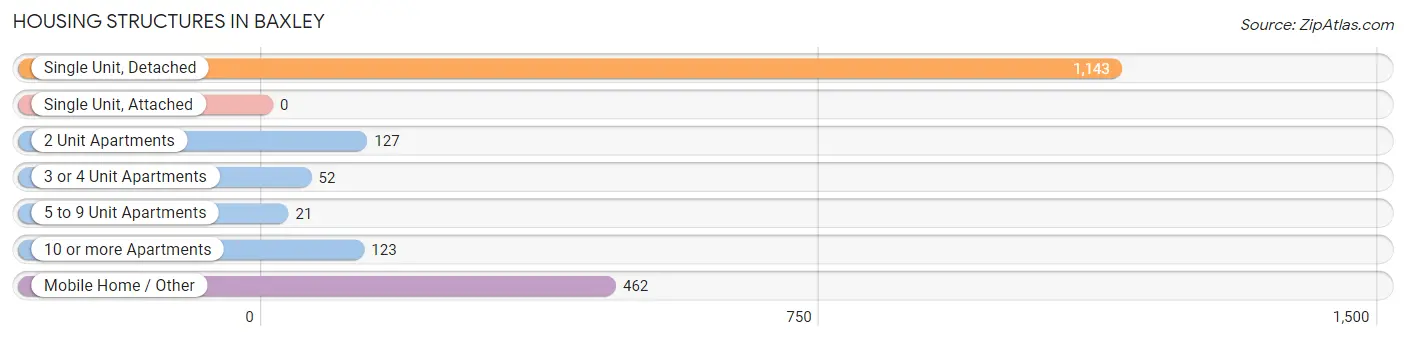
| Structure Type | # Housing Units | % Housing Units |
| Single Unit, Detached | 1,143 | 59.3% |
| Single Unit, Attached | 0 | 0.0% |
| 2 Unit Apartments | 127 | 6.6% |
| 3 or 4 Unit Apartments | 52 | 2.7% |
| 5 to 9 Unit Apartments | 21 | 1.1% |
| 10 or more Apartments | 123 | 6.4% |
| Mobile Home / Other | 462 | 24.0% |
| Total | 1,928 | 100.0% |
Housing Structures by Occupancy in Baxley
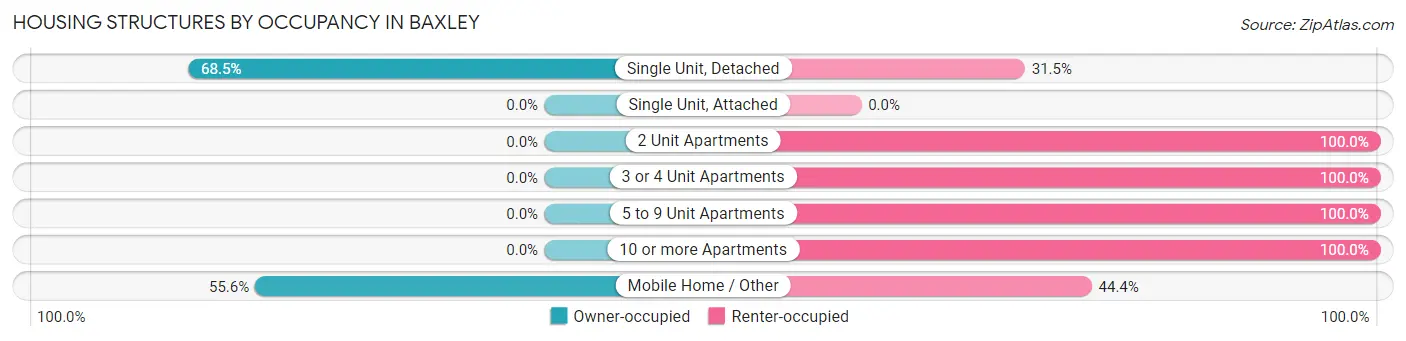
| Structure Type | Owner-occupied | Renter-occupied |
| Single Unit, Detached | 783 (68.5%) | 360 (31.5%) |
| Single Unit, Attached | 0 (0.0%) | 0 (0.0%) |
| 2 Unit Apartments | 0 (0.0%) | 127 (100.0%) |
| 3 or 4 Unit Apartments | 0 (0.0%) | 52 (100.0%) |
| 5 to 9 Unit Apartments | 0 (0.0%) | 21 (100.0%) |
| 10 or more Apartments | 0 (0.0%) | 123 (100.0%) |
| Mobile Home / Other | 257 (55.6%) | 205 (44.4%) |
| Total | 1,040 (53.9%) | 888 (46.1%) |
Housing Structures by Number of Rooms in Baxley
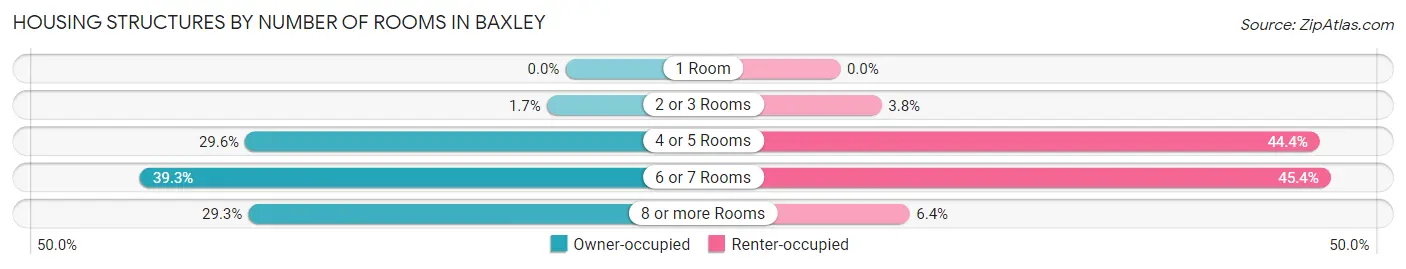
| Number of Rooms | Owner-occupied | Renter-occupied |
| 1 Room | 0 (0.0%) | 0 (0.0%) |
| 2 or 3 Rooms | 18 (1.7%) | 34 (3.8%) |
| 4 or 5 Rooms | 308 (29.6%) | 394 (44.4%) |
| 6 or 7 Rooms | 409 (39.3%) | 403 (45.4%) |
| 8 or more Rooms | 305 (29.3%) | 57 (6.4%) |
| Total | 1,040 (100.0%) | 888 (100.0%) |
Housing Structure by Heating Type in Baxley
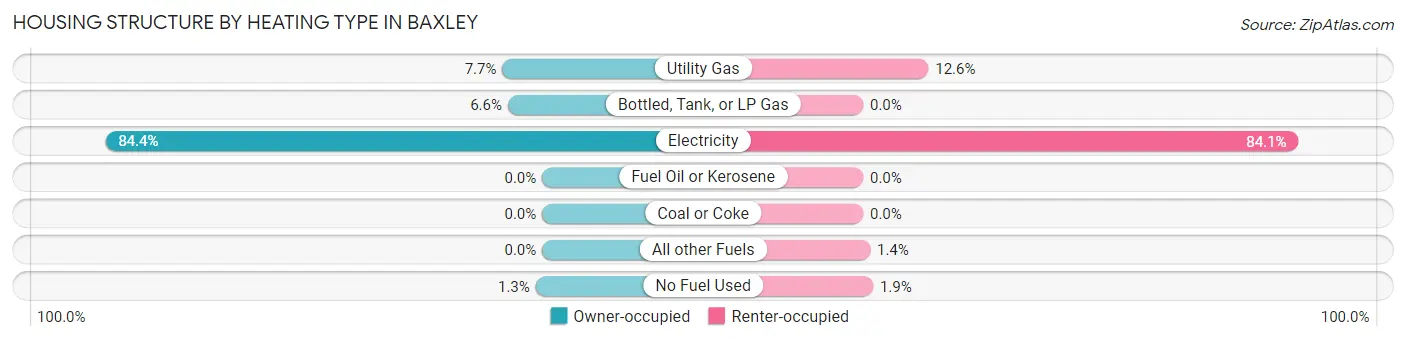
| Heating Type | Owner-occupied | Renter-occupied |
| Utility Gas | 80 (7.7%) | 112 (12.6%) |
| Bottled, Tank, or LP Gas | 69 (6.6%) | 0 (0.0%) |
| Electricity | 878 (84.4%) | 747 (84.1%) |
| Fuel Oil or Kerosene | 0 (0.0%) | 0 (0.0%) |
| Coal or Coke | 0 (0.0%) | 0 (0.0%) |
| All other Fuels | 0 (0.0%) | 12 (1.3%) |
| No Fuel Used | 13 (1.3%) | 17 (1.9%) |
| Total | 1,040 (100.0%) | 888 (100.0%) |
Household Vehicle Usage in Baxley
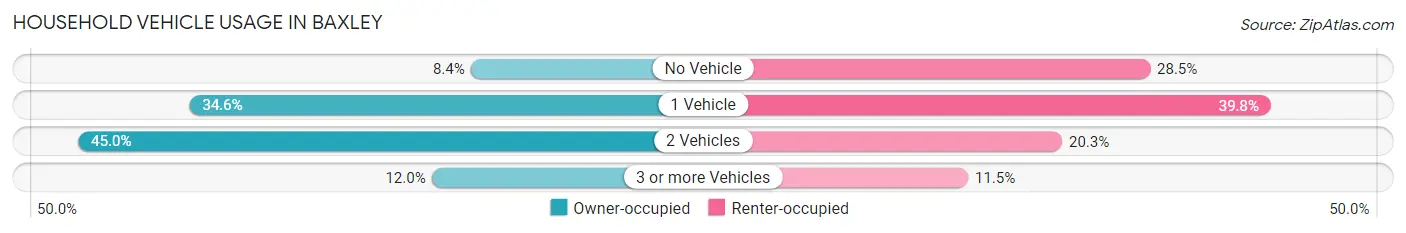
| Vehicles per Household | Owner-occupied | Renter-occupied |
| No Vehicle | 87 (8.4%) | 253 (28.5%) |
| 1 Vehicle | 360 (34.6%) | 353 (39.8%) |
| 2 Vehicles | 468 (45.0%) | 180 (20.3%) |
| 3 or more Vehicles | 125 (12.0%) | 102 (11.5%) |
| Total | 1,040 (100.0%) | 888 (100.0%) |
Real Estate & Mortgages in Baxley
Real Estate and Mortgage Overview in Baxley
| Characteristic | Without Mortgage | With Mortgage |
| Housing Units | 511 | 529 |
| Median Property Value | $103,900 | $80,200 |
| Median Household Income | - | - |
| Monthly Housing Costs | $371 | $0 |
| Real Estate Taxes | $605 | $29 |
Property Value by Mortgage Status in Baxley
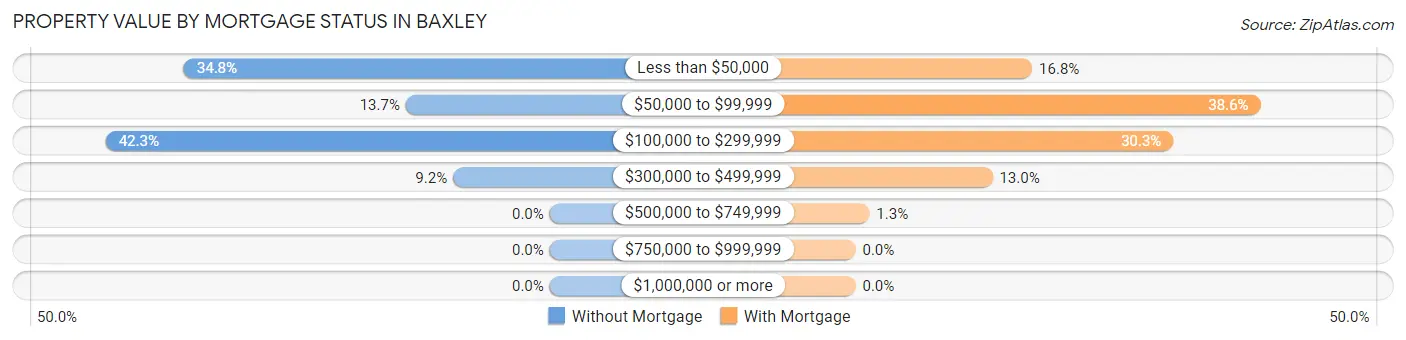
| Property Value | Without Mortgage | With Mortgage |
| Less than $50,000 | 178 (34.8%) | 89 (16.8%) |
| $50,000 to $99,999 | 70 (13.7%) | 204 (38.6%) |
| $100,000 to $299,999 | 216 (42.3%) | 160 (30.2%) |
| $300,000 to $499,999 | 47 (9.2%) | 69 (13.0%) |
| $500,000 to $749,999 | 0 (0.0%) | 7 (1.3%) |
| $750,000 to $999,999 | 0 (0.0%) | 0 (0.0%) |
| $1,000,000 or more | 0 (0.0%) | 0 (0.0%) |
| Total | 511 (100.0%) | 529 (100.0%) |
Household Income by Mortgage Status in Baxley
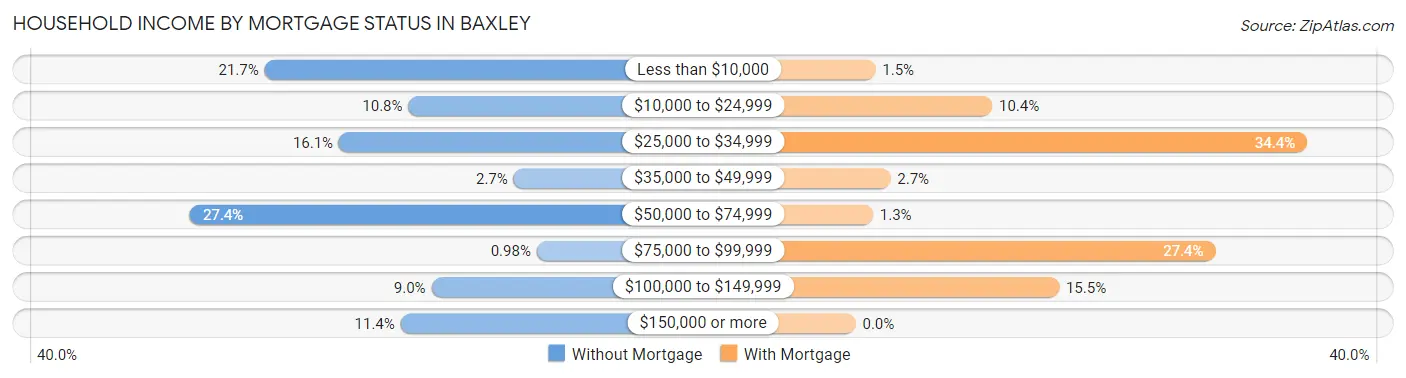
| Household Income | Without Mortgage | With Mortgage |
| Less than $10,000 | 111 (21.7%) | 8 (1.5%) |
| $10,000 to $24,999 | 55 (10.8%) | 55 (10.4%) |
| $25,000 to $34,999 | 82 (16.1%) | 182 (34.4%) |
| $35,000 to $49,999 | 14 (2.7%) | 14 (2.6%) |
| $50,000 to $74,999 | 140 (27.4%) | 7 (1.3%) |
| $75,000 to $99,999 | 5 (1.0%) | 145 (27.4%) |
| $100,000 to $149,999 | 46 (9.0%) | 82 (15.5%) |
| $150,000 or more | 58 (11.4%) | 0 (0.0%) |
| Total | 511 (100.0%) | 529 (100.0%) |
Property Value to Household Income Ratio in Baxley
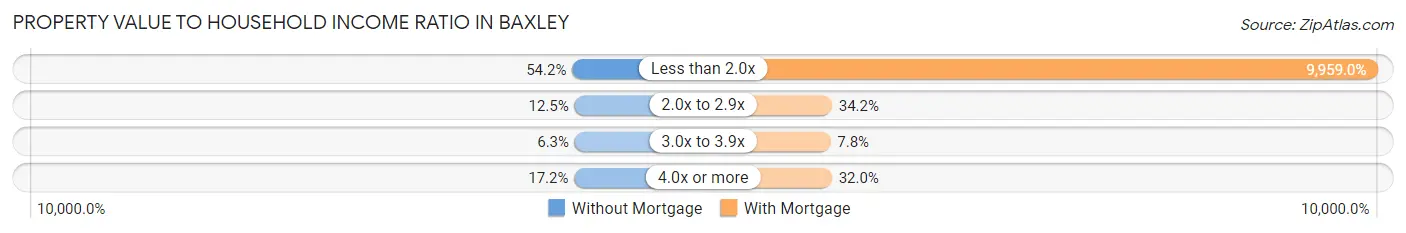
| Value-to-Income Ratio | Without Mortgage | With Mortgage |
| Less than 2.0x | 277 (54.2%) | 52,683 (9,959.0%) |
| 2.0x to 2.9x | 64 (12.5%) | 181 (34.2%) |
| 3.0x to 3.9x | 32 (6.3%) | 41 (7.7%) |
| 4.0x or more | 88 (17.2%) | 169 (32.0%) |
| Total | 511 (100.0%) | 529 (100.0%) |
Real Estate Taxes by Mortgage Status in Baxley
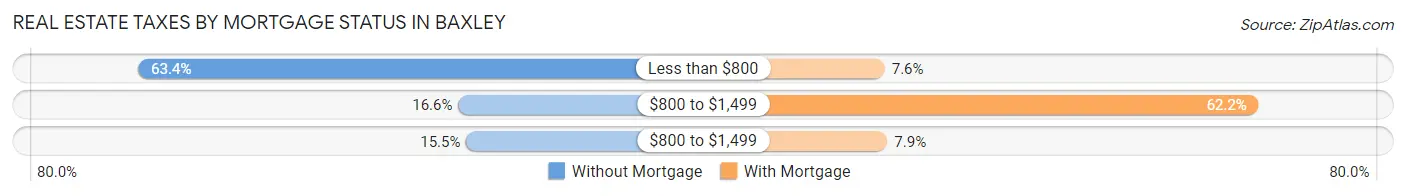
| Property Taxes | Without Mortgage | With Mortgage |
| Less than $800 | 324 (63.4%) | 40 (7.6%) |
| $800 to $1,499 | 85 (16.6%) | 329 (62.2%) |
| $800 to $1,499 | 79 (15.5%) | 42 (7.9%) |
| Total | 511 (100.0%) | 529 (100.0%) |
Health & Disability in Baxley
Health Insurance Coverage by Age in Baxley
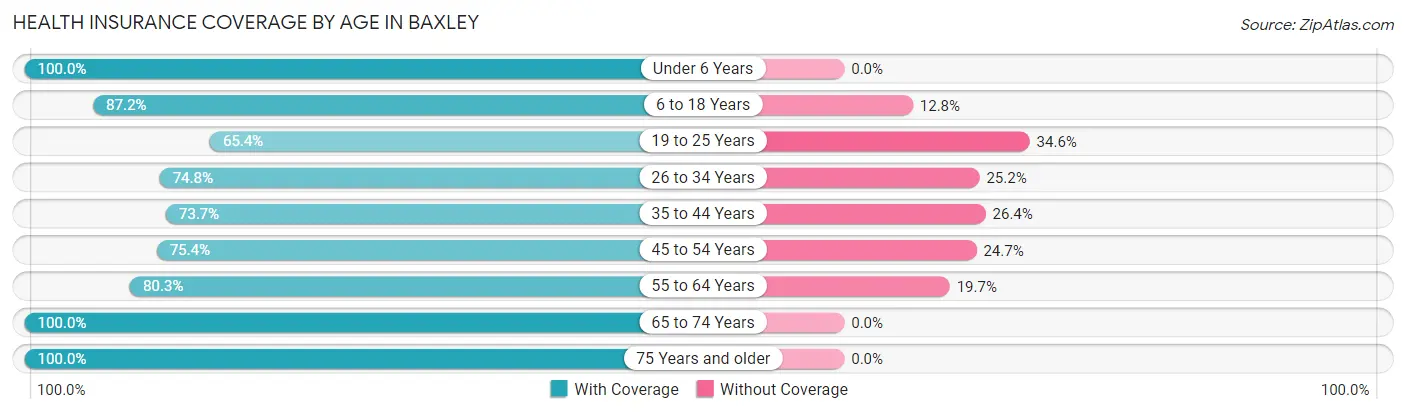
| Age Bracket | With Coverage | Without Coverage |
| Under 6 Years | 378 (100.0%) | 0 (0.0%) |
| 6 to 18 Years | 914 (87.2%) | 134 (12.8%) |
| 19 to 25 Years | 176 (65.4%) | 93 (34.6%) |
| 26 to 34 Years | 356 (74.8%) | 120 (25.2%) |
| 35 to 44 Years | 517 (73.7%) | 185 (26.4%) |
| 45 to 54 Years | 382 (75.3%) | 125 (24.6%) |
| 55 to 64 Years | 527 (80.3%) | 129 (19.7%) |
| 65 to 74 Years | 366 (100.0%) | 0 (0.0%) |
| 75 Years and older | 394 (100.0%) | 0 (0.0%) |
| Total | 4,010 (83.6%) | 786 (16.4%) |
Health Insurance Coverage by Citizenship Status in Baxley
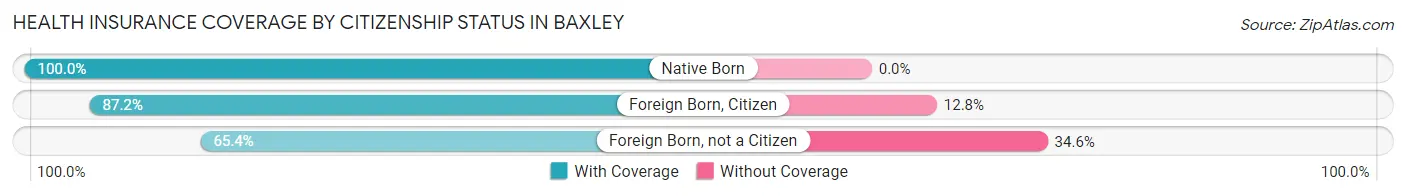
| Citizenship Status | With Coverage | Without Coverage |
| Native Born | 378 (100.0%) | 0 (0.0%) |
| Foreign Born, Citizen | 914 (87.2%) | 134 (12.8%) |
| Foreign Born, not a Citizen | 176 (65.4%) | 93 (34.6%) |
Health Insurance Coverage by Household Income in Baxley
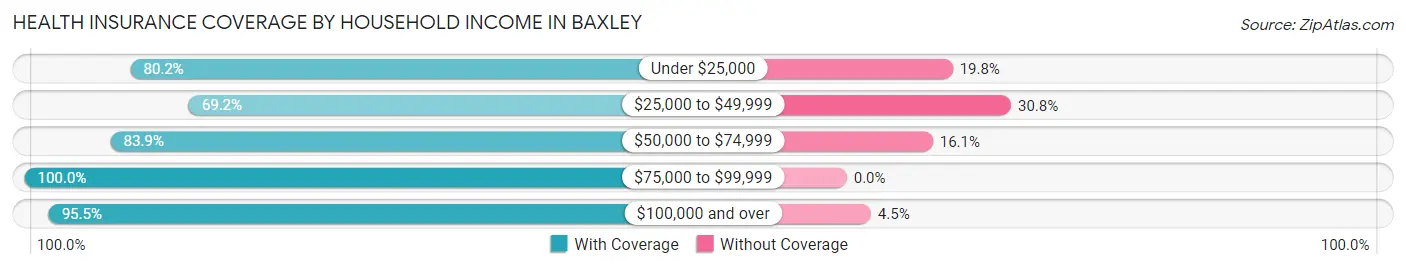
| Household Income | With Coverage | Without Coverage |
| Under $25,000 | 1,168 (80.2%) | 289 (19.8%) |
| $25,000 to $49,999 | 479 (69.2%) | 213 (30.8%) |
| $50,000 to $74,999 | 1,151 (83.9%) | 221 (16.1%) |
| $75,000 to $99,999 | 473 (100.0%) | 0 (0.0%) |
| $100,000 and over | 739 (95.5%) | 35 (4.5%) |
Public vs Private Health Insurance Coverage by Age in Baxley
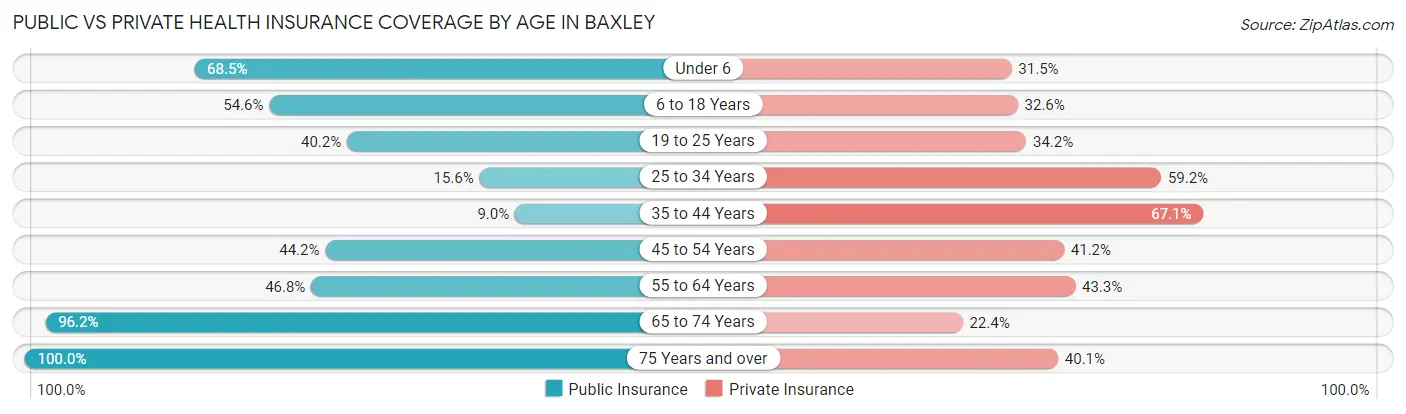
| Age Bracket | Public Insurance | Private Insurance |
| Under 6 | 259 (68.5%) | 119 (31.5%) |
| 6 to 18 Years | 572 (54.6%) | 342 (32.6%) |
| 19 to 25 Years | 108 (40.2%) | 92 (34.2%) |
| 25 to 34 Years | 74 (15.5%) | 282 (59.2%) |
| 35 to 44 Years | 63 (9.0%) | 471 (67.1%) |
| 45 to 54 Years | 224 (44.2%) | 209 (41.2%) |
| 55 to 64 Years | 307 (46.8%) | 284 (43.3%) |
| 65 to 74 Years | 352 (96.2%) | 82 (22.4%) |
| 75 Years and over | 394 (100.0%) | 158 (40.1%) |
| Total | 2,353 (49.1%) | 2,039 (42.5%) |
Disability Status by Sex by Age in Baxley
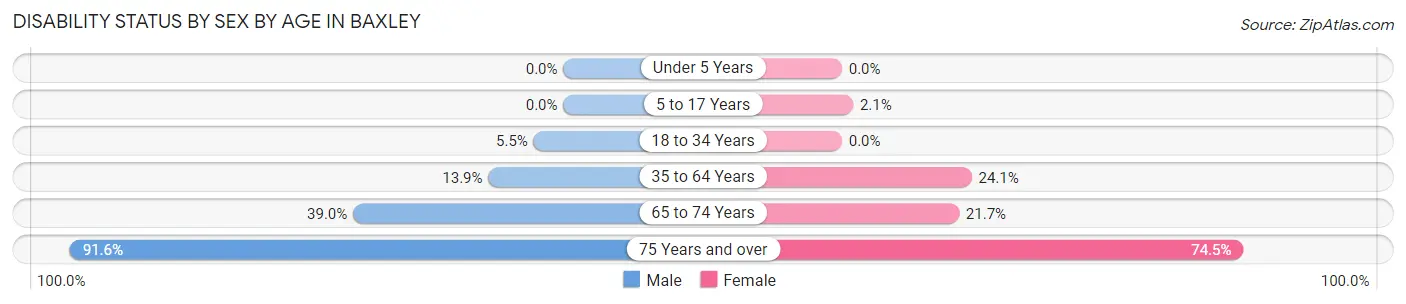
| Age Bracket | Male | Female |
| Under 5 Years | 0 (0.0%) | 0 (0.0%) |
| 5 to 17 Years | 0 (0.0%) | 11 (2.1%) |
| 18 to 34 Years | 14 (5.5%) | 0 (0.0%) |
| 35 to 64 Years | 103 (13.9%) | 271 (24.1%) |
| 65 to 74 Years | 80 (39.0%) | 35 (21.7%) |
| 75 Years and over | 120 (91.6%) | 196 (74.5%) |
Disability Class by Sex by Age in Baxley
Disability Class: Hearing Difficulty
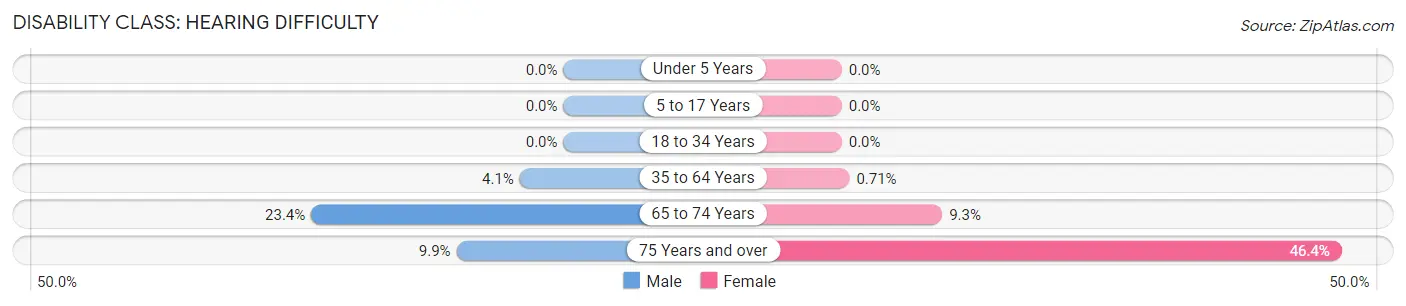
| Age Bracket | Male | Female |
| Under 5 Years | 0 (0.0%) | 0 (0.0%) |
| 5 to 17 Years | 0 (0.0%) | 0 (0.0%) |
| 18 to 34 Years | 0 (0.0%) | 0 (0.0%) |
| 35 to 64 Years | 30 (4.1%) | 8 (0.7%) |
| 65 to 74 Years | 48 (23.4%) | 15 (9.3%) |
| 75 Years and over | 13 (9.9%) | 122 (46.4%) |
Disability Class: Vision Difficulty
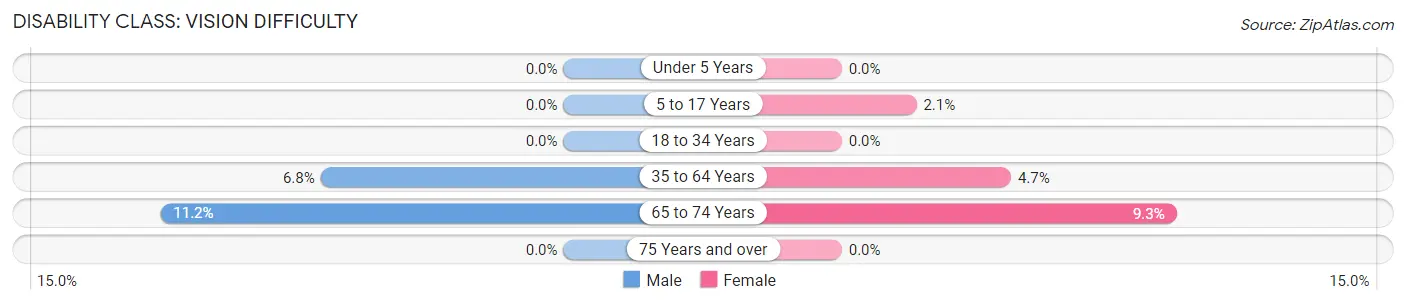
| Age Bracket | Male | Female |
| Under 5 Years | 0 (0.0%) | 0 (0.0%) |
| 5 to 17 Years | 0 (0.0%) | 11 (2.1%) |
| 18 to 34 Years | 0 (0.0%) | 0 (0.0%) |
| 35 to 64 Years | 50 (6.8%) | 53 (4.7%) |
| 65 to 74 Years | 23 (11.2%) | 15 (9.3%) |
| 75 Years and over | 0 (0.0%) | 0 (0.0%) |
Disability Class: Cognitive Difficulty
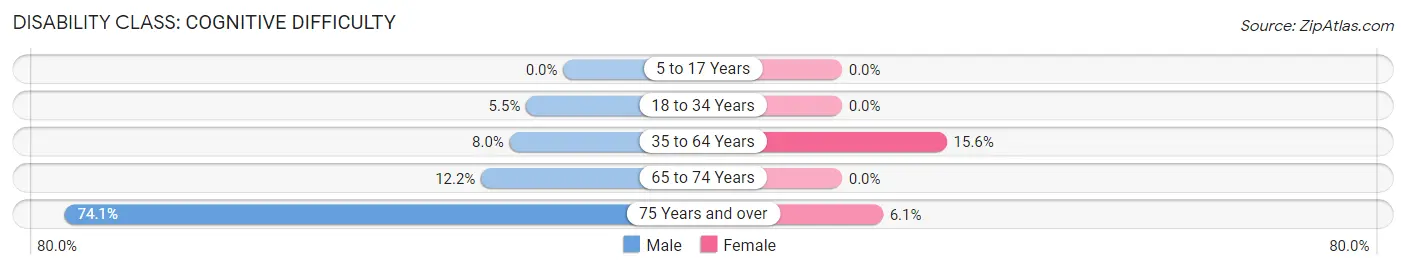
| Age Bracket | Male | Female |
| 5 to 17 Years | 0 (0.0%) | 0 (0.0%) |
| 18 to 34 Years | 14 (5.5%) | 0 (0.0%) |
| 35 to 64 Years | 59 (8.0%) | 175 (15.6%) |
| 65 to 74 Years | 25 (12.2%) | 0 (0.0%) |
| 75 Years and over | 97 (74.1%) | 16 (6.1%) |
Disability Class: Ambulatory Difficulty
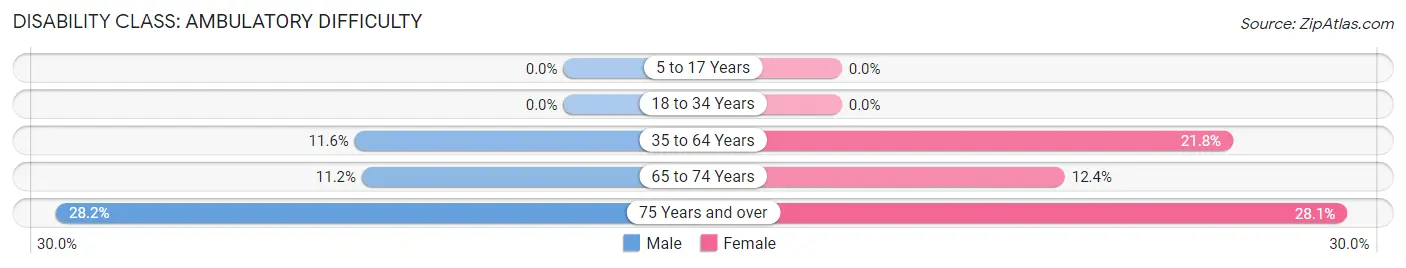
| Age Bracket | Male | Female |
| 5 to 17 Years | 0 (0.0%) | 0 (0.0%) |
| 18 to 34 Years | 0 (0.0%) | 0 (0.0%) |
| 35 to 64 Years | 86 (11.6%) | 245 (21.8%) |
| 65 to 74 Years | 23 (11.2%) | 20 (12.4%) |
| 75 Years and over | 37 (28.2%) | 74 (28.1%) |
Disability Class: Self-Care Difficulty
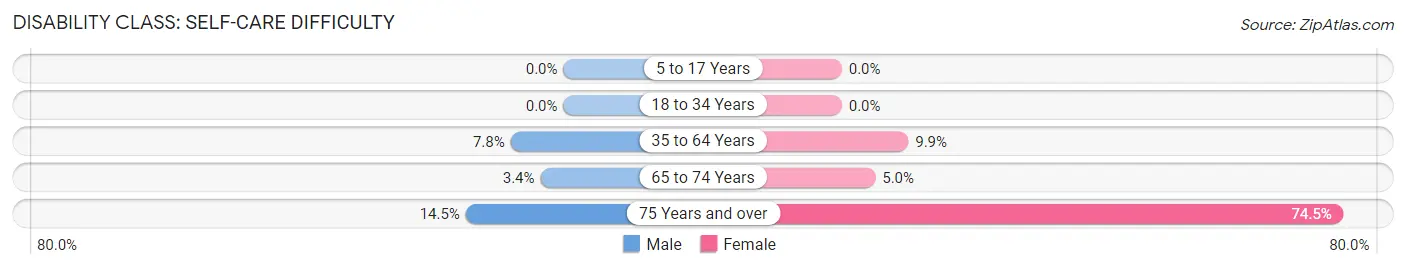
| Age Bracket | Male | Female |
| 5 to 17 Years | 0 (0.0%) | 0 (0.0%) |
| 18 to 34 Years | 0 (0.0%) | 0 (0.0%) |
| 35 to 64 Years | 58 (7.8%) | 111 (9.9%) |
| 65 to 74 Years | 7 (3.4%) | 8 (5.0%) |
| 75 Years and over | 19 (14.5%) | 196 (74.5%) |
Technology Access in Baxley
Computing Device Access in Baxley
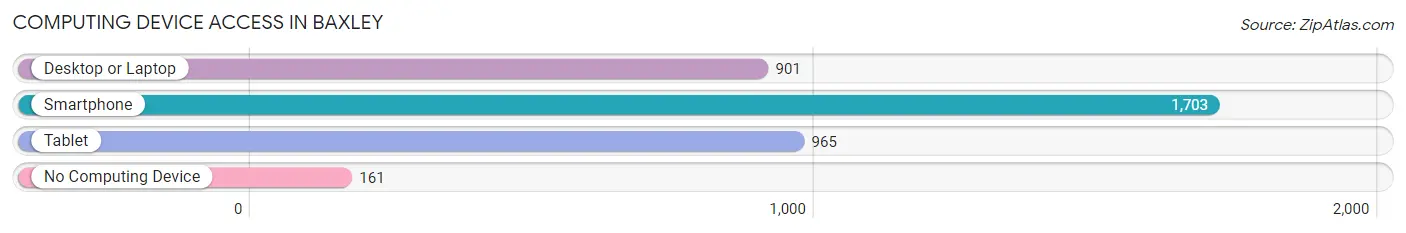
| Device Type | # Households | % Households |
| Desktop or Laptop | 901 | 46.7% |
| Smartphone | 1,703 | 88.3% |
| Tablet | 965 | 50.0% |
| No Computing Device | 161 | 8.4% |
| Total | 1,928 | 100.0% |
Internet Access in Baxley
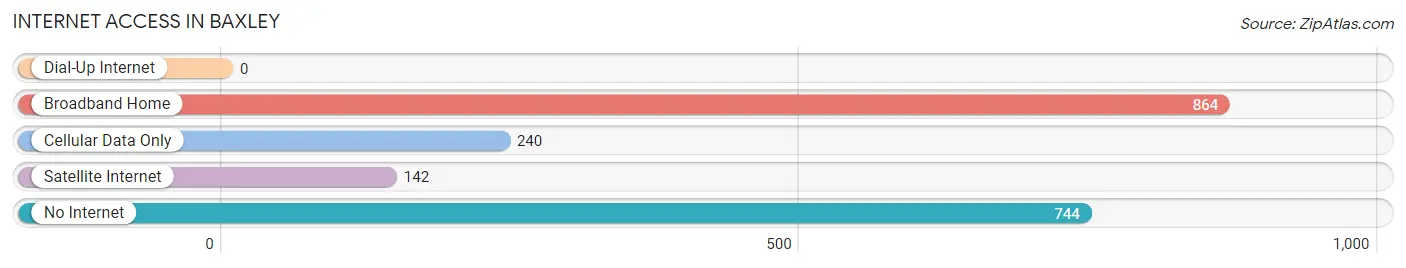
| Internet Type | # Households | % Households |
| Dial-Up Internet | 0 | 0.0% |
| Broadband Home | 864 | 44.8% |
| Cellular Data Only | 240 | 12.4% |
| Satellite Internet | 142 | 7.4% |
| No Internet | 744 | 38.6% |
| Total | 1,928 | 100.0% |
Baxley Summary
Baxley, Georgia is a small city located in Appling County in the southeastern part of the state. It is the county seat of Appling County and is located about 60 miles south of Augusta and about 90 miles north of Jacksonville, Florida. The city has a population of 4,400 people as of the 2010 census.
History
Baxley was founded in 1872 by William Baxley, a former Confederate soldier. The city was named after him and was incorporated in 1874. The city was originally a farming community and was known for its production of cotton, corn, and peanuts. In the late 19th century, the city began to grow and develop as a commercial center. The railroad arrived in 1891, and the city was connected to the rest of the state.
In the early 20th century, Baxley became a popular tourist destination. The city was known for its many resorts and hotels, as well as its natural beauty. The city was also home to a number of historic sites, including the Baxley-Appling County Courthouse, which was built in 1891.
Geography
Baxley is located in Appling County in the southeastern part of the state. It is situated at the intersection of U.S. Route 1 and Georgia State Route 121. The city is located about 60 miles south of Augusta and about 90 miles north of Jacksonville, Florida. The city has a total area of 4.2 square miles, all of which is land.
The city is located in a humid subtropical climate zone, with hot, humid summers and mild winters. The average annual temperature is around 70 degrees Fahrenheit, and the average annual precipitation is around 50 inches.
Economy
The economy of Baxley is largely based on agriculture and tourism. The city is home to a number of farms, which produce cotton, corn, peanuts, and other crops. The city is also home to a number of tourist attractions, including the Baxley-Appling County Courthouse, the Baxley-Appling County Museum, and the Baxley-Appling County Historical Society.
The city is also home to a number of manufacturing companies, including Georgia-Pacific, which produces paper products, and Georgia-Pacific Plywood, which produces plywood and other wood products. The city is also home to a number of retail stores, restaurants, and other businesses.
Demographics
As of the 2010 census, the population of Baxley was 4,400 people. The racial makeup of the city was 79.3% White, 17.2% African American, 0.7% Native American, 0.3% Asian, 0.1% Pacific Islander, 1.2% from other races, and 1.4% from two or more races. Hispanic or Latino of any race were 3.2% of the population.
The median household income in Baxley was $30,938, and the median family income was $37,917. The per capita income in the city was $17,845. About 17.2% of the population was below the poverty line.
Baxley is served by the Appling County School District, which includes four elementary schools, one middle school, and one high school. The city is also home to a number of private schools, including Baxley Christian Academy and Baxley Academy.
Common Questions
What is the Total Population of Baxley?
Total Population of Baxley is 4,971.
What is the Total Male Population of Baxley?
Total Male Population of Baxley is 2,150.
What is the Total Female Population of Baxley?
Total Female Population of Baxley is 2,821.
What is the Ratio of Males per 100 Females in Baxley?
There are 76.21 Males per 100 Females in Baxley.
What is the Ratio of Females per 100 Males in Baxley?
There are 131.21 Females per 100 Males in Baxley.
What is the Median Population Age in Baxley?
Median Population Age in Baxley is 39.5 Years.
What is the Average Family Size in Baxley
Average Family Size in Baxley is 3.3 People.
What is the Average Household Size in Baxley
Average Household Size in Baxley is 2.5 People.
What is Per Capita Income in Baxley?
Per Capita income in Baxley is $19,623.
What is the Median Family Income in Baxley?
Median Family Income in Baxley is $53,456.
What is the Median Household income in Baxley?
Median Household Income in Baxley is $27,303.
What is Income or Wage Gap in Baxley?
Income or Wage Gap in Baxley is 35.0%.
Women in Baxley earn 65.0 cents for every dollar earned by a man.
What is Family Income Deficit in Baxley?
Family Income Deficit in Baxley is $13,856.
Families that are below poverty line in Baxley earn $13,856 less on average than the poverty threshold level.
What is Inequality or Gini Index in Baxley?
Inequality or Gini Index in Baxley is 0.51.
How Large is the Labor Force in Baxley?
There are 1,601 People in the Labor Forcein in Baxley.
What is the Percentage of People in the Labor Force in Baxley?
43.1% of People are in the Labor Force in Baxley.
What is the Unemployment Rate in Baxley?
Unemployment Rate in Baxley is 9.9%.