Dalton, GA
Dalton Map
Dalton Overview
34,358
TOTAL POPULATION
17,096
MALE POPULATION
17,262
FEMALE POPULATION
99.04
MALES / 100 FEMALES
100.97
FEMALES / 100 MALES
34.0
MEDIAN AGE
3.4
AVG FAMILY SIZE
2.8
AVG HOUSEHOLD SIZE
$29,899
PER CAPITA INCOME
$69,030
AVG FAMILY INCOME
$57,163
AVG HOUSEHOLD INCOME
19.4%
WAGE / INCOME GAP [ % ]
80.6¢/ $1
WAGE / INCOME GAP [ $ ]
$11,614
FAMILY INCOME DEFICIT
0.47
INEQUALITY / GINI INDEX
16,907
LABOR FORCE [ PEOPLE ]
63.6%
PERCENT IN LABOR FORCE
3.9%
UNEMPLOYMENT RATE
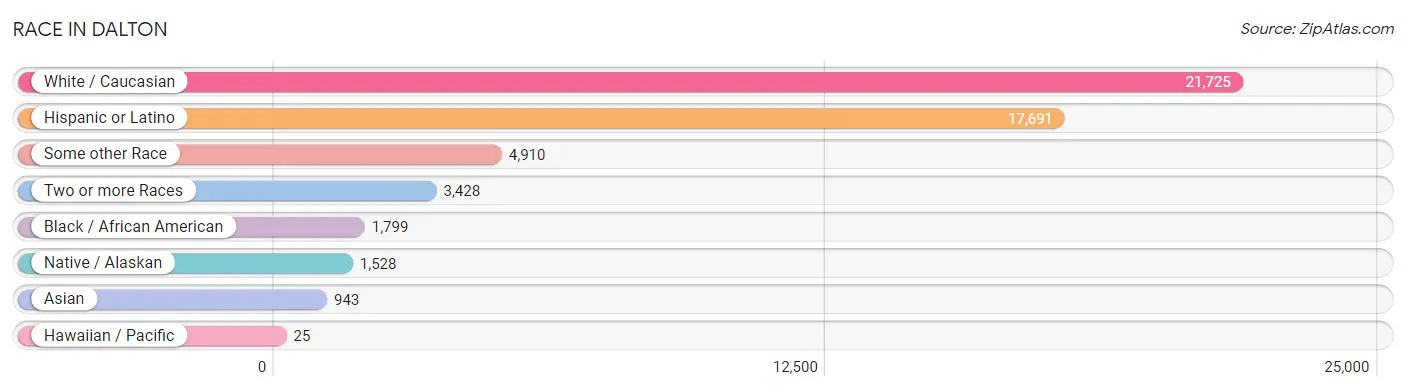
Race in Dalton
The most populous races in Dalton are White / Caucasian (21,725 | 63.2%), Hispanic or Latino (17,691 | 51.5%), and Some other Race (4,910 | 14.3%).
| Race | # Population | % Population |
| Asian | 943 | 2.7% |
| Black / African American | 1,799 | 5.2% |
| Hawaiian / Pacific | 25 | 0.1% |
| Hispanic or Latino | 17,691 | 51.5% |
| Native / Alaskan | 1,528 | 4.4% |
| White / Caucasian | 21,725 | 63.2% |
| Two or more Races | 3,428 | 10.0% |
| Some other Race | 4,910 | 14.3% |
| Total | 34,358 | 100.0% |
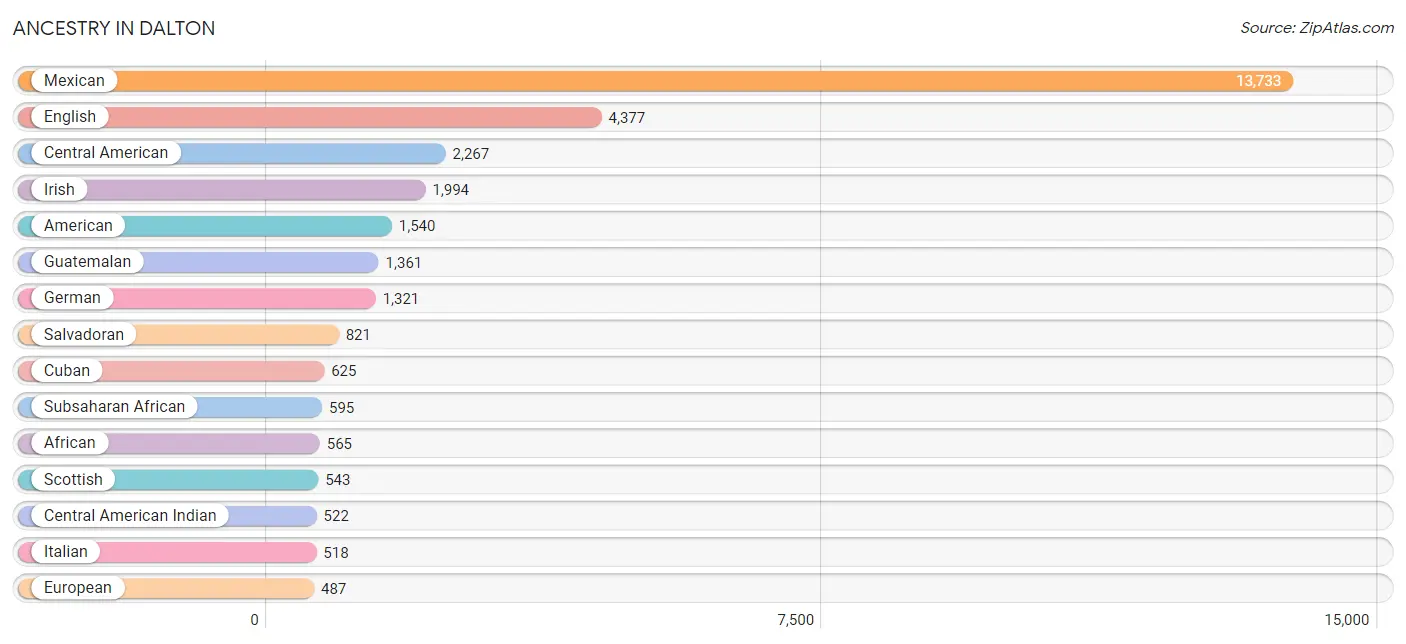
Ancestry in Dalton
The most populous ancestries reported in Dalton are Mexican (13,733 | 40.0%), English (4,377 | 12.7%), Central American (2,267 | 6.6%), Irish (1,994 | 5.8%), and American (1,540 | 4.5%), together accounting for 69.6% of all Dalton residents.
| Ancestry | # Population | % Population |
| African | 565 | 1.6% |
| American | 1,540 | 4.5% |
| Austrian | 10 | 0.0% |
| Bhutanese | 158 | 0.5% |
| British | 319 | 0.9% |
| Burmese | 172 | 0.5% |
| Canadian | 21 | 0.1% |
| Central American | 2,267 | 6.6% |
| Central American Indian | 522 | 1.5% |
| Cherokee | 88 | 0.3% |
| Colombian | 160 | 0.5% |
| Costa Rican | 29 | 0.1% |
| Cuban | 625 | 1.8% |
| Czech | 9 | 0.0% |
| Danish | 25 | 0.1% |
| Dominican | 233 | 0.7% |
| Dutch | 157 | 0.5% |
| Eastern European | 142 | 0.4% |
| Ecuadorian | 33 | 0.1% |
| English | 4,377 | 12.7% |
| European | 487 | 1.4% |
| French | 217 | 0.6% |
| German | 1,321 | 3.8% |
| Greek | 10 | 0.0% |
| Guatemalan | 1,361 | 4.0% |
| Haitian | 7 | 0.0% |
| Hungarian | 17 | 0.1% |
| Indian (Asian) | 92 | 0.3% |
| Irish | 1,994 | 5.8% |
| Italian | 518 | 1.5% |
| Korean | 54 | 0.2% |
| Mexican | 13,733 | 40.0% |
| Mexican American Indian | 456 | 1.3% |
| Native Hawaiian | 27 | 0.1% |
| Nicaraguan | 56 | 0.2% |
| Nigerian | 22 | 0.1% |
| Northern European | 43 | 0.1% |
| Norwegian | 8 | 0.0% |
| Pennsylvania German | 18 | 0.1% |
| Peruvian | 39 | 0.1% |
| Polish | 108 | 0.3% |
| Portuguese | 16 | 0.1% |
| Puerto Rican | 433 | 1.3% |
| Salvadoran | 821 | 2.4% |
| Scandinavian | 54 | 0.2% |
| Scotch-Irish | 188 | 0.5% |
| Scottish | 543 | 1.6% |
| South American | 245 | 0.7% |
| Spaniard | 7 | 0.0% |
| Sri Lankan | 182 | 0.5% |
| Subsaharan African | 595 | 1.7% |
| Swedish | 423 | 1.2% |
| Swiss | 16 | 0.1% |
| Thai | 373 | 1.1% |
| Turkish | 52 | 0.2% |
| Venezuelan | 13 | 0.0% |
| Welsh | 70 | 0.2% |
| Yugoslavian | 40 | 0.1% | View All 58 Rows |
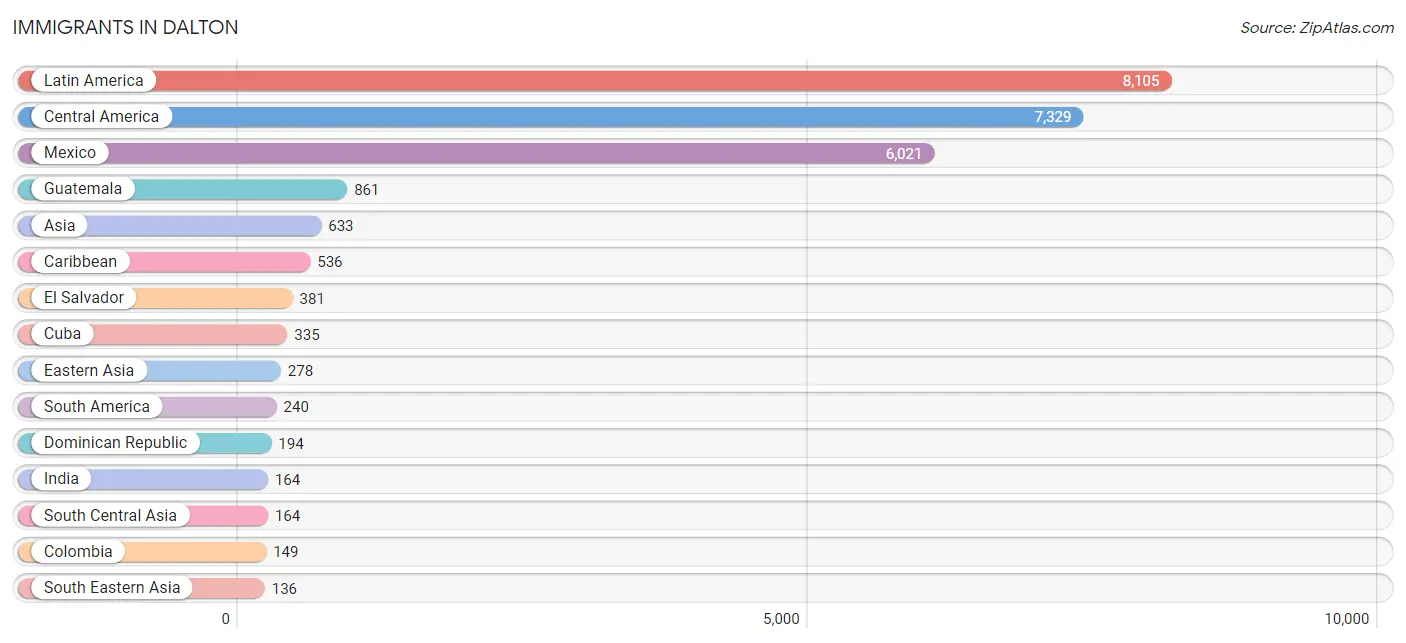
Immigrants in Dalton
The most numerous immigrant groups reported in Dalton came from Latin America (8,105 | 23.6%), Central America (7,329 | 21.3%), Mexico (6,021 | 17.5%), Guatemala (861 | 2.5%), and Asia (633 | 1.8%), together accounting for 66.8% of all Dalton residents.
| Immigration Origin | # Population | % Population |
| Africa | 121 | 0.4% |
| Asia | 633 | 1.8% |
| Brazil | 6 | 0.0% |
| Canada | 53 | 0.2% |
| Caribbean | 536 | 1.6% |
| Central America | 7,329 | 21.3% |
| China | 58 | 0.2% |
| Colombia | 149 | 0.4% |
| Cuba | 335 | 1.0% |
| Dominican Republic | 194 | 0.6% |
| Eastern Asia | 278 | 0.8% |
| Ecuador | 33 | 0.1% |
| El Salvador | 381 | 1.1% |
| Europe | 72 | 0.2% |
| Fiji | 6 | 0.0% |
| Germany | 36 | 0.1% |
| Ghana | 7 | 0.0% |
| Guatemala | 861 | 2.5% |
| Haiti | 7 | 0.0% |
| Honduras | 25 | 0.1% |
| India | 164 | 0.5% |
| Japan | 105 | 0.3% |
| Korea | 115 | 0.3% |
| Latin America | 8,105 | 23.6% |
| Mexico | 6,021 | 17.5% |
| Nicaragua | 41 | 0.1% |
| Nigeria | 7 | 0.0% |
| Northern Europe | 29 | 0.1% |
| Oceania | 6 | 0.0% |
| Peru | 39 | 0.1% |
| Philippines | 7 | 0.0% |
| Saudi Arabia | 20 | 0.1% |
| South Africa | 40 | 0.1% |
| South America | 240 | 0.7% |
| South Central Asia | 164 | 0.5% |
| South Eastern Asia | 136 | 0.4% |
| Southern Europe | 7 | 0.0% |
| Spain | 7 | 0.0% |
| Turkey | 35 | 0.1% |
| Venezuela | 13 | 0.0% |
| Vietnam | 129 | 0.4% |
| Western Africa | 14 | 0.0% |
| Western Asia | 55 | 0.2% |
| Western Europe | 36 | 0.1% | View All 44 Rows |
Sex and Age in Dalton
Sex and Age in Dalton
The most populous age groups in Dalton are 15 to 19 Years (1,715 | 10.0%) for men and 25 to 29 Years (1,486 | 8.6%) for women.
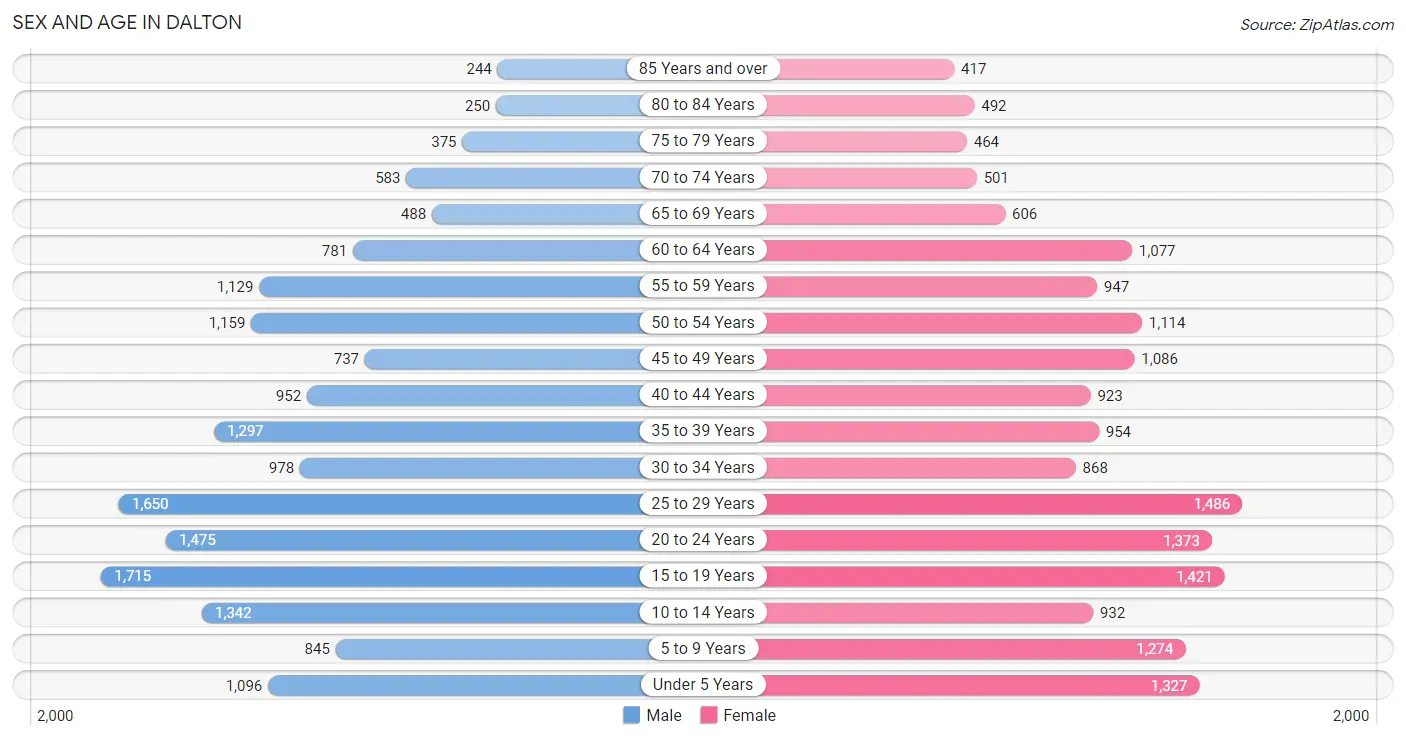
| Age Bracket | Male | Female |
| Under 5 Years | 1,096 (6.4%) | 1,327 (7.7%) |
| 5 to 9 Years | 845 (4.9%) | 1,274 (7.4%) |
| 10 to 14 Years | 1,342 (7.9%) | 932 (5.4%) |
| 15 to 19 Years | 1,715 (10.0%) | 1,421 (8.2%) |
| 20 to 24 Years | 1,475 (8.6%) | 1,373 (8.0%) |
| 25 to 29 Years | 1,650 (9.7%) | 1,486 (8.6%) |
| 30 to 34 Years | 978 (5.7%) | 868 (5.0%) |
| 35 to 39 Years | 1,297 (7.6%) | 954 (5.5%) |
| 40 to 44 Years | 952 (5.6%) | 923 (5.3%) |
| 45 to 49 Years | 737 (4.3%) | 1,086 (6.3%) |
| 50 to 54 Years | 1,159 (6.8%) | 1,114 (6.5%) |
| 55 to 59 Years | 1,129 (6.6%) | 947 (5.5%) |
| 60 to 64 Years | 781 (4.6%) | 1,077 (6.2%) |
| 65 to 69 Years | 488 (2.9%) | 606 (3.5%) |
| 70 to 74 Years | 583 (3.4%) | 501 (2.9%) |
| 75 to 79 Years | 375 (2.2%) | 464 (2.7%) |
| 80 to 84 Years | 250 (1.5%) | 492 (2.9%) |
| 85 Years and over | 244 (1.4%) | 417 (2.4%) |
| Total | 17,096 (100.0%) | 17,262 (100.0%) |
Families and Households in Dalton
Median Family Size in Dalton
The median family size in Dalton is 3.42 persons per family, with married-couple families (4,586 | 56.5%) accounting for the largest median family size of 3.57 persons per family. On the other hand, single male/father families (1,231 | 15.2%) represent the smallest median family size with 2.71 persons per family.
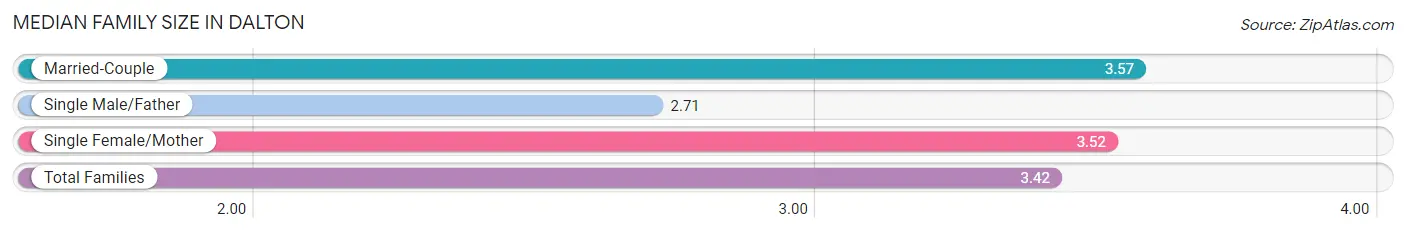
| Family Type | # Families | Family Size |
| Married-Couple | 4,586 (56.5%) | 3.57 |
| Single Male/Father | 1,231 (15.2%) | 2.71 |
| Single Female/Mother | 2,299 (28.3%) | 3.52 |
| Total Families | 8,116 (100.0%) | 3.42 |
Median Household Size in Dalton
The median household size in Dalton is 2.76 persons per household, with single female/mother households (2,299 | 19.2%) accounting for the largest median household size of 3.64 persons per household. non-family households (3,844 | 32.1%) represent the smallest median household size with 1.17 persons per household.
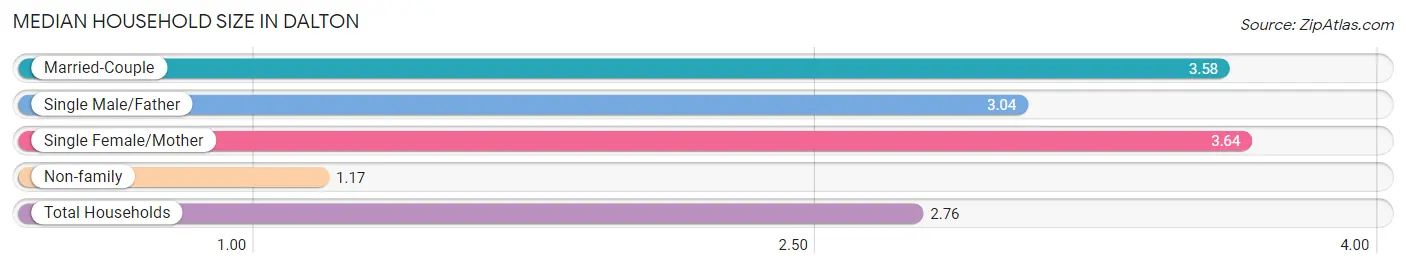
| Household Type | # Households | Household Size |
| Married-Couple | 4,586 (38.3%) | 3.58 |
| Single Male/Father | 1,231 (10.3%) | 3.04 |
| Single Female/Mother | 2,299 (19.2%) | 3.64 |
| Non-family | 3,844 (32.1%) | 1.17 |
| Total Households | 11,960 (100.0%) | 2.76 |
Household Size by Marriage Status in Dalton
Out of a total of 11,960 households in Dalton, 8,116 (67.9%) are family households, while 3,844 (32.1%) are nonfamily households. The most numerous type of family households are 2-person households, comprising 2,926, and the most common type of nonfamily households are 1-person households, comprising 3,424.
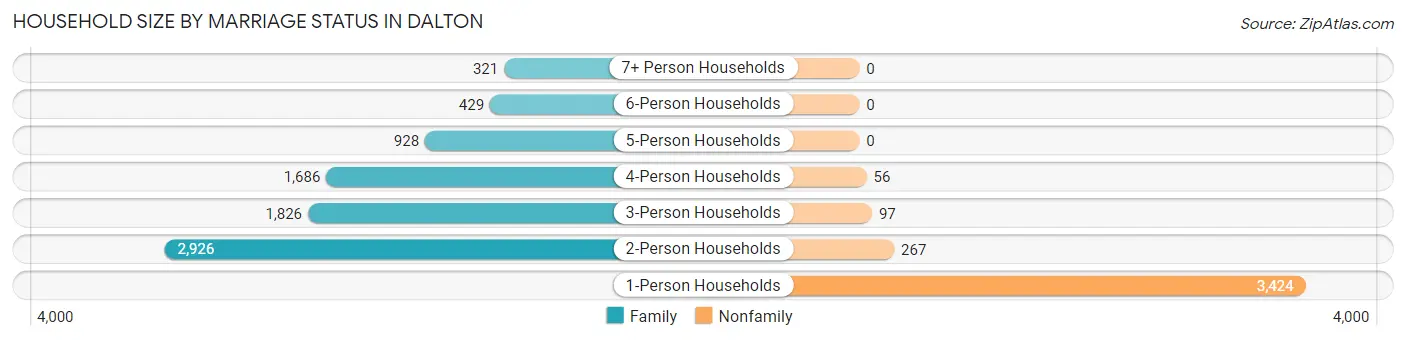
| Household Size | Family Households | Nonfamily Households |
| 1-Person Households | - | 3,424 (28.6%) |
| 2-Person Households | 2,926 (24.5%) | 267 (2.2%) |
| 3-Person Households | 1,826 (15.3%) | 97 (0.8%) |
| 4-Person Households | 1,686 (14.1%) | 56 (0.5%) |
| 5-Person Households | 928 (7.8%) | 0 (0.0%) |
| 6-Person Households | 429 (3.6%) | 0 (0.0%) |
| 7+ Person Households | 321 (2.7%) | 0 (0.0%) |
| Total | 8,116 (67.9%) | 3,844 (32.1%) |
Female Fertility in Dalton
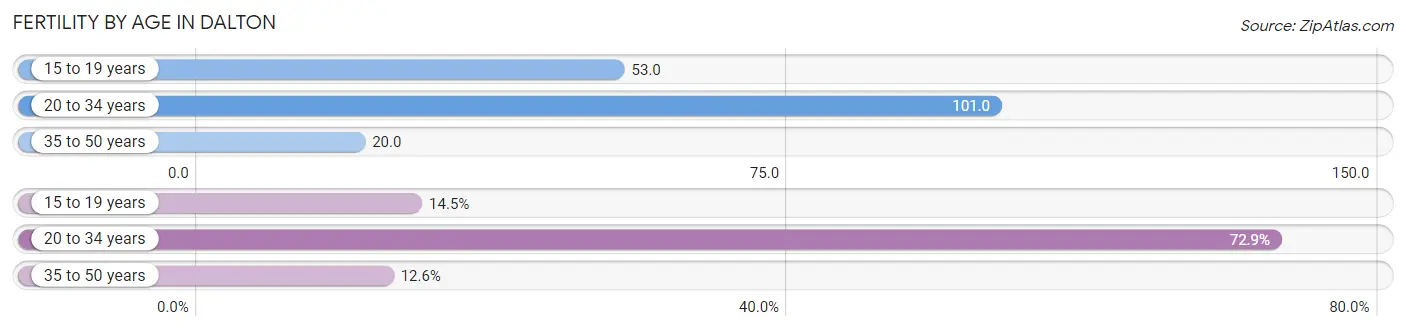
Fertility by Age in Dalton
Average fertility rate in Dalton is 62.0 births per 1,000 women. Women in the age bracket of 20 to 34 years have the highest fertility rate with 101.0 births per 1,000 women. Women in the age bracket of 20 to 34 years acount for 72.9% of all women with births.
| Age Bracket | Women with Births | Births / 1,000 Women |
| 15 to 19 years | 75 (14.5%) | 53.0 |
| 20 to 34 years | 376 (72.9%) | 101.0 |
| 35 to 50 years | 65 (12.6%) | 20.0 |
| Total | 516 (100.0%) | 62.0 |
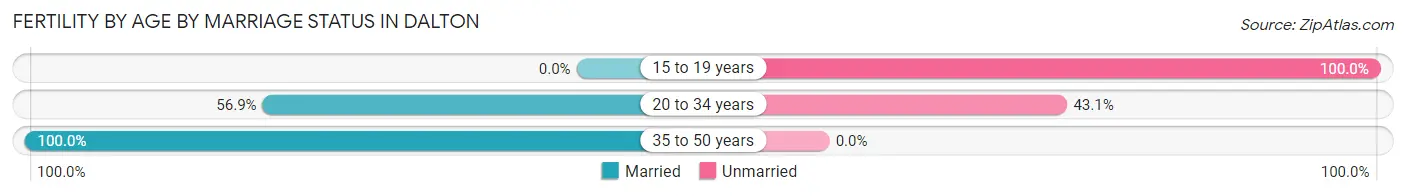
Fertility by Age by Marriage Status in Dalton
54.1% of women with births (516) in Dalton are married. The highest percentage of unmarried women with births falls into 15 to 19 years age bracket with 100.0% of them unmarried at the time of birth, while the lowest percentage of unmarried women with births belong to 35 to 50 years age bracket with 0.0% of them unmarried.
| Age Bracket | Married | Unmarried |
| 15 to 19 years | 0 (0.0%) | 75 (100.0%) |
| 20 to 34 years | 214 (56.9%) | 162 (43.1%) |
| 35 to 50 years | 65 (100.0%) | 0 (0.0%) |
| Total | 279 (54.1%) | 237 (45.9%) |
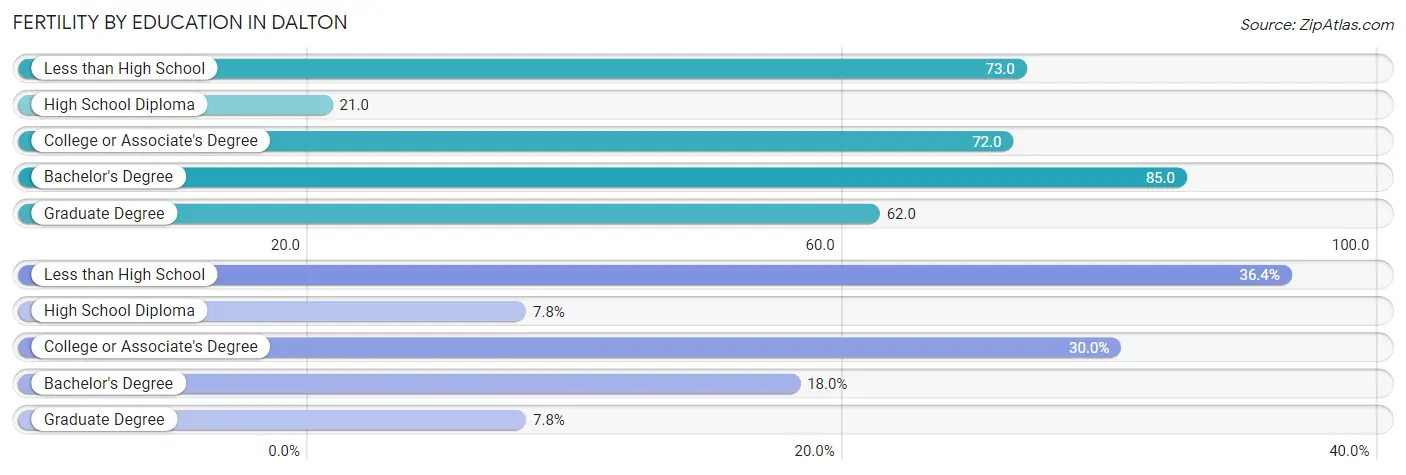
Fertility by Education in Dalton
Average fertility rate in Dalton is 62.0 births per 1,000 women. Women with the education attainment of bachelor's degree have the highest fertility rate of 85.0 births per 1,000 women, while women with the education attainment of high school diploma have the lowest fertility at 21.0 births per 1,000 women. Women with the education attainment of less than high school represent 36.4% of all women with births.
| Educational Attainment | Women with Births | Births / 1,000 Women |
| Less than High School | 188 (36.4%) | 73.0 |
| High School Diploma | 40 (7.7%) | 21.0 |
| College or Associate's Degree | 155 (30.0%) | 72.0 |
| Bachelor's Degree | 93 (18.0%) | 85.0 |
| Graduate Degree | 40 (7.7%) | 62.0 |
| Total | 516 (100.0%) | 62.0 |
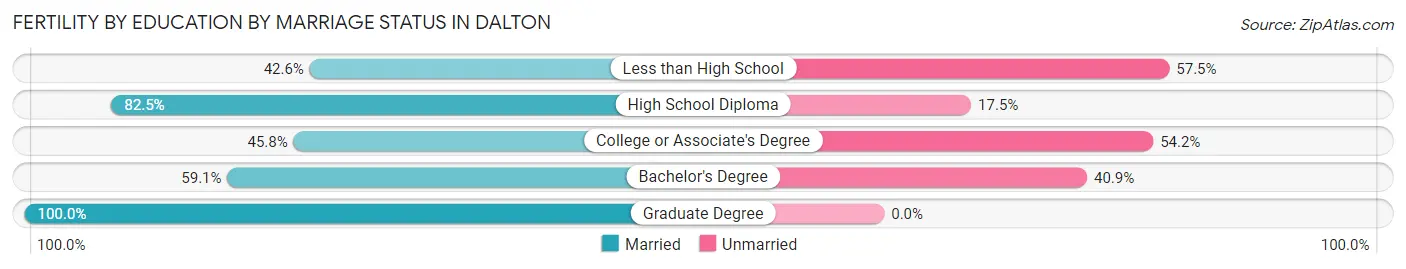
Fertility by Education by Marriage Status in Dalton
45.9% of women with births in Dalton are unmarried. Women with the educational attainment of graduate degree are most likely to be married with 100.0% of them married at childbirth, while women with the educational attainment of less than high school are least likely to be married with 57.5% of them unmarried at childbirth.
| Educational Attainment | Married | Unmarried |
| Less than High School | 80 (42.5%) | 108 (57.5%) |
| High School Diploma | 33 (82.5%) | 7 (17.5%) |
| College or Associate's Degree | 71 (45.8%) | 84 (54.2%) |
| Bachelor's Degree | 55 (59.1%) | 38 (40.9%) |
| Graduate Degree | 40 (100.0%) | 0 (0.0%) |
| Total | 279 (54.1%) | 237 (45.9%) |
Income in Dalton
Income Overview in Dalton
Per Capita Income in Dalton is $29,899, while median incomes of families and households are $69,030 and $57,163 respectively.
| Characteristic | Number | Measure |
| Per Capita Income | 34,358 | $29,899 |
| Median Family Income | 8,116 | $69,030 |
| Mean Family Income | 8,116 | $97,548 |
| Median Household Income | 11,960 | $57,163 |
| Mean Household Income | 11,960 | $82,459 |
| Income Deficit | 8,116 | $11,614 |
| Wage / Income Gap (%) | 34,358 | 19.44% |
| Wage / Income Gap ($) | 34,358 | 80.56¢ per $1 |
| Gini / Inequality Index | 34,358 | 0.47 |
Earnings by Sex in Dalton
Average Earnings in Dalton are $32,671, $34,957 for men and $28,161 for women, a difference of 19.4%.
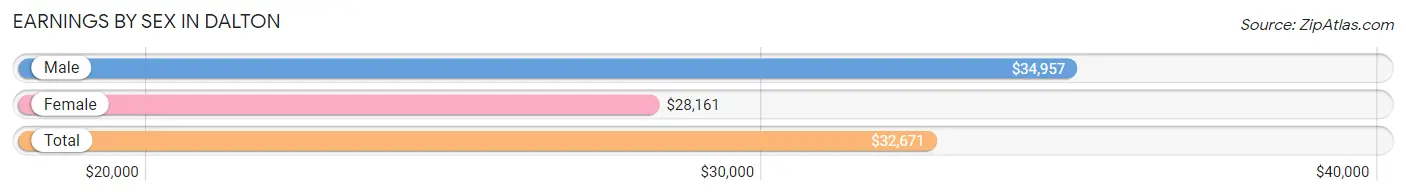
| Sex | Number | Average Earnings |
| Male | 9,762 (53.7%) | $34,957 |
| Female | 8,421 (46.3%) | $28,161 |
| Total | 18,183 (100.0%) | $32,671 |
Earnings by Sex by Income Bracket in Dalton
The most common earnings brackets in Dalton are $40,000 to $44,999 for men (998 | 10.2%) and $25,000 to $29,999 for women (1,013 | 12.0%).
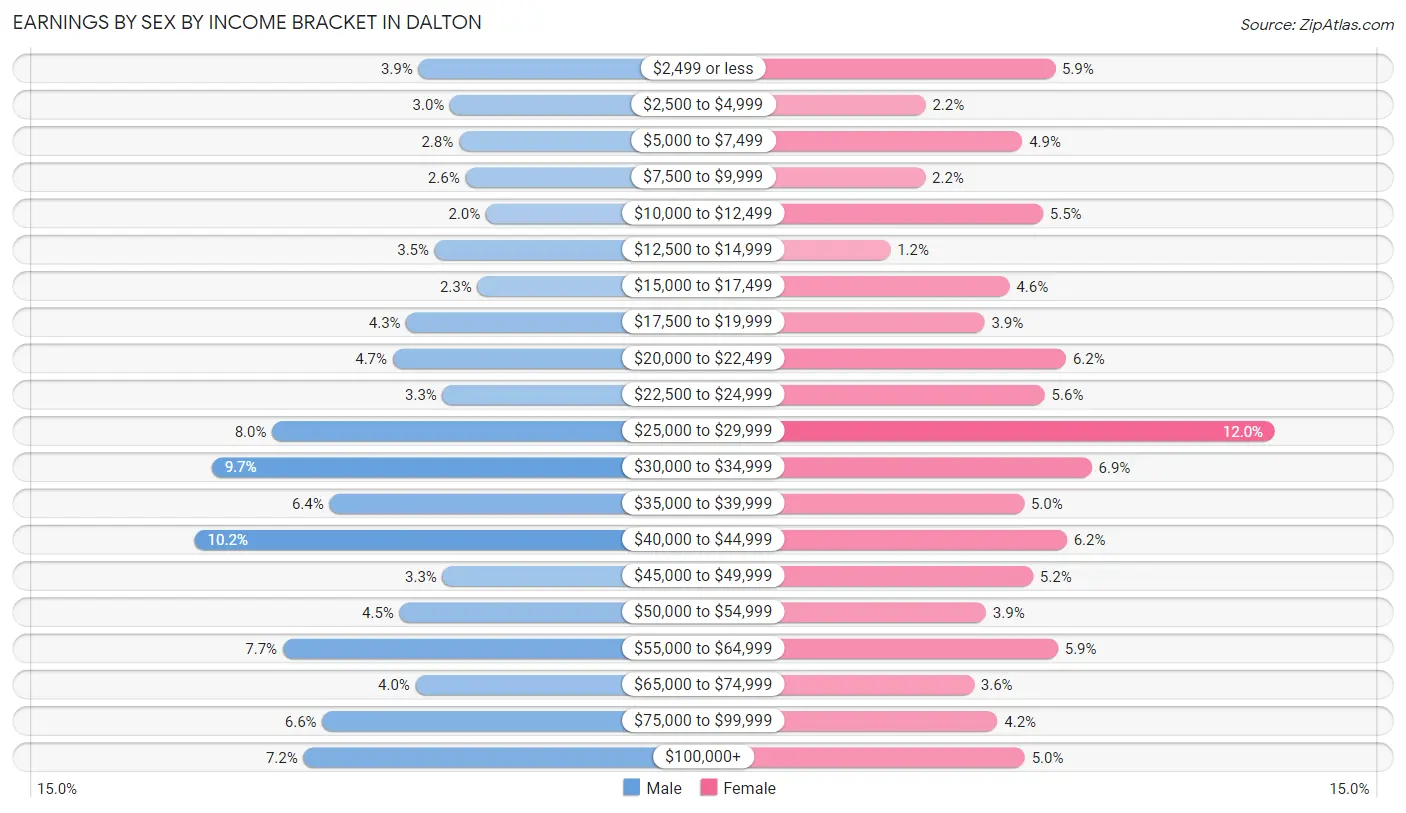
| Income | Male | Female |
| $2,499 or less | 384 (3.9%) | 493 (5.9%) |
| $2,500 to $4,999 | 297 (3.0%) | 186 (2.2%) |
| $5,000 to $7,499 | 272 (2.8%) | 415 (4.9%) |
| $7,500 to $9,999 | 255 (2.6%) | 185 (2.2%) |
| $10,000 to $12,499 | 198 (2.0%) | 464 (5.5%) |
| $12,500 to $14,999 | 339 (3.5%) | 103 (1.2%) |
| $15,000 to $17,499 | 222 (2.3%) | 385 (4.6%) |
| $17,500 to $19,999 | 417 (4.3%) | 326 (3.9%) |
| $20,000 to $22,499 | 454 (4.6%) | 519 (6.2%) |
| $22,500 to $24,999 | 317 (3.3%) | 468 (5.6%) |
| $25,000 to $29,999 | 785 (8.0%) | 1,013 (12.0%) |
| $30,000 to $34,999 | 951 (9.7%) | 579 (6.9%) |
| $35,000 to $39,999 | 628 (6.4%) | 419 (5.0%) |
| $40,000 to $44,999 | 998 (10.2%) | 520 (6.2%) |
| $45,000 to $49,999 | 317 (3.3%) | 440 (5.2%) |
| $50,000 to $54,999 | 435 (4.5%) | 329 (3.9%) |
| $55,000 to $64,999 | 756 (7.7%) | 499 (5.9%) |
| $65,000 to $74,999 | 391 (4.0%) | 301 (3.6%) |
| $75,000 to $99,999 | 647 (6.6%) | 356 (4.2%) |
| $100,000+ | 699 (7.2%) | 421 (5.0%) |
| Total | 9,762 (100.0%) | 8,421 (100.0%) |
Earnings by Sex by Educational Attainment in Dalton
Average earnings in Dalton are $38,162 for men and $31,425 for women, a difference of 17.6%. Men with an educational attainment of graduate degree enjoy the highest average annual earnings of $64,531, while those with high school diploma education earn the least with $32,169. Women with an educational attainment of graduate degree earn the most with the average annual earnings of $60,828, while those with high school diploma education have the smallest earnings of $24,650.
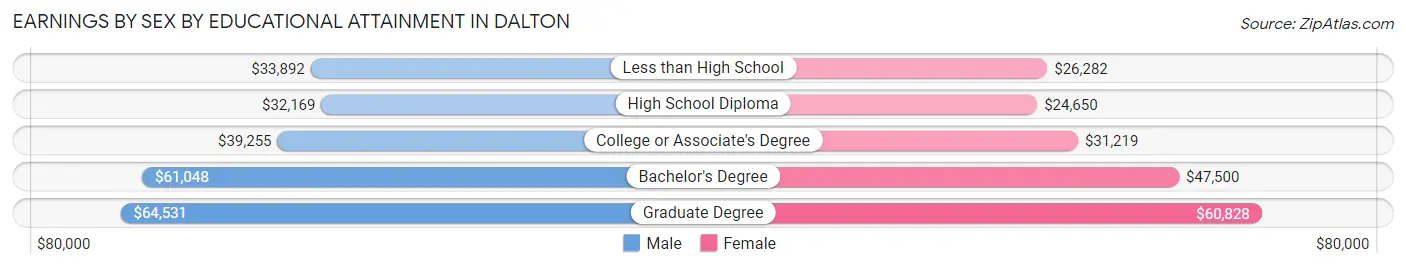
| Educational Attainment | Male Income | Female Income |
| Less than High School | $33,892 | $26,282 |
| High School Diploma | $32,169 | $24,650 |
| College or Associate's Degree | $39,255 | $31,219 |
| Bachelor's Degree | $61,048 | $47,500 |
| Graduate Degree | $64,531 | $60,828 |
| Total | $38,162 | $31,425 |
Family Income in Dalton
Family Income Brackets in Dalton
According to the Dalton family income data, there are 1,786 families falling into the $50,000 to $74,999 income range, which is the most common income bracket and makes up 22.0% of all families. Conversely, the $10,000 to $14,999 income bracket is the least frequent group with only 162 families (2.0%) belonging to this category.
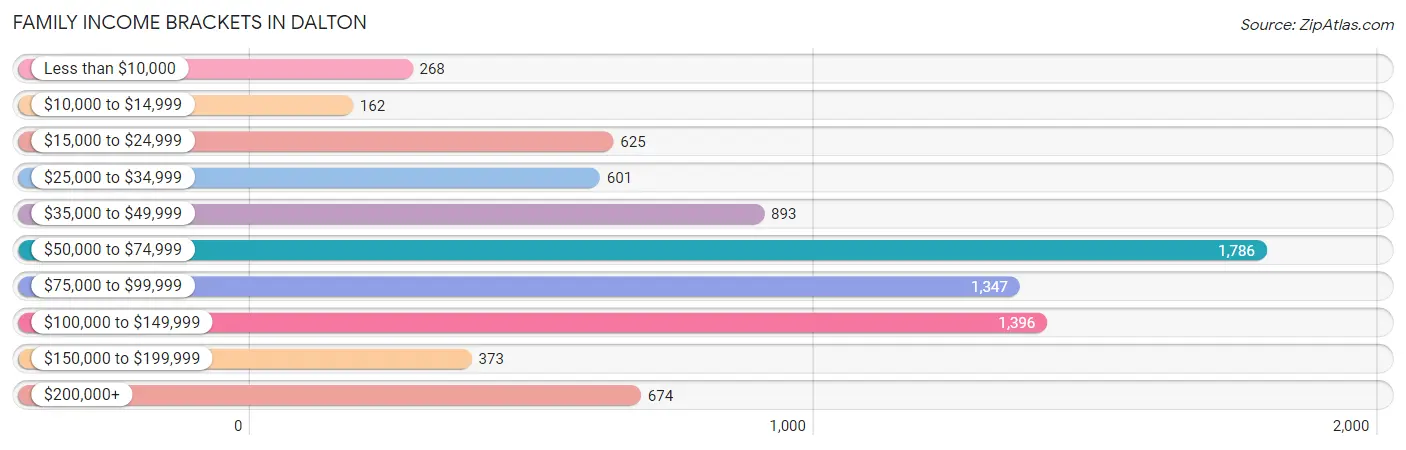
| Income Bracket | # Families | % Families |
| Less than $10,000 | 268 | 3.3% |
| $10,000 to $14,999 | 162 | 2.0% |
| $15,000 to $24,999 | 625 | 7.7% |
| $25,000 to $34,999 | 601 | 7.4% |
| $35,000 to $49,999 | 893 | 11.0% |
| $50,000 to $74,999 | 1,786 | 22.0% |
| $75,000 to $99,999 | 1,347 | 16.6% |
| $100,000 to $149,999 | 1,396 | 17.2% |
| $150,000 to $199,999 | 373 | 4.6% |
| $200,000+ | 674 | 8.3% |
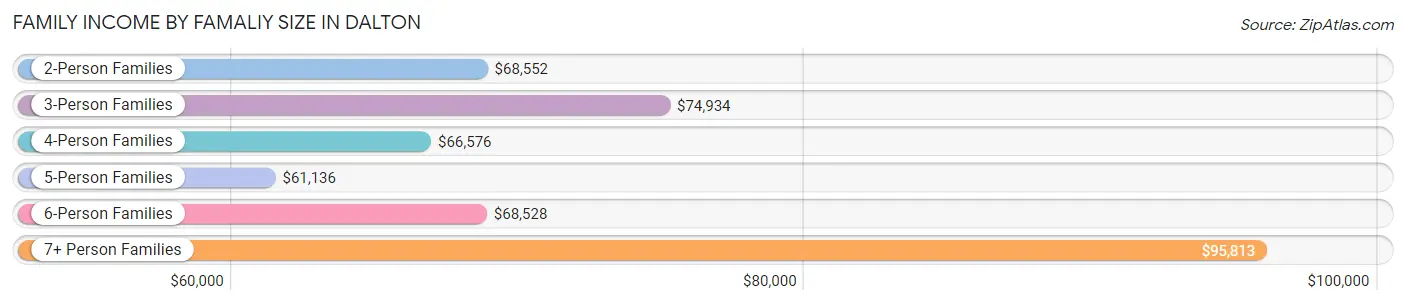
Family Income by Famaliy Size in Dalton
7+ person families (301 | 3.7%) account for the highest median family income in Dalton with $95,813 per family, while 2-person families (3,263 | 40.2%) have the highest median income of $34,276 per family member.
| Income Bracket | # Families | Median Income |
| 2-Person Families | 3,263 (40.2%) | $68,552 |
| 3-Person Families | 1,703 (21.0%) | $74,934 |
| 4-Person Families | 1,534 (18.9%) | $66,576 |
| 5-Person Families | 896 (11.0%) | $61,136 |
| 6-Person Families | 419 (5.2%) | $68,528 |
| 7+ Person Families | 301 (3.7%) | $95,813 |
| Total | 8,116 (100.0%) | $69,030 |
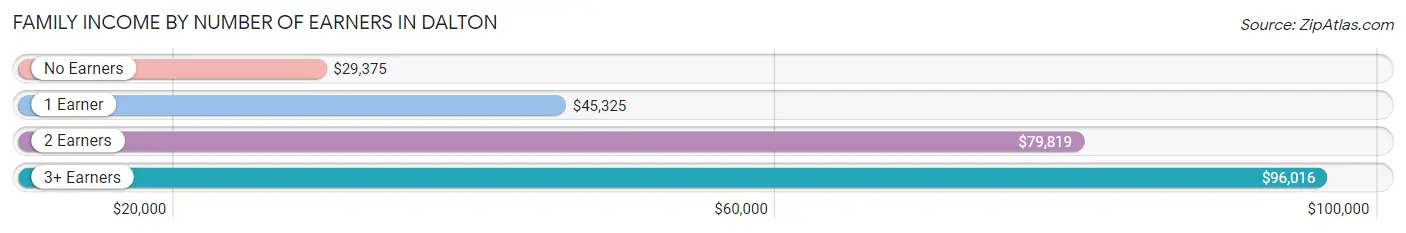
Family Income by Number of Earners in Dalton
The median family income in Dalton is $69,030, with families comprising 3+ earners (1,411) having the highest median family income of $96,016, while families with no earners (805) have the lowest median family income of $29,375, accounting for 17.4% and 9.9% of families, respectively.
| Number of Earners | # Families | Median Income |
| No Earners | 805 (9.9%) | $29,375 |
| 1 Earner | 2,847 (35.1%) | $45,325 |
| 2 Earners | 3,053 (37.6%) | $79,819 |
| 3+ Earners | 1,411 (17.4%) | $96,016 |
| Total | 8,116 (100.0%) | $69,030 |
Household Income in Dalton
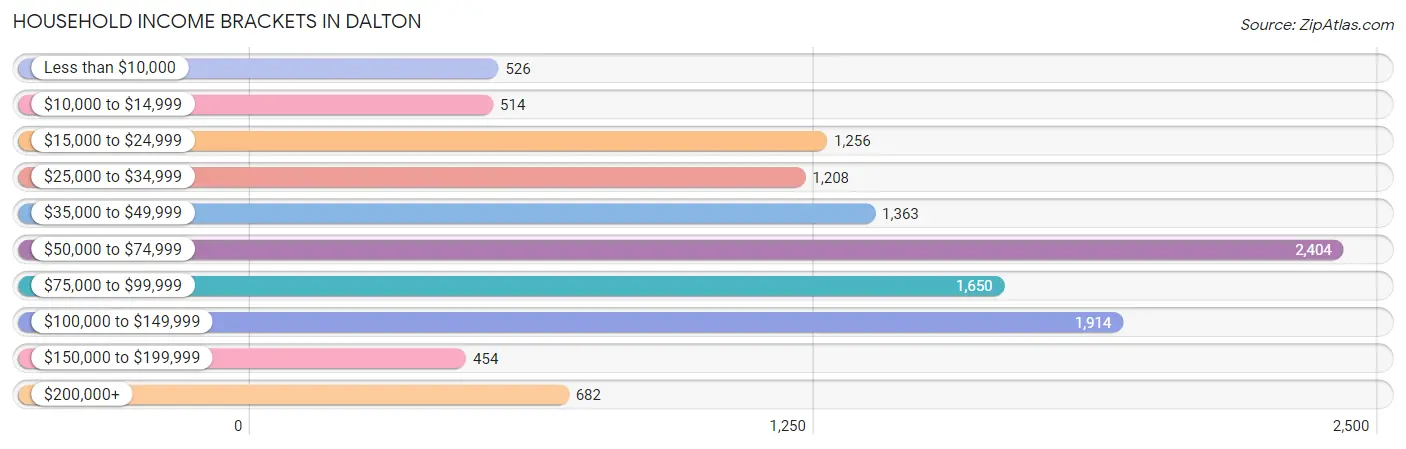
Household Income Brackets in Dalton
With 2,404 households falling in the category, the $50,000 to $74,999 income range is the most frequent in Dalton, accounting for 20.1% of all households. In contrast, only 454 households (3.8%) fall into the $150,000 to $199,999 income bracket, making it the least populous group.
| Income Bracket | # Households | % Households |
| Less than $10,000 | 526 | 4.4% |
| $10,000 to $14,999 | 514 | 4.3% |
| $15,000 to $24,999 | 1,256 | 10.5% |
| $25,000 to $34,999 | 1,208 | 10.1% |
| $35,000 to $49,999 | 1,363 | 11.4% |
| $50,000 to $74,999 | 2,404 | 20.1% |
| $75,000 to $99,999 | 1,650 | 13.8% |
| $100,000 to $149,999 | 1,914 | 16.0% |
| $150,000 to $199,999 | 454 | 3.8% |
| $200,000+ | 682 | 5.7% |
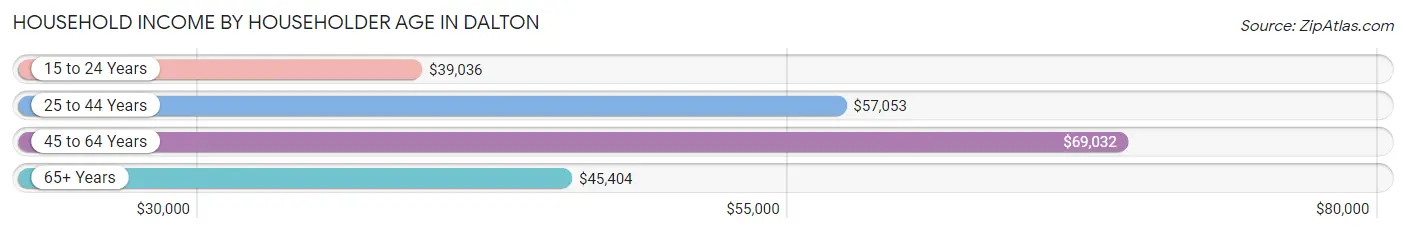
Household Income by Householder Age in Dalton
The median household income in Dalton is $57,163, with the highest median household income of $69,032 found in the 45 to 64 years age bracket for the primary householder. A total of 4,524 households (37.8%) fall into this category. Meanwhile, the 15 to 24 years age bracket for the primary householder has the lowest median household income of $39,036, with 743 households (6.2%) in this group.
| Income Bracket | # Households | Median Income |
| 15 to 24 Years | 743 (6.2%) | $39,036 |
| 25 to 44 Years | 4,134 (34.6%) | $57,053 |
| 45 to 64 Years | 4,524 (37.8%) | $69,032 |
| 65+ Years | 2,559 (21.4%) | $45,404 |
| Total | 11,960 (100.0%) | $57,163 |
Poverty in Dalton
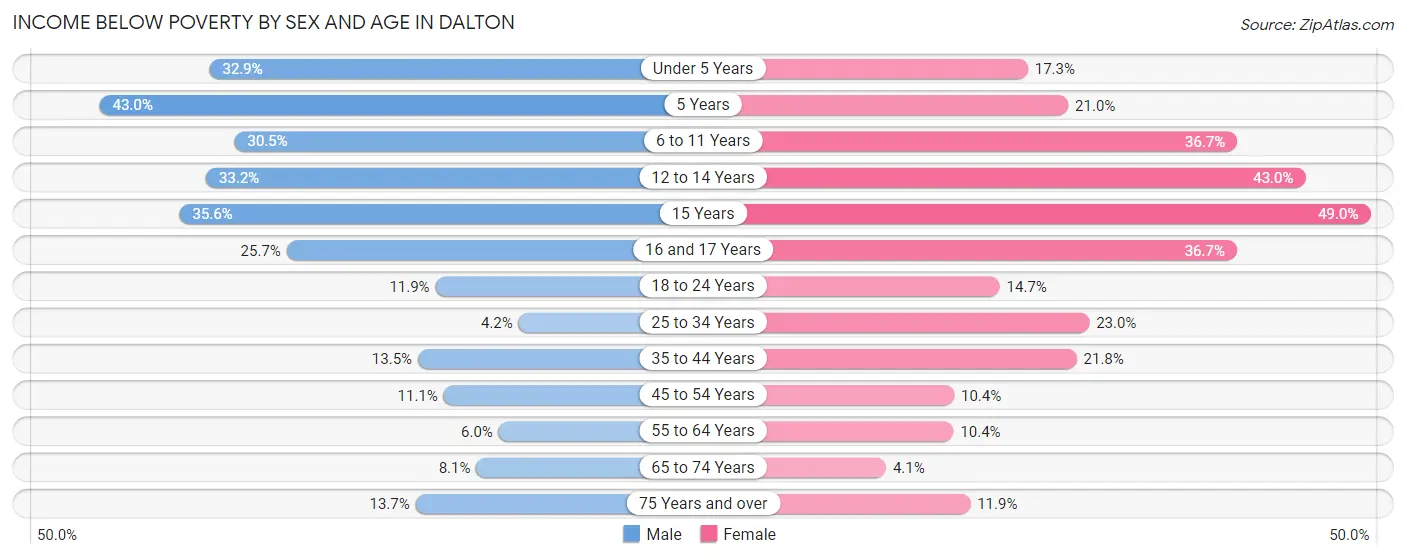
Income Below Poverty by Sex and Age in Dalton
With 15.5% poverty level for males and 19.2% for females among the residents of Dalton, 5 year old males and 15 year old females are the most vulnerable to poverty, with 99 males (43.0%) and 178 females (49.0%) in their respective age groups living below the poverty level.
| Age Bracket | Male | Female |
| Under 5 Years | 360 (32.9%) | 229 (17.3%) |
| 5 Years | 99 (43.0%) | 50 (21.0%) |
| 6 to 11 Years | 349 (30.5%) | 499 (36.7%) |
| 12 to 14 Years | 270 (33.2%) | 240 (43.0%) |
| 15 Years | 212 (35.6%) | 178 (49.0%) |
| 16 and 17 Years | 142 (25.7%) | 199 (36.6%) |
| 18 to 24 Years | 227 (11.9%) | 250 (14.6%) |
| 25 to 34 Years | 105 (4.2%) | 532 (23.0%) |
| 35 to 44 Years | 288 (13.5%) | 405 (21.8%) |
| 45 to 54 Years | 205 (11.1%) | 227 (10.4%) |
| 55 to 64 Years | 109 (6.0%) | 206 (10.4%) |
| 65 to 74 Years | 85 (8.1%) | 44 (4.1%) |
| 75 Years and over | 115 (13.7%) | 143 (11.9%) |
| Total | 2,566 (15.5%) | 3,202 (19.2%) |
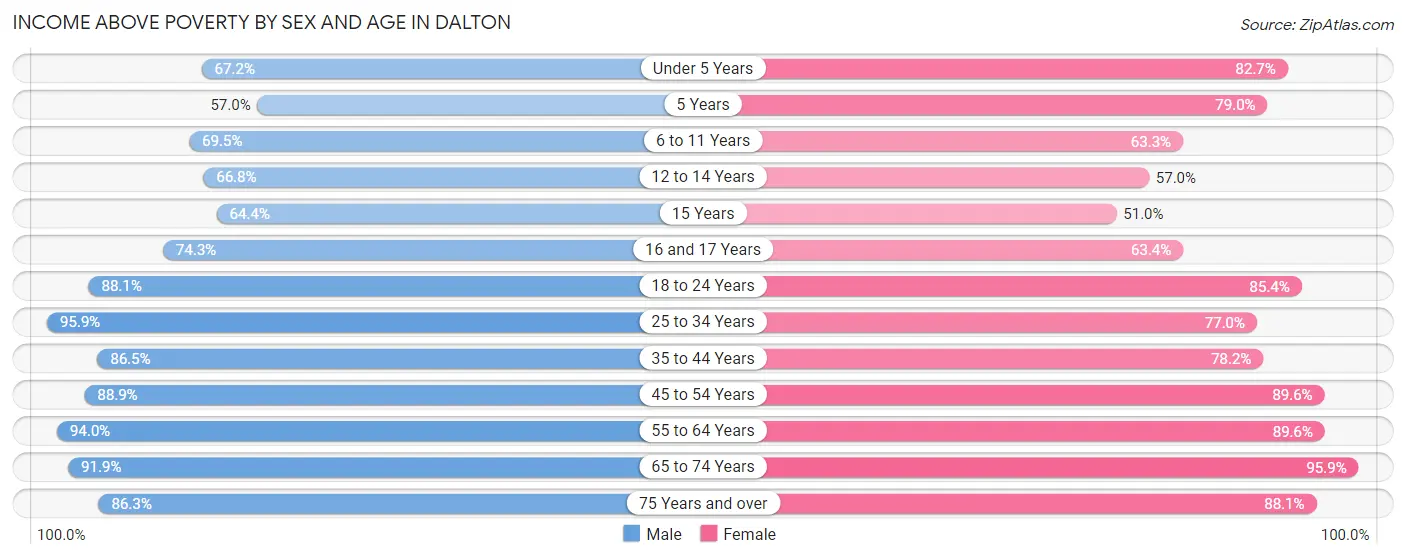
Income Above Poverty by Sex and Age in Dalton
According to the poverty statistics in Dalton, males aged 25 to 34 years and females aged 65 to 74 years are the age groups that are most secure financially, with 95.9% of males and 95.9% of females in these age groups living above the poverty line.
| Age Bracket | Male | Female |
| Under 5 Years | 736 (67.1%) | 1,098 (82.7%) |
| 5 Years | 131 (57.0%) | 188 (79.0%) |
| 6 to 11 Years | 794 (69.5%) | 861 (63.3%) |
| 12 to 14 Years | 544 (66.8%) | 318 (57.0%) |
| 15 Years | 383 (64.4%) | 185 (51.0%) |
| 16 and 17 Years | 411 (74.3%) | 344 (63.3%) |
| 18 to 24 Years | 1,686 (88.1%) | 1,457 (85.4%) |
| 25 to 34 Years | 2,428 (95.9%) | 1,785 (77.0%) |
| 35 to 44 Years | 1,846 (86.5%) | 1,454 (78.2%) |
| 45 to 54 Years | 1,641 (88.9%) | 1,951 (89.6%) |
| 55 to 64 Years | 1,708 (94.0%) | 1,783 (89.6%) |
| 65 to 74 Years | 967 (91.9%) | 1,030 (95.9%) |
| 75 Years and over | 723 (86.3%) | 1,057 (88.1%) |
| Total | 13,998 (84.5%) | 13,511 (80.8%) |
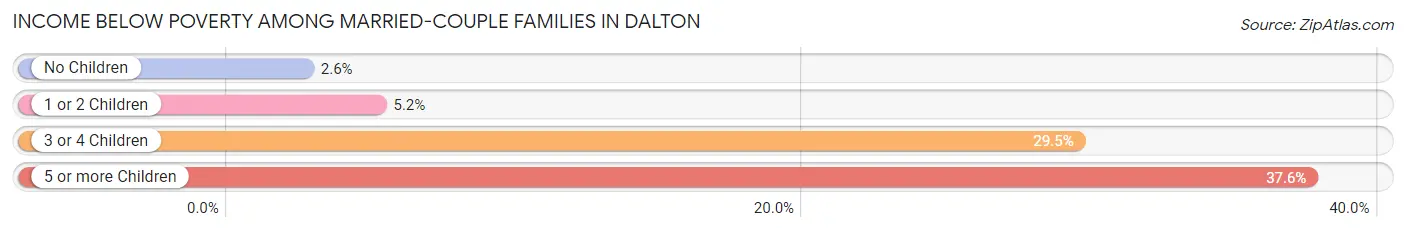
Income Below Poverty Among Married-Couple Families in Dalton
The poverty statistics for married-couple families in Dalton show that 7.6% or 347 of the total 4,586 families live below the poverty line. Families with 5 or more children have the highest poverty rate of 37.6%, comprising of 44 families. On the other hand, families with no children have the lowest poverty rate of 2.6%, which includes 60 families.
| Children | Above Poverty | Below Poverty |
| No Children | 2,213 (97.4%) | 60 (2.6%) |
| 1 or 2 Children | 1,578 (94.8%) | 86 (5.2%) |
| 3 or 4 Children | 375 (70.5%) | 157 (29.5%) |
| 5 or more Children | 73 (62.4%) | 44 (37.6%) |
| Total | 4,239 (92.4%) | 347 (7.6%) |
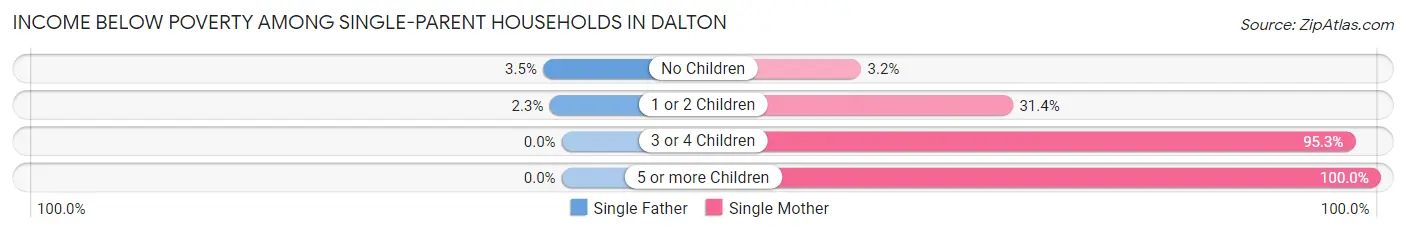
Income Below Poverty Among Single-Parent Households in Dalton
According to the poverty data in Dalton, 2.8% or 35 single-father households and 30.4% or 698 single-mother households are living below the poverty line. Among single-father households, those with no children have the highest poverty rate, with 21 households (3.5%) experiencing poverty. Likewise, among single-mother households, those with 5 or more children have the highest poverty rate, with 88 households (100.0%) falling below the poverty line.
| Children | Single Father | Single Mother |
| No Children | 21 (3.5%) | 32 (3.2%) |
| 1 or 2 Children | 14 (2.3%) | 276 (31.4%) |
| 3 or 4 Children | 0 (0.0%) | 302 (95.3%) |
| 5 or more Children | 0 (0.0%) | 88 (100.0%) |
| Total | 35 (2.8%) | 698 (30.4%) |
Income Below Poverty Among Married-Couple vs Single-Parent Households in Dalton
The poverty data for Dalton shows that 347 of the married-couple family households (7.6%) and 733 of the single-parent households (20.8%) are living below the poverty level. Within the married-couple family households, those with 5 or more children have the highest poverty rate, with 44 households (37.6%) falling below the poverty line. Among the single-parent households, those with 5 or more children have the highest poverty rate, with 88 household (100.0%) living below poverty.
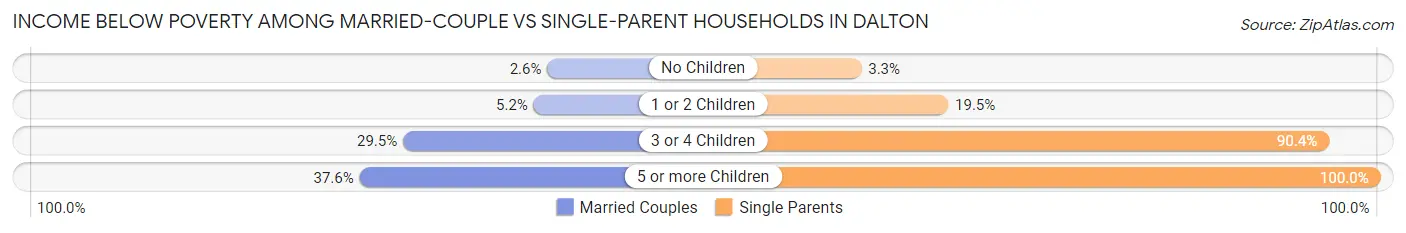
| Children | Married-Couple Families | Single-Parent Households |
| No Children | 60 (2.6%) | 53 (3.3%) |
| 1 or 2 Children | 86 (5.2%) | 290 (19.5%) |
| 3 or 4 Children | 157 (29.5%) | 302 (90.4%) |
| 5 or more Children | 44 (37.6%) | 88 (100.0%) |
| Total | 347 (7.6%) | 733 (20.8%) |
Employment Characteristics in Dalton
Employment by Class of Employer in Dalton
Among the 16,113 employed individuals in Dalton, private company employees (12,623 | 78.3%), local government employees (964 | 6.0%), and not-for-profit organizations (774 | 4.8%) make up the most common classes of employment.
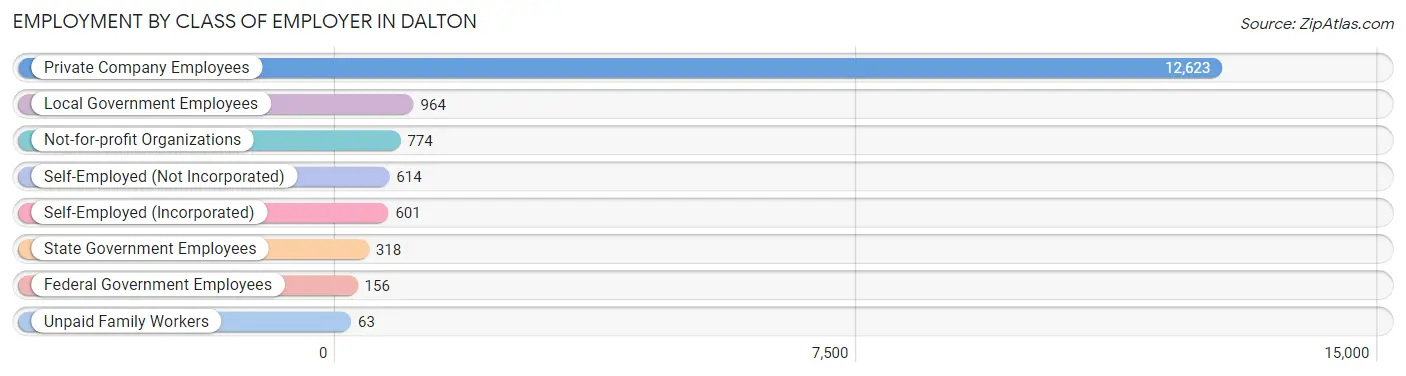
| Employer Class | # Employees | % Employees |
| Private Company Employees | 12,623 | 78.3% |
| Self-Employed (Incorporated) | 601 | 3.7% |
| Self-Employed (Not Incorporated) | 614 | 3.8% |
| Not-for-profit Organizations | 774 | 4.8% |
| Local Government Employees | 964 | 6.0% |
| State Government Employees | 318 | 2.0% |
| Federal Government Employees | 156 | 1.0% |
| Unpaid Family Workers | 63 | 0.4% |
| Total | 16,113 | 100.0% |
Employment Status by Age in Dalton
According to the labor force statistics for Dalton, out of the total population over 16 years of age (26,583), 63.6% or 16,907 individuals are in the labor force, with 3.9% or 659 of them unemployed. The age group with the highest labor force participation rate is 30 to 34 years, with 85.4% or 1,576 individuals in the labor force. Within the labor force, the 45 to 54 years age range has the highest percentage of unemployed individuals, with 8.1% or 263 of them being unemployed.
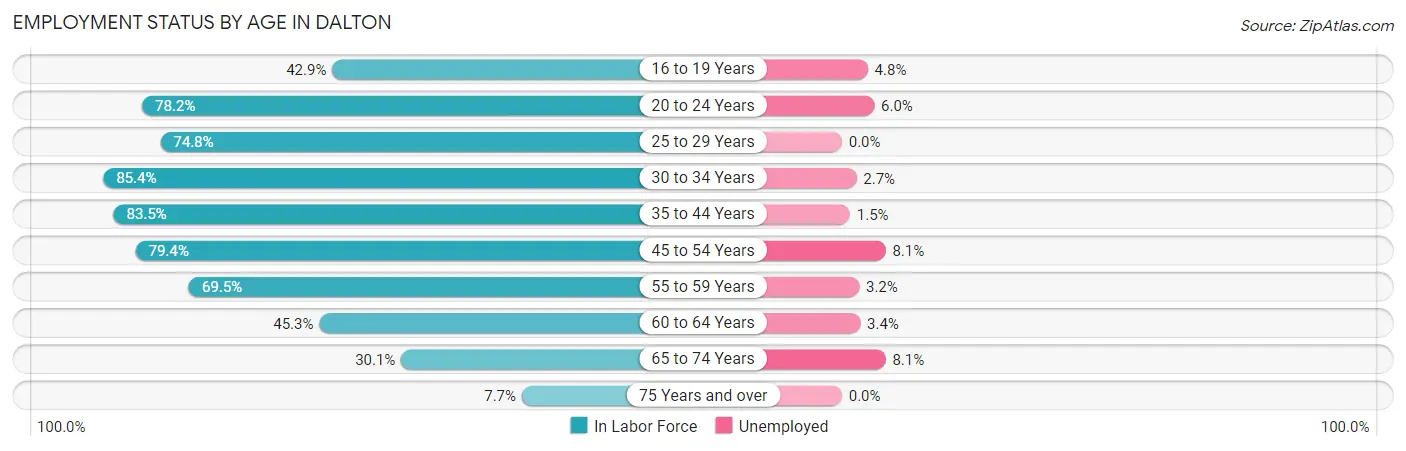
| Age Bracket | In Labor Force | Unemployed |
| 16 to 19 Years | 934 (42.9%) | 45 (4.8%) |
| 20 to 24 Years | 2,227 (78.2%) | 134 (6.0%) |
| 25 to 29 Years | 2,346 (74.8%) | 0 (0.0%) |
| 30 to 34 Years | 1,576 (85.4%) | 43 (2.7%) |
| 35 to 44 Years | 3,445 (83.5%) | 52 (1.5%) |
| 45 to 54 Years | 3,252 (79.4%) | 263 (8.1%) |
| 55 to 59 Years | 1,443 (69.5%) | 46 (3.2%) |
| 60 to 64 Years | 842 (45.3%) | 29 (3.4%) |
| 65 to 74 Years | 656 (30.1%) | 53 (8.1%) |
| 75 Years and over | 173 (7.7%) | 0 (0.0%) |
| Total | 16,907 (63.6%) | 659 (3.9%) |
Employment Status by Educational Attainment in Dalton
According to labor force statistics for Dalton, 75.3% of individuals (12,905) out of the total population between 25 and 64 years of age (17,138) are in the labor force, with 3.4% or 439 of them being unemployed. The group with the highest labor force participation rate are those with the educational attainment of bachelor's degree or higher, with 91.1% or 3,300 individuals in the labor force. Within the labor force, individuals with college / associate degree education have the highest percentage of unemployment, with 4.5% or 124 of them being unemployed.
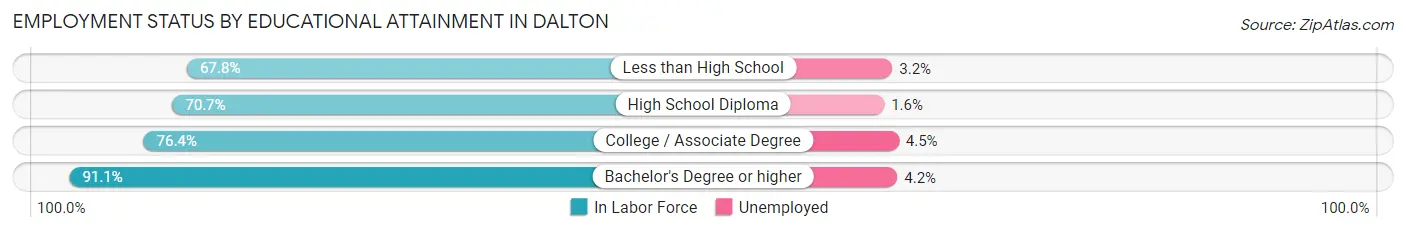
| Educational Attainment | In Labor Force | Unemployed |
| Less than High School | 3,698 (67.8%) | 175 (3.2%) |
| High School Diploma | 3,156 (70.7%) | 71 (1.6%) |
| College / Associate Degree | 2,749 (76.4%) | 162 (4.5%) |
| Bachelor's Degree or higher | 3,300 (91.1%) | 152 (4.2%) |
| Total | 12,905 (75.3%) | 583 (3.4%) |
Employment Occupations by Sex in Dalton
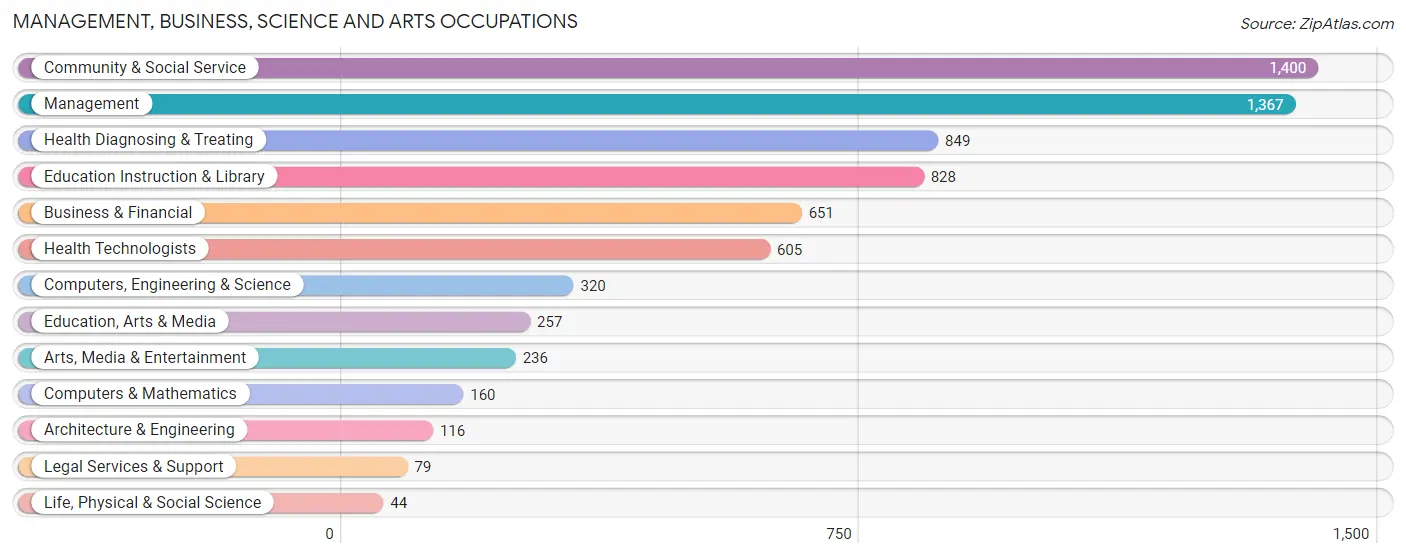
Management, Business, Science and Arts Occupations
The most common Management, Business, Science and Arts occupations in Dalton are Community & Social Service (1,400 | 8.6%), Management (1,367 | 8.4%), Health Diagnosing & Treating (849 | 5.2%), Education Instruction & Library (828 | 5.1%), and Business & Financial (651 | 4.0%).
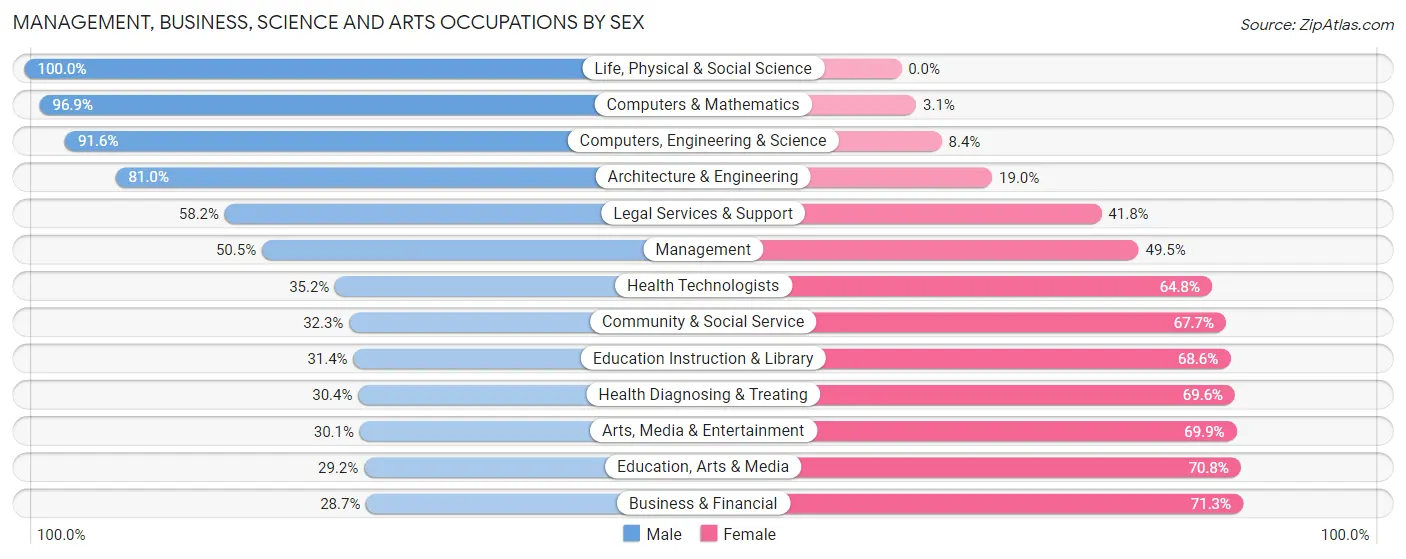
Management, Business, Science and Arts Occupations by Sex
Within the Management, Business, Science and Arts occupations in Dalton, the most male-oriented occupations are Life, Physical & Social Science (100.0%), Computers & Mathematics (96.9%), and Computers, Engineering & Science (91.6%), while the most female-oriented occupations are Business & Financial (71.3%), Education, Arts & Media (70.8%), and Arts, Media & Entertainment (69.9%).
| Occupation | Male | Female |
| Management | 690 (50.5%) | 677 (49.5%) |
| Business & Financial | 187 (28.7%) | 464 (71.3%) |
| Computers, Engineering & Science | 293 (91.6%) | 27 (8.4%) |
| Computers & Mathematics | 155 (96.9%) | 5 (3.1%) |
| Architecture & Engineering | 94 (81.0%) | 22 (19.0%) |
| Life, Physical & Social Science | 44 (100.0%) | 0 (0.0%) |
| Community & Social Service | 452 (32.3%) | 948 (67.7%) |
| Education, Arts & Media | 75 (29.2%) | 182 (70.8%) |
| Legal Services & Support | 46 (58.2%) | 33 (41.8%) |
| Education Instruction & Library | 260 (31.4%) | 568 (68.6%) |
| Arts, Media & Entertainment | 71 (30.1%) | 165 (69.9%) |
| Health Diagnosing & Treating | 258 (30.4%) | 591 (69.6%) |
| Health Technologists | 213 (35.2%) | 392 (64.8%) |
| Total (Category) | 1,880 (41.0%) | 2,707 (59.0%) |
| Total (Overall) | 8,759 (54.0%) | 7,463 (46.0%) |
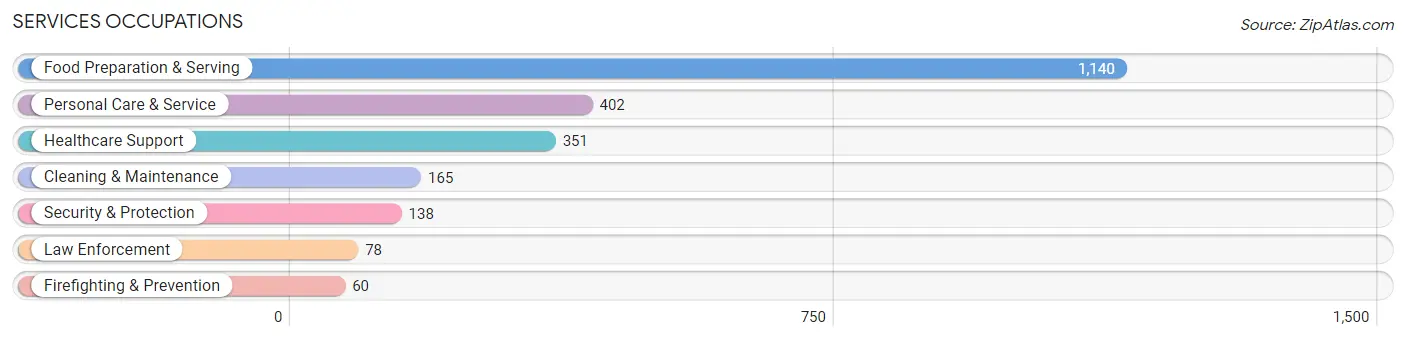
Services Occupations
The most common Services occupations in Dalton are Food Preparation & Serving (1,140 | 7.0%), Personal Care & Service (402 | 2.5%), Healthcare Support (351 | 2.2%), Cleaning & Maintenance (165 | 1.0%), and Security & Protection (138 | 0.9%).
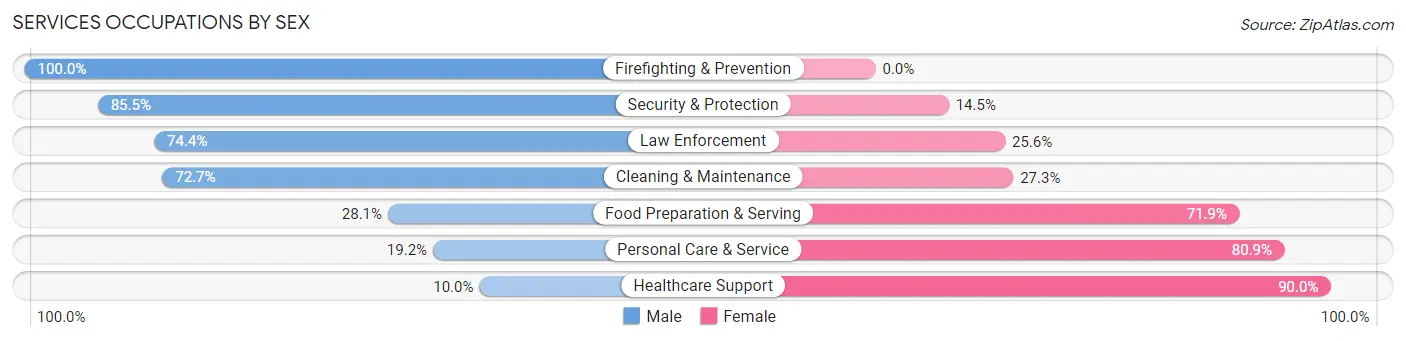
Services Occupations by Sex
Within the Services occupations in Dalton, the most male-oriented occupations are Firefighting & Prevention (100.0%), Security & Protection (85.5%), and Law Enforcement (74.4%), while the most female-oriented occupations are Healthcare Support (90.0%), Personal Care & Service (80.8%), and Food Preparation & Serving (71.9%).
| Occupation | Male | Female |
| Healthcare Support | 35 (10.0%) | 316 (90.0%) |
| Security & Protection | 118 (85.5%) | 20 (14.5%) |
| Firefighting & Prevention | 60 (100.0%) | 0 (0.0%) |
| Law Enforcement | 58 (74.4%) | 20 (25.6%) |
| Food Preparation & Serving | 320 (28.1%) | 820 (71.9%) |
| Cleaning & Maintenance | 120 (72.7%) | 45 (27.3%) |
| Personal Care & Service | 77 (19.2%) | 325 (80.8%) |
| Total (Category) | 670 (30.5%) | 1,526 (69.5%) |
| Total (Overall) | 8,759 (54.0%) | 7,463 (46.0%) |
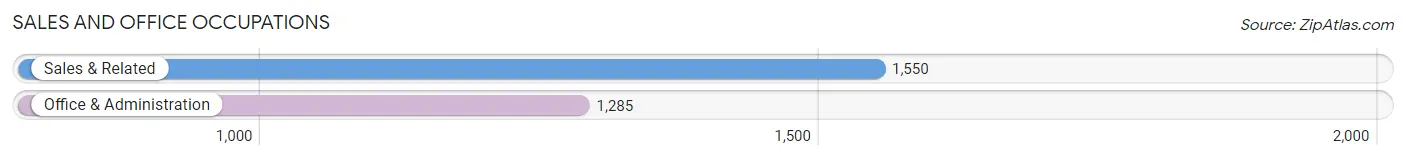
Sales and Office Occupations
The most common Sales and Office occupations in Dalton are Sales & Related (1,550 | 9.6%), and Office & Administration (1,285 | 7.9%).
Sales and Office Occupations by Sex
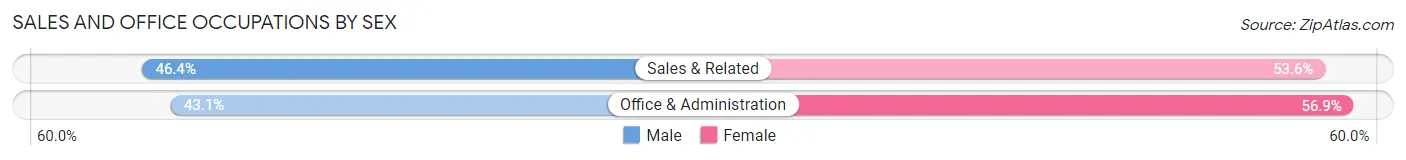
| Occupation | Male | Female |
| Sales & Related | 719 (46.4%) | 831 (53.6%) |
| Office & Administration | 554 (43.1%) | 731 (56.9%) |
| Total (Category) | 1,273 (44.9%) | 1,562 (55.1%) |
| Total (Overall) | 8,759 (54.0%) | 7,463 (46.0%) |
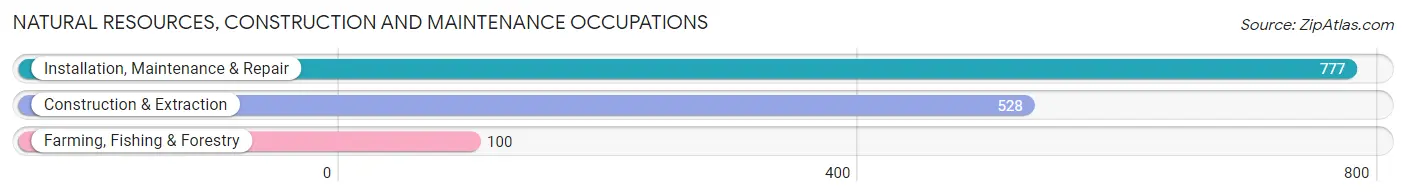
Natural Resources, Construction and Maintenance Occupations
The most common Natural Resources, Construction and Maintenance occupations in Dalton are Installation, Maintenance & Repair (777 | 4.8%), Construction & Extraction (528 | 3.3%), and Farming, Fishing & Forestry (100 | 0.6%).
Natural Resources, Construction and Maintenance Occupations by Sex
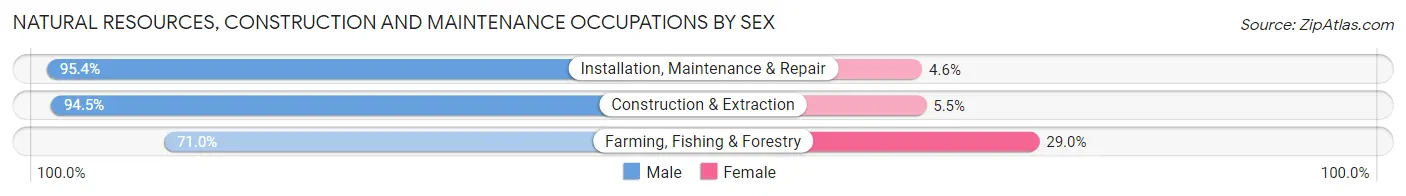
| Occupation | Male | Female |
| Farming, Fishing & Forestry | 71 (71.0%) | 29 (29.0%) |
| Construction & Extraction | 499 (94.5%) | 29 (5.5%) |
| Installation, Maintenance & Repair | 741 (95.4%) | 36 (4.6%) |
| Total (Category) | 1,311 (93.3%) | 94 (6.7%) |
| Total (Overall) | 8,759 (54.0%) | 7,463 (46.0%) |
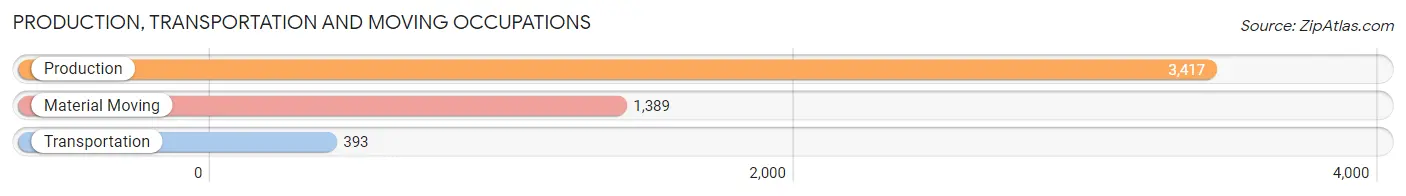
Production, Transportation and Moving Occupations
The most common Production, Transportation and Moving occupations in Dalton are Production (3,417 | 21.1%), Material Moving (1,389 | 8.6%), and Transportation (393 | 2.4%).
Production, Transportation and Moving Occupations by Sex
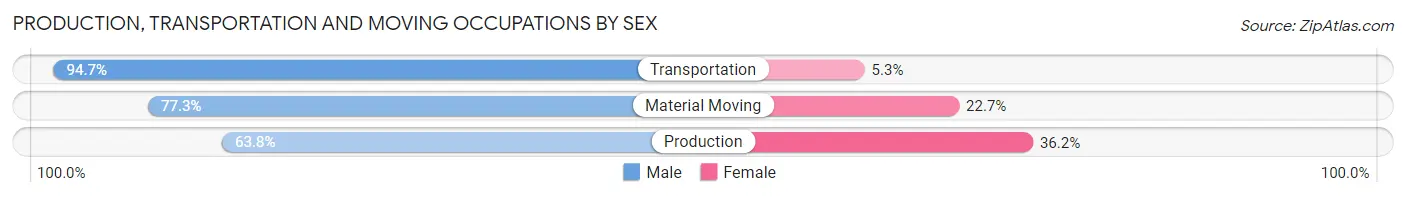
| Occupation | Male | Female |
| Production | 2,179 (63.8%) | 1,238 (36.2%) |
| Transportation | 372 (94.7%) | 21 (5.3%) |
| Material Moving | 1,074 (77.3%) | 315 (22.7%) |
| Total (Category) | 3,625 (69.7%) | 1,574 (30.3%) |
| Total (Overall) | 8,759 (54.0%) | 7,463 (46.0%) |
Employment Industries by Sex in Dalton
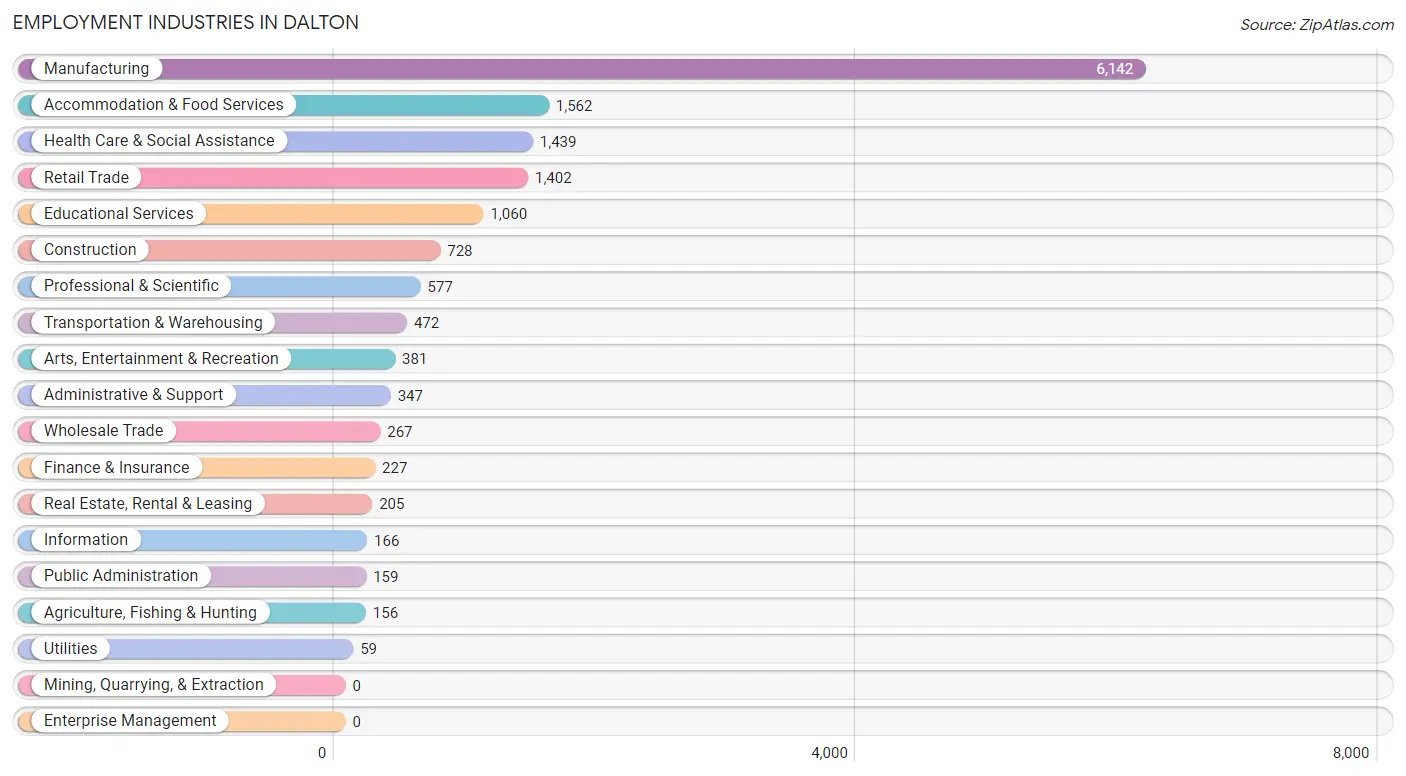
Employment Industries in Dalton
The major employment industries in Dalton include Manufacturing (6,142 | 37.9%), Accommodation & Food Services (1,562 | 9.6%), Health Care & Social Assistance (1,439 | 8.9%), Retail Trade (1,402 | 8.6%), and Educational Services (1,060 | 6.5%).
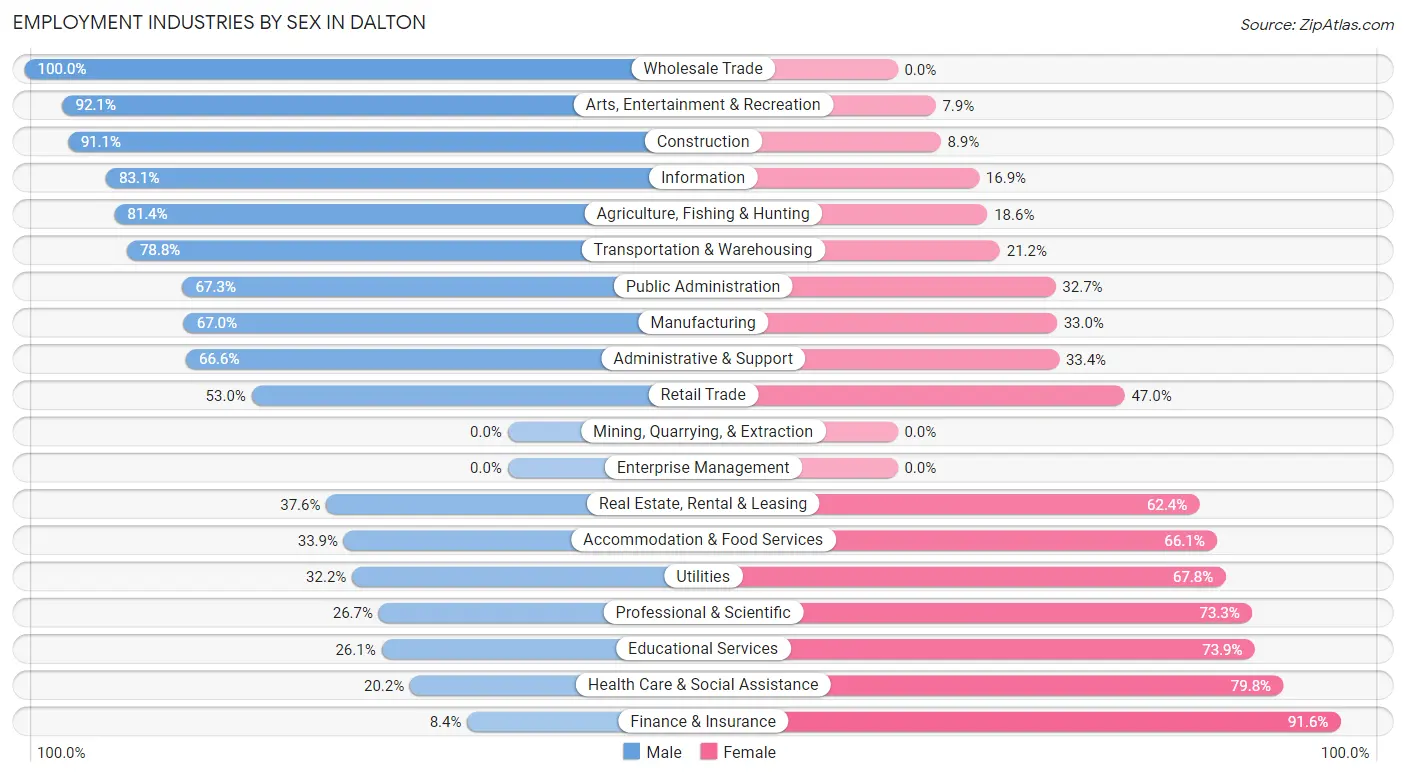
Employment Industries by Sex in Dalton
The Dalton industries that see more men than women are Wholesale Trade (100.0%), Arts, Entertainment & Recreation (92.1%), and Construction (91.1%), whereas the industries that tend to have a higher number of women are Finance & Insurance (91.6%), Health Care & Social Assistance (79.8%), and Educational Services (73.9%).
| Industry | Male | Female |
| Agriculture, Fishing & Hunting | 127 (81.4%) | 29 (18.6%) |
| Mining, Quarrying, & Extraction | 0 (0.0%) | 0 (0.0%) |
| Construction | 663 (91.1%) | 65 (8.9%) |
| Manufacturing | 4,117 (67.0%) | 2,025 (33.0%) |
| Wholesale Trade | 267 (100.0%) | 0 (0.0%) |
| Retail Trade | 743 (53.0%) | 659 (47.0%) |
| Transportation & Warehousing | 372 (78.8%) | 100 (21.2%) |
| Utilities | 19 (32.2%) | 40 (67.8%) |
| Information | 138 (83.1%) | 28 (16.9%) |
| Finance & Insurance | 19 (8.4%) | 208 (91.6%) |
| Real Estate, Rental & Leasing | 77 (37.6%) | 128 (62.4%) |
| Professional & Scientific | 154 (26.7%) | 423 (73.3%) |
| Enterprise Management | 0 (0.0%) | 0 (0.0%) |
| Administrative & Support | 231 (66.6%) | 116 (33.4%) |
| Educational Services | 277 (26.1%) | 783 (73.9%) |
| Health Care & Social Assistance | 291 (20.2%) | 1,148 (79.8%) |
| Arts, Entertainment & Recreation | 351 (92.1%) | 30 (7.9%) |
| Accommodation & Food Services | 530 (33.9%) | 1,032 (66.1%) |
| Public Administration | 107 (67.3%) | 52 (32.7%) |
| Total | 8,759 (54.0%) | 7,463 (46.0%) |
Education in Dalton
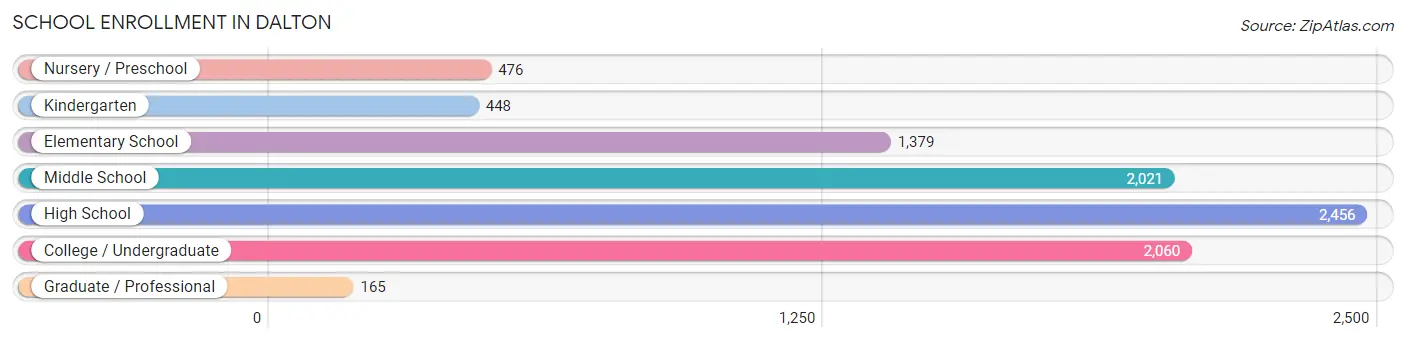
School Enrollment in Dalton
The most common levels of schooling among the 9,005 students in Dalton are high school (2,456 | 27.3%), college / undergraduate (2,060 | 22.9%), and middle school (2,021 | 22.4%).
| School Level | # Students | % Students |
| Nursery / Preschool | 476 | 5.3% |
| Kindergarten | 448 | 5.0% |
| Elementary School | 1,379 | 15.3% |
| Middle School | 2,021 | 22.4% |
| High School | 2,456 | 27.3% |
| College / Undergraduate | 2,060 | 22.9% |
| Graduate / Professional | 165 | 1.8% |
| Total | 9,005 | 100.0% |
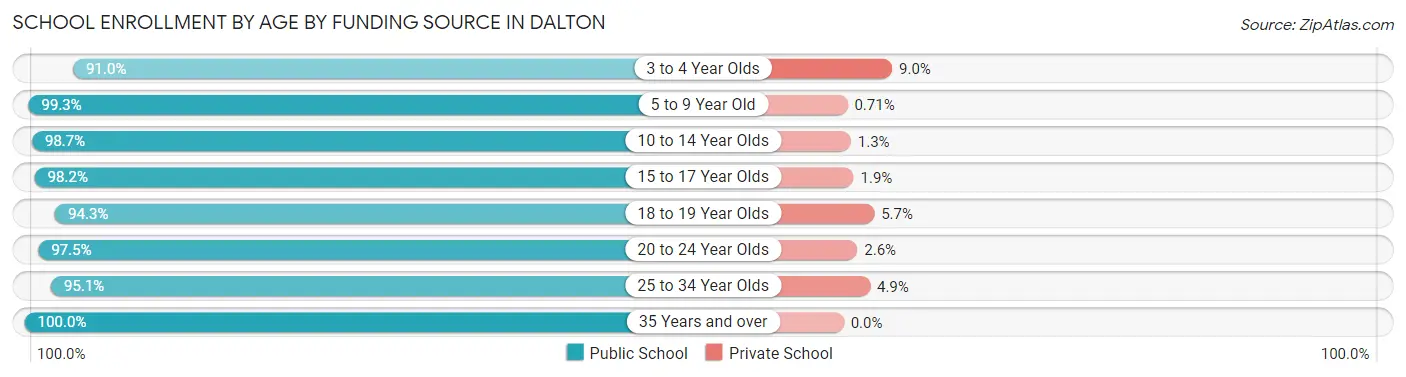
School Enrollment by Age by Funding Source in Dalton
Out of a total of 9,005 students who are enrolled in schools in Dalton, 189 (2.1%) attend a private institution, while the remaining 8,816 (97.9%) are enrolled in public schools. The age group of 3 to 4 year olds has the highest likelihood of being enrolled in private schools, with 22 (9.0% in the age bracket) enrolled. Conversely, the age group of 35 years and over has the lowest likelihood of being enrolled in a private school, with 215 (100.0% in the age bracket) attending a public institution.
| Age Bracket | Public School | Private School |
| 3 to 4 Year Olds | 222 (91.0%) | 22 (9.0%) |
| 5 to 9 Year Old | 1,953 (99.3%) | 14 (0.7%) |
| 10 to 14 Year Olds | 2,216 (98.7%) | 30 (1.3%) |
| 15 to 17 Year Olds | 2,018 (98.2%) | 38 (1.8%) |
| 18 to 19 Year Olds | 481 (94.3%) | 29 (5.7%) |
| 20 to 24 Year Olds | 1,186 (97.5%) | 31 (2.5%) |
| 25 to 34 Year Olds | 523 (95.1%) | 27 (4.9%) |
| 35 Years and over | 215 (100.0%) | 0 (0.0%) |
| Total | 8,816 (97.9%) | 189 (2.1%) |
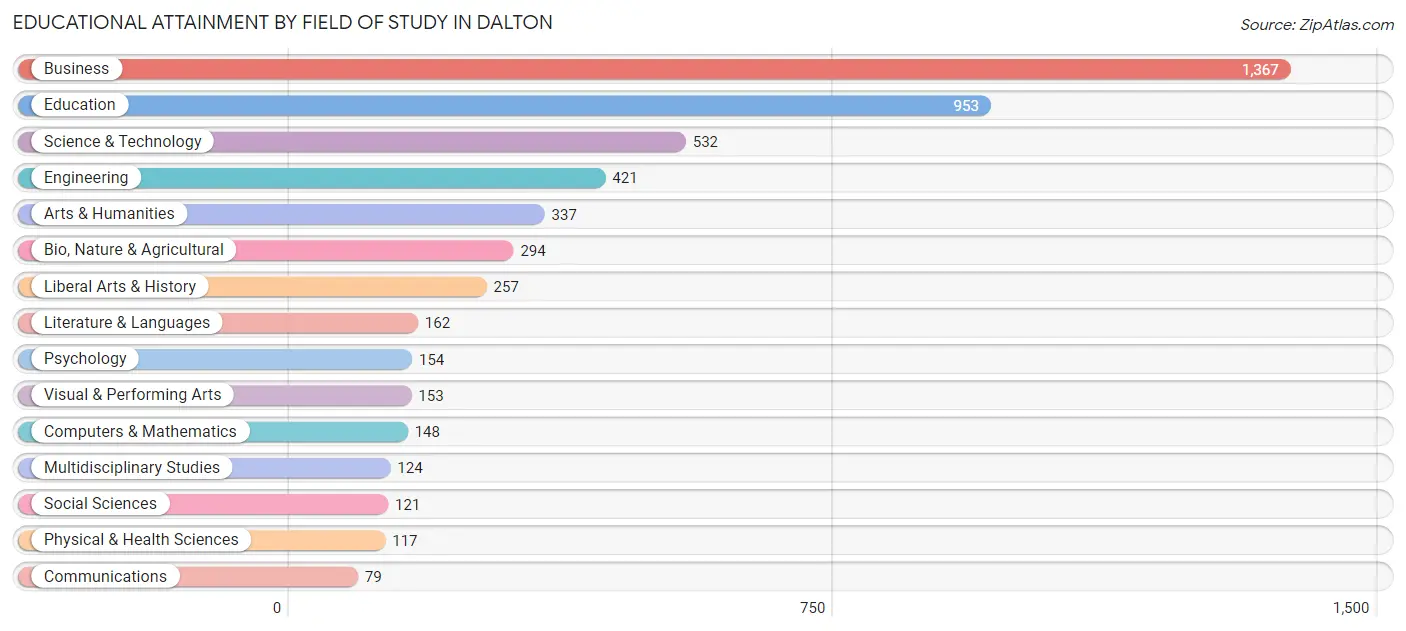
Educational Attainment by Field of Study in Dalton
Business (1,367 | 26.2%), education (953 | 18.3%), science & technology (532 | 10.2%), engineering (421 | 8.1%), and arts & humanities (337 | 6.5%) are the most common fields of study among 5,219 individuals in Dalton who have obtained a bachelor's degree or higher.
| Field of Study | # Graduates | % Graduates |
| Computers & Mathematics | 148 | 2.8% |
| Bio, Nature & Agricultural | 294 | 5.6% |
| Physical & Health Sciences | 117 | 2.2% |
| Psychology | 154 | 2.9% |
| Social Sciences | 121 | 2.3% |
| Engineering | 421 | 8.1% |
| Multidisciplinary Studies | 124 | 2.4% |
| Science & Technology | 532 | 10.2% |
| Business | 1,367 | 26.2% |
| Education | 953 | 18.3% |
| Literature & Languages | 162 | 3.1% |
| Liberal Arts & History | 257 | 4.9% |
| Visual & Performing Arts | 153 | 2.9% |
| Communications | 79 | 1.5% |
| Arts & Humanities | 337 | 6.5% |
| Total | 5,219 | 100.0% |
Transportation & Commute in Dalton
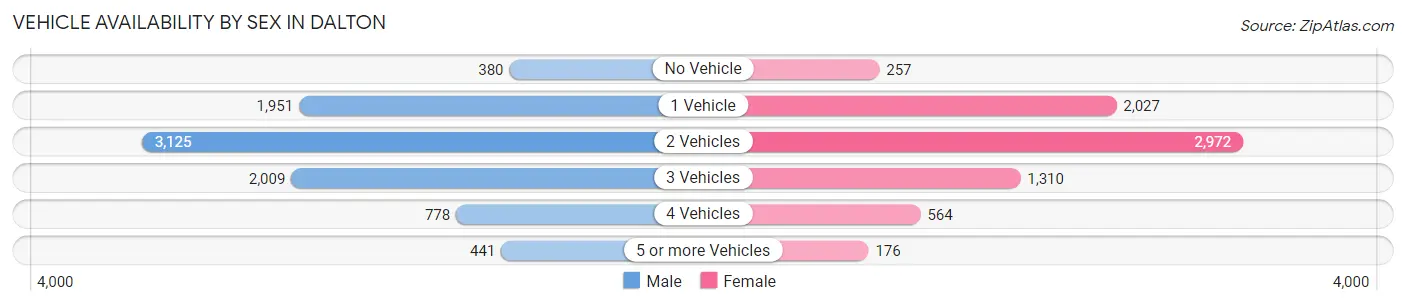
Vehicle Availability by Sex in Dalton
The most prevalent vehicle ownership categories in Dalton are males with 2 vehicles (3,125, accounting for 36.0%) and females with 2 vehicles (2,972, making up 42.8%).
| Vehicles Available | Male | Female |
| No Vehicle | 380 (4.4%) | 257 (3.5%) |
| 1 Vehicle | 1,951 (22.5%) | 2,027 (27.7%) |
| 2 Vehicles | 3,125 (36.0%) | 2,972 (40.7%) |
| 3 Vehicles | 2,009 (23.1%) | 1,310 (17.9%) |
| 4 Vehicles | 778 (9.0%) | 564 (7.7%) |
| 5 or more Vehicles | 441 (5.1%) | 176 (2.4%) |
| Total | 8,684 (100.0%) | 7,306 (100.0%) |
Commute Time in Dalton
The most frequently occuring commute durations in Dalton are 15 to 19 minutes (4,153 commuters, 26.7%), 10 to 14 minutes (3,318 commuters, 21.4%), and 20 to 24 minutes (2,442 commuters, 15.7%).
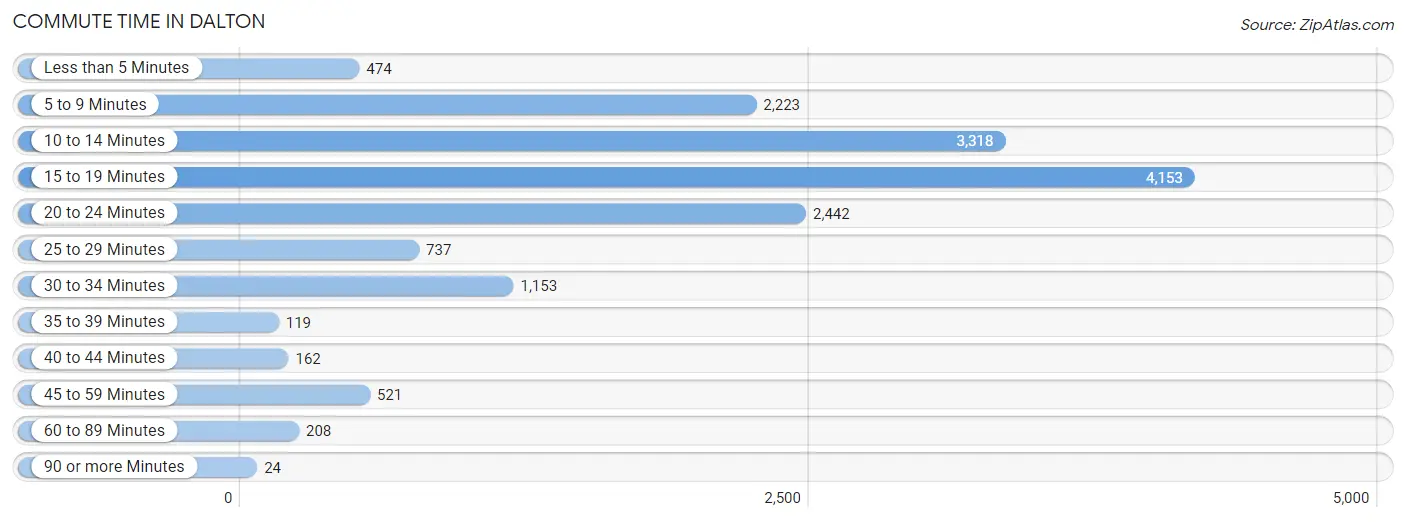
| Commute Time | # Commuters | % Commuters |
| Less than 5 Minutes | 474 | 3.0% |
| 5 to 9 Minutes | 2,223 | 14.3% |
| 10 to 14 Minutes | 3,318 | 21.4% |
| 15 to 19 Minutes | 4,153 | 26.7% |
| 20 to 24 Minutes | 2,442 | 15.7% |
| 25 to 29 Minutes | 737 | 4.7% |
| 30 to 34 Minutes | 1,153 | 7.4% |
| 35 to 39 Minutes | 119 | 0.8% |
| 40 to 44 Minutes | 162 | 1.0% |
| 45 to 59 Minutes | 521 | 3.4% |
| 60 to 89 Minutes | 208 | 1.3% |
| 90 or more Minutes | 24 | 0.2% |
Commute Time by Sex in Dalton
The most common commute times in Dalton are 15 to 19 minutes (2,327 commuters, 27.6%) for males and 15 to 19 minutes (1,826 commuters, 25.7%) for females.
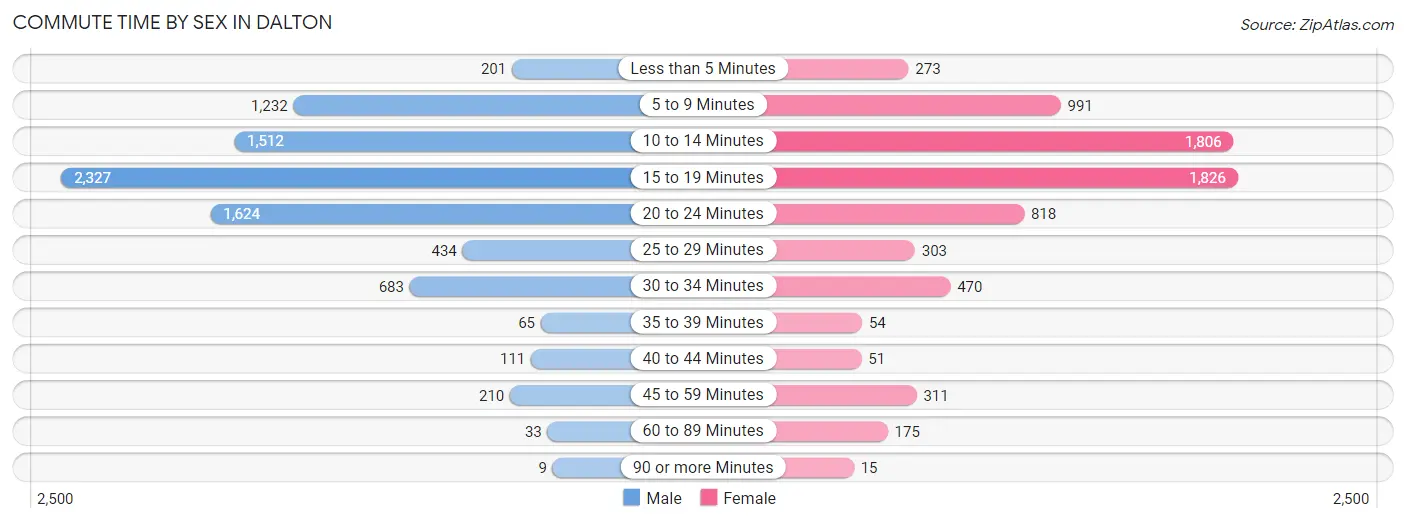
| Commute Time | Male | Female |
| Less than 5 Minutes | 201 (2.4%) | 273 (3.8%) |
| 5 to 9 Minutes | 1,232 (14.6%) | 991 (14.0%) |
| 10 to 14 Minutes | 1,512 (17.9%) | 1,806 (25.5%) |
| 15 to 19 Minutes | 2,327 (27.6%) | 1,826 (25.7%) |
| 20 to 24 Minutes | 1,624 (19.2%) | 818 (11.5%) |
| 25 to 29 Minutes | 434 (5.1%) | 303 (4.3%) |
| 30 to 34 Minutes | 683 (8.1%) | 470 (6.6%) |
| 35 to 39 Minutes | 65 (0.8%) | 54 (0.8%) |
| 40 to 44 Minutes | 111 (1.3%) | 51 (0.7%) |
| 45 to 59 Minutes | 210 (2.5%) | 311 (4.4%) |
| 60 to 89 Minutes | 33 (0.4%) | 175 (2.5%) |
| 90 or more Minutes | 9 (0.1%) | 15 (0.2%) |
Time of Departure to Work by Sex in Dalton
The most frequent times of departure to work in Dalton are 7:00 AM to 7:29 AM (1,455, 17.2%) for males and 7:00 AM to 7:29 AM (1,553, 21.9%) for females.
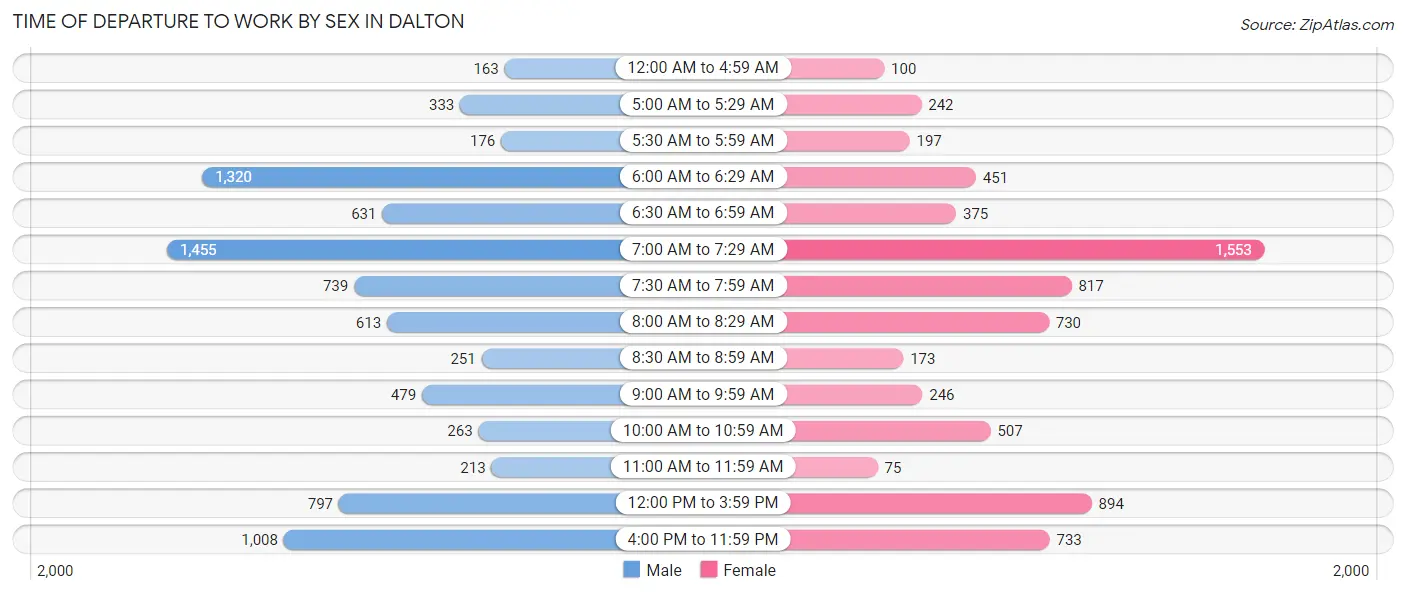
| Time of Departure | Male | Female |
| 12:00 AM to 4:59 AM | 163 (1.9%) | 100 (1.4%) |
| 5:00 AM to 5:29 AM | 333 (4.0%) | 242 (3.4%) |
| 5:30 AM to 5:59 AM | 176 (2.1%) | 197 (2.8%) |
| 6:00 AM to 6:29 AM | 1,320 (15.6%) | 451 (6.4%) |
| 6:30 AM to 6:59 AM | 631 (7.5%) | 375 (5.3%) |
| 7:00 AM to 7:29 AM | 1,455 (17.2%) | 1,553 (21.9%) |
| 7:30 AM to 7:59 AM | 739 (8.7%) | 817 (11.5%) |
| 8:00 AM to 8:29 AM | 613 (7.3%) | 730 (10.3%) |
| 8:30 AM to 8:59 AM | 251 (3.0%) | 173 (2.4%) |
| 9:00 AM to 9:59 AM | 479 (5.7%) | 246 (3.5%) |
| 10:00 AM to 10:59 AM | 263 (3.1%) | 507 (7.1%) |
| 11:00 AM to 11:59 AM | 213 (2.5%) | 75 (1.1%) |
| 12:00 PM to 3:59 PM | 797 (9.4%) | 894 (12.6%) |
| 4:00 PM to 11:59 PM | 1,008 (11.9%) | 733 (10.3%) |
| Total | 8,441 (100.0%) | 7,093 (100.0%) |
Housing Occupancy in Dalton
Occupancy by Ownership in Dalton
Of the total 11,960 dwellings in Dalton, owner-occupied units account for 6,383 (53.4%), while renter-occupied units make up 5,577 (46.6%).
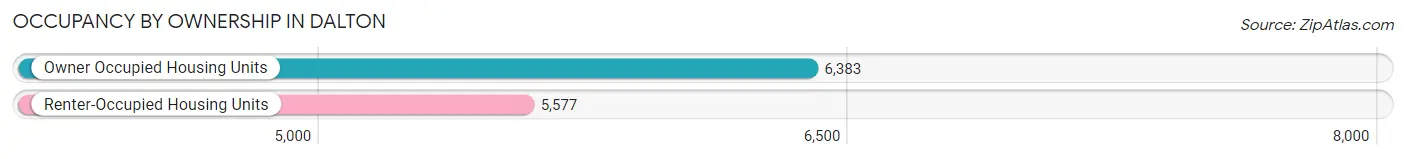
| Occupancy | # Housing Units | % Housing Units |
| Owner Occupied Housing Units | 6,383 | 53.4% |
| Renter-Occupied Housing Units | 5,577 | 46.6% |
| Total Occupied Housing Units | 11,960 | 100.0% |
Occupancy by Household Size in Dalton
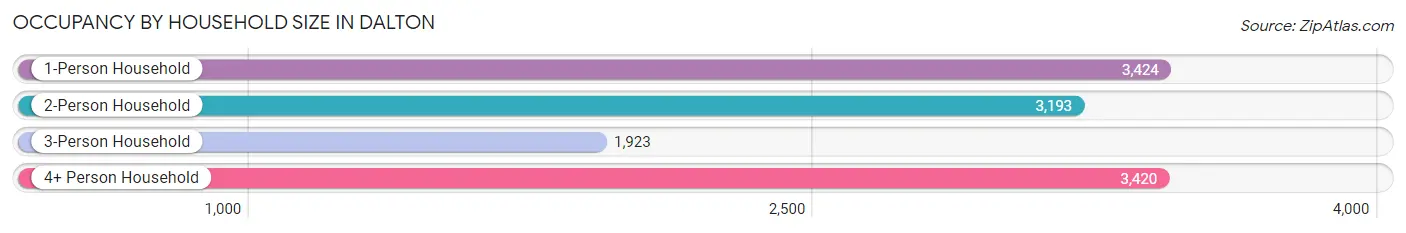
| Household Size | # Housing Units | % Housing Units |
| 1-Person Household | 3,424 | 28.6% |
| 2-Person Household | 3,193 | 26.7% |
| 3-Person Household | 1,923 | 16.1% |
| 4+ Person Household | 3,420 | 28.6% |
| Total Housing Units | 11,960 | 100.0% |
Occupancy by Ownership by Household Size in Dalton
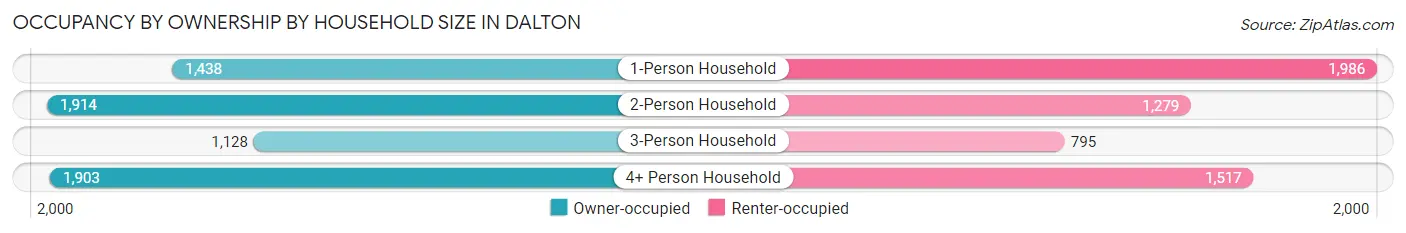
| Household Size | Owner-occupied | Renter-occupied |
| 1-Person Household | 1,438 (42.0%) | 1,986 (58.0%) |
| 2-Person Household | 1,914 (59.9%) | 1,279 (40.1%) |
| 3-Person Household | 1,128 (58.7%) | 795 (41.3%) |
| 4+ Person Household | 1,903 (55.6%) | 1,517 (44.4%) |
| Total Housing Units | 6,383 (53.4%) | 5,577 (46.6%) |
Occupancy by Educational Attainment in Dalton
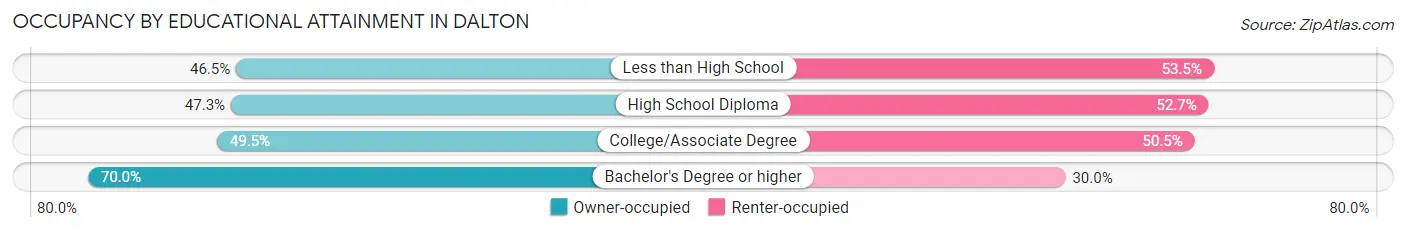
| Household Size | Owner-occupied | Renter-occupied |
| Less than High School | 1,313 (46.5%) | 1,513 (53.5%) |
| High School Diploma | 1,554 (47.3%) | 1,733 (52.7%) |
| College/Associate Degree | 1,391 (49.5%) | 1,419 (50.5%) |
| Bachelor's Degree or higher | 2,125 (70.0%) | 912 (30.0%) |
Occupancy by Age of Householder in Dalton
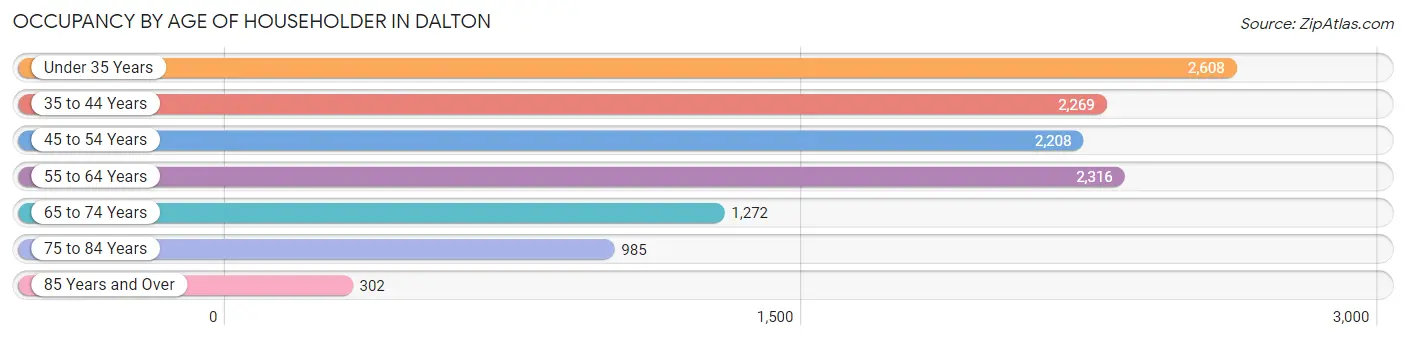
| Age Bracket | # Households | % Households |
| Under 35 Years | 2,608 | 21.8% |
| 35 to 44 Years | 2,269 | 19.0% |
| 45 to 54 Years | 2,208 | 18.5% |
| 55 to 64 Years | 2,316 | 19.4% |
| 65 to 74 Years | 1,272 | 10.6% |
| 75 to 84 Years | 985 | 8.2% |
| 85 Years and Over | 302 | 2.5% |
| Total | 11,960 | 100.0% |
Housing Finances in Dalton
Median Income by Occupancy in Dalton
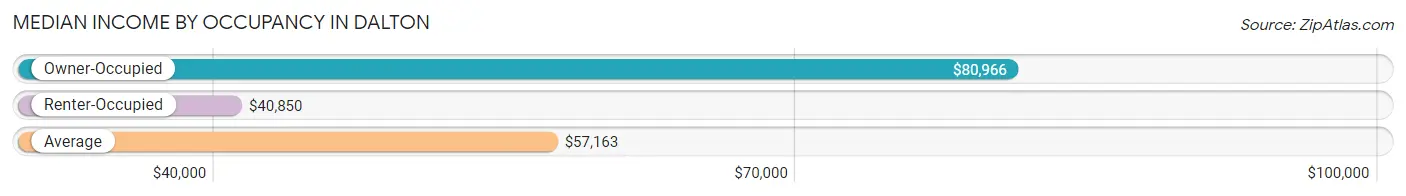
| Occupancy Type | # Households | Median Income |
| Owner-Occupied | 6,383 (53.4%) | $80,966 |
| Renter-Occupied | 5,577 (46.6%) | $40,850 |
| Average | 11,960 (100.0%) | $57,163 |
Occupancy by Householder Income Bracket in Dalton
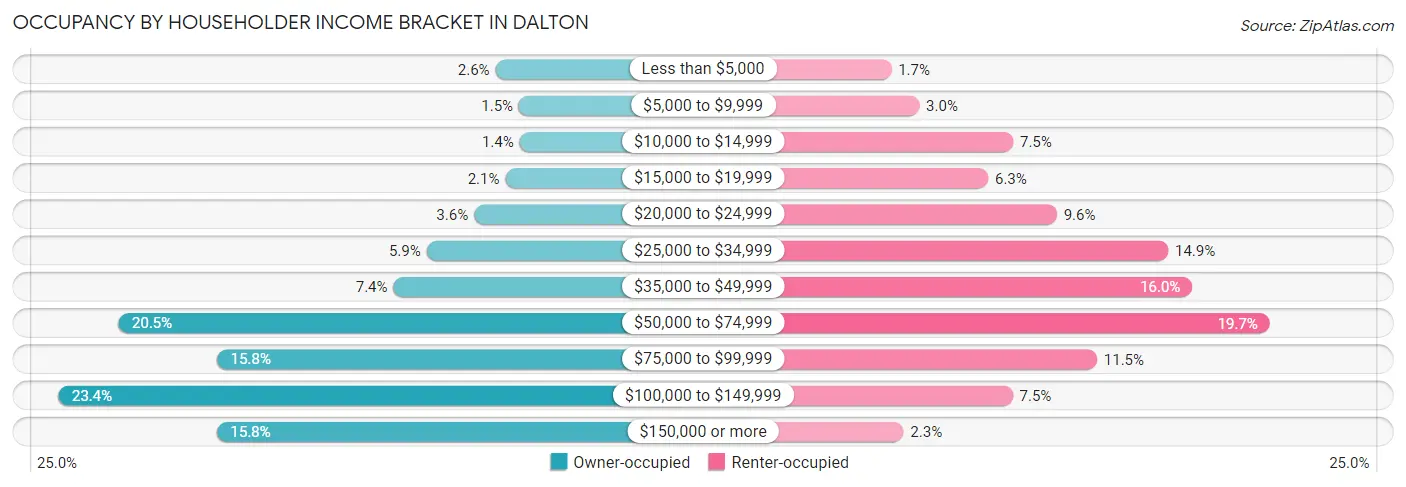
| Income Bracket | Owner-occupied | Renter-occupied |
| Less than $5,000 | 165 (2.6%) | 95 (1.7%) |
| $5,000 to $9,999 | 93 (1.5%) | 169 (3.0%) |
| $10,000 to $14,999 | 91 (1.4%) | 418 (7.5%) |
| $15,000 to $19,999 | 135 (2.1%) | 352 (6.3%) |
| $20,000 to $24,999 | 230 (3.6%) | 534 (9.6%) |
| $25,000 to $34,999 | 374 (5.9%) | 830 (14.9%) |
| $35,000 to $49,999 | 475 (7.4%) | 894 (16.0%) |
| $50,000 to $74,999 | 1,309 (20.5%) | 1,100 (19.7%) |
| $75,000 to $99,999 | 1,009 (15.8%) | 641 (11.5%) |
| $100,000 to $149,999 | 1,492 (23.4%) | 417 (7.5%) |
| $150,000 or more | 1,010 (15.8%) | 127 (2.3%) |
| Total | 6,383 (100.0%) | 5,577 (100.0%) |
Monthly Housing Cost Tiers in Dalton
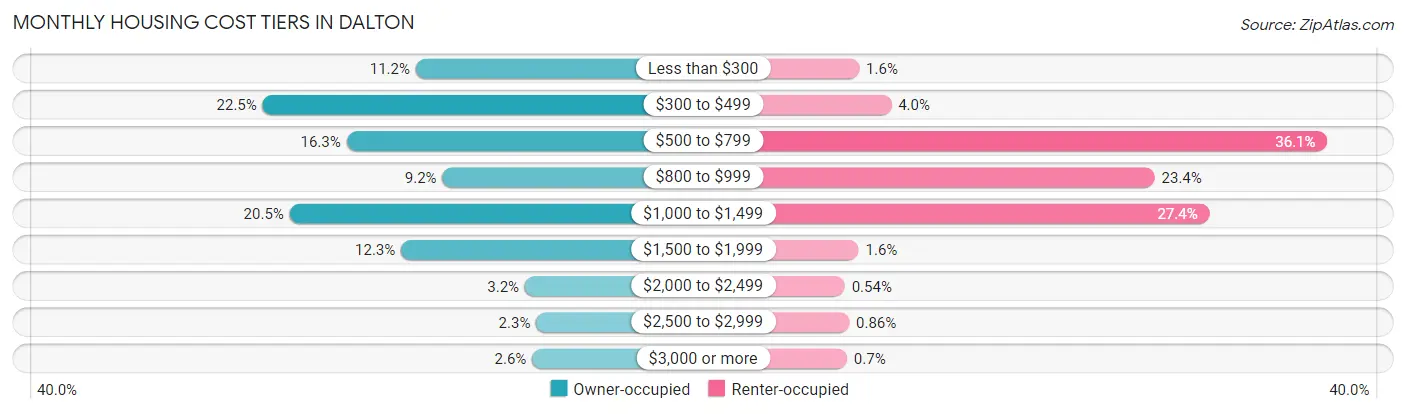
| Monthly Cost | Owner-occupied | Renter-occupied |
| Less than $300 | 714 (11.2%) | 89 (1.6%) |
| $300 to $499 | 1,434 (22.5%) | 221 (4.0%) |
| $500 to $799 | 1,040 (16.3%) | 2,012 (36.1%) |
| $800 to $999 | 589 (9.2%) | 1,303 (23.4%) |
| $1,000 to $1,499 | 1,307 (20.5%) | 1,528 (27.4%) |
| $1,500 to $1,999 | 783 (12.3%) | 87 (1.6%) |
| $2,000 to $2,499 | 201 (3.2%) | 30 (0.5%) |
| $2,500 to $2,999 | 148 (2.3%) | 48 (0.9%) |
| $3,000 or more | 167 (2.6%) | 39 (0.7%) |
| Total | 6,383 (100.0%) | 5,577 (100.0%) |
Physical Housing Characteristics in Dalton
Housing Structures in Dalton
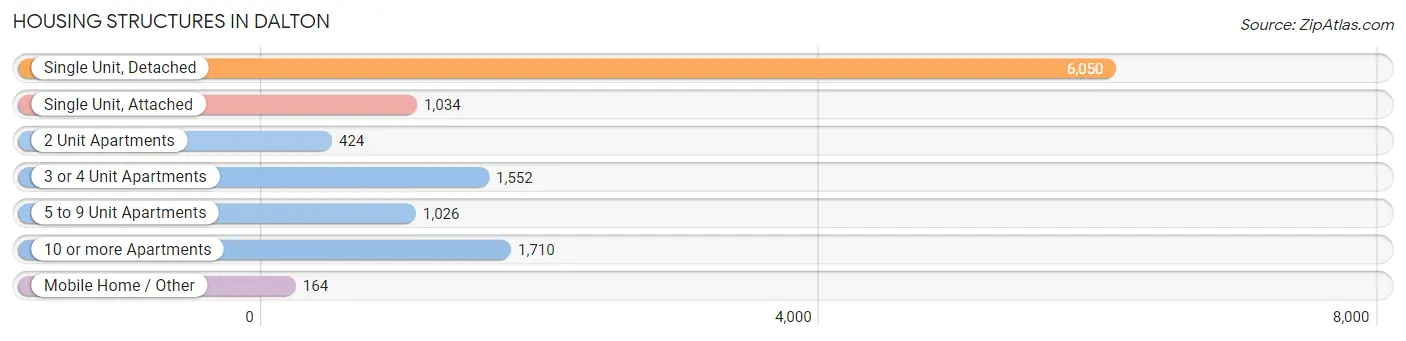
| Structure Type | # Housing Units | % Housing Units |
| Single Unit, Detached | 6,050 | 50.6% |
| Single Unit, Attached | 1,034 | 8.6% |
| 2 Unit Apartments | 424 | 3.5% |
| 3 or 4 Unit Apartments | 1,552 | 13.0% |
| 5 to 9 Unit Apartments | 1,026 | 8.6% |
| 10 or more Apartments | 1,710 | 14.3% |
| Mobile Home / Other | 164 | 1.4% |
| Total | 11,960 | 100.0% |
Housing Structures by Occupancy in Dalton
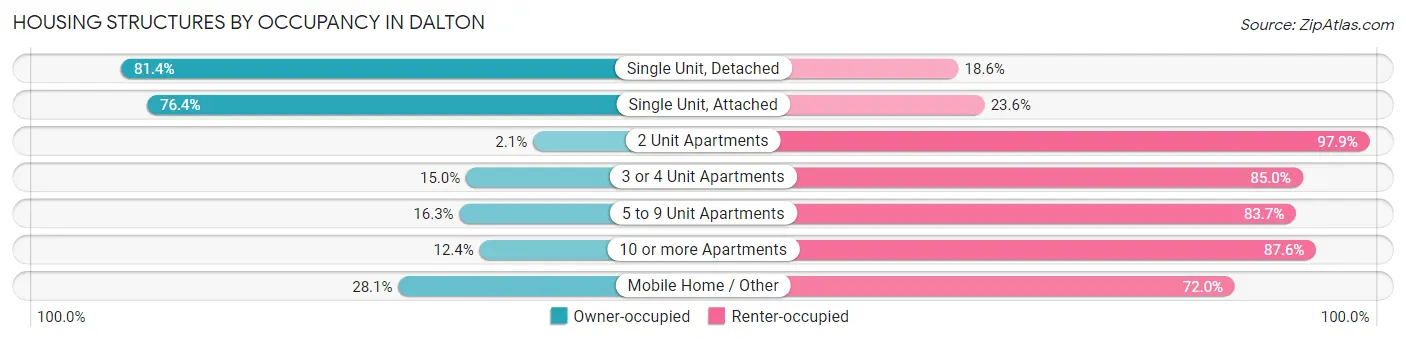
| Structure Type | Owner-occupied | Renter-occupied |
| Single Unit, Detached | 4,926 (81.4%) | 1,124 (18.6%) |
| Single Unit, Attached | 790 (76.4%) | 244 (23.6%) |
| 2 Unit Apartments | 9 (2.1%) | 415 (97.9%) |
| 3 or 4 Unit Apartments | 233 (15.0%) | 1,319 (85.0%) |
| 5 to 9 Unit Apartments | 167 (16.3%) | 859 (83.7%) |
| 10 or more Apartments | 212 (12.4%) | 1,498 (87.6%) |
| Mobile Home / Other | 46 (28.1%) | 118 (72.0%) |
| Total | 6,383 (53.4%) | 5,577 (46.6%) |
Housing Structures by Number of Rooms in Dalton
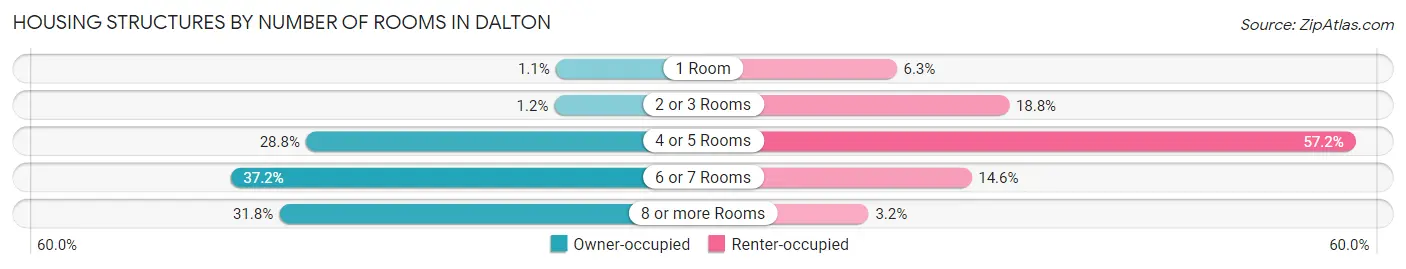
| Number of Rooms | Owner-occupied | Renter-occupied |
| 1 Room | 68 (1.1%) | 350 (6.3%) |
| 2 or 3 Rooms | 78 (1.2%) | 1,046 (18.8%) |
| 4 or 5 Rooms | 1,838 (28.8%) | 3,191 (57.2%) |
| 6 or 7 Rooms | 2,372 (37.2%) | 813 (14.6%) |
| 8 or more Rooms | 2,027 (31.8%) | 177 (3.2%) |
| Total | 6,383 (100.0%) | 5,577 (100.0%) |
Housing Structure by Heating Type in Dalton
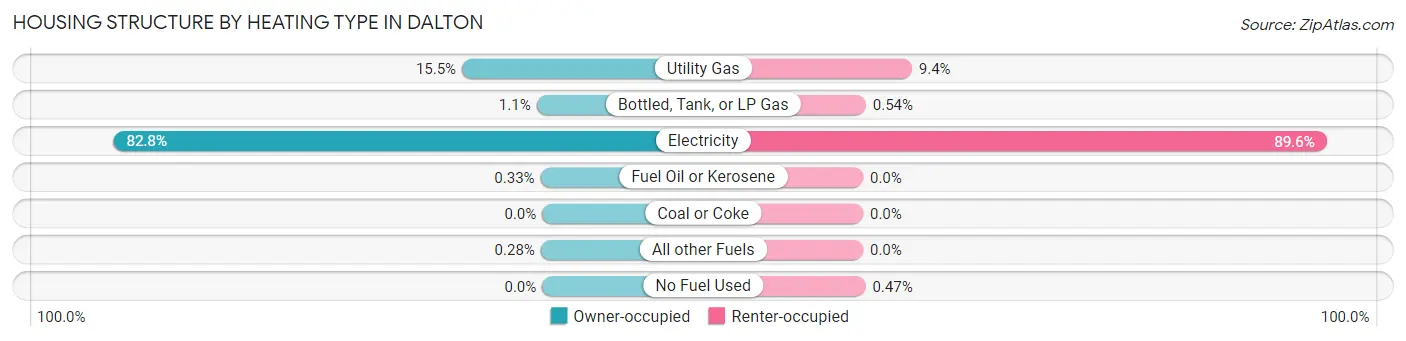
| Heating Type | Owner-occupied | Renter-occupied |
| Utility Gas | 989 (15.5%) | 526 (9.4%) |
| Bottled, Tank, or LP Gas | 69 (1.1%) | 30 (0.5%) |
| Electricity | 5,286 (82.8%) | 4,995 (89.6%) |
| Fuel Oil or Kerosene | 21 (0.3%) | 0 (0.0%) |
| Coal or Coke | 0 (0.0%) | 0 (0.0%) |
| All other Fuels | 18 (0.3%) | 0 (0.0%) |
| No Fuel Used | 0 (0.0%) | 26 (0.5%) |
| Total | 6,383 (100.0%) | 5,577 (100.0%) |
Household Vehicle Usage in Dalton
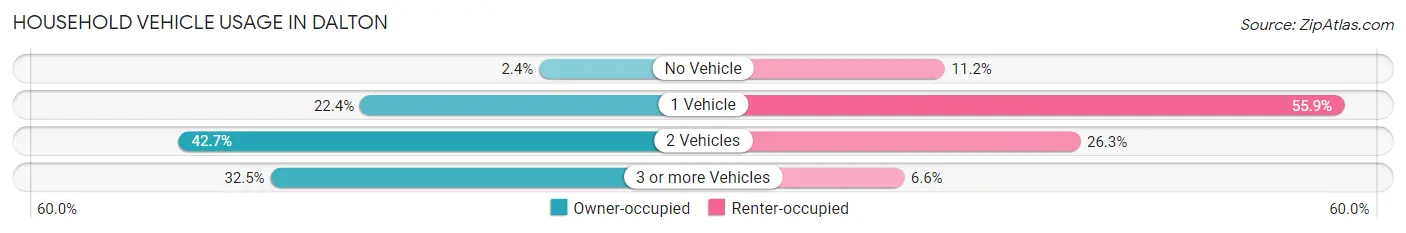
| Vehicles per Household | Owner-occupied | Renter-occupied |
| No Vehicle | 151 (2.4%) | 623 (11.2%) |
| 1 Vehicle | 1,432 (22.4%) | 3,117 (55.9%) |
| 2 Vehicles | 2,728 (42.7%) | 1,469 (26.3%) |
| 3 or more Vehicles | 2,072 (32.5%) | 368 (6.6%) |
| Total | 6,383 (100.0%) | 5,577 (100.0%) |
Real Estate & Mortgages in Dalton
Real Estate and Mortgage Overview in Dalton
| Characteristic | Without Mortgage | With Mortgage |
| Housing Units | 3,014 | 3,369 |
| Median Property Value | $173,500 | $201,300 |
| Median Household Income | $62,684 | $623 |
| Monthly Housing Costs | $429 | $153 |
| Real Estate Taxes | $1,294 | $111 |
Property Value by Mortgage Status in Dalton
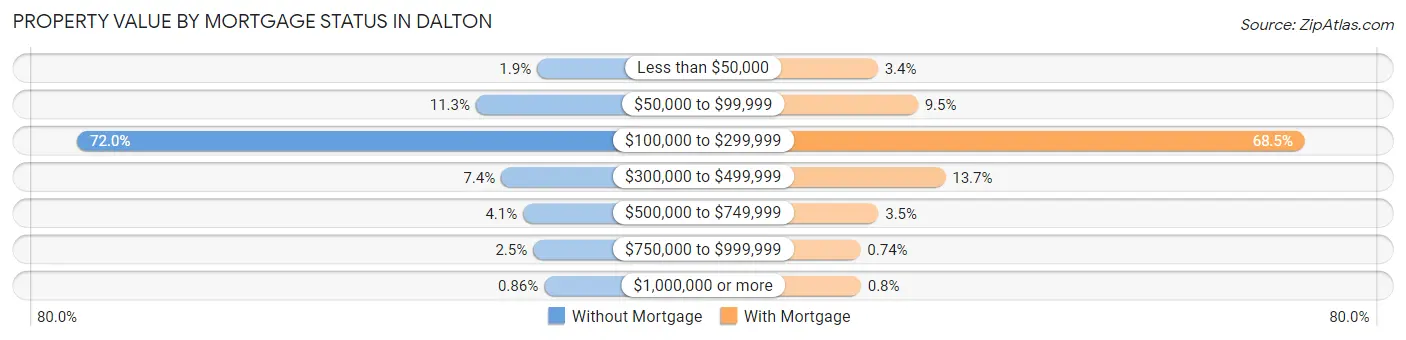
| Property Value | Without Mortgage | With Mortgage |
| Less than $50,000 | 58 (1.9%) | 114 (3.4%) |
| $50,000 to $99,999 | 339 (11.3%) | 319 (9.5%) |
| $100,000 to $299,999 | 2,170 (72.0%) | 2,306 (68.4%) |
| $300,000 to $499,999 | 223 (7.4%) | 461 (13.7%) |
| $500,000 to $749,999 | 122 (4.1%) | 117 (3.5%) |
| $750,000 to $999,999 | 76 (2.5%) | 25 (0.7%) |
| $1,000,000 or more | 26 (0.9%) | 27 (0.8%) |
| Total | 3,014 (100.0%) | 3,369 (100.0%) |
Household Income by Mortgage Status in Dalton
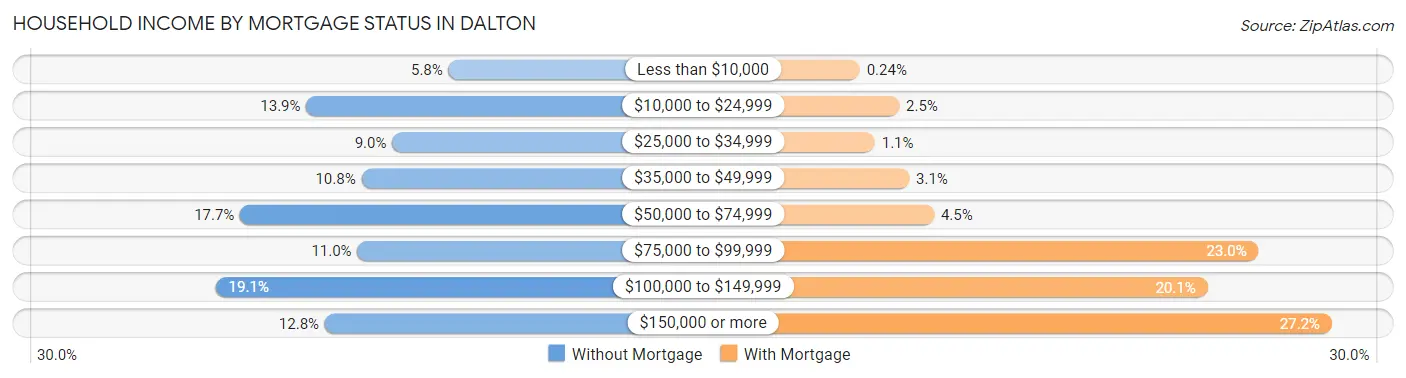
| Household Income | Without Mortgage | With Mortgage |
| Less than $10,000 | 174 (5.8%) | 8 (0.2%) |
| $10,000 to $24,999 | 419 (13.9%) | 84 (2.5%) |
| $25,000 to $34,999 | 271 (9.0%) | 37 (1.1%) |
| $35,000 to $49,999 | 324 (10.7%) | 103 (3.1%) |
| $50,000 to $74,999 | 533 (17.7%) | 151 (4.5%) |
| $75,000 to $99,999 | 331 (11.0%) | 776 (23.0%) |
| $100,000 to $149,999 | 575 (19.1%) | 678 (20.1%) |
| $150,000 or more | 387 (12.8%) | 917 (27.2%) |
| Total | 3,014 (100.0%) | 3,369 (100.0%) |
Property Value to Household Income Ratio in Dalton
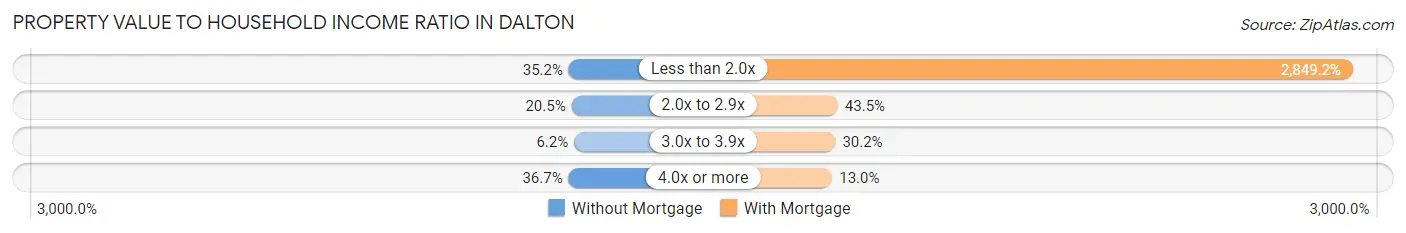
| Value-to-Income Ratio | Without Mortgage | With Mortgage |
| Less than 2.0x | 1,061 (35.2%) | 95,991 (2,849.2%) |
| 2.0x to 2.9x | 618 (20.5%) | 1,464 (43.5%) |
| 3.0x to 3.9x | 187 (6.2%) | 1,018 (30.2%) |
| 4.0x or more | 1,107 (36.7%) | 437 (13.0%) |
| Total | 3,014 (100.0%) | 3,369 (100.0%) |
Real Estate Taxes by Mortgage Status in Dalton
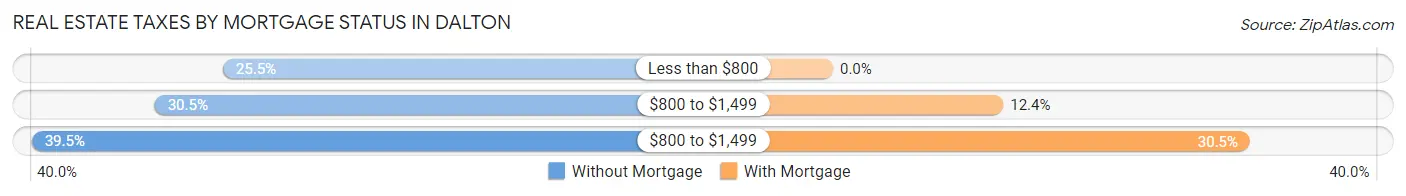
| Property Taxes | Without Mortgage | With Mortgage |
| Less than $800 | 769 (25.5%) | 0 (0.0%) |
| $800 to $1,499 | 919 (30.5%) | 419 (12.4%) |
| $800 to $1,499 | 1,190 (39.5%) | 1,026 (30.4%) |
| Total | 3,014 (100.0%) | 3,369 (100.0%) |
Health & Disability in Dalton
Health Insurance Coverage by Age in Dalton
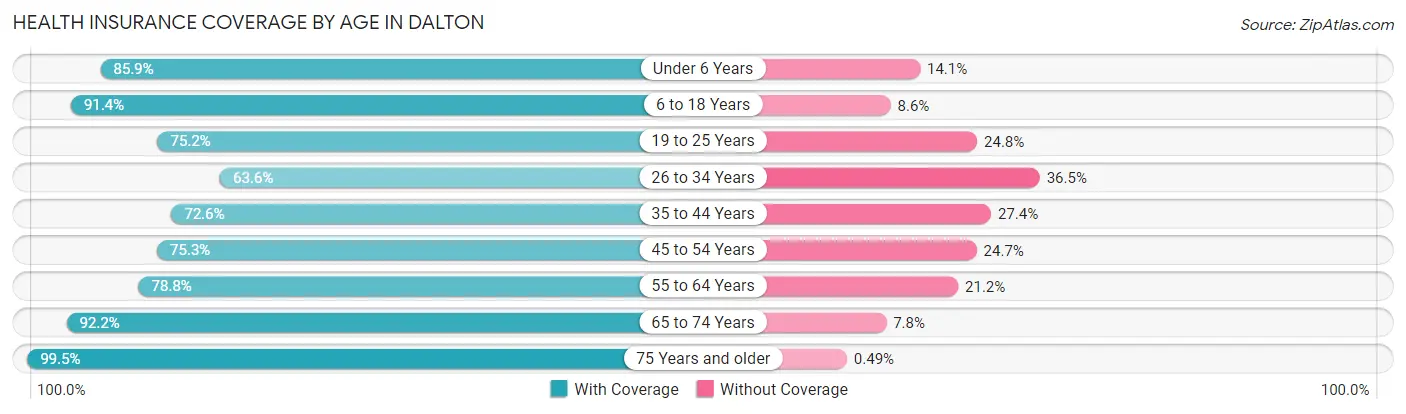
| Age Bracket | With Coverage | Without Coverage |
| Under 6 Years | 2,498 (85.9%) | 411 (14.1%) |
| 6 to 18 Years | 5,862 (91.4%) | 554 (8.6%) |
| 19 to 25 Years | 3,347 (75.2%) | 1,102 (24.8%) |
| 26 to 34 Years | 2,418 (63.5%) | 1,387 (36.4%) |
| 35 to 44 Years | 2,900 (72.6%) | 1,093 (27.4%) |
| 45 to 54 Years | 3,031 (75.3%) | 993 (24.7%) |
| 55 to 64 Years | 2,998 (78.8%) | 808 (21.2%) |
| 65 to 74 Years | 1,960 (92.2%) | 166 (7.8%) |
| 75 Years and older | 2,028 (99.5%) | 10 (0.5%) |
| Total | 27,042 (80.6%) | 6,524 (19.4%) |
Health Insurance Coverage by Citizenship Status in Dalton
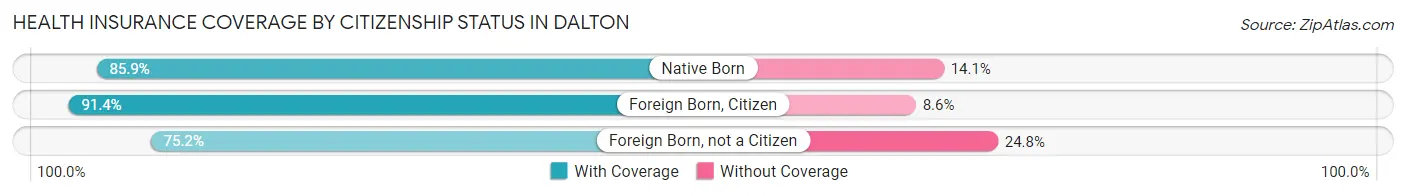
| Citizenship Status | With Coverage | Without Coverage |
| Native Born | 2,498 (85.9%) | 411 (14.1%) |
| Foreign Born, Citizen | 5,862 (91.4%) | 554 (8.6%) |
| Foreign Born, not a Citizen | 3,347 (75.2%) | 1,102 (24.8%) |
Health Insurance Coverage by Household Income in Dalton
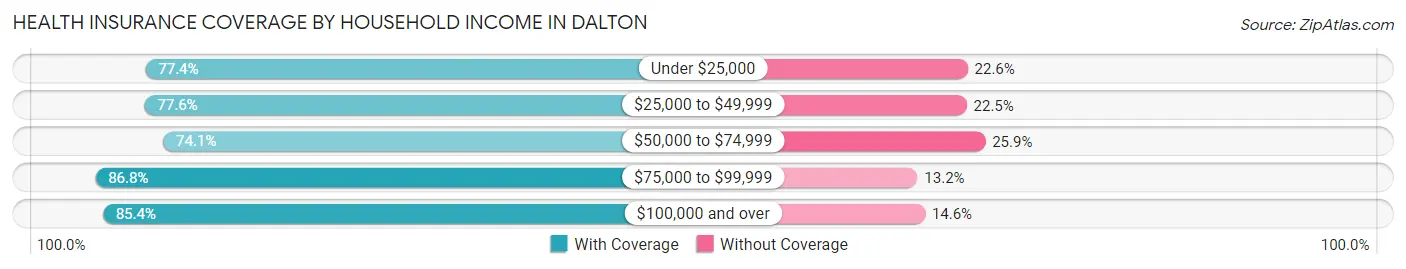
| Household Income | With Coverage | Without Coverage |
| Under $25,000 | 3,505 (77.4%) | 1,025 (22.6%) |
| $25,000 to $49,999 | 4,922 (77.5%) | 1,425 (22.5%) |
| $50,000 to $74,999 | 5,043 (74.1%) | 1,766 (25.9%) |
| $75,000 to $99,999 | 4,271 (86.8%) | 651 (13.2%) |
| $100,000 and over | 8,918 (85.4%) | 1,530 (14.6%) |
Public vs Private Health Insurance Coverage by Age in Dalton
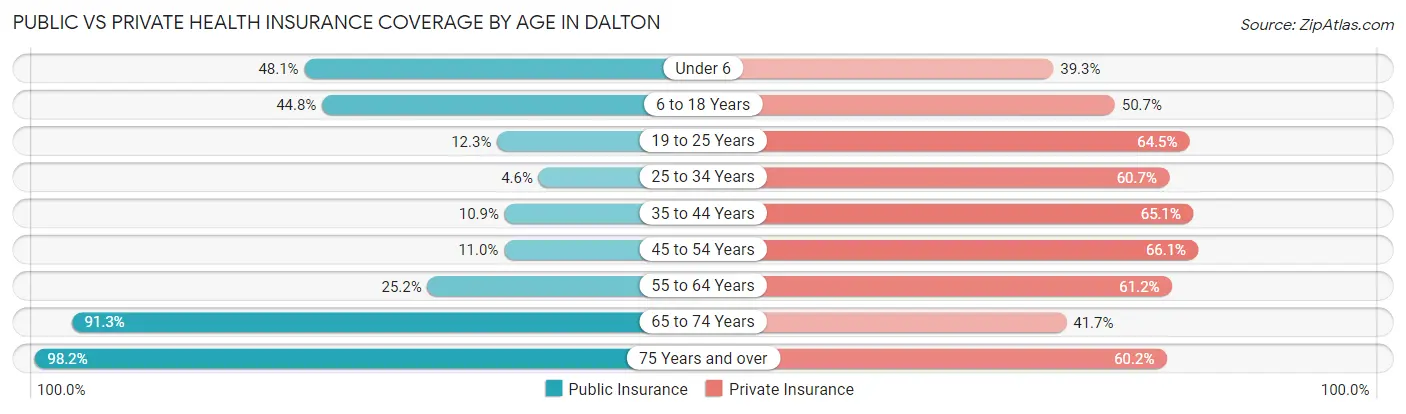
| Age Bracket | Public Insurance | Private Insurance |
| Under 6 | 1,398 (48.1%) | 1,142 (39.3%) |
| 6 to 18 Years | 2,872 (44.8%) | 3,251 (50.7%) |
| 19 to 25 Years | 546 (12.3%) | 2,870 (64.5%) |
| 25 to 34 Years | 173 (4.5%) | 2,309 (60.7%) |
| 35 to 44 Years | 434 (10.9%) | 2,601 (65.1%) |
| 45 to 54 Years | 442 (11.0%) | 2,660 (66.1%) |
| 55 to 64 Years | 959 (25.2%) | 2,328 (61.2%) |
| 65 to 74 Years | 1,941 (91.3%) | 886 (41.7%) |
| 75 Years and over | 2,001 (98.2%) | 1,227 (60.2%) |
| Total | 10,766 (32.1%) | 19,274 (57.4%) |
Disability Status by Sex by Age in Dalton
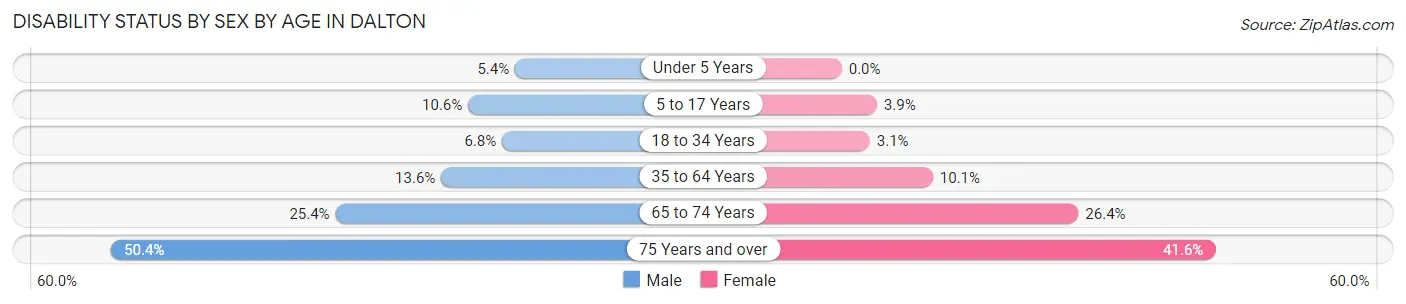
| Age Bracket | Male | Female |
| Under 5 Years | 59 (5.4%) | 0 (0.0%) |
| 5 to 17 Years | 354 (10.6%) | 122 (3.9%) |
| 18 to 34 Years | 308 (6.8%) | 131 (3.1%) |
| 35 to 64 Years | 789 (13.6%) | 611 (10.1%) |
| 65 to 74 Years | 267 (25.4%) | 283 (26.4%) |
| 75 Years and over | 422 (50.4%) | 499 (41.6%) |
Disability Class by Sex by Age in Dalton
Disability Class: Hearing Difficulty
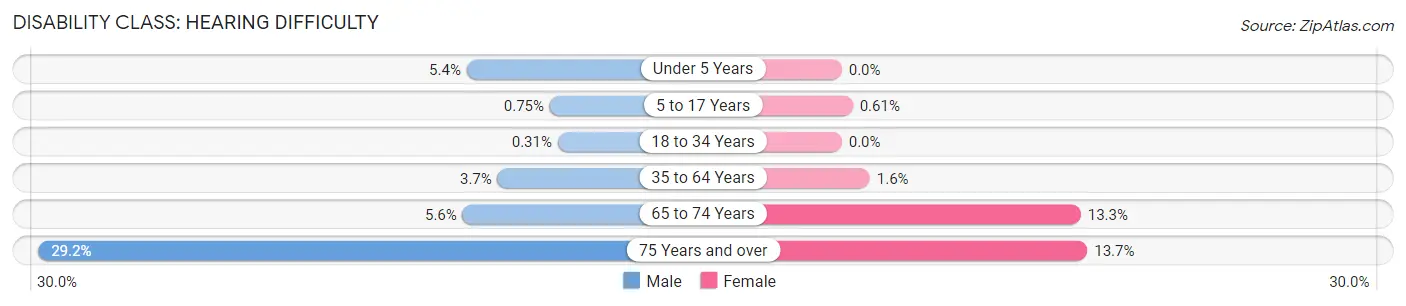
| Age Bracket | Male | Female |
| Under 5 Years | 59 (5.4%) | 0 (0.0%) |
| 5 to 17 Years | 25 (0.7%) | 19 (0.6%) |
| 18 to 34 Years | 14 (0.3%) | 0 (0.0%) |
| 35 to 64 Years | 212 (3.7%) | 94 (1.6%) |
| 65 to 74 Years | 59 (5.6%) | 143 (13.3%) |
| 75 Years and over | 245 (29.2%) | 164 (13.7%) |
Disability Class: Vision Difficulty
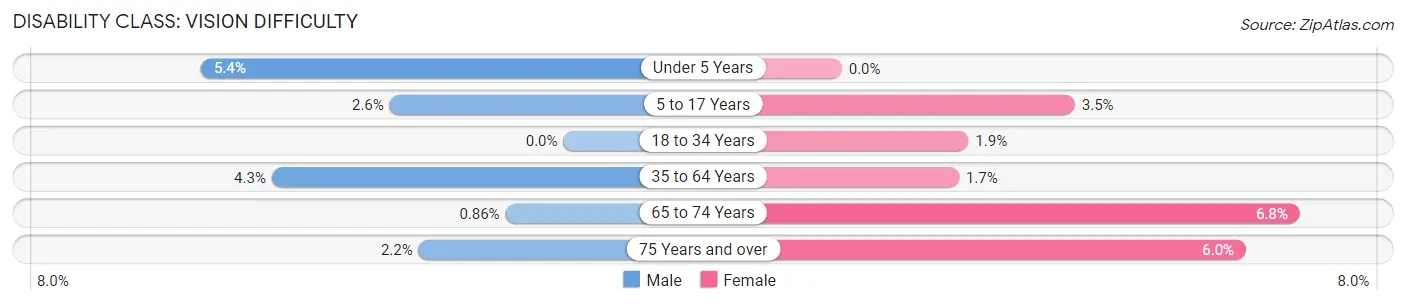
| Age Bracket | Male | Female |
| Under 5 Years | 59 (5.4%) | 0 (0.0%) |
| 5 to 17 Years | 86 (2.6%) | 108 (3.5%) |
| 18 to 34 Years | 0 (0.0%) | 79 (1.9%) |
| 35 to 64 Years | 251 (4.3%) | 105 (1.7%) |
| 65 to 74 Years | 9 (0.9%) | 73 (6.8%) |
| 75 Years and over | 18 (2.1%) | 72 (6.0%) |
Disability Class: Cognitive Difficulty
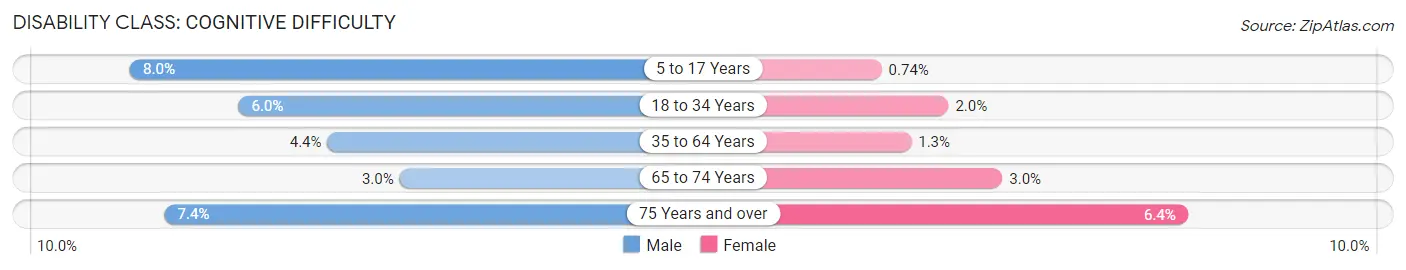
| Age Bracket | Male | Female |
| 5 to 17 Years | 268 (8.0%) | 23 (0.7%) |
| 18 to 34 Years | 272 (6.0%) | 83 (2.0%) |
| 35 to 64 Years | 254 (4.4%) | 78 (1.3%) |
| 65 to 74 Years | 32 (3.0%) | 32 (3.0%) |
| 75 Years and over | 62 (7.4%) | 77 (6.4%) |
Disability Class: Ambulatory Difficulty
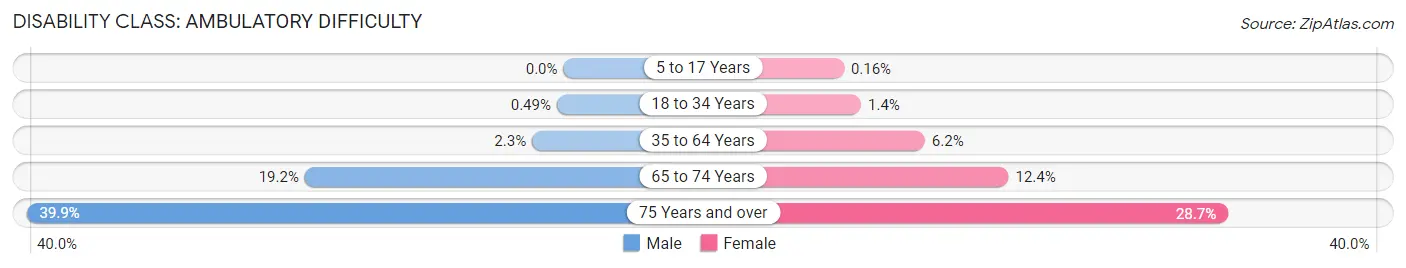
| Age Bracket | Male | Female |
| 5 to 17 Years | 0 (0.0%) | 5 (0.2%) |
| 18 to 34 Years | 22 (0.5%) | 60 (1.4%) |
| 35 to 64 Years | 135 (2.3%) | 372 (6.2%) |
| 65 to 74 Years | 202 (19.2%) | 133 (12.4%) |
| 75 Years and over | 334 (39.9%) | 344 (28.7%) |
Disability Class: Self-Care Difficulty
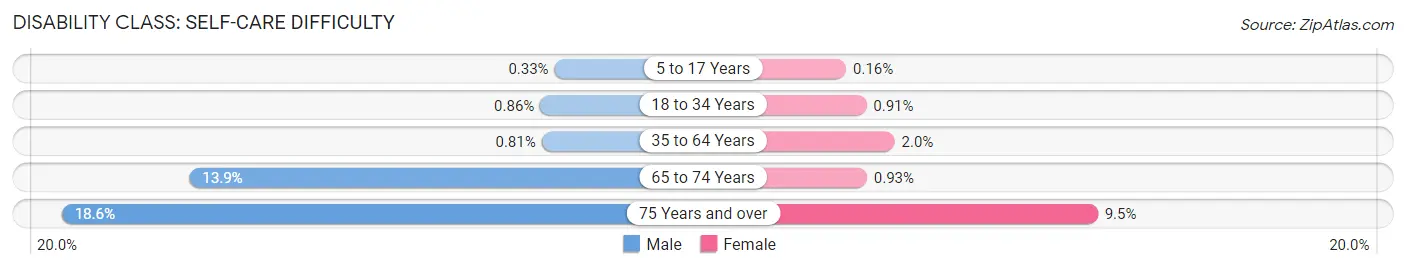
| Age Bracket | Male | Female |
| 5 to 17 Years | 11 (0.3%) | 5 (0.2%) |
| 18 to 34 Years | 39 (0.9%) | 38 (0.9%) |
| 35 to 64 Years | 47 (0.8%) | 118 (2.0%) |
| 65 to 74 Years | 146 (13.9%) | 10 (0.9%) |
| 75 Years and over | 156 (18.6%) | 114 (9.5%) |
Technology Access in Dalton
Computing Device Access in Dalton
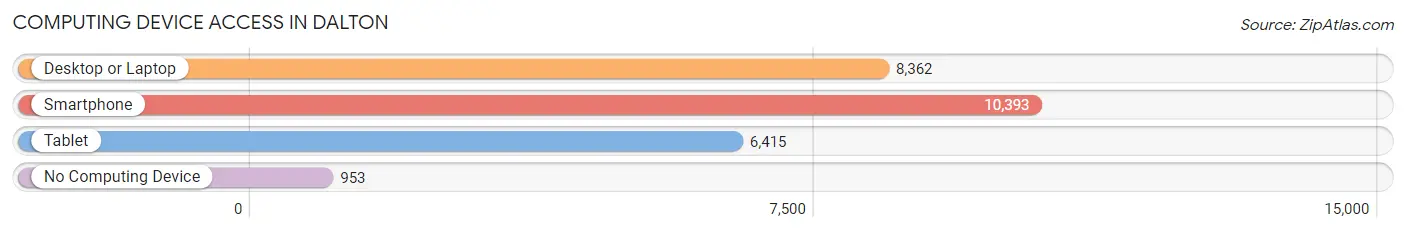
| Device Type | # Households | % Households |
| Desktop or Laptop | 8,362 | 69.9% |
| Smartphone | 10,393 | 86.9% |
| Tablet | 6,415 | 53.6% |
| No Computing Device | 953 | 8.0% |
| Total | 11,960 | 100.0% |
Internet Access in Dalton
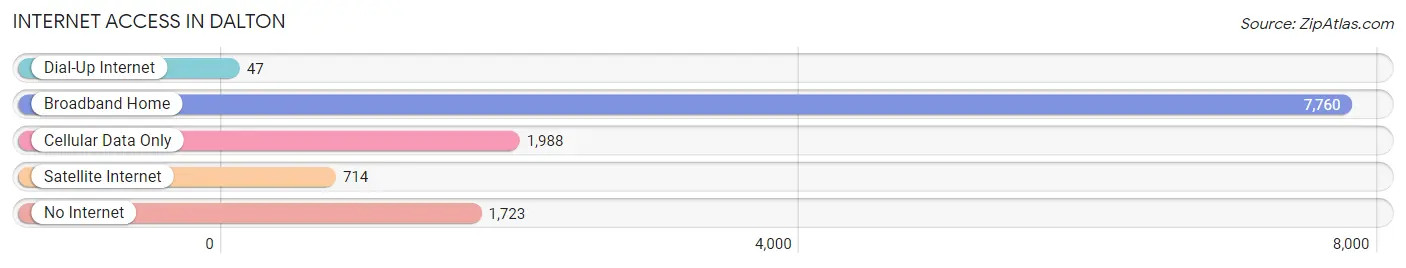
| Internet Type | # Households | % Households |
| Dial-Up Internet | 47 | 0.4% |
| Broadband Home | 7,760 | 64.9% |
| Cellular Data Only | 1,988 | 16.6% |
| Satellite Internet | 714 | 6.0% |
| No Internet | 1,723 | 14.4% |
| Total | 11,960 | 100.0% |
Dalton Summary
Dalton, Georgia is a city located in the northwestern corner of the state, in Whitfield County. It is the county seat and the largest city in the county. Dalton is part of the Chattanooga, TN-GA Metropolitan Statistical Area and is located just south of the Tennessee state line. The city has a population of 33,128 as of the 2010 census, making it the second largest city in northwest Georgia.
History
Dalton was founded in 1847 by settlers from the nearby town of Tunnel Hill. The city was named after the founder, Tristram Dalton, who was a prominent local politician. The city was incorporated in 1847 and quickly became a major center for the production of carpets and rugs. The city was also a major hub for the railroad industry, with several major railroads running through the city.
In the late 19th century, Dalton was a major center for the textile industry, with several large mills located in the city. The city was also home to several large carpet and rug manufacturers, including the Dalton Carpet Mills, which was the largest carpet mill in the world at the time.
Geography
Dalton is located in the northwestern corner of Georgia, in Whitfield County. The city is situated at the base of the Appalachian Mountains, and is surrounded by several mountain ranges, including the Cohutta Mountains, the Blue Ridge Mountains, and the Chattahoochee National Forest. The city is located at the intersection of Interstate 75 and U.S. Highway 41, and is approximately 80 miles north of Atlanta.
The city has a total area of 16.2 square miles, of which 16.1 square miles is land and 0.1 square miles is water. The city is located at an elevation of 845 feet above sea level.
Economy
Dalton is a major center for the carpet and rug industry, with several large carpet and rug manufacturers located in the city. The city is also home to several large textile mills, including the Dalton Carpet Mills, which is the largest carpet mill in the world.
The city is also home to several large distribution centers, including the Dalton Distribution Center, which is the largest distribution center in the world. The city is also home to several large manufacturing companies, including Shaw Industries, which is the largest carpet manufacturer in the world.
Demographics
As of the 2010 census, Dalton had a population of 33,128. The racial makeup of the city was 79.2% White, 15.3% African American, 0.4% Native American, 1.2% Asian, 0.1% Pacific Islander, 1.7% from other races, and 2.1% from two or more races. Hispanic or Latino of any race were 4.7% of the population.
The median income for a household in the city was $35,945, and the median income for a family was $45,945. The per capita income for the city was $20,945. About 15.3% of families and 19.2% of the population were below the poverty line, including 28.2% of those under age 18 and 11.2% of those age 65 or over.
Common Questions
What is the Total Population of Dalton?
Total Population of Dalton is 34,358.
What is the Total Male Population of Dalton?
Total Male Population of Dalton is 17,096.
What is the Total Female Population of Dalton?
Total Female Population of Dalton is 17,262.
What is the Ratio of Males per 100 Females in Dalton?
There are 99.04 Males per 100 Females in Dalton.
What is the Ratio of Females per 100 Males in Dalton?
There are 100.97 Females per 100 Males in Dalton.
What is the Median Population Age in Dalton?
Median Population Age in Dalton is 34.0 Years.
What is the Average Family Size in Dalton
Average Family Size in Dalton is 3.4 People.
What is the Average Household Size in Dalton
Average Household Size in Dalton is 2.8 People.
What is Per Capita Income in Dalton?
Per Capita income in Dalton is $29,899.
What is the Median Family Income in Dalton?
Median Family Income in Dalton is $69,030.
What is the Median Household income in Dalton?
Median Household Income in Dalton is $57,163.
What is Income or Wage Gap in Dalton?
Income or Wage Gap in Dalton is 19.4%.
Women in Dalton earn 80.6 cents for every dollar earned by a man.
What is Family Income Deficit in Dalton?
Family Income Deficit in Dalton is $11,614.
Families that are below poverty line in Dalton earn $11,614 less on average than the poverty threshold level.
What is Inequality or Gini Index in Dalton?
Inequality or Gini Index in Dalton is 0.47.
How Large is the Labor Force in Dalton?
There are 16,907 People in the Labor Forcein in Dalton.
What is the Percentage of People in the Labor Force in Dalton?
63.6% of People are in the Labor Force in Dalton.
What is the Unemployment Rate in Dalton?
Unemployment Rate in Dalton is 3.9%.