Fort Oglethorpe, GA
Fort Oglethorpe Map
Fort Oglethorpe Overview
10,203
TOTAL POPULATION
4,498
MALE POPULATION
5,705
FEMALE POPULATION
78.84
MALES / 100 FEMALES
126.83
FEMALES / 100 MALES
43.5
MEDIAN AGE
2.8
AVG FAMILY SIZE
2.1
AVG HOUSEHOLD SIZE
$29,970
PER CAPITA INCOME
$65,387
AVG FAMILY INCOME
$49,789
AVG HOUSEHOLD INCOME
14.8%
WAGE / INCOME GAP [ % ]
85.2¢/ $1
WAGE / INCOME GAP [ $ ]
0.39
INEQUALITY / GINI INDEX
4,715
LABOR FORCE [ PEOPLE ]
54.3%
PERCENT IN LABOR FORCE
5.9%
UNEMPLOYMENT RATE
Fort Oglethorpe Zip Codes
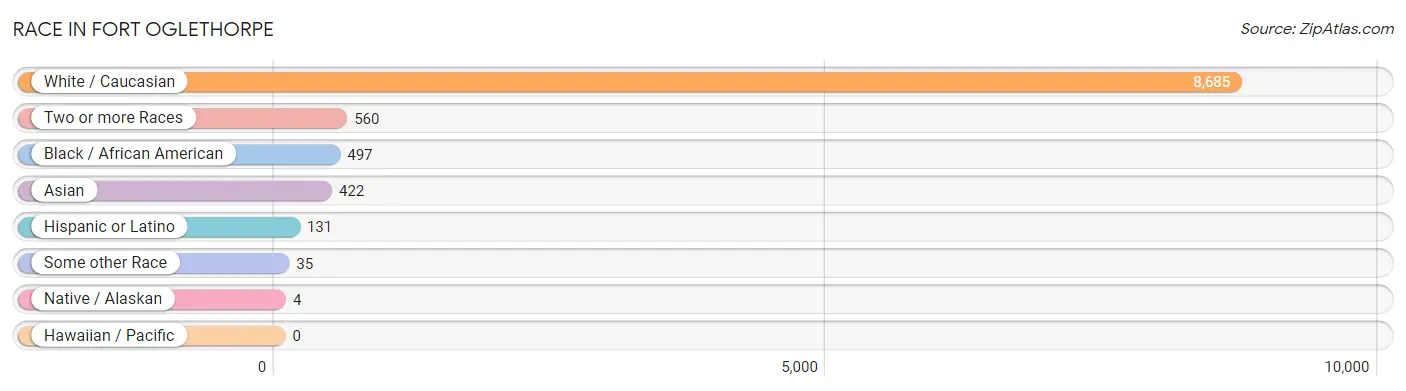
Race in Fort Oglethorpe
The most populous races in Fort Oglethorpe are White / Caucasian (8,685 | 85.1%), Two or more Races (560 | 5.5%), and Black / African American (497 | 4.9%).
| Race | # Population | % Population |
| Asian | 422 | 4.1% |
| Black / African American | 497 | 4.9% |
| Hawaiian / Pacific | 0 | 0.0% |
| Hispanic or Latino | 131 | 1.3% |
| Native / Alaskan | 4 | 0.0% |
| White / Caucasian | 8,685 | 85.1% |
| Two or more Races | 560 | 5.5% |
| Some other Race | 35 | 0.3% |
| Total | 10,203 | 100.0% |
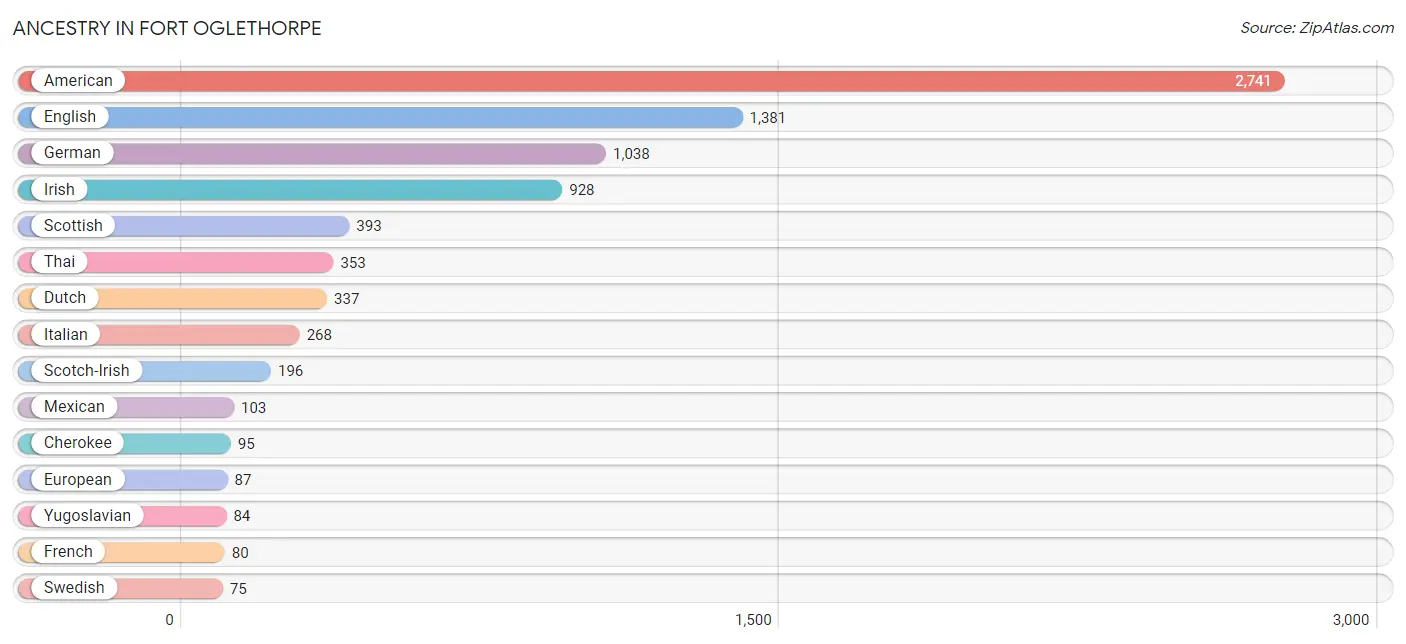
Ancestry in Fort Oglethorpe
The most populous ancestries reported in Fort Oglethorpe are American (2,741 | 26.9%), English (1,381 | 13.5%), German (1,038 | 10.2%), Irish (928 | 9.1%), and Scottish (393 | 3.8%), together accounting for 63.5% of all Fort Oglethorpe residents.
| Ancestry | # Population | % Population |
| African | 11 | 0.1% |
| American | 2,741 | 26.9% |
| British | 72 | 0.7% |
| Burmese | 33 | 0.3% |
| Cherokee | 95 | 0.9% |
| Dutch | 337 | 3.3% |
| English | 1,381 | 13.5% |
| European | 87 | 0.9% |
| French | 80 | 0.8% |
| French Canadian | 13 | 0.1% |
| German | 1,038 | 10.2% |
| Irish | 928 | 9.1% |
| Italian | 268 | 2.6% |
| Jamaican | 9 | 0.1% |
| Malaysian | 13 | 0.1% |
| Mexican | 103 | 1.0% |
| Northern European | 74 | 0.7% |
| Norwegian | 16 | 0.2% |
| Polish | 10 | 0.1% |
| Scotch-Irish | 196 | 1.9% |
| Scottish | 393 | 3.8% |
| Sri Lankan | 23 | 0.2% |
| Subsaharan African | 11 | 0.1% |
| Swedish | 75 | 0.7% |
| Thai | 353 | 3.5% |
| Welsh | 28 | 0.3% |
| Yugoslavian | 84 | 0.8% | View All 27 Rows |
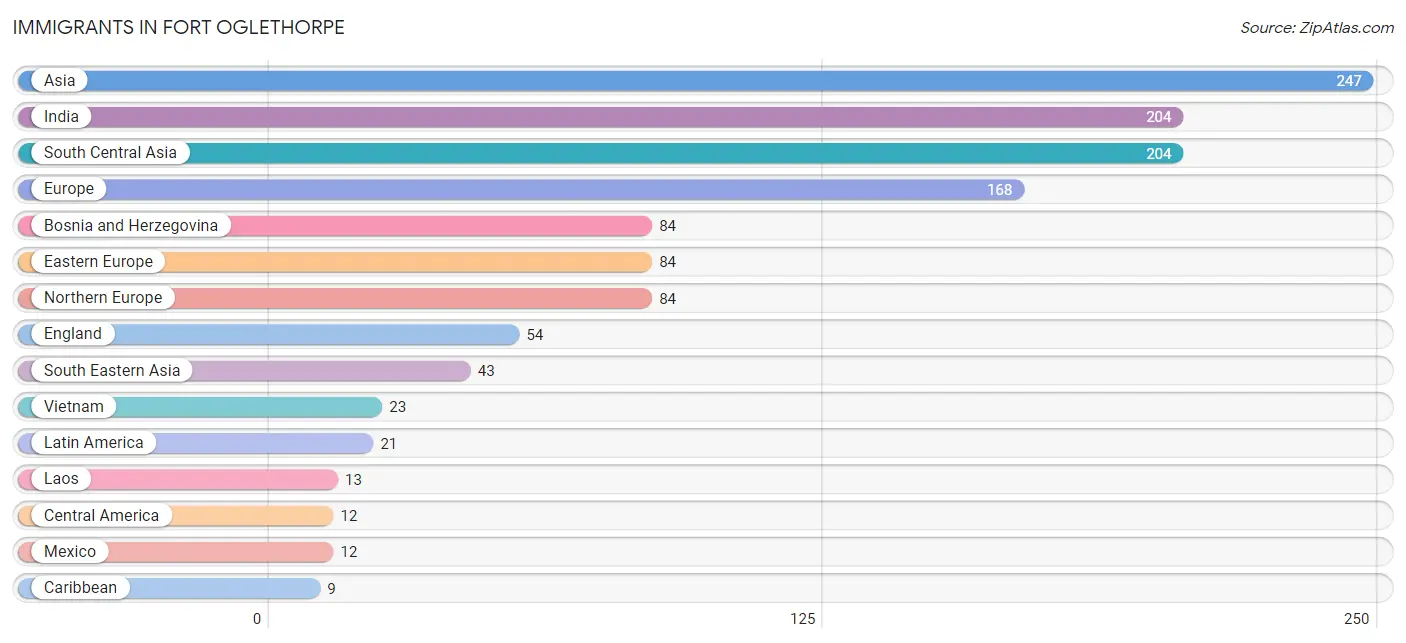
Immigrants in Fort Oglethorpe
The most numerous immigrant groups reported in Fort Oglethorpe came from Asia (247 | 2.4%), India (204 | 2.0%), South Central Asia (204 | 2.0%), Europe (168 | 1.7%), and Bosnia and Herzegovina (84 | 0.8%), together accounting for 8.9% of all Fort Oglethorpe residents.
| Immigration Origin | # Population | % Population |
| Asia | 247 | 2.4% |
| Bosnia and Herzegovina | 84 | 0.8% |
| Caribbean | 9 | 0.1% |
| Central America | 12 | 0.1% |
| Eastern Europe | 84 | 0.8% |
| England | 54 | 0.5% |
| Europe | 168 | 1.7% |
| India | 204 | 2.0% |
| Jamaica | 9 | 0.1% |
| Laos | 13 | 0.1% |
| Latin America | 21 | 0.2% |
| Mexico | 12 | 0.1% |
| Northern Europe | 84 | 0.8% |
| Philippines | 7 | 0.1% |
| South Central Asia | 204 | 2.0% |
| South Eastern Asia | 43 | 0.4% |
| Vietnam | 23 | 0.2% | View All 17 Rows |
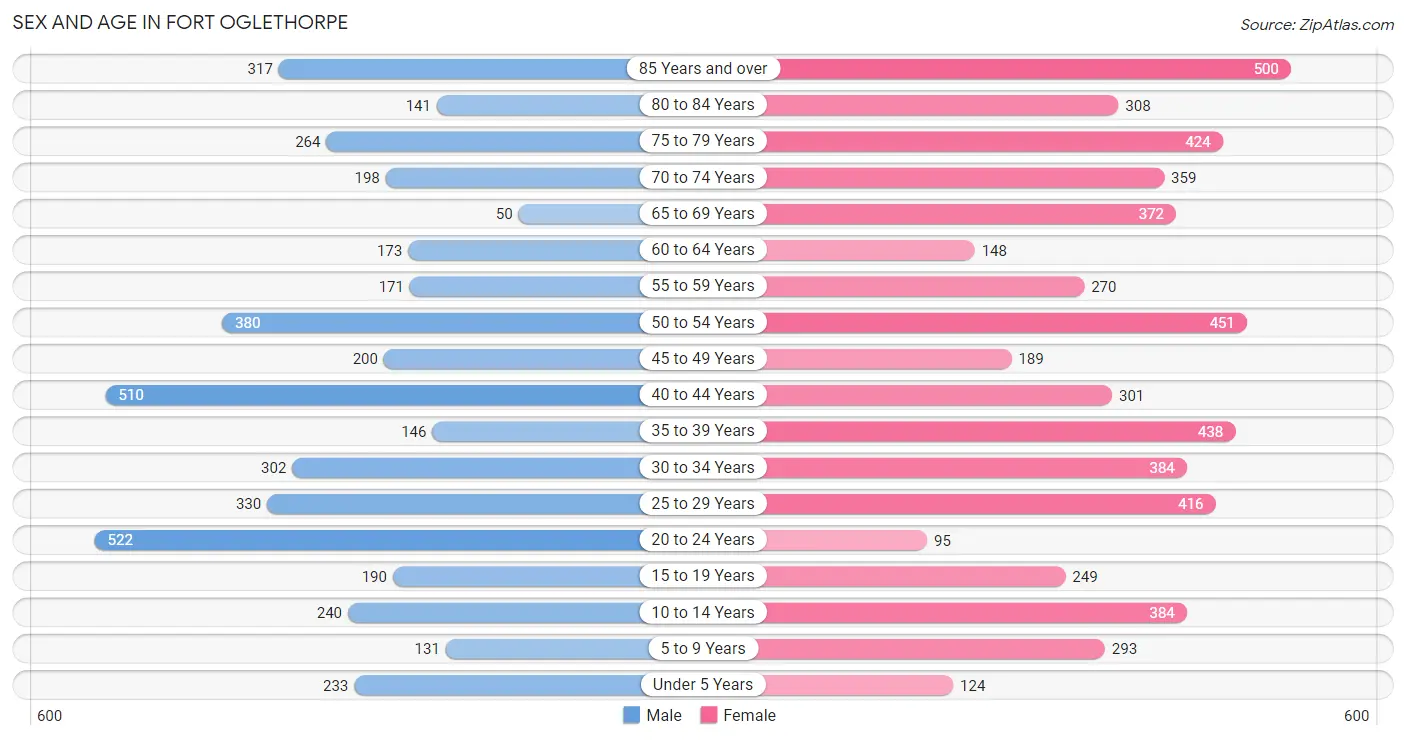
Sex and Age in Fort Oglethorpe
Sex and Age in Fort Oglethorpe
The most populous age groups in Fort Oglethorpe are 20 to 24 Years (522 | 11.6%) for men and 85 Years and over (500 | 8.8%) for women.
| Age Bracket | Male | Female |
| Under 5 Years | 233 (5.2%) | 124 (2.2%) |
| 5 to 9 Years | 131 (2.9%) | 293 (5.1%) |
| 10 to 14 Years | 240 (5.3%) | 384 (6.7%) |
| 15 to 19 Years | 190 (4.2%) | 249 (4.4%) |
| 20 to 24 Years | 522 (11.6%) | 95 (1.7%) |
| 25 to 29 Years | 330 (7.3%) | 416 (7.3%) |
| 30 to 34 Years | 302 (6.7%) | 384 (6.7%) |
| 35 to 39 Years | 146 (3.3%) | 438 (7.7%) |
| 40 to 44 Years | 510 (11.3%) | 301 (5.3%) |
| 45 to 49 Years | 200 (4.4%) | 189 (3.3%) |
| 50 to 54 Years | 380 (8.5%) | 451 (7.9%) |
| 55 to 59 Years | 171 (3.8%) | 270 (4.7%) |
| 60 to 64 Years | 173 (3.8%) | 148 (2.6%) |
| 65 to 69 Years | 50 (1.1%) | 372 (6.5%) |
| 70 to 74 Years | 198 (4.4%) | 359 (6.3%) |
| 75 to 79 Years | 264 (5.9%) | 424 (7.4%) |
| 80 to 84 Years | 141 (3.1%) | 308 (5.4%) |
| 85 Years and over | 317 (7.0%) | 500 (8.8%) |
| Total | 4,498 (100.0%) | 5,705 (100.0%) |
Families and Households in Fort Oglethorpe
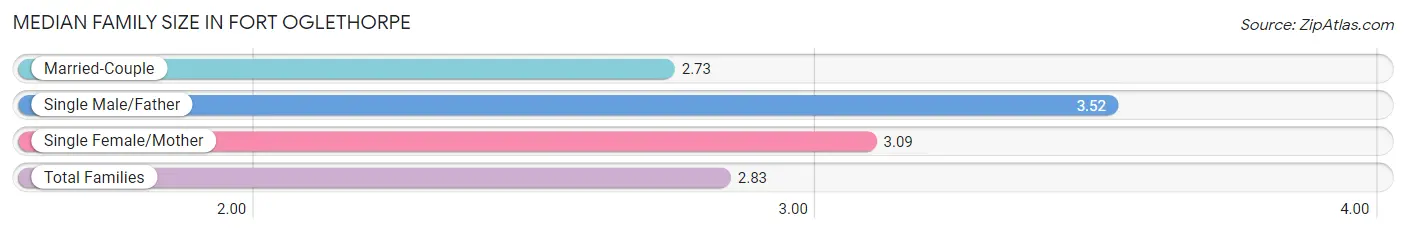
Median Family Size in Fort Oglethorpe
The median family size in Fort Oglethorpe is 2.83 persons per family, with single male/father families (94 | 3.8%) accounting for the largest median family size of 3.52 persons per family. On the other hand, married-couple families (1,881 | 76.0%) represent the smallest median family size with 2.73 persons per family.
| Family Type | # Families | Family Size |
| Married-Couple | 1,881 (76.0%) | 2.73 |
| Single Male/Father | 94 (3.8%) | 3.52 |
| Single Female/Mother | 500 (20.2%) | 3.09 |
| Total Families | 2,475 (100.0%) | 2.83 |
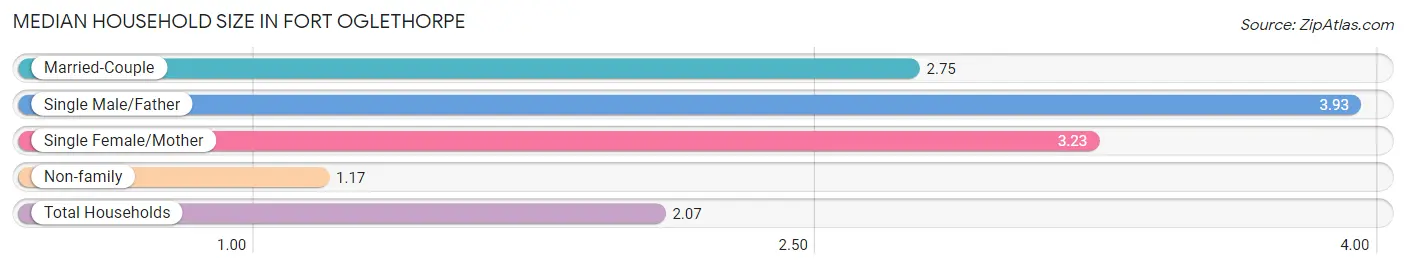
Median Household Size in Fort Oglethorpe
The median household size in Fort Oglethorpe is 2.07 persons per household, with single male/father households (94 | 2.0%) accounting for the largest median household size of 3.93 persons per household. non-family households (2,276 | 47.9%) represent the smallest median household size with 1.17 persons per household.
| Household Type | # Households | Household Size |
| Married-Couple | 1,881 (39.6%) | 2.75 |
| Single Male/Father | 94 (2.0%) | 3.93 |
| Single Female/Mother | 500 (10.5%) | 3.23 |
| Non-family | 2,276 (47.9%) | 1.17 |
| Total Households | 4,751 (100.0%) | 2.07 |
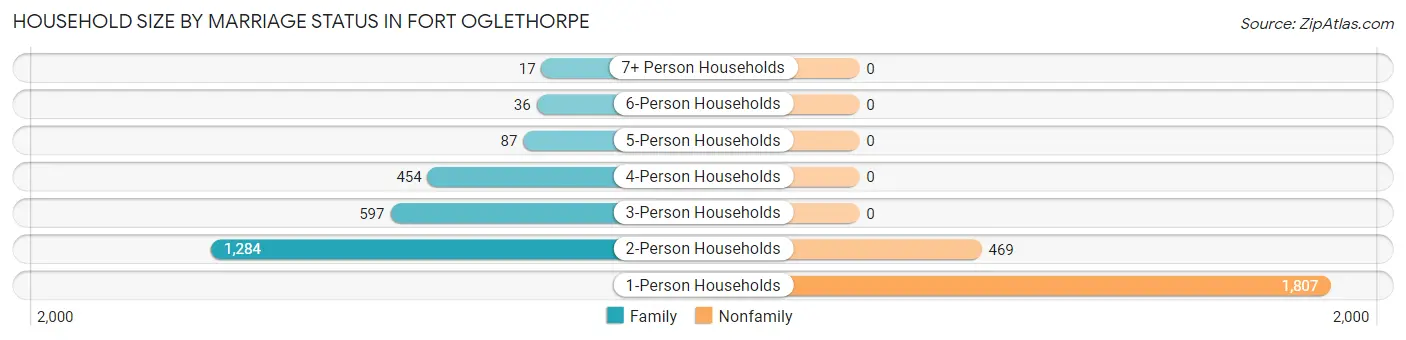
Household Size by Marriage Status in Fort Oglethorpe
Out of a total of 4,751 households in Fort Oglethorpe, 2,475 (52.1%) are family households, while 2,276 (47.9%) are nonfamily households. The most numerous type of family households are 2-person households, comprising 1,284, and the most common type of nonfamily households are 1-person households, comprising 1,807.
| Household Size | Family Households | Nonfamily Households |
| 1-Person Households | - | 1,807 (38.0%) |
| 2-Person Households | 1,284 (27.0%) | 469 (9.9%) |
| 3-Person Households | 597 (12.6%) | 0 (0.0%) |
| 4-Person Households | 454 (9.6%) | 0 (0.0%) |
| 5-Person Households | 87 (1.8%) | 0 (0.0%) |
| 6-Person Households | 36 (0.8%) | 0 (0.0%) |
| 7+ Person Households | 17 (0.4%) | 0 (0.0%) |
| Total | 2,475 (52.1%) | 2,276 (47.9%) |
Female Fertility in Fort Oglethorpe
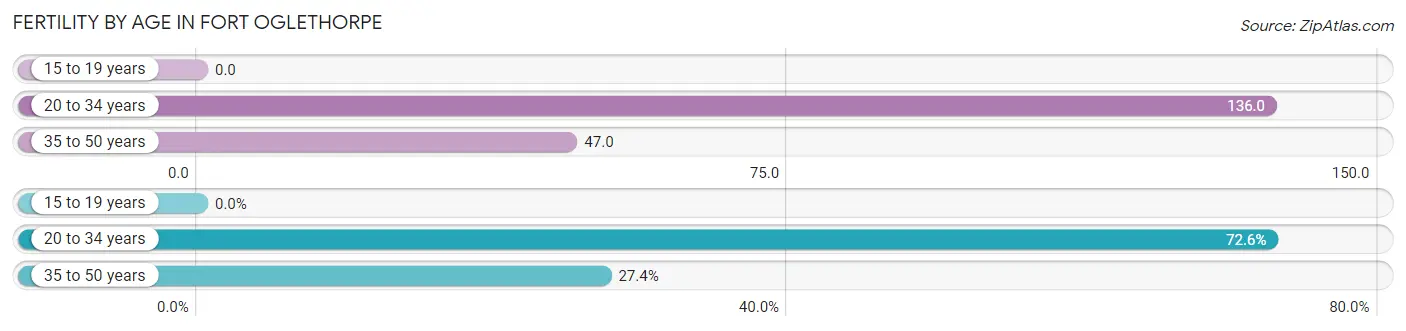
Fertility by Age in Fort Oglethorpe
Average fertility rate in Fort Oglethorpe is 79.0 births per 1,000 women. Women in the age bracket of 20 to 34 years have the highest fertility rate with 136.0 births per 1,000 women. Women in the age bracket of 20 to 34 years acount for 72.6% of all women with births.
| Age Bracket | Women with Births | Births / 1,000 Women |
| 15 to 19 years | 0 (0.0%) | 0.0 |
| 20 to 34 years | 122 (72.6%) | 136.0 |
| 35 to 50 years | 46 (27.4%) | 47.0 |
| Total | 168 (100.0%) | 79.0 |
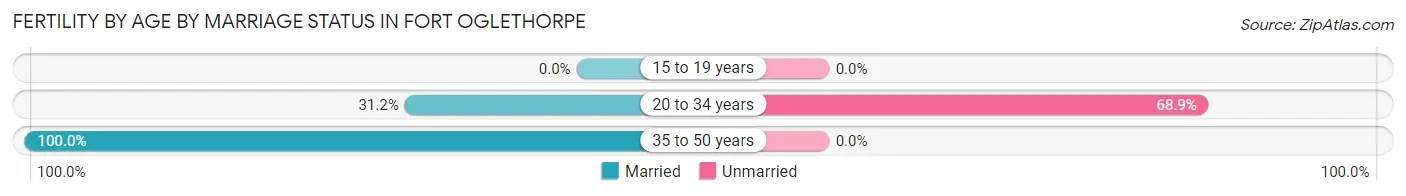
Fertility by Age by Marriage Status in Fort Oglethorpe
50.0% of women with births (168) in Fort Oglethorpe are married. The highest percentage of unmarried women with births falls into 20 to 34 years age bracket with 68.9% of them unmarried at the time of birth, while the lowest percentage of unmarried women with births belong to 35 to 50 years age bracket with 0.0% of them unmarried.
| Age Bracket | Married | Unmarried |
| 15 to 19 years | 0 (0.0%) | 0 (0.0%) |
| 20 to 34 years | 38 (31.1%) | 84 (68.9%) |
| 35 to 50 years | 46 (100.0%) | 0 (0.0%) |
| Total | 84 (50.0%) | 84 (50.0%) |
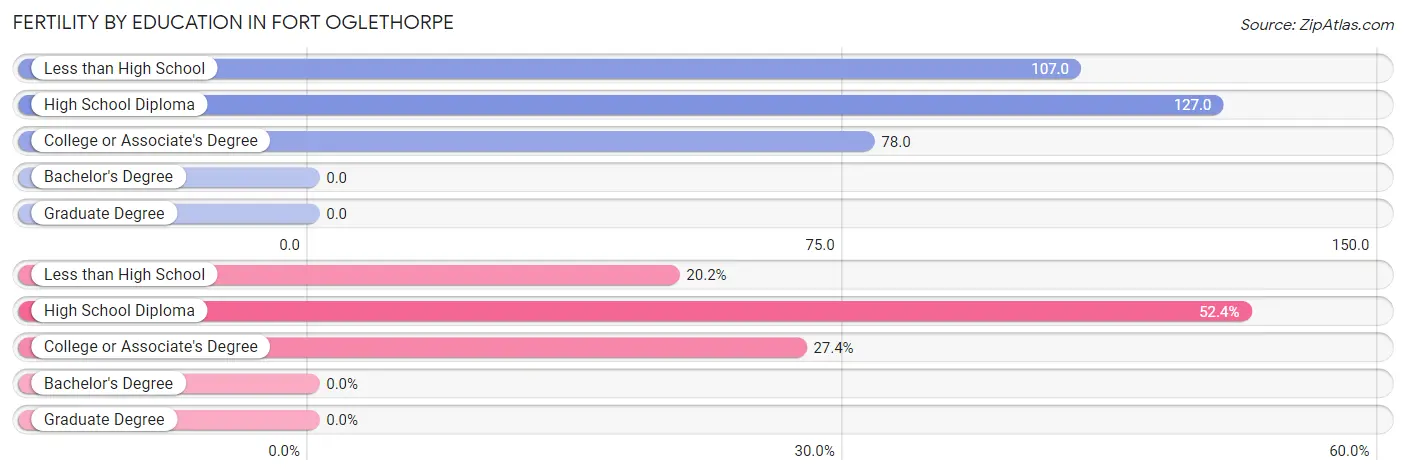
Fertility by Education in Fort Oglethorpe
| Educational Attainment | Women with Births | Births / 1,000 Women |
| Less than High School | 34 (20.2%) | 107.0 |
| High School Diploma | 88 (52.4%) | 127.0 |
| College or Associate's Degree | 46 (27.4%) | 78.0 |
| Bachelor's Degree | 0 (0.0%) | 0.0 |
| Graduate Degree | 0 (0.0%) | 0.0 |
| Total | 168 (100.0%) | 79.0 |
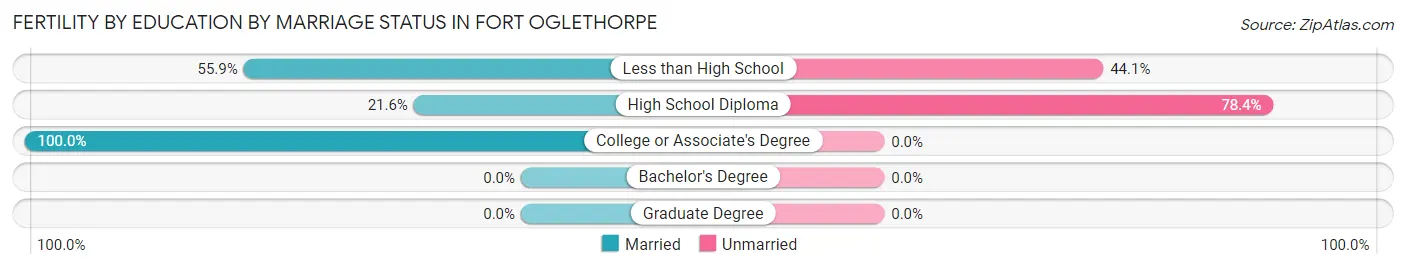
Fertility by Education by Marriage Status in Fort Oglethorpe
50.0% of women with births in Fort Oglethorpe are unmarried. Women with the educational attainment of college or associate's degree are most likely to be married with 100.0% of them married at childbirth, while women with the educational attainment of high school diploma are least likely to be married with 78.4% of them unmarried at childbirth.
| Educational Attainment | Married | Unmarried |
| Less than High School | 19 (55.9%) | 15 (44.1%) |
| High School Diploma | 19 (21.6%) | 69 (78.4%) |
| College or Associate's Degree | 46 (100.0%) | 0 (0.0%) |
| Bachelor's Degree | 0 (0.0%) | 0 (0.0%) |
| Graduate Degree | 0 (0.0%) | 0 (0.0%) |
| Total | 84 (50.0%) | 84 (50.0%) |
Income in Fort Oglethorpe
Income Overview in Fort Oglethorpe
Per Capita Income in Fort Oglethorpe is $29,970, while median incomes of families and households are $65,387 and $49,789 respectively.
| Characteristic | Number | Measure |
| Per Capita Income | 10,203 | $29,970 |
| Median Family Income | 2,475 | $65,387 |
| Mean Family Income | 2,475 | $76,265 |
| Median Household Income | 4,751 | $49,789 |
| Mean Household Income | 4,751 | $62,306 |
| Income Deficit | 2,475 | $0 |
| Wage / Income Gap (%) | 10,203 | 14.80% |
| Wage / Income Gap ($) | 10,203 | 85.20¢ per $1 |
| Gini / Inequality Index | 10,203 | 0.39 |
Earnings by Sex in Fort Oglethorpe
Average Earnings in Fort Oglethorpe are $40,046, $41,987 for men and $35,771 for women, a difference of 14.8%.
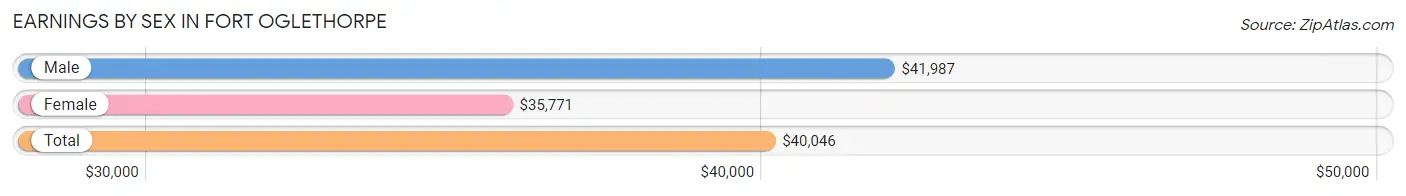
| Sex | Number | Average Earnings |
| Male | 2,593 (52.2%) | $41,987 |
| Female | 2,375 (47.8%) | $35,771 |
| Total | 4,968 (100.0%) | $40,046 |
Earnings by Sex by Income Bracket in Fort Oglethorpe
The most common earnings brackets in Fort Oglethorpe are $40,000 to $44,999 for men (296 | 11.4%) and $40,000 to $44,999 for women (279 | 11.7%).
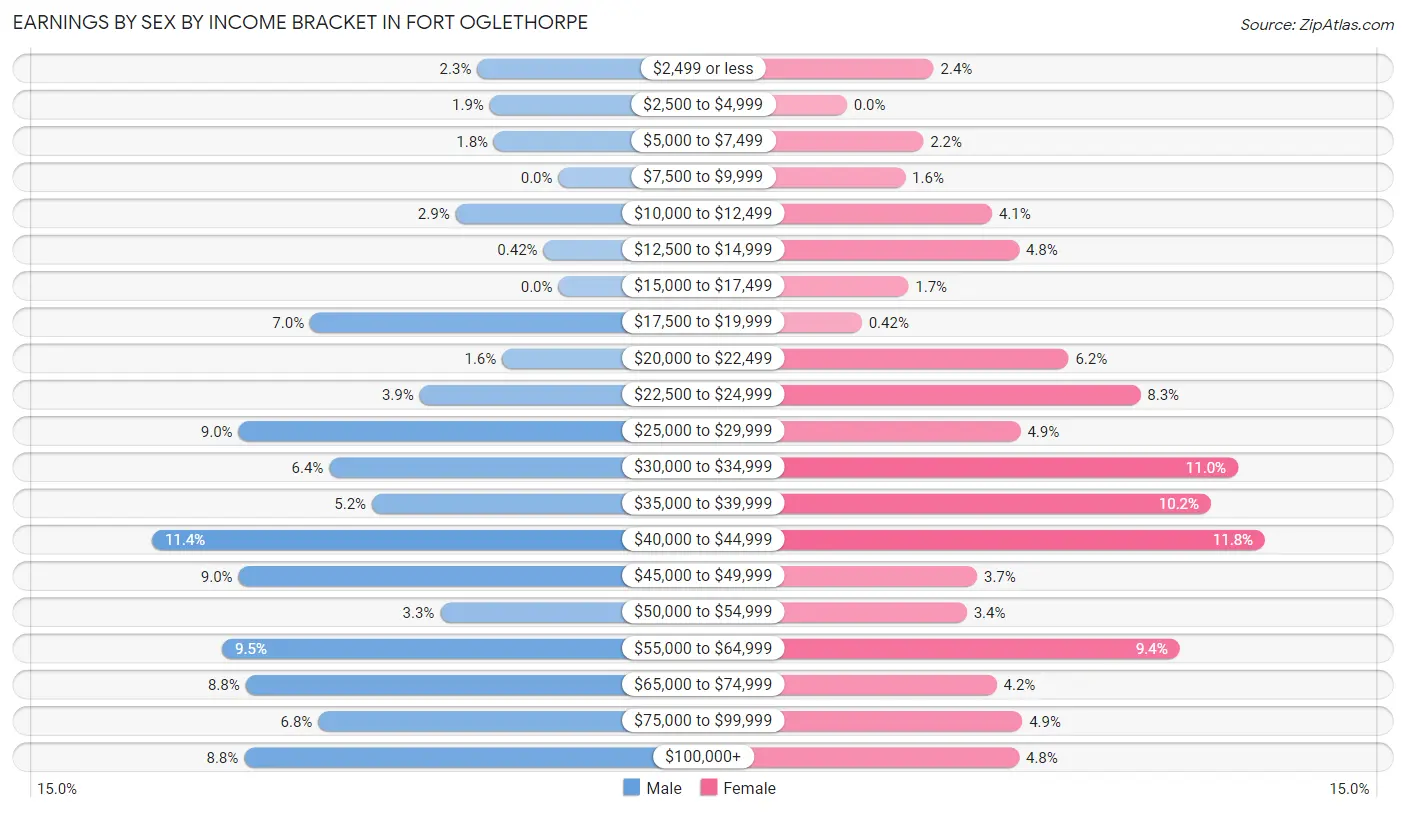
| Income | Male | Female |
| $2,499 or less | 59 (2.3%) | 58 (2.4%) |
| $2,500 to $4,999 | 50 (1.9%) | 0 (0.0%) |
| $5,000 to $7,499 | 47 (1.8%) | 51 (2.1%) |
| $7,500 to $9,999 | 0 (0.0%) | 39 (1.6%) |
| $10,000 to $12,499 | 75 (2.9%) | 97 (4.1%) |
| $12,500 to $14,999 | 11 (0.4%) | 115 (4.8%) |
| $15,000 to $17,499 | 0 (0.0%) | 41 (1.7%) |
| $17,500 to $19,999 | 181 (7.0%) | 10 (0.4%) |
| $20,000 to $22,499 | 41 (1.6%) | 148 (6.2%) |
| $22,500 to $24,999 | 101 (3.9%) | 196 (8.3%) |
| $25,000 to $29,999 | 233 (9.0%) | 116 (4.9%) |
| $30,000 to $34,999 | 167 (6.4%) | 261 (11.0%) |
| $35,000 to $39,999 | 136 (5.2%) | 243 (10.2%) |
| $40,000 to $44,999 | 296 (11.4%) | 279 (11.7%) |
| $45,000 to $49,999 | 233 (9.0%) | 87 (3.7%) |
| $50,000 to $54,999 | 86 (3.3%) | 80 (3.4%) |
| $55,000 to $64,999 | 245 (9.5%) | 222 (9.3%) |
| $65,000 to $74,999 | 228 (8.8%) | 100 (4.2%) |
| $75,000 to $99,999 | 175 (6.8%) | 117 (4.9%) |
| $100,000+ | 229 (8.8%) | 115 (4.8%) |
| Total | 2,593 (100.0%) | 2,375 (100.0%) |
Earnings by Sex by Educational Attainment in Fort Oglethorpe
Average earnings in Fort Oglethorpe are $47,033 for men and $36,410 for women, a difference of 22.6%. Men with an educational attainment of graduate degree enjoy the highest average annual earnings of $94,698, while those with bachelor's degree education earn the least with $42,476. Women with an educational attainment of graduate degree earn the most with the average annual earnings of $59,643, while those with less than high school education have the smallest earnings of $13,140.
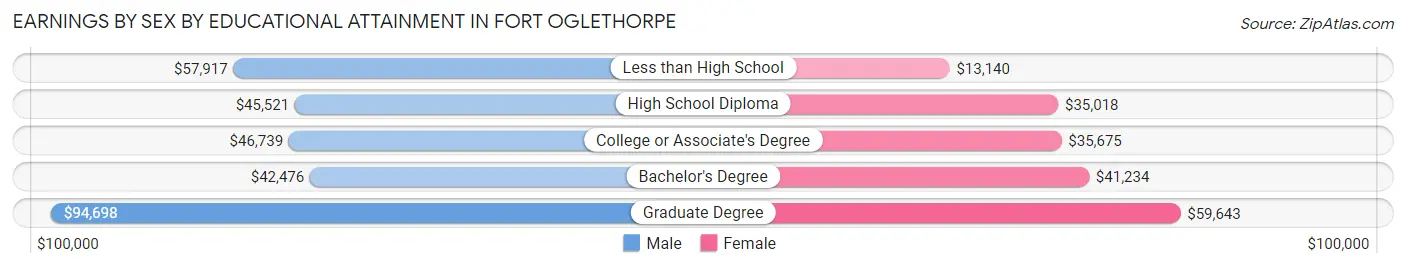
| Educational Attainment | Male Income | Female Income |
| Less than High School | $57,917 | $13,140 |
| High School Diploma | $45,521 | $35,018 |
| College or Associate's Degree | $46,739 | $35,675 |
| Bachelor's Degree | $42,476 | $41,234 |
| Graduate Degree | $94,698 | $59,643 |
| Total | $47,033 | $36,410 |
Family Income in Fort Oglethorpe
Family Income Brackets in Fort Oglethorpe
According to the Fort Oglethorpe family income data, there are 621 families falling into the $35,000 to $49,999 income range, which is the most common income bracket and makes up 25.1% of all families. Conversely, the $10,000 to $14,999 income bracket is the least frequent group with only 17 families (0.7%) belonging to this category.
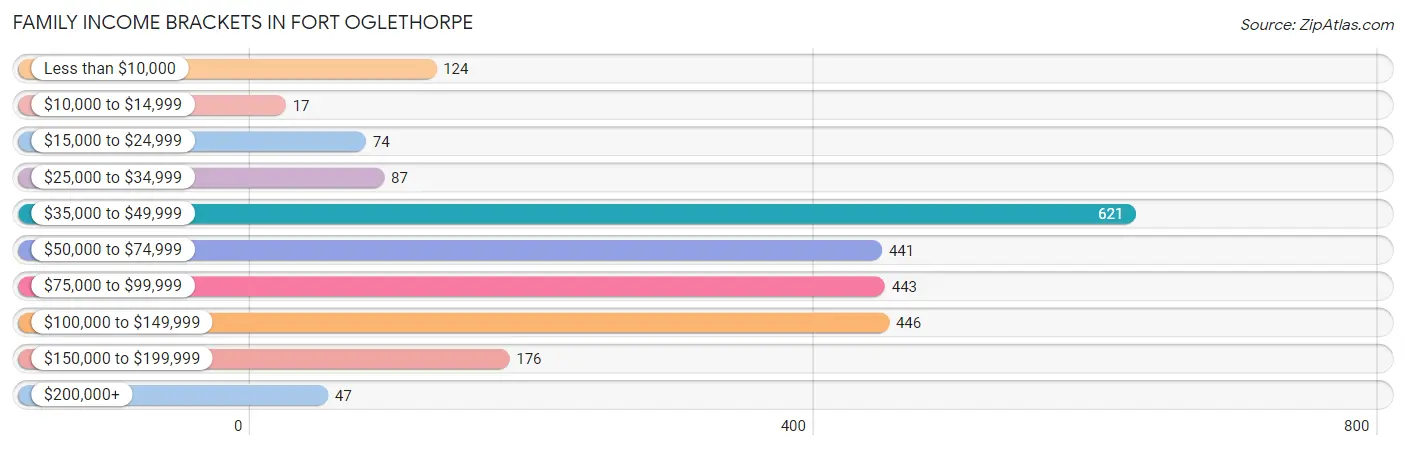
| Income Bracket | # Families | % Families |
| Less than $10,000 | 124 | 5.0% |
| $10,000 to $14,999 | 17 | 0.7% |
| $15,000 to $24,999 | 74 | 3.0% |
| $25,000 to $34,999 | 87 | 3.5% |
| $35,000 to $49,999 | 621 | 25.1% |
| $50,000 to $74,999 | 441 | 17.8% |
| $75,000 to $99,999 | 443 | 17.9% |
| $100,000 to $149,999 | 446 | 18.0% |
| $150,000 to $199,999 | 176 | 7.1% |
| $200,000+ | 47 | 1.9% |
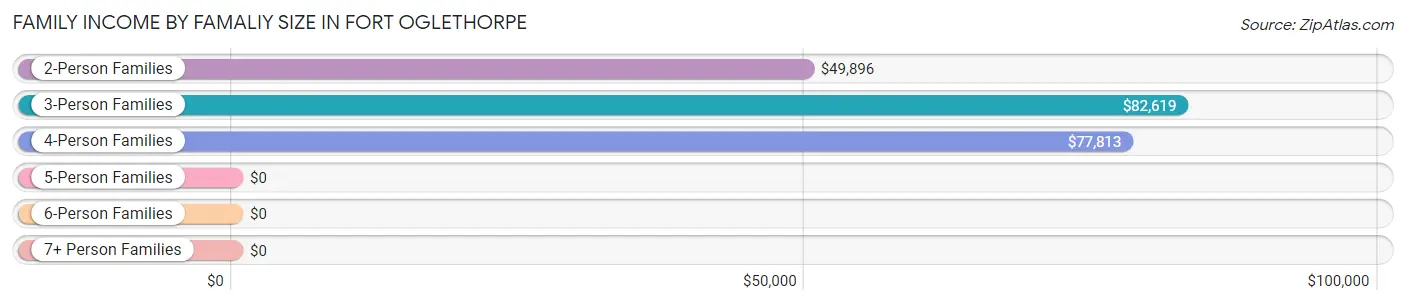
Family Income by Famaliy Size in Fort Oglethorpe
3-person families (620 | 25.1%) account for the highest median family income in Fort Oglethorpe with $82,619 per family, while 3-person families (620 | 25.1%) have the highest median income of $27,540 per family member.
| Income Bracket | # Families | Median Income |
| 2-Person Families | 1,284 (51.9%) | $49,896 |
| 3-Person Families | 620 (25.1%) | $82,619 |
| 4-Person Families | 473 (19.1%) | $77,813 |
| 5-Person Families | 62 (2.5%) | $0 |
| 6-Person Families | 19 (0.8%) | $0 |
| 7+ Person Families | 17 (0.7%) | $0 |
| Total | 2,475 (100.0%) | $65,387 |
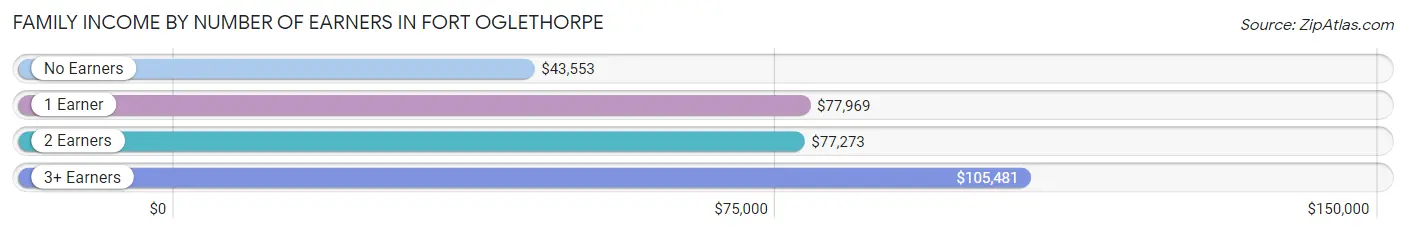
Family Income by Number of Earners in Fort Oglethorpe
The median family income in Fort Oglethorpe is $65,387, with families comprising 3+ earners (216) having the highest median family income of $105,481, while families with no earners (713) have the lowest median family income of $43,553, accounting for 8.7% and 28.8% of families, respectively.
| Number of Earners | # Families | Median Income |
| No Earners | 713 (28.8%) | $43,553 |
| 1 Earner | 702 (28.4%) | $77,969 |
| 2 Earners | 844 (34.1%) | $77,273 |
| 3+ Earners | 216 (8.7%) | $105,481 |
| Total | 2,475 (100.0%) | $65,387 |
Household Income in Fort Oglethorpe
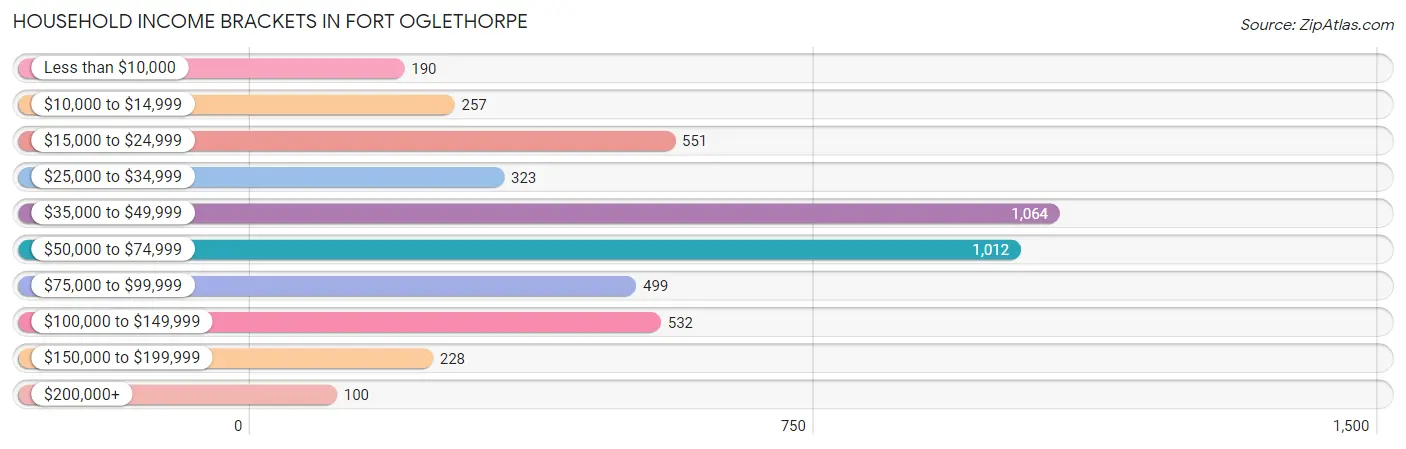
Household Income Brackets in Fort Oglethorpe
With 1,064 households falling in the category, the $35,000 to $49,999 income range is the most frequent in Fort Oglethorpe, accounting for 22.4% of all households. In contrast, only 100 households (2.1%) fall into the $200,000+ income bracket, making it the least populous group.
| Income Bracket | # Households | % Households |
| Less than $10,000 | 190 | 4.0% |
| $10,000 to $14,999 | 257 | 5.4% |
| $15,000 to $24,999 | 551 | 11.6% |
| $25,000 to $34,999 | 323 | 6.8% |
| $35,000 to $49,999 | 1,064 | 22.4% |
| $50,000 to $74,999 | 1,012 | 21.3% |
| $75,000 to $99,999 | 499 | 10.5% |
| $100,000 to $149,999 | 532 | 11.2% |
| $150,000 to $199,999 | 228 | 4.8% |
| $200,000+ | 100 | 2.1% |
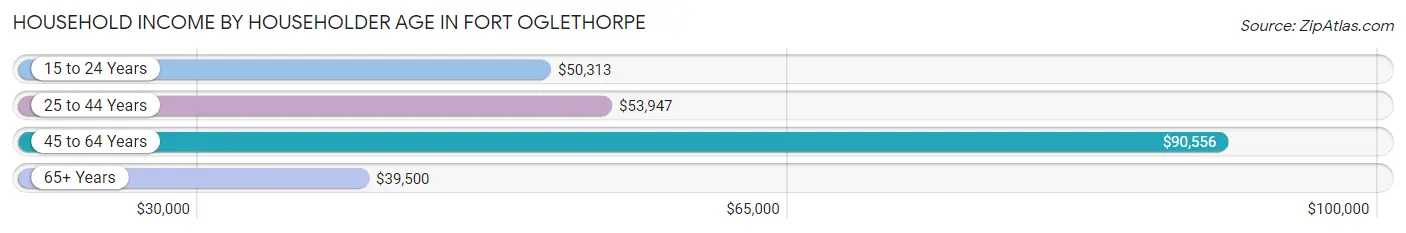
Household Income by Householder Age in Fort Oglethorpe
The median household income in Fort Oglethorpe is $49,789, with the highest median household income of $90,556 found in the 45 to 64 years age bracket for the primary householder. A total of 1,030 households (21.7%) fall into this category. Meanwhile, the 65+ years age bracket for the primary householder has the lowest median household income of $39,500, with 1,862 households (39.2%) in this group.
| Income Bracket | # Households | Median Income |
| 15 to 24 Years | 149 (3.1%) | $50,313 |
| 25 to 44 Years | 1,710 (36.0%) | $53,947 |
| 45 to 64 Years | 1,030 (21.7%) | $90,556 |
| 65+ Years | 1,862 (39.2%) | $39,500 |
| Total | 4,751 (100.0%) | $49,789 |
Poverty in Fort Oglethorpe
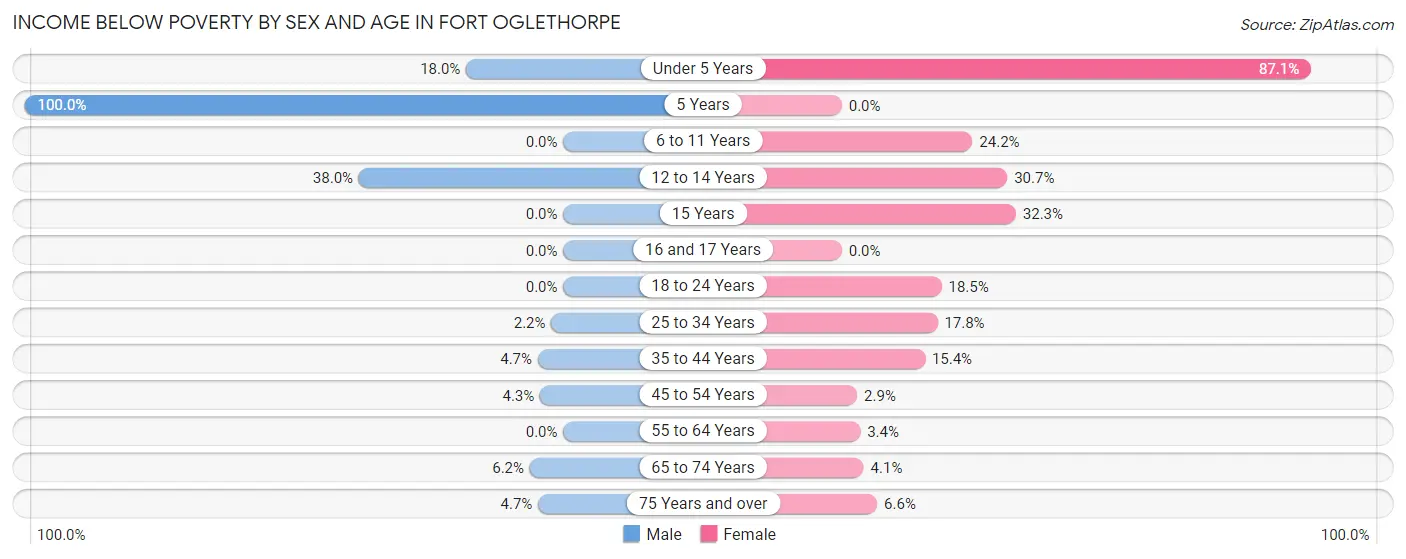
Income Below Poverty by Sex and Age in Fort Oglethorpe
With 6.5% poverty level for males and 13.0% for females among the residents of Fort Oglethorpe, 5 year old males and under 5 year old females are the most vulnerable to poverty, with 52 males (100.0%) and 108 females (87.1%) in their respective age groups living below the poverty level.
| Age Bracket | Male | Female |
| Under 5 Years | 42 (18.0%) | 108 (87.1%) |
| 5 Years | 52 (100.0%) | 0 (0.0%) |
| 6 to 11 Years | 0 (0.0%) | 80 (24.2%) |
| 12 to 14 Years | 74 (38.0%) | 86 (30.7%) |
| 15 Years | 0 (0.0%) | 21 (32.3%) |
| 16 and 17 Years | 0 (0.0%) | 0 (0.0%) |
| 18 to 24 Years | 0 (0.0%) | 30 (18.5%) |
| 25 to 34 Years | 14 (2.2%) | 142 (17.7%) |
| 35 to 44 Years | 31 (4.7%) | 114 (15.4%) |
| 45 to 54 Years | 25 (4.3%) | 18 (2.9%) |
| 55 to 64 Years | 0 (0.0%) | 14 (3.4%) |
| 65 to 74 Years | 14 (6.2%) | 28 (4.1%) |
| 75 Years and over | 29 (4.7%) | 71 (6.6%) |
| Total | 281 (6.5%) | 712 (13.0%) |
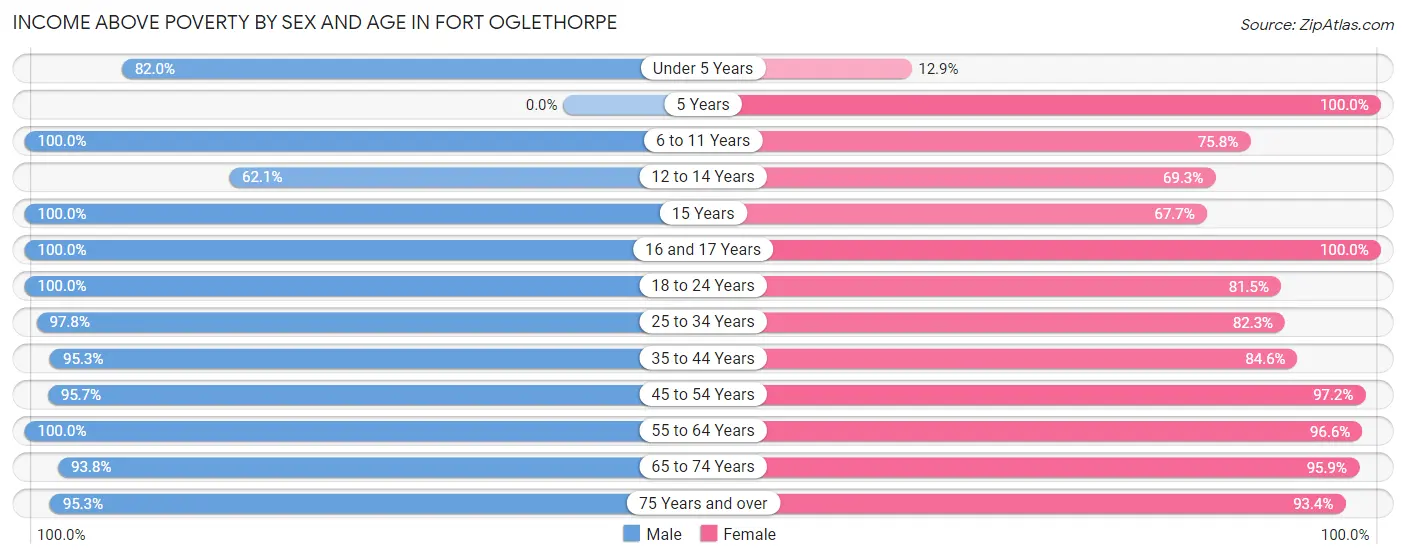
Income Above Poverty by Sex and Age in Fort Oglethorpe
According to the poverty statistics in Fort Oglethorpe, males aged 6 to 11 years and females aged 5 years are the age groups that are most secure financially, with 100.0% of males and 100.0% of females in these age groups living above the poverty line.
| Age Bracket | Male | Female |
| Under 5 Years | 191 (82.0%) | 16 (12.9%) |
| 5 Years | 0 (0.0%) | 67 (100.0%) |
| 6 to 11 Years | 124 (100.0%) | 250 (75.8%) |
| 12 to 14 Years | 121 (62.1%) | 194 (69.3%) |
| 15 Years | 49 (100.0%) | 44 (67.7%) |
| 16 and 17 Years | 61 (100.0%) | 117 (100.0%) |
| 18 to 24 Years | 602 (100.0%) | 132 (81.5%) |
| 25 to 34 Years | 618 (97.8%) | 658 (82.3%) |
| 35 to 44 Years | 625 (95.3%) | 625 (84.6%) |
| 45 to 54 Years | 555 (95.7%) | 614 (97.2%) |
| 55 to 64 Years | 311 (100.0%) | 395 (96.6%) |
| 65 to 74 Years | 211 (93.8%) | 662 (95.9%) |
| 75 Years and over | 590 (95.3%) | 1,011 (93.4%) |
| Total | 4,058 (93.5%) | 4,785 (87.1%) |
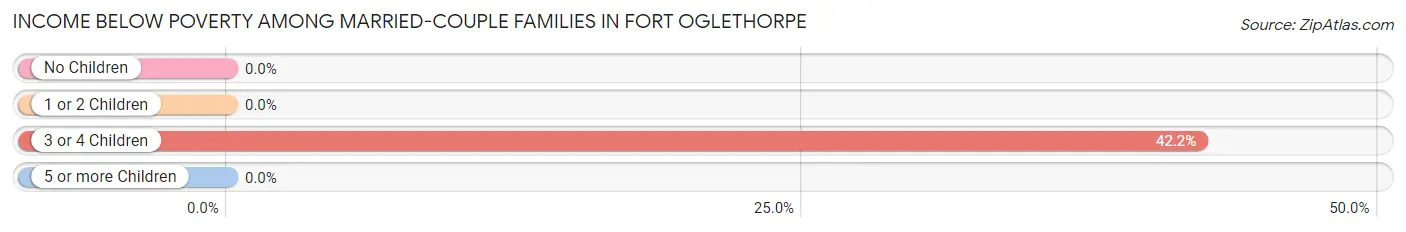
Income Below Poverty Among Married-Couple Families in Fort Oglethorpe
The poverty statistics for married-couple families in Fort Oglethorpe show that 1.0% or 19 of the total 1,881 families live below the poverty line. Families with 3 or 4 children have the highest poverty rate of 42.2%, comprising of 19 families. On the other hand, families with no children have the lowest poverty rate of 0.0%, which includes 0 families.
| Children | Above Poverty | Below Poverty |
| No Children | 1,345 (100.0%) | 0 (0.0%) |
| 1 or 2 Children | 491 (100.0%) | 0 (0.0%) |
| 3 or 4 Children | 26 (57.8%) | 19 (42.2%) |
| 5 or more Children | 0 (0.0%) | 0 (0.0%) |
| Total | 1,862 (99.0%) | 19 (1.0%) |
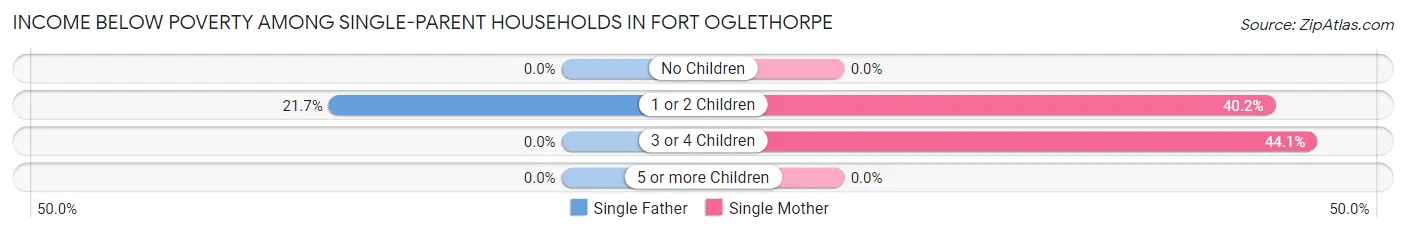
Income Below Poverty Among Single-Parent Households in Fort Oglethorpe
According to the poverty data in Fort Oglethorpe, 19.2% or 18 single-father households and 28.0% or 140 single-mother households are living below the poverty line. Among single-father households, those with 1 or 2 children have the highest poverty rate, with 18 households (21.7%) experiencing poverty. Likewise, among single-mother households, those with 3 or 4 children have the highest poverty rate, with 56 households (44.1%) falling below the poverty line.
| Children | Single Father | Single Mother |
| No Children | 0 (0.0%) | 0 (0.0%) |
| 1 or 2 Children | 18 (21.7%) | 84 (40.2%) |
| 3 or 4 Children | 0 (0.0%) | 56 (44.1%) |
| 5 or more Children | 0 (0.0%) | 0 (0.0%) |
| Total | 18 (19.2%) | 140 (28.0%) |
Income Below Poverty Among Married-Couple vs Single-Parent Households in Fort Oglethorpe
The poverty data for Fort Oglethorpe shows that 19 of the married-couple family households (1.0%) and 158 of the single-parent households (26.6%) are living below the poverty level. Within the married-couple family households, those with 3 or 4 children have the highest poverty rate, with 19 households (42.2%) falling below the poverty line. Among the single-parent households, those with 3 or 4 children have the highest poverty rate, with 56 household (44.1%) living below poverty.
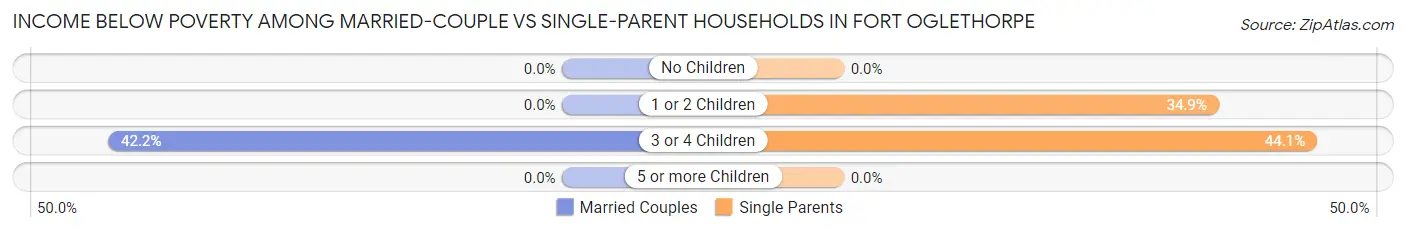
| Children | Married-Couple Families | Single-Parent Households |
| No Children | 0 (0.0%) | 0 (0.0%) |
| 1 or 2 Children | 0 (0.0%) | 102 (34.9%) |
| 3 or 4 Children | 19 (42.2%) | 56 (44.1%) |
| 5 or more Children | 0 (0.0%) | 0 (0.0%) |
| Total | 19 (1.0%) | 158 (26.6%) |
Employment Characteristics in Fort Oglethorpe
Employment by Class of Employer in Fort Oglethorpe
Among the 4,359 employed individuals in Fort Oglethorpe, private company employees (3,215 | 73.8%), local government employees (362 | 8.3%), and not-for-profit organizations (359 | 8.2%) make up the most common classes of employment.
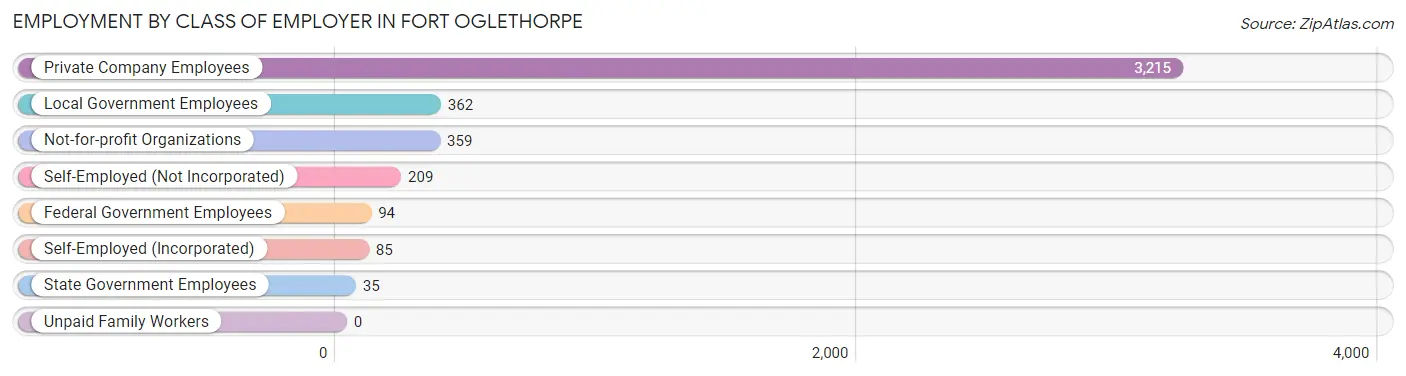
| Employer Class | # Employees | % Employees |
| Private Company Employees | 3,215 | 73.8% |
| Self-Employed (Incorporated) | 85 | 1.9% |
| Self-Employed (Not Incorporated) | 209 | 4.8% |
| Not-for-profit Organizations | 359 | 8.2% |
| Local Government Employees | 362 | 8.3% |
| State Government Employees | 35 | 0.8% |
| Federal Government Employees | 94 | 2.2% |
| Unpaid Family Workers | 0 | 0.0% |
| Total | 4,359 | 100.0% |
Employment Status by Age in Fort Oglethorpe
According to the labor force statistics for Fort Oglethorpe, out of the total population over 16 years of age (8,684), 54.3% or 4,715 individuals are in the labor force, with 5.9% or 278 of them unemployed. The age group with the highest labor force participation rate is 30 to 34 years, with 96.8% or 664 individuals in the labor force. Within the labor force, the 16 to 19 years age range has the highest percentage of unemployed individuals, with 26.9% or 18 of them being unemployed.
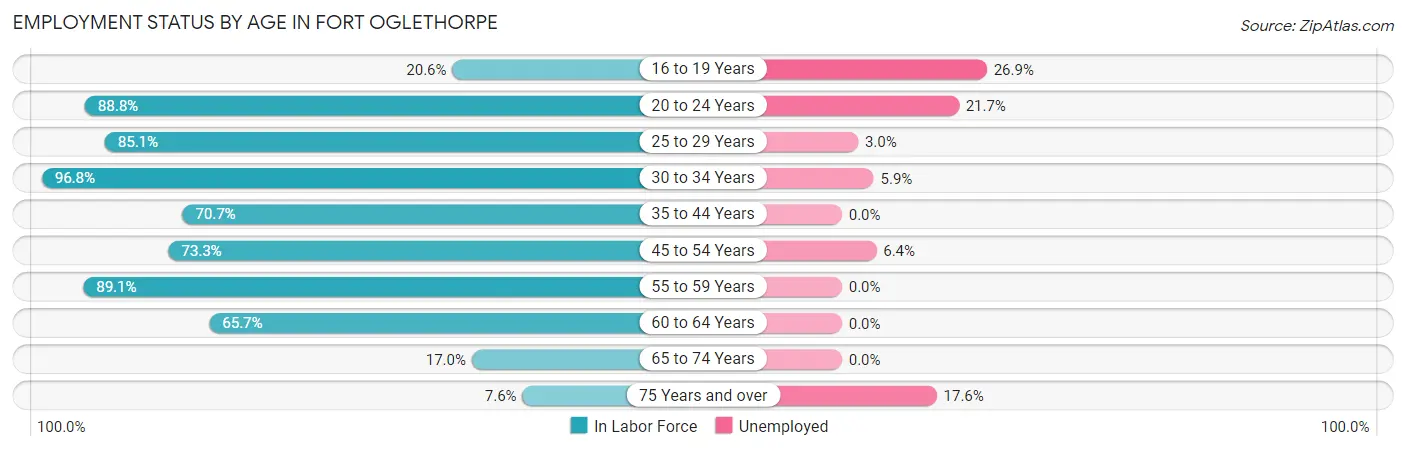
| Age Bracket | In Labor Force | Unemployed |
| 16 to 19 Years | 67 (20.6%) | 18 (26.9%) |
| 20 to 24 Years | 548 (88.8%) | 119 (21.7%) |
| 25 to 29 Years | 635 (85.1%) | 19 (3.0%) |
| 30 to 34 Years | 664 (96.8%) | 39 (5.9%) |
| 35 to 44 Years | 986 (70.7%) | 0 (0.0%) |
| 45 to 54 Years | 894 (73.3%) | 57 (6.4%) |
| 55 to 59 Years | 393 (89.1%) | 0 (0.0%) |
| 60 to 64 Years | 211 (65.7%) | 0 (0.0%) |
| 65 to 74 Years | 166 (17.0%) | 0 (0.0%) |
| 75 Years and over | 149 (7.6%) | 26 (17.6%) |
| Total | 4,715 (54.3%) | 278 (5.9%) |
Employment Status by Educational Attainment in Fort Oglethorpe
According to labor force statistics for Fort Oglethorpe, 78.7% of individuals (3,785) out of the total population between 25 and 64 years of age (4,809) are in the labor force, with 3.0% or 114 of them being unemployed. The group with the highest labor force participation rate are those with the educational attainment of bachelor's degree or higher, with 89.9% or 1,028 individuals in the labor force. Within the labor force, individuals with less than high school education have the highest percentage of unemployment, with 34.4% or 76 of them being unemployed.
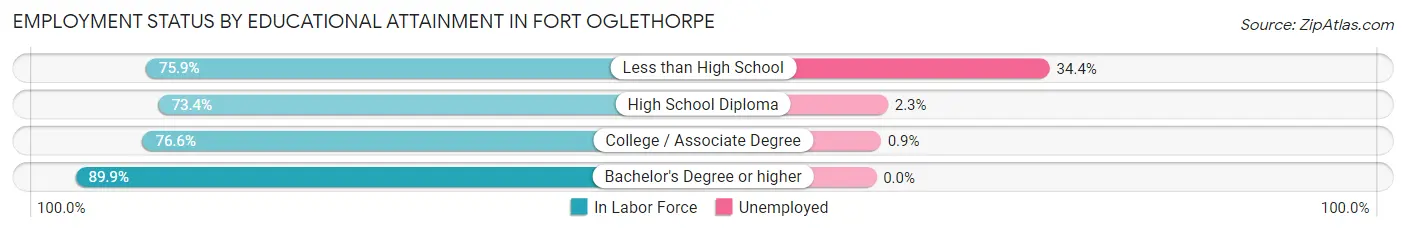
| Educational Attainment | In Labor Force | Unemployed |
| Less than High School | 221 (75.9%) | 100 (34.4%) |
| High School Diploma | 1,127 (73.4%) | 35 (2.3%) |
| College / Associate Degree | 1,408 (76.6%) | 17 (0.9%) |
| Bachelor's Degree or higher | 1,028 (89.9%) | 0 (0.0%) |
| Total | 3,785 (78.7%) | 144 (3.0%) |
Employment Occupations by Sex in Fort Oglethorpe
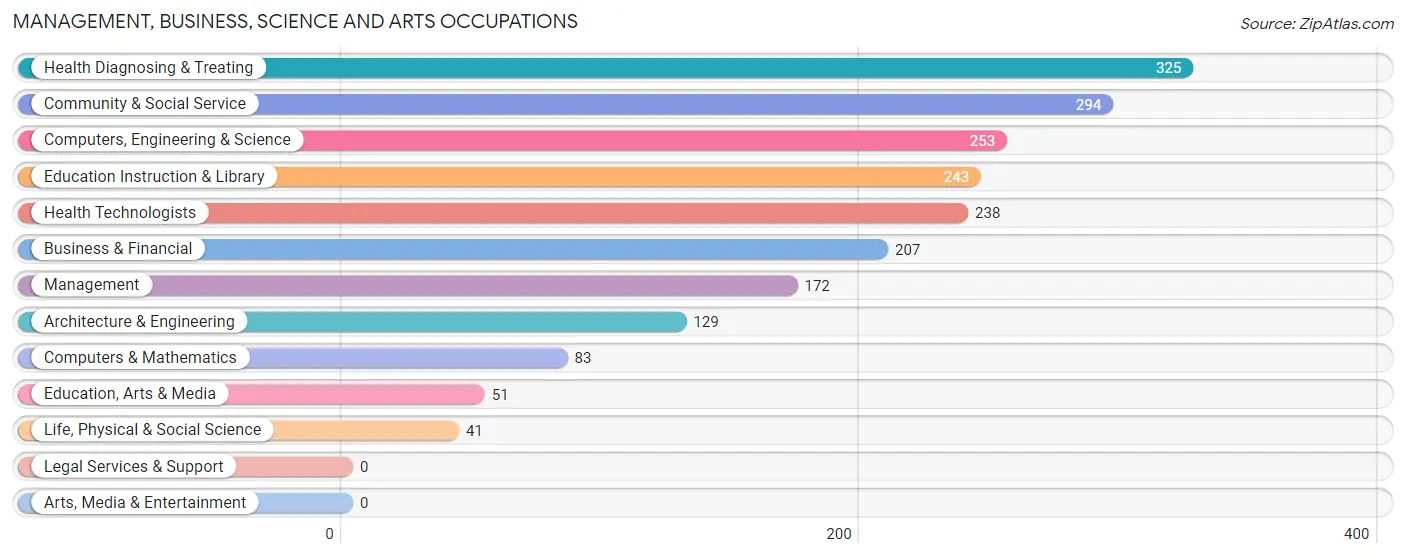
Management, Business, Science and Arts Occupations
The most common Management, Business, Science and Arts occupations in Fort Oglethorpe are Health Diagnosing & Treating (325 | 7.3%), Community & Social Service (294 | 6.6%), Computers, Engineering & Science (253 | 5.7%), Education Instruction & Library (243 | 5.5%), and Health Technologists (238 | 5.4%).
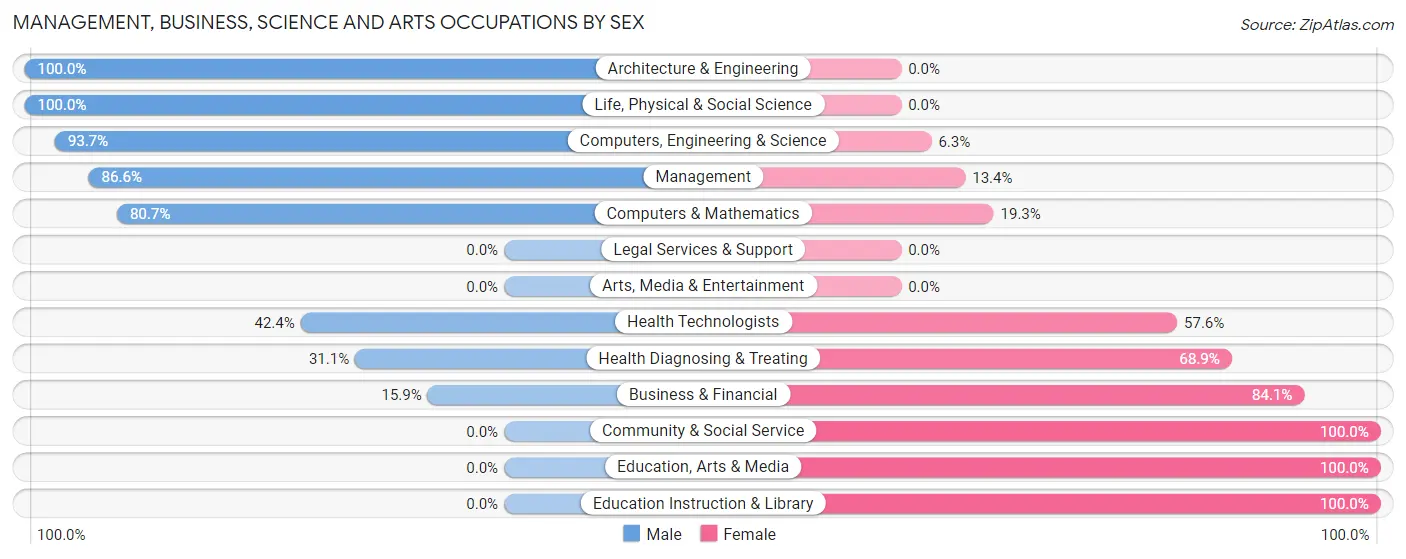
Management, Business, Science and Arts Occupations by Sex
Within the Management, Business, Science and Arts occupations in Fort Oglethorpe, the most male-oriented occupations are Architecture & Engineering (100.0%), Life, Physical & Social Science (100.0%), and Computers, Engineering & Science (93.7%), while the most female-oriented occupations are Community & Social Service (100.0%), Education, Arts & Media (100.0%), and Education Instruction & Library (100.0%).
| Occupation | Male | Female |
| Management | 149 (86.6%) | 23 (13.4%) |
| Business & Financial | 33 (15.9%) | 174 (84.1%) |
| Computers, Engineering & Science | 237 (93.7%) | 16 (6.3%) |
| Computers & Mathematics | 67 (80.7%) | 16 (19.3%) |
| Architecture & Engineering | 129 (100.0%) | 0 (0.0%) |
| Life, Physical & Social Science | 41 (100.0%) | 0 (0.0%) |
| Community & Social Service | 0 (0.0%) | 294 (100.0%) |
| Education, Arts & Media | 0 (0.0%) | 51 (100.0%) |
| Legal Services & Support | 0 (0.0%) | 0 (0.0%) |
| Education Instruction & Library | 0 (0.0%) | 243 (100.0%) |
| Arts, Media & Entertainment | 0 (0.0%) | 0 (0.0%) |
| Health Diagnosing & Treating | 101 (31.1%) | 224 (68.9%) |
| Health Technologists | 101 (42.4%) | 137 (57.6%) |
| Total (Category) | 520 (41.6%) | 731 (58.4%) |
| Total (Overall) | 2,274 (51.3%) | 2,160 (48.7%) |
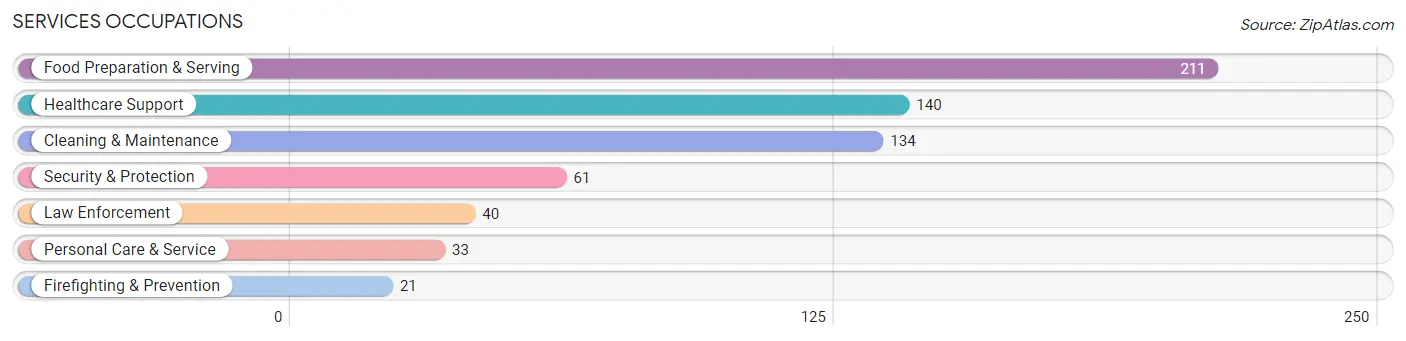
Services Occupations
The most common Services occupations in Fort Oglethorpe are Food Preparation & Serving (211 | 4.8%), Healthcare Support (140 | 3.2%), Cleaning & Maintenance (134 | 3.0%), Security & Protection (61 | 1.4%), and Law Enforcement (40 | 0.9%).
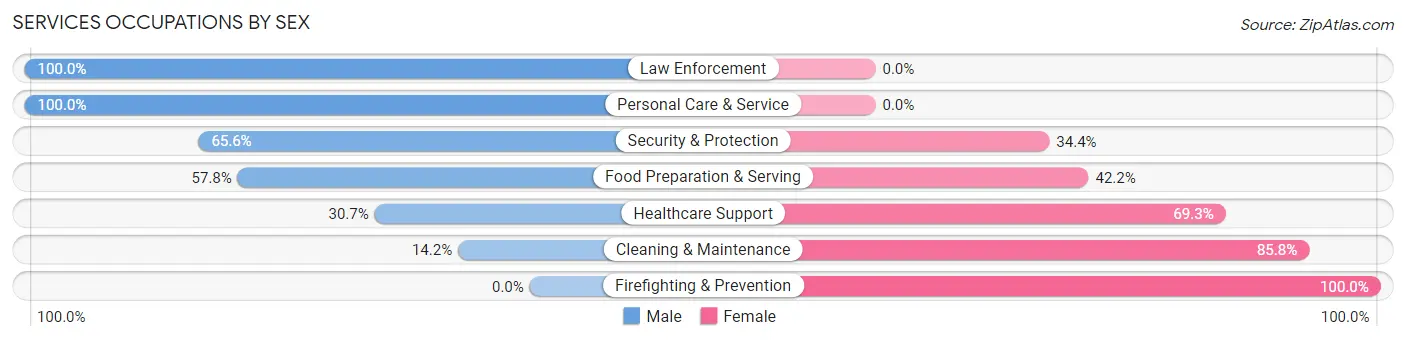
Services Occupations by Sex
Within the Services occupations in Fort Oglethorpe, the most male-oriented occupations are Law Enforcement (100.0%), Personal Care & Service (100.0%), and Security & Protection (65.6%), while the most female-oriented occupations are Firefighting & Prevention (100.0%), Cleaning & Maintenance (85.8%), and Healthcare Support (69.3%).
| Occupation | Male | Female |
| Healthcare Support | 43 (30.7%) | 97 (69.3%) |
| Security & Protection | 40 (65.6%) | 21 (34.4%) |
| Firefighting & Prevention | 0 (0.0%) | 21 (100.0%) |
| Law Enforcement | 40 (100.0%) | 0 (0.0%) |
| Food Preparation & Serving | 122 (57.8%) | 89 (42.2%) |
| Cleaning & Maintenance | 19 (14.2%) | 115 (85.8%) |
| Personal Care & Service | 33 (100.0%) | 0 (0.0%) |
| Total (Category) | 257 (44.4%) | 322 (55.6%) |
| Total (Overall) | 2,274 (51.3%) | 2,160 (48.7%) |
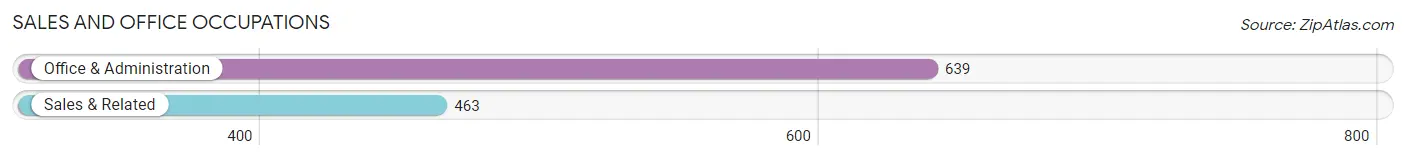
Sales and Office Occupations
The most common Sales and Office occupations in Fort Oglethorpe are Office & Administration (639 | 14.4%), and Sales & Related (463 | 10.4%).
Sales and Office Occupations by Sex
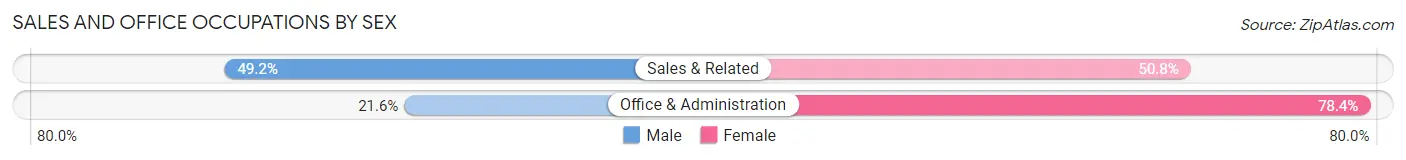
| Occupation | Male | Female |
| Sales & Related | 228 (49.2%) | 235 (50.8%) |
| Office & Administration | 138 (21.6%) | 501 (78.4%) |
| Total (Category) | 366 (33.2%) | 736 (66.8%) |
| Total (Overall) | 2,274 (51.3%) | 2,160 (48.7%) |
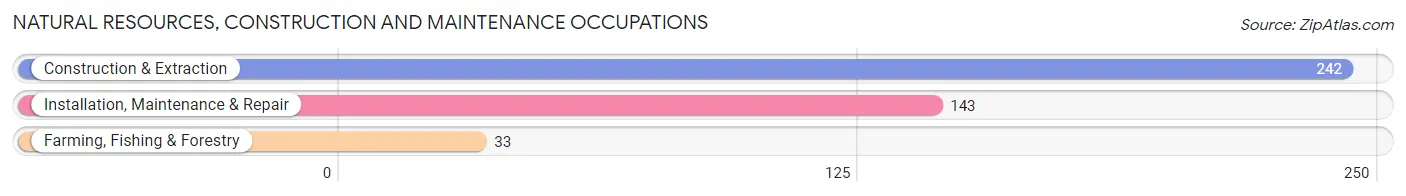
Natural Resources, Construction and Maintenance Occupations
The most common Natural Resources, Construction and Maintenance occupations in Fort Oglethorpe are Construction & Extraction (242 | 5.5%), Installation, Maintenance & Repair (143 | 3.2%), and Farming, Fishing & Forestry (33 | 0.7%).
Natural Resources, Construction and Maintenance Occupations by Sex
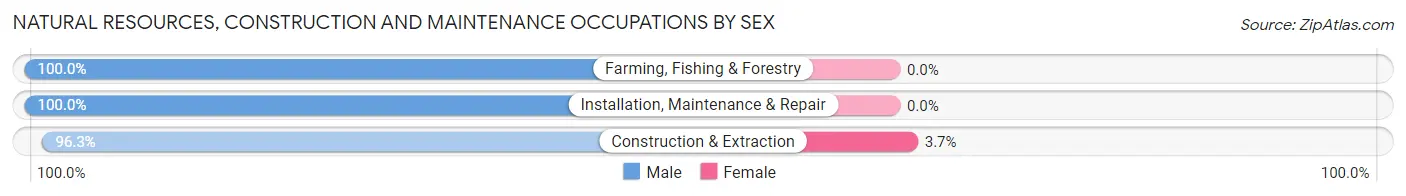
| Occupation | Male | Female |
| Farming, Fishing & Forestry | 33 (100.0%) | 0 (0.0%) |
| Construction & Extraction | 233 (96.3%) | 9 (3.7%) |
| Installation, Maintenance & Repair | 143 (100.0%) | 0 (0.0%) |
| Total (Category) | 409 (97.9%) | 9 (2.1%) |
| Total (Overall) | 2,274 (51.3%) | 2,160 (48.7%) |
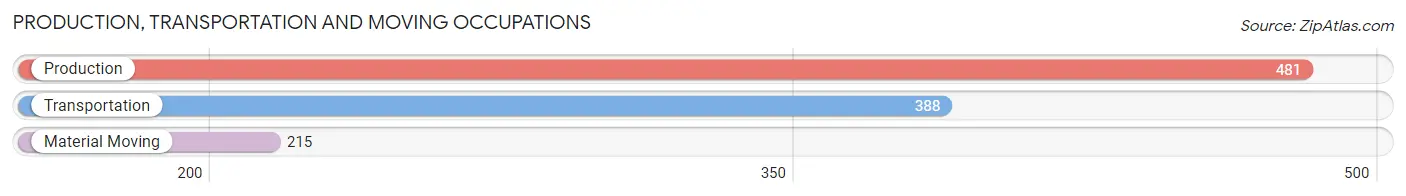
Production, Transportation and Moving Occupations
The most common Production, Transportation and Moving occupations in Fort Oglethorpe are Production (481 | 10.8%), Transportation (388 | 8.7%), and Material Moving (215 | 4.9%).
Production, Transportation and Moving Occupations by Sex
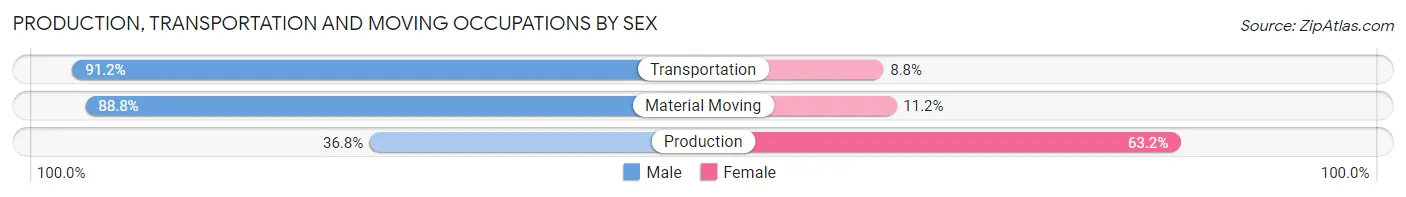
| Occupation | Male | Female |
| Production | 177 (36.8%) | 304 (63.2%) |
| Transportation | 354 (91.2%) | 34 (8.8%) |
| Material Moving | 191 (88.8%) | 24 (11.2%) |
| Total (Category) | 722 (66.6%) | 362 (33.4%) |
| Total (Overall) | 2,274 (51.3%) | 2,160 (48.7%) |
Employment Industries by Sex in Fort Oglethorpe
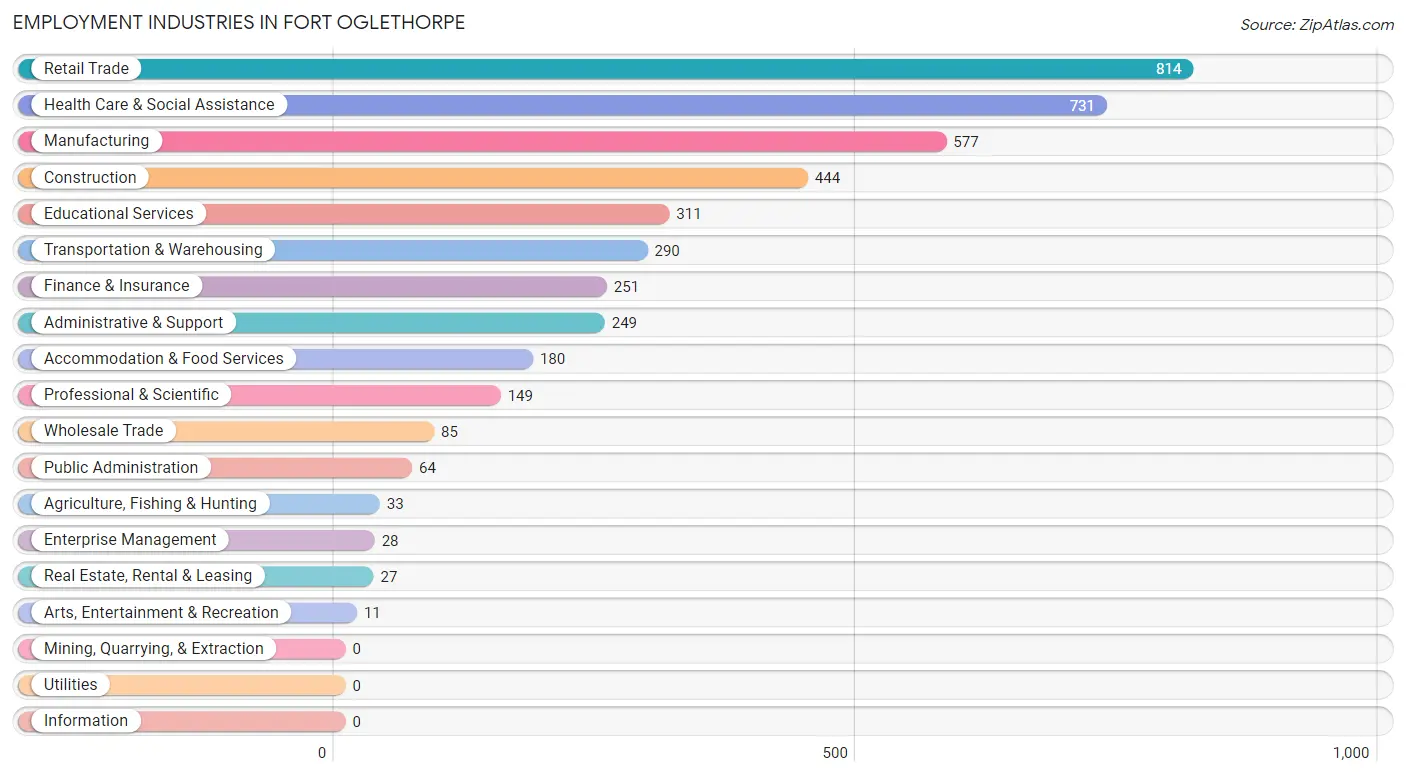
Employment Industries in Fort Oglethorpe
The major employment industries in Fort Oglethorpe include Retail Trade (814 | 18.4%), Health Care & Social Assistance (731 | 16.5%), Manufacturing (577 | 13.0%), Construction (444 | 10.0%), and Educational Services (311 | 7.0%).
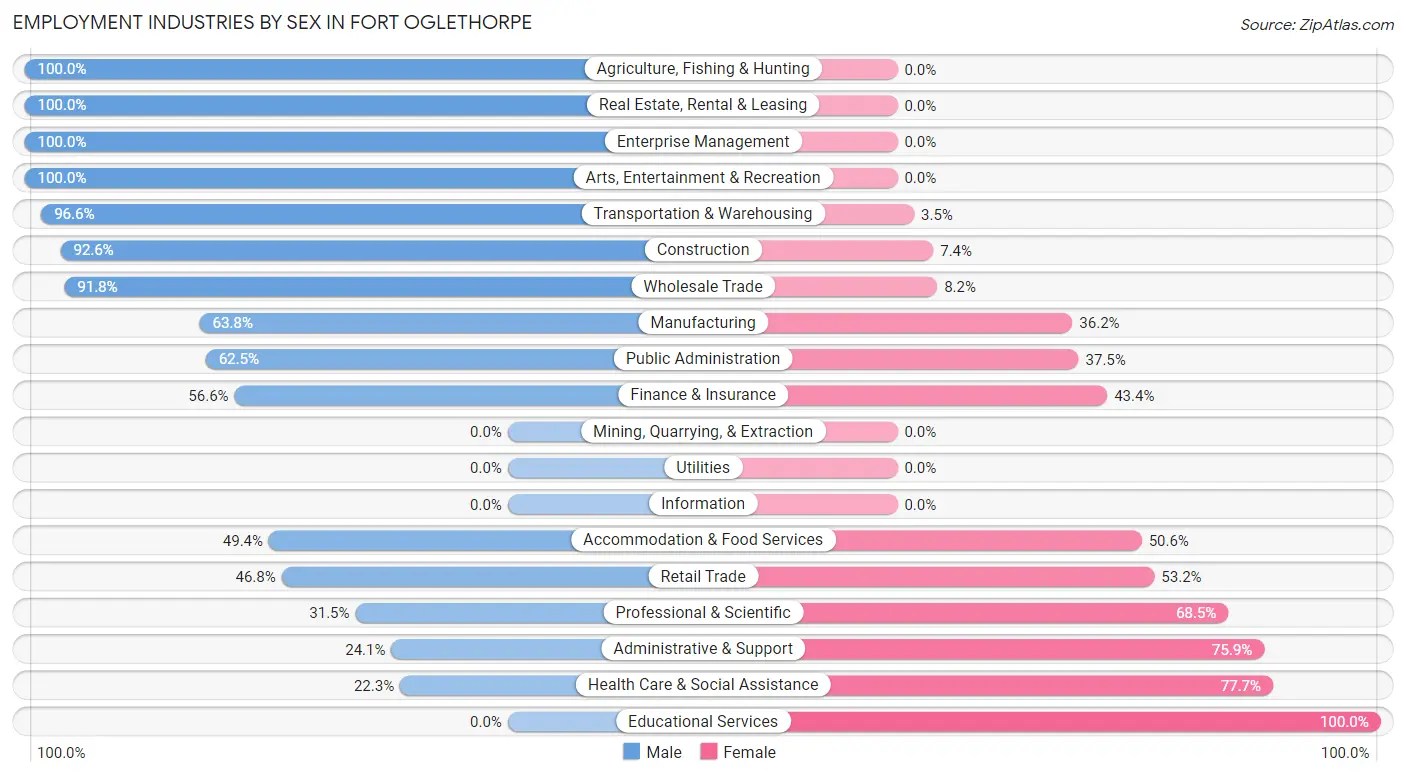
Employment Industries by Sex in Fort Oglethorpe
The Fort Oglethorpe industries that see more men than women are Agriculture, Fishing & Hunting (100.0%), Real Estate, Rental & Leasing (100.0%), and Enterprise Management (100.0%), whereas the industries that tend to have a higher number of women are Educational Services (100.0%), Health Care & Social Assistance (77.7%), and Administrative & Support (75.9%).
| Industry | Male | Female |
| Agriculture, Fishing & Hunting | 33 (100.0%) | 0 (0.0%) |
| Mining, Quarrying, & Extraction | 0 (0.0%) | 0 (0.0%) |
| Construction | 411 (92.6%) | 33 (7.4%) |
| Manufacturing | 368 (63.8%) | 209 (36.2%) |
| Wholesale Trade | 78 (91.8%) | 7 (8.2%) |
| Retail Trade | 381 (46.8%) | 433 (53.2%) |
| Transportation & Warehousing | 280 (96.6%) | 10 (3.5%) |
| Utilities | 0 (0.0%) | 0 (0.0%) |
| Information | 0 (0.0%) | 0 (0.0%) |
| Finance & Insurance | 142 (56.6%) | 109 (43.4%) |
| Real Estate, Rental & Leasing | 27 (100.0%) | 0 (0.0%) |
| Professional & Scientific | 47 (31.5%) | 102 (68.5%) |
| Enterprise Management | 28 (100.0%) | 0 (0.0%) |
| Administrative & Support | 60 (24.1%) | 189 (75.9%) |
| Educational Services | 0 (0.0%) | 311 (100.0%) |
| Health Care & Social Assistance | 163 (22.3%) | 568 (77.7%) |
| Arts, Entertainment & Recreation | 11 (100.0%) | 0 (0.0%) |
| Accommodation & Food Services | 89 (49.4%) | 91 (50.6%) |
| Public Administration | 40 (62.5%) | 24 (37.5%) |
| Total | 2,274 (51.3%) | 2,160 (48.7%) |
Education in Fort Oglethorpe
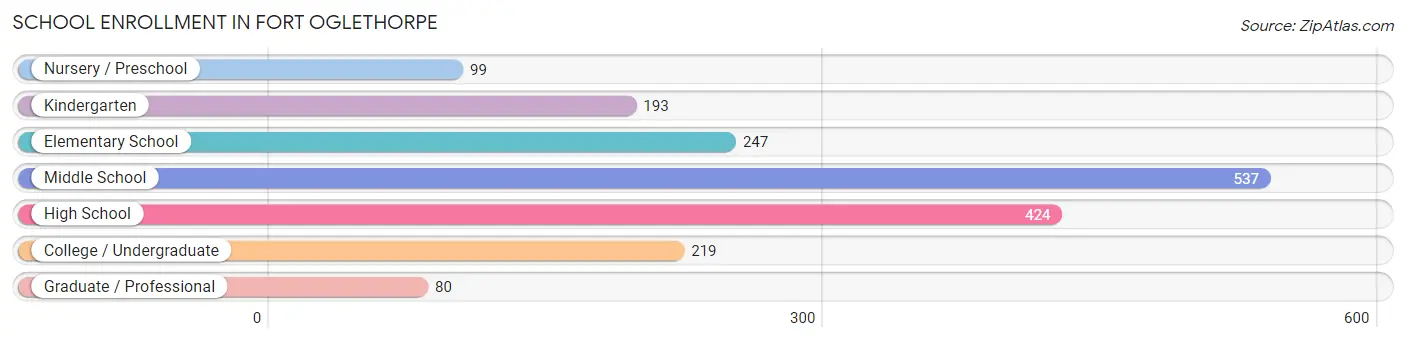
School Enrollment in Fort Oglethorpe
The most common levels of schooling among the 1,799 students in Fort Oglethorpe are middle school (537 | 29.8%), high school (424 | 23.6%), and elementary school (247 | 13.7%).
| School Level | # Students | % Students |
| Nursery / Preschool | 99 | 5.5% |
| Kindergarten | 193 | 10.7% |
| Elementary School | 247 | 13.7% |
| Middle School | 537 | 29.8% |
| High School | 424 | 23.6% |
| College / Undergraduate | 219 | 12.2% |
| Graduate / Professional | 80 | 4.4% |
| Total | 1,799 | 100.0% |
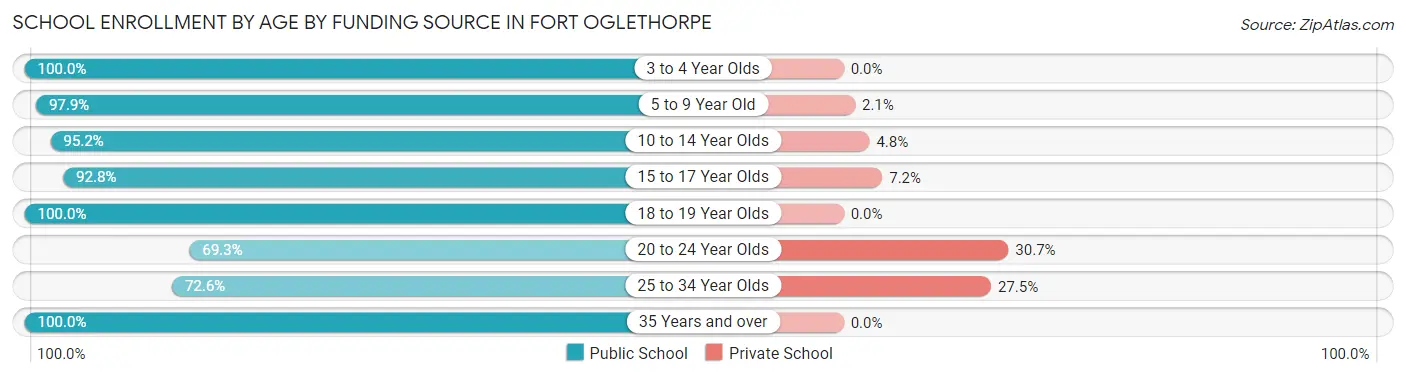
School Enrollment by Age by Funding Source in Fort Oglethorpe
Out of a total of 1,799 students who are enrolled in schools in Fort Oglethorpe, 115 (6.4%) attend a private institution, while the remaining 1,684 (93.6%) are enrolled in public schools. The age group of 20 to 24 year olds has the highest likelihood of being enrolled in private schools, with 27 (30.7% in the age bracket) enrolled. Conversely, the age group of 3 to 4 year olds has the lowest likelihood of being enrolled in a private school, with 99 (100.0% in the age bracket) attending a public institution.
| Age Bracket | Public School | Private School |
| 3 to 4 Year Olds | 99 (100.0%) | 0 (0.0%) |
| 5 to 9 Year Old | 415 (97.9%) | 9 (2.1%) |
| 10 to 14 Year Olds | 594 (95.2%) | 30 (4.8%) |
| 15 to 17 Year Olds | 271 (92.8%) | 21 (7.2%) |
| 18 to 19 Year Olds | 83 (100.0%) | 0 (0.0%) |
| 20 to 24 Year Olds | 61 (69.3%) | 27 (30.7%) |
| 25 to 34 Year Olds | 74 (72.6%) | 28 (27.5%) |
| 35 Years and over | 87 (100.0%) | 0 (0.0%) |
| Total | 1,684 (93.6%) | 115 (6.4%) |
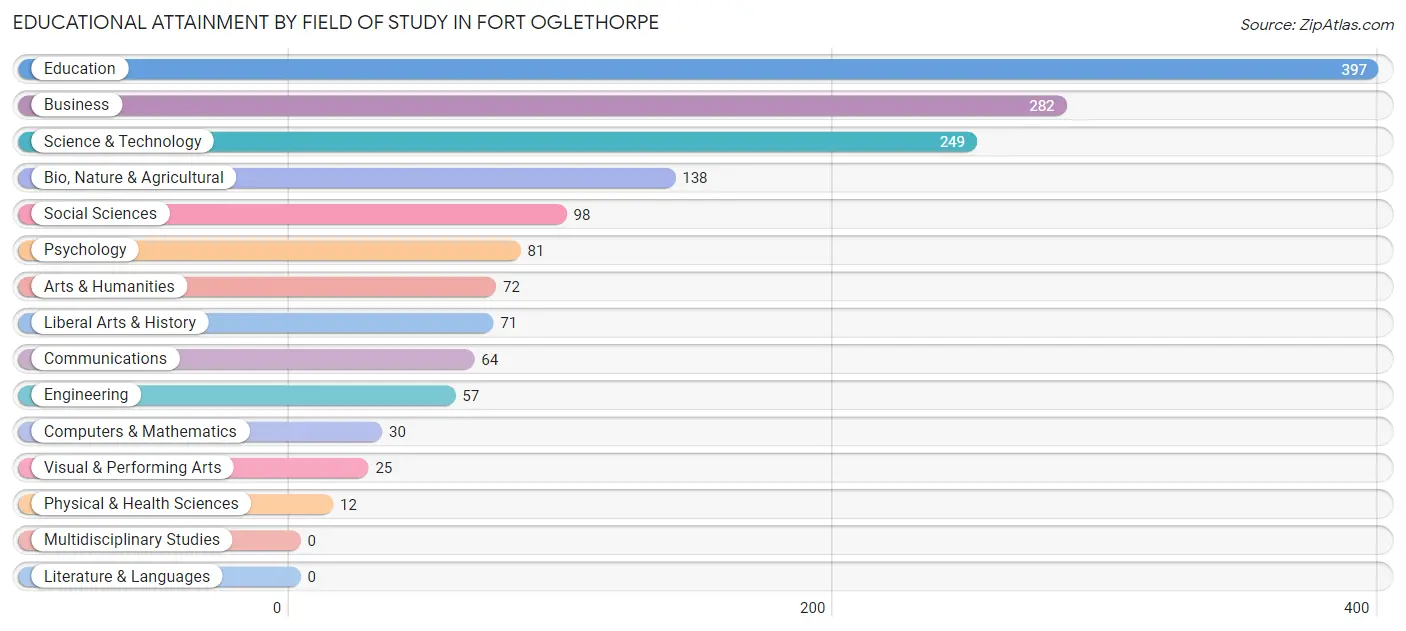
Educational Attainment by Field of Study in Fort Oglethorpe
Education (397 | 25.2%), business (282 | 17.9%), science & technology (249 | 15.8%), bio, nature & agricultural (138 | 8.8%), and social sciences (98 | 6.2%) are the most common fields of study among 1,576 individuals in Fort Oglethorpe who have obtained a bachelor's degree or higher.
| Field of Study | # Graduates | % Graduates |
| Computers & Mathematics | 30 | 1.9% |
| Bio, Nature & Agricultural | 138 | 8.8% |
| Physical & Health Sciences | 12 | 0.8% |
| Psychology | 81 | 5.1% |
| Social Sciences | 98 | 6.2% |
| Engineering | 57 | 3.6% |
| Multidisciplinary Studies | 0 | 0.0% |
| Science & Technology | 249 | 15.8% |
| Business | 282 | 17.9% |
| Education | 397 | 25.2% |
| Literature & Languages | 0 | 0.0% |
| Liberal Arts & History | 71 | 4.5% |
| Visual & Performing Arts | 25 | 1.6% |
| Communications | 64 | 4.1% |
| Arts & Humanities | 72 | 4.6% |
| Total | 1,576 | 100.0% |
Transportation & Commute in Fort Oglethorpe
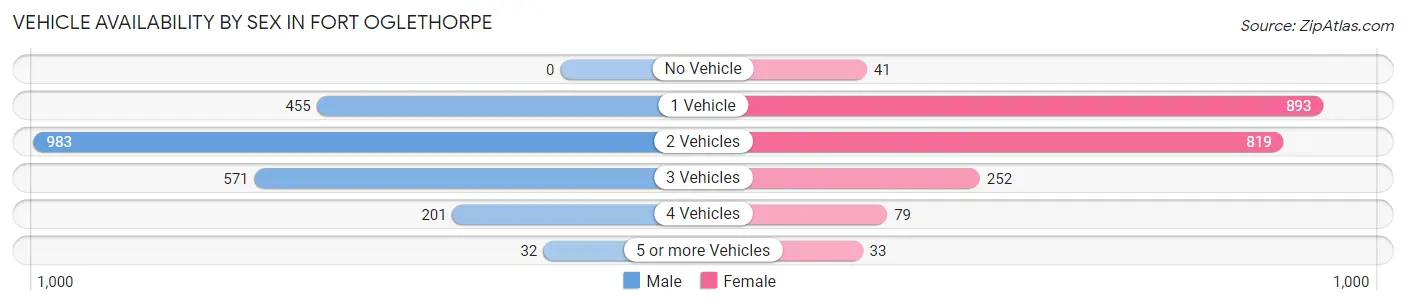
Vehicle Availability by Sex in Fort Oglethorpe
The most prevalent vehicle ownership categories in Fort Oglethorpe are males with 2 vehicles (983, accounting for 43.8%) and females with 2 vehicles (819, making up 46.4%).
| Vehicles Available | Male | Female |
| No Vehicle | 0 (0.0%) | 41 (1.9%) |
| 1 Vehicle | 455 (20.3%) | 893 (42.2%) |
| 2 Vehicles | 983 (43.8%) | 819 (38.7%) |
| 3 Vehicles | 571 (25.5%) | 252 (11.9%) |
| 4 Vehicles | 201 (9.0%) | 79 (3.7%) |
| 5 or more Vehicles | 32 (1.4%) | 33 (1.6%) |
| Total | 2,242 (100.0%) | 2,117 (100.0%) |
Commute Time in Fort Oglethorpe
The most frequently occuring commute durations in Fort Oglethorpe are 15 to 19 minutes (812 commuters, 19.7%), 20 to 24 minutes (695 commuters, 16.9%), and 5 to 9 minutes (655 commuters, 15.9%).
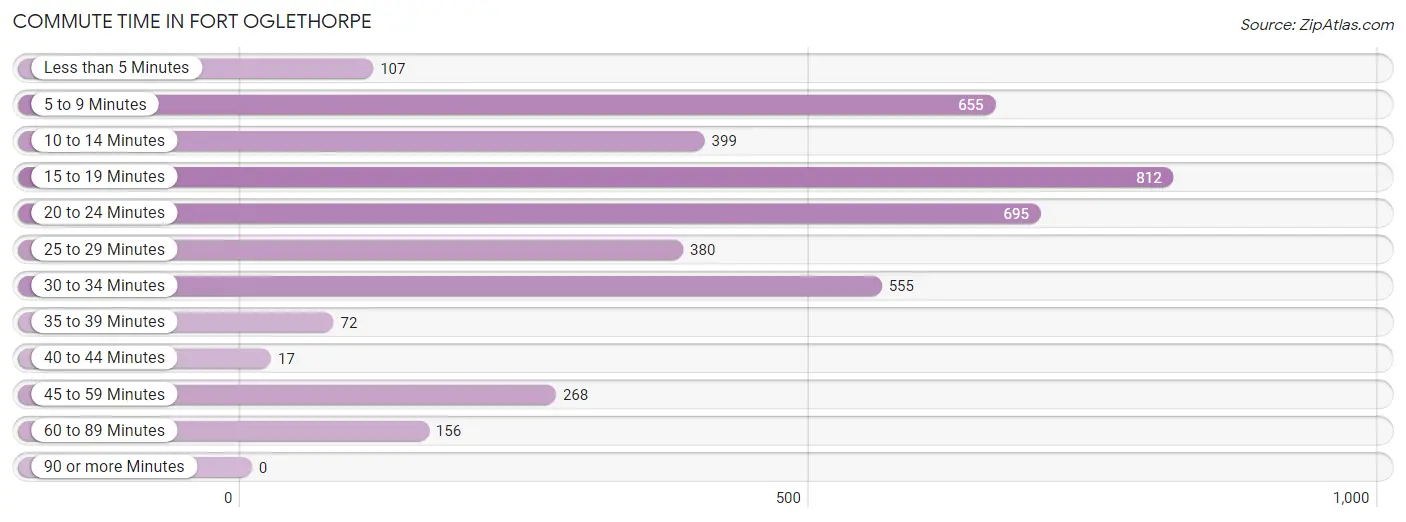
| Commute Time | # Commuters | % Commuters |
| Less than 5 Minutes | 107 | 2.6% |
| 5 to 9 Minutes | 655 | 15.9% |
| 10 to 14 Minutes | 399 | 9.7% |
| 15 to 19 Minutes | 812 | 19.7% |
| 20 to 24 Minutes | 695 | 16.9% |
| 25 to 29 Minutes | 380 | 9.2% |
| 30 to 34 Minutes | 555 | 13.5% |
| 35 to 39 Minutes | 72 | 1.8% |
| 40 to 44 Minutes | 17 | 0.4% |
| 45 to 59 Minutes | 268 | 6.5% |
| 60 to 89 Minutes | 156 | 3.8% |
| 90 or more Minutes | 0 | 0.0% |
Commute Time by Sex in Fort Oglethorpe
The most common commute times in Fort Oglethorpe are 30 to 34 minutes (474 commuters, 22.8%) for males and 5 to 9 minutes (440 commuters, 21.6%) for females.
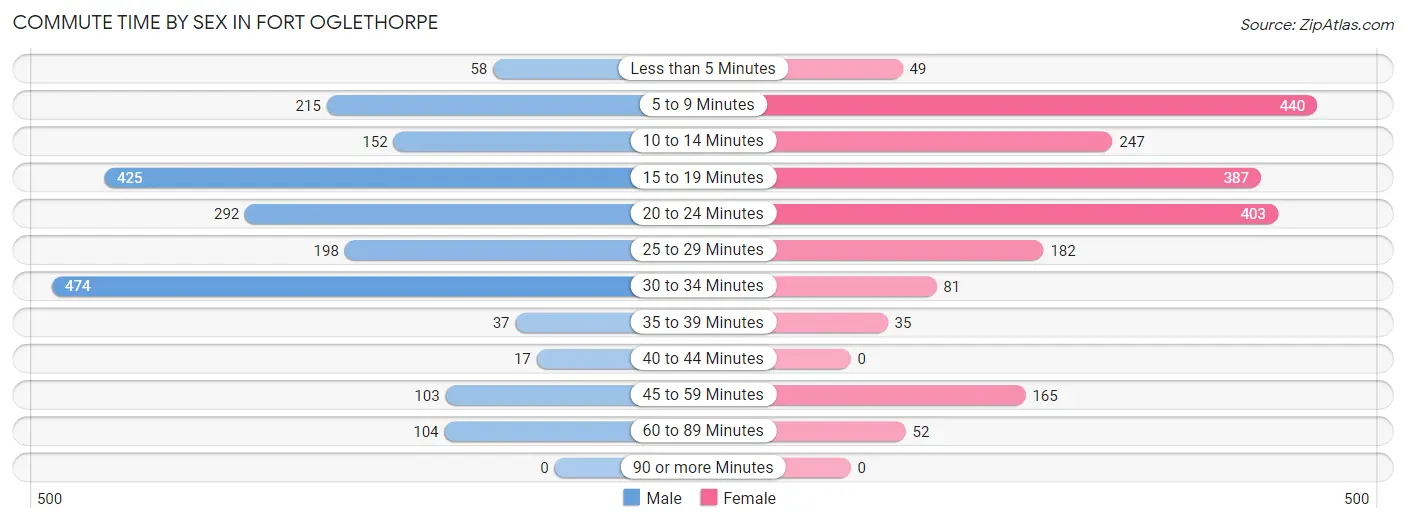
| Commute Time | Male | Female |
| Less than 5 Minutes | 58 (2.8%) | 49 (2.4%) |
| 5 to 9 Minutes | 215 (10.4%) | 440 (21.6%) |
| 10 to 14 Minutes | 152 (7.3%) | 247 (12.1%) |
| 15 to 19 Minutes | 425 (20.5%) | 387 (19.0%) |
| 20 to 24 Minutes | 292 (14.1%) | 403 (19.8%) |
| 25 to 29 Minutes | 198 (9.5%) | 182 (8.9%) |
| 30 to 34 Minutes | 474 (22.8%) | 81 (4.0%) |
| 35 to 39 Minutes | 37 (1.8%) | 35 (1.7%) |
| 40 to 44 Minutes | 17 (0.8%) | 0 (0.0%) |
| 45 to 59 Minutes | 103 (5.0%) | 165 (8.1%) |
| 60 to 89 Minutes | 104 (5.0%) | 52 (2.5%) |
| 90 or more Minutes | 0 (0.0%) | 0 (0.0%) |
Time of Departure to Work by Sex in Fort Oglethorpe
The most frequent times of departure to work in Fort Oglethorpe are 6:30 AM to 6:59 AM (340, 16.4%) for males and 7:00 AM to 7:29 AM (448, 22.0%) for females.
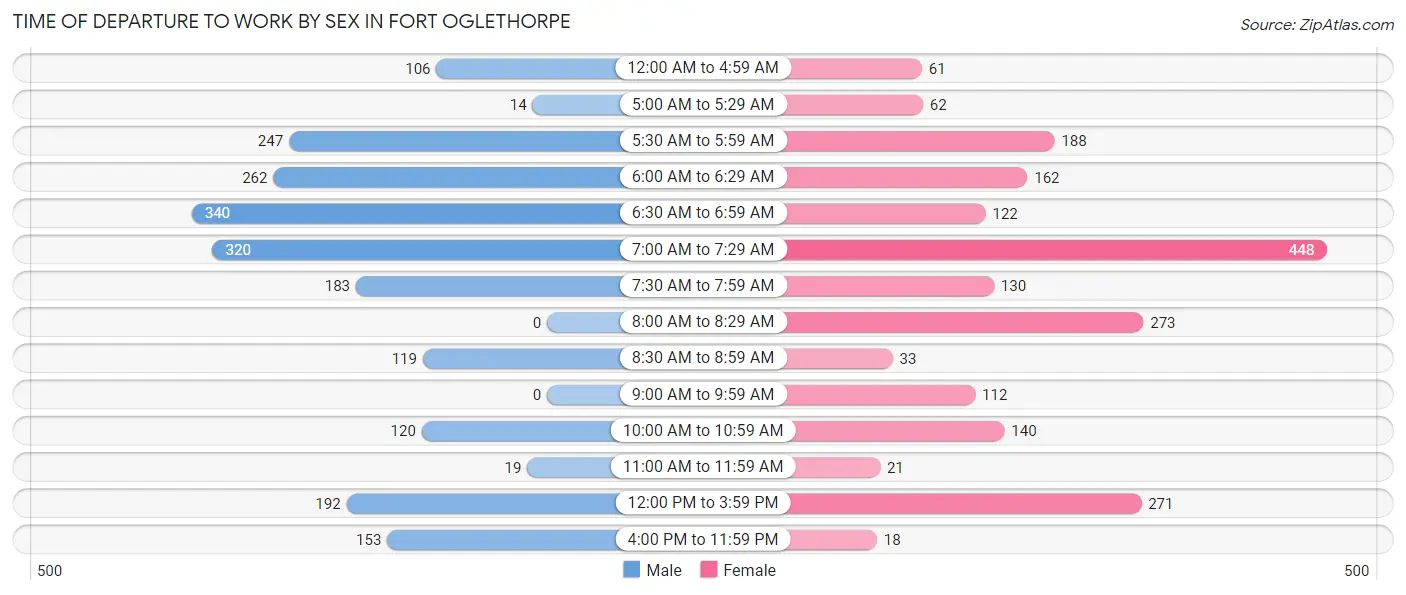
| Time of Departure | Male | Female |
| 12:00 AM to 4:59 AM | 106 (5.1%) | 61 (3.0%) |
| 5:00 AM to 5:29 AM | 14 (0.7%) | 62 (3.0%) |
| 5:30 AM to 5:59 AM | 247 (11.9%) | 188 (9.2%) |
| 6:00 AM to 6:29 AM | 262 (12.6%) | 162 (7.9%) |
| 6:30 AM to 6:59 AM | 340 (16.4%) | 122 (6.0%) |
| 7:00 AM to 7:29 AM | 320 (15.4%) | 448 (22.0%) |
| 7:30 AM to 7:59 AM | 183 (8.8%) | 130 (6.4%) |
| 8:00 AM to 8:29 AM | 0 (0.0%) | 273 (13.4%) |
| 8:30 AM to 8:59 AM | 119 (5.7%) | 33 (1.6%) |
| 9:00 AM to 9:59 AM | 0 (0.0%) | 112 (5.5%) |
| 10:00 AM to 10:59 AM | 120 (5.8%) | 140 (6.9%) |
| 11:00 AM to 11:59 AM | 19 (0.9%) | 21 (1.0%) |
| 12:00 PM to 3:59 PM | 192 (9.2%) | 271 (13.3%) |
| 4:00 PM to 11:59 PM | 153 (7.4%) | 18 (0.9%) |
| Total | 2,075 (100.0%) | 2,041 (100.0%) |
Housing Occupancy in Fort Oglethorpe
Occupancy by Ownership in Fort Oglethorpe
Of the total 4,751 dwellings in Fort Oglethorpe, owner-occupied units account for 2,361 (49.7%), while renter-occupied units make up 2,390 (50.3%).
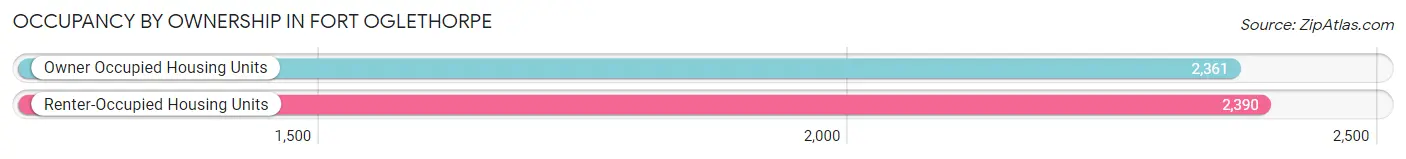
| Occupancy | # Housing Units | % Housing Units |
| Owner Occupied Housing Units | 2,361 | 49.7% |
| Renter-Occupied Housing Units | 2,390 | 50.3% |
| Total Occupied Housing Units | 4,751 | 100.0% |
Occupancy by Household Size in Fort Oglethorpe
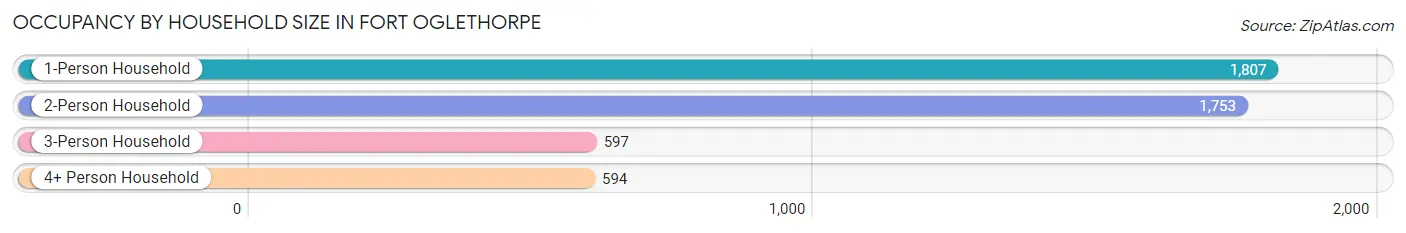
| Household Size | # Housing Units | % Housing Units |
| 1-Person Household | 1,807 | 38.0% |
| 2-Person Household | 1,753 | 36.9% |
| 3-Person Household | 597 | 12.6% |
| 4+ Person Household | 594 | 12.5% |
| Total Housing Units | 4,751 | 100.0% |
Occupancy by Ownership by Household Size in Fort Oglethorpe
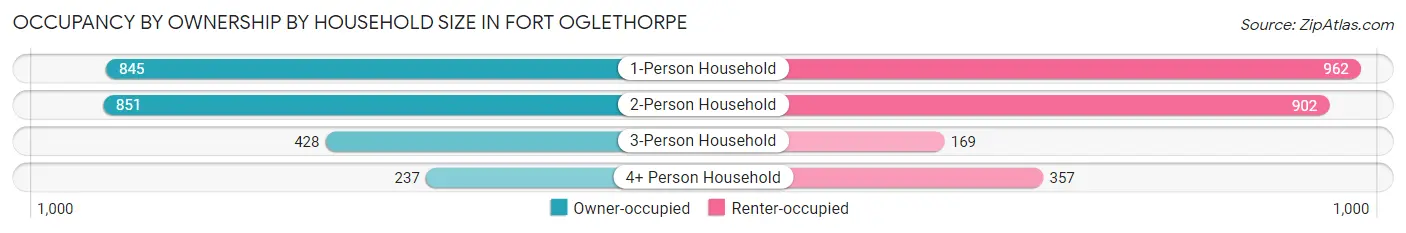
| Household Size | Owner-occupied | Renter-occupied |
| 1-Person Household | 845 (46.8%) | 962 (53.2%) |
| 2-Person Household | 851 (48.5%) | 902 (51.4%) |
| 3-Person Household | 428 (71.7%) | 169 (28.3%) |
| 4+ Person Household | 237 (39.9%) | 357 (60.1%) |
| Total Housing Units | 2,361 (49.7%) | 2,390 (50.3%) |
Occupancy by Educational Attainment in Fort Oglethorpe
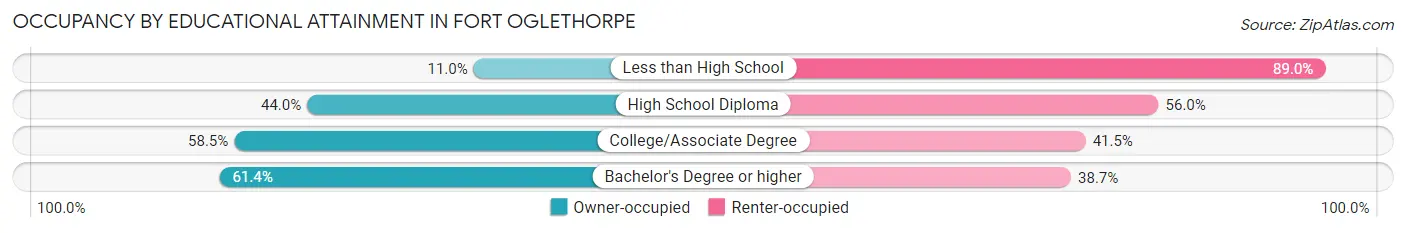
| Household Size | Owner-occupied | Renter-occupied |
| Less than High School | 41 (11.0%) | 332 (89.0%) |
| High School Diploma | 807 (44.0%) | 1,027 (56.0%) |
| College/Associate Degree | 967 (58.5%) | 687 (41.5%) |
| Bachelor's Degree or higher | 546 (61.4%) | 344 (38.7%) |
Occupancy by Age of Householder in Fort Oglethorpe
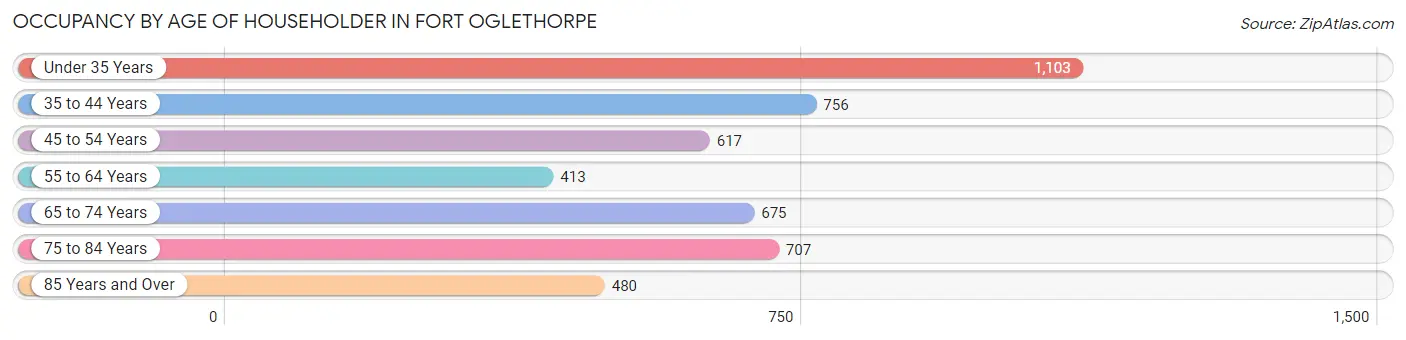
| Age Bracket | # Households | % Households |
| Under 35 Years | 1,103 | 23.2% |
| 35 to 44 Years | 756 | 15.9% |
| 45 to 54 Years | 617 | 13.0% |
| 55 to 64 Years | 413 | 8.7% |
| 65 to 74 Years | 675 | 14.2% |
| 75 to 84 Years | 707 | 14.9% |
| 85 Years and Over | 480 | 10.1% |
| Total | 4,751 | 100.0% |
Housing Finances in Fort Oglethorpe
Median Income by Occupancy in Fort Oglethorpe
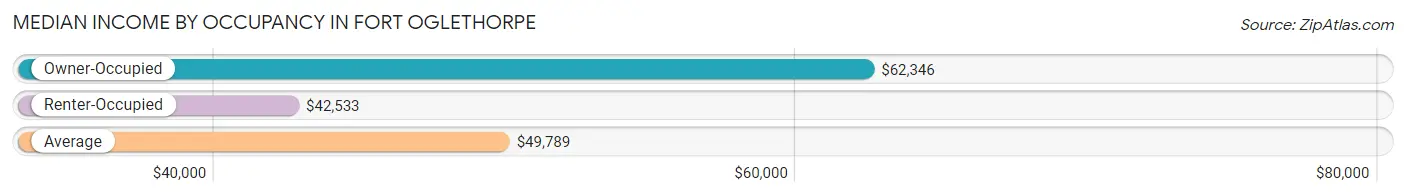
| Occupancy Type | # Households | Median Income |
| Owner-Occupied | 2,361 (49.7%) | $62,346 |
| Renter-Occupied | 2,390 (50.3%) | $42,533 |
| Average | 4,751 (100.0%) | $49,789 |
Occupancy by Householder Income Bracket in Fort Oglethorpe
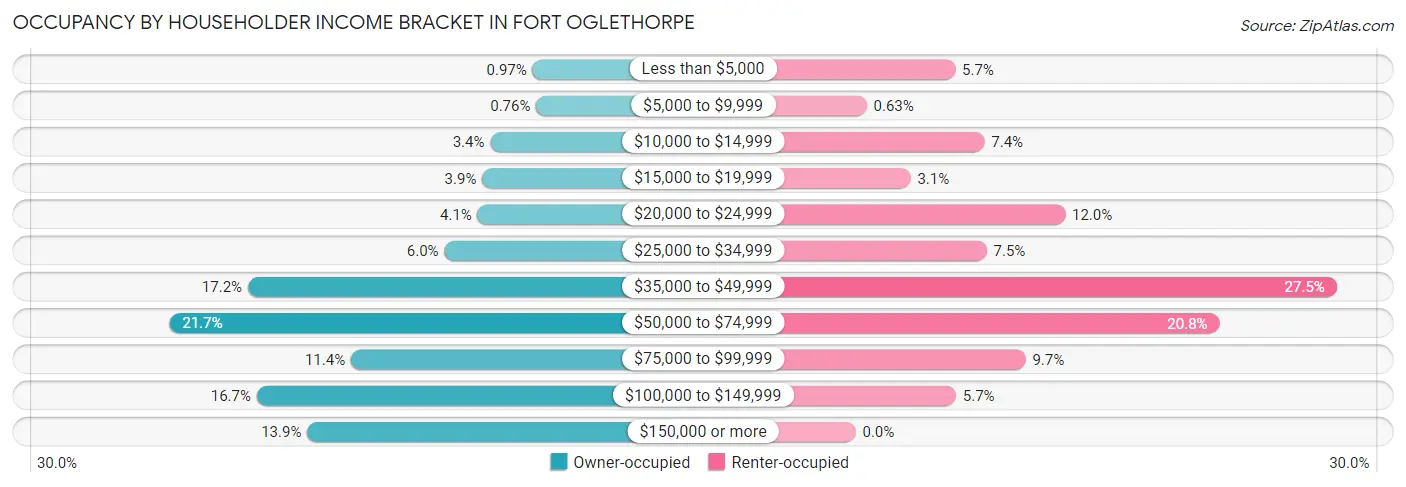
| Income Bracket | Owner-occupied | Renter-occupied |
| Less than $5,000 | 23 (1.0%) | 136 (5.7%) |
| $5,000 to $9,999 | 18 (0.8%) | 15 (0.6%) |
| $10,000 to $14,999 | 80 (3.4%) | 176 (7.4%) |
| $15,000 to $19,999 | 91 (3.8%) | 75 (3.1%) |
| $20,000 to $24,999 | 97 (4.1%) | 286 (12.0%) |
| $25,000 to $34,999 | 142 (6.0%) | 179 (7.5%) |
| $35,000 to $49,999 | 407 (17.2%) | 657 (27.5%) |
| $50,000 to $74,999 | 513 (21.7%) | 497 (20.8%) |
| $75,000 to $99,999 | 268 (11.4%) | 232 (9.7%) |
| $100,000 to $149,999 | 395 (16.7%) | 137 (5.7%) |
| $150,000 or more | 327 (13.9%) | 0 (0.0%) |
| Total | 2,361 (100.0%) | 2,390 (100.0%) |
Monthly Housing Cost Tiers in Fort Oglethorpe
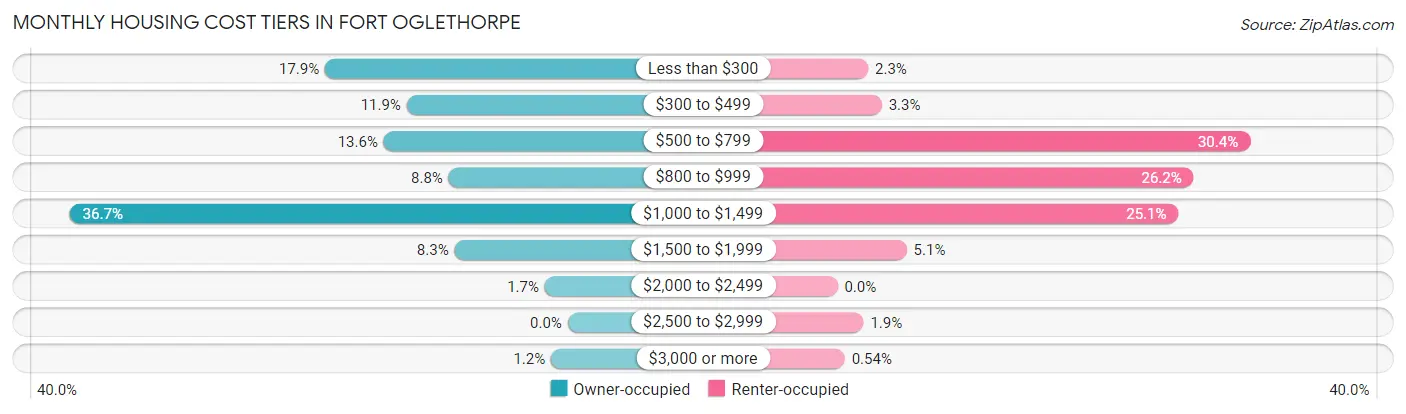
| Monthly Cost | Owner-occupied | Renter-occupied |
| Less than $300 | 422 (17.9%) | 54 (2.3%) |
| $300 to $499 | 280 (11.9%) | 78 (3.3%) |
| $500 to $799 | 320 (13.6%) | 726 (30.4%) |
| $800 to $999 | 207 (8.8%) | 627 (26.2%) |
| $1,000 to $1,499 | 866 (36.7%) | 600 (25.1%) |
| $1,500 to $1,999 | 197 (8.3%) | 122 (5.1%) |
| $2,000 to $2,499 | 40 (1.7%) | 0 (0.0%) |
| $2,500 to $2,999 | 0 (0.0%) | 46 (1.9%) |
| $3,000 or more | 29 (1.2%) | 13 (0.5%) |
| Total | 2,361 (100.0%) | 2,390 (100.0%) |
Physical Housing Characteristics in Fort Oglethorpe
Housing Structures in Fort Oglethorpe
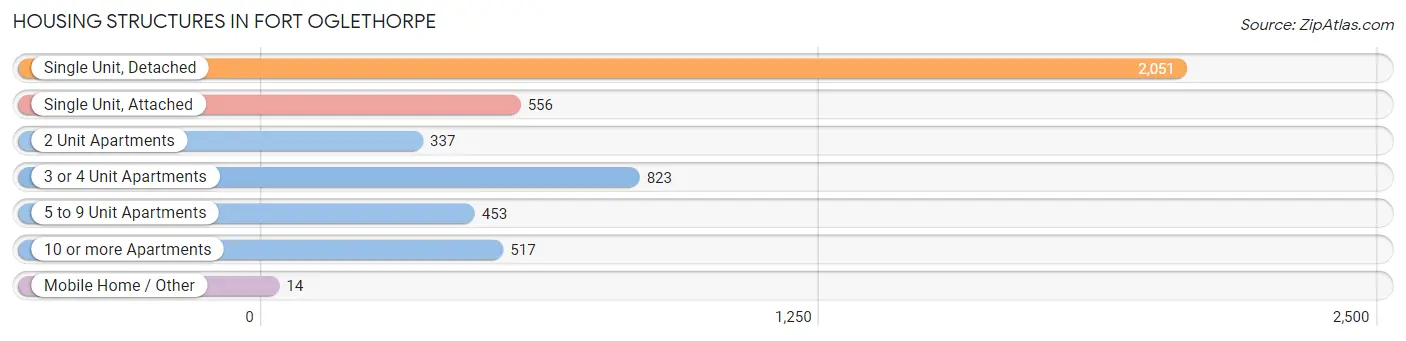
| Structure Type | # Housing Units | % Housing Units |
| Single Unit, Detached | 2,051 | 43.2% |
| Single Unit, Attached | 556 | 11.7% |
| 2 Unit Apartments | 337 | 7.1% |
| 3 or 4 Unit Apartments | 823 | 17.3% |
| 5 to 9 Unit Apartments | 453 | 9.5% |
| 10 or more Apartments | 517 | 10.9% |
| Mobile Home / Other | 14 | 0.3% |
| Total | 4,751 | 100.0% |
Housing Structures by Occupancy in Fort Oglethorpe
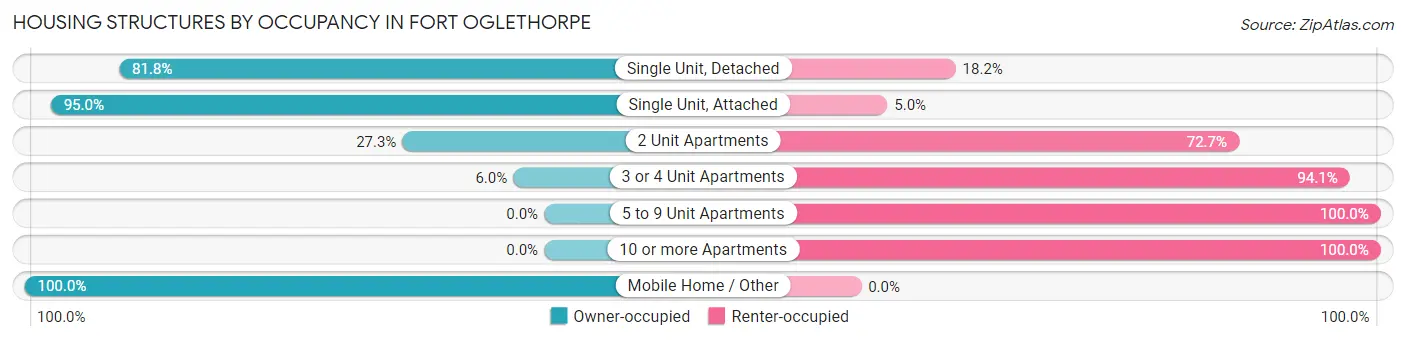
| Structure Type | Owner-occupied | Renter-occupied |
| Single Unit, Detached | 1,678 (81.8%) | 373 (18.2%) |
| Single Unit, Attached | 528 (95.0%) | 28 (5.0%) |
| 2 Unit Apartments | 92 (27.3%) | 245 (72.7%) |
| 3 or 4 Unit Apartments | 49 (5.9%) | 774 (94.1%) |
| 5 to 9 Unit Apartments | 0 (0.0%) | 453 (100.0%) |
| 10 or more Apartments | 0 (0.0%) | 517 (100.0%) |
| Mobile Home / Other | 14 (100.0%) | 0 (0.0%) |
| Total | 2,361 (49.7%) | 2,390 (50.3%) |
Housing Structures by Number of Rooms in Fort Oglethorpe
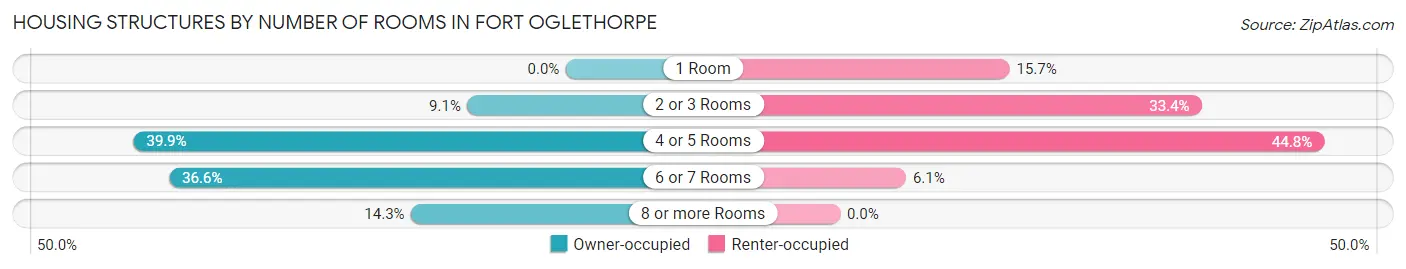
| Number of Rooms | Owner-occupied | Renter-occupied |
| 1 Room | 0 (0.0%) | 375 (15.7%) |
| 2 or 3 Rooms | 215 (9.1%) | 799 (33.4%) |
| 4 or 5 Rooms | 943 (39.9%) | 1,070 (44.8%) |
| 6 or 7 Rooms | 865 (36.6%) | 146 (6.1%) |
| 8 or more Rooms | 338 (14.3%) | 0 (0.0%) |
| Total | 2,361 (100.0%) | 2,390 (100.0%) |
Housing Structure by Heating Type in Fort Oglethorpe
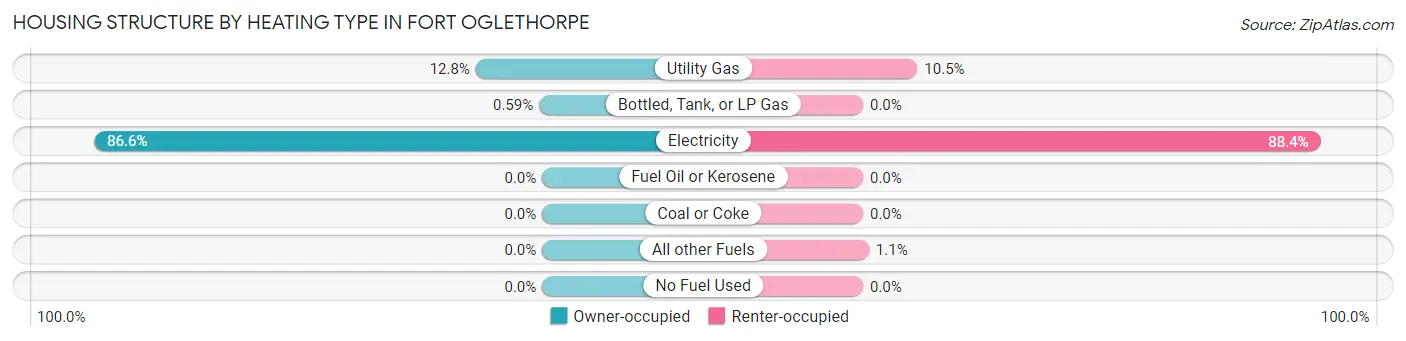
| Heating Type | Owner-occupied | Renter-occupied |
| Utility Gas | 303 (12.8%) | 251 (10.5%) |
| Bottled, Tank, or LP Gas | 14 (0.6%) | 0 (0.0%) |
| Electricity | 2,044 (86.6%) | 2,112 (88.4%) |
| Fuel Oil or Kerosene | 0 (0.0%) | 0 (0.0%) |
| Coal or Coke | 0 (0.0%) | 0 (0.0%) |
| All other Fuels | 0 (0.0%) | 27 (1.1%) |
| No Fuel Used | 0 (0.0%) | 0 (0.0%) |
| Total | 2,361 (100.0%) | 2,390 (100.0%) |
Household Vehicle Usage in Fort Oglethorpe

| Vehicles per Household | Owner-occupied | Renter-occupied |
| No Vehicle | 82 (3.5%) | 520 (21.8%) |
| 1 Vehicle | 844 (35.7%) | 1,323 (55.4%) |
| 2 Vehicles | 791 (33.5%) | 468 (19.6%) |
| 3 or more Vehicles | 644 (27.3%) | 79 (3.3%) |
| Total | 2,361 (100.0%) | 2,390 (100.0%) |
Real Estate & Mortgages in Fort Oglethorpe
Real Estate and Mortgage Overview in Fort Oglethorpe
| Characteristic | Without Mortgage | With Mortgage |
| Housing Units | 871 | 1,490 |
| Median Property Value | $166,100 | $163,100 |
| Median Household Income | $46,250 | $259 |
| Monthly Housing Costs | $310 | $29 |
| Real Estate Taxes | $1,014 | $86 |
Property Value by Mortgage Status in Fort Oglethorpe
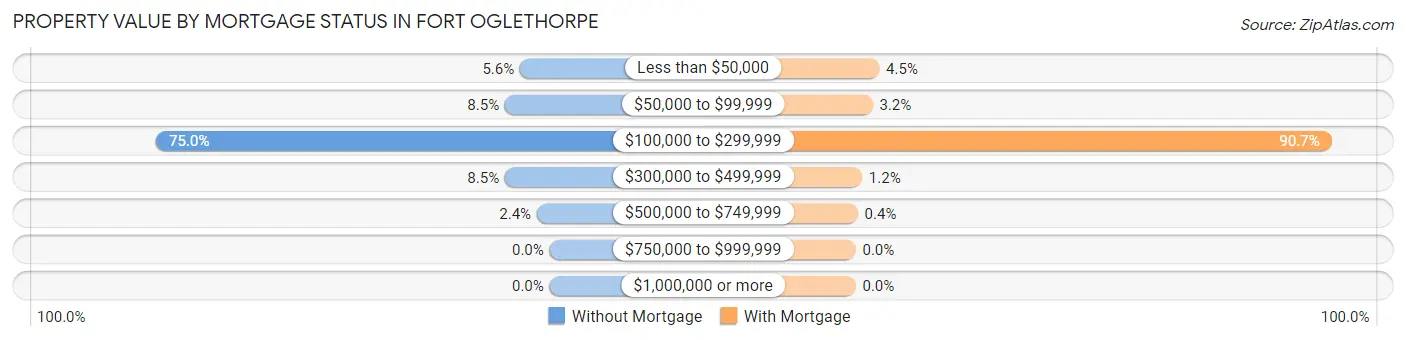
| Property Value | Without Mortgage | With Mortgage |
| Less than $50,000 | 49 (5.6%) | 67 (4.5%) |
| $50,000 to $99,999 | 74 (8.5%) | 48 (3.2%) |
| $100,000 to $299,999 | 653 (75.0%) | 1,351 (90.7%) |
| $300,000 to $499,999 | 74 (8.5%) | 18 (1.2%) |
| $500,000 to $749,999 | 21 (2.4%) | 6 (0.4%) |
| $750,000 to $999,999 | 0 (0.0%) | 0 (0.0%) |
| $1,000,000 or more | 0 (0.0%) | 0 (0.0%) |
| Total | 871 (100.0%) | 1,490 (100.0%) |
Household Income by Mortgage Status in Fort Oglethorpe
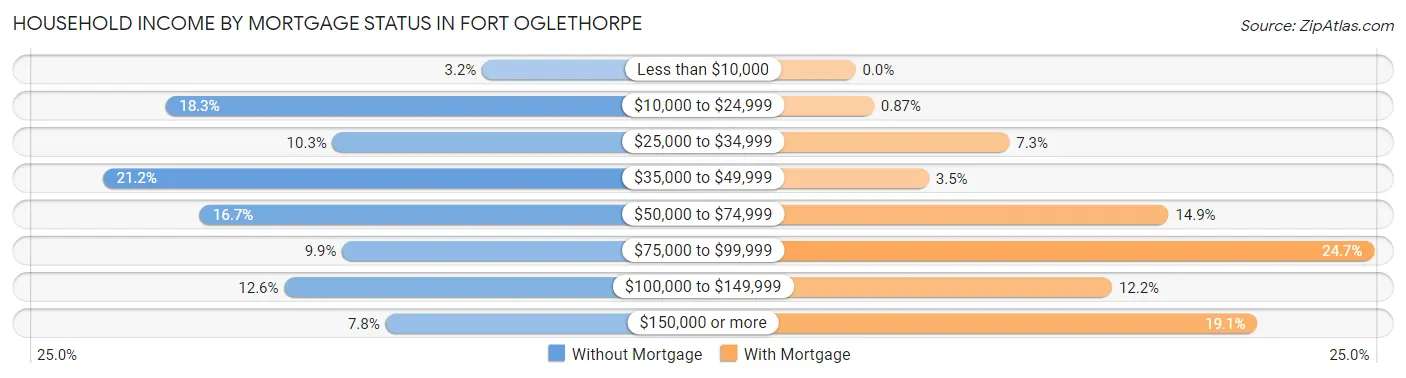
| Household Income | Without Mortgage | With Mortgage |
| Less than $10,000 | 28 (3.2%) | 0 (0.0%) |
| $10,000 to $24,999 | 159 (18.2%) | 13 (0.9%) |
| $25,000 to $34,999 | 90 (10.3%) | 109 (7.3%) |
| $35,000 to $49,999 | 185 (21.2%) | 52 (3.5%) |
| $50,000 to $74,999 | 145 (16.7%) | 222 (14.9%) |
| $75,000 to $99,999 | 86 (9.9%) | 368 (24.7%) |
| $100,000 to $149,999 | 110 (12.6%) | 182 (12.2%) |
| $150,000 or more | 68 (7.8%) | 285 (19.1%) |
| Total | 871 (100.0%) | 1,490 (100.0%) |
Property Value to Household Income Ratio in Fort Oglethorpe
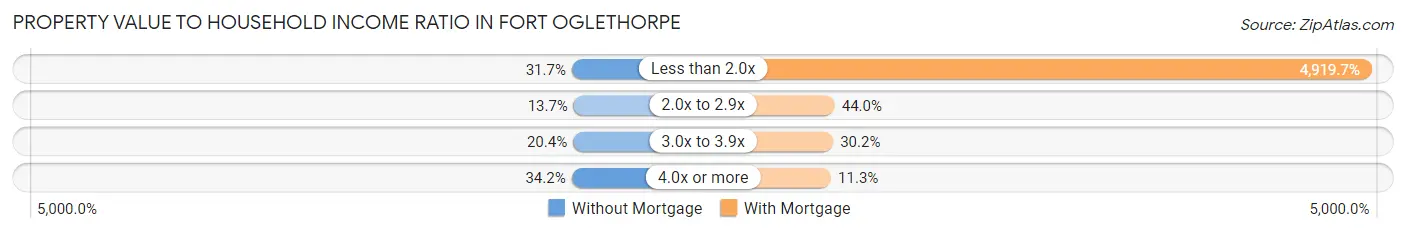
| Value-to-Income Ratio | Without Mortgage | With Mortgage |
| Less than 2.0x | 276 (31.7%) | 73,304 (4,919.7%) |
| 2.0x to 2.9x | 119 (13.7%) | 656 (44.0%) |
| 3.0x to 3.9x | 178 (20.4%) | 450 (30.2%) |
| 4.0x or more | 298 (34.2%) | 168 (11.3%) |
| Total | 871 (100.0%) | 1,490 (100.0%) |
Real Estate Taxes by Mortgage Status in Fort Oglethorpe
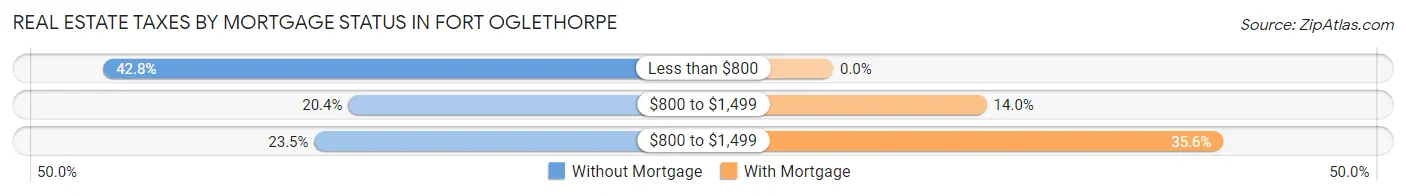
| Property Taxes | Without Mortgage | With Mortgage |
| Less than $800 | 373 (42.8%) | 0 (0.0%) |
| $800 to $1,499 | 178 (20.4%) | 209 (14.0%) |
| $800 to $1,499 | 205 (23.5%) | 531 (35.6%) |
| Total | 871 (100.0%) | 1,490 (100.0%) |
Health & Disability in Fort Oglethorpe
Health Insurance Coverage by Age in Fort Oglethorpe
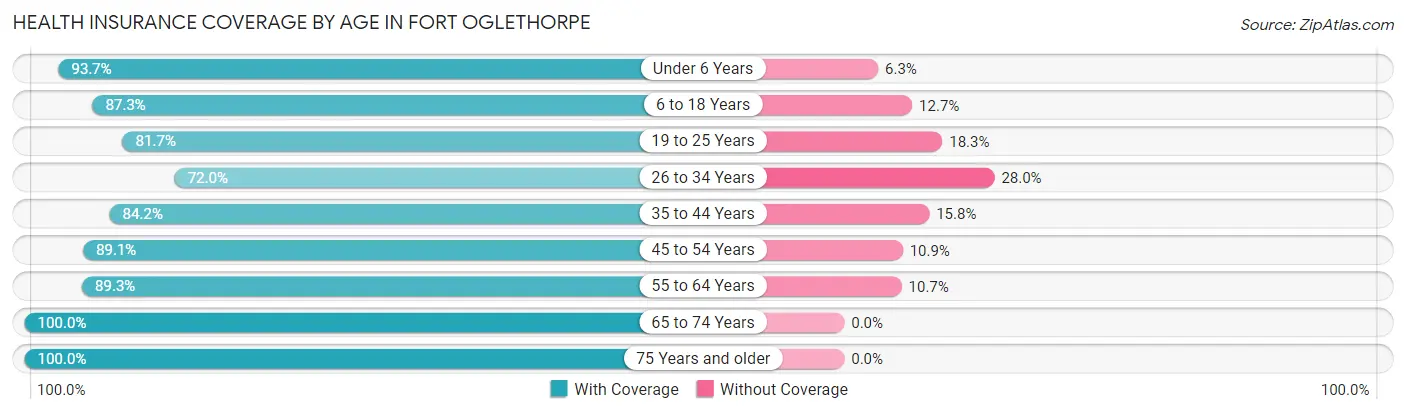
| Age Bracket | With Coverage | Without Coverage |
| Under 6 Years | 446 (93.7%) | 30 (6.3%) |
| 6 to 18 Years | 1,152 (87.3%) | 167 (12.7%) |
| 19 to 25 Years | 760 (81.7%) | 170 (18.3%) |
| 26 to 34 Years | 841 (72.0%) | 327 (28.0%) |
| 35 to 44 Years | 1,174 (84.2%) | 221 (15.8%) |
| 45 to 54 Years | 1,080 (89.1%) | 132 (10.9%) |
| 55 to 64 Years | 643 (89.3%) | 77 (10.7%) |
| 65 to 74 Years | 915 (100.0%) | 0 (0.0%) |
| 75 Years and older | 1,701 (100.0%) | 0 (0.0%) |
| Total | 8,712 (88.6%) | 1,124 (11.4%) |
Health Insurance Coverage by Citizenship Status in Fort Oglethorpe
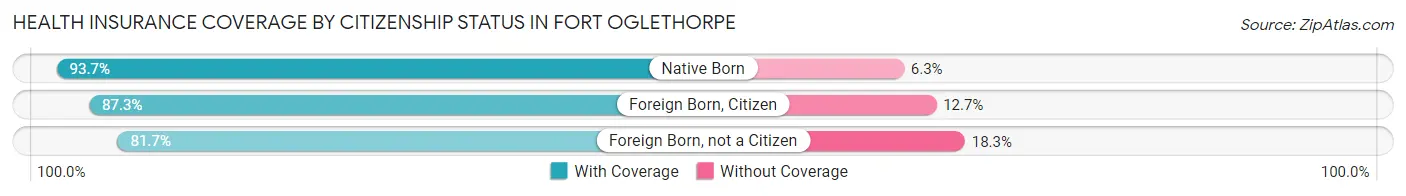
| Citizenship Status | With Coverage | Without Coverage |
| Native Born | 446 (93.7%) | 30 (6.3%) |
| Foreign Born, Citizen | 1,152 (87.3%) | 167 (12.7%) |
| Foreign Born, not a Citizen | 760 (81.7%) | 170 (18.3%) |
Health Insurance Coverage by Household Income in Fort Oglethorpe
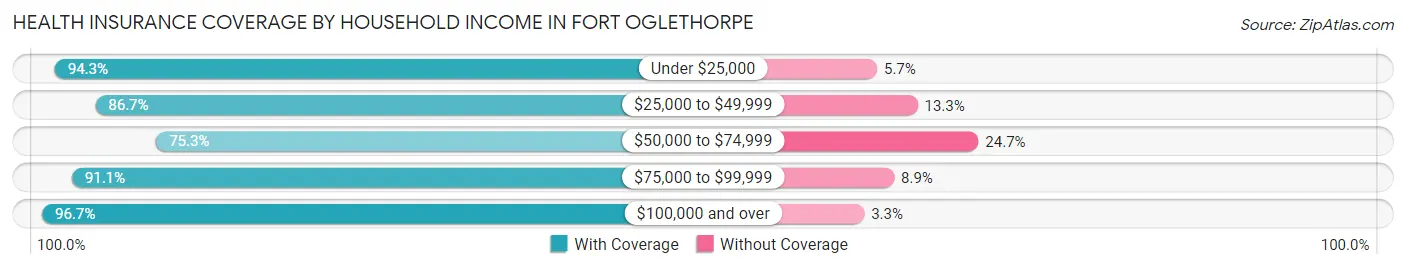
| Household Income | With Coverage | Without Coverage |
| Under $25,000 | 1,331 (94.3%) | 80 (5.7%) |
| $25,000 to $49,999 | 2,002 (86.7%) | 306 (13.3%) |
| $50,000 to $74,999 | 1,586 (75.3%) | 519 (24.7%) |
| $75,000 to $99,999 | 1,389 (91.1%) | 135 (8.9%) |
| $100,000 and over | 2,397 (96.7%) | 81 (3.3%) |
Public vs Private Health Insurance Coverage by Age in Fort Oglethorpe
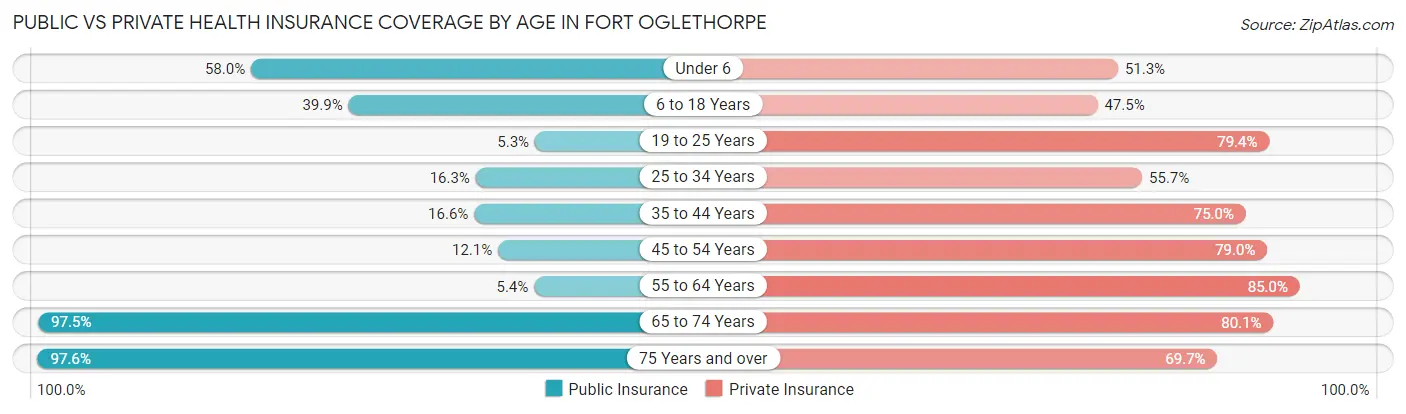
| Age Bracket | Public Insurance | Private Insurance |
| Under 6 | 276 (58.0%) | 244 (51.3%) |
| 6 to 18 Years | 526 (39.9%) | 626 (47.5%) |
| 19 to 25 Years | 49 (5.3%) | 738 (79.3%) |
| 25 to 34 Years | 190 (16.3%) | 651 (55.7%) |
| 35 to 44 Years | 231 (16.6%) | 1,046 (75.0%) |
| 45 to 54 Years | 147 (12.1%) | 957 (79.0%) |
| 55 to 64 Years | 39 (5.4%) | 612 (85.0%) |
| 65 to 74 Years | 892 (97.5%) | 733 (80.1%) |
| 75 Years and over | 1,660 (97.6%) | 1,186 (69.7%) |
| Total | 4,010 (40.8%) | 6,793 (69.1%) |
Disability Status by Sex by Age in Fort Oglethorpe
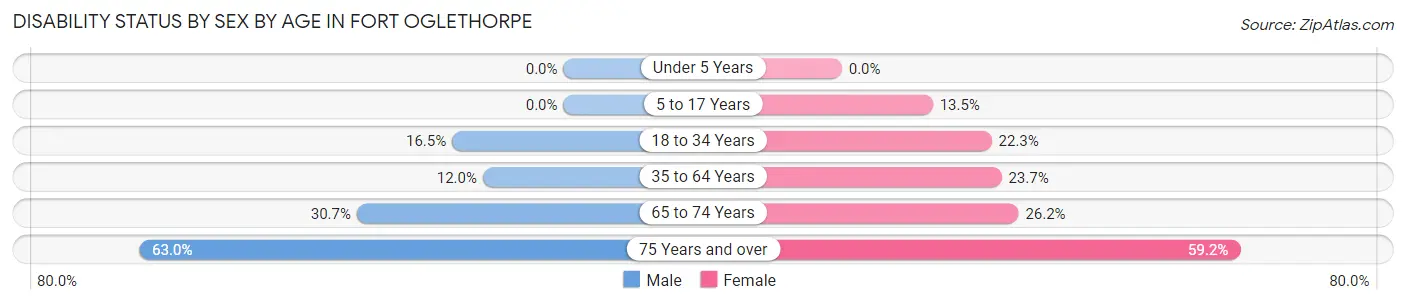
| Age Bracket | Male | Female |
| Under 5 Years | 0 (0.0%) | 0 (0.0%) |
| 5 to 17 Years | 0 (0.0%) | 116 (13.5%) |
| 18 to 34 Years | 204 (16.5%) | 214 (22.3%) |
| 35 to 64 Years | 185 (12.0%) | 422 (23.7%) |
| 65 to 74 Years | 69 (30.7%) | 181 (26.2%) |
| 75 Years and over | 390 (63.0%) | 640 (59.2%) |
Disability Class by Sex by Age in Fort Oglethorpe
Disability Class: Hearing Difficulty
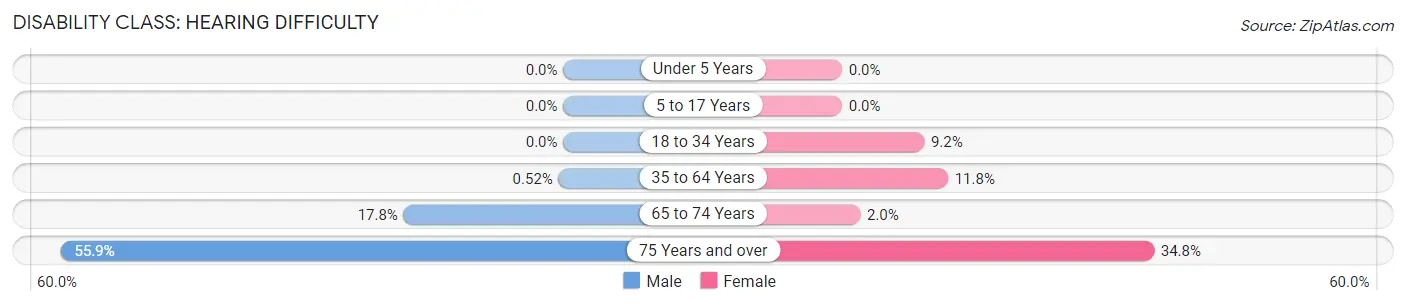
| Age Bracket | Male | Female |
| Under 5 Years | 0 (0.0%) | 0 (0.0%) |
| 5 to 17 Years | 0 (0.0%) | 0 (0.0%) |
| 18 to 34 Years | 0 (0.0%) | 88 (9.1%) |
| 35 to 64 Years | 8 (0.5%) | 210 (11.8%) |
| 65 to 74 Years | 40 (17.8%) | 14 (2.0%) |
| 75 Years and over | 346 (55.9%) | 376 (34.7%) |
Disability Class: Vision Difficulty
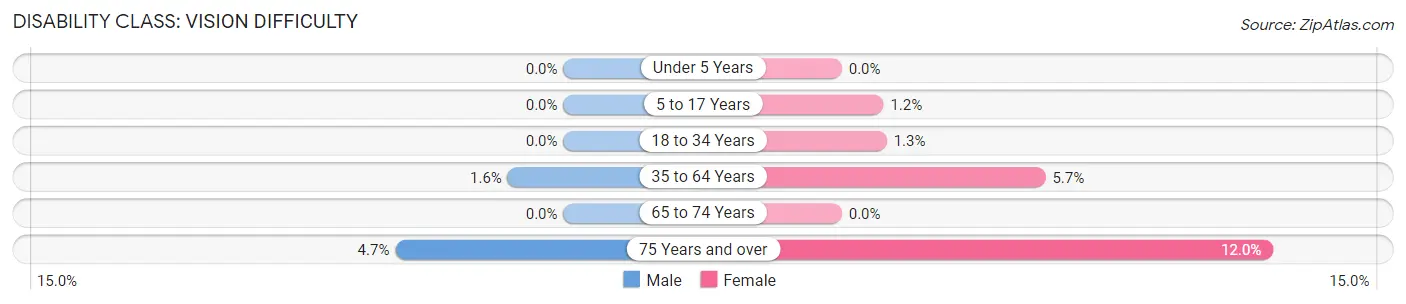
| Age Bracket | Male | Female |
| Under 5 Years | 0 (0.0%) | 0 (0.0%) |
| 5 to 17 Years | 0 (0.0%) | 10 (1.2%) |
| 18 to 34 Years | 0 (0.0%) | 12 (1.3%) |
| 35 to 64 Years | 24 (1.5%) | 101 (5.7%) |
| 65 to 74 Years | 0 (0.0%) | 0 (0.0%) |
| 75 Years and over | 29 (4.7%) | 130 (12.0%) |
Disability Class: Cognitive Difficulty
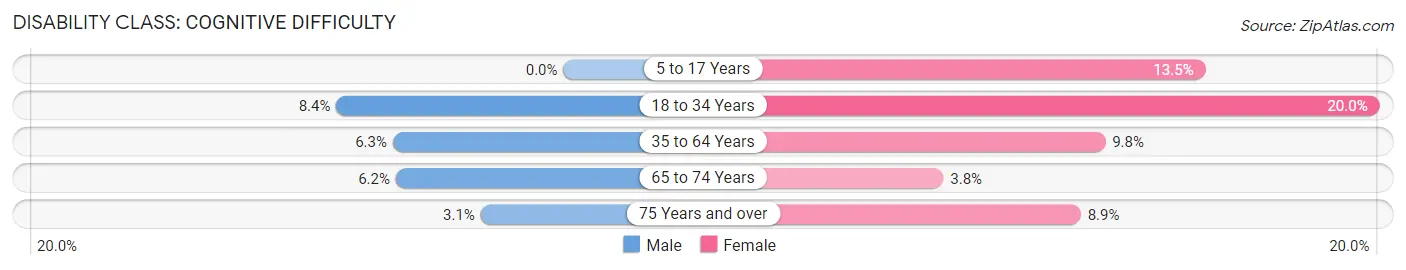
| Age Bracket | Male | Female |
| 5 to 17 Years | 0 (0.0%) | 116 (13.5%) |
| 18 to 34 Years | 104 (8.4%) | 192 (20.0%) |
| 35 to 64 Years | 98 (6.3%) | 174 (9.8%) |
| 65 to 74 Years | 14 (6.2%) | 26 (3.8%) |
| 75 Years and over | 19 (3.1%) | 96 (8.9%) |
Disability Class: Ambulatory Difficulty
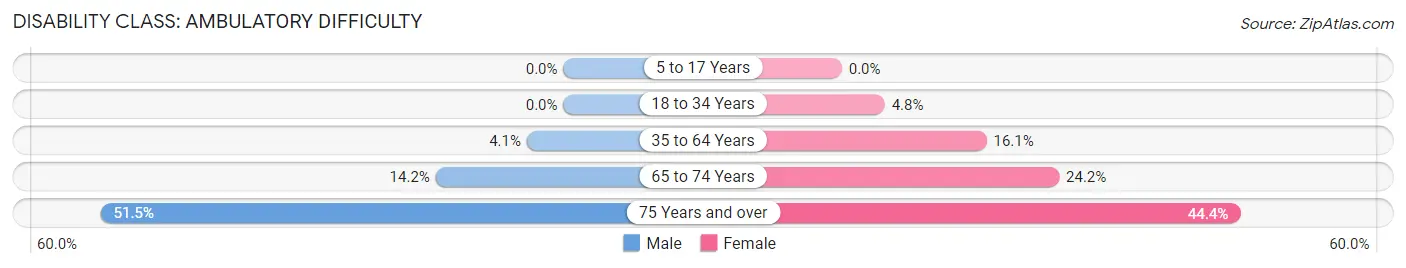
| Age Bracket | Male | Female |
| 5 to 17 Years | 0 (0.0%) | 0 (0.0%) |
| 18 to 34 Years | 0 (0.0%) | 46 (4.8%) |
| 35 to 64 Years | 63 (4.1%) | 287 (16.1%) |
| 65 to 74 Years | 32 (14.2%) | 167 (24.2%) |
| 75 Years and over | 319 (51.5%) | 480 (44.4%) |
Disability Class: Self-Care Difficulty
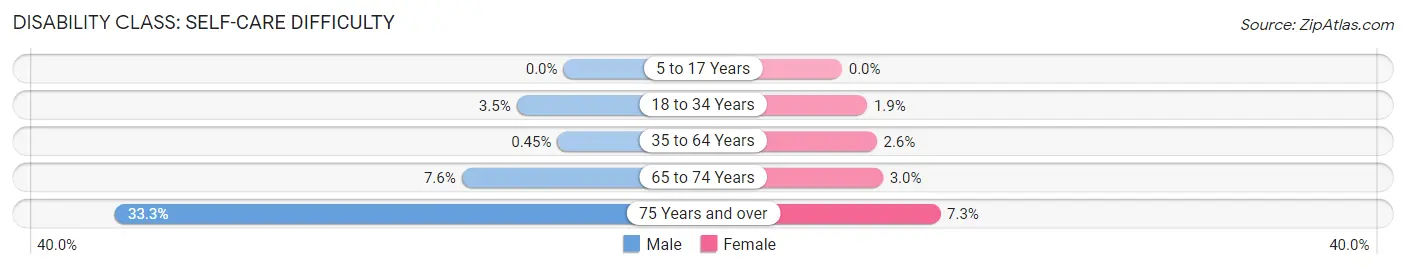
| Age Bracket | Male | Female |
| 5 to 17 Years | 0 (0.0%) | 0 (0.0%) |
| 18 to 34 Years | 43 (3.5%) | 18 (1.9%) |
| 35 to 64 Years | 7 (0.4%) | 46 (2.6%) |
| 65 to 74 Years | 17 (7.6%) | 21 (3.0%) |
| 75 Years and over | 206 (33.3%) | 79 (7.3%) |
Technology Access in Fort Oglethorpe
Computing Device Access in Fort Oglethorpe
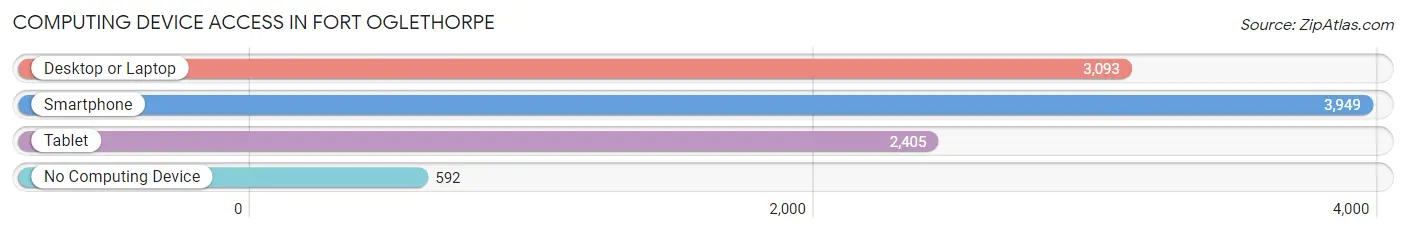
| Device Type | # Households | % Households |
| Desktop or Laptop | 3,093 | 65.1% |
| Smartphone | 3,949 | 83.1% |
| Tablet | 2,405 | 50.6% |
| No Computing Device | 592 | 12.5% |
| Total | 4,751 | 100.0% |
Internet Access in Fort Oglethorpe
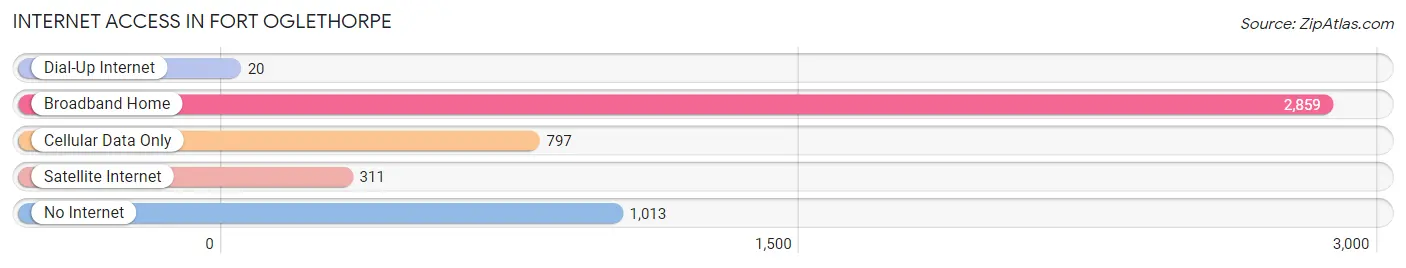
| Internet Type | # Households | % Households |
| Dial-Up Internet | 20 | 0.4% |
| Broadband Home | 2,859 | 60.2% |
| Cellular Data Only | 797 | 16.8% |
| Satellite Internet | 311 | 6.6% |
| No Internet | 1,013 | 21.3% |
| Total | 4,751 | 100.0% |
Fort Oglethorpe Summary
Fort Oglethorpe is a city located in Catoosa County, Georgia, United States. It is part of the Chattanooga, TN–GA Metropolitan Statistical Area. As of the 2010 census, the city had a population of 9,263.
History
Fort Oglethorpe was founded in 1902 as a military post. It was named after James Oglethorpe, the founder of the colony of Georgia. The post was established to protect the settlers of the area from Native American attacks. The post was abandoned in 1906, but the city of Fort Oglethorpe was incorporated in 1910.
During World War I, the post was reactivated and served as a training camp for the United States Army. After the war, the post was again abandoned and the city of Fort Oglethorpe continued to grow.
In the 1930s, the city was the site of a Civilian Conservation Corps camp. During World War II, the post was again reactivated and served as a training camp for the United States Army Air Forces. After the war, the post was again abandoned and the city of Fort Oglethorpe continued to grow.
Geography
Fort Oglethorpe is located in the northwest corner of Catoosa County at 34°56'25" North, 85°14'45" West (34.940278, -85.245833). It is bordered to the north by the city of Chattanooga, Tennessee, and to the south by the city of Rossville, Georgia.
According to the United States Census Bureau, the city has a total area of 8.3 square miles (21.5 km2), of which 8.2 square miles (21.3 km2) is land and 0.1 square miles (0.2 km2) (1.17%) is water.
Economy
The economy of Fort Oglethorpe is largely based on retail and services. The city is home to several large retail stores, including Walmart, Lowe's, and Home Depot. The city also has a variety of restaurants, including fast food, casual dining, and fine dining.
The city is also home to several manufacturing companies, including a Coca-Cola bottling plant and a carpet manufacturing plant. The city is also home to a number of small businesses, including auto repair shops, beauty salons, and medical offices.
Demographics
As of the census of 2000, there were 8,945 people, 3,845 households, and 2,541 families residing in the city. The population density was 1,082.2 people per square mile (417.9/km2). There were 4,093 housing units at an average density of 498.2 per square mile (192.2/km2). The racial makeup of the city was 90.17% White, 6.17% African American, 0.37% Native American, 0.71% Asian, 0.02% Pacific Islander, 1.17% from other races, and 1.50% from two or more races. Hispanic or Latino of any race were 3.17% of the population.
There were 3,845 households, out of which 28.2% had children under the age of 18 living with them, 49.2% were married couples living together, 13.2% had a female householder with no husband present, and 33.3% were non-families. 28.7% of all households were made up of individuals, and 11.7% had someone living alone who was 65 years of age or older. The average household size was 2.32 and the average family size was 2.84.
In the city, the population was spread out, with 22.7% under the age of 18, 8.2% from 18 to 24, 28.7% from 25 to 44, 24.2% from 45 to 64, and 16.2% who were 65 years of age or older. The median age was 38 years. For every 100 females, there were 91.2 males. For every 100 females age 18 and over, there were 87.2 males.
The median income for a household in the city was $32,813, and the median income for a family was $40,938. Males had a median income of $30,917 versus $21,917 for females. The per capita income for the city was $17,945. About 8.2% of families and 11.2% of the population were below the poverty line, including 14.2% of those under age 18 and 8.7% of those age 65 or over.
Common Questions
What is the Total Population of Fort Oglethorpe?
Total Population of Fort Oglethorpe is 10,203.
What is the Total Male Population of Fort Oglethorpe?
Total Male Population of Fort Oglethorpe is 4,498.
What is the Total Female Population of Fort Oglethorpe?
Total Female Population of Fort Oglethorpe is 5,705.
What is the Ratio of Males per 100 Females in Fort Oglethorpe?
There are 78.84 Males per 100 Females in Fort Oglethorpe.
What is the Ratio of Females per 100 Males in Fort Oglethorpe?
There are 126.83 Females per 100 Males in Fort Oglethorpe.
What is the Median Population Age in Fort Oglethorpe?
Median Population Age in Fort Oglethorpe is 43.5 Years.
What is the Average Family Size in Fort Oglethorpe
Average Family Size in Fort Oglethorpe is 2.8 People.
What is the Average Household Size in Fort Oglethorpe
Average Household Size in Fort Oglethorpe is 2.1 People.
What is Per Capita Income in Fort Oglethorpe?
Per Capita income in Fort Oglethorpe is $29,970.
What is the Median Family Income in Fort Oglethorpe?
Median Family Income in Fort Oglethorpe is $65,387.
What is the Median Household income in Fort Oglethorpe?
Median Household Income in Fort Oglethorpe is $49,789.
What is Income or Wage Gap in Fort Oglethorpe?
Income or Wage Gap in Fort Oglethorpe is 14.8%.
Women in Fort Oglethorpe earn 85.2 cents for every dollar earned by a man.
What is Inequality or Gini Index in Fort Oglethorpe?
Inequality or Gini Index in Fort Oglethorpe is 0.39.
How Large is the Labor Force in Fort Oglethorpe?
There are 4,715 People in the Labor Forcein in Fort Oglethorpe.
What is the Percentage of People in the Labor Force in Fort Oglethorpe?
54.3% of People are in the Labor Force in Fort Oglethorpe.
What is the Unemployment Rate in Fort Oglethorpe?
Unemployment Rate in Fort Oglethorpe is 5.9%.