Fair Oaks, GA
Fair Oaks Map
Fair Oaks Overview
9,614
TOTAL POPULATION
4,745
MALE POPULATION
4,869
FEMALE POPULATION
97.45
MALES / 100 FEMALES
102.61
FEMALES / 100 MALES
29.6
MEDIAN AGE
3.7
AVG FAMILY SIZE
3.0
AVG HOUSEHOLD SIZE
$24,626
PER CAPITA INCOME
$58,963
AVG FAMILY INCOME
$57,582
AVG HOUSEHOLD INCOME
20.3%
WAGE / INCOME GAP [ % ]
79.7¢/ $1
WAGE / INCOME GAP [ $ ]
$11,264
FAMILY INCOME DEFICIT
0.44
INEQUALITY / GINI INDEX
5,433
LABOR FORCE [ PEOPLE ]
75.8%
PERCENT IN LABOR FORCE
6.7%
UNEMPLOYMENT RATE
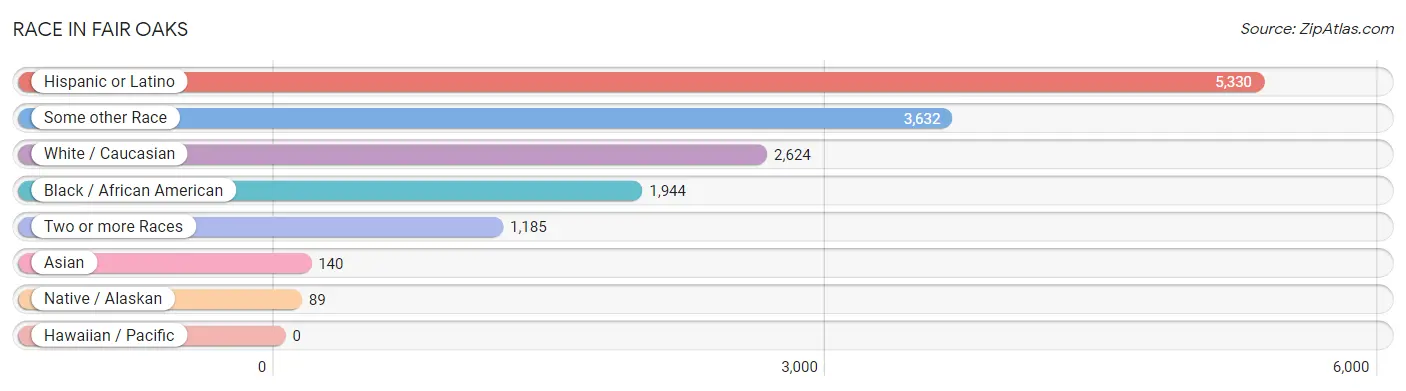
Race in Fair Oaks
The most populous races in Fair Oaks are Hispanic or Latino (5,330 | 55.4%), Some other Race (3,632 | 37.8%), and White / Caucasian (2,624 | 27.3%).
| Race | # Population | % Population |
| Asian | 140 | 1.5% |
| Black / African American | 1,944 | 20.2% |
| Hawaiian / Pacific | 0 | 0.0% |
| Hispanic or Latino | 5,330 | 55.4% |
| Native / Alaskan | 89 | 0.9% |
| White / Caucasian | 2,624 | 27.3% |
| Two or more Races | 1,185 | 12.3% |
| Some other Race | 3,632 | 37.8% |
| Total | 9,614 | 100.0% |
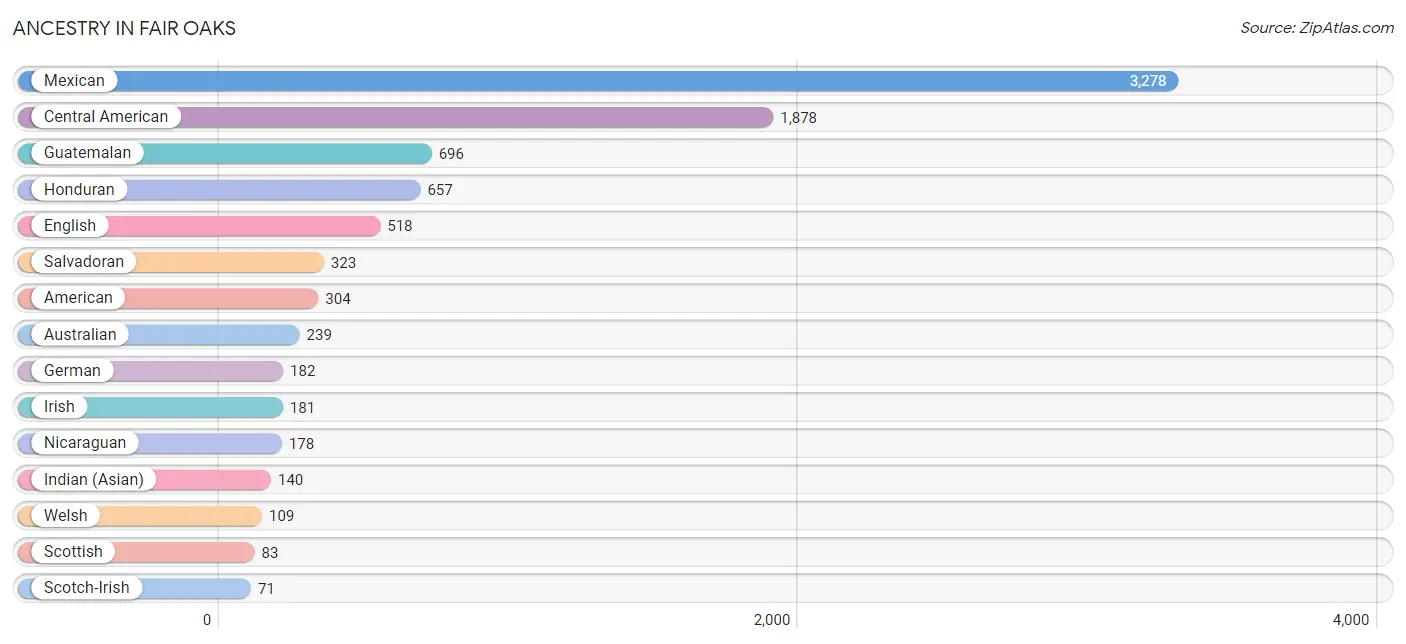
Ancestry in Fair Oaks
The most populous ancestries reported in Fair Oaks are Mexican (3,278 | 34.1%), Central American (1,878 | 19.5%), Guatemalan (696 | 7.2%), Honduran (657 | 6.8%), and English (518 | 5.4%), together accounting for 73.1% of all Fair Oaks residents.
| Ancestry | # Population | % Population |
| Albanian | 28 | 0.3% |
| American | 304 | 3.2% |
| Australian | 239 | 2.5% |
| Barbadian | 13 | 0.1% |
| British | 6 | 0.1% |
| Central American | 1,878 | 19.5% |
| Choctaw | 6 | 0.1% |
| Costa Rican | 11 | 0.1% |
| Croatian | 12 | 0.1% |
| Ecuadorian | 56 | 0.6% |
| English | 518 | 5.4% |
| European | 8 | 0.1% |
| French | 21 | 0.2% |
| German | 182 | 1.9% |
| Guatemalan | 696 | 7.2% |
| Guyanese | 13 | 0.1% |
| Haitian | 41 | 0.4% |
| Honduran | 657 | 6.8% |
| Indian (Asian) | 140 | 1.5% |
| Irish | 181 | 1.9% |
| Italian | 60 | 0.6% |
| Jamaican | 44 | 0.5% |
| Korean | 11 | 0.1% |
| Mexican | 3,278 | 34.1% |
| Nicaraguan | 178 | 1.8% |
| Nigerian | 13 | 0.1% |
| Norwegian | 30 | 0.3% |
| Panamanian | 13 | 0.1% |
| Puerto Rican | 64 | 0.7% |
| Romanian | 29 | 0.3% |
| Russian | 9 | 0.1% |
| Salvadoran | 323 | 3.4% |
| Scotch-Irish | 71 | 0.7% |
| Scottish | 83 | 0.9% |
| Serbian | 13 | 0.1% |
| South American | 56 | 0.6% |
| Spaniard | 11 | 0.1% |
| Spanish | 33 | 0.3% |
| Subsaharan African | 13 | 0.1% |
| Thai | 28 | 0.3% |
| Welsh | 109 | 1.1% |
| West Indian | 28 | 0.3% | View All 42 Rows |
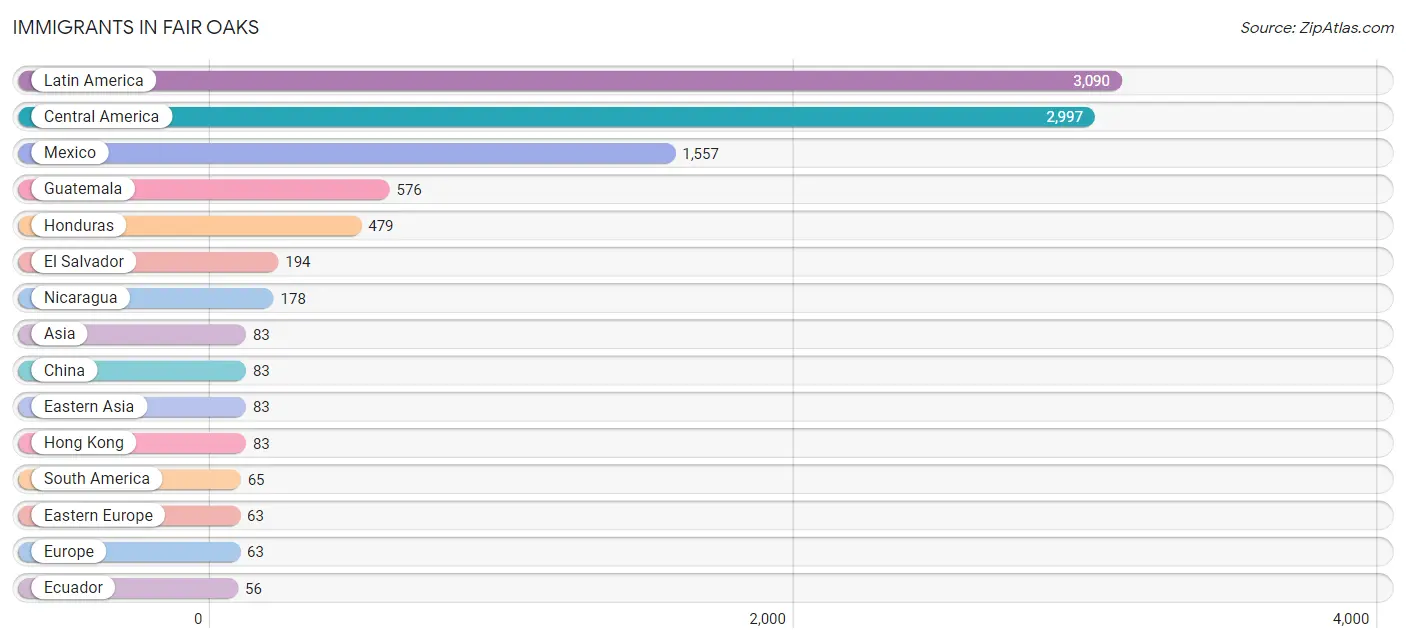
Immigrants in Fair Oaks
The most numerous immigrant groups reported in Fair Oaks came from Latin America (3,090 | 32.1%), Central America (2,997 | 31.2%), Mexico (1,557 | 16.2%), Guatemala (576 | 6.0%), and Honduras (479 | 5.0%), together accounting for 90.5% of all Fair Oaks residents.
| Immigration Origin | # Population | % Population |
| Africa | 42 | 0.4% |
| Asia | 83 | 0.9% |
| Brazil | 9 | 0.1% |
| Caribbean | 28 | 0.3% |
| Central America | 2,997 | 31.2% |
| China | 83 | 0.9% |
| Croatia | 12 | 0.1% |
| Eastern Asia | 83 | 0.9% |
| Eastern Europe | 63 | 0.7% |
| Ecuador | 56 | 0.6% |
| El Salvador | 194 | 2.0% |
| Europe | 63 | 0.7% |
| Guatemala | 576 | 6.0% |
| Honduras | 479 | 5.0% |
| Hong Kong | 83 | 0.9% |
| Jamaica | 28 | 0.3% |
| Latin America | 3,090 | 32.1% |
| Mexico | 1,557 | 16.2% |
| Moldova | 29 | 0.3% |
| Nicaragua | 178 | 1.8% |
| Nigeria | 42 | 0.4% |
| Panama | 13 | 0.1% |
| Serbia | 22 | 0.2% |
| South America | 65 | 0.7% |
| Western Africa | 42 | 0.4% | View All 25 Rows |
Sex and Age in Fair Oaks
Sex and Age in Fair Oaks
The most populous age groups in Fair Oaks are 25 to 29 Years (513 | 10.8%) for men and 20 to 24 Years (560 | 11.5%) for women.
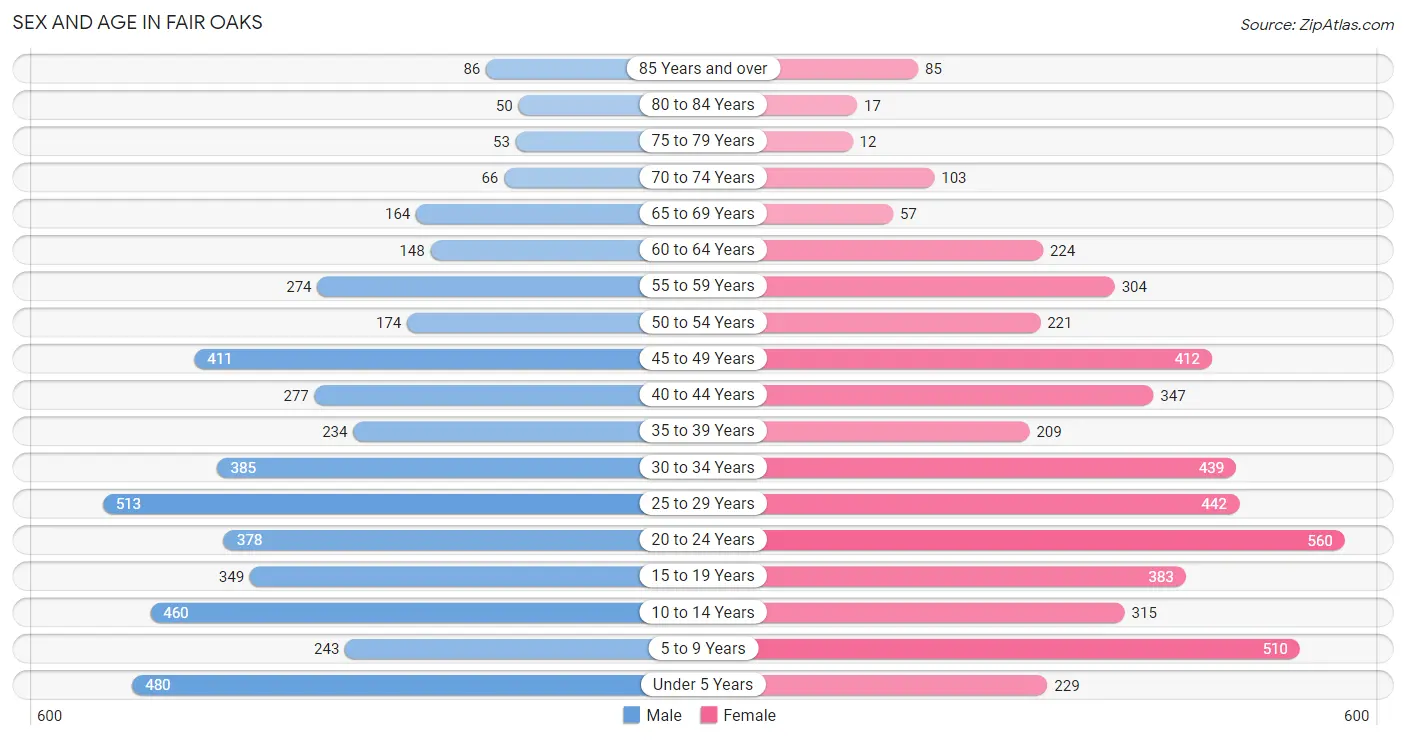
| Age Bracket | Male | Female |
| Under 5 Years | 480 (10.1%) | 229 (4.7%) |
| 5 to 9 Years | 243 (5.1%) | 510 (10.5%) |
| 10 to 14 Years | 460 (9.7%) | 315 (6.5%) |
| 15 to 19 Years | 349 (7.4%) | 383 (7.9%) |
| 20 to 24 Years | 378 (8.0%) | 560 (11.5%) |
| 25 to 29 Years | 513 (10.8%) | 442 (9.1%) |
| 30 to 34 Years | 385 (8.1%) | 439 (9.0%) |
| 35 to 39 Years | 234 (4.9%) | 209 (4.3%) |
| 40 to 44 Years | 277 (5.8%) | 347 (7.1%) |
| 45 to 49 Years | 411 (8.7%) | 412 (8.5%) |
| 50 to 54 Years | 174 (3.7%) | 221 (4.5%) |
| 55 to 59 Years | 274 (5.8%) | 304 (6.2%) |
| 60 to 64 Years | 148 (3.1%) | 224 (4.6%) |
| 65 to 69 Years | 164 (3.5%) | 57 (1.2%) |
| 70 to 74 Years | 66 (1.4%) | 103 (2.1%) |
| 75 to 79 Years | 53 (1.1%) | 12 (0.3%) |
| 80 to 84 Years | 50 (1.1%) | 17 (0.4%) |
| 85 Years and over | 86 (1.8%) | 85 (1.8%) |
| Total | 4,745 (100.0%) | 4,869 (100.0%) |
Families and Households in Fair Oaks
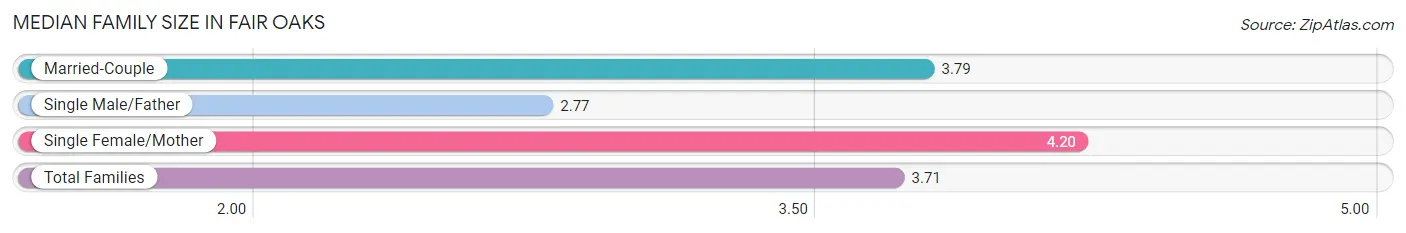
Median Family Size in Fair Oaks
The median family size in Fair Oaks is 3.71 persons per family, with single female/mother families (526 | 26.4%) accounting for the largest median family size of 4.2 persons per family. On the other hand, single male/father families (363 | 18.2%) represent the smallest median family size with 2.77 persons per family.
| Family Type | # Families | Family Size |
| Married-Couple | 1,101 (55.3%) | 3.79 |
| Single Male/Father | 363 (18.2%) | 2.77 |
| Single Female/Mother | 526 (26.4%) | 4.20 |
| Total Families | 1,990 (100.0%) | 3.71 |
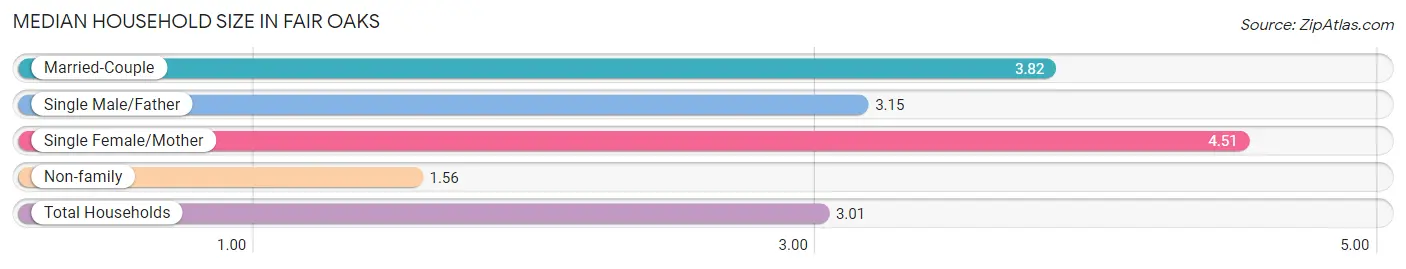
Median Household Size in Fair Oaks
The median household size in Fair Oaks is 3.01 persons per household, with single female/mother households (526 | 16.5%) accounting for the largest median household size of 4.51 persons per household. non-family households (1,199 | 37.6%) represent the smallest median household size with 1.56 persons per household.
| Household Type | # Households | Household Size |
| Married-Couple | 1,101 (34.5%) | 3.82 |
| Single Male/Father | 363 (11.4%) | 3.15 |
| Single Female/Mother | 526 (16.5%) | 4.51 |
| Non-family | 1,199 (37.6%) | 1.56 |
| Total Households | 3,189 (100.0%) | 3.01 |
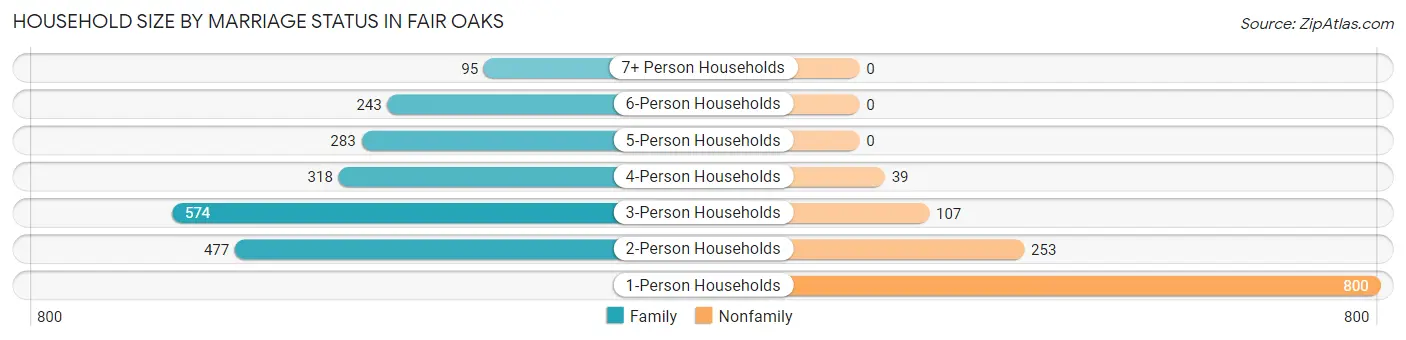
Household Size by Marriage Status in Fair Oaks
Out of a total of 3,189 households in Fair Oaks, 1,990 (62.4%) are family households, while 1,199 (37.6%) are nonfamily households. The most numerous type of family households are 3-person households, comprising 574, and the most common type of nonfamily households are 1-person households, comprising 800.
| Household Size | Family Households | Nonfamily Households |
| 1-Person Households | - | 800 (25.1%) |
| 2-Person Households | 477 (15.0%) | 253 (7.9%) |
| 3-Person Households | 574 (18.0%) | 107 (3.4%) |
| 4-Person Households | 318 (10.0%) | 39 (1.2%) |
| 5-Person Households | 283 (8.9%) | 0 (0.0%) |
| 6-Person Households | 243 (7.6%) | 0 (0.0%) |
| 7+ Person Households | 95 (3.0%) | 0 (0.0%) |
| Total | 1,990 (62.4%) | 1,199 (37.6%) |
Female Fertility in Fair Oaks
Fertility by Age in Fair Oaks
Average fertility rate in Fair Oaks is 27.0 births per 1,000 women. Women in the age bracket of 15 to 19 years have the highest fertility rate with 86.0 births per 1,000 women. Women in the age bracket of 20 to 34 years acount for 57.1% of all women with births.
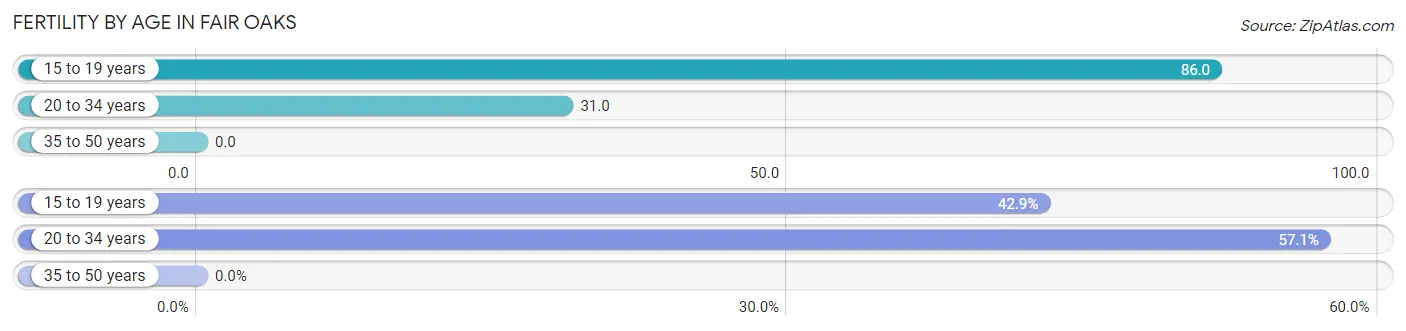
| Age Bracket | Women with Births | Births / 1,000 Women |
| 15 to 19 years | 33 (42.9%) | 86.0 |
| 20 to 34 years | 44 (57.1%) | 31.0 |
| 35 to 50 years | 0 (0.0%) | 0.0 |
| Total | 77 (100.0%) | 27.0 |
Fertility by Age by Marriage Status in Fair Oaks
24.7% of women with births (77) in Fair Oaks are married. The highest percentage of unmarried women with births falls into 20 to 34 years age bracket with 100.0% of them unmarried at the time of birth, while the lowest percentage of unmarried women with births belong to 15 to 19 years age bracket with 42.4% of them unmarried.
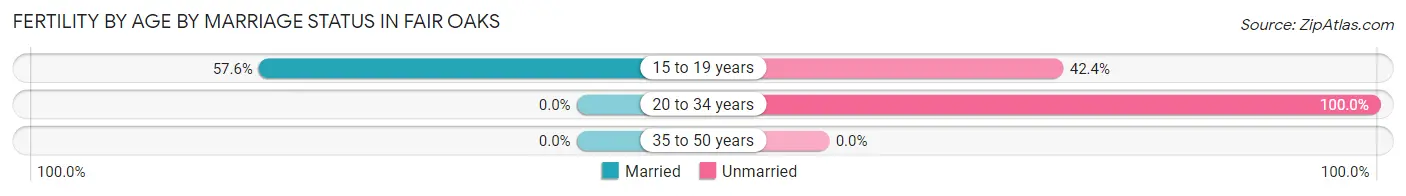
| Age Bracket | Married | Unmarried |
| 15 to 19 years | 19 (57.6%) | 14 (42.4%) |
| 20 to 34 years | 0 (0.0%) | 44 (100.0%) |
| 35 to 50 years | 0 (0.0%) | 0 (0.0%) |
| Total | 19 (24.7%) | 58 (75.3%) |
Fertility by Education in Fair Oaks
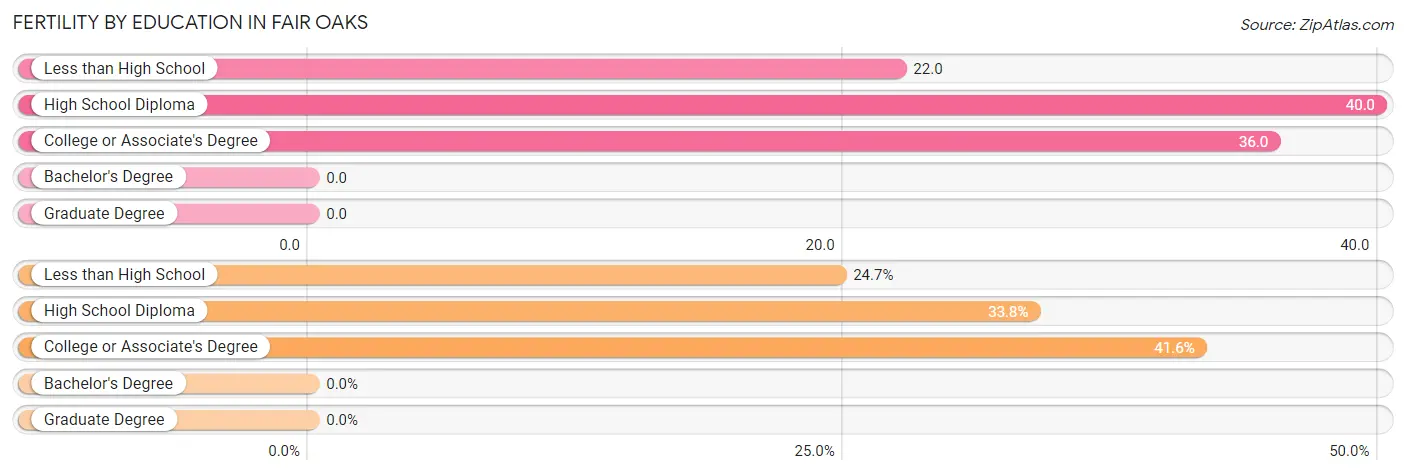
| Educational Attainment | Women with Births | Births / 1,000 Women |
| Less than High School | 19 (24.7%) | 22.0 |
| High School Diploma | 26 (33.8%) | 40.0 |
| College or Associate's Degree | 32 (41.6%) | 36.0 |
| Bachelor's Degree | 0 (0.0%) | 0.0 |
| Graduate Degree | 0 (0.0%) | 0.0 |
| Total | 77 (100.0%) | 27.0 |
Fertility by Education by Marriage Status in Fair Oaks
75.3% of women with births in Fair Oaks are unmarried. Women with the educational attainment of less than high school are most likely to be married with 100.0% of them married at childbirth, while women with the educational attainment of high school diploma are least likely to be married with 100.0% of them unmarried at childbirth.
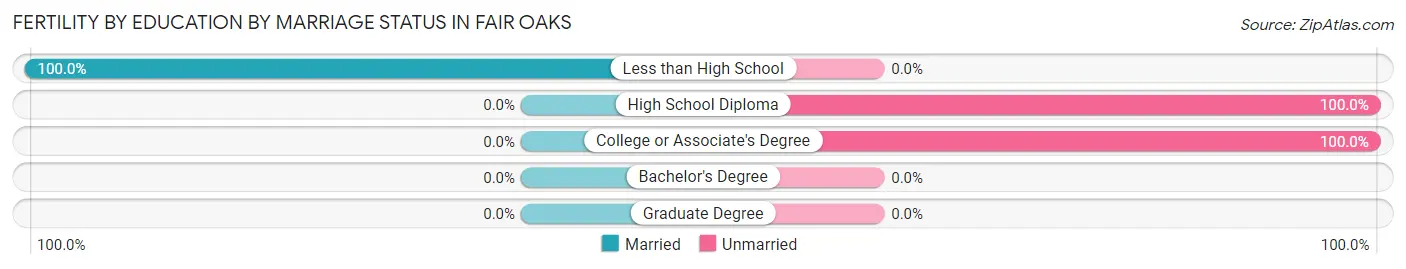
| Educational Attainment | Married | Unmarried |
| Less than High School | 19 (100.0%) | 0 (0.0%) |
| High School Diploma | 0 (0.0%) | 26 (100.0%) |
| College or Associate's Degree | 0 (0.0%) | 32 (100.0%) |
| Bachelor's Degree | 0 (0.0%) | 0 (0.0%) |
| Graduate Degree | 0 (0.0%) | 0 (0.0%) |
| Total | 19 (24.7%) | 58 (75.3%) |
Income in Fair Oaks
Income Overview in Fair Oaks
Per Capita Income in Fair Oaks is $24,626, while median incomes of families and households are $58,963 and $57,582 respectively.
| Characteristic | Number | Measure |
| Per Capita Income | 9,614 | $24,626 |
| Median Family Income | 1,990 | $58,963 |
| Mean Family Income | 1,990 | $82,364 |
| Median Household Income | 3,189 | $57,582 |
| Mean Household Income | 3,189 | $74,535 |
| Income Deficit | 1,990 | $11,264 |
| Wage / Income Gap (%) | 9,614 | 20.33% |
| Wage / Income Gap ($) | 9,614 | 79.67¢ per $1 |
| Gini / Inequality Index | 9,614 | 0.44 |
Earnings by Sex in Fair Oaks
Average Earnings in Fair Oaks are $28,721, $31,681 for men and $25,239 for women, a difference of 20.3%.
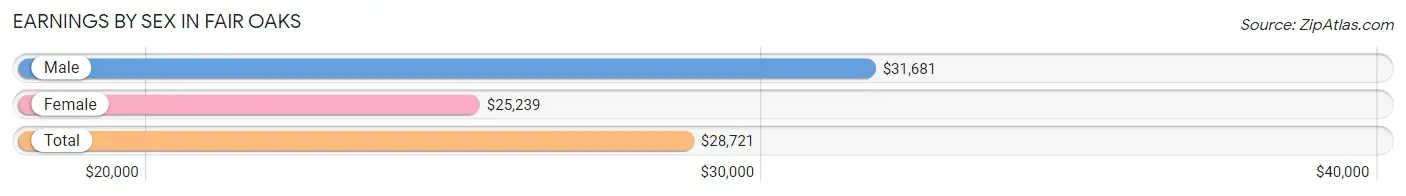
| Sex | Number | Average Earnings |
| Male | 2,896 (53.3%) | $31,681 |
| Female | 2,539 (46.7%) | $25,239 |
| Total | 5,435 (100.0%) | $28,721 |
Earnings by Sex by Income Bracket in Fair Oaks
The most common earnings brackets in Fair Oaks are $25,000 to $29,999 for men (469 | 16.2%) and $25,000 to $29,999 for women (348 | 13.7%).
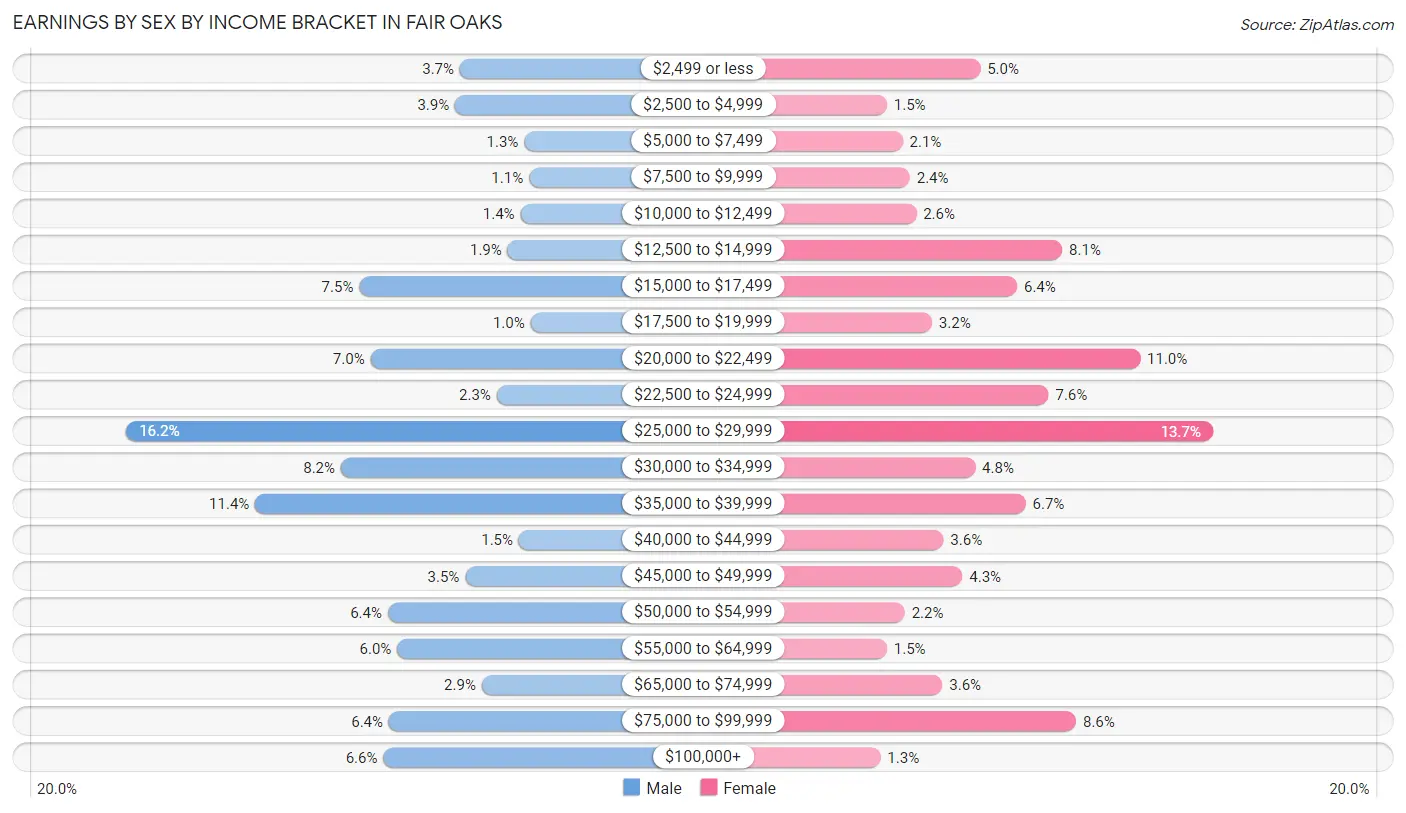
| Income | Male | Female |
| $2,499 or less | 107 (3.7%) | 127 (5.0%) |
| $2,500 to $4,999 | 112 (3.9%) | 38 (1.5%) |
| $5,000 to $7,499 | 37 (1.3%) | 53 (2.1%) |
| $7,500 to $9,999 | 32 (1.1%) | 60 (2.4%) |
| $10,000 to $12,499 | 41 (1.4%) | 66 (2.6%) |
| $12,500 to $14,999 | 55 (1.9%) | 205 (8.1%) |
| $15,000 to $17,499 | 216 (7.5%) | 162 (6.4%) |
| $17,500 to $19,999 | 30 (1.0%) | 81 (3.2%) |
| $20,000 to $22,499 | 204 (7.0%) | 279 (11.0%) |
| $22,500 to $24,999 | 67 (2.3%) | 192 (7.6%) |
| $25,000 to $29,999 | 469 (16.2%) | 348 (13.7%) |
| $30,000 to $34,999 | 236 (8.2%) | 122 (4.8%) |
| $35,000 to $39,999 | 329 (11.4%) | 170 (6.7%) |
| $40,000 to $44,999 | 43 (1.5%) | 92 (3.6%) |
| $45,000 to $49,999 | 101 (3.5%) | 110 (4.3%) |
| $50,000 to $54,999 | 185 (6.4%) | 55 (2.2%) |
| $55,000 to $64,999 | 175 (6.0%) | 38 (1.5%) |
| $65,000 to $74,999 | 83 (2.9%) | 91 (3.6%) |
| $75,000 to $99,999 | 184 (6.4%) | 218 (8.6%) |
| $100,000+ | 190 (6.6%) | 32 (1.3%) |
| Total | 2,896 (100.0%) | 2,539 (100.0%) |
Earnings by Sex by Educational Attainment in Fair Oaks
Average earnings in Fair Oaks are $35,131 for men and $28,346 for women, a difference of 19.3%. Men with an educational attainment of bachelor's degree enjoy the highest average annual earnings of $58,194, while those with high school diploma education earn the least with $28,643. Women with an educational attainment of bachelor's degree earn the most with the average annual earnings of $41,302, while those with less than high school education have the smallest earnings of $20,931.
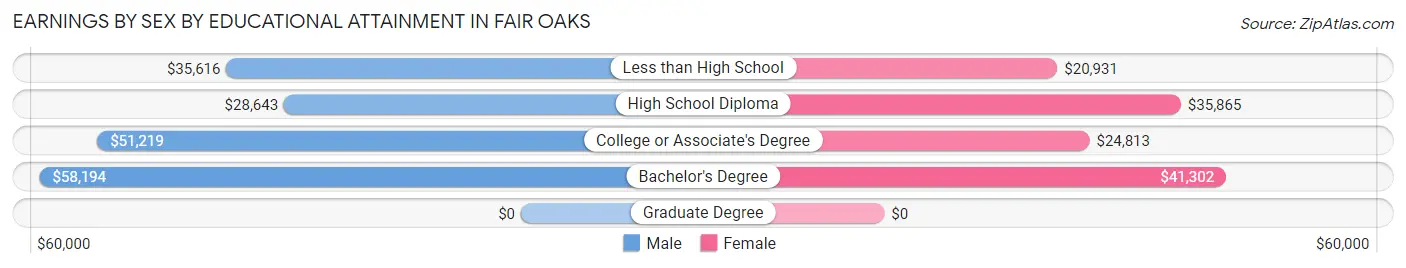
| Educational Attainment | Male Income | Female Income |
| Less than High School | $35,616 | $20,931 |
| High School Diploma | $28,643 | $35,865 |
| College or Associate's Degree | $51,219 | $24,813 |
| Bachelor's Degree | $58,194 | $41,302 |
| Graduate Degree | - | - |
| Total | $35,131 | $28,346 |
Family Income in Fair Oaks
Family Income Brackets in Fair Oaks
According to the Fair Oaks family income data, there are 663 families falling into the $50,000 to $74,999 income range, which is the most common income bracket and makes up 33.3% of all families. Conversely, the $10,000 to $14,999 income bracket is the least frequent group with only 14 families (0.7%) belonging to this category.
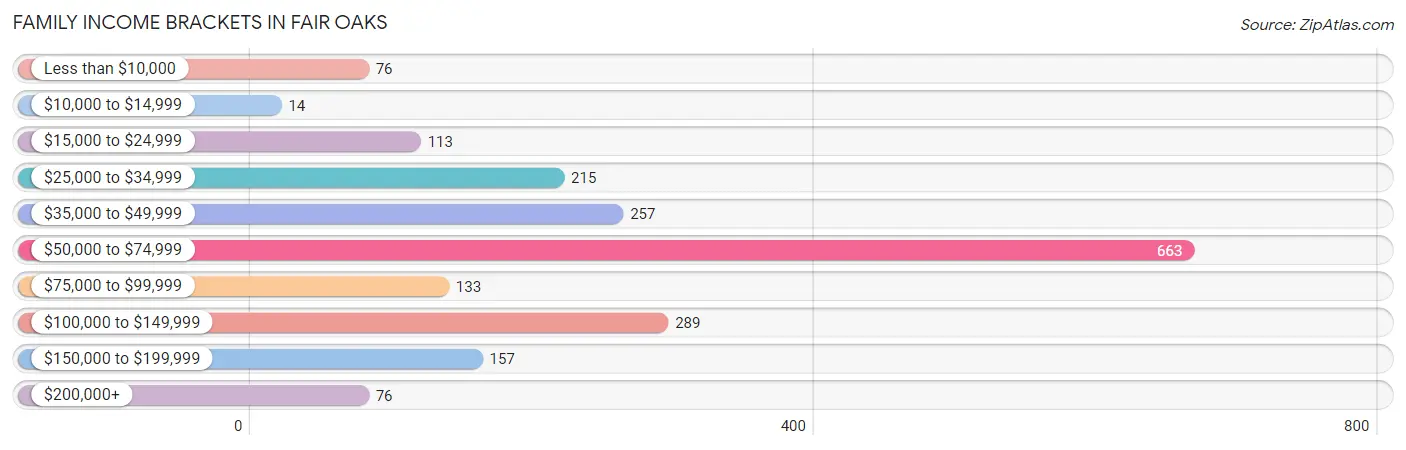
| Income Bracket | # Families | % Families |
| Less than $10,000 | 76 | 3.8% |
| $10,000 to $14,999 | 14 | 0.7% |
| $15,000 to $24,999 | 113 | 5.7% |
| $25,000 to $34,999 | 215 | 10.8% |
| $35,000 to $49,999 | 257 | 12.9% |
| $50,000 to $74,999 | 663 | 33.3% |
| $75,000 to $99,999 | 133 | 6.7% |
| $100,000 to $149,999 | 289 | 14.5% |
| $150,000 to $199,999 | 157 | 7.9% |
| $200,000+ | 76 | 3.8% |
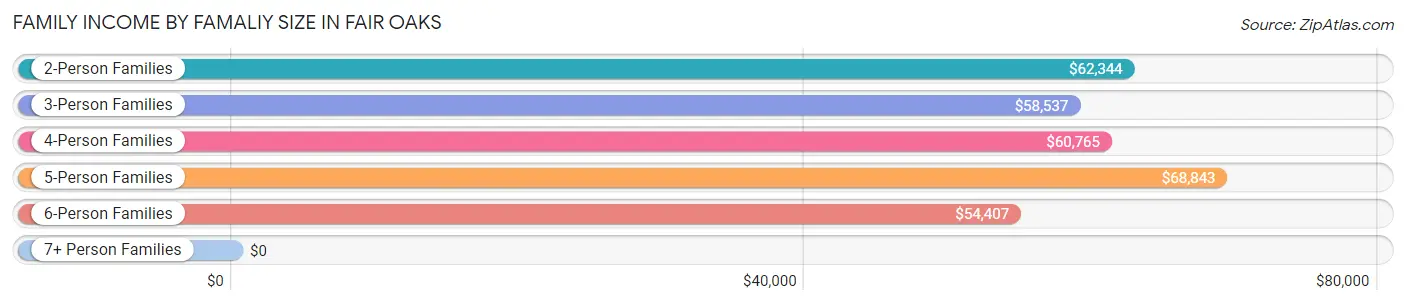
Family Income by Famaliy Size in Fair Oaks
5-person families (351 | 17.6%) account for the highest median family income in Fair Oaks with $68,843 per family, while 2-person families (564 | 28.3%) have the highest median income of $31,172 per family member.
| Income Bracket | # Families | Median Income |
| 2-Person Families | 564 (28.3%) | $62,344 |
| 3-Person Families | 576 (28.9%) | $58,537 |
| 4-Person Families | 258 (13.0%) | $60,765 |
| 5-Person Families | 351 (17.6%) | $68,843 |
| 6-Person Families | 209 (10.5%) | $54,407 |
| 7+ Person Families | 32 (1.6%) | $0 |
| Total | 1,990 (100.0%) | $58,963 |
Family Income by Number of Earners in Fair Oaks
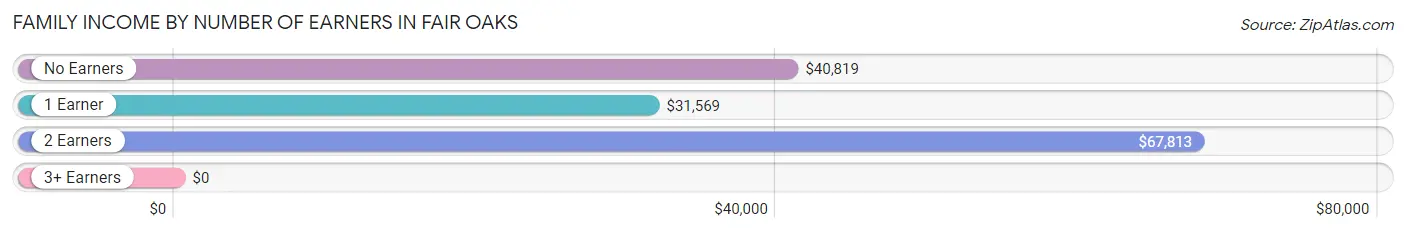
| Number of Earners | # Families | Median Income |
| No Earners | 78 (3.9%) | $40,819 |
| 1 Earner | 669 (33.6%) | $31,569 |
| 2 Earners | 878 (44.1%) | $67,813 |
| 3+ Earners | 365 (18.3%) | $0 |
| Total | 1,990 (100.0%) | $58,963 |
Household Income in Fair Oaks
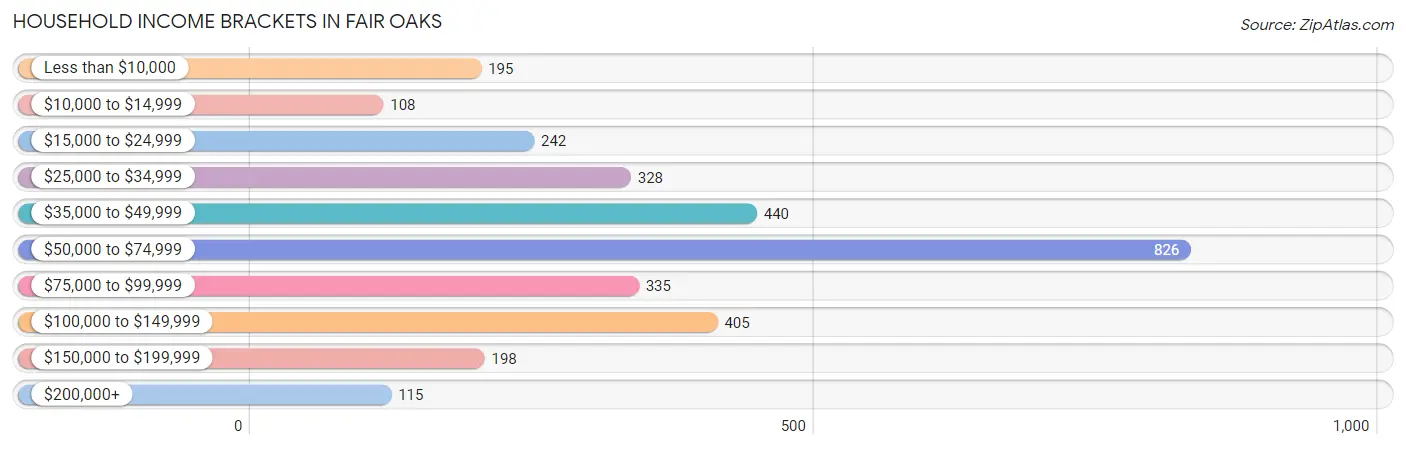
Household Income Brackets in Fair Oaks
With 826 households falling in the category, the $50,000 to $74,999 income range is the most frequent in Fair Oaks, accounting for 25.9% of all households. In contrast, only 108 households (3.4%) fall into the $10,000 to $14,999 income bracket, making it the least populous group.
| Income Bracket | # Households | % Households |
| Less than $10,000 | 195 | 6.1% |
| $10,000 to $14,999 | 108 | 3.4% |
| $15,000 to $24,999 | 242 | 7.6% |
| $25,000 to $34,999 | 328 | 10.3% |
| $35,000 to $49,999 | 440 | 13.8% |
| $50,000 to $74,999 | 826 | 25.9% |
| $75,000 to $99,999 | 335 | 10.5% |
| $100,000 to $149,999 | 405 | 12.7% |
| $150,000 to $199,999 | 198 | 6.2% |
| $200,000+ | 115 | 3.6% |
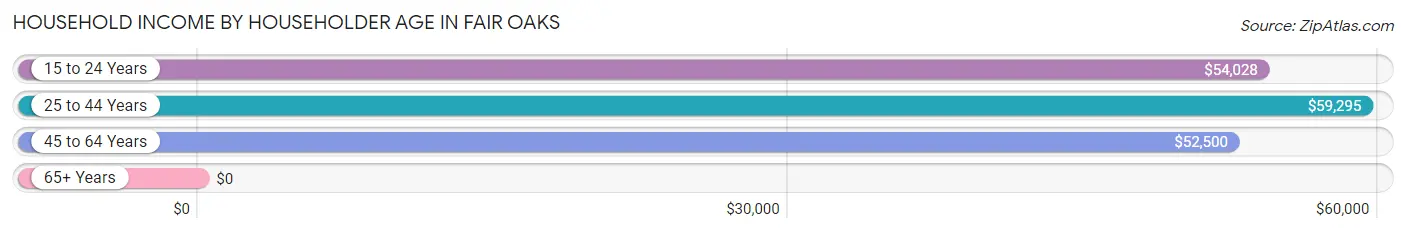
Household Income by Householder Age in Fair Oaks
The median household income in Fair Oaks is $57,582, with the highest median household income of $59,295 found in the 25 to 44 years age bracket for the primary householder. A total of 1,466 households (46.0%) fall into this category. Meanwhile, the 65+ years age bracket for the primary householder has the lowest median household income of $0, with 289 households (9.1%) in this group.
| Income Bracket | # Households | Median Income |
| 15 to 24 Years | 262 (8.2%) | $54,028 |
| 25 to 44 Years | 1,466 (46.0%) | $59,295 |
| 45 to 64 Years | 1,172 (36.7%) | $52,500 |
| 65+ Years | 289 (9.1%) | $0 |
| Total | 3,189 (100.0%) | $57,582 |
Poverty in Fair Oaks
Income Below Poverty by Sex and Age in Fair Oaks
With 17.2% poverty level for males and 21.5% for females among the residents of Fair Oaks, 6 to 11 year old males and 12 to 14 year old females are the most vulnerable to poverty, with 136 males (49.3%) and 100 females (44.8%) in their respective age groups living below the poverty level.
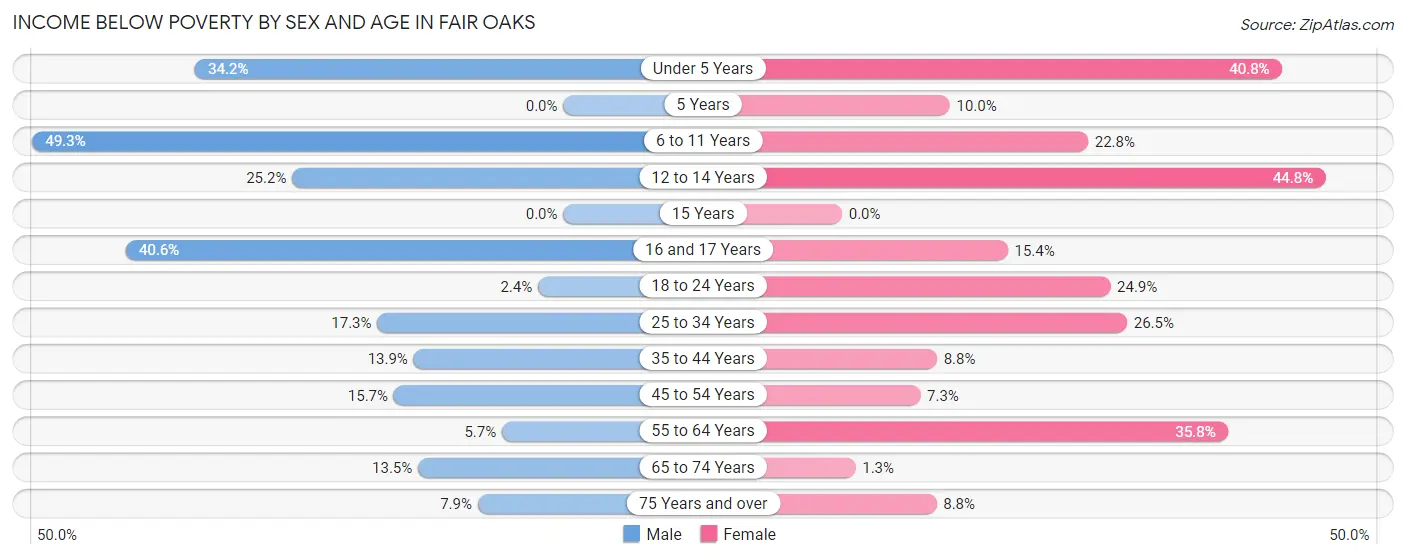
| Age Bracket | Male | Female |
| Under 5 Years | 148 (34.2%) | 71 (40.8%) |
| 5 Years | 0 (0.0%) | 8 (10.0%) |
| 6 to 11 Years | 136 (49.3%) | 116 (22.8%) |
| 12 to 14 Years | 79 (25.2%) | 100 (44.8%) |
| 15 Years | 0 (0.0%) | 0 (0.0%) |
| 16 and 17 Years | 41 (40.6%) | 24 (15.4%) |
| 18 to 24 Years | 11 (2.4%) | 183 (24.9%) |
| 25 to 34 Years | 155 (17.3%) | 233 (26.5%) |
| 35 to 44 Years | 71 (13.9%) | 49 (8.8%) |
| 45 to 54 Years | 92 (15.7%) | 46 (7.3%) |
| 55 to 64 Years | 24 (5.7%) | 189 (35.8%) |
| 65 to 74 Years | 31 (13.5%) | 2 (1.3%) |
| 75 Years and over | 15 (7.9%) | 10 (8.8%) |
| Total | 803 (17.2%) | 1,031 (21.5%) |
Income Above Poverty by Sex and Age in Fair Oaks
According to the poverty statistics in Fair Oaks, males aged 5 years and females aged 15 years are the age groups that are most secure financially, with 100.0% of males and 100.0% of females in these age groups living above the poverty line.
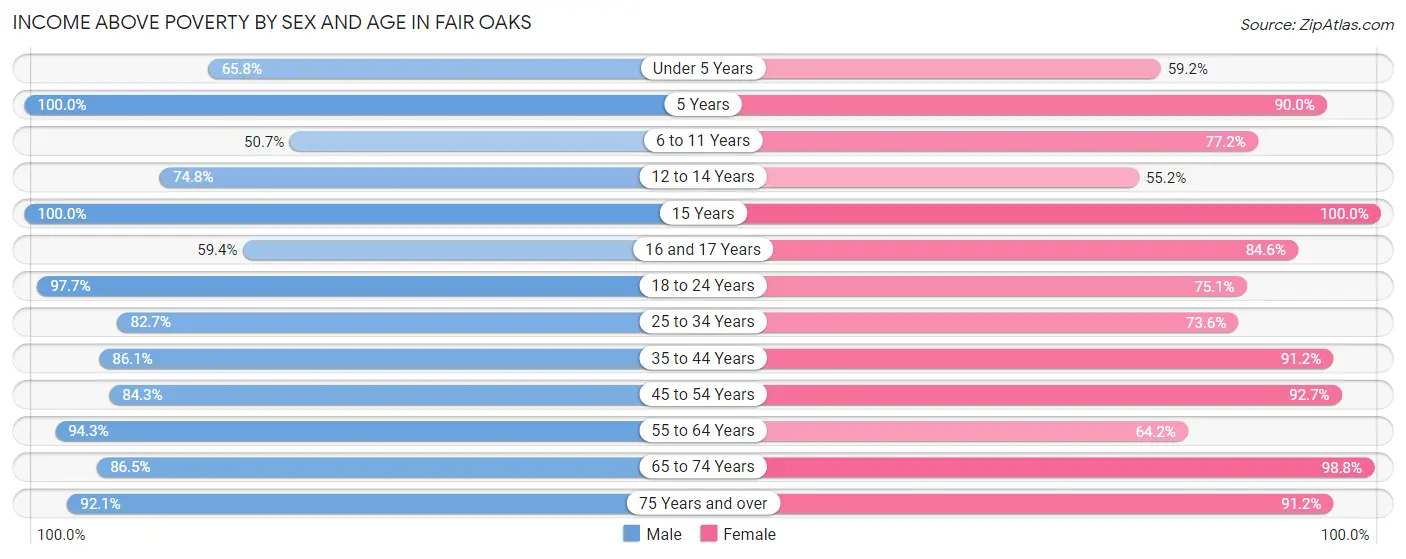
| Age Bracket | Male | Female |
| Under 5 Years | 285 (65.8%) | 103 (59.2%) |
| 5 Years | 84 (100.0%) | 72 (90.0%) |
| 6 to 11 Years | 140 (50.7%) | 392 (77.2%) |
| 12 to 14 Years | 235 (74.8%) | 123 (55.2%) |
| 15 Years | 157 (100.0%) | 52 (100.0%) |
| 16 and 17 Years | 60 (59.4%) | 132 (84.6%) |
| 18 to 24 Years | 458 (97.7%) | 552 (75.1%) |
| 25 to 34 Years | 743 (82.7%) | 648 (73.6%) |
| 35 to 44 Years | 440 (86.1%) | 507 (91.2%) |
| 45 to 54 Years | 493 (84.3%) | 587 (92.7%) |
| 55 to 64 Years | 398 (94.3%) | 339 (64.2%) |
| 65 to 74 Years | 199 (86.5%) | 158 (98.8%) |
| 75 Years and over | 174 (92.1%) | 104 (91.2%) |
| Total | 3,866 (82.8%) | 3,769 (78.5%) |
Income Below Poverty Among Married-Couple Families in Fair Oaks
The poverty statistics for married-couple families in Fair Oaks show that 10.0% or 110 of the total 1,101 families live below the poverty line. Families with 3 or 4 children have the highest poverty rate of 24.0%, comprising of 49 families. On the other hand, families with no children have the lowest poverty rate of 0.0%, which includes 0 families.
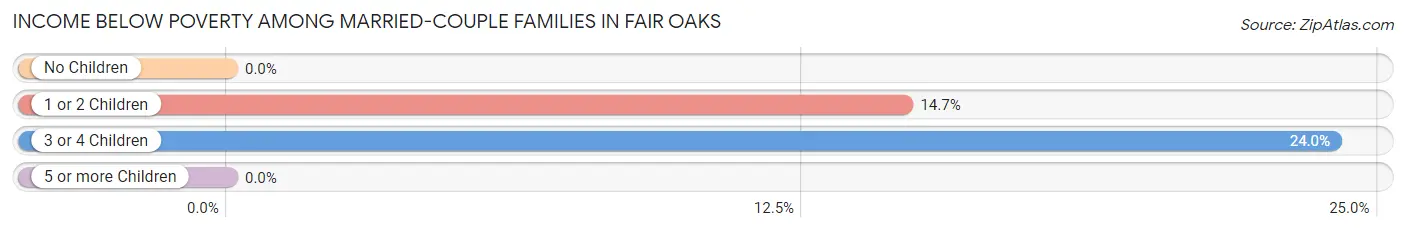
| Children | Above Poverty | Below Poverty |
| No Children | 482 (100.0%) | 0 (0.0%) |
| 1 or 2 Children | 354 (85.3%) | 61 (14.7%) |
| 3 or 4 Children | 155 (76.0%) | 49 (24.0%) |
| 5 or more Children | 0 (0.0%) | 0 (0.0%) |
| Total | 991 (90.0%) | 110 (10.0%) |
Income Below Poverty Among Single-Parent Households in Fair Oaks
According to the poverty data in Fair Oaks, 19.0% or 69 single-father households and 18.6% or 98 single-mother households are living below the poverty line. Among single-father households, those with 3 or 4 children have the highest poverty rate, with 29 households (100.0%) experiencing poverty. Likewise, among single-mother households, those with 3 or 4 children have the highest poverty rate, with 42 households (30.2%) falling below the poverty line.
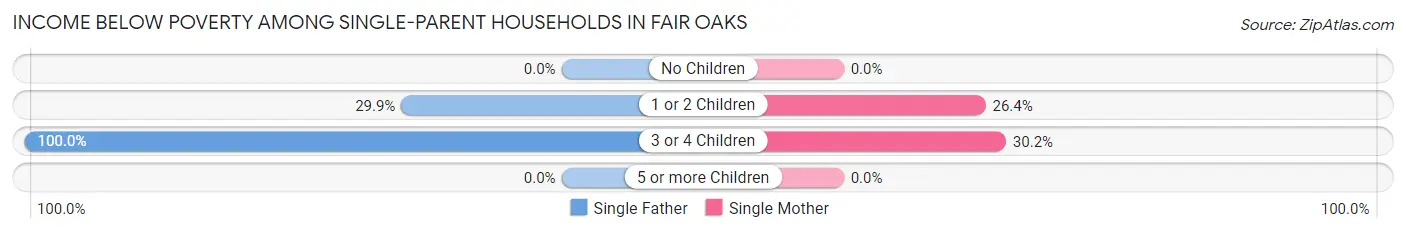
| Children | Single Father | Single Mother |
| No Children | 0 (0.0%) | 0 (0.0%) |
| 1 or 2 Children | 40 (29.8%) | 56 (26.4%) |
| 3 or 4 Children | 29 (100.0%) | 42 (30.2%) |
| 5 or more Children | 0 (0.0%) | 0 (0.0%) |
| Total | 69 (19.0%) | 98 (18.6%) |
Income Below Poverty Among Married-Couple vs Single-Parent Households in Fair Oaks
The poverty data for Fair Oaks shows that 110 of the married-couple family households (10.0%) and 167 of the single-parent households (18.8%) are living below the poverty level. Within the married-couple family households, those with 3 or 4 children have the highest poverty rate, with 49 households (24.0%) falling below the poverty line. Among the single-parent households, those with 3 or 4 children have the highest poverty rate, with 71 household (42.3%) living below poverty.
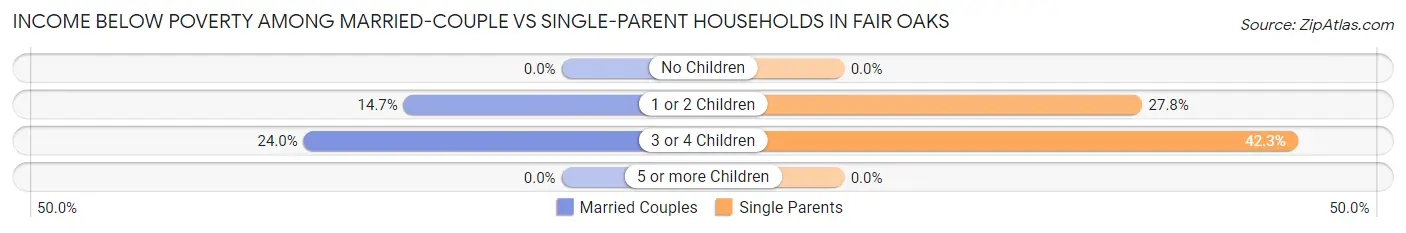
| Children | Married-Couple Families | Single-Parent Households |
| No Children | 0 (0.0%) | 0 (0.0%) |
| 1 or 2 Children | 61 (14.7%) | 96 (27.8%) |
| 3 or 4 Children | 49 (24.0%) | 71 (42.3%) |
| 5 or more Children | 0 (0.0%) | 0 (0.0%) |
| Total | 110 (10.0%) | 167 (18.8%) |
Employment Characteristics in Fair Oaks
Employment by Class of Employer in Fair Oaks
Among the 4,751 employed individuals in Fair Oaks, private company employees (3,474 | 73.1%), self-employed (not incorporated) (663 | 14.0%), and not-for-profit organizations (187 | 3.9%) make up the most common classes of employment.
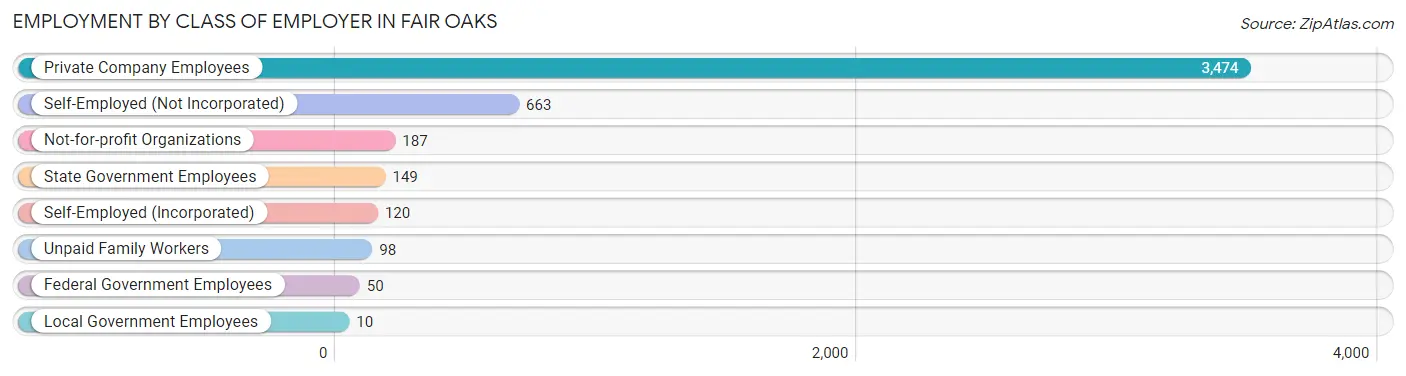
| Employer Class | # Employees | % Employees |
| Private Company Employees | 3,474 | 73.1% |
| Self-Employed (Incorporated) | 120 | 2.5% |
| Self-Employed (Not Incorporated) | 663 | 14.0% |
| Not-for-profit Organizations | 187 | 3.9% |
| Local Government Employees | 10 | 0.2% |
| State Government Employees | 149 | 3.1% |
| Federal Government Employees | 50 | 1.1% |
| Unpaid Family Workers | 98 | 2.1% |
| Total | 4,751 | 100.0% |
Employment Status by Age in Fair Oaks
According to the labor force statistics for Fair Oaks, out of the total population over 16 years of age (7,168), 75.8% or 5,433 individuals are in the labor force, with 6.7% or 364 of them unemployed. The age group with the highest labor force participation rate is 45 to 54 years, with 88.3% or 1,075 individuals in the labor force. Within the labor force, the 60 to 64 years age range has the highest percentage of unemployed individuals, with 19.0% or 47 of them being unemployed.
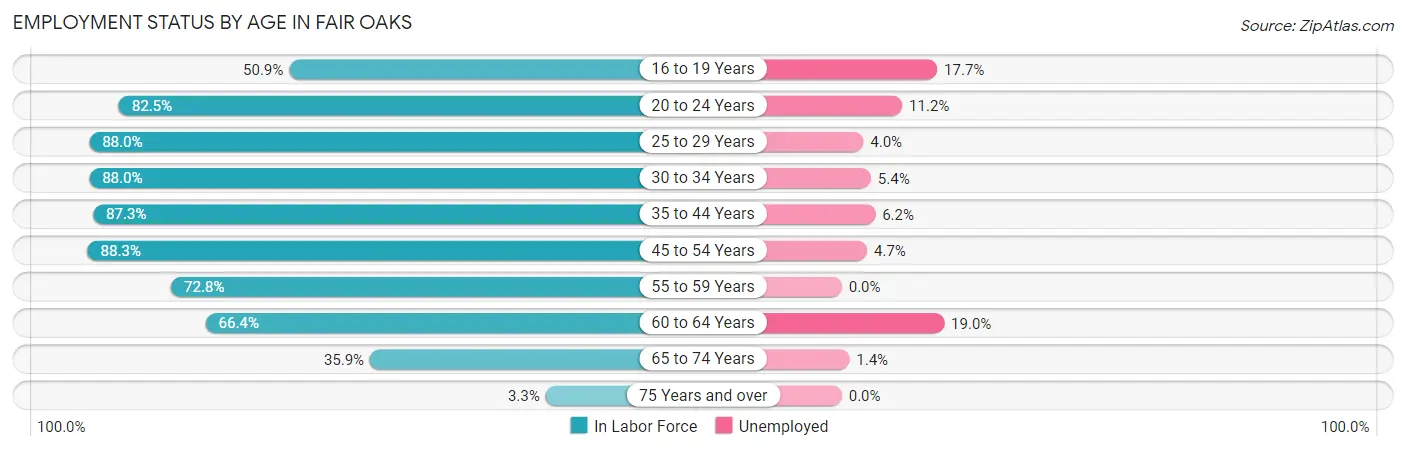
| Age Bracket | In Labor Force | Unemployed |
| 16 to 19 Years | 266 (50.9%) | 47 (17.7%) |
| 20 to 24 Years | 774 (82.5%) | 87 (11.2%) |
| 25 to 29 Years | 840 (88.0%) | 34 (4.0%) |
| 30 to 34 Years | 725 (88.0%) | 39 (5.4%) |
| 35 to 44 Years | 931 (87.3%) | 58 (6.2%) |
| 45 to 54 Years | 1,075 (88.3%) | 51 (4.7%) |
| 55 to 59 Years | 421 (72.8%) | 0 (0.0%) |
| 60 to 64 Years | 247 (66.4%) | 47 (19.0%) |
| 65 to 74 Years | 140 (35.9%) | 2 (1.4%) |
| 75 Years and over | 10 (3.3%) | 0 (0.0%) |
| Total | 5,433 (75.8%) | 364 (6.7%) |
Employment Status by Educational Attainment in Fair Oaks
According to labor force statistics for Fair Oaks, 84.6% of individuals (4,242) out of the total population between 25 and 64 years of age (5,014) are in the labor force, with 5.4% or 229 of them being unemployed. The group with the highest labor force participation rate are those with the educational attainment of bachelor's degree or higher, with 94.3% or 845 individuals in the labor force. Within the labor force, individuals with high school diploma education have the highest percentage of unemployment, with 9.2% or 97 of them being unemployed.
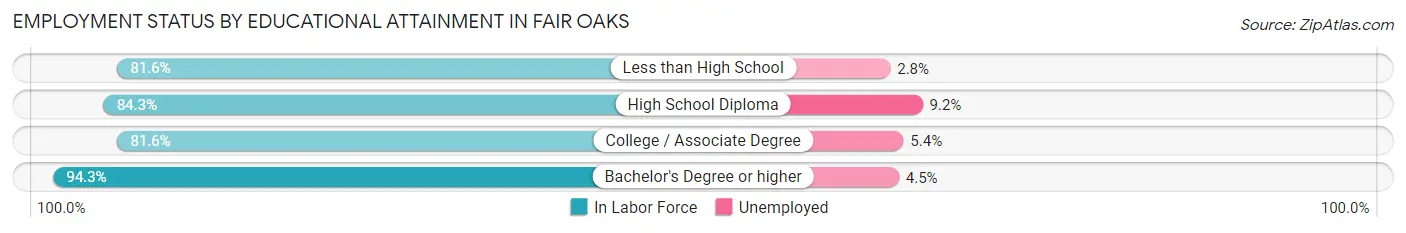
| Educational Attainment | In Labor Force | Unemployed |
| Less than High School | 1,231 (81.6%) | 42 (2.8%) |
| High School Diploma | 1,052 (84.3%) | 115 (9.2%) |
| College / Associate Degree | 1,111 (81.6%) | 74 (5.4%) |
| Bachelor's Degree or higher | 845 (94.3%) | 40 (4.5%) |
| Total | 4,242 (84.6%) | 271 (5.4%) |
Employment Occupations by Sex in Fair Oaks
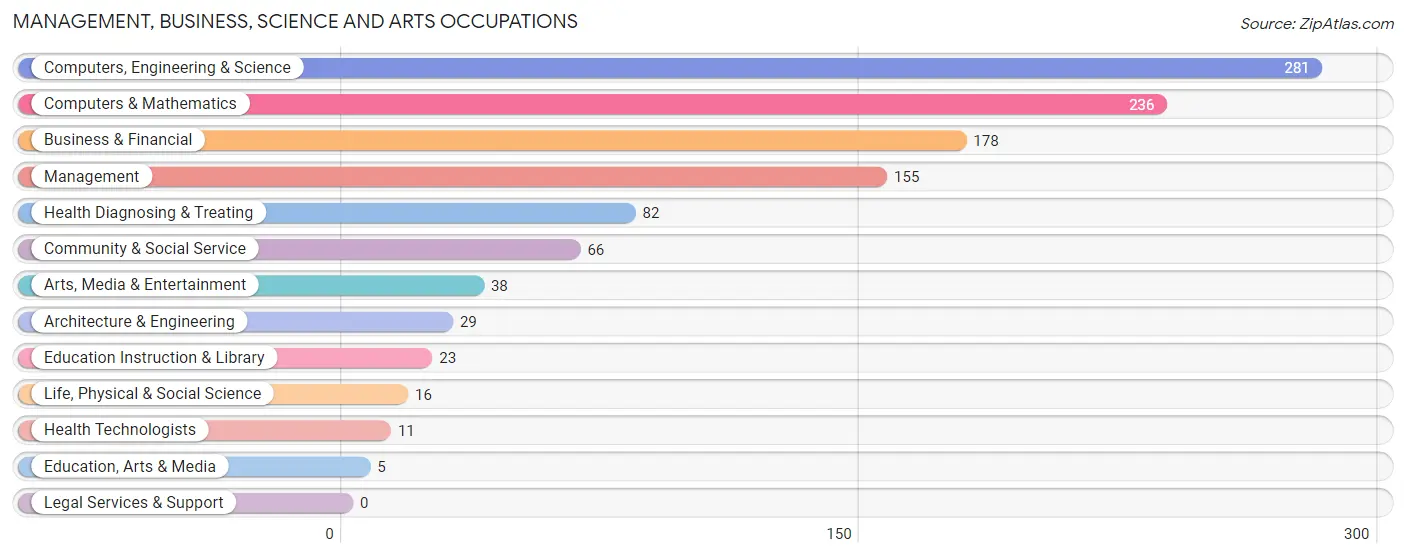
Management, Business, Science and Arts Occupations
The most common Management, Business, Science and Arts occupations in Fair Oaks are Computers, Engineering & Science (281 | 5.6%), Computers & Mathematics (236 | 4.7%), Business & Financial (178 | 3.5%), Management (155 | 3.1%), and Health Diagnosing & Treating (82 | 1.6%).
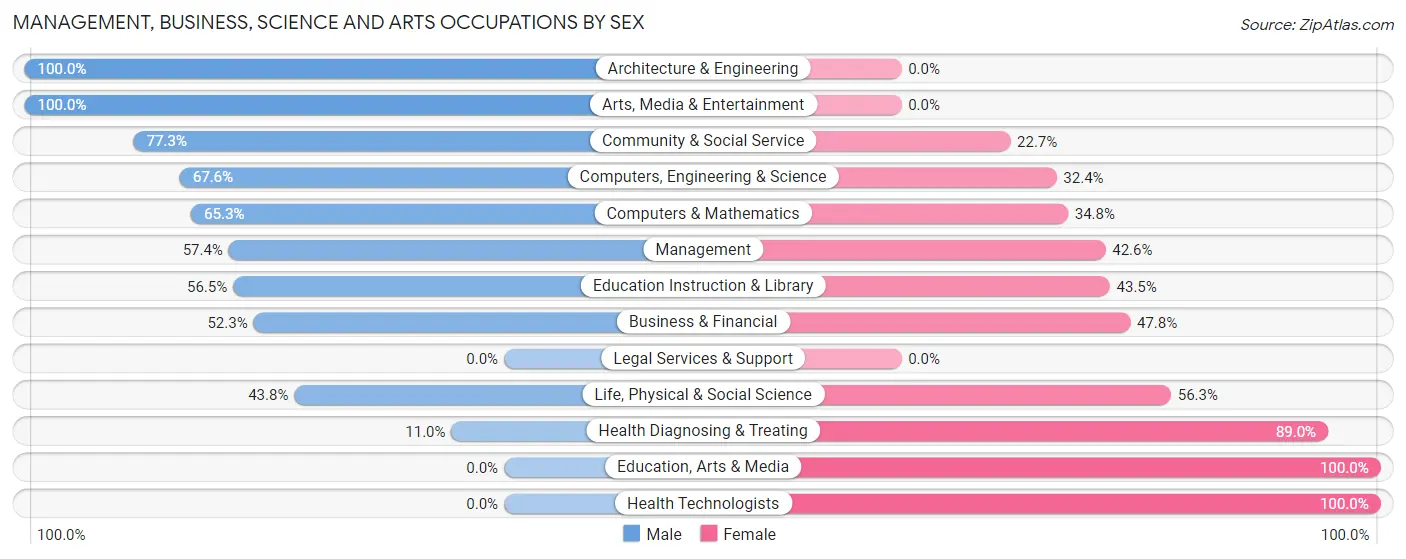
Management, Business, Science and Arts Occupations by Sex
Within the Management, Business, Science and Arts occupations in Fair Oaks, the most male-oriented occupations are Architecture & Engineering (100.0%), Arts, Media & Entertainment (100.0%), and Community & Social Service (77.3%), while the most female-oriented occupations are Education, Arts & Media (100.0%), Health Technologists (100.0%), and Health Diagnosing & Treating (89.0%).
| Occupation | Male | Female |
| Management | 89 (57.4%) | 66 (42.6%) |
| Business & Financial | 93 (52.2%) | 85 (47.7%) |
| Computers, Engineering & Science | 190 (67.6%) | 91 (32.4%) |
| Computers & Mathematics | 154 (65.2%) | 82 (34.7%) |
| Architecture & Engineering | 29 (100.0%) | 0 (0.0%) |
| Life, Physical & Social Science | 7 (43.8%) | 9 (56.2%) |
| Community & Social Service | 51 (77.3%) | 15 (22.7%) |
| Education, Arts & Media | 0 (0.0%) | 5 (100.0%) |
| Legal Services & Support | 0 (0.0%) | 0 (0.0%) |
| Education Instruction & Library | 13 (56.5%) | 10 (43.5%) |
| Arts, Media & Entertainment | 38 (100.0%) | 0 (0.0%) |
| Health Diagnosing & Treating | 9 (11.0%) | 73 (89.0%) |
| Health Technologists | 0 (0.0%) | 11 (100.0%) |
| Total (Category) | 432 (56.7%) | 330 (43.3%) |
| Total (Overall) | 2,817 (55.6%) | 2,248 (44.4%) |
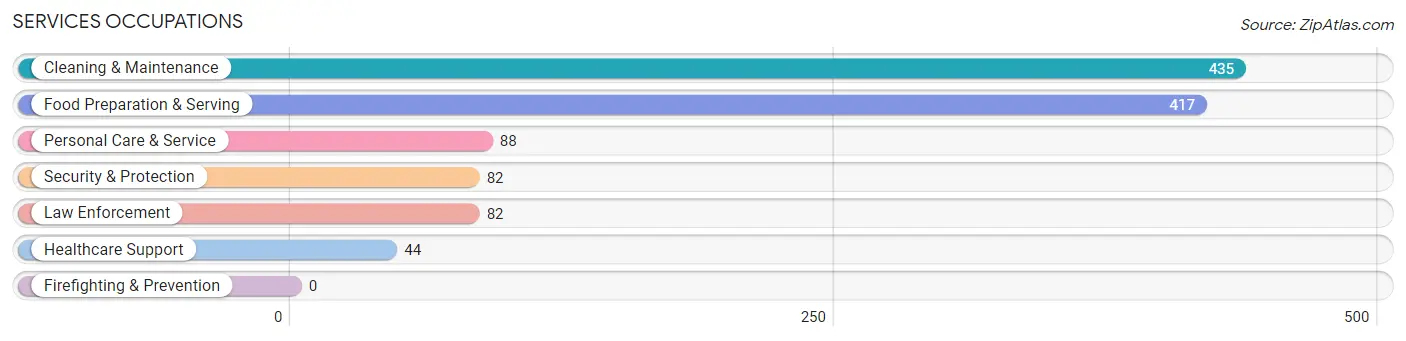
Services Occupations
The most common Services occupations in Fair Oaks are Cleaning & Maintenance (435 | 8.6%), Food Preparation & Serving (417 | 8.2%), Personal Care & Service (88 | 1.7%), Security & Protection (82 | 1.6%), and Law Enforcement (82 | 1.6%).
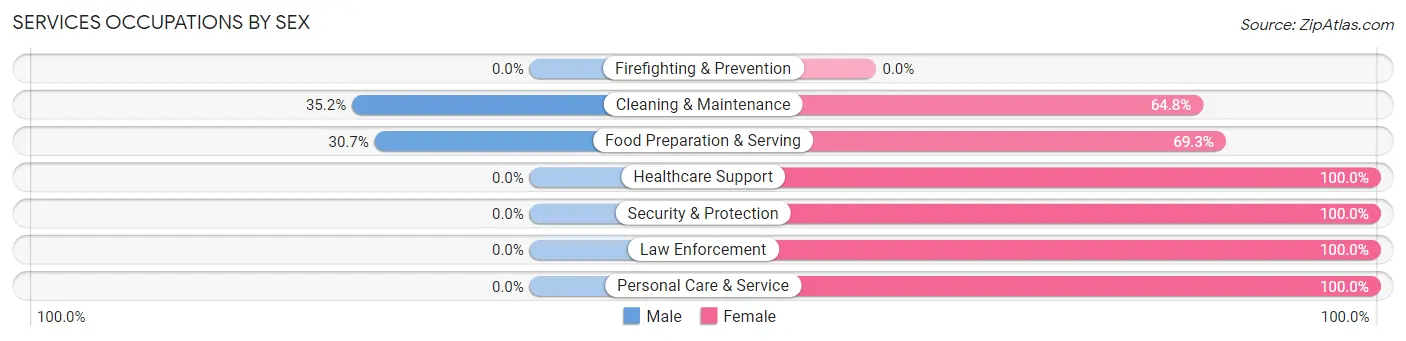
Services Occupations by Sex
Within the Services occupations in Fair Oaks, the most male-oriented occupations are Cleaning & Maintenance (35.2%), and Food Preparation & Serving (30.7%), while the most female-oriented occupations are Healthcare Support (100.0%), Security & Protection (100.0%), and Law Enforcement (100.0%).
| Occupation | Male | Female |
| Healthcare Support | 0 (0.0%) | 44 (100.0%) |
| Security & Protection | 0 (0.0%) | 82 (100.0%) |
| Firefighting & Prevention | 0 (0.0%) | 0 (0.0%) |
| Law Enforcement | 0 (0.0%) | 82 (100.0%) |
| Food Preparation & Serving | 128 (30.7%) | 289 (69.3%) |
| Cleaning & Maintenance | 153 (35.2%) | 282 (64.8%) |
| Personal Care & Service | 0 (0.0%) | 88 (100.0%) |
| Total (Category) | 281 (26.4%) | 785 (73.6%) |
| Total (Overall) | 2,817 (55.6%) | 2,248 (44.4%) |
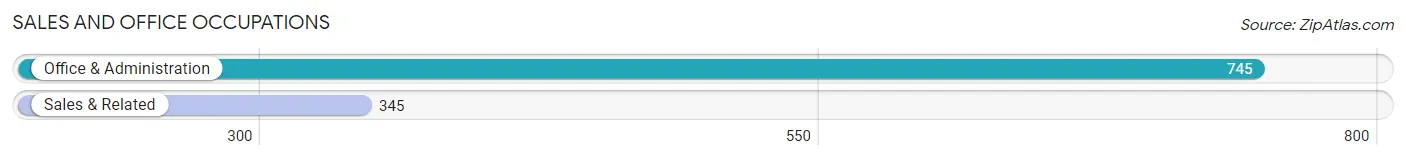
Sales and Office Occupations
The most common Sales and Office occupations in Fair Oaks are Office & Administration (745 | 14.7%), and Sales & Related (345 | 6.8%).
Sales and Office Occupations by Sex
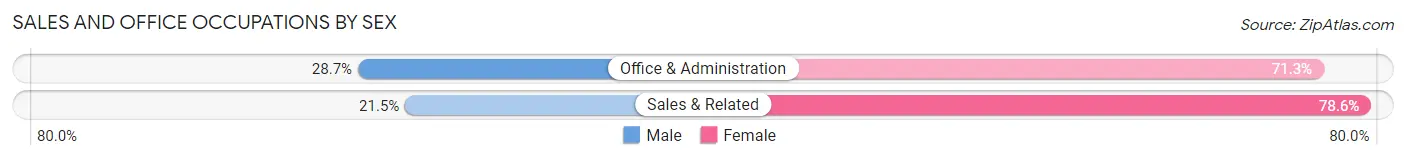
| Occupation | Male | Female |
| Sales & Related | 74 (21.4%) | 271 (78.5%) |
| Office & Administration | 214 (28.7%) | 531 (71.3%) |
| Total (Category) | 288 (26.4%) | 802 (73.6%) |
| Total (Overall) | 2,817 (55.6%) | 2,248 (44.4%) |
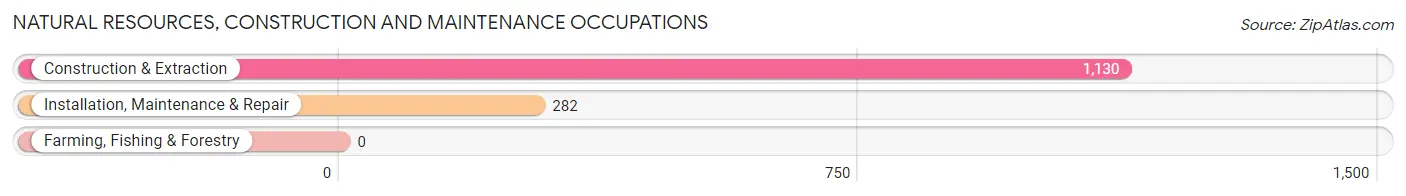
Natural Resources, Construction and Maintenance Occupations
The most common Natural Resources, Construction and Maintenance occupations in Fair Oaks are Construction & Extraction (1,130 | 22.3%), and Installation, Maintenance & Repair (282 | 5.6%).
Natural Resources, Construction and Maintenance Occupations by Sex
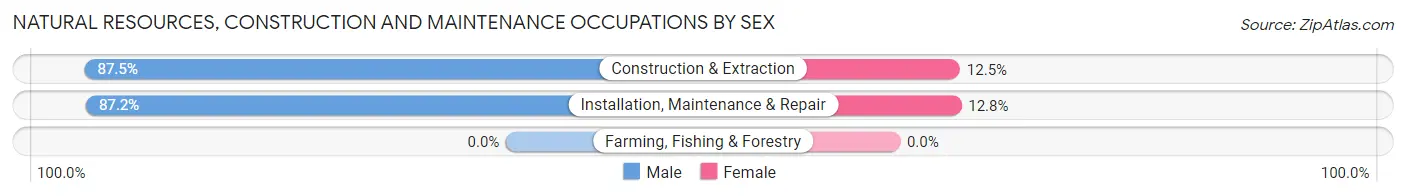
| Occupation | Male | Female |
| Farming, Fishing & Forestry | 0 (0.0%) | 0 (0.0%) |
| Construction & Extraction | 989 (87.5%) | 141 (12.5%) |
| Installation, Maintenance & Repair | 246 (87.2%) | 36 (12.8%) |
| Total (Category) | 1,235 (87.5%) | 177 (12.5%) |
| Total (Overall) | 2,817 (55.6%) | 2,248 (44.4%) |
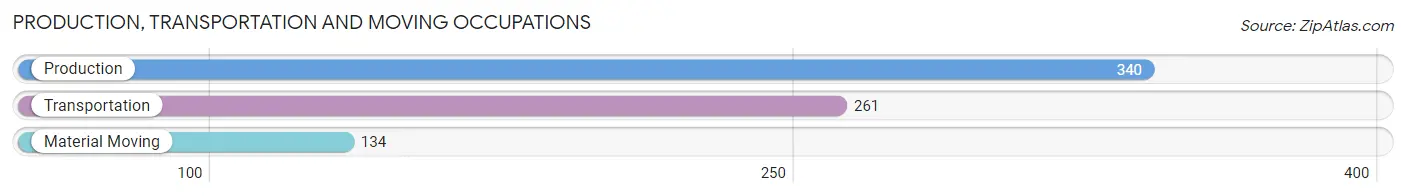
Production, Transportation and Moving Occupations
The most common Production, Transportation and Moving occupations in Fair Oaks are Production (340 | 6.7%), Transportation (261 | 5.1%), and Material Moving (134 | 2.6%).
Production, Transportation and Moving Occupations by Sex
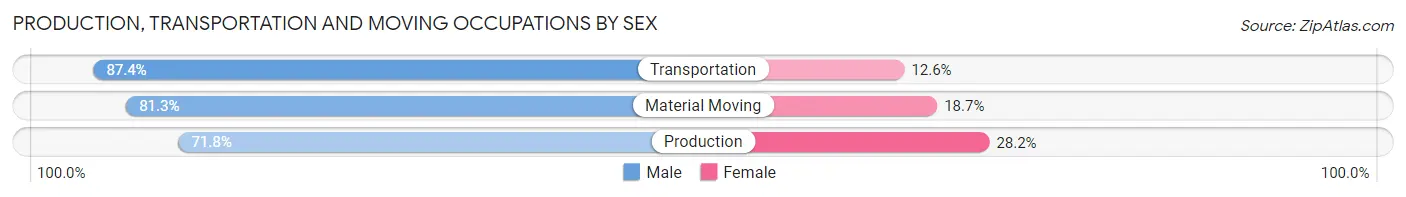
| Occupation | Male | Female |
| Production | 244 (71.8%) | 96 (28.2%) |
| Transportation | 228 (87.4%) | 33 (12.6%) |
| Material Moving | 109 (81.3%) | 25 (18.7%) |
| Total (Category) | 581 (79.0%) | 154 (20.9%) |
| Total (Overall) | 2,817 (55.6%) | 2,248 (44.4%) |
Employment Industries by Sex in Fair Oaks
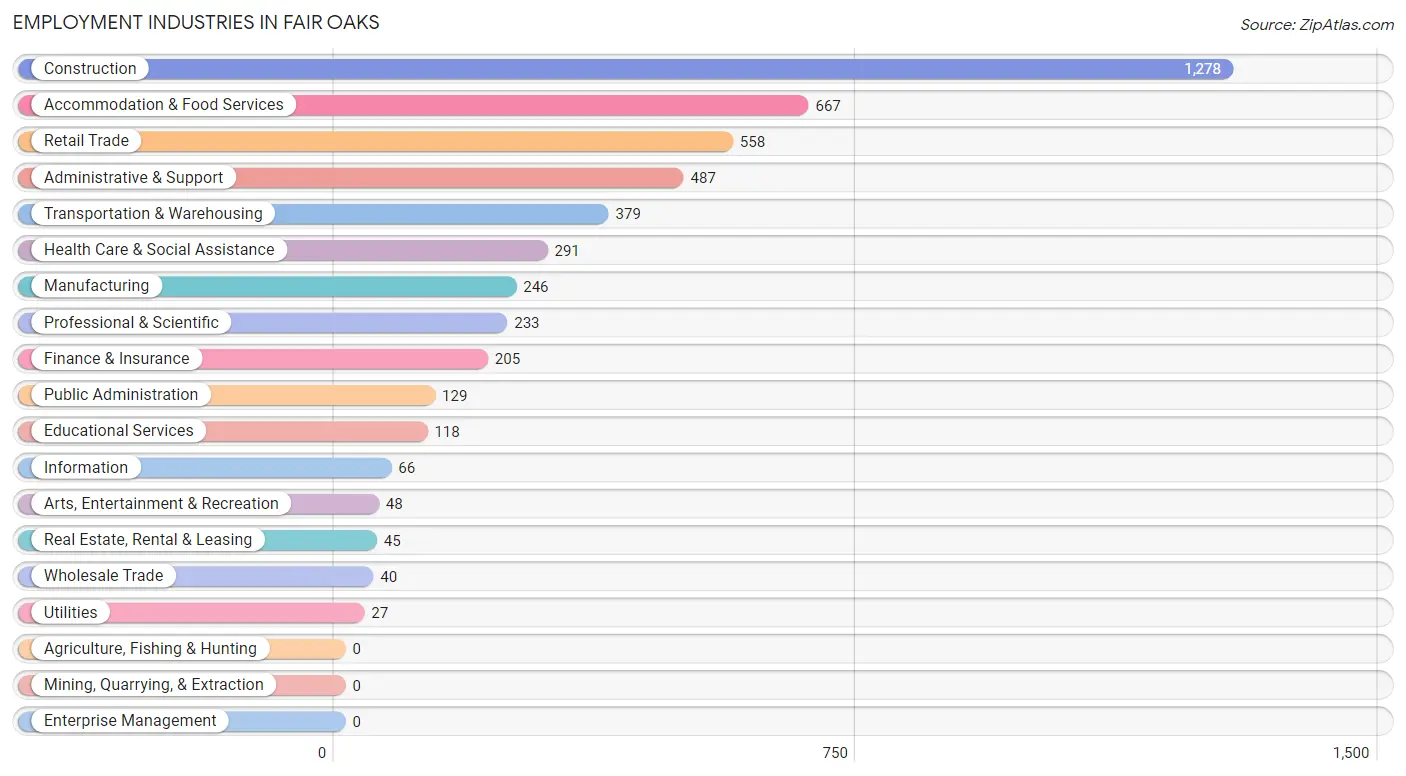
Employment Industries in Fair Oaks
The major employment industries in Fair Oaks include Construction (1,278 | 25.2%), Accommodation & Food Services (667 | 13.2%), Retail Trade (558 | 11.0%), Administrative & Support (487 | 9.6%), and Transportation & Warehousing (379 | 7.5%).
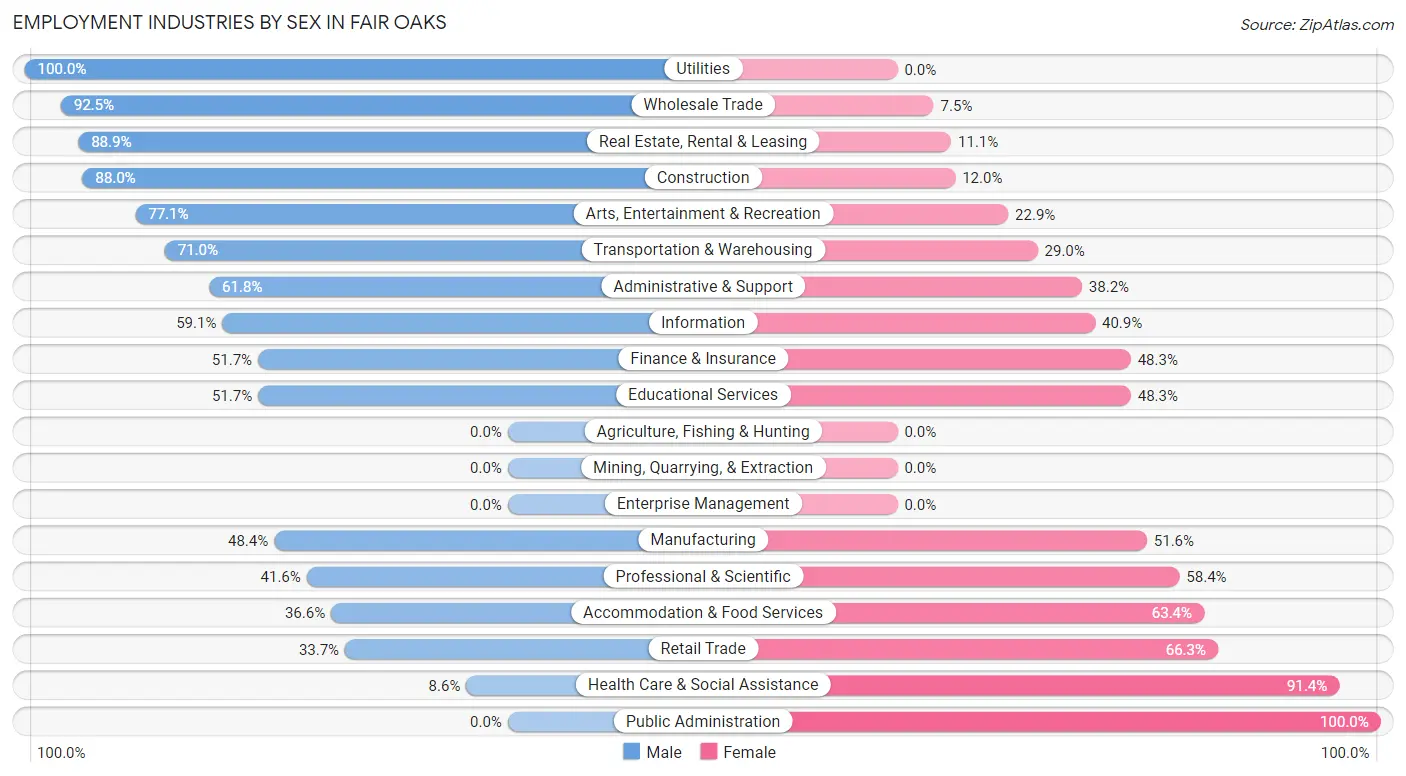
Employment Industries by Sex in Fair Oaks
The Fair Oaks industries that see more men than women are Utilities (100.0%), Wholesale Trade (92.5%), and Real Estate, Rental & Leasing (88.9%), whereas the industries that tend to have a higher number of women are Public Administration (100.0%), Health Care & Social Assistance (91.4%), and Retail Trade (66.3%).
| Industry | Male | Female |
| Agriculture, Fishing & Hunting | 0 (0.0%) | 0 (0.0%) |
| Mining, Quarrying, & Extraction | 0 (0.0%) | 0 (0.0%) |
| Construction | 1,125 (88.0%) | 153 (12.0%) |
| Manufacturing | 119 (48.4%) | 127 (51.6%) |
| Wholesale Trade | 37 (92.5%) | 3 (7.5%) |
| Retail Trade | 188 (33.7%) | 370 (66.3%) |
| Transportation & Warehousing | 269 (71.0%) | 110 (29.0%) |
| Utilities | 27 (100.0%) | 0 (0.0%) |
| Information | 39 (59.1%) | 27 (40.9%) |
| Finance & Insurance | 106 (51.7%) | 99 (48.3%) |
| Real Estate, Rental & Leasing | 40 (88.9%) | 5 (11.1%) |
| Professional & Scientific | 97 (41.6%) | 136 (58.4%) |
| Enterprise Management | 0 (0.0%) | 0 (0.0%) |
| Administrative & Support | 301 (61.8%) | 186 (38.2%) |
| Educational Services | 61 (51.7%) | 57 (48.3%) |
| Health Care & Social Assistance | 25 (8.6%) | 266 (91.4%) |
| Arts, Entertainment & Recreation | 37 (77.1%) | 11 (22.9%) |
| Accommodation & Food Services | 244 (36.6%) | 423 (63.4%) |
| Public Administration | 0 (0.0%) | 129 (100.0%) |
| Total | 2,817 (55.6%) | 2,248 (44.4%) |
Education in Fair Oaks
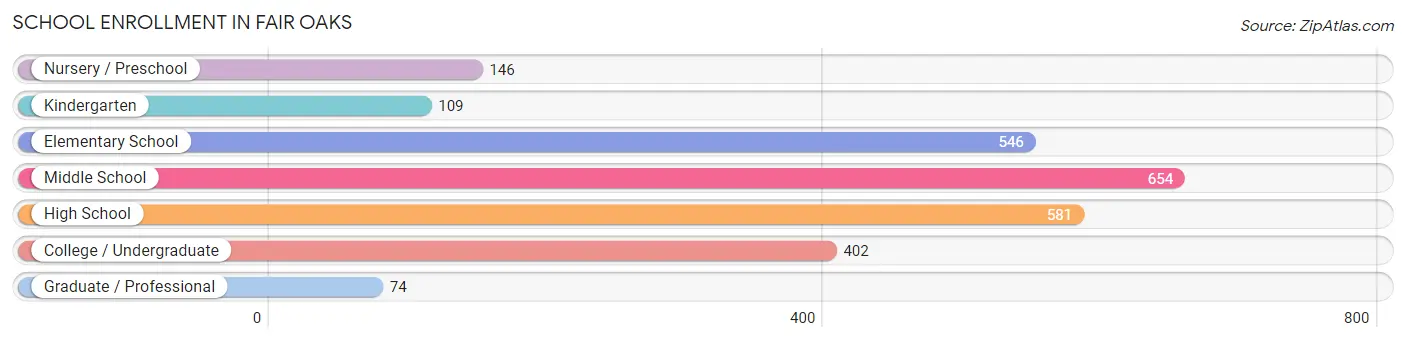
School Enrollment in Fair Oaks
The most common levels of schooling among the 2,512 students in Fair Oaks are middle school (654 | 26.0%), high school (581 | 23.1%), and elementary school (546 | 21.7%).
| School Level | # Students | % Students |
| Nursery / Preschool | 146 | 5.8% |
| Kindergarten | 109 | 4.3% |
| Elementary School | 546 | 21.7% |
| Middle School | 654 | 26.0% |
| High School | 581 | 23.1% |
| College / Undergraduate | 402 | 16.0% |
| Graduate / Professional | 74 | 2.9% |
| Total | 2,512 | 100.0% |
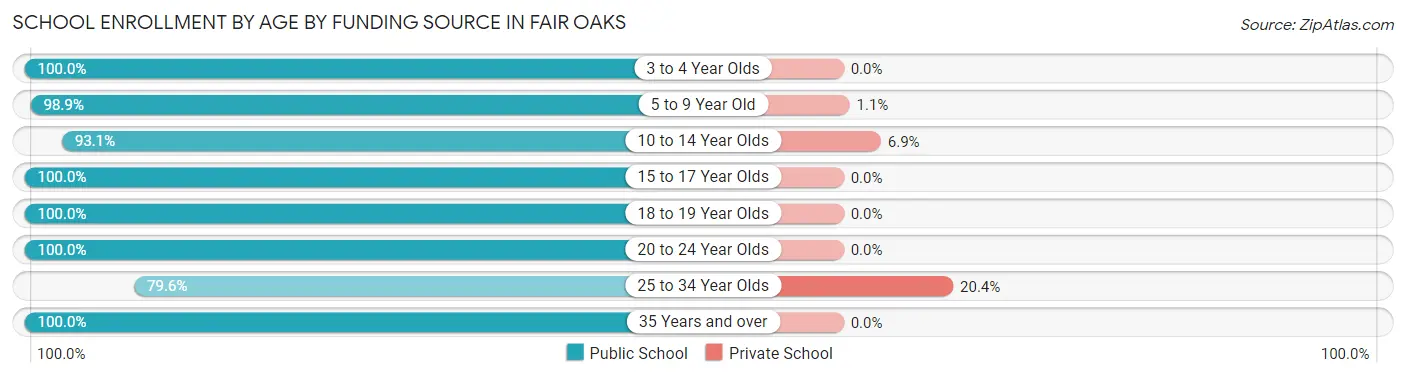
School Enrollment by Age by Funding Source in Fair Oaks
Out of a total of 2,512 students who are enrolled in schools in Fair Oaks, 93 (3.7%) attend a private institution, while the remaining 2,419 (96.3%) are enrolled in public schools. The age group of 25 to 34 year olds has the highest likelihood of being enrolled in private schools, with 32 (20.4% in the age bracket) enrolled. Conversely, the age group of 3 to 4 year olds has the lowest likelihood of being enrolled in a private school, with 67 (100.0% in the age bracket) attending a public institution.
| Age Bracket | Public School | Private School |
| 3 to 4 Year Olds | 67 (100.0%) | 0 (0.0%) |
| 5 to 9 Year Old | 717 (98.9%) | 8 (1.1%) |
| 10 to 14 Year Olds | 698 (93.1%) | 52 (6.9%) |
| 15 to 17 Year Olds | 425 (100.0%) | 0 (0.0%) |
| 18 to 19 Year Olds | 161 (100.0%) | 0 (0.0%) |
| 20 to 24 Year Olds | 214 (100.0%) | 0 (0.0%) |
| 25 to 34 Year Olds | 125 (79.6%) | 32 (20.4%) |
| 35 Years and over | 13 (100.0%) | 0 (0.0%) |
| Total | 2,419 (96.3%) | 93 (3.7%) |
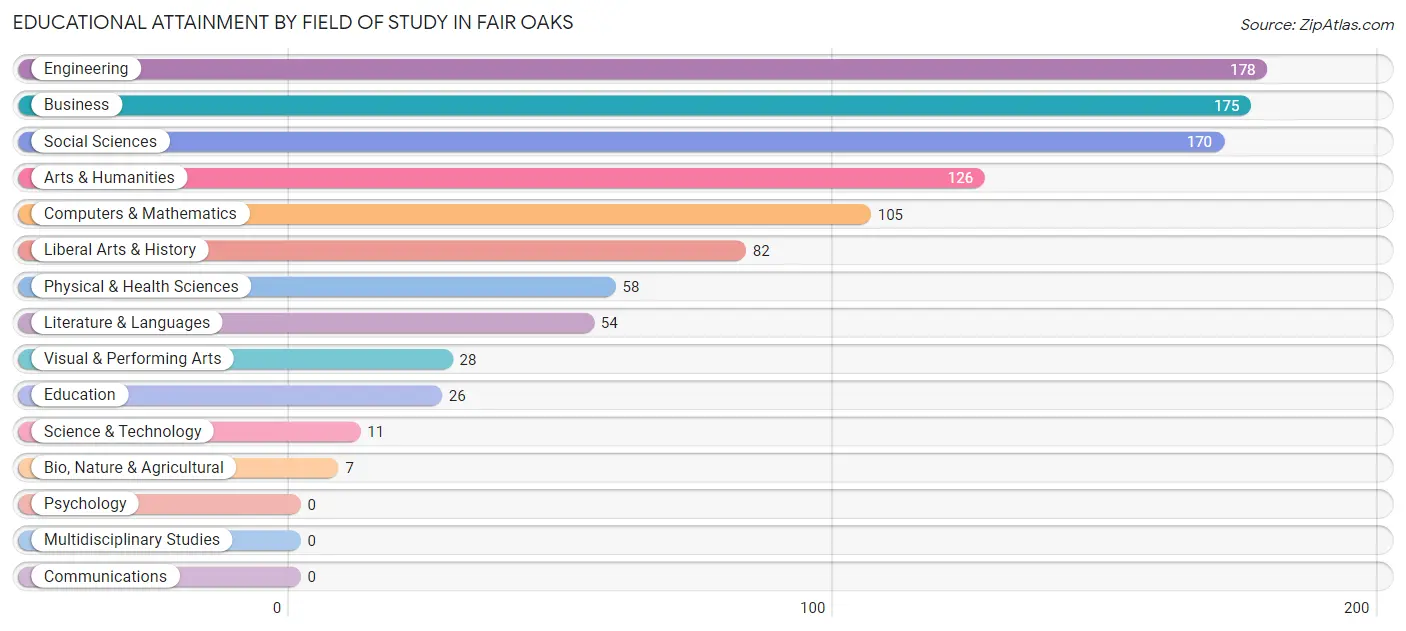
Educational Attainment by Field of Study in Fair Oaks
Engineering (178 | 17.4%), business (175 | 17.2%), social sciences (170 | 16.7%), arts & humanities (126 | 12.3%), and computers & mathematics (105 | 10.3%) are the most common fields of study among 1,020 individuals in Fair Oaks who have obtained a bachelor's degree or higher.
| Field of Study | # Graduates | % Graduates |
| Computers & Mathematics | 105 | 10.3% |
| Bio, Nature & Agricultural | 7 | 0.7% |
| Physical & Health Sciences | 58 | 5.7% |
| Psychology | 0 | 0.0% |
| Social Sciences | 170 | 16.7% |
| Engineering | 178 | 17.4% |
| Multidisciplinary Studies | 0 | 0.0% |
| Science & Technology | 11 | 1.1% |
| Business | 175 | 17.2% |
| Education | 26 | 2.5% |
| Literature & Languages | 54 | 5.3% |
| Liberal Arts & History | 82 | 8.0% |
| Visual & Performing Arts | 28 | 2.8% |
| Communications | 0 | 0.0% |
| Arts & Humanities | 126 | 12.3% |
| Total | 1,020 | 100.0% |
Transportation & Commute in Fair Oaks
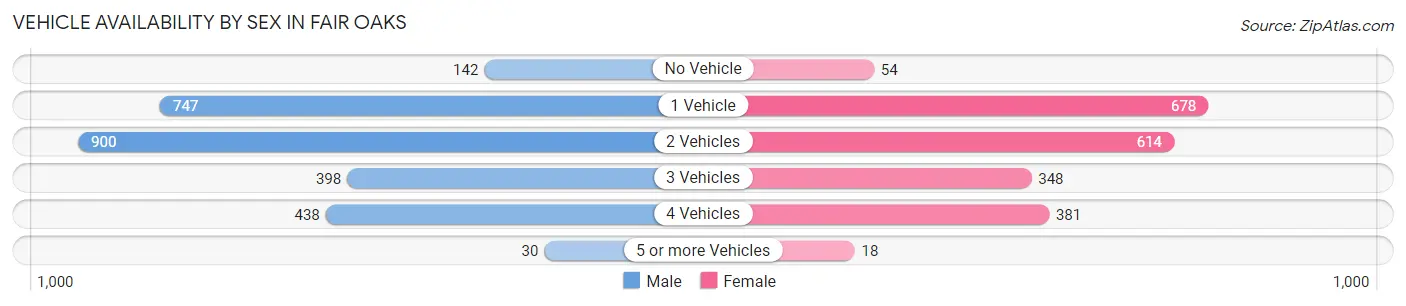
Vehicle Availability by Sex in Fair Oaks
The most prevalent vehicle ownership categories in Fair Oaks are males with 2 vehicles (900, accounting for 33.9%) and females with 2 vehicles (614, making up 43.0%).
| Vehicles Available | Male | Female |
| No Vehicle | 142 (5.3%) | 54 (2.6%) |
| 1 Vehicle | 747 (28.1%) | 678 (32.4%) |
| 2 Vehicles | 900 (33.9%) | 614 (29.3%) |
| 3 Vehicles | 398 (15.0%) | 348 (16.6%) |
| 4 Vehicles | 438 (16.5%) | 381 (18.2%) |
| 5 or more Vehicles | 30 (1.1%) | 18 (0.9%) |
| Total | 2,655 (100.0%) | 2,093 (100.0%) |
Commute Time in Fair Oaks
The most frequently occuring commute durations in Fair Oaks are 15 to 19 minutes (949 commuters, 21.4%), 10 to 14 minutes (865 commuters, 19.5%), and 30 to 34 minutes (776 commuters, 17.5%).
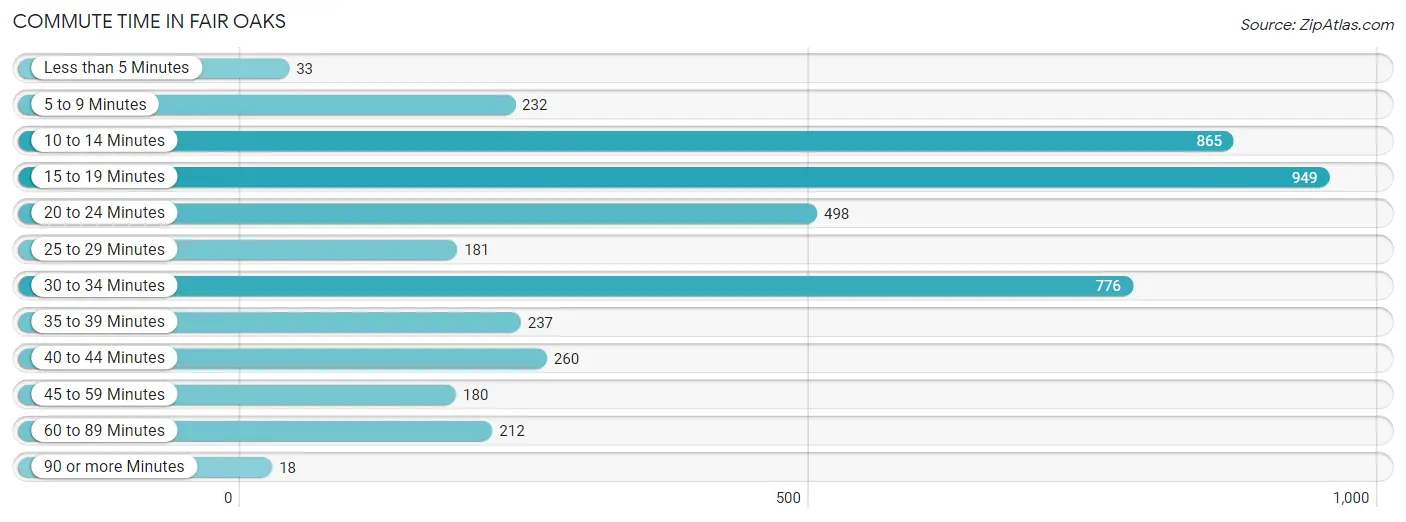
| Commute Time | # Commuters | % Commuters |
| Less than 5 Minutes | 33 | 0.7% |
| 5 to 9 Minutes | 232 | 5.2% |
| 10 to 14 Minutes | 865 | 19.5% |
| 15 to 19 Minutes | 949 | 21.4% |
| 20 to 24 Minutes | 498 | 11.2% |
| 25 to 29 Minutes | 181 | 4.1% |
| 30 to 34 Minutes | 776 | 17.5% |
| 35 to 39 Minutes | 237 | 5.3% |
| 40 to 44 Minutes | 260 | 5.9% |
| 45 to 59 Minutes | 180 | 4.1% |
| 60 to 89 Minutes | 212 | 4.8% |
| 90 or more Minutes | 18 | 0.4% |
Commute Time by Sex in Fair Oaks
The most common commute times in Fair Oaks are 10 to 14 minutes (681 commuters, 26.9%) for males and 15 to 19 minutes (567 commuters, 29.7%) for females.
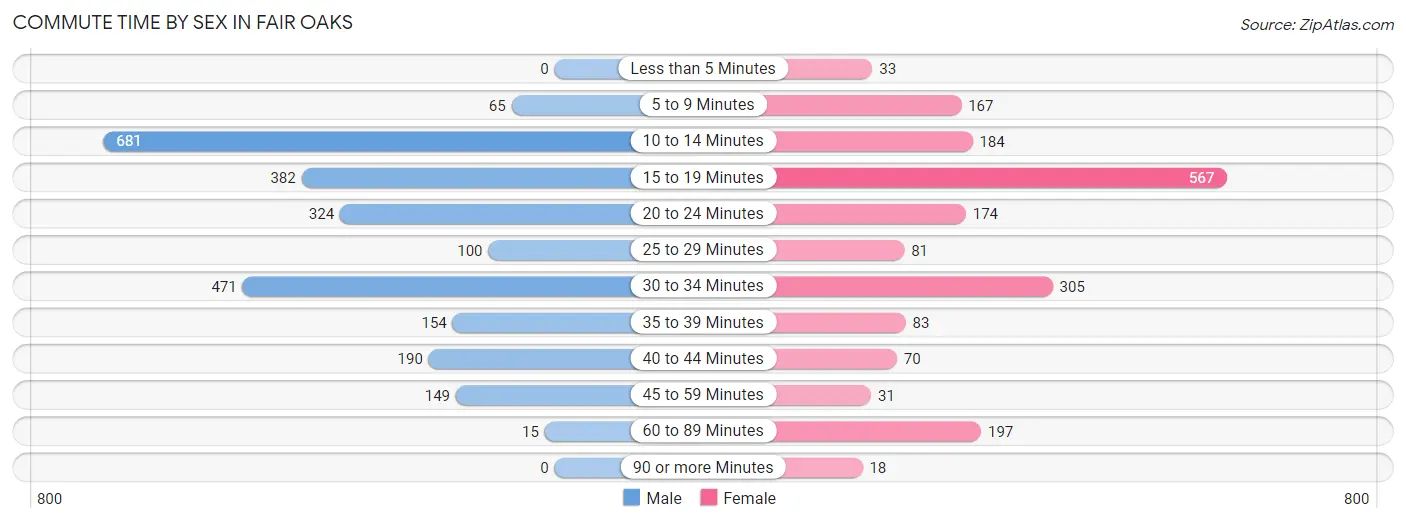
| Commute Time | Male | Female |
| Less than 5 Minutes | 0 (0.0%) | 33 (1.7%) |
| 5 to 9 Minutes | 65 (2.6%) | 167 (8.7%) |
| 10 to 14 Minutes | 681 (26.9%) | 184 (9.6%) |
| 15 to 19 Minutes | 382 (15.1%) | 567 (29.7%) |
| 20 to 24 Minutes | 324 (12.8%) | 174 (9.1%) |
| 25 to 29 Minutes | 100 (4.0%) | 81 (4.2%) |
| 30 to 34 Minutes | 471 (18.6%) | 305 (16.0%) |
| 35 to 39 Minutes | 154 (6.1%) | 83 (4.3%) |
| 40 to 44 Minutes | 190 (7.5%) | 70 (3.7%) |
| 45 to 59 Minutes | 149 (5.9%) | 31 (1.6%) |
| 60 to 89 Minutes | 15 (0.6%) | 197 (10.3%) |
| 90 or more Minutes | 0 (0.0%) | 18 (0.9%) |
Time of Departure to Work by Sex in Fair Oaks
The most frequent times of departure to work in Fair Oaks are 6:00 AM to 6:29 AM (544, 21.5%) for males and 8:00 AM to 8:29 AM (307, 16.1%) for females.
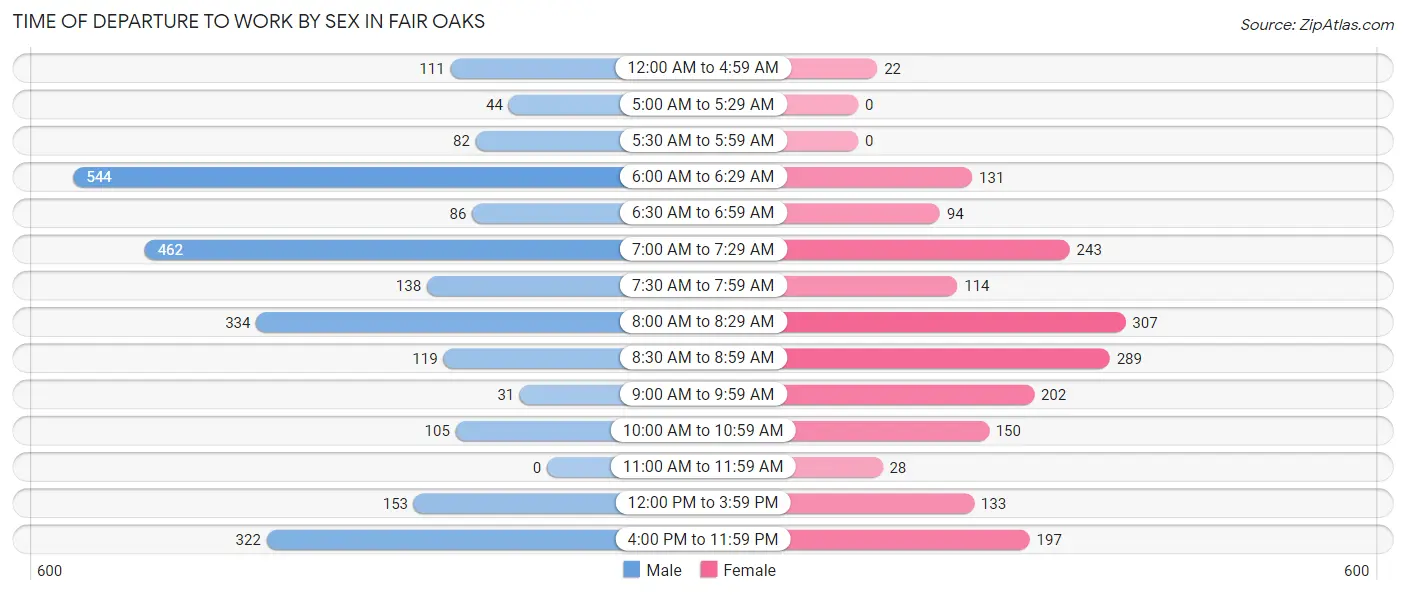
| Time of Departure | Male | Female |
| 12:00 AM to 4:59 AM | 111 (4.4%) | 22 (1.1%) |
| 5:00 AM to 5:29 AM | 44 (1.7%) | 0 (0.0%) |
| 5:30 AM to 5:59 AM | 82 (3.2%) | 0 (0.0%) |
| 6:00 AM to 6:29 AM | 544 (21.5%) | 131 (6.9%) |
| 6:30 AM to 6:59 AM | 86 (3.4%) | 94 (4.9%) |
| 7:00 AM to 7:29 AM | 462 (18.2%) | 243 (12.7%) |
| 7:30 AM to 7:59 AM | 138 (5.4%) | 114 (6.0%) |
| 8:00 AM to 8:29 AM | 334 (13.2%) | 307 (16.1%) |
| 8:30 AM to 8:59 AM | 119 (4.7%) | 289 (15.1%) |
| 9:00 AM to 9:59 AM | 31 (1.2%) | 202 (10.6%) |
| 10:00 AM to 10:59 AM | 105 (4.2%) | 150 (7.9%) |
| 11:00 AM to 11:59 AM | 0 (0.0%) | 28 (1.5%) |
| 12:00 PM to 3:59 PM | 153 (6.0%) | 133 (7.0%) |
| 4:00 PM to 11:59 PM | 322 (12.7%) | 197 (10.3%) |
| Total | 2,531 (100.0%) | 1,910 (100.0%) |
Housing Occupancy in Fair Oaks
Occupancy by Ownership in Fair Oaks
Of the total 3,189 dwellings in Fair Oaks, owner-occupied units account for 1,226 (38.4%), while renter-occupied units make up 1,963 (61.6%).
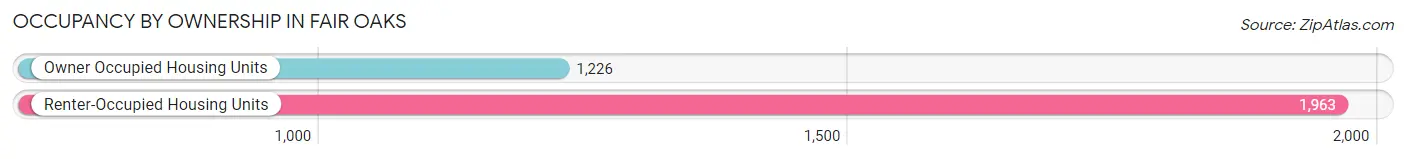
| Occupancy | # Housing Units | % Housing Units |
| Owner Occupied Housing Units | 1,226 | 38.4% |
| Renter-Occupied Housing Units | 1,963 | 61.6% |
| Total Occupied Housing Units | 3,189 | 100.0% |
Occupancy by Household Size in Fair Oaks
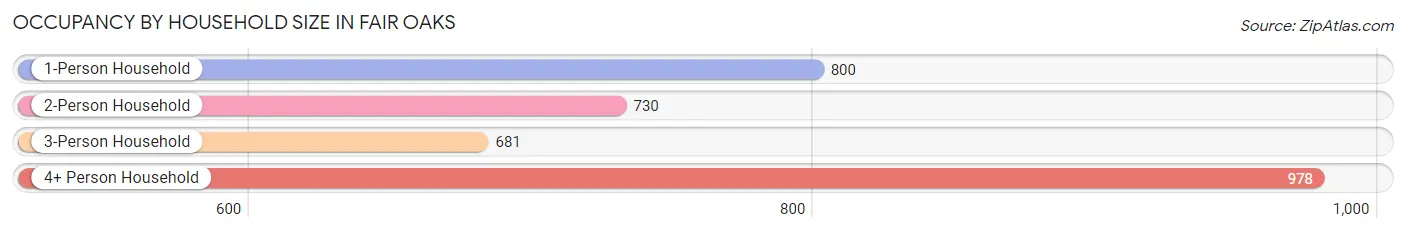
| Household Size | # Housing Units | % Housing Units |
| 1-Person Household | 800 | 25.1% |
| 2-Person Household | 730 | 22.9% |
| 3-Person Household | 681 | 21.3% |
| 4+ Person Household | 978 | 30.7% |
| Total Housing Units | 3,189 | 100.0% |
Occupancy by Ownership by Household Size in Fair Oaks
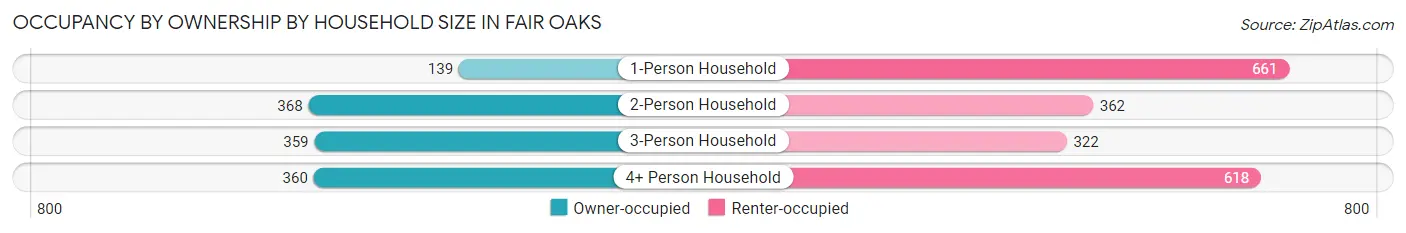
| Household Size | Owner-occupied | Renter-occupied |
| 1-Person Household | 139 (17.4%) | 661 (82.6%) |
| 2-Person Household | 368 (50.4%) | 362 (49.6%) |
| 3-Person Household | 359 (52.7%) | 322 (47.3%) |
| 4+ Person Household | 360 (36.8%) | 618 (63.2%) |
| Total Housing Units | 1,226 (38.4%) | 1,963 (61.6%) |
Occupancy by Educational Attainment in Fair Oaks
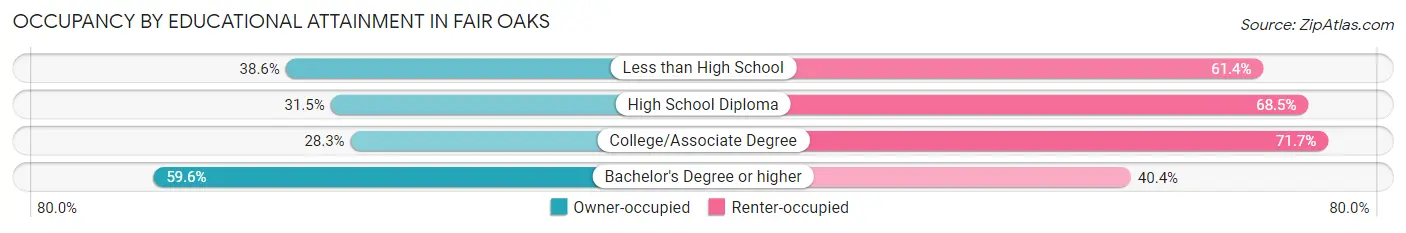
| Household Size | Owner-occupied | Renter-occupied |
| Less than High School | 308 (38.6%) | 490 (61.4%) |
| High School Diploma | 225 (31.5%) | 490 (68.5%) |
| College/Associate Degree | 277 (28.3%) | 701 (71.7%) |
| Bachelor's Degree or higher | 416 (59.6%) | 282 (40.4%) |
Occupancy by Age of Householder in Fair Oaks
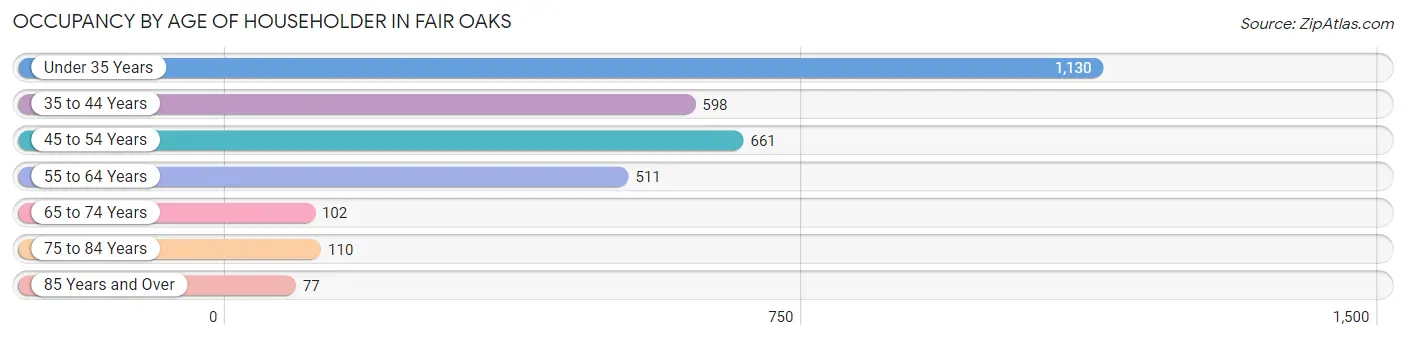
| Age Bracket | # Households | % Households |
| Under 35 Years | 1,130 | 35.4% |
| 35 to 44 Years | 598 | 18.8% |
| 45 to 54 Years | 661 | 20.7% |
| 55 to 64 Years | 511 | 16.0% |
| 65 to 74 Years | 102 | 3.2% |
| 75 to 84 Years | 110 | 3.5% |
| 85 Years and Over | 77 | 2.4% |
| Total | 3,189 | 100.0% |
Housing Finances in Fair Oaks
Median Income by Occupancy in Fair Oaks
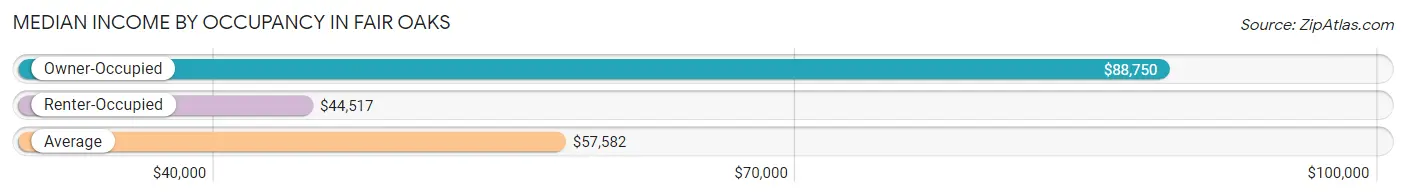
| Occupancy Type | # Households | Median Income |
| Owner-Occupied | 1,226 (38.4%) | $88,750 |
| Renter-Occupied | 1,963 (61.6%) | $44,517 |
| Average | 3,189 (100.0%) | $57,582 |
Occupancy by Householder Income Bracket in Fair Oaks
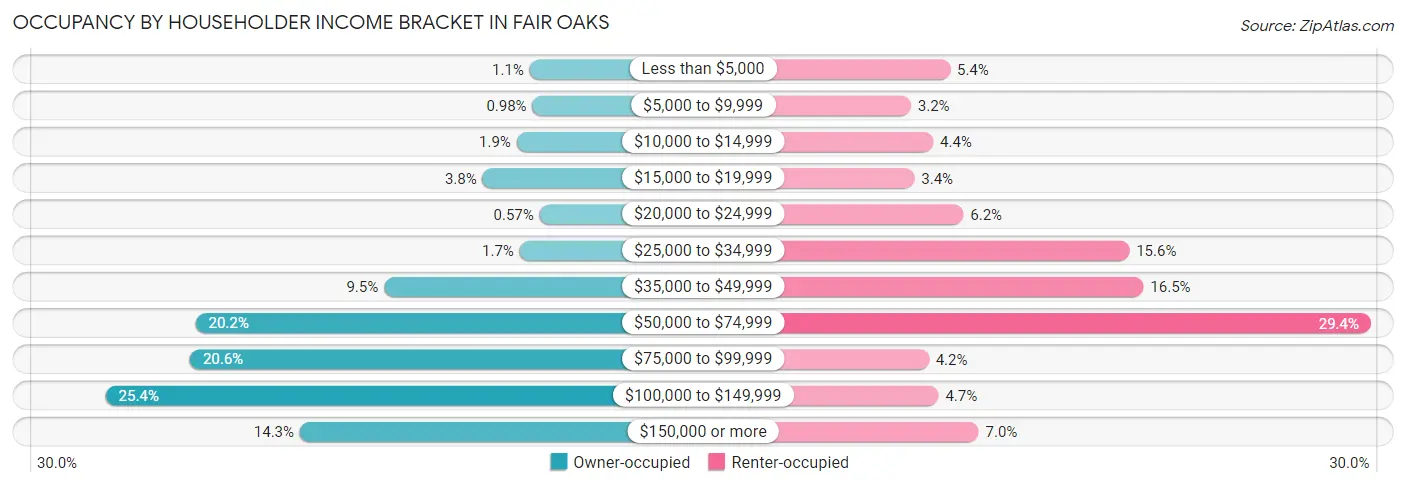
| Income Bracket | Owner-occupied | Renter-occupied |
| Less than $5,000 | 14 (1.1%) | 106 (5.4%) |
| $5,000 to $9,999 | 12 (1.0%) | 62 (3.2%) |
| $10,000 to $14,999 | 23 (1.9%) | 87 (4.4%) |
| $15,000 to $19,999 | 47 (3.8%) | 66 (3.4%) |
| $20,000 to $24,999 | 7 (0.6%) | 121 (6.2%) |
| $25,000 to $34,999 | 21 (1.7%) | 307 (15.6%) |
| $35,000 to $49,999 | 116 (9.5%) | 323 (16.5%) |
| $50,000 to $74,999 | 248 (20.2%) | 578 (29.4%) |
| $75,000 to $99,999 | 252 (20.5%) | 82 (4.2%) |
| $100,000 to $149,999 | 311 (25.4%) | 93 (4.7%) |
| $150,000 or more | 175 (14.3%) | 138 (7.0%) |
| Total | 1,226 (100.0%) | 1,963 (100.0%) |
Monthly Housing Cost Tiers in Fair Oaks
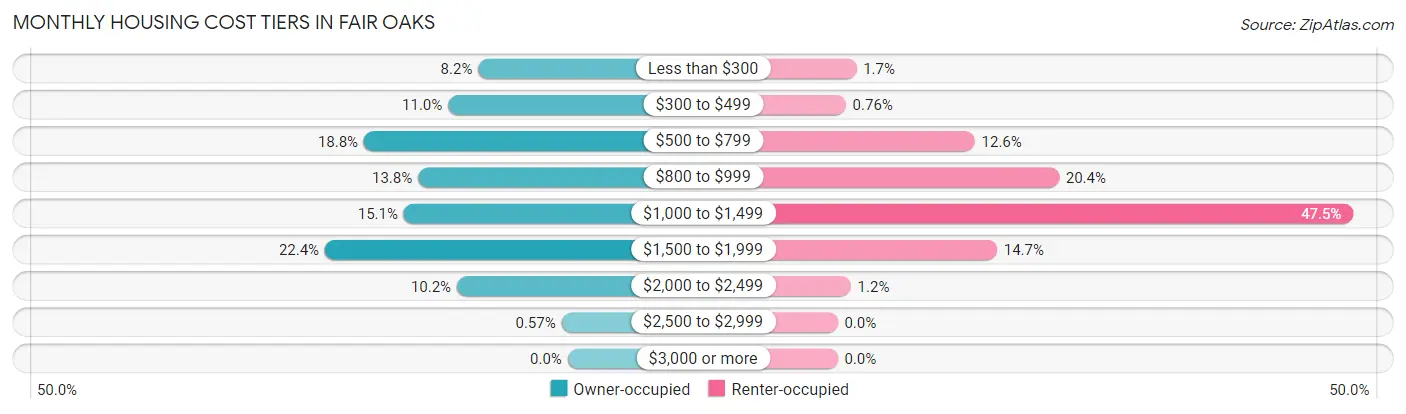
| Monthly Cost | Owner-occupied | Renter-occupied |
| Less than $300 | 101 (8.2%) | 34 (1.7%) |
| $300 to $499 | 135 (11.0%) | 15 (0.8%) |
| $500 to $799 | 230 (18.8%) | 248 (12.6%) |
| $800 to $999 | 169 (13.8%) | 400 (20.4%) |
| $1,000 to $1,499 | 185 (15.1%) | 932 (47.5%) |
| $1,500 to $1,999 | 274 (22.4%) | 288 (14.7%) |
| $2,000 to $2,499 | 125 (10.2%) | 24 (1.2%) |
| $2,500 to $2,999 | 7 (0.6%) | 0 (0.0%) |
| $3,000 or more | 0 (0.0%) | 0 (0.0%) |
| Total | 1,226 (100.0%) | 1,963 (100.0%) |
Physical Housing Characteristics in Fair Oaks
Housing Structures in Fair Oaks
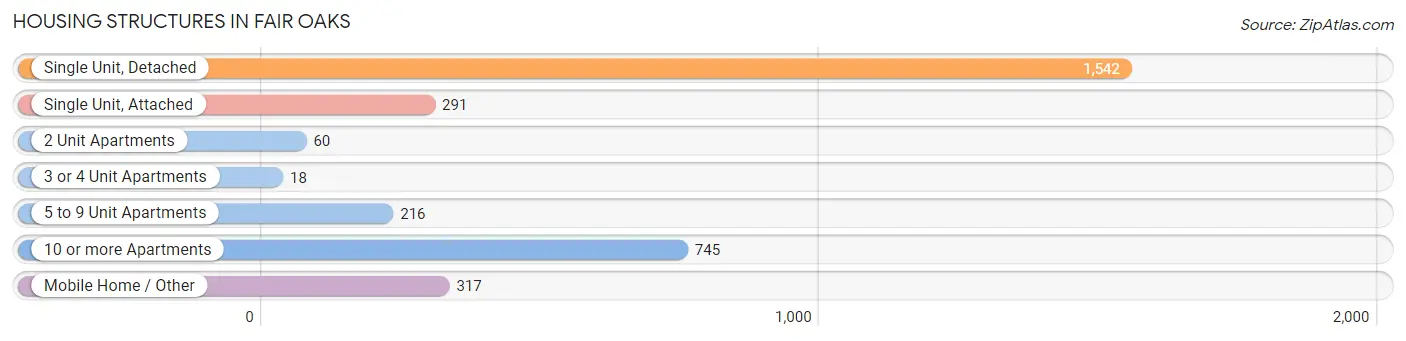
| Structure Type | # Housing Units | % Housing Units |
| Single Unit, Detached | 1,542 | 48.3% |
| Single Unit, Attached | 291 | 9.1% |
| 2 Unit Apartments | 60 | 1.9% |
| 3 or 4 Unit Apartments | 18 | 0.6% |
| 5 to 9 Unit Apartments | 216 | 6.8% |
| 10 or more Apartments | 745 | 23.4% |
| Mobile Home / Other | 317 | 9.9% |
| Total | 3,189 | 100.0% |
Housing Structures by Occupancy in Fair Oaks
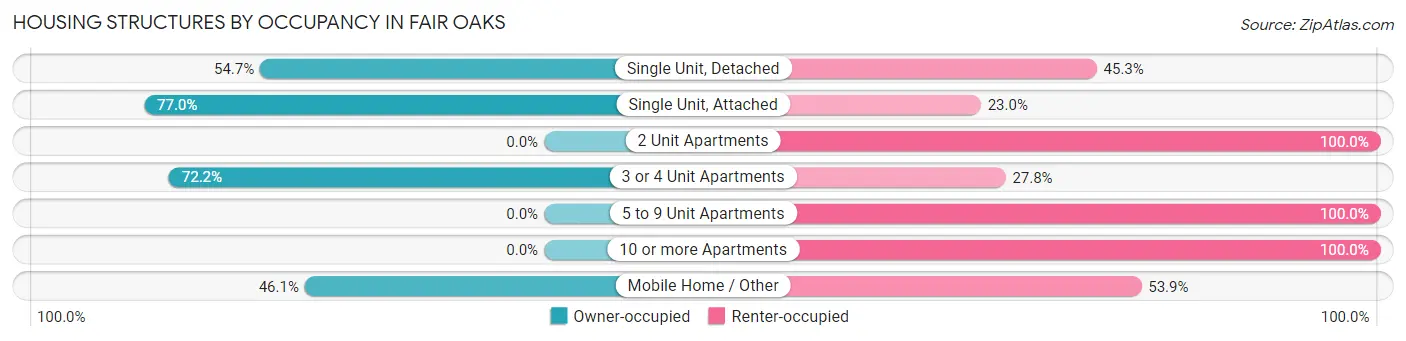
| Structure Type | Owner-occupied | Renter-occupied |
| Single Unit, Detached | 843 (54.7%) | 699 (45.3%) |
| Single Unit, Attached | 224 (77.0%) | 67 (23.0%) |
| 2 Unit Apartments | 0 (0.0%) | 60 (100.0%) |
| 3 or 4 Unit Apartments | 13 (72.2%) | 5 (27.8%) |
| 5 to 9 Unit Apartments | 0 (0.0%) | 216 (100.0%) |
| 10 or more Apartments | 0 (0.0%) | 745 (100.0%) |
| Mobile Home / Other | 146 (46.1%) | 171 (53.9%) |
| Total | 1,226 (38.4%) | 1,963 (61.6%) |
Housing Structures by Number of Rooms in Fair Oaks
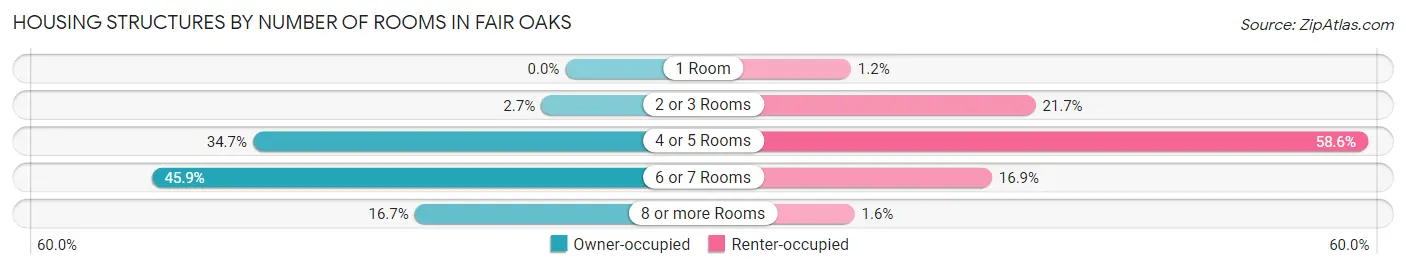
| Number of Rooms | Owner-occupied | Renter-occupied |
| 1 Room | 0 (0.0%) | 24 (1.2%) |
| 2 or 3 Rooms | 33 (2.7%) | 426 (21.7%) |
| 4 or 5 Rooms | 425 (34.7%) | 1,150 (58.6%) |
| 6 or 7 Rooms | 563 (45.9%) | 331 (16.9%) |
| 8 or more Rooms | 205 (16.7%) | 32 (1.6%) |
| Total | 1,226 (100.0%) | 1,963 (100.0%) |
Housing Structure by Heating Type in Fair Oaks
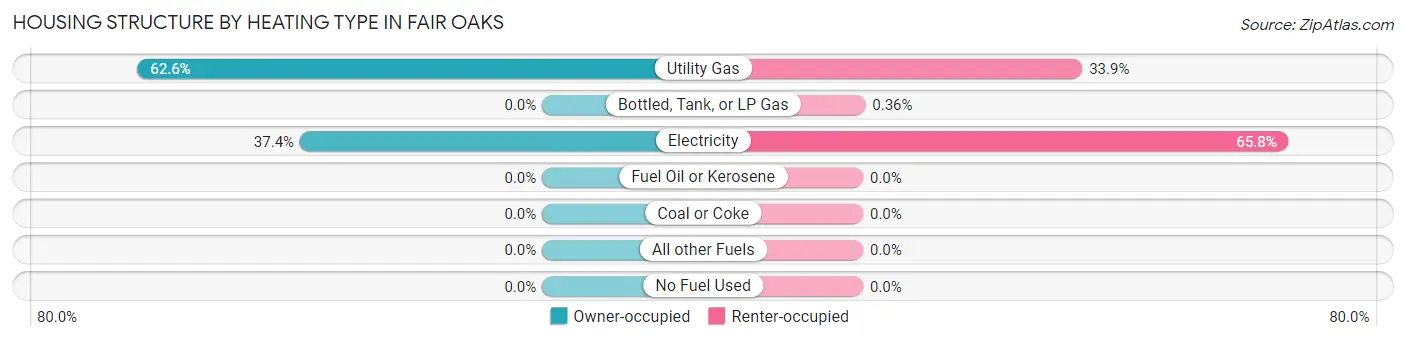
| Heating Type | Owner-occupied | Renter-occupied |
| Utility Gas | 767 (62.6%) | 665 (33.9%) |
| Bottled, Tank, or LP Gas | 0 (0.0%) | 7 (0.4%) |
| Electricity | 459 (37.4%) | 1,291 (65.8%) |
| Fuel Oil or Kerosene | 0 (0.0%) | 0 (0.0%) |
| Coal or Coke | 0 (0.0%) | 0 (0.0%) |
| All other Fuels | 0 (0.0%) | 0 (0.0%) |
| No Fuel Used | 0 (0.0%) | 0 (0.0%) |
| Total | 1,226 (100.0%) | 1,963 (100.0%) |
Household Vehicle Usage in Fair Oaks
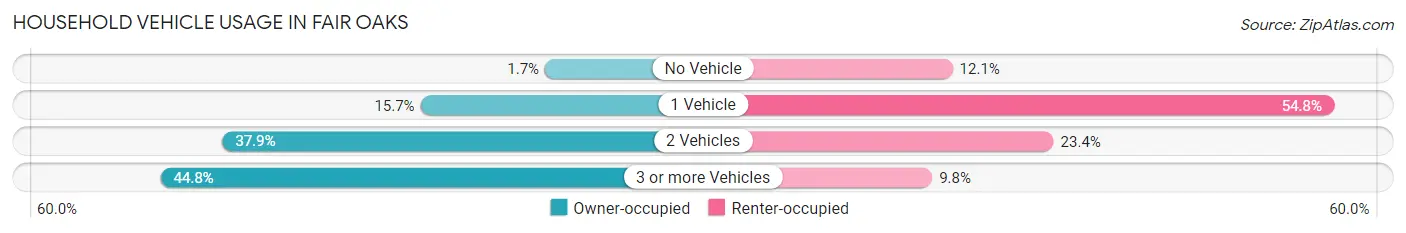
| Vehicles per Household | Owner-occupied | Renter-occupied |
| No Vehicle | 21 (1.7%) | 237 (12.1%) |
| 1 Vehicle | 192 (15.7%) | 1,075 (54.8%) |
| 2 Vehicles | 464 (37.9%) | 459 (23.4%) |
| 3 or more Vehicles | 549 (44.8%) | 192 (9.8%) |
| Total | 1,226 (100.0%) | 1,963 (100.0%) |
Real Estate & Mortgages in Fair Oaks
Real Estate and Mortgage Overview in Fair Oaks
| Characteristic | Without Mortgage | With Mortgage |
| Housing Units | 413 | 813 |
| Median Property Value | $174,000 | $204,400 |
| Median Household Income | $69,095 | $155 |
| Monthly Housing Costs | $448 | $0 |
| Real Estate Taxes | $577 | $27 |
Property Value by Mortgage Status in Fair Oaks
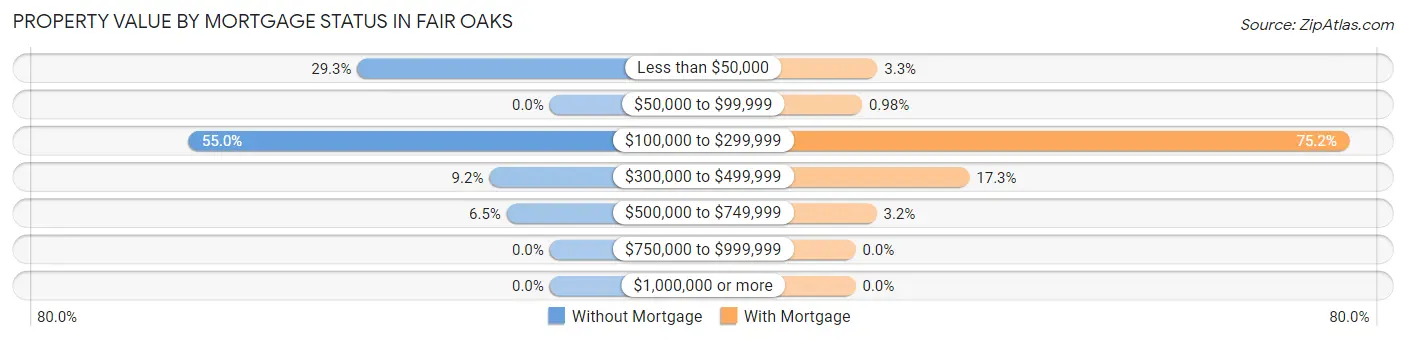
| Property Value | Without Mortgage | With Mortgage |
| Less than $50,000 | 121 (29.3%) | 27 (3.3%) |
| $50,000 to $99,999 | 0 (0.0%) | 8 (1.0%) |
| $100,000 to $299,999 | 227 (55.0%) | 611 (75.1%) |
| $300,000 to $499,999 | 38 (9.2%) | 141 (17.3%) |
| $500,000 to $749,999 | 27 (6.5%) | 26 (3.2%) |
| $750,000 to $999,999 | 0 (0.0%) | 0 (0.0%) |
| $1,000,000 or more | 0 (0.0%) | 0 (0.0%) |
| Total | 413 (100.0%) | 813 (100.0%) |
Household Income by Mortgage Status in Fair Oaks
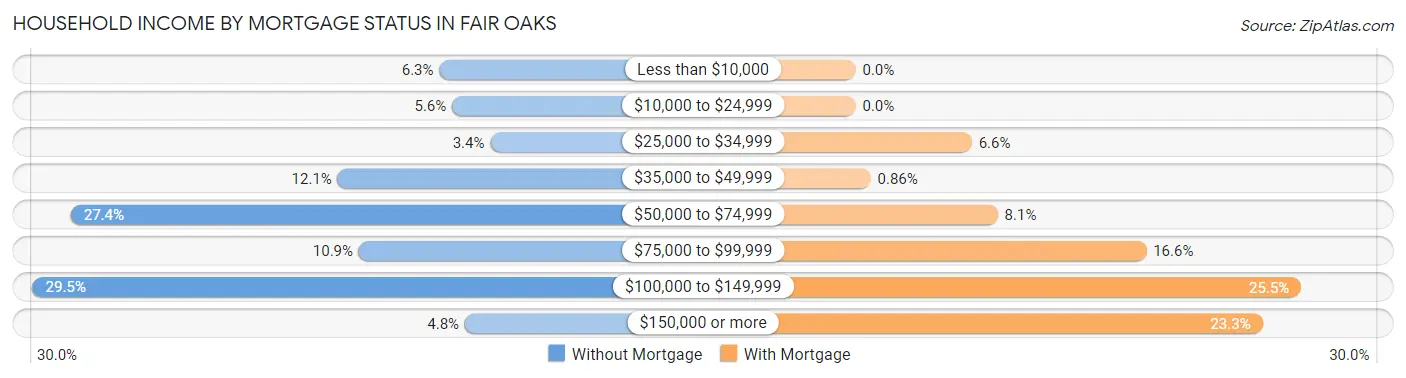
| Household Income | Without Mortgage | With Mortgage |
| Less than $10,000 | 26 (6.3%) | 0 (0.0%) |
| $10,000 to $24,999 | 23 (5.6%) | 0 (0.0%) |
| $25,000 to $34,999 | 14 (3.4%) | 54 (6.6%) |
| $35,000 to $49,999 | 50 (12.1%) | 7 (0.9%) |
| $50,000 to $74,999 | 113 (27.4%) | 66 (8.1%) |
| $75,000 to $99,999 | 45 (10.9%) | 135 (16.6%) |
| $100,000 to $149,999 | 122 (29.5%) | 207 (25.5%) |
| $150,000 or more | 20 (4.8%) | 189 (23.3%) |
| Total | 413 (100.0%) | 813 (100.0%) |
Property Value to Household Income Ratio in Fair Oaks
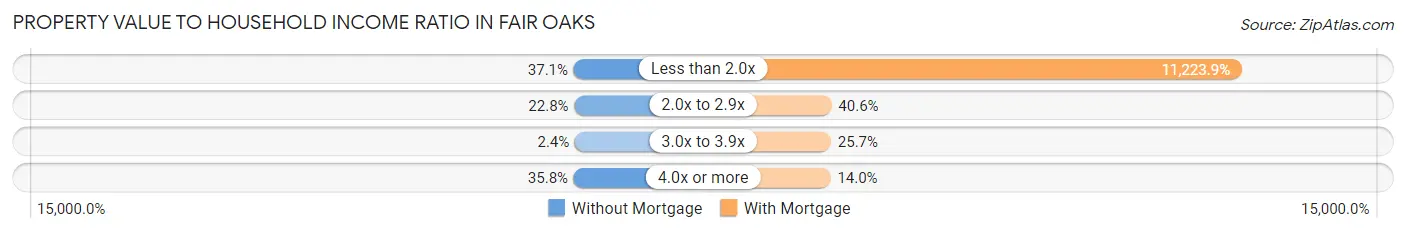
| Value-to-Income Ratio | Without Mortgage | With Mortgage |
| Less than 2.0x | 153 (37.0%) | 91,250 (11,223.9%) |
| 2.0x to 2.9x | 94 (22.8%) | 330 (40.6%) |
| 3.0x to 3.9x | 10 (2.4%) | 209 (25.7%) |
| 4.0x or more | 148 (35.8%) | 114 (14.0%) |
| Total | 413 (100.0%) | 813 (100.0%) |
Real Estate Taxes by Mortgage Status in Fair Oaks
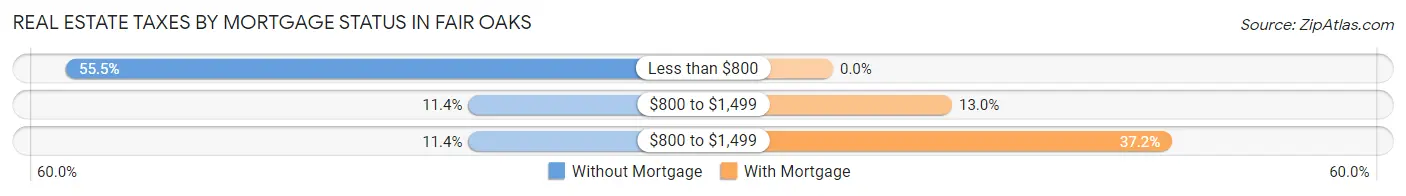
| Property Taxes | Without Mortgage | With Mortgage |
| Less than $800 | 229 (55.4%) | 0 (0.0%) |
| $800 to $1,499 | 47 (11.4%) | 106 (13.0%) |
| $800 to $1,499 | 47 (11.4%) | 302 (37.1%) |
| Total | 413 (100.0%) | 813 (100.0%) |
Health & Disability in Fair Oaks
Health Insurance Coverage by Age in Fair Oaks
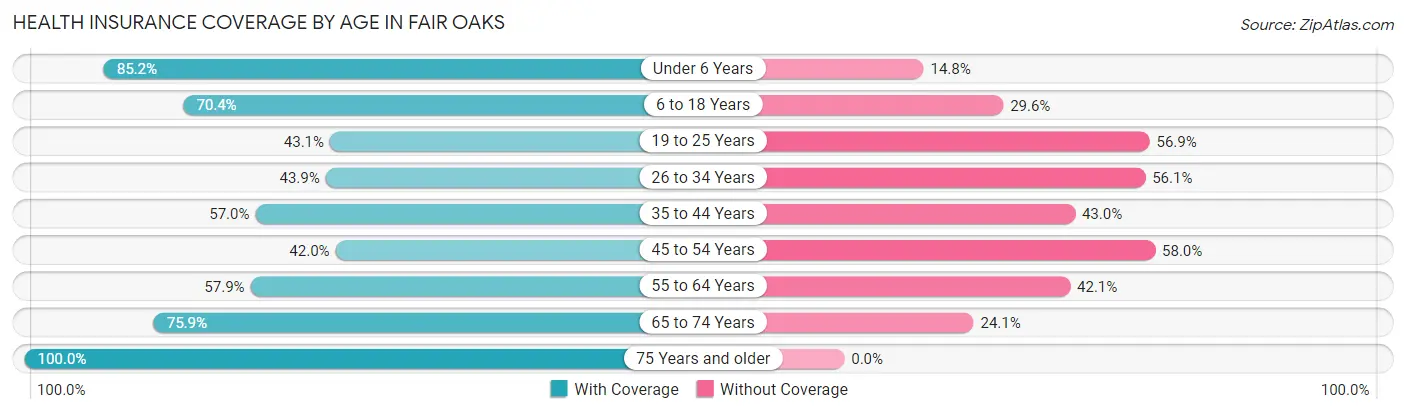
| Age Bracket | With Coverage | Without Coverage |
| Under 6 Years | 744 (85.2%) | 129 (14.8%) |
| 6 to 18 Years | 1,368 (70.4%) | 576 (29.6%) |
| 19 to 25 Years | 525 (43.1%) | 694 (56.9%) |
| 26 to 34 Years | 724 (43.9%) | 926 (56.1%) |
| 35 to 44 Years | 608 (57.0%) | 459 (43.0%) |
| 45 to 54 Years | 512 (42.0%) | 706 (58.0%) |
| 55 to 64 Years | 550 (57.9%) | 400 (42.1%) |
| 65 to 74 Years | 296 (75.9%) | 94 (24.1%) |
| 75 Years and older | 303 (100.0%) | 0 (0.0%) |
| Total | 5,630 (58.6%) | 3,984 (41.4%) |
Health Insurance Coverage by Citizenship Status in Fair Oaks
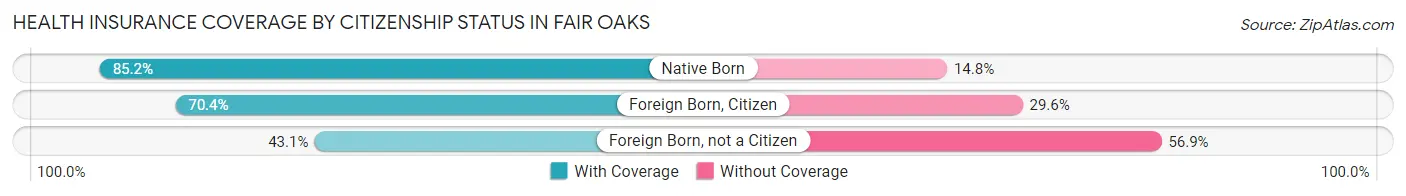
| Citizenship Status | With Coverage | Without Coverage |
| Native Born | 744 (85.2%) | 129 (14.8%) |
| Foreign Born, Citizen | 1,368 (70.4%) | 576 (29.6%) |
| Foreign Born, not a Citizen | 525 (43.1%) | 694 (56.9%) |
Health Insurance Coverage by Household Income in Fair Oaks
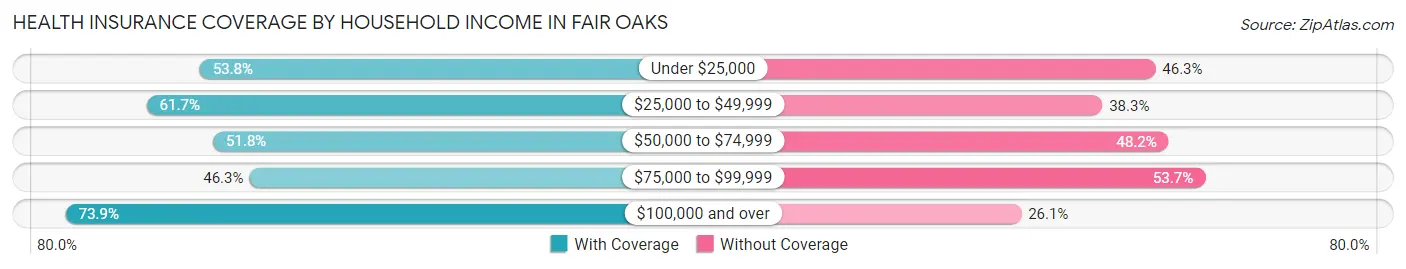
| Household Income | With Coverage | Without Coverage |
| Under $25,000 | 602 (53.7%) | 518 (46.3%) |
| $25,000 to $49,999 | 1,136 (61.7%) | 705 (38.3%) |
| $50,000 to $74,999 | 1,477 (51.8%) | 1,376 (48.2%) |
| $75,000 to $99,999 | 668 (46.3%) | 774 (53.7%) |
| $100,000 and over | 1,726 (73.9%) | 611 (26.1%) |
Public vs Private Health Insurance Coverage by Age in Fair Oaks
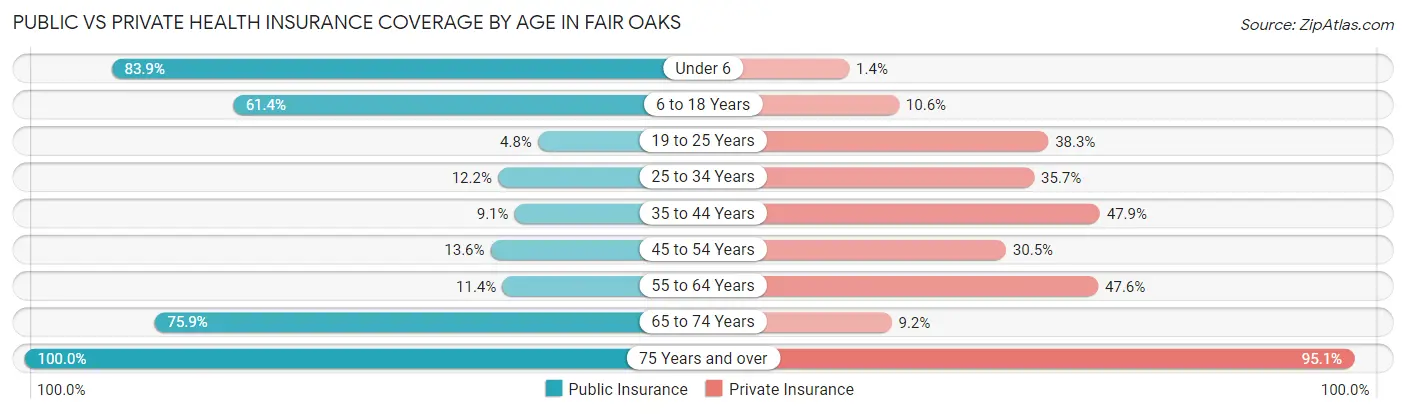
| Age Bracket | Public Insurance | Private Insurance |
| Under 6 | 732 (83.9%) | 12 (1.4%) |
| 6 to 18 Years | 1,193 (61.4%) | 206 (10.6%) |
| 19 to 25 Years | 58 (4.8%) | 467 (38.3%) |
| 25 to 34 Years | 201 (12.2%) | 589 (35.7%) |
| 35 to 44 Years | 97 (9.1%) | 511 (47.9%) |
| 45 to 54 Years | 165 (13.6%) | 371 (30.5%) |
| 55 to 64 Years | 108 (11.4%) | 452 (47.6%) |
| 65 to 74 Years | 296 (75.9%) | 36 (9.2%) |
| 75 Years and over | 303 (100.0%) | 288 (95.1%) |
| Total | 3,153 (32.8%) | 2,932 (30.5%) |
Disability Status by Sex by Age in Fair Oaks
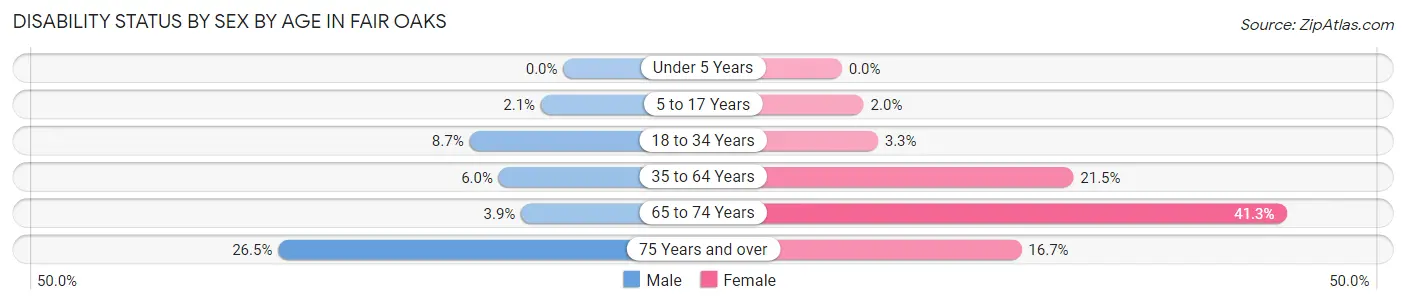
| Age Bracket | Male | Female |
| Under 5 Years | 0 (0.0%) | 0 (0.0%) |
| 5 to 17 Years | 20 (2.1%) | 21 (2.0%) |
| 18 to 34 Years | 119 (8.7%) | 54 (3.3%) |
| 35 to 64 Years | 91 (6.0%) | 369 (21.5%) |
| 65 to 74 Years | 9 (3.9%) | 66 (41.2%) |
| 75 Years and over | 50 (26.5%) | 19 (16.7%) |
Disability Class by Sex by Age in Fair Oaks
Disability Class: Hearing Difficulty
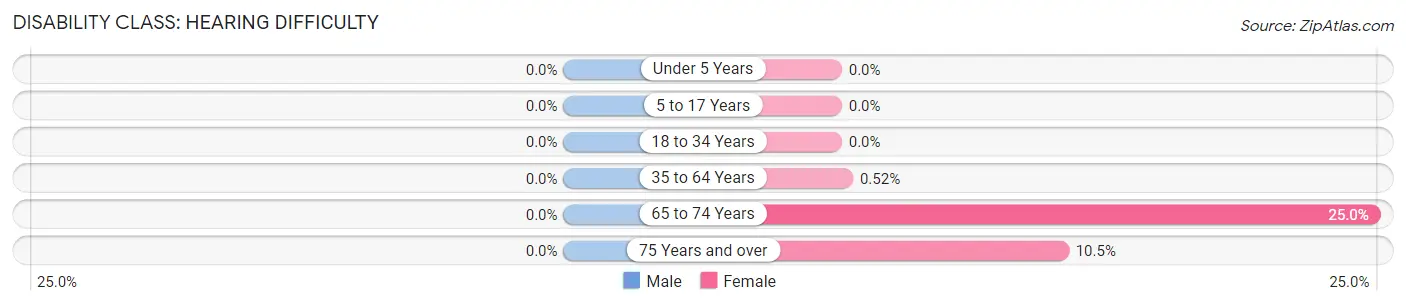
| Age Bracket | Male | Female |
| Under 5 Years | 0 (0.0%) | 0 (0.0%) |
| 5 to 17 Years | 0 (0.0%) | 0 (0.0%) |
| 18 to 34 Years | 0 (0.0%) | 0 (0.0%) |
| 35 to 64 Years | 0 (0.0%) | 9 (0.5%) |
| 65 to 74 Years | 0 (0.0%) | 40 (25.0%) |
| 75 Years and over | 0 (0.0%) | 12 (10.5%) |
Disability Class: Vision Difficulty
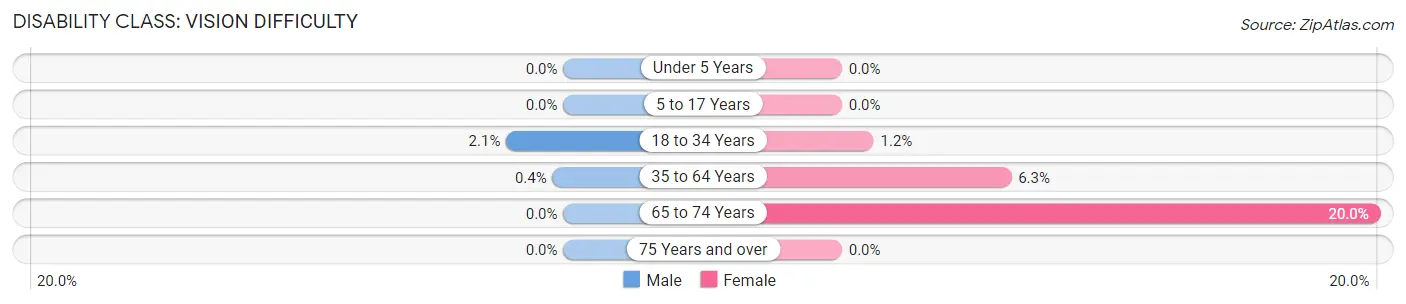
| Age Bracket | Male | Female |
| Under 5 Years | 0 (0.0%) | 0 (0.0%) |
| 5 to 17 Years | 0 (0.0%) | 0 (0.0%) |
| 18 to 34 Years | 29 (2.1%) | 19 (1.2%) |
| 35 to 64 Years | 6 (0.4%) | 108 (6.3%) |
| 65 to 74 Years | 0 (0.0%) | 32 (20.0%) |
| 75 Years and over | 0 (0.0%) | 0 (0.0%) |
Disability Class: Cognitive Difficulty
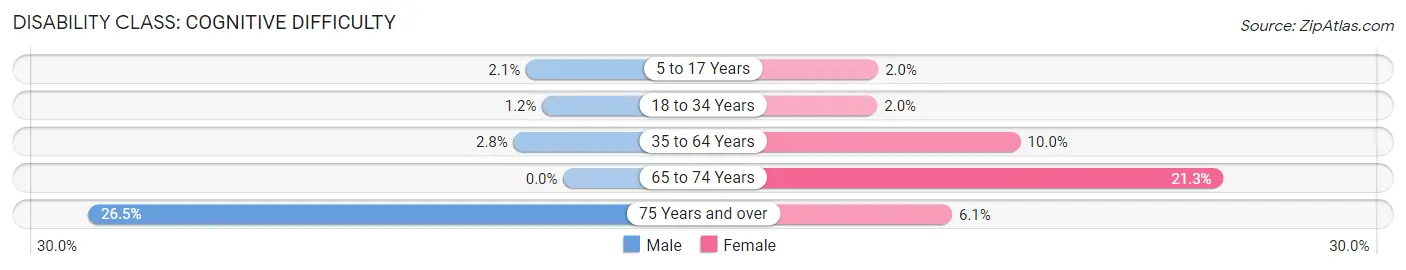
| Age Bracket | Male | Female |
| 5 to 17 Years | 20 (2.1%) | 21 (2.0%) |
| 18 to 34 Years | 16 (1.2%) | 32 (2.0%) |
| 35 to 64 Years | 42 (2.8%) | 171 (10.0%) |
| 65 to 74 Years | 0 (0.0%) | 34 (21.2%) |
| 75 Years and over | 50 (26.5%) | 7 (6.1%) |
Disability Class: Ambulatory Difficulty
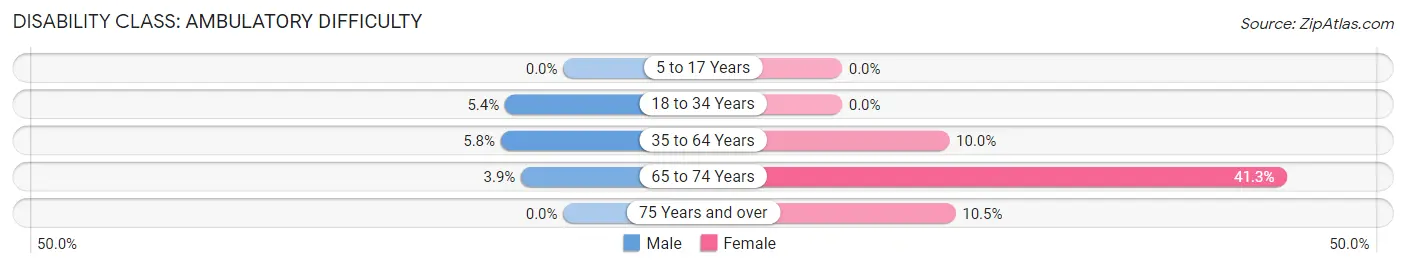
| Age Bracket | Male | Female |
| 5 to 17 Years | 0 (0.0%) | 0 (0.0%) |
| 18 to 34 Years | 74 (5.4%) | 0 (0.0%) |
| 35 to 64 Years | 88 (5.8%) | 171 (10.0%) |
| 65 to 74 Years | 9 (3.9%) | 66 (41.2%) |
| 75 Years and over | 0 (0.0%) | 12 (10.5%) |
Disability Class: Self-Care Difficulty
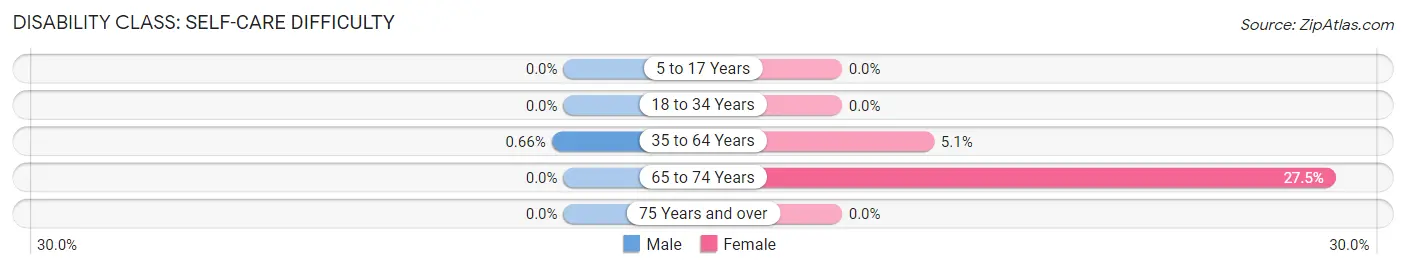
| Age Bracket | Male | Female |
| 5 to 17 Years | 0 (0.0%) | 0 (0.0%) |
| 18 to 34 Years | 0 (0.0%) | 0 (0.0%) |
| 35 to 64 Years | 10 (0.7%) | 88 (5.1%) |
| 65 to 74 Years | 0 (0.0%) | 44 (27.5%) |
| 75 Years and over | 0 (0.0%) | 0 (0.0%) |
Technology Access in Fair Oaks
Computing Device Access in Fair Oaks
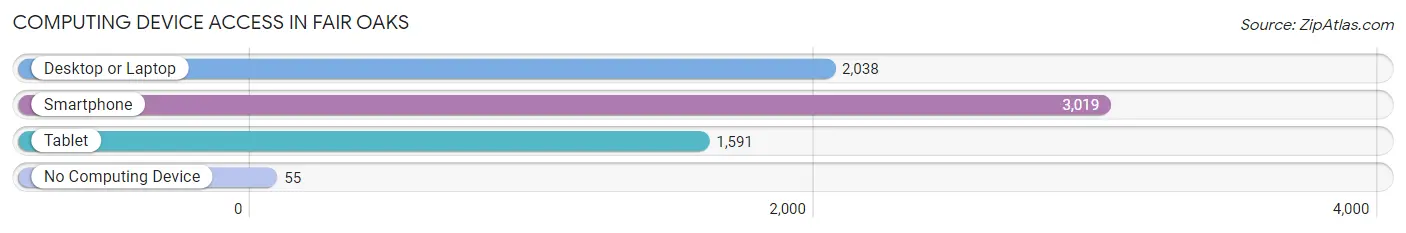
| Device Type | # Households | % Households |
| Desktop or Laptop | 2,038 | 63.9% |
| Smartphone | 3,019 | 94.7% |
| Tablet | 1,591 | 49.9% |
| No Computing Device | 55 | 1.7% |
| Total | 3,189 | 100.0% |
Internet Access in Fair Oaks
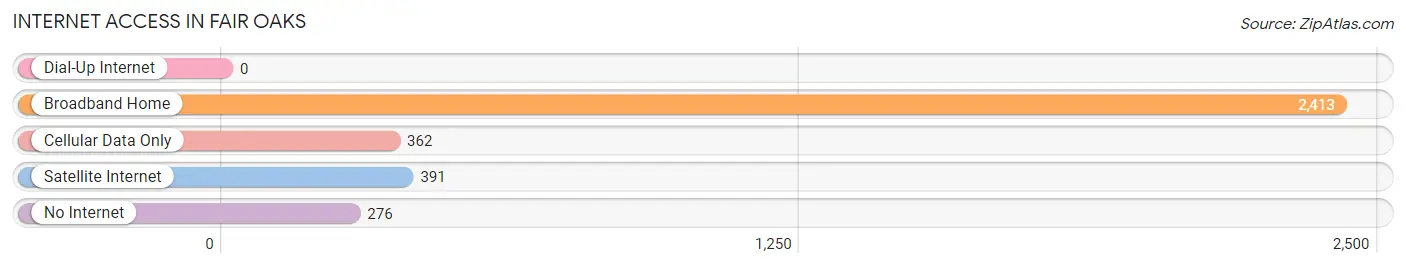
| Internet Type | # Households | % Households |
| Dial-Up Internet | 0 | 0.0% |
| Broadband Home | 2,413 | 75.7% |
| Cellular Data Only | 362 | 11.4% |
| Satellite Internet | 391 | 12.3% |
| No Internet | 276 | 8.6% |
| Total | 3,189 | 100.0% |
Fair Oaks Summary
Founded in 1820, Fair Oaks, Georgia is a small town located in the northeastern corner of the state. It is situated in the foothills of the Appalachian Mountains and is part of the Chattahoochee National Forest. The town is home to a population of just over 1,000 people and is known for its rural charm and small-town atmosphere.
Geography
Fair Oaks is located in the northeastern corner of Georgia, in the foothills of the Appalachian Mountains. It is situated in the Chattahoochee National Forest and is surrounded by the Chattahoochee River to the north, the Etowah River to the east, and the Oostanaula River to the south. The town is located at an elevation of 1,000 feet and has a total area of 1.2 square miles.
The town is located in a temperate climate, with hot summers and mild winters. The average annual temperature is around 60 degrees Fahrenheit, with an average high of around 80 degrees in the summer and an average low of around 40 degrees in the winter. The town receives an average of around 50 inches of precipitation each year, with most of it falling in the form of rain.
Economy
Fair Oaks is a small, rural town with a largely agricultural economy. The town is home to several farms, which produce a variety of crops, including corn, soybeans, wheat, and hay. The town also has a small manufacturing sector, which produces a variety of products, including furniture, clothing, and textiles.
The town is also home to several small businesses, including restaurants, retail stores, and service providers. The town is also home to a few small tourist attractions, including a historic grist mill and a local winery.
Demographics
As of the 2010 census, Fair Oaks had a population of 1,072 people. The town is predominantly white, with a population that is 97.2% white and 2.8% African American. The median household income in the town is $37,500, and the median age is 44.
The town is home to a variety of religious denominations, including Baptist, Methodist, and Presbyterian. The town is also home to a variety of educational institutions, including a public elementary school, a public middle school, and a public high school.
Conclusion
Fair Oaks, Georgia is a small, rural town located in the northeastern corner of the state. It is situated in the foothills of the Appalachian Mountains and is part of the Chattahoochee National Forest. The town is home to a population of just over 1,000 people and is known for its rural charm and small-town atmosphere. The town has a largely agricultural economy, with a few small businesses and tourist attractions. The town is predominantly white, with a population that is 97.2% white and 2.8% African American. The town is home to a variety of religious denominations and educational institutions.
Common Questions
What is the Total Population of Fair Oaks?
Total Population of Fair Oaks is 9,614.
What is the Total Male Population of Fair Oaks?
Total Male Population of Fair Oaks is 4,745.
What is the Total Female Population of Fair Oaks?
Total Female Population of Fair Oaks is 4,869.
What is the Ratio of Males per 100 Females in Fair Oaks?
There are 97.45 Males per 100 Females in Fair Oaks.
What is the Ratio of Females per 100 Males in Fair Oaks?
There are 102.61 Females per 100 Males in Fair Oaks.
What is the Median Population Age in Fair Oaks?
Median Population Age in Fair Oaks is 29.6 Years.
What is the Average Family Size in Fair Oaks
Average Family Size in Fair Oaks is 3.7 People.
What is the Average Household Size in Fair Oaks
Average Household Size in Fair Oaks is 3.0 People.
What is Per Capita Income in Fair Oaks?
Per Capita income in Fair Oaks is $24,626.
What is the Median Family Income in Fair Oaks?
Median Family Income in Fair Oaks is $58,963.
What is the Median Household income in Fair Oaks?
Median Household Income in Fair Oaks is $57,582.
What is Income or Wage Gap in Fair Oaks?
Income or Wage Gap in Fair Oaks is 20.3%.
Women in Fair Oaks earn 79.7 cents for every dollar earned by a man.
What is Family Income Deficit in Fair Oaks?
Family Income Deficit in Fair Oaks is $11,264.
Families that are below poverty line in Fair Oaks earn $11,264 less on average than the poverty threshold level.
What is Inequality or Gini Index in Fair Oaks?
Inequality or Gini Index in Fair Oaks is 0.44.
How Large is the Labor Force in Fair Oaks?
There are 5,433 People in the Labor Forcein in Fair Oaks.
What is the Percentage of People in the Labor Force in Fair Oaks?
75.8% of People are in the Labor Force in Fair Oaks.
What is the Unemployment Rate in Fair Oaks?
Unemployment Rate in Fair Oaks is 6.7%.