Douglasville, GA
Douglasville Map
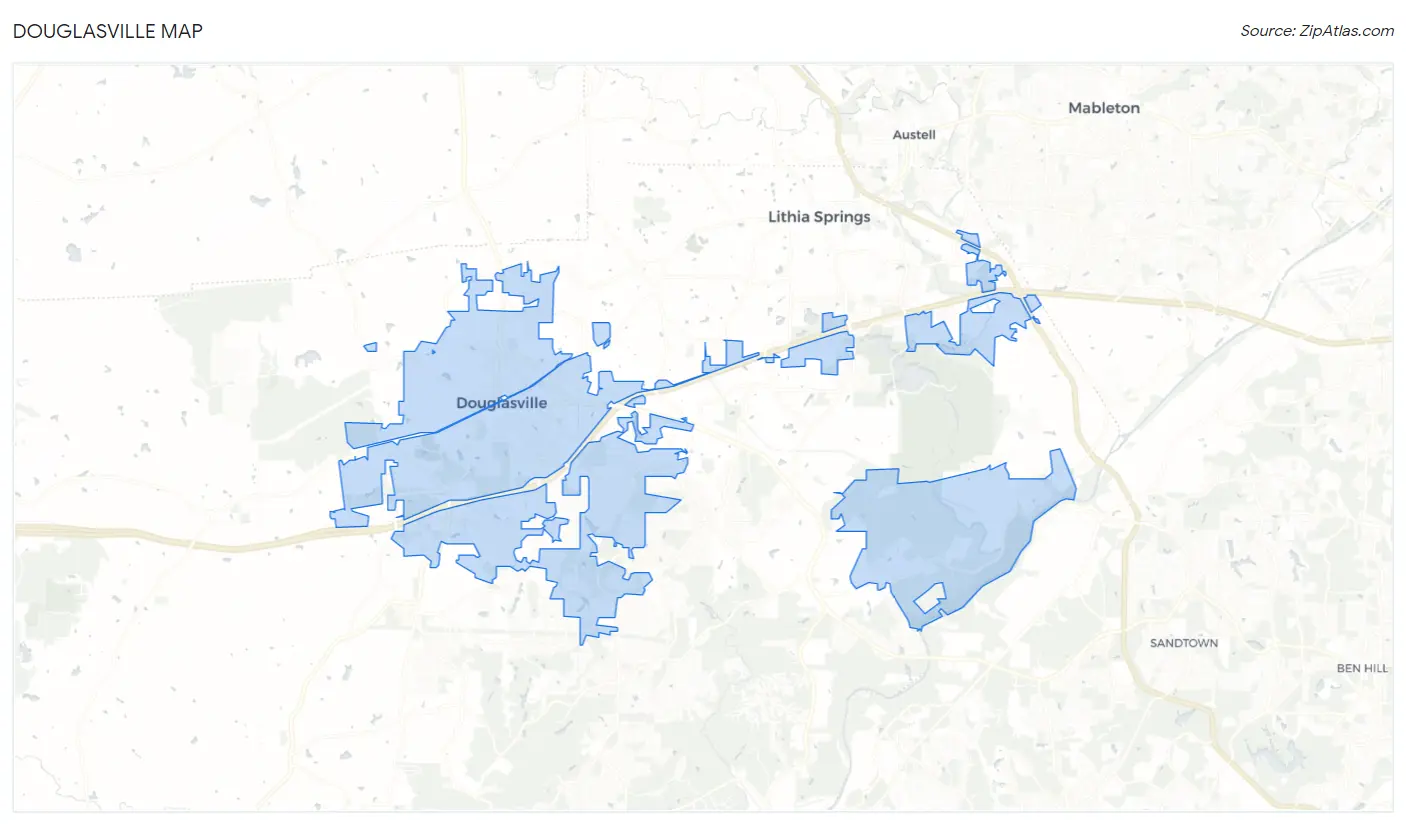
Douglasville Overview
35,252
TOTAL POPULATION
16,613
MALE POPULATION
18,639
FEMALE POPULATION
89.13
MALES / 100 FEMALES
112.20
FEMALES / 100 MALES
36.5
MEDIAN AGE
3.1
AVG FAMILY SIZE
2.5
AVG HOUSEHOLD SIZE
$36,077
PER CAPITA INCOME
$81,165
AVG FAMILY INCOME
$72,753
AVG HOUSEHOLD INCOME
2.1%
WAGE / INCOME GAP [ % ]
97.9¢/ $1
WAGE / INCOME GAP [ $ ]
0.43
INEQUALITY / GINI INDEX
19,129
LABOR FORCE [ PEOPLE ]
70.4%
PERCENT IN LABOR FORCE
5.5%
UNEMPLOYMENT RATE
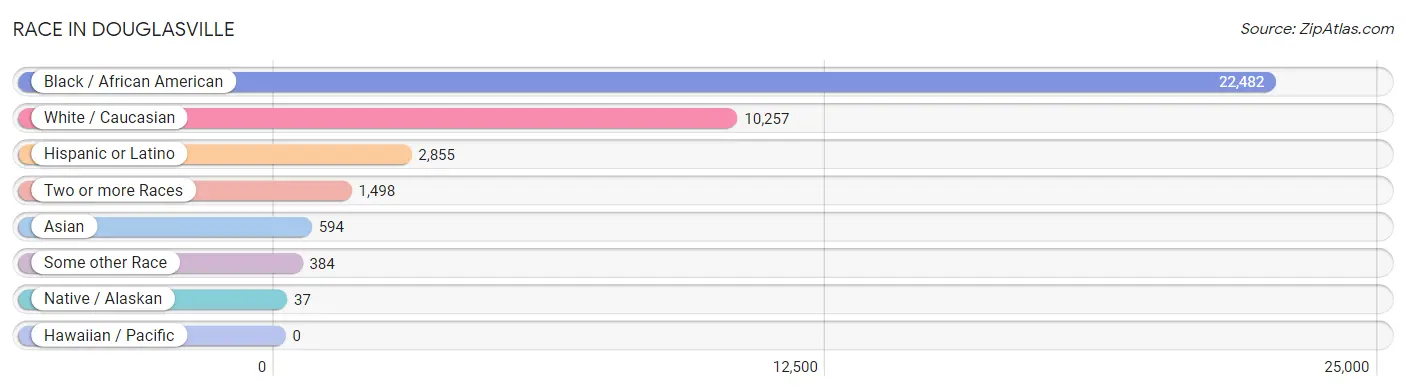
Race in Douglasville
The most populous races in Douglasville are Black / African American (22,482 | 63.8%), White / Caucasian (10,257 | 29.1%), and Hispanic or Latino (2,855 | 8.1%).
| Race | # Population | % Population |
| Asian | 594 | 1.7% |
| Black / African American | 22,482 | 63.8% |
| Hawaiian / Pacific | 0 | 0.0% |
| Hispanic or Latino | 2,855 | 8.1% |
| Native / Alaskan | 37 | 0.1% |
| White / Caucasian | 10,257 | 29.1% |
| Two or more Races | 1,498 | 4.3% |
| Some other Race | 384 | 1.1% |
| Total | 35,252 | 100.0% |
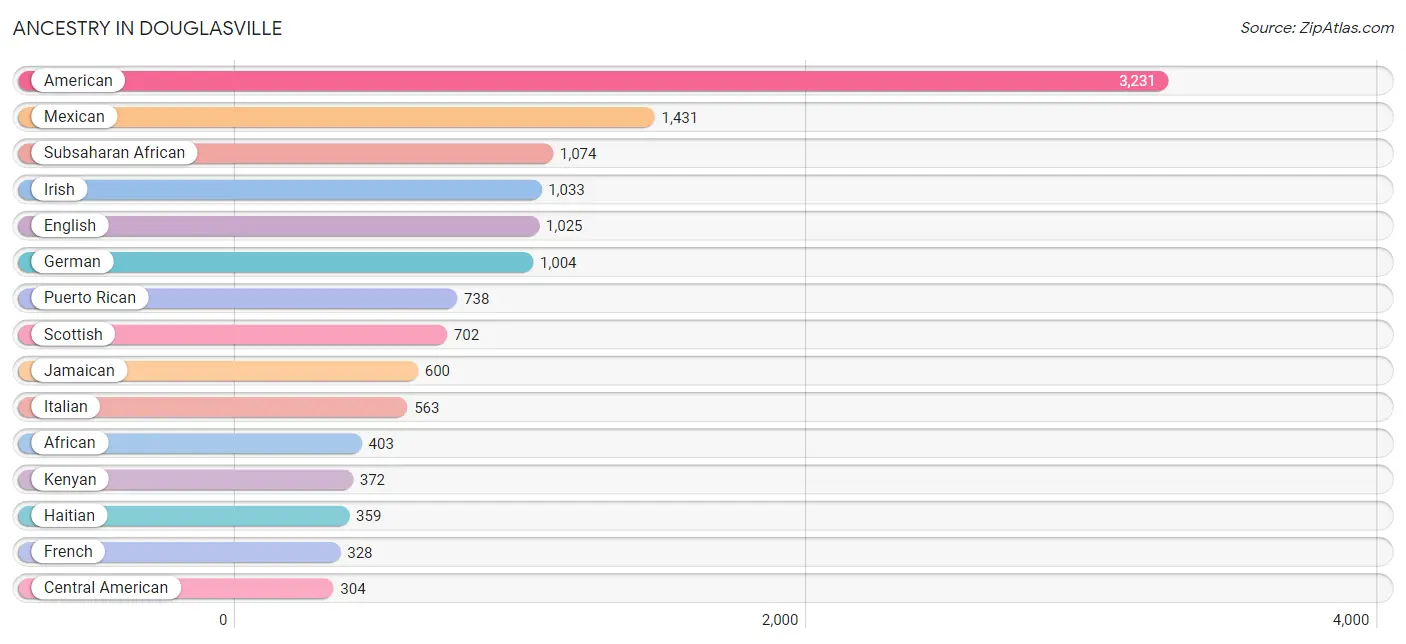
Ancestry in Douglasville
The most populous ancestries reported in Douglasville are American (3,231 | 9.2%), Mexican (1,431 | 4.1%), Subsaharan African (1,074 | 3.0%), Irish (1,033 | 2.9%), and English (1,025 | 2.9%), together accounting for 22.1% of all Douglasville residents.
| Ancestry | # Population | % Population |
| African | 403 | 1.1% |
| American | 3,231 | 9.2% |
| Arab | 59 | 0.2% |
| Argentinean | 25 | 0.1% |
| Bahamian | 137 | 0.4% |
| Belizean | 56 | 0.2% |
| British | 55 | 0.2% |
| Burmese | 17 | 0.1% |
| Canadian | 29 | 0.1% |
| Cape Verdean | 32 | 0.1% |
| Central American | 304 | 0.9% |
| Central American Indian | 14 | 0.0% |
| Cherokee | 55 | 0.2% |
| Colombian | 185 | 0.5% |
| Creek | 18 | 0.1% |
| Cuban | 9 | 0.0% |
| Czech | 24 | 0.1% |
| Dominican | 2 | 0.0% |
| Dutch | 17 | 0.1% |
| Eastern European | 28 | 0.1% |
| Egyptian | 49 | 0.1% |
| English | 1,025 | 2.9% |
| European | 81 | 0.2% |
| French | 328 | 0.9% |
| French Canadian | 10 | 0.0% |
| German | 1,004 | 2.9% |
| German Russian | 91 | 0.3% |
| Ghanaian | 49 | 0.1% |
| Guatemalan | 42 | 0.1% |
| Haitian | 359 | 1.0% |
| Honduran | 14 | 0.0% |
| Hungarian | 28 | 0.1% |
| Indian (Asian) | 172 | 0.5% |
| Irish | 1,033 | 2.9% |
| Italian | 563 | 1.6% |
| Jamaican | 600 | 1.7% |
| Kenyan | 372 | 1.1% |
| Korean | 53 | 0.2% |
| Mexican | 1,431 | 4.1% |
| Mexican American Indian | 10 | 0.0% |
| Nicaraguan | 26 | 0.1% |
| Nigerian | 117 | 0.3% |
| Norwegian | 61 | 0.2% |
| Pakistani | 7 | 0.0% |
| Panamanian | 100 | 0.3% |
| Polish | 131 | 0.4% |
| Portuguese | 149 | 0.4% |
| Puerto Rican | 738 | 2.1% |
| Russian | 39 | 0.1% |
| Salvadoran | 122 | 0.4% |
| Scandinavian | 25 | 0.1% |
| Scotch-Irish | 93 | 0.3% |
| Scottish | 702 | 2.0% |
| Sierra Leonean | 15 | 0.0% |
| Slavic | 13 | 0.0% |
| Slovak | 23 | 0.1% |
| South American | 301 | 0.9% |
| Spanish | 70 | 0.2% |
| Sri Lankan | 200 | 0.6% |
| Subsaharan African | 1,074 | 3.0% |
| Swedish | 163 | 0.5% |
| Thai | 195 | 0.5% |
| Trinidadian and Tobagonian | 104 | 0.3% |
| Ukrainian | 30 | 0.1% |
| Venezuelan | 91 | 0.3% |
| Vietnamese | 113 | 0.3% |
| West Indian | 73 | 0.2% | View All 67 Rows |
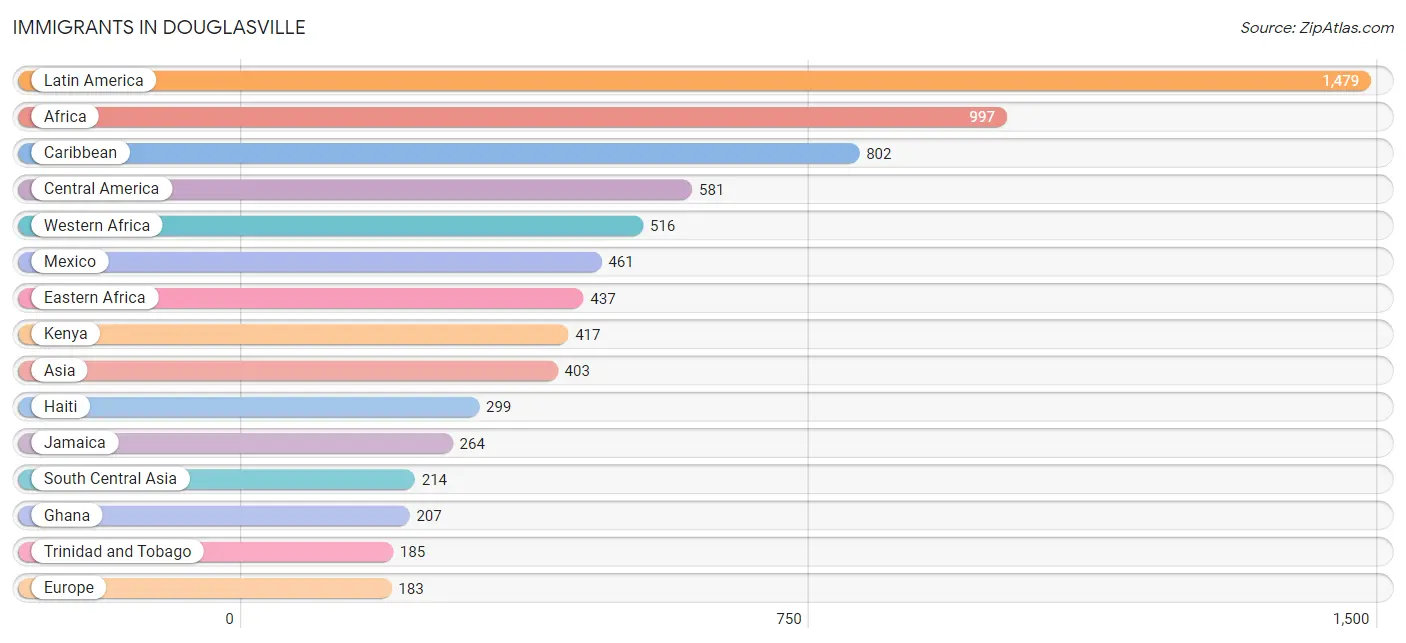
Immigrants in Douglasville
The most numerous immigrant groups reported in Douglasville came from Latin America (1,479 | 4.2%), Africa (997 | 2.8%), Caribbean (802 | 2.3%), Central America (581 | 1.7%), and Western Africa (516 | 1.5%), together accounting for 12.4% of all Douglasville residents.
| Immigration Origin | # Population | % Population |
| Africa | 997 | 2.8% |
| Asia | 403 | 1.1% |
| Bahamas | 54 | 0.2% |
| Bangladesh | 107 | 0.3% |
| Belize | 41 | 0.1% |
| Cabo Verde | 32 | 0.1% |
| Cameroon | 15 | 0.0% |
| Canada | 29 | 0.1% |
| Caribbean | 802 | 2.3% |
| Central America | 581 | 1.7% |
| China | 24 | 0.1% |
| Colombia | 45 | 0.1% |
| Eastern Africa | 437 | 1.2% |
| Eastern Asia | 34 | 0.1% |
| Eastern Europe | 20 | 0.1% |
| Egypt | 29 | 0.1% |
| El Salvador | 51 | 0.1% |
| England | 115 | 0.3% |
| Europe | 183 | 0.5% |
| Ghana | 207 | 0.6% |
| Guatemala | 28 | 0.1% |
| Haiti | 299 | 0.9% |
| India | 94 | 0.3% |
| Iraq | 20 | 0.1% |
| Jamaica | 264 | 0.7% |
| Kenya | 417 | 1.2% |
| Korea | 10 | 0.0% |
| Latin America | 1,479 | 4.2% |
| Liberia | 31 | 0.1% |
| Mexico | 461 | 1.3% |
| Middle Africa | 15 | 0.0% |
| Nigeria | 145 | 0.4% |
| Northern Africa | 29 | 0.1% |
| Northern Europe | 163 | 0.5% |
| Pakistan | 13 | 0.0% |
| Philippines | 53 | 0.2% |
| Russia | 20 | 0.1% |
| Saudi Arabia | 10 | 0.0% |
| Sierra Leone | 15 | 0.0% |
| South America | 96 | 0.3% |
| South Central Asia | 214 | 0.6% |
| South Eastern Asia | 125 | 0.4% |
| Taiwan | 24 | 0.1% |
| Thailand | 7 | 0.0% |
| Trinidad and Tobago | 185 | 0.5% |
| Venezuela | 51 | 0.1% |
| Vietnam | 65 | 0.2% |
| Western Africa | 516 | 1.5% |
| Western Asia | 30 | 0.1% |
| Zimbabwe | 20 | 0.1% | View All 50 Rows |
Sex and Age in Douglasville
Sex and Age in Douglasville
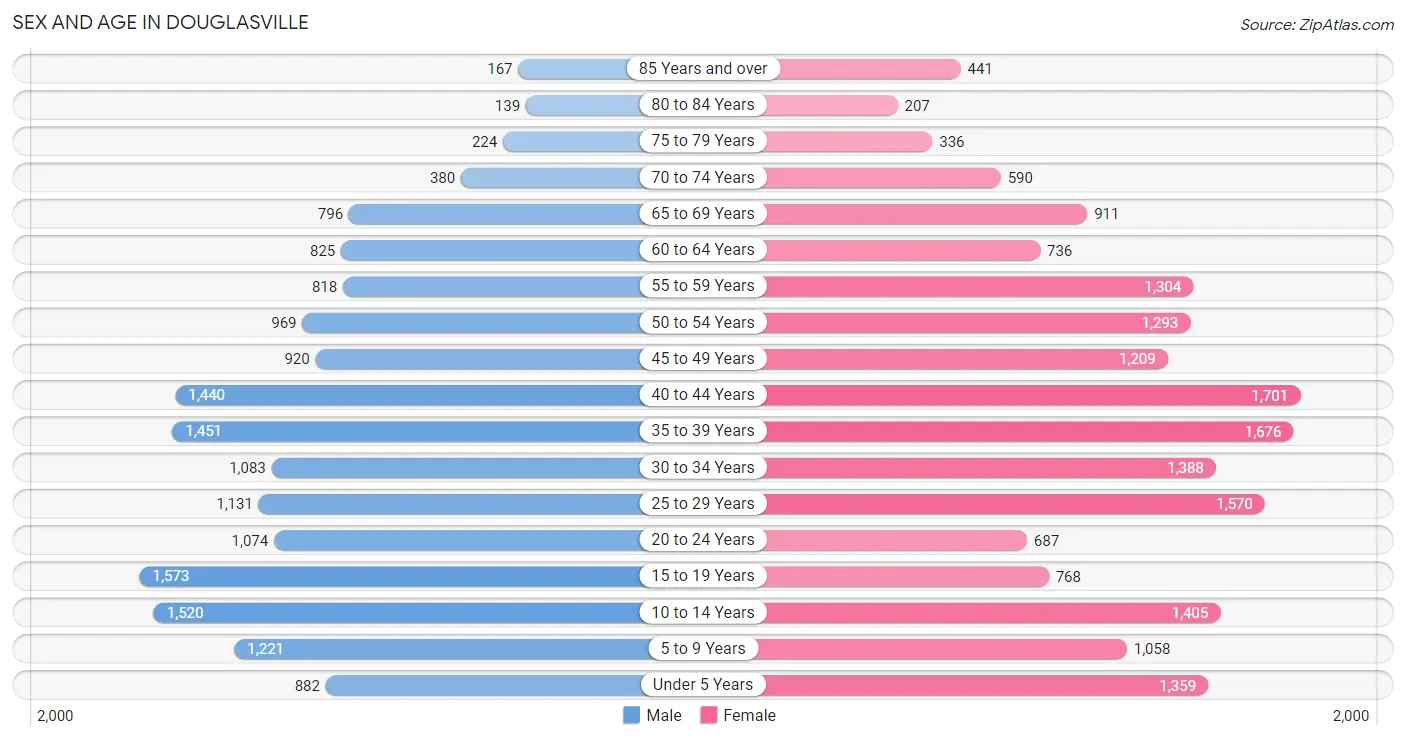
The most populous age groups in Douglasville are 15 to 19 Years (1,573 | 9.5%) for men and 40 to 44 Years (1,701 | 9.1%) for women.
| Age Bracket | Male | Female |
| Under 5 Years | 882 (5.3%) | 1,359 (7.3%) |
| 5 to 9 Years | 1,221 (7.3%) | 1,058 (5.7%) |
| 10 to 14 Years | 1,520 (9.1%) | 1,405 (7.5%) |
| 15 to 19 Years | 1,573 (9.5%) | 768 (4.1%) |
| 20 to 24 Years | 1,074 (6.5%) | 687 (3.7%) |
| 25 to 29 Years | 1,131 (6.8%) | 1,570 (8.4%) |
| 30 to 34 Years | 1,083 (6.5%) | 1,388 (7.4%) |
| 35 to 39 Years | 1,451 (8.7%) | 1,676 (9.0%) |
| 40 to 44 Years | 1,440 (8.7%) | 1,701 (9.1%) |
| 45 to 49 Years | 920 (5.5%) | 1,209 (6.5%) |
| 50 to 54 Years | 969 (5.8%) | 1,293 (6.9%) |
| 55 to 59 Years | 818 (4.9%) | 1,304 (7.0%) |
| 60 to 64 Years | 825 (5.0%) | 736 (4.0%) |
| 65 to 69 Years | 796 (4.8%) | 911 (4.9%) |
| 70 to 74 Years | 380 (2.3%) | 590 (3.2%) |
| 75 to 79 Years | 224 (1.3%) | 336 (1.8%) |
| 80 to 84 Years | 139 (0.8%) | 207 (1.1%) |
| 85 Years and over | 167 (1.0%) | 441 (2.4%) |
| Total | 16,613 (100.0%) | 18,639 (100.0%) |
Families and Households in Douglasville
Median Family Size in Douglasville
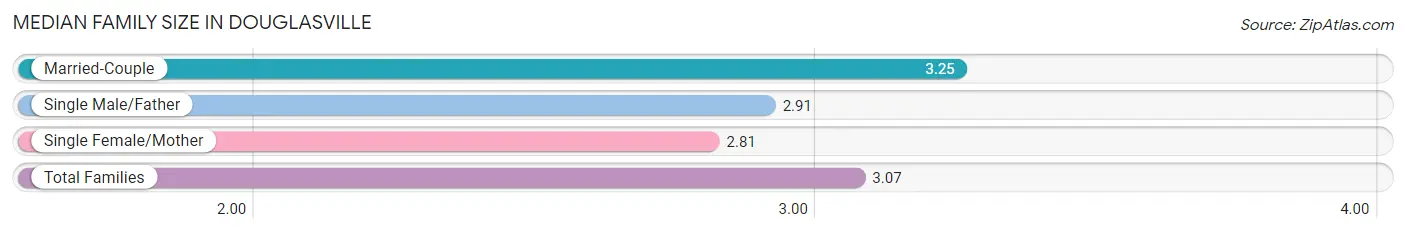
The median family size in Douglasville is 3.07 persons per family, with married-couple families (5,197 | 57.7%) accounting for the largest median family size of 3.25 persons per family. On the other hand, single female/mother families (3,236 | 35.9%) represent the smallest median family size with 2.81 persons per family.
| Family Type | # Families | Family Size |
| Married-Couple | 5,197 (57.7%) | 3.25 |
| Single Male/Father | 581 (6.5%) | 2.91 |
| Single Female/Mother | 3,236 (35.9%) | 2.81 |
| Total Families | 9,014 (100.0%) | 3.07 |
Median Household Size in Douglasville
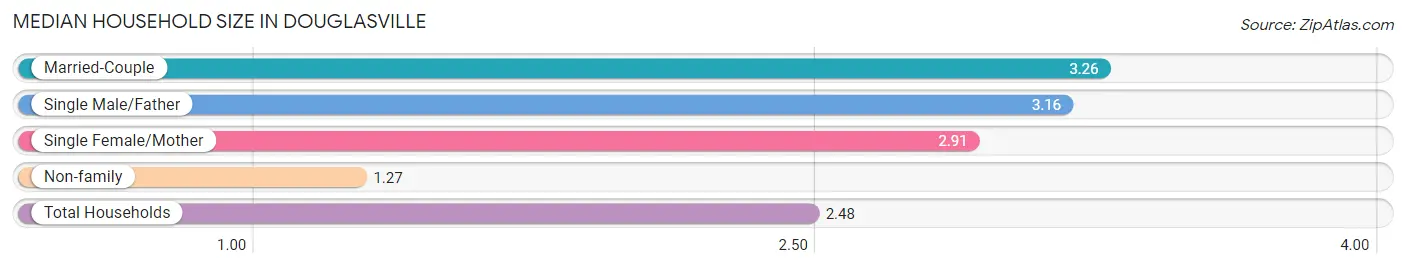
The median household size in Douglasville is 2.48 persons per household, with married-couple households (5,197 | 37.7%) accounting for the largest median household size of 3.26 persons per household. non-family households (4,778 | 34.6%) represent the smallest median household size with 1.27 persons per household.
| Household Type | # Households | Household Size |
| Married-Couple | 5,197 (37.7%) | 3.26 |
| Single Male/Father | 581 (4.2%) | 3.16 |
| Single Female/Mother | 3,236 (23.5%) | 2.91 |
| Non-family | 4,778 (34.6%) | 1.27 |
| Total Households | 13,792 (100.0%) | 2.48 |
Household Size by Marriage Status in Douglasville
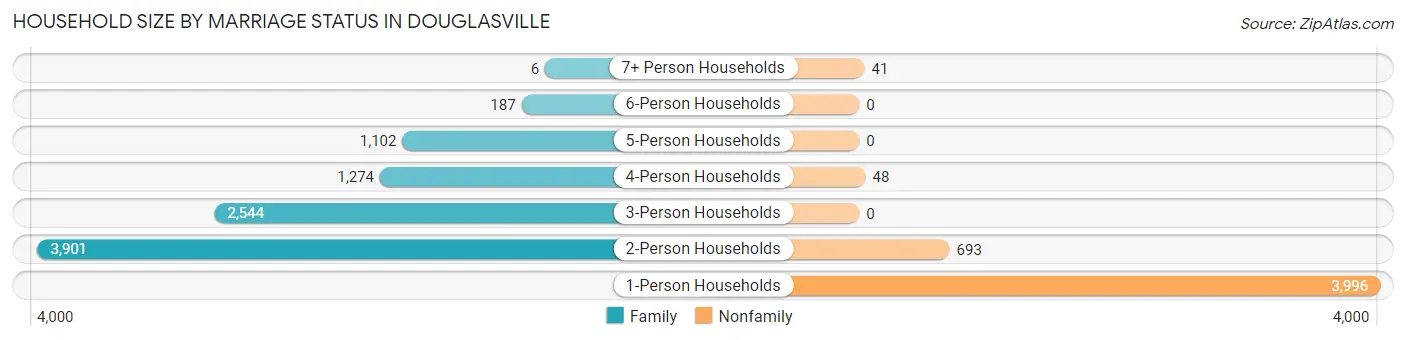
Out of a total of 13,792 households in Douglasville, 9,014 (65.4%) are family households, while 4,778 (34.6%) are nonfamily households. The most numerous type of family households are 2-person households, comprising 3,901, and the most common type of nonfamily households are 1-person households, comprising 3,996.
| Household Size | Family Households | Nonfamily Households |
| 1-Person Households | - | 3,996 (29.0%) |
| 2-Person Households | 3,901 (28.3%) | 693 (5.0%) |
| 3-Person Households | 2,544 (18.4%) | 0 (0.0%) |
| 4-Person Households | 1,274 (9.2%) | 48 (0.4%) |
| 5-Person Households | 1,102 (8.0%) | 0 (0.0%) |
| 6-Person Households | 187 (1.4%) | 0 (0.0%) |
| 7+ Person Households | 6 (0.0%) | 41 (0.3%) |
| Total | 9,014 (65.4%) | 4,778 (34.6%) |
Female Fertility in Douglasville
Fertility by Age in Douglasville
Average fertility rate in Douglasville is 49.0 births per 1,000 women. Women in the age bracket of 20 to 34 years have the highest fertility rate with 103.0 births per 1,000 women. Women in the age bracket of 20 to 34 years acount for 82.0% of all women with births.
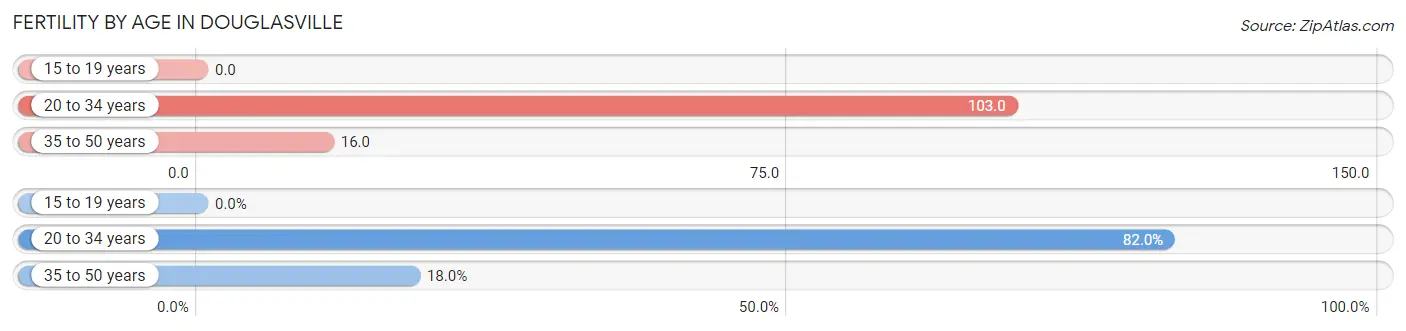
| Age Bracket | Women with Births | Births / 1,000 Women |
| 15 to 19 years | 0 (0.0%) | 0.0 |
| 20 to 34 years | 374 (82.0%) | 103.0 |
| 35 to 50 years | 82 (18.0%) | 16.0 |
| Total | 456 (100.0%) | 49.0 |
Fertility by Age by Marriage Status in Douglasville
67.3% of women with births (456) in Douglasville are married. The highest percentage of unmarried women with births falls into 20 to 34 years age bracket with 39.8% of them unmarried at the time of birth, while the lowest percentage of unmarried women with births belong to 35 to 50 years age bracket with 0.0% of them unmarried.

| Age Bracket | Married | Unmarried |
| 15 to 19 years | 0 (0.0%) | 0 (0.0%) |
| 20 to 34 years | 225 (60.2%) | 149 (39.8%) |
| 35 to 50 years | 82 (100.0%) | 0 (0.0%) |
| Total | 307 (67.3%) | 149 (32.7%) |
Fertility by Education in Douglasville
Average fertility rate in Douglasville is 49.0 births per 1,000 women. Women with the education attainment of high school diploma have the highest fertility rate of 84.0 births per 1,000 women, while women with the education attainment of graduate degree have the lowest fertility at 26.0 births per 1,000 women. Women with the education attainment of college or associate's degree represent 37.3% of all women with births.
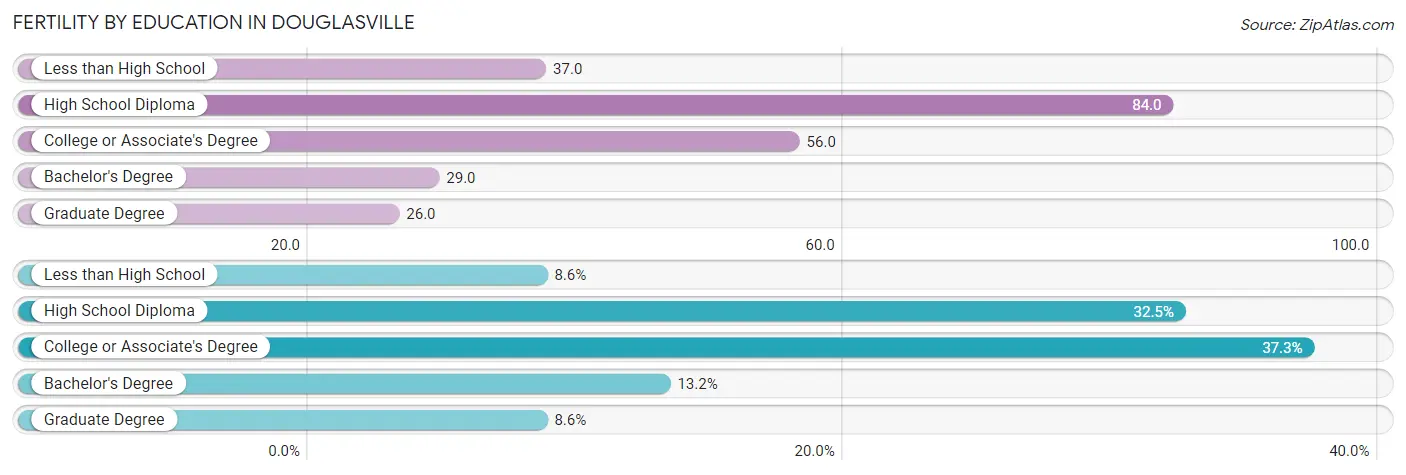
| Educational Attainment | Women with Births | Births / 1,000 Women |
| Less than High School | 39 (8.6%) | 37.0 |
| High School Diploma | 148 (32.5%) | 84.0 |
| College or Associate's Degree | 170 (37.3%) | 56.0 |
| Bachelor's Degree | 60 (13.2%) | 29.0 |
| Graduate Degree | 39 (8.6%) | 26.0 |
| Total | 456 (100.0%) | 49.0 |
Fertility by Education by Marriage Status in Douglasville
32.7% of women with births in Douglasville are unmarried. Women with the educational attainment of less than high school are most likely to be married with 100.0% of them married at childbirth, while women with the educational attainment of high school diploma are least likely to be married with 58.1% of them unmarried at childbirth.
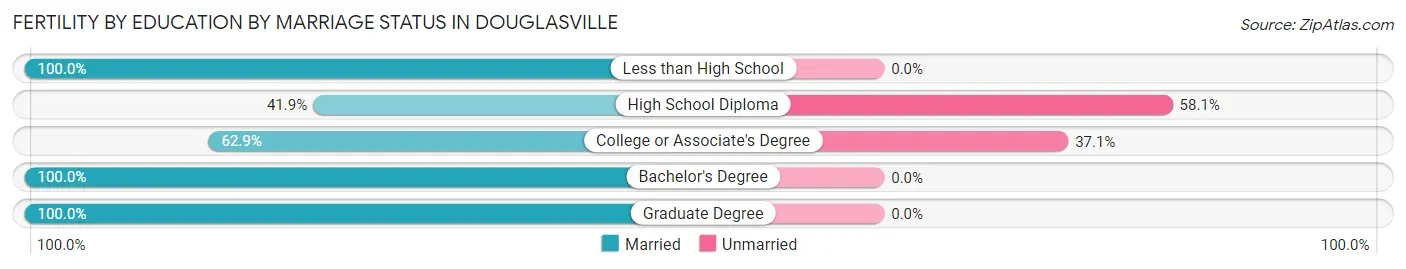
| Educational Attainment | Married | Unmarried |
| Less than High School | 39 (100.0%) | 0 (0.0%) |
| High School Diploma | 62 (41.9%) | 86 (58.1%) |
| College or Associate's Degree | 107 (62.9%) | 63 (37.1%) |
| Bachelor's Degree | 60 (100.0%) | 0 (0.0%) |
| Graduate Degree | 39 (100.0%) | 0 (0.0%) |
| Total | 307 (67.3%) | 149 (32.7%) |
Income in Douglasville
Income Overview in Douglasville
Per Capita Income in Douglasville is $36,077, while median incomes of families and households are $81,165 and $72,753 respectively.
| Characteristic | Number | Measure |
| Per Capita Income | 35,252 | $36,077 |
| Median Family Income | 9,014 | $81,165 |
| Mean Family Income | 9,014 | $104,409 |
| Median Household Income | 13,792 | $72,753 |
| Mean Household Income | 13,792 | $91,000 |
| Income Deficit | 9,014 | $0 |
| Wage / Income Gap (%) | 35,252 | 2.13% |
| Wage / Income Gap ($) | 35,252 | 97.87¢ per $1 |
| Gini / Inequality Index | 35,252 | 0.43 |
Earnings by Sex in Douglasville
Average Earnings in Douglasville are $42,151, $41,720 for men and $42,628 for women, a difference of 2.1%.

| Sex | Number | Average Earnings |
| Male | 9,813 (48.1%) | $41,720 |
| Female | 10,583 (51.9%) | $42,628 |
| Total | 20,396 (100.0%) | $42,151 |
Earnings by Sex by Income Bracket in Douglasville
The most common earnings brackets in Douglasville are $75,000 to $99,999 for men (1,357 | 13.8%) and $100,000+ for women (1,507 | 14.2%).
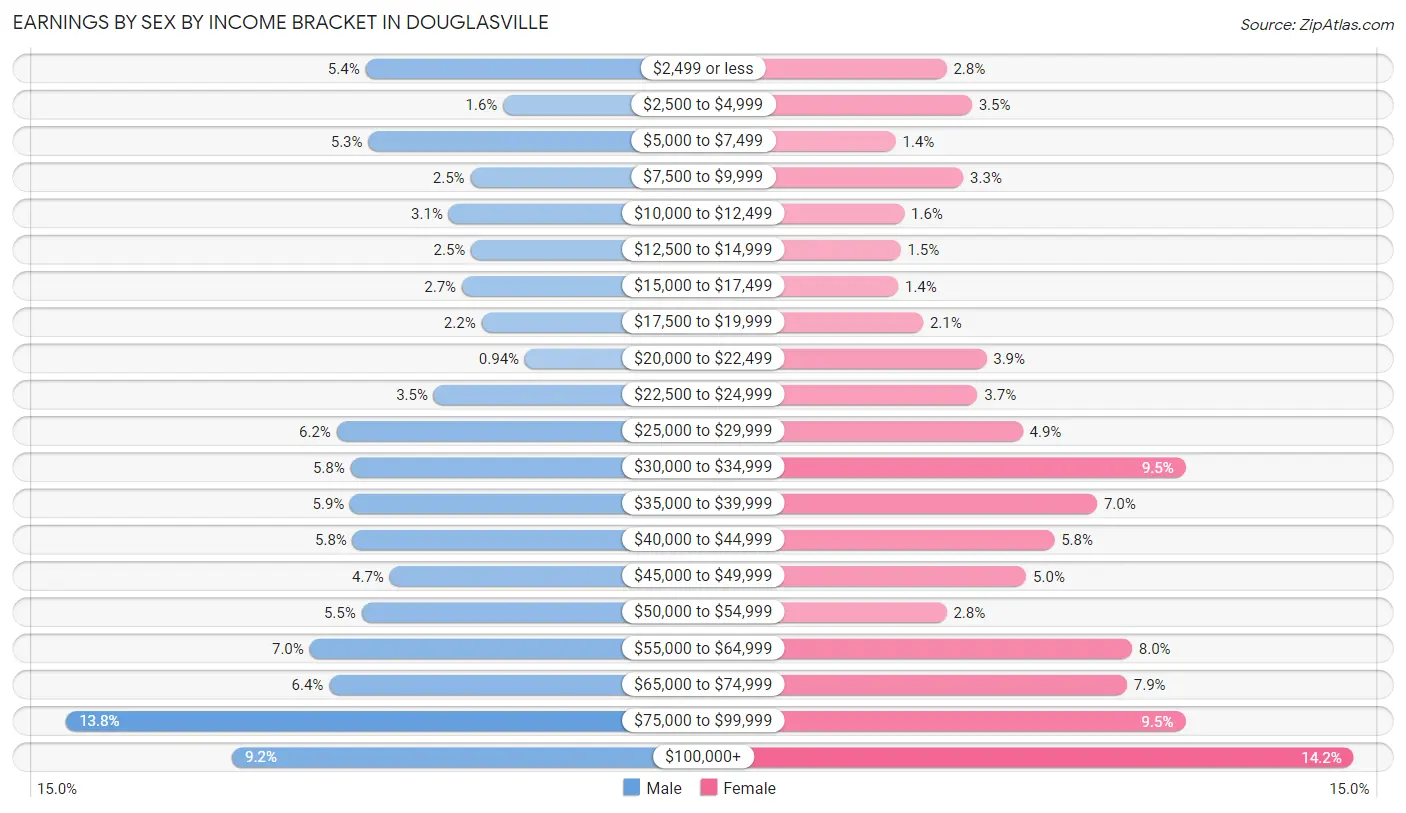
| Income | Male | Female |
| $2,499 or less | 532 (5.4%) | 296 (2.8%) |
| $2,500 to $4,999 | 152 (1.5%) | 371 (3.5%) |
| $5,000 to $7,499 | 524 (5.3%) | 145 (1.4%) |
| $7,500 to $9,999 | 242 (2.5%) | 346 (3.3%) |
| $10,000 to $12,499 | 302 (3.1%) | 170 (1.6%) |
| $12,500 to $14,999 | 240 (2.5%) | 160 (1.5%) |
| $15,000 to $17,499 | 266 (2.7%) | 152 (1.4%) |
| $17,500 to $19,999 | 212 (2.2%) | 226 (2.1%) |
| $20,000 to $22,499 | 92 (0.9%) | 415 (3.9%) |
| $22,500 to $24,999 | 343 (3.5%) | 388 (3.7%) |
| $25,000 to $29,999 | 611 (6.2%) | 523 (4.9%) |
| $30,000 to $34,999 | 573 (5.8%) | 1,007 (9.5%) |
| $35,000 to $39,999 | 574 (5.9%) | 744 (7.0%) |
| $40,000 to $44,999 | 567 (5.8%) | 617 (5.8%) |
| $45,000 to $49,999 | 465 (4.7%) | 533 (5.0%) |
| $50,000 to $54,999 | 543 (5.5%) | 296 (2.8%) |
| $55,000 to $64,999 | 686 (7.0%) | 848 (8.0%) |
| $65,000 to $74,999 | 632 (6.4%) | 833 (7.9%) |
| $75,000 to $99,999 | 1,357 (13.8%) | 1,006 (9.5%) |
| $100,000+ | 900 (9.2%) | 1,507 (14.2%) |
| Total | 9,813 (100.0%) | 10,583 (100.0%) |
Earnings by Sex by Educational Attainment in Douglasville
Average earnings in Douglasville are $50,223 for men and $45,559 for women, a difference of 9.3%. Men with an educational attainment of graduate degree enjoy the highest average annual earnings of $93,630, while those with less than high school education earn the least with $25,556. Women with an educational attainment of graduate degree earn the most with the average annual earnings of $64,264, while those with high school diploma education have the smallest earnings of $32,668.
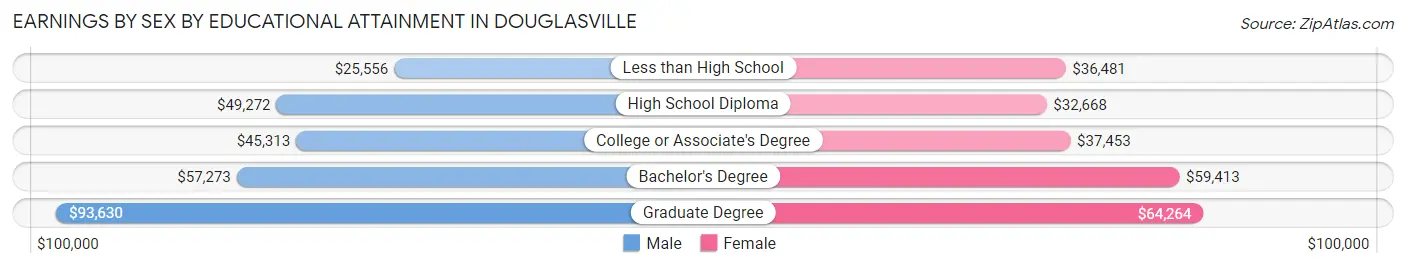
| Educational Attainment | Male Income | Female Income |
| Less than High School | $25,556 | $36,481 |
| High School Diploma | $49,272 | $32,668 |
| College or Associate's Degree | $45,313 | $37,453 |
| Bachelor's Degree | $57,273 | $59,413 |
| Graduate Degree | $93,630 | $64,264 |
| Total | $50,223 | $45,559 |
Family Income in Douglasville
Family Income Brackets in Douglasville
According to the Douglasville family income data, there are 1,785 families falling into the $50,000 to $74,999 income range, which is the most common income bracket and makes up 19.8% of all families. Conversely, the $10,000 to $14,999 income bracket is the least frequent group with only 252 families (2.8%) belonging to this category.
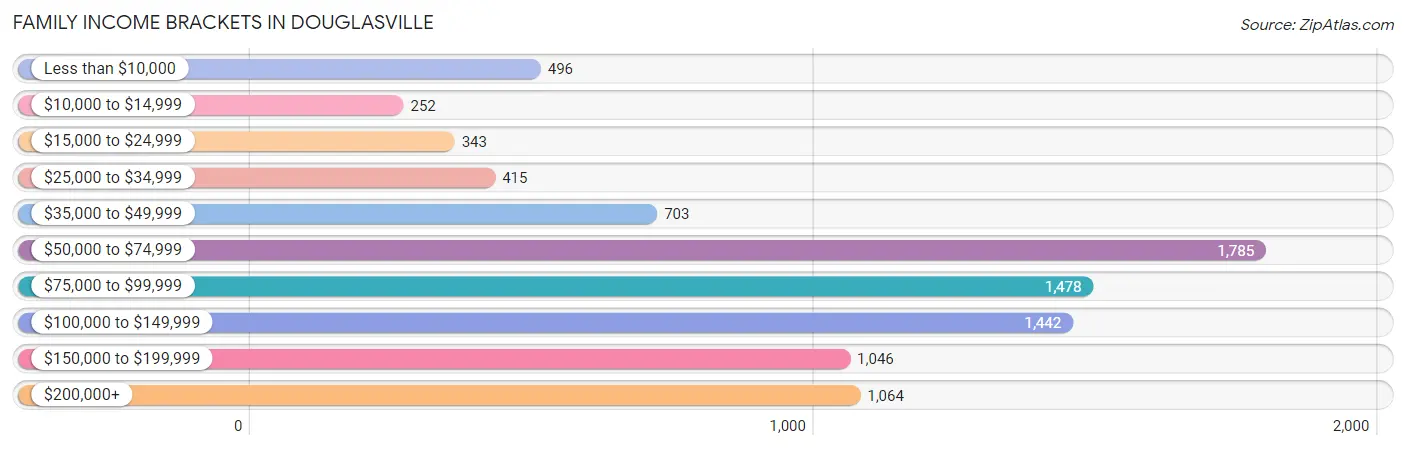
| Income Bracket | # Families | % Families |
| Less than $10,000 | 496 | 5.5% |
| $10,000 to $14,999 | 252 | 2.8% |
| $15,000 to $24,999 | 343 | 3.8% |
| $25,000 to $34,999 | 415 | 4.6% |
| $35,000 to $49,999 | 703 | 7.8% |
| $50,000 to $74,999 | 1,785 | 19.8% |
| $75,000 to $99,999 | 1,478 | 16.4% |
| $100,000 to $149,999 | 1,442 | 16.0% |
| $150,000 to $199,999 | 1,046 | 11.6% |
| $200,000+ | 1,064 | 11.8% |
Family Income by Famaliy Size in Douglasville
4-person families (1,118 | 12.4%) account for the highest median family income in Douglasville with $115,682 per family, while 2-person families (4,093 | 45.4%) have the highest median income of $36,820 per family member.
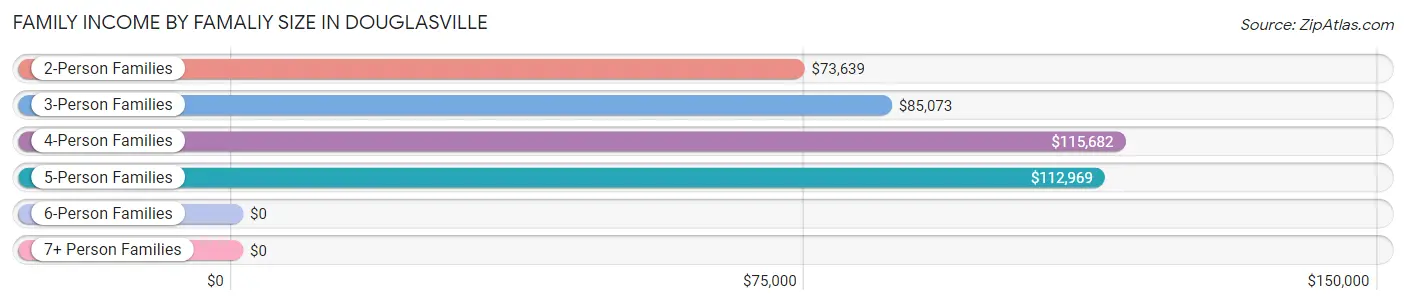
| Income Bracket | # Families | Median Income |
| 2-Person Families | 4,093 (45.4%) | $73,639 |
| 3-Person Families | 2,622 (29.1%) | $85,073 |
| 4-Person Families | 1,118 (12.4%) | $115,682 |
| 5-Person Families | 1,001 (11.1%) | $112,969 |
| 6-Person Families | 174 (1.9%) | $0 |
| 7+ Person Families | 6 (0.1%) | $0 |
| Total | 9,014 (100.0%) | $81,165 |
Family Income by Number of Earners in Douglasville
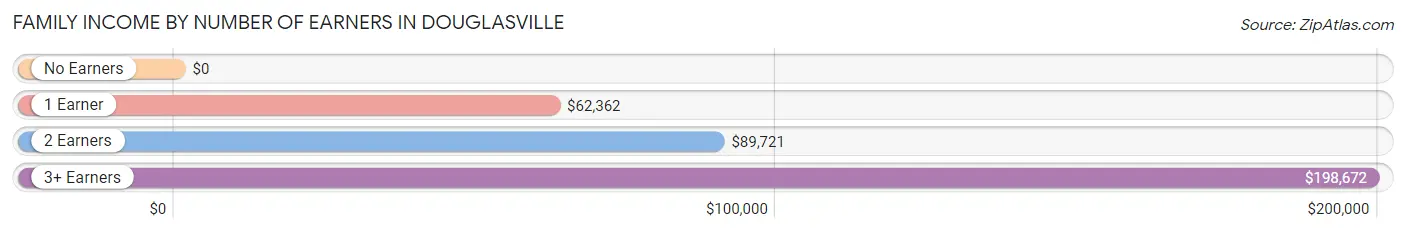
| Number of Earners | # Families | Median Income |
| No Earners | 744 (8.3%) | $0 |
| 1 Earner | 3,180 (35.3%) | $62,362 |
| 2 Earners | 4,341 (48.2%) | $89,721 |
| 3+ Earners | 749 (8.3%) | $198,672 |
| Total | 9,014 (100.0%) | $81,165 |
Household Income in Douglasville
Household Income Brackets in Douglasville
With 2,607 households falling in the category, the $50,000 to $74,999 income range is the most frequent in Douglasville, accounting for 18.9% of all households. In contrast, only 469 households (3.4%) fall into the $10,000 to $14,999 income bracket, making it the least populous group.
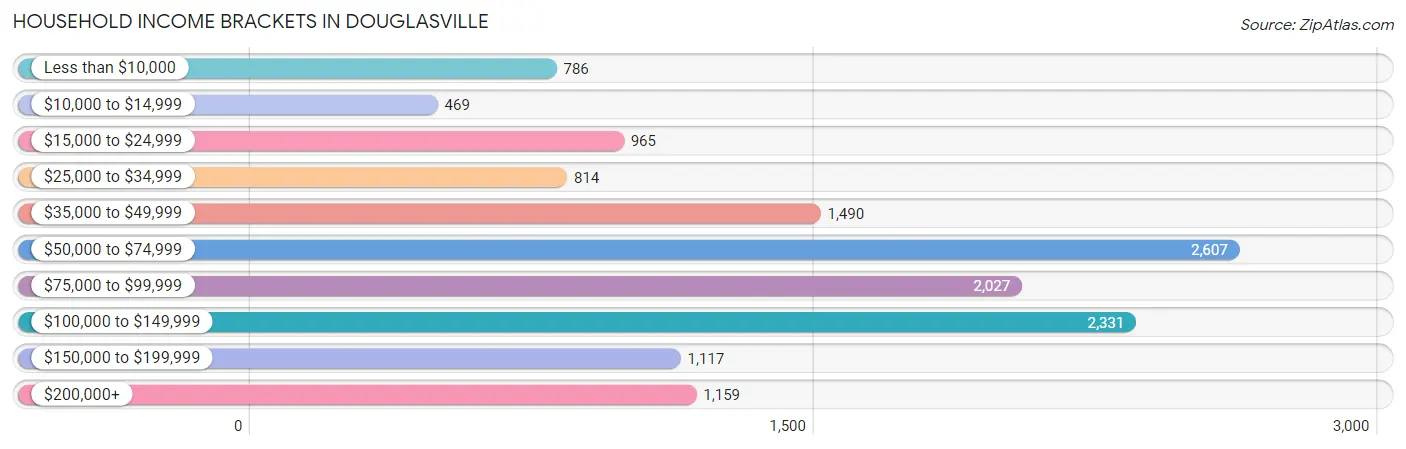
| Income Bracket | # Households | % Households |
| Less than $10,000 | 786 | 5.7% |
| $10,000 to $14,999 | 469 | 3.4% |
| $15,000 to $24,999 | 965 | 7.0% |
| $25,000 to $34,999 | 814 | 5.9% |
| $35,000 to $49,999 | 1,490 | 10.8% |
| $50,000 to $74,999 | 2,607 | 18.9% |
| $75,000 to $99,999 | 2,027 | 14.7% |
| $100,000 to $149,999 | 2,331 | 16.9% |
| $150,000 to $199,999 | 1,117 | 8.1% |
| $200,000+ | 1,159 | 8.4% |
Household Income by Householder Age in Douglasville
The median household income in Douglasville is $72,753, with the highest median household income of $78,856 found in the 45 to 64 years age bracket for the primary householder. A total of 4,900 households (35.5%) fall into this category. Meanwhile, the 15 to 24 years age bracket for the primary householder has the lowest median household income of $0, with 246 households (1.8%) in this group.
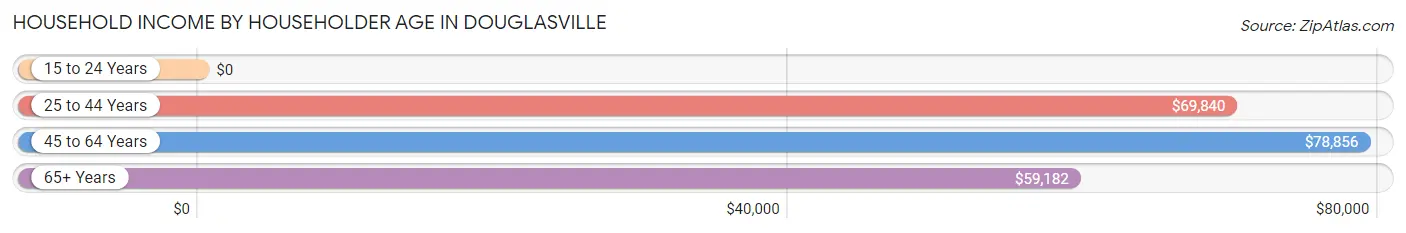
| Income Bracket | # Households | Median Income |
| 15 to 24 Years | 246 (1.8%) | $0 |
| 25 to 44 Years | 6,154 (44.6%) | $69,840 |
| 45 to 64 Years | 4,900 (35.5%) | $78,856 |
| 65+ Years | 2,492 (18.1%) | $59,182 |
| Total | 13,792 (100.0%) | $72,753 |
Poverty in Douglasville
Income Below Poverty by Sex and Age in Douglasville
With 13.3% poverty level for males and 10.7% for females among the residents of Douglasville, 5 year old males and 5 year old females are the most vulnerable to poverty, with 280 males (54.8%) and 35 females (35.7%) in their respective age groups living below the poverty level.
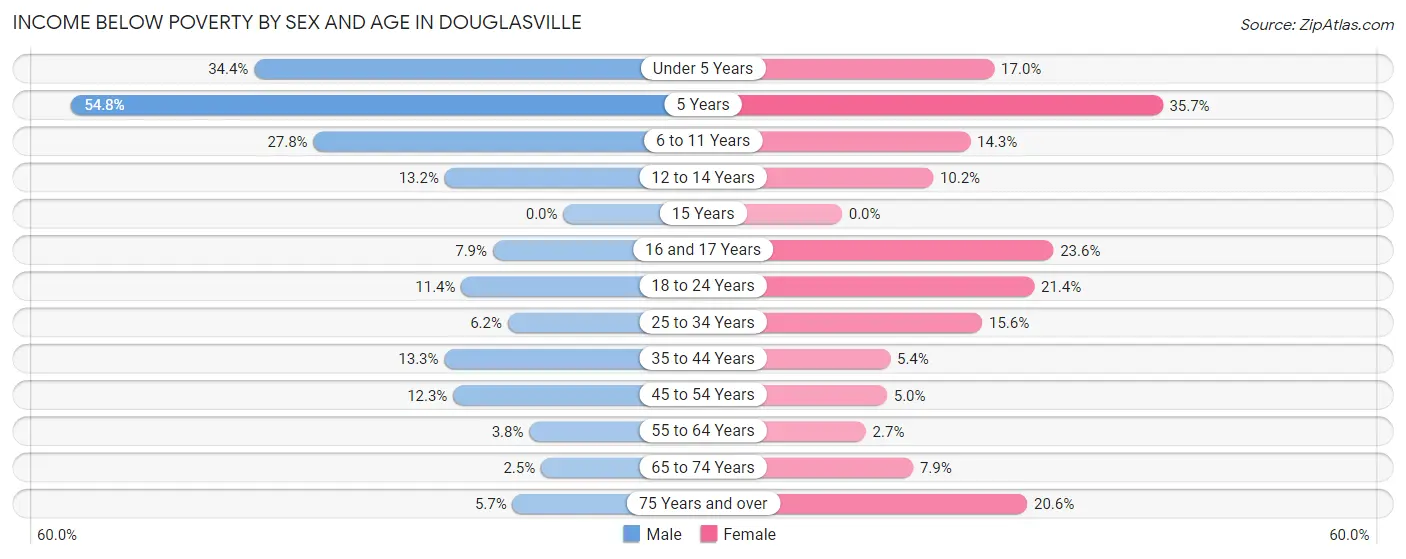
| Age Bracket | Male | Female |
| Under 5 Years | 303 (34.4%) | 230 (17.0%) |
| 5 Years | 280 (54.8%) | 35 (35.7%) |
| 6 to 11 Years | 388 (27.8%) | 241 (14.3%) |
| 12 to 14 Years | 109 (13.2%) | 68 (10.2%) |
| 15 Years | 0 (0.0%) | 0 (0.0%) |
| 16 and 17 Years | 38 (7.9%) | 65 (23.5%) |
| 18 to 24 Years | 175 (11.4%) | 206 (21.4%) |
| 25 to 34 Years | 125 (6.2%) | 451 (15.6%) |
| 35 to 44 Years | 347 (13.3%) | 179 (5.4%) |
| 45 to 54 Years | 222 (12.3%) | 125 (5.0%) |
| 55 to 64 Years | 62 (3.8%) | 54 (2.7%) |
| 65 to 74 Years | 29 (2.5%) | 119 (7.9%) |
| 75 Years and over | 30 (5.7%) | 203 (20.6%) |
| Total | 2,108 (13.3%) | 1,976 (10.7%) |
Income Above Poverty by Sex and Age in Douglasville
According to the poverty statistics in Douglasville, males aged 15 years and females aged 15 years are the age groups that are most secure financially, with 100.0% of males and 100.0% of females in these age groups living above the poverty line.
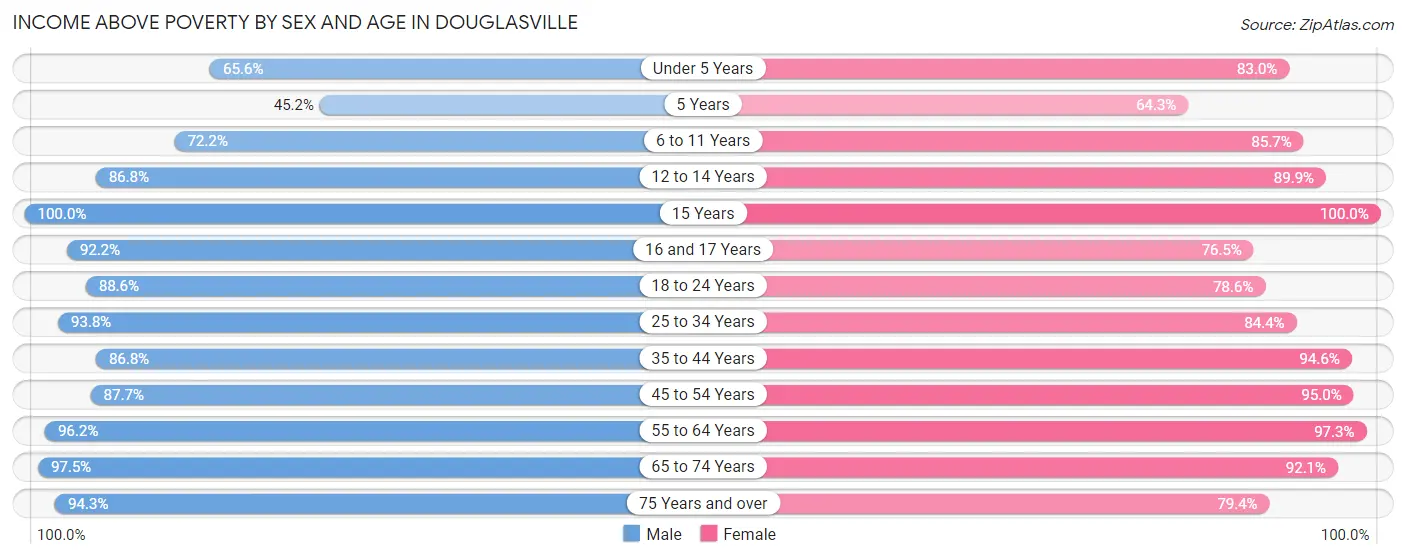
| Age Bracket | Male | Female |
| Under 5 Years | 577 (65.6%) | 1,125 (83.0%) |
| 5 Years | 231 (45.2%) | 63 (64.3%) |
| 6 to 11 Years | 1,006 (72.2%) | 1,445 (85.7%) |
| 12 to 14 Years | 716 (86.8%) | 602 (89.8%) |
| 15 Years | 445 (100.0%) | 190 (100.0%) |
| 16 and 17 Years | 446 (92.1%) | 211 (76.4%) |
| 18 to 24 Years | 1,366 (88.6%) | 756 (78.6%) |
| 25 to 34 Years | 1,893 (93.8%) | 2,436 (84.4%) |
| 35 to 44 Years | 2,272 (86.8%) | 3,154 (94.6%) |
| 45 to 54 Years | 1,588 (87.7%) | 2,369 (95.0%) |
| 55 to 64 Years | 1,574 (96.2%) | 1,979 (97.3%) |
| 65 to 74 Years | 1,140 (97.5%) | 1,382 (92.1%) |
| 75 Years and over | 500 (94.3%) | 781 (79.4%) |
| Total | 13,754 (86.7%) | 16,493 (89.3%) |
Income Below Poverty Among Married-Couple Families in Douglasville
The poverty statistics for married-couple families in Douglasville show that 4.2% or 216 of the total 5,197 families live below the poverty line. Families with 3 or 4 children have the highest poverty rate of 13.2%, comprising of 96 families. On the other hand, families with 5 or more children have the lowest poverty rate of 0.0%, which includes 0 families.
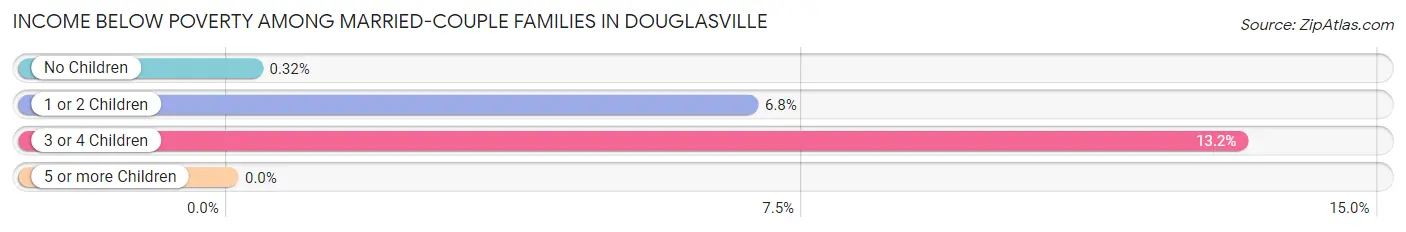
| Children | Above Poverty | Below Poverty |
| No Children | 2,819 (99.7%) | 9 (0.3%) |
| 1 or 2 Children | 1,524 (93.2%) | 111 (6.8%) |
| 3 or 4 Children | 632 (86.8%) | 96 (13.2%) |
| 5 or more Children | 6 (100.0%) | 0 (0.0%) |
| Total | 4,981 (95.8%) | 216 (4.2%) |
Income Below Poverty Among Single-Parent Households in Douglasville
According to the poverty data in Douglasville, 33.2% or 193 single-father households and 15.7% or 507 single-mother households are living below the poverty line. Among single-father households, those with 1 or 2 children have the highest poverty rate, with 193 households (40.8%) experiencing poverty. Likewise, among single-mother households, those with 3 or 4 children have the highest poverty rate, with 169 households (75.1%) falling below the poverty line.
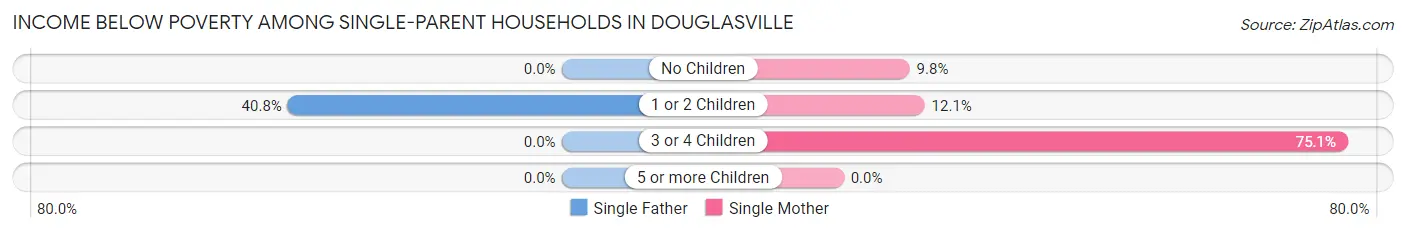
| Children | Single Father | Single Mother |
| No Children | 0 (0.0%) | 112 (9.8%) |
| 1 or 2 Children | 193 (40.8%) | 226 (12.1%) |
| 3 or 4 Children | 0 (0.0%) | 169 (75.1%) |
| 5 or more Children | 0 (0.0%) | 0 (0.0%) |
| Total | 193 (33.2%) | 507 (15.7%) |
Income Below Poverty Among Married-Couple vs Single-Parent Households in Douglasville
The poverty data for Douglasville shows that 216 of the married-couple family households (4.2%) and 700 of the single-parent households (18.3%) are living below the poverty level. Within the married-couple family households, those with 3 or 4 children have the highest poverty rate, with 96 households (13.2%) falling below the poverty line. Among the single-parent households, those with 3 or 4 children have the highest poverty rate, with 169 household (69.0%) living below poverty.
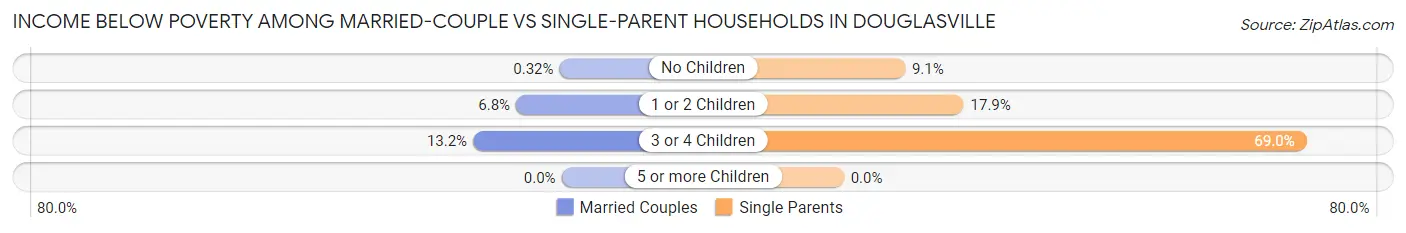
| Children | Married-Couple Families | Single-Parent Households |
| No Children | 9 (0.3%) | 112 (9.1%) |
| 1 or 2 Children | 111 (6.8%) | 419 (17.9%) |
| 3 or 4 Children | 96 (13.2%) | 169 (69.0%) |
| 5 or more Children | 0 (0.0%) | 0 (0.0%) |
| Total | 216 (4.2%) | 700 (18.3%) |
Employment Characteristics in Douglasville
Employment by Class of Employer in Douglasville
Among the 17,848 employed individuals in Douglasville, private company employees (12,646 | 70.9%), not-for-profit organizations (1,327 | 7.4%), and local government employees (1,240 | 7.0%) make up the most common classes of employment.
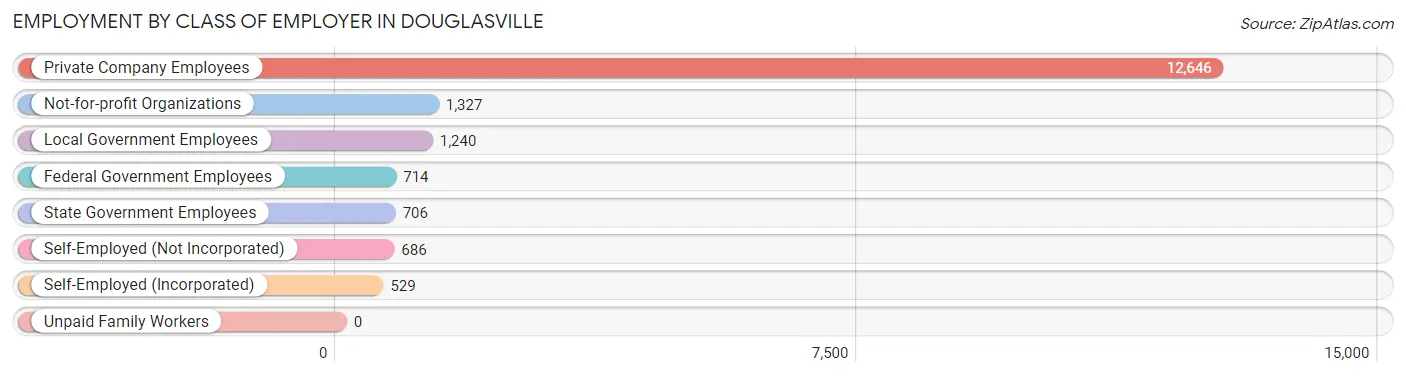
| Employer Class | # Employees | % Employees |
| Private Company Employees | 12,646 | 70.9% |
| Self-Employed (Incorporated) | 529 | 3.0% |
| Self-Employed (Not Incorporated) | 686 | 3.8% |
| Not-for-profit Organizations | 1,327 | 7.4% |
| Local Government Employees | 1,240 | 7.0% |
| State Government Employees | 706 | 4.0% |
| Federal Government Employees | 714 | 4.0% |
| Unpaid Family Workers | 0 | 0.0% |
| Total | 17,848 | 100.0% |
Employment Status by Age in Douglasville
According to the labor force statistics for Douglasville, out of the total population over 16 years of age (27,172), 70.4% or 19,129 individuals are in the labor force, with 5.5% or 1,052 of them unemployed. The age group with the highest labor force participation rate is 25 to 29 years, with 87.6% or 2,366 individuals in the labor force. Within the labor force, the 75 years and over age range has the highest percentage of unemployed individuals, with 50.4% or 132 of them being unemployed.
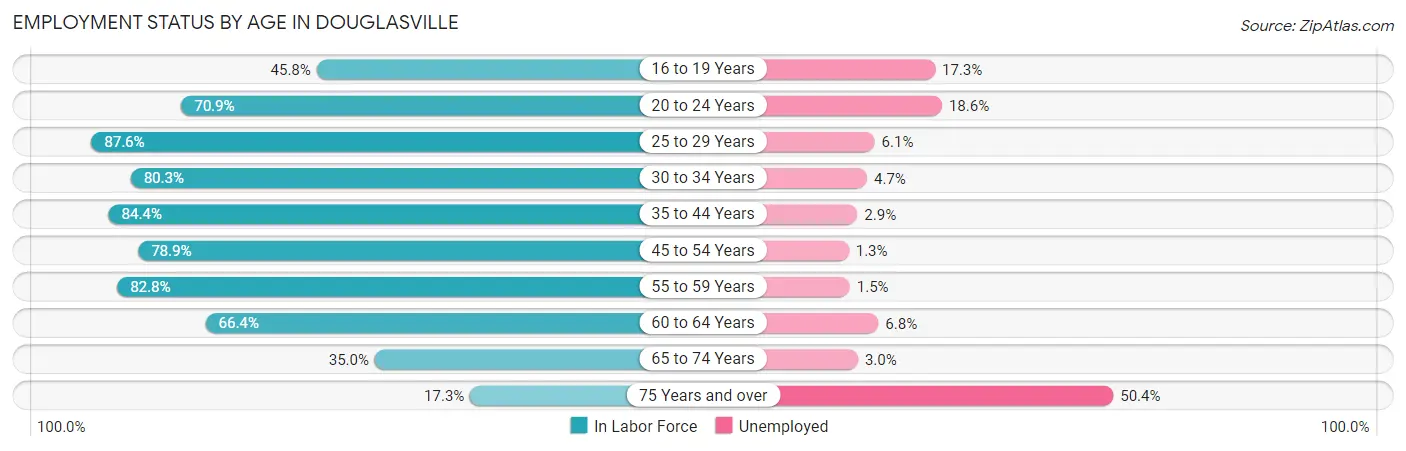
| Age Bracket | In Labor Force | Unemployed |
| 16 to 19 Years | 781 (45.8%) | 135 (17.3%) |
| 20 to 24 Years | 1,249 (70.9%) | 232 (18.6%) |
| 25 to 29 Years | 2,366 (87.6%) | 144 (6.1%) |
| 30 to 34 Years | 1,984 (80.3%) | 93 (4.7%) |
| 35 to 44 Years | 5,290 (84.4%) | 153 (2.9%) |
| 45 to 54 Years | 3,464 (78.9%) | 45 (1.3%) |
| 55 to 59 Years | 1,757 (82.8%) | 26 (1.5%) |
| 60 to 64 Years | 1,037 (66.4%) | 71 (6.8%) |
| 65 to 74 Years | 937 (35.0%) | 28 (3.0%) |
| 75 Years and over | 262 (17.3%) | 132 (50.4%) |
| Total | 19,129 (70.4%) | 1,052 (5.5%) |
Employment Status by Educational Attainment in Douglasville
According to labor force statistics for Douglasville, 81.5% of individuals (15,904) out of the total population between 25 and 64 years of age (19,514) are in the labor force, with 3.4% or 541 of them being unemployed. The group with the highest labor force participation rate are those with the educational attainment of bachelor's degree or higher, with 88.2% or 6,401 individuals in the labor force. Within the labor force, individuals with high school diploma education have the highest percentage of unemployment, with 9.3% or 329 of them being unemployed.

| Educational Attainment | In Labor Force | Unemployed |
| Less than High School | 783 (54.2%) | 9 (0.6%) |
| High School Diploma | 3,541 (75.1%) | 438 (9.3%) |
| College / Associate Degree | 5,177 (84.9%) | 110 (1.8%) |
| Bachelor's Degree or higher | 6,401 (88.2%) | 116 (1.6%) |
| Total | 15,904 (81.5%) | 663 (3.4%) |
Employment Occupations by Sex in Douglasville
Management, Business, Science and Arts Occupations
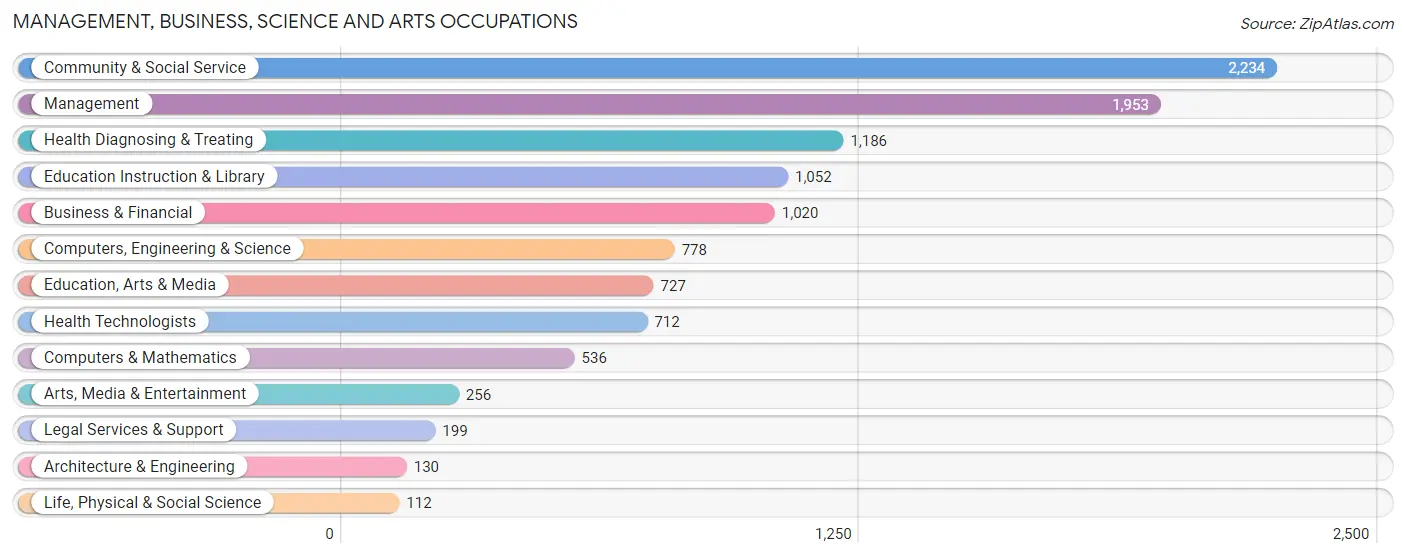
The most common Management, Business, Science and Arts occupations in Douglasville are Community & Social Service (2,234 | 12.4%), Management (1,953 | 10.9%), Health Diagnosing & Treating (1,186 | 6.6%), Education Instruction & Library (1,052 | 5.9%), and Business & Financial (1,020 | 5.7%).
Management, Business, Science and Arts Occupations by Sex
Within the Management, Business, Science and Arts occupations in Douglasville, the most male-oriented occupations are Architecture & Engineering (95.4%), Arts, Media & Entertainment (69.1%), and Computers & Mathematics (68.7%), while the most female-oriented occupations are Life, Physical & Social Science (100.0%), Legal Services & Support (100.0%), and Health Technologists (91.8%).
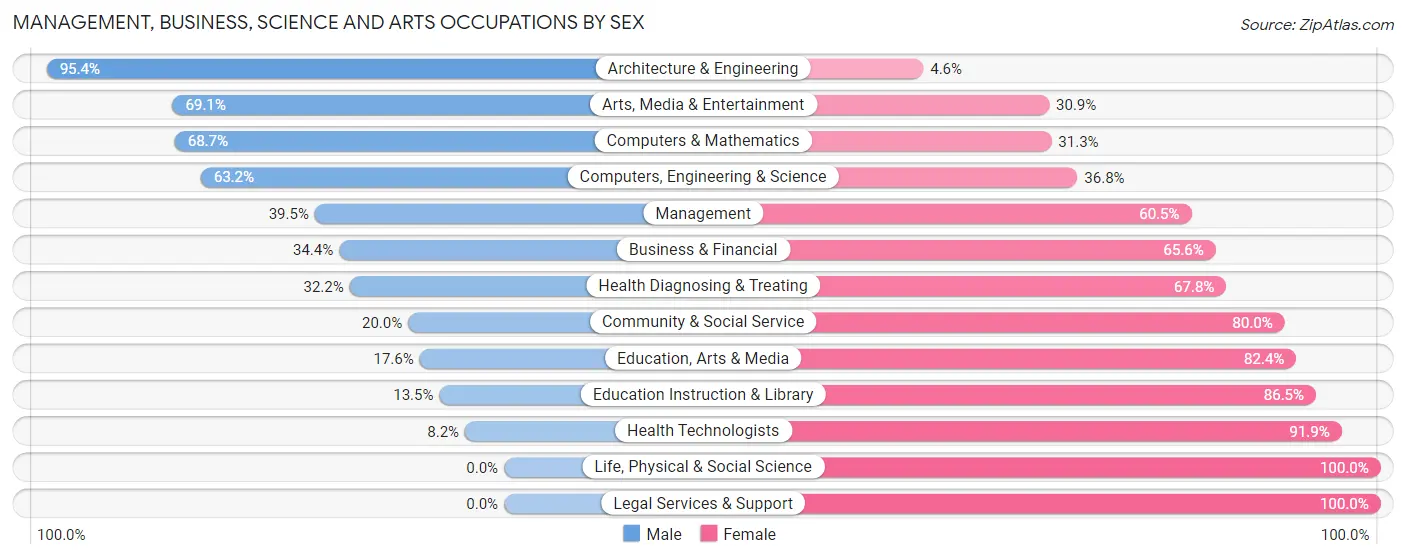
| Occupation | Male | Female |
| Management | 771 (39.5%) | 1,182 (60.5%) |
| Business & Financial | 351 (34.4%) | 669 (65.6%) |
| Computers, Engineering & Science | 492 (63.2%) | 286 (36.8%) |
| Computers & Mathematics | 368 (68.7%) | 168 (31.3%) |
| Architecture & Engineering | 124 (95.4%) | 6 (4.6%) |
| Life, Physical & Social Science | 0 (0.0%) | 112 (100.0%) |
| Community & Social Service | 447 (20.0%) | 1,787 (80.0%) |
| Education, Arts & Media | 128 (17.6%) | 599 (82.4%) |
| Legal Services & Support | 0 (0.0%) | 199 (100.0%) |
| Education Instruction & Library | 142 (13.5%) | 910 (86.5%) |
| Arts, Media & Entertainment | 177 (69.1%) | 79 (30.9%) |
| Health Diagnosing & Treating | 382 (32.2%) | 804 (67.8%) |
| Health Technologists | 58 (8.2%) | 654 (91.8%) |
| Total (Category) | 2,443 (34.1%) | 4,728 (65.9%) |
| Total (Overall) | 8,344 (46.5%) | 9,621 (53.5%) |
Services Occupations
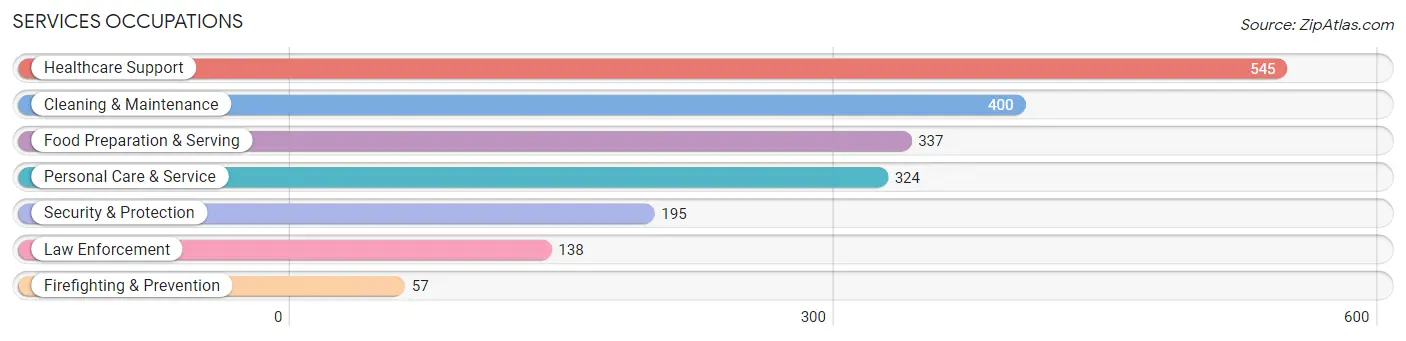
The most common Services occupations in Douglasville are Healthcare Support (545 | 3.0%), Cleaning & Maintenance (400 | 2.2%), Food Preparation & Serving (337 | 1.9%), Personal Care & Service (324 | 1.8%), and Security & Protection (195 | 1.1%).
Services Occupations by Sex
Within the Services occupations in Douglasville, the most male-oriented occupations are Firefighting & Prevention (100.0%), Security & Protection (71.3%), and Law Enforcement (59.4%), while the most female-oriented occupations are Healthcare Support (100.0%), Food Preparation & Serving (70.3%), and Cleaning & Maintenance (50.7%).
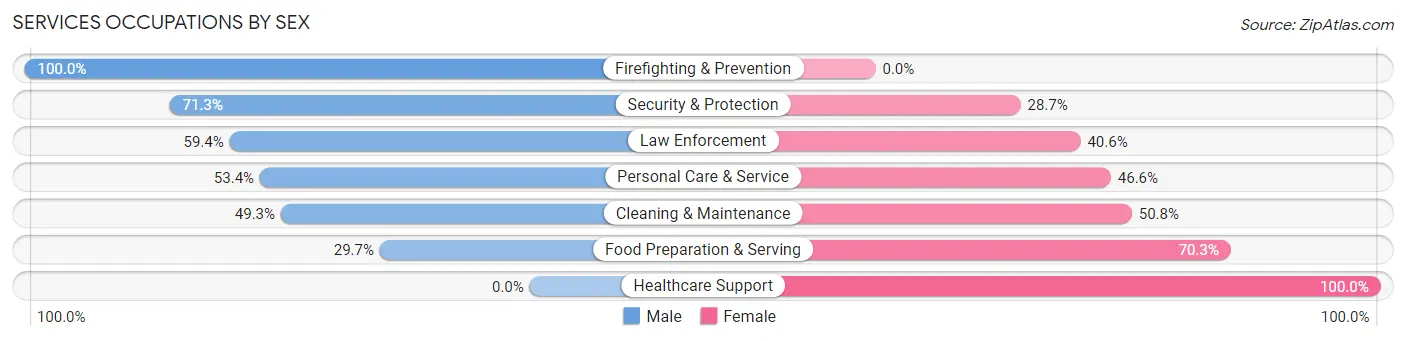
| Occupation | Male | Female |
| Healthcare Support | 0 (0.0%) | 545 (100.0%) |
| Security & Protection | 139 (71.3%) | 56 (28.7%) |
| Firefighting & Prevention | 57 (100.0%) | 0 (0.0%) |
| Law Enforcement | 82 (59.4%) | 56 (40.6%) |
| Food Preparation & Serving | 100 (29.7%) | 237 (70.3%) |
| Cleaning & Maintenance | 197 (49.2%) | 203 (50.7%) |
| Personal Care & Service | 173 (53.4%) | 151 (46.6%) |
| Total (Category) | 609 (33.8%) | 1,192 (66.2%) |
| Total (Overall) | 8,344 (46.5%) | 9,621 (53.5%) |
Sales and Office Occupations
The most common Sales and Office occupations in Douglasville are Office & Administration (2,830 | 15.8%), and Sales & Related (1,582 | 8.8%).

Sales and Office Occupations by Sex

| Occupation | Male | Female |
| Sales & Related | 648 (41.0%) | 934 (59.0%) |
| Office & Administration | 804 (28.4%) | 2,026 (71.6%) |
| Total (Category) | 1,452 (32.9%) | 2,960 (67.1%) |
| Total (Overall) | 8,344 (46.5%) | 9,621 (53.5%) |
Natural Resources, Construction and Maintenance Occupations
The most common Natural Resources, Construction and Maintenance occupations in Douglasville are Installation, Maintenance & Repair (622 | 3.5%), and Construction & Extraction (422 | 2.4%).

Natural Resources, Construction and Maintenance Occupations by Sex

| Occupation | Male | Female |
| Farming, Fishing & Forestry | 0 (0.0%) | 0 (0.0%) |
| Construction & Extraction | 422 (100.0%) | 0 (0.0%) |
| Installation, Maintenance & Repair | 622 (100.0%) | 0 (0.0%) |
| Total (Category) | 1,044 (100.0%) | 0 (0.0%) |
| Total (Overall) | 8,344 (46.5%) | 9,621 (53.5%) |
Production, Transportation and Moving Occupations
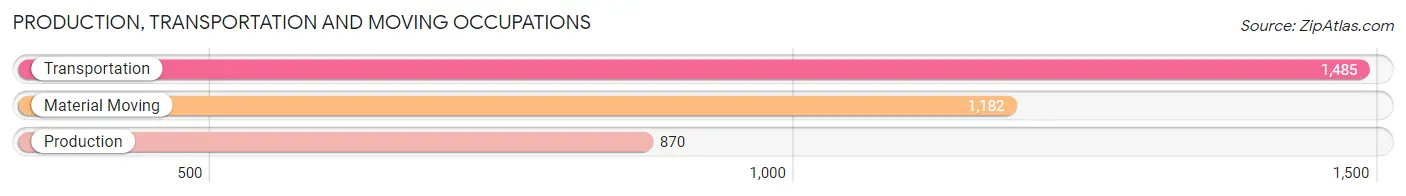
The most common Production, Transportation and Moving occupations in Douglasville are Transportation (1,485 | 8.3%), Material Moving (1,182 | 6.6%), and Production (870 | 4.8%).
Production, Transportation and Moving Occupations by Sex
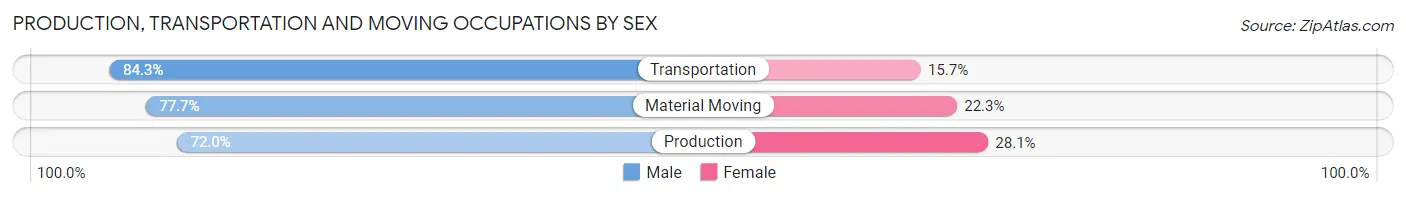
| Occupation | Male | Female |
| Production | 626 (72.0%) | 244 (28.1%) |
| Transportation | 1,252 (84.3%) | 233 (15.7%) |
| Material Moving | 918 (77.7%) | 264 (22.3%) |
| Total (Category) | 2,796 (79.0%) | 741 (20.9%) |
| Total (Overall) | 8,344 (46.5%) | 9,621 (53.5%) |
Employment Industries by Sex in Douglasville
Employment Industries in Douglasville
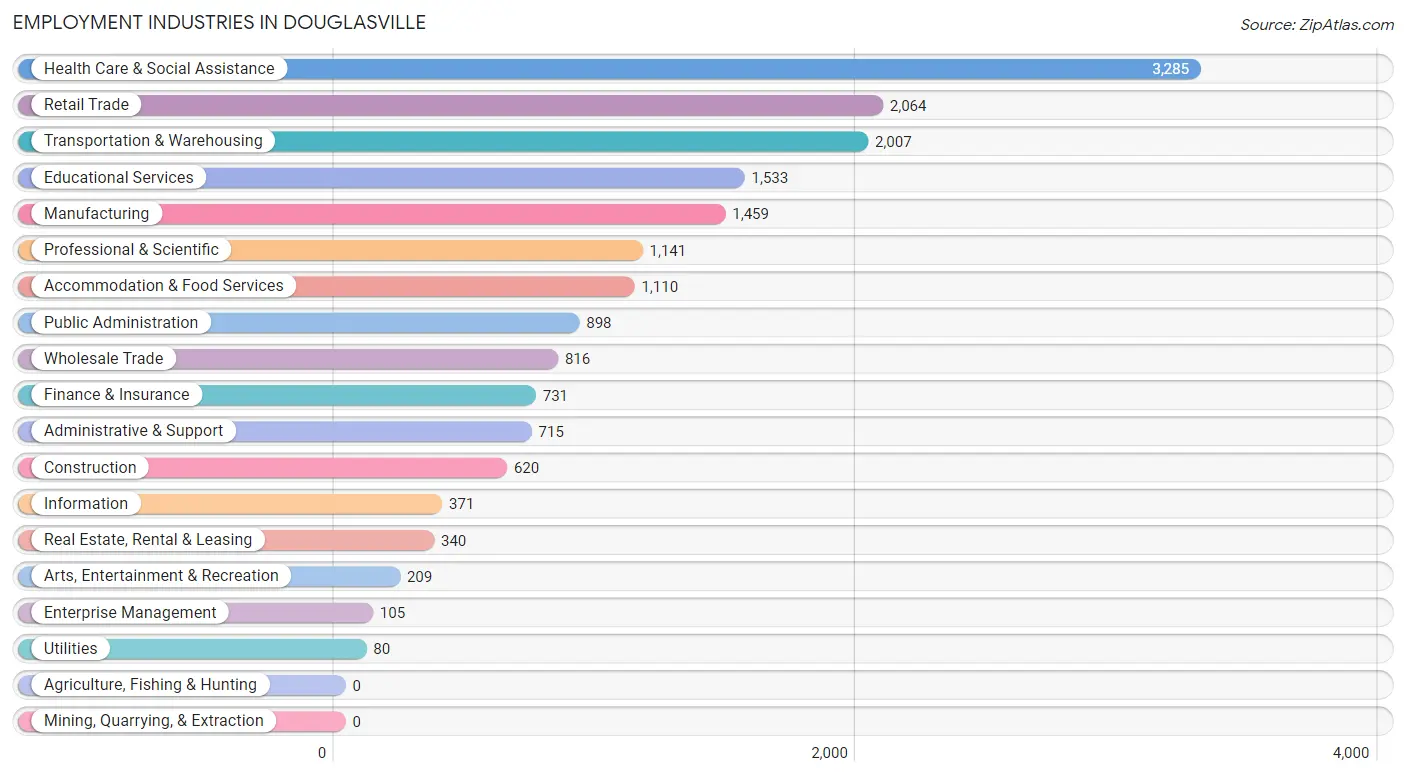
The major employment industries in Douglasville include Health Care & Social Assistance (3,285 | 18.3%), Retail Trade (2,064 | 11.5%), Transportation & Warehousing (2,007 | 11.2%), Educational Services (1,533 | 8.5%), and Manufacturing (1,459 | 8.1%).
Employment Industries by Sex in Douglasville
The Douglasville industries that see more men than women are Construction (96.1%), Arts, Entertainment & Recreation (84.7%), and Utilities (76.2%), whereas the industries that tend to have a higher number of women are Enterprise Management (100.0%), Finance & Insurance (87.5%), and Real Estate, Rental & Leasing (80.6%).
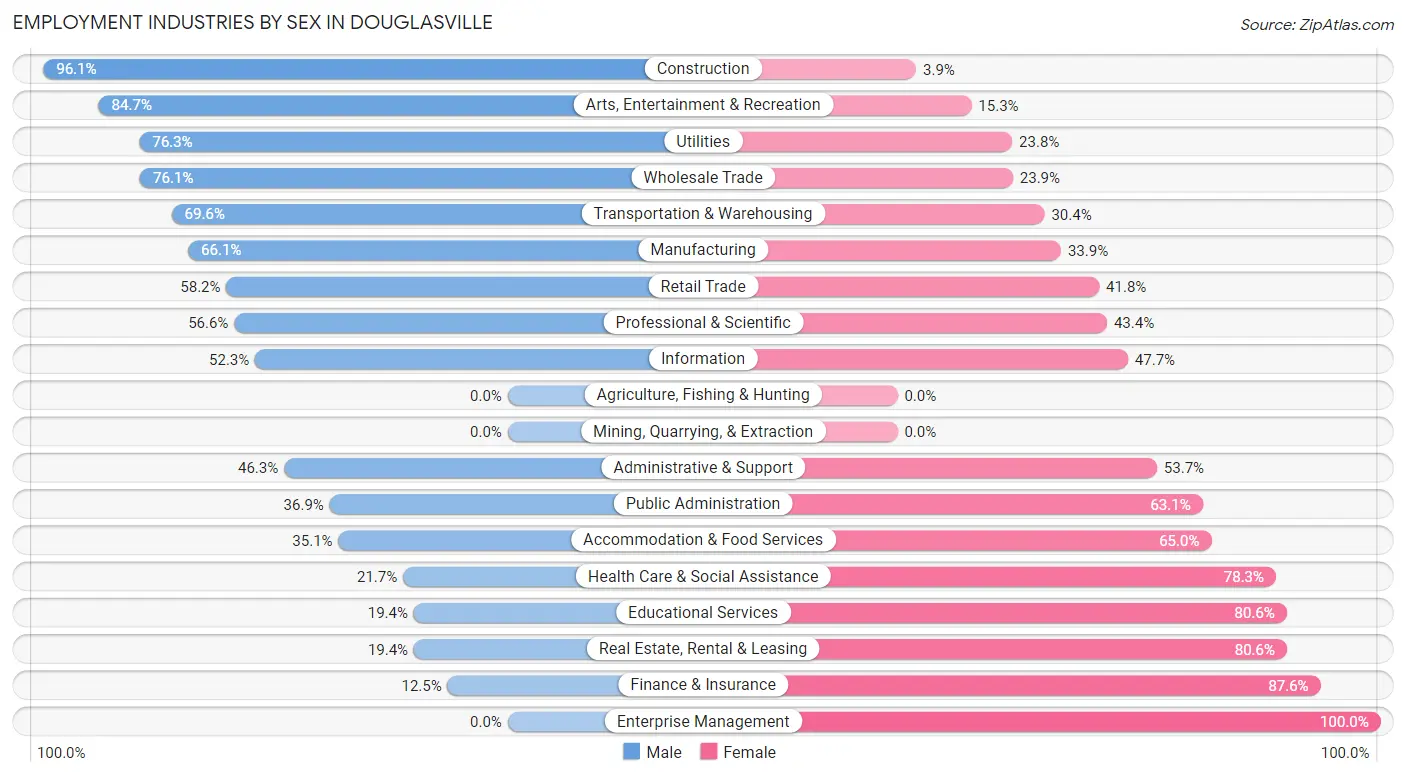
| Industry | Male | Female |
| Agriculture, Fishing & Hunting | 0 (0.0%) | 0 (0.0%) |
| Mining, Quarrying, & Extraction | 0 (0.0%) | 0 (0.0%) |
| Construction | 596 (96.1%) | 24 (3.9%) |
| Manufacturing | 965 (66.1%) | 494 (33.9%) |
| Wholesale Trade | 621 (76.1%) | 195 (23.9%) |
| Retail Trade | 1,202 (58.2%) | 862 (41.8%) |
| Transportation & Warehousing | 1,396 (69.6%) | 611 (30.4%) |
| Utilities | 61 (76.2%) | 19 (23.7%) |
| Information | 194 (52.3%) | 177 (47.7%) |
| Finance & Insurance | 91 (12.4%) | 640 (87.5%) |
| Real Estate, Rental & Leasing | 66 (19.4%) | 274 (80.6%) |
| Professional & Scientific | 646 (56.6%) | 495 (43.4%) |
| Enterprise Management | 0 (0.0%) | 105 (100.0%) |
| Administrative & Support | 331 (46.3%) | 384 (53.7%) |
| Educational Services | 298 (19.4%) | 1,235 (80.6%) |
| Health Care & Social Assistance | 712 (21.7%) | 2,573 (78.3%) |
| Arts, Entertainment & Recreation | 177 (84.7%) | 32 (15.3%) |
| Accommodation & Food Services | 389 (35.0%) | 721 (64.9%) |
| Public Administration | 331 (36.9%) | 567 (63.1%) |
| Total | 8,344 (46.5%) | 9,621 (53.5%) |
Education in Douglasville
School Enrollment in Douglasville
The most common levels of schooling among the 9,958 students in Douglasville are elementary school (2,224 | 22.3%), middle school (2,075 | 20.8%), and high school (2,013 | 20.2%).
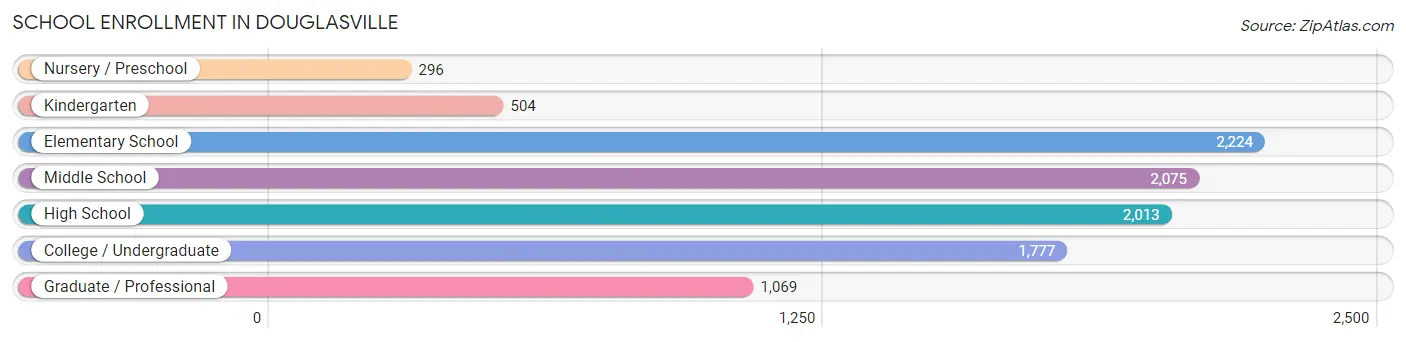
| School Level | # Students | % Students |
| Nursery / Preschool | 296 | 3.0% |
| Kindergarten | 504 | 5.1% |
| Elementary School | 2,224 | 22.3% |
| Middle School | 2,075 | 20.8% |
| High School | 2,013 | 20.2% |
| College / Undergraduate | 1,777 | 17.8% |
| Graduate / Professional | 1,069 | 10.7% |
| Total | 9,958 | 100.0% |
School Enrollment by Age by Funding Source in Douglasville
Out of a total of 9,958 students who are enrolled in schools in Douglasville, 1,812 (18.2%) attend a private institution, while the remaining 8,146 (81.8%) are enrolled in public schools. The age group of 18 to 19 year olds has the highest likelihood of being enrolled in private schools, with 249 (40.4% in the age bracket) enrolled. Conversely, the age group of 15 to 17 year olds has the lowest likelihood of being enrolled in a private school, with 1,267 (91.5% in the age bracket) attending a public institution.
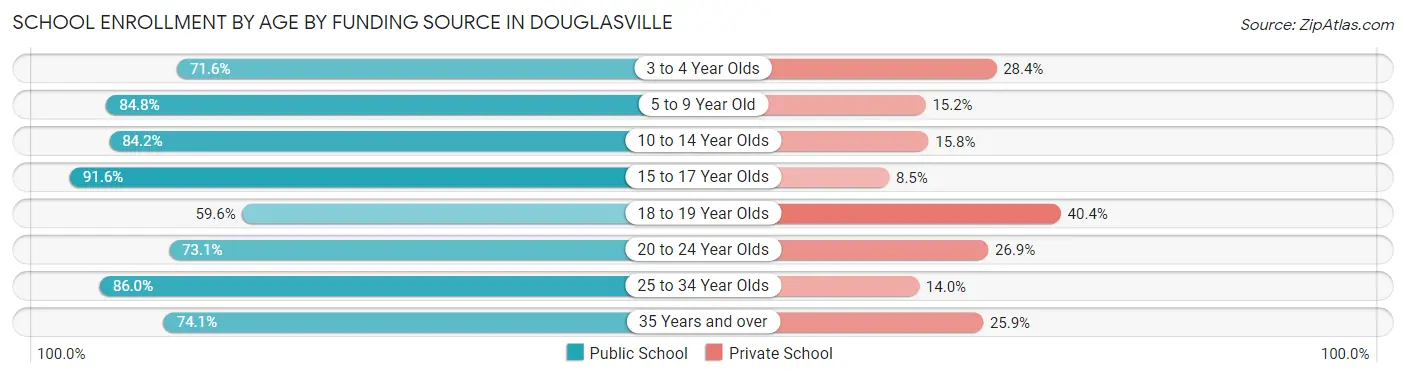
| Age Bracket | Public School | Private School |
| 3 to 4 Year Olds | 126 (71.6%) | 50 (28.4%) |
| 5 to 9 Year Old | 1,764 (84.8%) | 317 (15.2%) |
| 10 to 14 Year Olds | 2,441 (84.2%) | 457 (15.8%) |
| 15 to 17 Year Olds | 1,267 (91.5%) | 117 (8.5%) |
| 18 to 19 Year Olds | 367 (59.6%) | 249 (40.4%) |
| 20 to 24 Year Olds | 405 (73.1%) | 149 (26.9%) |
| 25 to 34 Year Olds | 767 (86.0%) | 125 (14.0%) |
| 35 Years and over | 1,005 (74.1%) | 352 (25.9%) |
| Total | 8,146 (81.8%) | 1,812 (18.2%) |
Educational Attainment by Field of Study in Douglasville
Business (2,552 | 27.9%), education (1,295 | 14.1%), arts & humanities (1,214 | 13.3%), science & technology (844 | 9.2%), and psychology (580 | 6.3%) are the most common fields of study among 9,161 individuals in Douglasville who have obtained a bachelor's degree or higher.
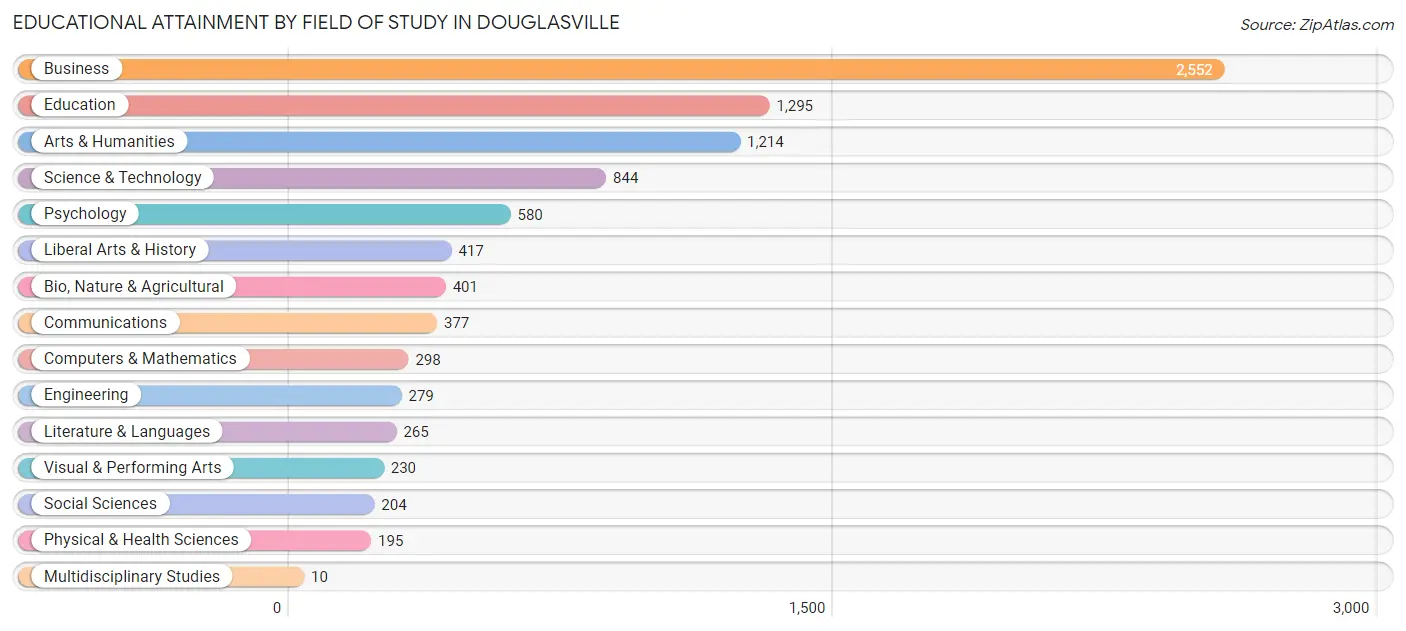
| Field of Study | # Graduates | % Graduates |
| Computers & Mathematics | 298 | 3.3% |
| Bio, Nature & Agricultural | 401 | 4.4% |
| Physical & Health Sciences | 195 | 2.1% |
| Psychology | 580 | 6.3% |
| Social Sciences | 204 | 2.2% |
| Engineering | 279 | 3.0% |
| Multidisciplinary Studies | 10 | 0.1% |
| Science & Technology | 844 | 9.2% |
| Business | 2,552 | 27.9% |
| Education | 1,295 | 14.1% |
| Literature & Languages | 265 | 2.9% |
| Liberal Arts & History | 417 | 4.5% |
| Visual & Performing Arts | 230 | 2.5% |
| Communications | 377 | 4.1% |
| Arts & Humanities | 1,214 | 13.3% |
| Total | 9,161 | 100.0% |
Transportation & Commute in Douglasville
Vehicle Availability by Sex in Douglasville
The most prevalent vehicle ownership categories in Douglasville are males with 2 vehicles (3,807, accounting for 45.8%) and females with 2 vehicles (4,369, making up 40.0%).
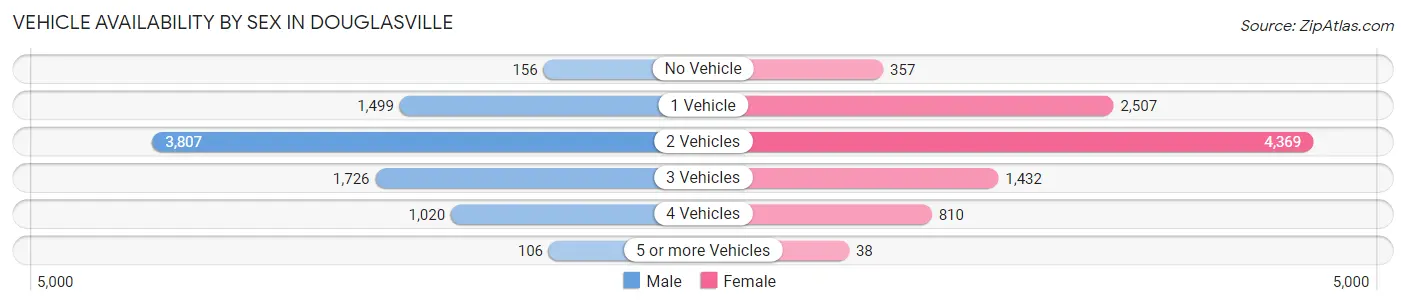
| Vehicles Available | Male | Female |
| No Vehicle | 156 (1.9%) | 357 (3.7%) |
| 1 Vehicle | 1,499 (18.0%) | 2,507 (26.4%) |
| 2 Vehicles | 3,807 (45.8%) | 4,369 (45.9%) |
| 3 Vehicles | 1,726 (20.8%) | 1,432 (15.0%) |
| 4 Vehicles | 1,020 (12.3%) | 810 (8.5%) |
| 5 or more Vehicles | 106 (1.3%) | 38 (0.4%) |
| Total | 8,314 (100.0%) | 9,513 (100.0%) |
Commute Time in Douglasville
The most frequently occuring commute durations in Douglasville are 30 to 34 minutes (2,358 commuters, 15.0%), 15 to 19 minutes (2,272 commuters, 14.5%), and 60 to 89 minutes (2,106 commuters, 13.4%).
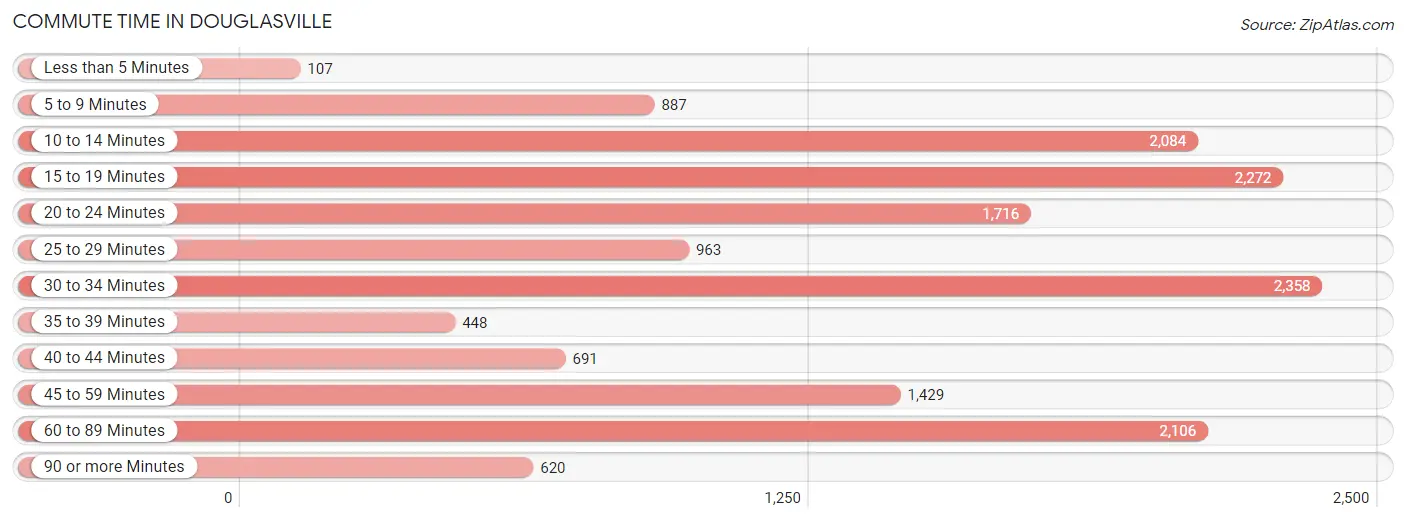
| Commute Time | # Commuters | % Commuters |
| Less than 5 Minutes | 107 | 0.7% |
| 5 to 9 Minutes | 887 | 5.7% |
| 10 to 14 Minutes | 2,084 | 13.3% |
| 15 to 19 Minutes | 2,272 | 14.5% |
| 20 to 24 Minutes | 1,716 | 10.9% |
| 25 to 29 Minutes | 963 | 6.1% |
| 30 to 34 Minutes | 2,358 | 15.0% |
| 35 to 39 Minutes | 448 | 2.9% |
| 40 to 44 Minutes | 691 | 4.4% |
| 45 to 59 Minutes | 1,429 | 9.1% |
| 60 to 89 Minutes | 2,106 | 13.4% |
| 90 or more Minutes | 620 | 4.0% |
Commute Time by Sex in Douglasville
The most common commute times in Douglasville are 10 to 14 minutes (1,127 commuters, 14.8%) for males and 15 to 19 minutes (1,588 commuters, 19.7%) for females.
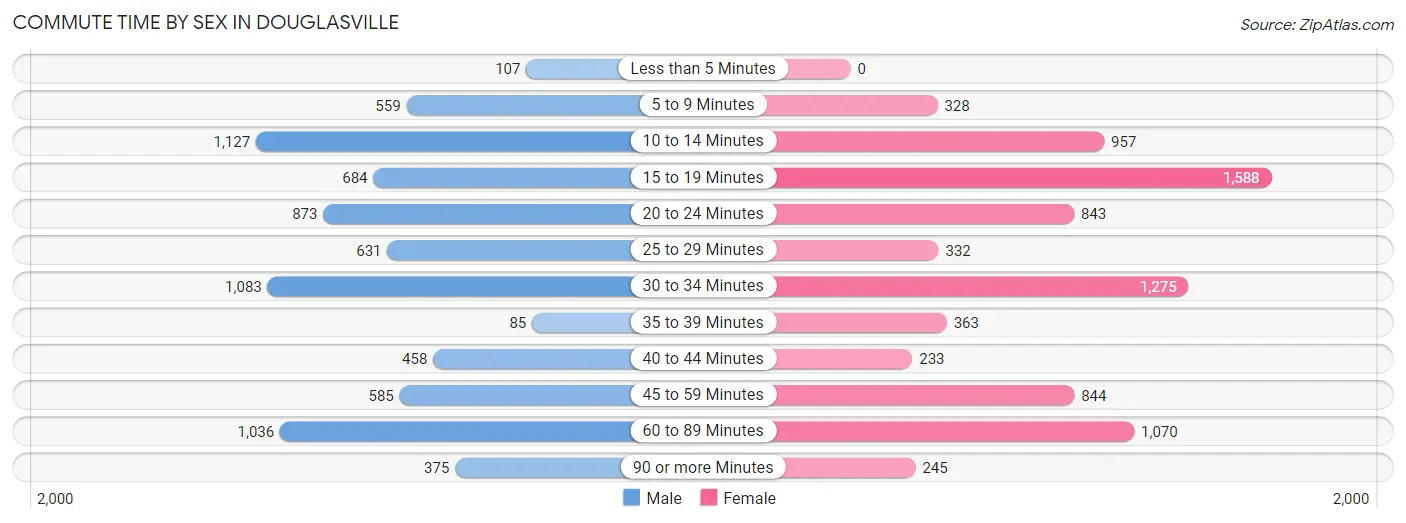
| Commute Time | Male | Female |
| Less than 5 Minutes | 107 (1.4%) | 0 (0.0%) |
| 5 to 9 Minutes | 559 (7.3%) | 328 (4.1%) |
| 10 to 14 Minutes | 1,127 (14.8%) | 957 (11.8%) |
| 15 to 19 Minutes | 684 (9.0%) | 1,588 (19.7%) |
| 20 to 24 Minutes | 873 (11.5%) | 843 (10.4%) |
| 25 to 29 Minutes | 631 (8.3%) | 332 (4.1%) |
| 30 to 34 Minutes | 1,083 (14.2%) | 1,275 (15.8%) |
| 35 to 39 Minutes | 85 (1.1%) | 363 (4.5%) |
| 40 to 44 Minutes | 458 (6.0%) | 233 (2.9%) |
| 45 to 59 Minutes | 585 (7.7%) | 844 (10.4%) |
| 60 to 89 Minutes | 1,036 (13.6%) | 1,070 (13.3%) |
| 90 or more Minutes | 375 (4.9%) | 245 (3.0%) |
Time of Departure to Work by Sex in Douglasville
The most frequent times of departure to work in Douglasville are 4:00 PM to 11:59 PM (1,107, 14.6%) for males and 6:30 AM to 6:59 AM (1,207, 14.9%) for females.
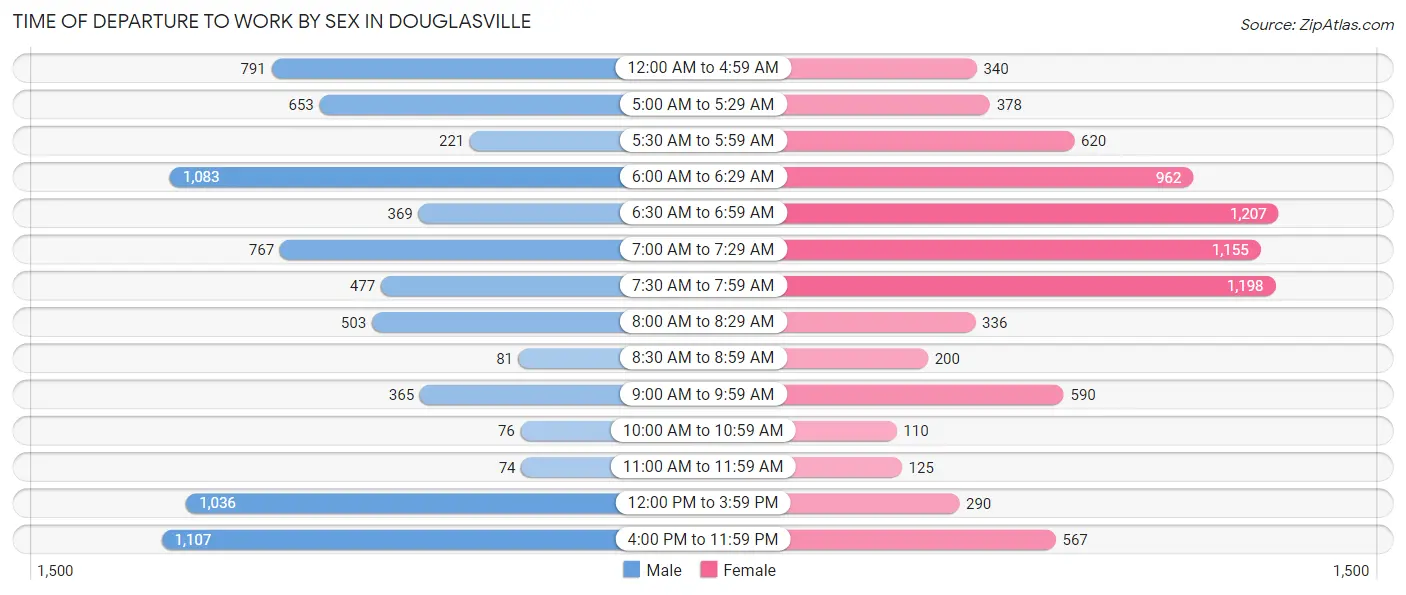
| Time of Departure | Male | Female |
| 12:00 AM to 4:59 AM | 791 (10.4%) | 340 (4.2%) |
| 5:00 AM to 5:29 AM | 653 (8.6%) | 378 (4.7%) |
| 5:30 AM to 5:59 AM | 221 (2.9%) | 620 (7.7%) |
| 6:00 AM to 6:29 AM | 1,083 (14.2%) | 962 (11.9%) |
| 6:30 AM to 6:59 AM | 369 (4.9%) | 1,207 (14.9%) |
| 7:00 AM to 7:29 AM | 767 (10.1%) | 1,155 (14.3%) |
| 7:30 AM to 7:59 AM | 477 (6.3%) | 1,198 (14.8%) |
| 8:00 AM to 8:29 AM | 503 (6.6%) | 336 (4.2%) |
| 8:30 AM to 8:59 AM | 81 (1.1%) | 200 (2.5%) |
| 9:00 AM to 9:59 AM | 365 (4.8%) | 590 (7.3%) |
| 10:00 AM to 10:59 AM | 76 (1.0%) | 110 (1.4%) |
| 11:00 AM to 11:59 AM | 74 (1.0%) | 125 (1.5%) |
| 12:00 PM to 3:59 PM | 1,036 (13.6%) | 290 (3.6%) |
| 4:00 PM to 11:59 PM | 1,107 (14.6%) | 567 (7.0%) |
| Total | 7,603 (100.0%) | 8,078 (100.0%) |
Housing Occupancy in Douglasville
Occupancy by Ownership in Douglasville
Of the total 13,792 dwellings in Douglasville, owner-occupied units account for 6,787 (49.2%), while renter-occupied units make up 7,005 (50.8%).
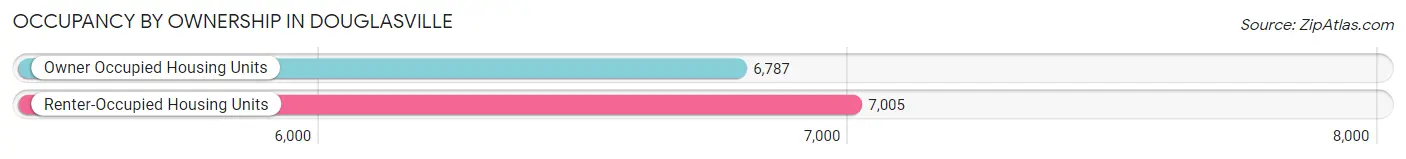
| Occupancy | # Housing Units | % Housing Units |
| Owner Occupied Housing Units | 6,787 | 49.2% |
| Renter-Occupied Housing Units | 7,005 | 50.8% |
| Total Occupied Housing Units | 13,792 | 100.0% |
Occupancy by Household Size in Douglasville
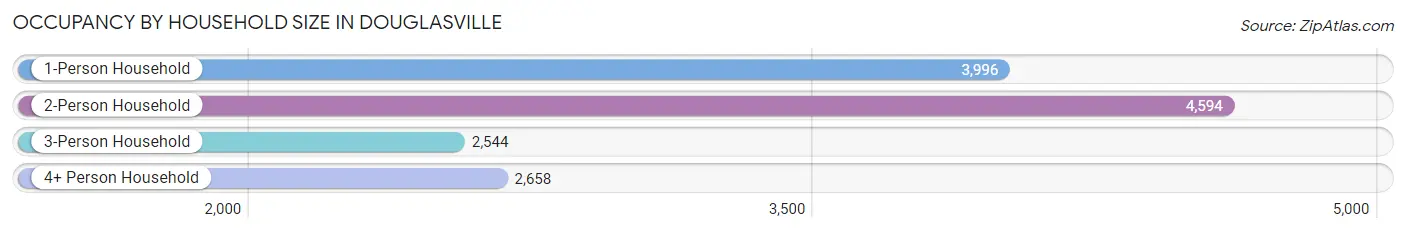
| Household Size | # Housing Units | % Housing Units |
| 1-Person Household | 3,996 | 29.0% |
| 2-Person Household | 4,594 | 33.3% |
| 3-Person Household | 2,544 | 18.4% |
| 4+ Person Household | 2,658 | 19.3% |
| Total Housing Units | 13,792 | 100.0% |
Occupancy by Ownership by Household Size in Douglasville
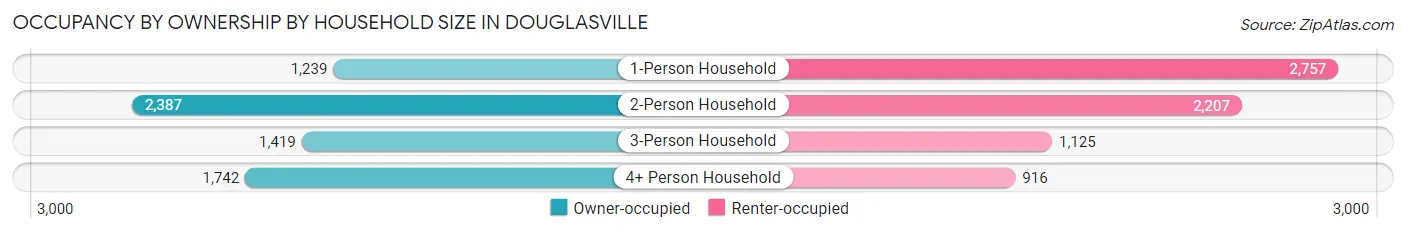
| Household Size | Owner-occupied | Renter-occupied |
| 1-Person Household | 1,239 (31.0%) | 2,757 (69.0%) |
| 2-Person Household | 2,387 (52.0%) | 2,207 (48.0%) |
| 3-Person Household | 1,419 (55.8%) | 1,125 (44.2%) |
| 4+ Person Household | 1,742 (65.5%) | 916 (34.5%) |
| Total Housing Units | 6,787 (49.2%) | 7,005 (50.8%) |
Occupancy by Educational Attainment in Douglasville
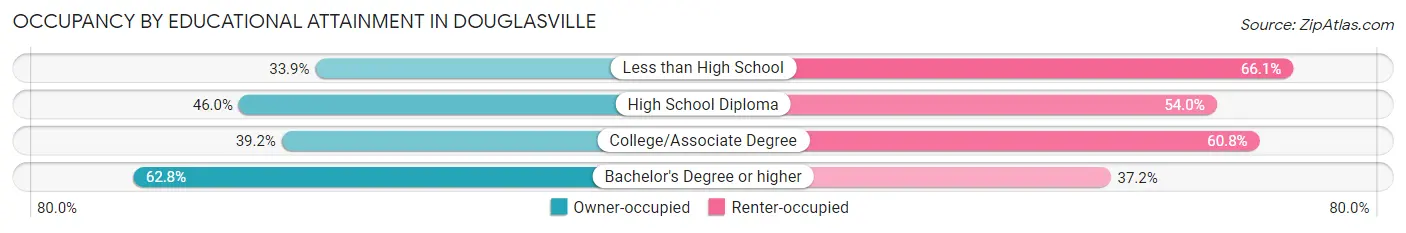
| Household Size | Owner-occupied | Renter-occupied |
| Less than High School | 363 (33.9%) | 708 (66.1%) |
| High School Diploma | 1,062 (46.0%) | 1,245 (54.0%) |
| College/Associate Degree | 1,961 (39.2%) | 3,039 (60.8%) |
| Bachelor's Degree or higher | 3,401 (62.8%) | 2,013 (37.2%) |
Occupancy by Age of Householder in Douglasville
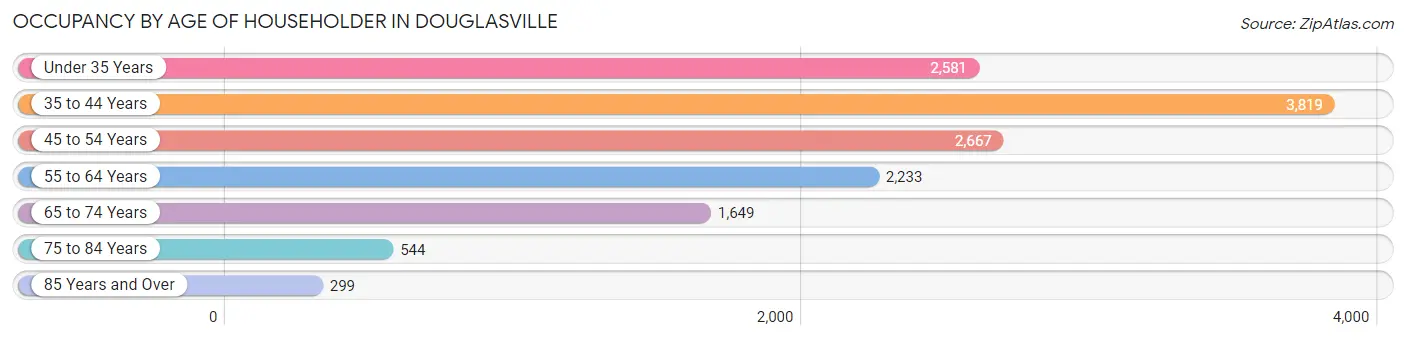
| Age Bracket | # Households | % Households |
| Under 35 Years | 2,581 | 18.7% |
| 35 to 44 Years | 3,819 | 27.7% |
| 45 to 54 Years | 2,667 | 19.3% |
| 55 to 64 Years | 2,233 | 16.2% |
| 65 to 74 Years | 1,649 | 12.0% |
| 75 to 84 Years | 544 | 3.9% |
| 85 Years and Over | 299 | 2.2% |
| Total | 13,792 | 100.0% |
Housing Finances in Douglasville
Median Income by Occupancy in Douglasville
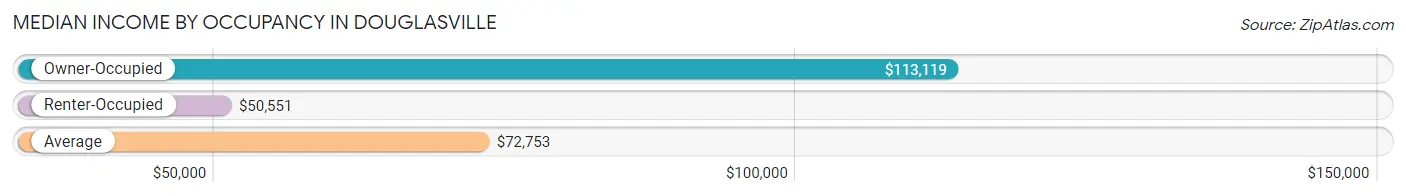
| Occupancy Type | # Households | Median Income |
| Owner-Occupied | 6,787 (49.2%) | $113,119 |
| Renter-Occupied | 7,005 (50.8%) | $50,551 |
| Average | 13,792 (100.0%) | $72,753 |
Occupancy by Householder Income Bracket in Douglasville
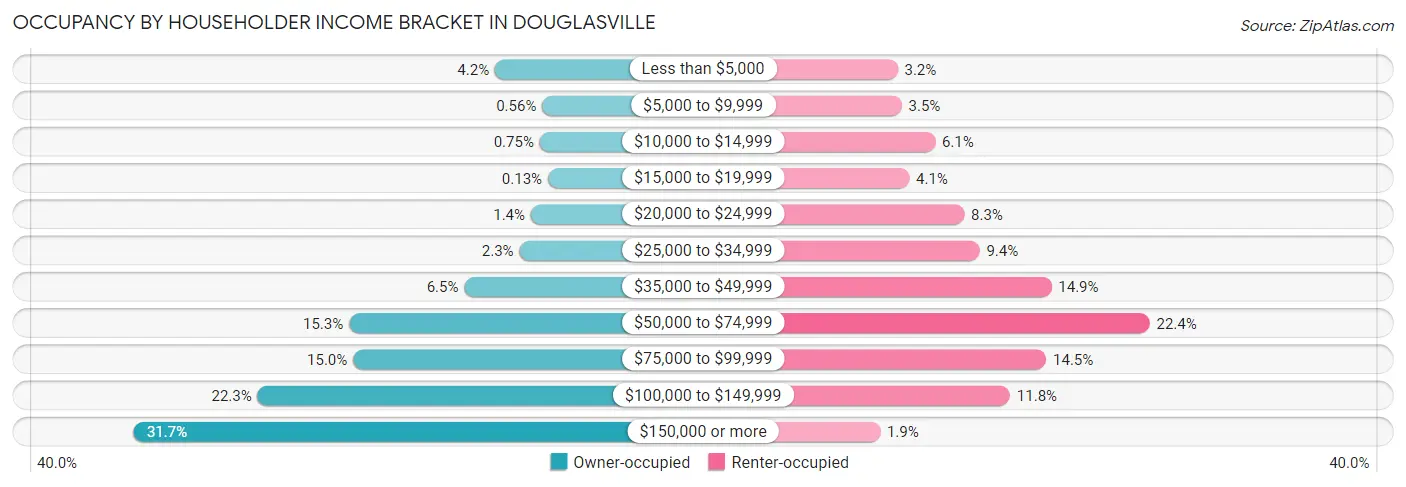
| Income Bracket | Owner-occupied | Renter-occupied |
| Less than $5,000 | 282 (4.2%) | 224 (3.2%) |
| $5,000 to $9,999 | 38 (0.6%) | 246 (3.5%) |
| $10,000 to $14,999 | 51 (0.7%) | 424 (6.0%) |
| $15,000 to $19,999 | 9 (0.1%) | 286 (4.1%) |
| $20,000 to $24,999 | 97 (1.4%) | 579 (8.3%) |
| $25,000 to $34,999 | 156 (2.3%) | 661 (9.4%) |
| $35,000 to $49,999 | 441 (6.5%) | 1,045 (14.9%) |
| $50,000 to $74,999 | 1,037 (15.3%) | 1,569 (22.4%) |
| $75,000 to $99,999 | 1,016 (15.0%) | 1,017 (14.5%) |
| $100,000 to $149,999 | 1,510 (22.3%) | 824 (11.8%) |
| $150,000 or more | 2,150 (31.7%) | 130 (1.9%) |
| Total | 6,787 (100.0%) | 7,005 (100.0%) |
Monthly Housing Cost Tiers in Douglasville
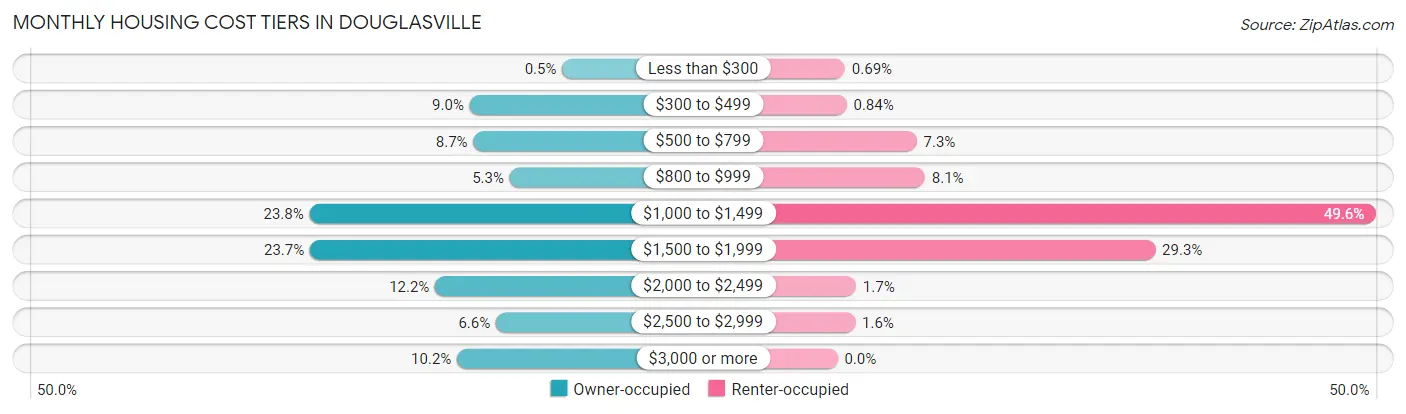
| Monthly Cost | Owner-occupied | Renter-occupied |
| Less than $300 | 34 (0.5%) | 48 (0.7%) |
| $300 to $499 | 612 (9.0%) | 59 (0.8%) |
| $500 to $799 | 589 (8.7%) | 511 (7.3%) |
| $800 to $999 | 362 (5.3%) | 564 (8.1%) |
| $1,000 to $1,499 | 1,613 (23.8%) | 3,473 (49.6%) |
| $1,500 to $1,999 | 1,610 (23.7%) | 2,049 (29.2%) |
| $2,000 to $2,499 | 828 (12.2%) | 119 (1.7%) |
| $2,500 to $2,999 | 448 (6.6%) | 114 (1.6%) |
| $3,000 or more | 691 (10.2%) | 0 (0.0%) |
| Total | 6,787 (100.0%) | 7,005 (100.0%) |
Physical Housing Characteristics in Douglasville
Housing Structures in Douglasville
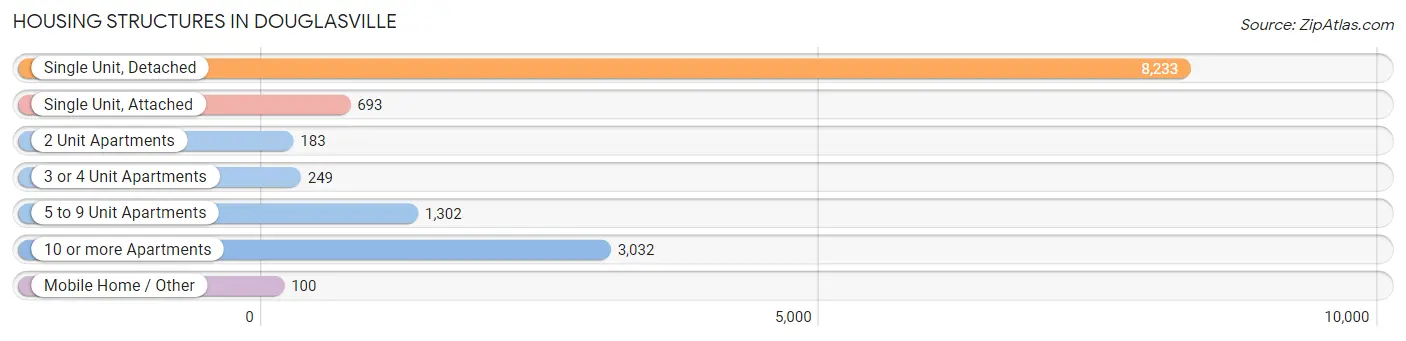
| Structure Type | # Housing Units | % Housing Units |
| Single Unit, Detached | 8,233 | 59.7% |
| Single Unit, Attached | 693 | 5.0% |
| 2 Unit Apartments | 183 | 1.3% |
| 3 or 4 Unit Apartments | 249 | 1.8% |
| 5 to 9 Unit Apartments | 1,302 | 9.4% |
| 10 or more Apartments | 3,032 | 22.0% |
| Mobile Home / Other | 100 | 0.7% |
| Total | 13,792 | 100.0% |
Housing Structures by Occupancy in Douglasville
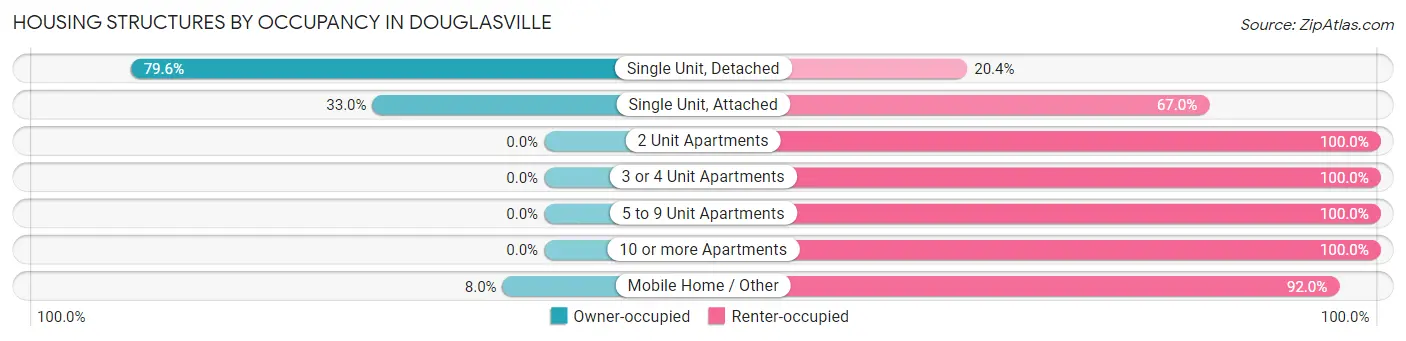
| Structure Type | Owner-occupied | Renter-occupied |
| Single Unit, Detached | 6,550 (79.6%) | 1,683 (20.4%) |
| Single Unit, Attached | 229 (33.0%) | 464 (67.0%) |
| 2 Unit Apartments | 0 (0.0%) | 183 (100.0%) |
| 3 or 4 Unit Apartments | 0 (0.0%) | 249 (100.0%) |
| 5 to 9 Unit Apartments | 0 (0.0%) | 1,302 (100.0%) |
| 10 or more Apartments | 0 (0.0%) | 3,032 (100.0%) |
| Mobile Home / Other | 8 (8.0%) | 92 (92.0%) |
| Total | 6,787 (49.2%) | 7,005 (50.8%) |
Housing Structures by Number of Rooms in Douglasville
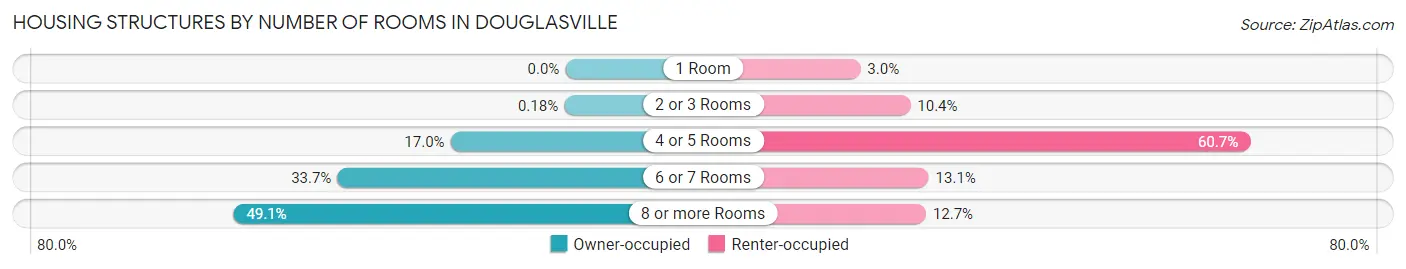
| Number of Rooms | Owner-occupied | Renter-occupied |
| 1 Room | 0 (0.0%) | 212 (3.0%) |
| 2 or 3 Rooms | 12 (0.2%) | 730 (10.4%) |
| 4 or 5 Rooms | 1,153 (17.0%) | 4,251 (60.7%) |
| 6 or 7 Rooms | 2,290 (33.7%) | 920 (13.1%) |
| 8 or more Rooms | 3,332 (49.1%) | 892 (12.7%) |
| Total | 6,787 (100.0%) | 7,005 (100.0%) |
Housing Structure by Heating Type in Douglasville
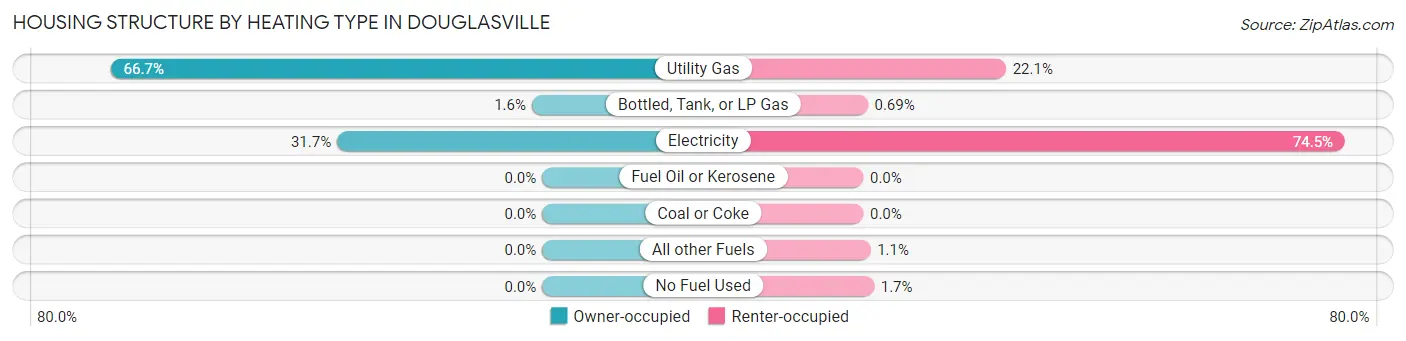
| Heating Type | Owner-occupied | Renter-occupied |
| Utility Gas | 4,527 (66.7%) | 1,545 (22.1%) |
| Bottled, Tank, or LP Gas | 108 (1.6%) | 48 (0.7%) |
| Electricity | 2,152 (31.7%) | 5,218 (74.5%) |
| Fuel Oil or Kerosene | 0 (0.0%) | 0 (0.0%) |
| Coal or Coke | 0 (0.0%) | 0 (0.0%) |
| All other Fuels | 0 (0.0%) | 78 (1.1%) |
| No Fuel Used | 0 (0.0%) | 116 (1.7%) |
| Total | 6,787 (100.0%) | 7,005 (100.0%) |
Household Vehicle Usage in Douglasville
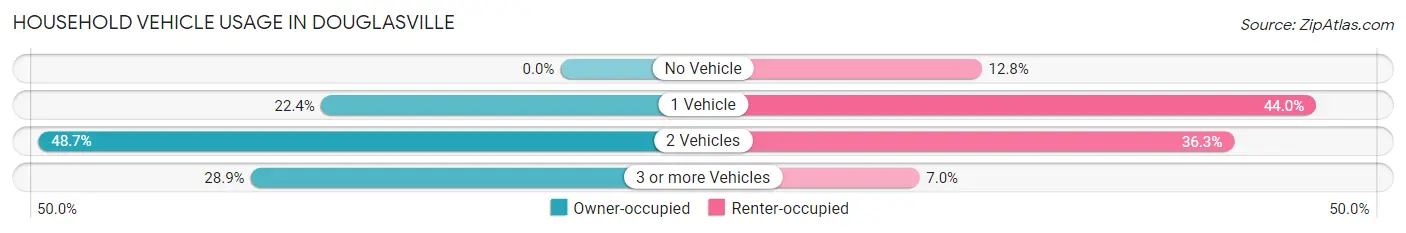
| Vehicles per Household | Owner-occupied | Renter-occupied |
| No Vehicle | 0 (0.0%) | 894 (12.8%) |
| 1 Vehicle | 1,518 (22.4%) | 3,080 (44.0%) |
| 2 Vehicles | 3,306 (48.7%) | 2,544 (36.3%) |
| 3 or more Vehicles | 1,963 (28.9%) | 487 (7.0%) |
| Total | 6,787 (100.0%) | 7,005 (100.0%) |
Real Estate & Mortgages in Douglasville
Real Estate and Mortgage Overview in Douglasville
| Characteristic | Without Mortgage | With Mortgage |
| Housing Units | 1,340 | 5,447 |
| Median Property Value | $230,000 | $284,600 |
| Median Household Income | $64,655 | $2,023 |
| Monthly Housing Costs | $531 | $691 |
| Real Estate Taxes | $1,990 | $107 |
Property Value by Mortgage Status in Douglasville
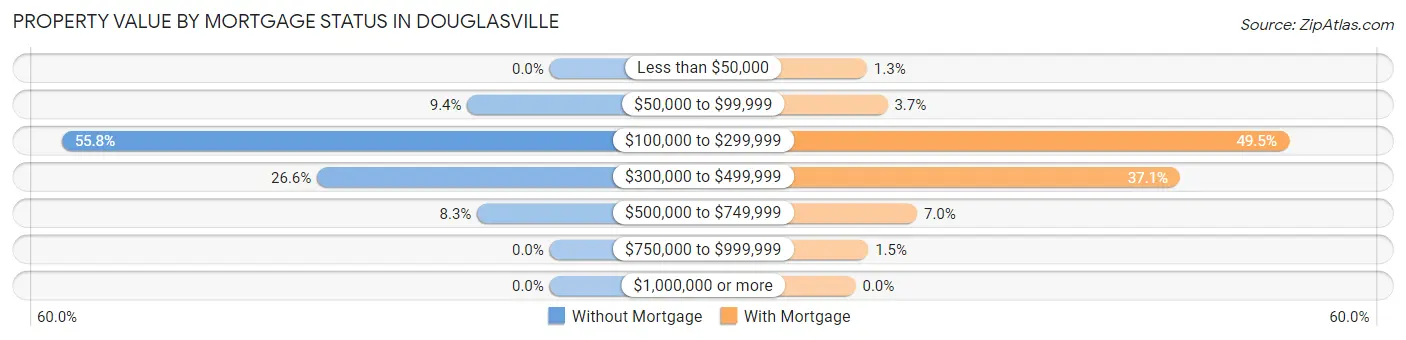
| Property Value | Without Mortgage | With Mortgage |
| Less than $50,000 | 0 (0.0%) | 71 (1.3%) |
| $50,000 to $99,999 | 126 (9.4%) | 199 (3.6%) |
| $100,000 to $299,999 | 747 (55.7%) | 2,696 (49.5%) |
| $300,000 to $499,999 | 356 (26.6%) | 2,019 (37.1%) |
| $500,000 to $749,999 | 111 (8.3%) | 383 (7.0%) |
| $750,000 to $999,999 | 0 (0.0%) | 79 (1.5%) |
| $1,000,000 or more | 0 (0.0%) | 0 (0.0%) |
| Total | 1,340 (100.0%) | 5,447 (100.0%) |
Household Income by Mortgage Status in Douglasville
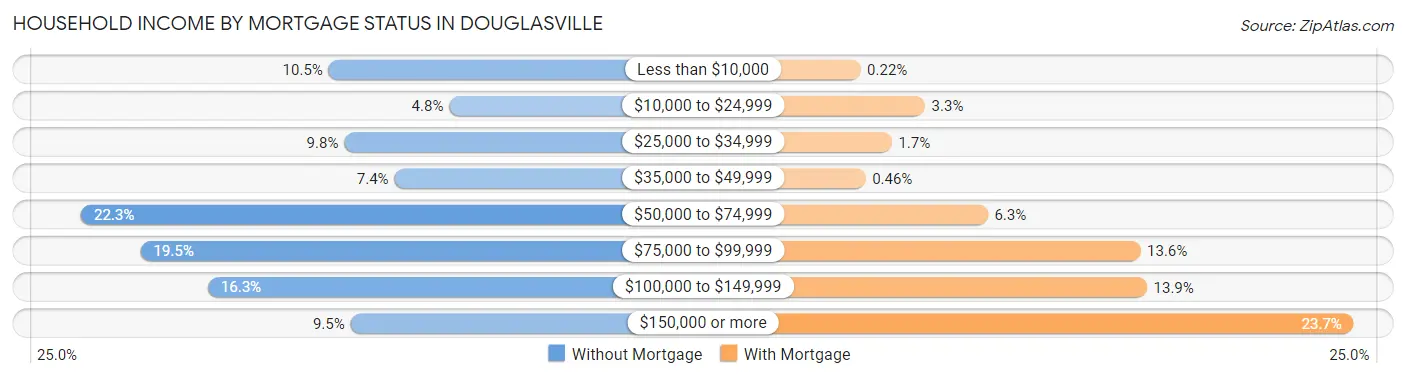
| Household Income | Without Mortgage | With Mortgage |
| Less than $10,000 | 141 (10.5%) | 12 (0.2%) |
| $10,000 to $24,999 | 64 (4.8%) | 179 (3.3%) |
| $25,000 to $34,999 | 131 (9.8%) | 93 (1.7%) |
| $35,000 to $49,999 | 99 (7.4%) | 25 (0.5%) |
| $50,000 to $74,999 | 299 (22.3%) | 342 (6.3%) |
| $75,000 to $99,999 | 261 (19.5%) | 738 (13.6%) |
| $100,000 to $149,999 | 218 (16.3%) | 755 (13.9%) |
| $150,000 or more | 127 (9.5%) | 1,292 (23.7%) |
| Total | 1,340 (100.0%) | 5,447 (100.0%) |
Property Value to Household Income Ratio in Douglasville
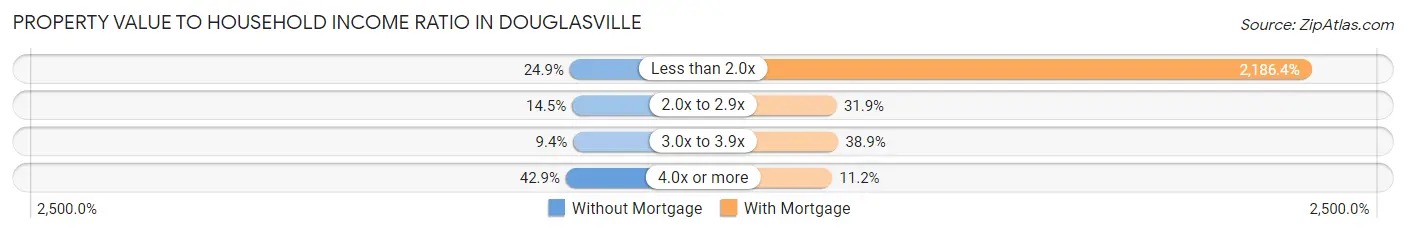
| Value-to-Income Ratio | Without Mortgage | With Mortgage |
| Less than 2.0x | 333 (24.8%) | 119,091 (2,186.4%) |
| 2.0x to 2.9x | 194 (14.5%) | 1,740 (31.9%) |
| 3.0x to 3.9x | 126 (9.4%) | 2,119 (38.9%) |
| 4.0x or more | 575 (42.9%) | 612 (11.2%) |
| Total | 1,340 (100.0%) | 5,447 (100.0%) |
Real Estate Taxes by Mortgage Status in Douglasville

| Property Taxes | Without Mortgage | With Mortgage |
| Less than $800 | 211 (15.8%) | 108 (2.0%) |
| $800 to $1,499 | 269 (20.1%) | 138 (2.5%) |
| $800 to $1,499 | 860 (64.2%) | 926 (17.0%) |
| Total | 1,340 (100.0%) | 5,447 (100.0%) |
Health & Disability in Douglasville
Health Insurance Coverage by Age in Douglasville
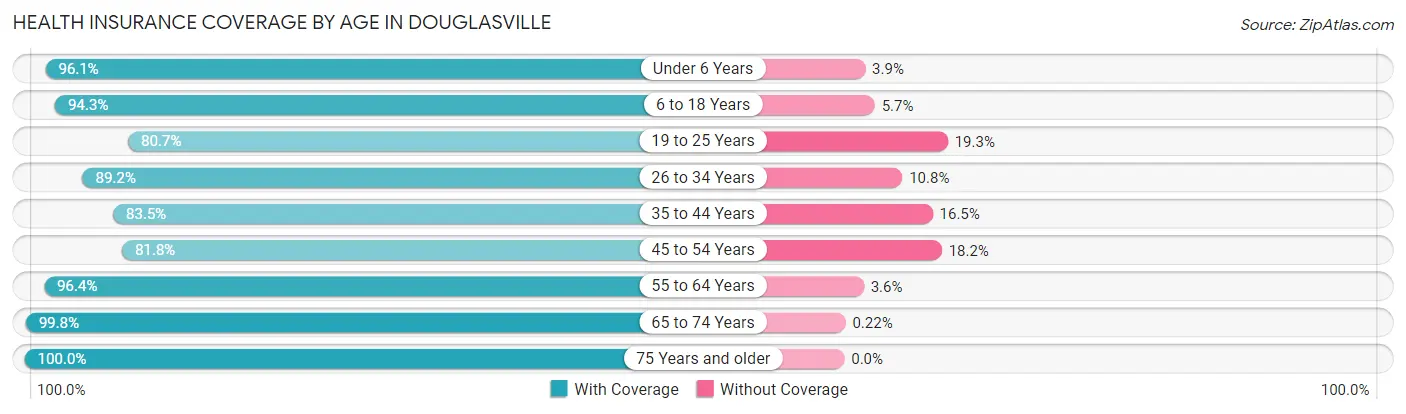
| Age Bracket | With Coverage | Without Coverage |
| Under 6 Years | 2,739 (96.1%) | 111 (3.9%) |
| 6 to 18 Years | 6,210 (94.3%) | 373 (5.7%) |
| 19 to 25 Years | 1,657 (80.7%) | 396 (19.3%) |
| 26 to 34 Years | 4,174 (89.2%) | 506 (10.8%) |
| 35 to 44 Years | 4,972 (83.5%) | 980 (16.5%) |
| 45 to 54 Years | 3,498 (81.8%) | 776 (18.2%) |
| 55 to 64 Years | 3,536 (96.4%) | 133 (3.6%) |
| 65 to 74 Years | 2,664 (99.8%) | 6 (0.2%) |
| 75 Years and older | 1,514 (100.0%) | 0 (0.0%) |
| Total | 30,964 (90.4%) | 3,281 (9.6%) |
Health Insurance Coverage by Citizenship Status in Douglasville

| Citizenship Status | With Coverage | Without Coverage |
| Native Born | 2,739 (96.1%) | 111 (3.9%) |
| Foreign Born, Citizen | 6,210 (94.3%) | 373 (5.7%) |
| Foreign Born, not a Citizen | 1,657 (80.7%) | 396 (19.3%) |
Health Insurance Coverage by Household Income in Douglasville
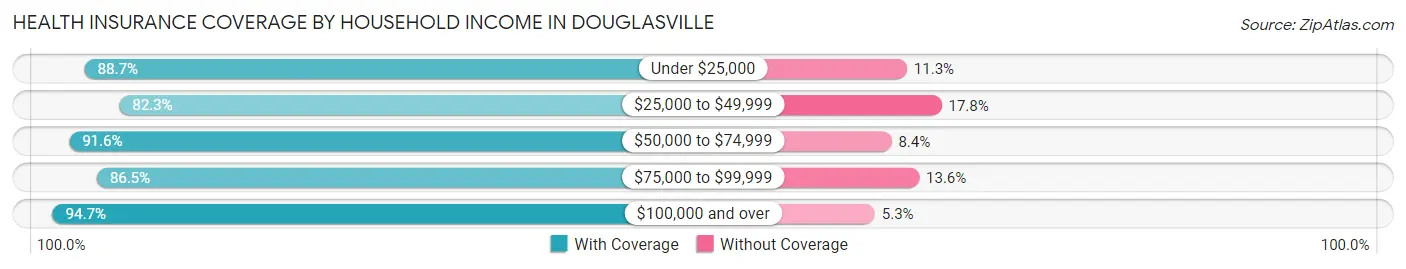
| Household Income | With Coverage | Without Coverage |
| Under $25,000 | 4,112 (88.7%) | 522 (11.3%) |
| $25,000 to $49,999 | 3,735 (82.3%) | 806 (17.7%) |
| $50,000 to $74,999 | 5,517 (91.6%) | 504 (8.4%) |
| $75,000 to $99,999 | 4,474 (86.5%) | 701 (13.6%) |
| $100,000 and over | 13,063 (94.7%) | 725 (5.3%) |
Public vs Private Health Insurance Coverage by Age in Douglasville
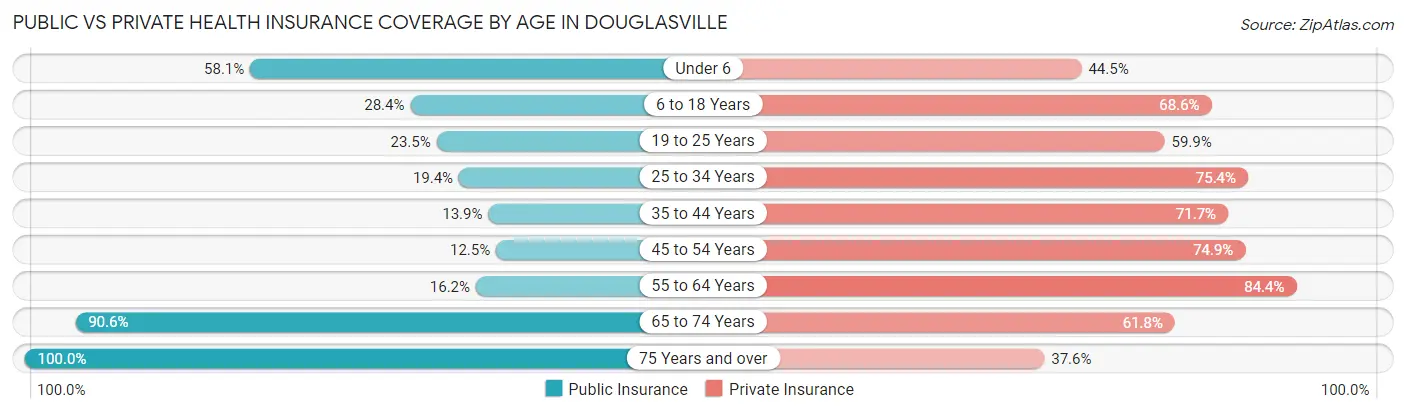
| Age Bracket | Public Insurance | Private Insurance |
| Under 6 | 1,657 (58.1%) | 1,268 (44.5%) |
| 6 to 18 Years | 1,870 (28.4%) | 4,516 (68.6%) |
| 19 to 25 Years | 483 (23.5%) | 1,230 (59.9%) |
| 25 to 34 Years | 907 (19.4%) | 3,527 (75.4%) |
| 35 to 44 Years | 829 (13.9%) | 4,266 (71.7%) |
| 45 to 54 Years | 534 (12.5%) | 3,200 (74.9%) |
| 55 to 64 Years | 596 (16.2%) | 3,095 (84.4%) |
| 65 to 74 Years | 2,419 (90.6%) | 1,650 (61.8%) |
| 75 Years and over | 1,514 (100.0%) | 569 (37.6%) |
| Total | 10,809 (31.6%) | 23,321 (68.1%) |
Disability Status by Sex by Age in Douglasville
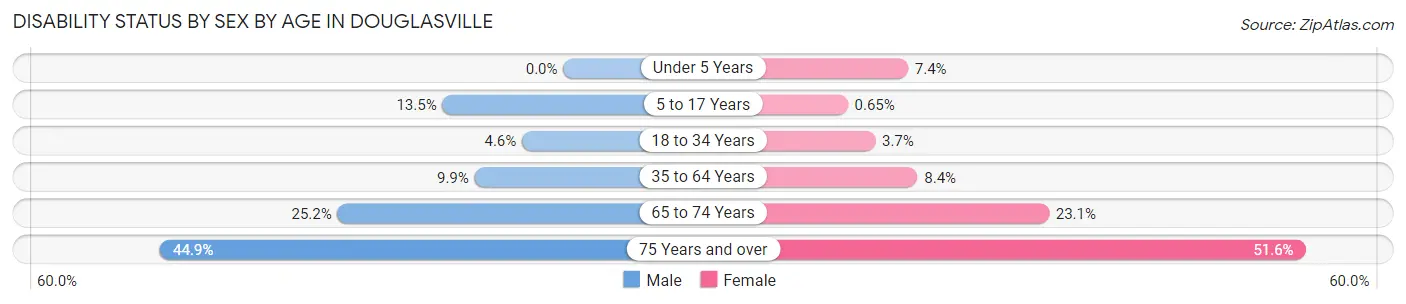
| Age Bracket | Male | Female |
| Under 5 Years | 0 (0.0%) | 100 (7.4%) |
| 5 to 17 Years | 494 (13.5%) | 19 (0.6%) |
| 18 to 34 Years | 160 (4.6%) | 142 (3.7%) |
| 35 to 64 Years | 596 (9.9%) | 661 (8.4%) |
| 65 to 74 Years | 294 (25.2%) | 346 (23.1%) |
| 75 Years and over | 238 (44.9%) | 508 (51.6%) |
Disability Class by Sex by Age in Douglasville
Disability Class: Hearing Difficulty
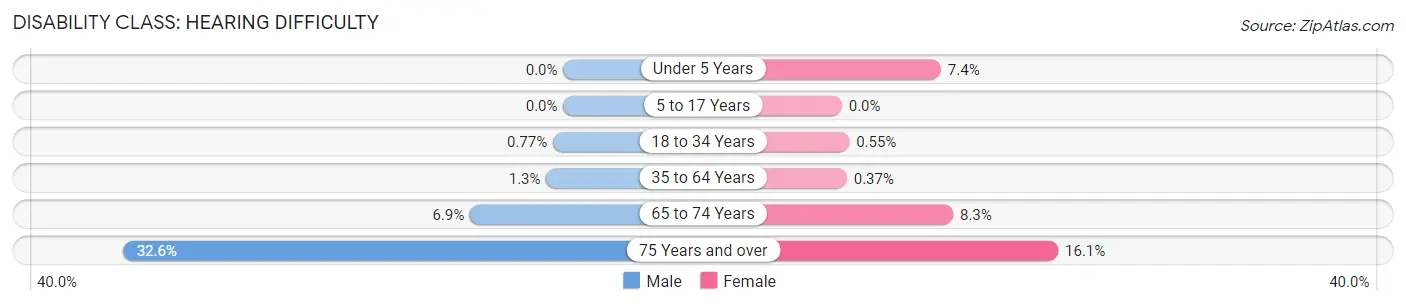
| Age Bracket | Male | Female |
| Under 5 Years | 0 (0.0%) | 100 (7.4%) |
| 5 to 17 Years | 0 (0.0%) | 0 (0.0%) |
| 18 to 34 Years | 27 (0.8%) | 21 (0.5%) |
| 35 to 64 Years | 76 (1.3%) | 29 (0.4%) |
| 65 to 74 Years | 81 (6.9%) | 124 (8.3%) |
| 75 Years and over | 173 (32.6%) | 158 (16.1%) |
Disability Class: Vision Difficulty
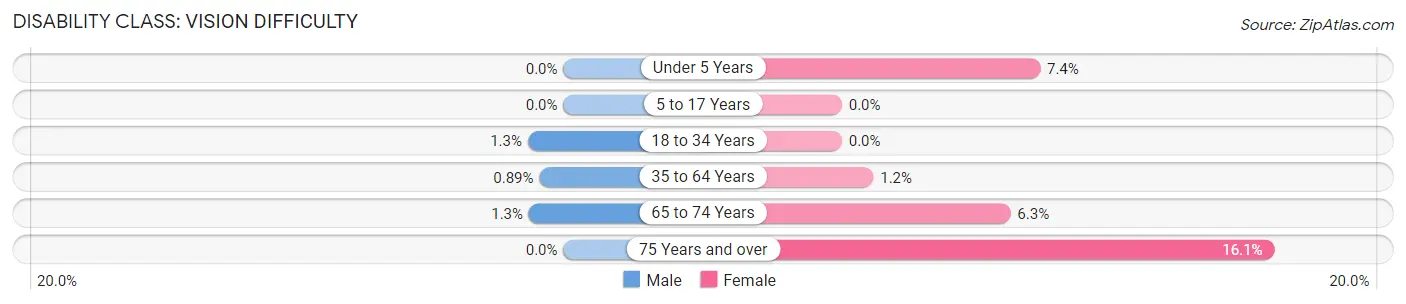
| Age Bracket | Male | Female |
| Under 5 Years | 0 (0.0%) | 100 (7.4%) |
| 5 to 17 Years | 0 (0.0%) | 0 (0.0%) |
| 18 to 34 Years | 46 (1.3%) | 0 (0.0%) |
| 35 to 64 Years | 54 (0.9%) | 92 (1.2%) |
| 65 to 74 Years | 15 (1.3%) | 94 (6.3%) |
| 75 Years and over | 0 (0.0%) | 158 (16.1%) |
Disability Class: Cognitive Difficulty
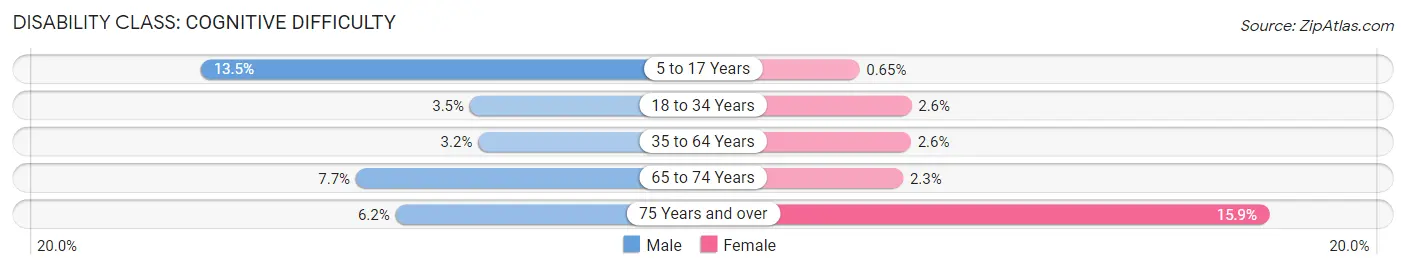
| Age Bracket | Male | Female |
| 5 to 17 Years | 494 (13.5%) | 19 (0.6%) |
| 18 to 34 Years | 121 (3.5%) | 99 (2.6%) |
| 35 to 64 Years | 191 (3.2%) | 201 (2.6%) |
| 65 to 74 Years | 90 (7.7%) | 34 (2.3%) |
| 75 Years and over | 33 (6.2%) | 156 (15.9%) |
Disability Class: Ambulatory Difficulty
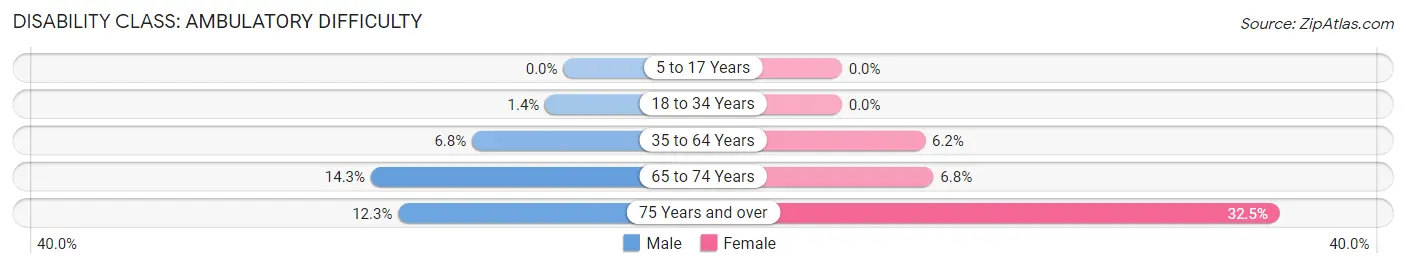
| Age Bracket | Male | Female |
| 5 to 17 Years | 0 (0.0%) | 0 (0.0%) |
| 18 to 34 Years | 47 (1.3%) | 0 (0.0%) |
| 35 to 64 Years | 409 (6.8%) | 486 (6.2%) |
| 65 to 74 Years | 167 (14.3%) | 102 (6.8%) |
| 75 Years and over | 65 (12.3%) | 320 (32.5%) |
Disability Class: Self-Care Difficulty

| Age Bracket | Male | Female |
| 5 to 17 Years | 0 (0.0%) | 0 (0.0%) |
| 18 to 34 Years | 27 (0.8%) | 0 (0.0%) |
| 35 to 64 Years | 196 (3.3%) | 163 (2.1%) |
| 65 to 74 Years | 0 (0.0%) | 38 (2.5%) |
| 75 Years and over | 58 (10.9%) | 116 (11.8%) |
Technology Access in Douglasville
Computing Device Access in Douglasville
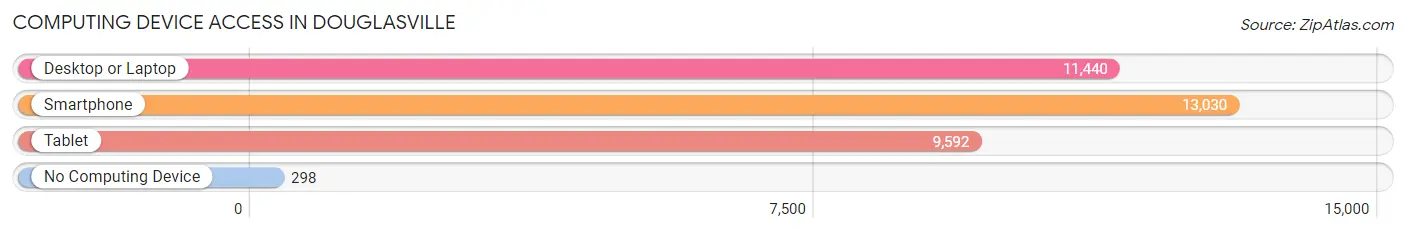
| Device Type | # Households | % Households |
| Desktop or Laptop | 11,440 | 83.0% |
| Smartphone | 13,030 | 94.5% |
| Tablet | 9,592 | 69.6% |
| No Computing Device | 298 | 2.2% |
| Total | 13,792 | 100.0% |
Internet Access in Douglasville
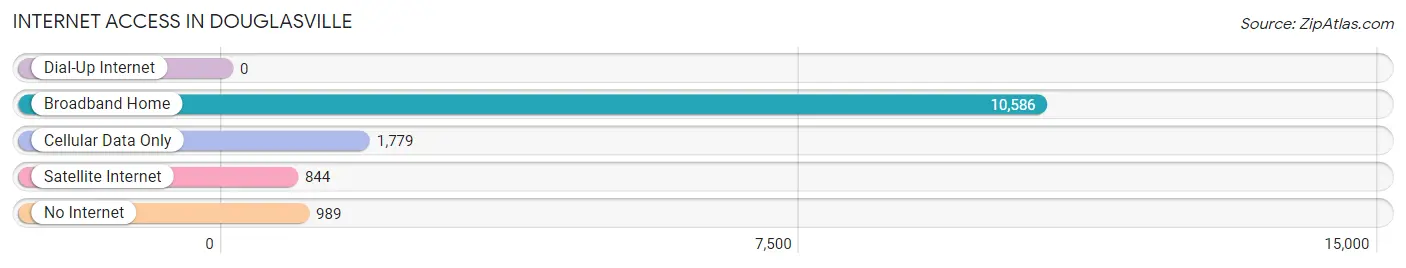
| Internet Type | # Households | % Households |
| Dial-Up Internet | 0 | 0.0% |
| Broadband Home | 10,586 | 76.7% |
| Cellular Data Only | 1,779 | 12.9% |
| Satellite Internet | 844 | 6.1% |
| No Internet | 989 | 7.2% |
| Total | 13,792 | 100.0% |
Douglasville Summary
Douglasville is a city in Douglas County, Georgia, United States. It is located approximately 20 miles west of Atlanta and is part of the Atlanta metropolitan area. As of the 2010 census, the city had a population of 30,961, up from 20,065 in 2000.
History
The area that is now Douglasville was first inhabited by the Cherokee Indians. The city was founded in 1875 by an act of the Georgia General Assembly and was named for Senator James Douglas. The city was incorporated in 1887.
In the late 19th century, Douglasville was a small agricultural town, with cotton and corn being the main crops. The town was also known for its mineral springs, which were believed to have healing properties.
In the early 20th century, the town began to grow as the Atlanta and West Point Railroad was built through the area. The railroad brought new industry and jobs to the area, and the population began to grow.
Geography
Douglasville is located in western Georgia, approximately 20 miles west of Atlanta. It is situated in the foothills of the Appalachian Mountains. The city is located in Douglas County, which is bordered by Carroll, Paulding, Cobb, and Fulton counties.
The city has a total area of 24.2 square miles, of which 24.1 square miles is land and 0.1 square miles is water. The city is located at an elevation of 890 feet above sea level.
Economy
Douglasville has a diverse economy, with a mix of manufacturing, retail, and service industries. The city is home to several large employers, including WellStar Douglas Hospital, Douglas County Schools, and the Douglas County government.
The city is also home to several large retail centers, including Arbor Place Mall, The Avenue West Cobb, and The Shoppes at Arbor Place.
Demographics
As of the 2010 census, the city had a population of 30,961, up from 20,065 in 2000. The racial makeup of the city was 63.2% White, 28.3% African American, 0.4% Native American, 2.2% Asian, 0.1% Pacific Islander, 3.7% from other races, and 2.2% from two or more races. Hispanic or Latino of any race were 8.2% of the population.
The median income for a household in the city was $45,945, and the median income for a family was $54,945. The per capita income for the city was $22,945. About 11.2% of families and 14.2% of the population were below the poverty line, including 19.2% of those under age 18 and 8.2% of those age 65 or over.
Common Questions
What is the Total Population of Douglasville?
Total Population of Douglasville is 35,252.
What is the Total Male Population of Douglasville?
Total Male Population of Douglasville is 16,613.
What is the Total Female Population of Douglasville?
Total Female Population of Douglasville is 18,639.
What is the Ratio of Males per 100 Females in Douglasville?
There are 89.13 Males per 100 Females in Douglasville.
What is the Ratio of Females per 100 Males in Douglasville?
There are 112.20 Females per 100 Males in Douglasville.
What is the Median Population Age in Douglasville?
Median Population Age in Douglasville is 36.5 Years.
What is the Average Family Size in Douglasville
Average Family Size in Douglasville is 3.1 People.
What is the Average Household Size in Douglasville
Average Household Size in Douglasville is 2.5 People.
What is Per Capita Income in Douglasville?
Per Capita income in Douglasville is $36,077.
What is the Median Family Income in Douglasville?
Median Family Income in Douglasville is $81,165.
What is the Median Household income in Douglasville?
Median Household Income in Douglasville is $72,753.
What is Income or Wage Gap in Douglasville?
Income or Wage Gap in Douglasville is 2.1%.
Women in Douglasville earn 97.9 cents for every dollar earned by a man.
What is Inequality or Gini Index in Douglasville?
Inequality or Gini Index in Douglasville is 0.43.
How Large is the Labor Force in Douglasville?
There are 19,129 People in the Labor Forcein in Douglasville.
What is the Percentage of People in the Labor Force in Douglasville?
70.4% of People are in the Labor Force in Douglasville.
What is the Unemployment Rate in Douglasville?
Unemployment Rate in Douglasville is 5.5%.