Griffin, GA
Griffin Map
Griffin Overview
23,485
TOTAL POPULATION
11,356
MALE POPULATION
12,129
FEMALE POPULATION
93.63
MALES / 100 FEMALES
106.81
FEMALES / 100 MALES
33.2
MEDIAN AGE
3.0
AVG FAMILY SIZE
2.4
AVG HOUSEHOLD SIZE
$26,016
PER CAPITA INCOME
$62,790
AVG FAMILY INCOME
$42,047
AVG HOUSEHOLD INCOME
22.5%
WAGE / INCOME GAP [ % ]
77.5¢/ $1
WAGE / INCOME GAP [ $ ]
$13,311
FAMILY INCOME DEFICIT
0.51
INEQUALITY / GINI INDEX
10,746
LABOR FORCE [ PEOPLE ]
59.3%
PERCENT IN LABOR FORCE
5.5%
UNEMPLOYMENT RATE
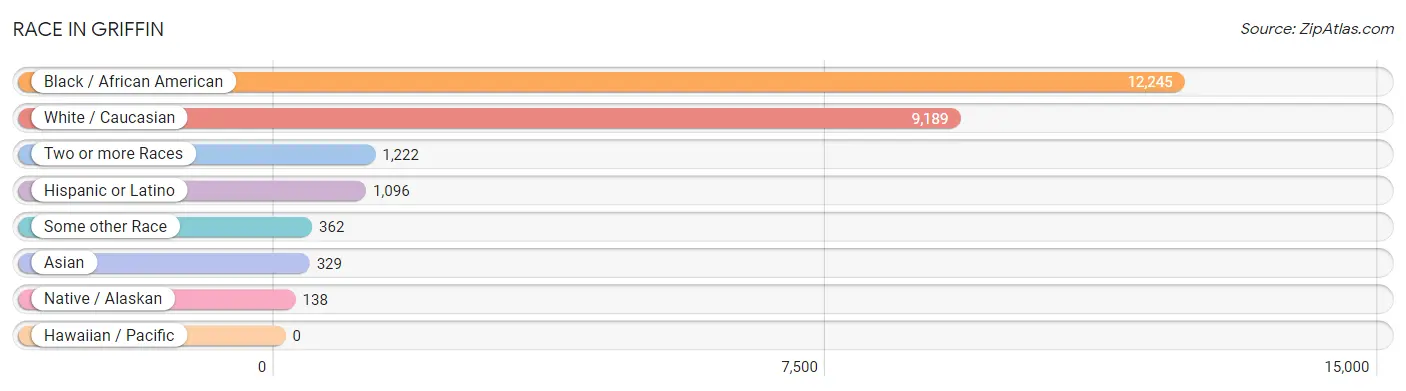
Race in Griffin
The most populous races in Griffin are Black / African American (12,245 | 52.1%), White / Caucasian (9,189 | 39.1%), and Two or more Races (1,222 | 5.2%).
| Race | # Population | % Population |
| Asian | 329 | 1.4% |
| Black / African American | 12,245 | 52.1% |
| Hawaiian / Pacific | 0 | 0.0% |
| Hispanic or Latino | 1,096 | 4.7% |
| Native / Alaskan | 138 | 0.6% |
| White / Caucasian | 9,189 | 39.1% |
| Two or more Races | 1,222 | 5.2% |
| Some other Race | 362 | 1.5% |
| Total | 23,485 | 100.0% |
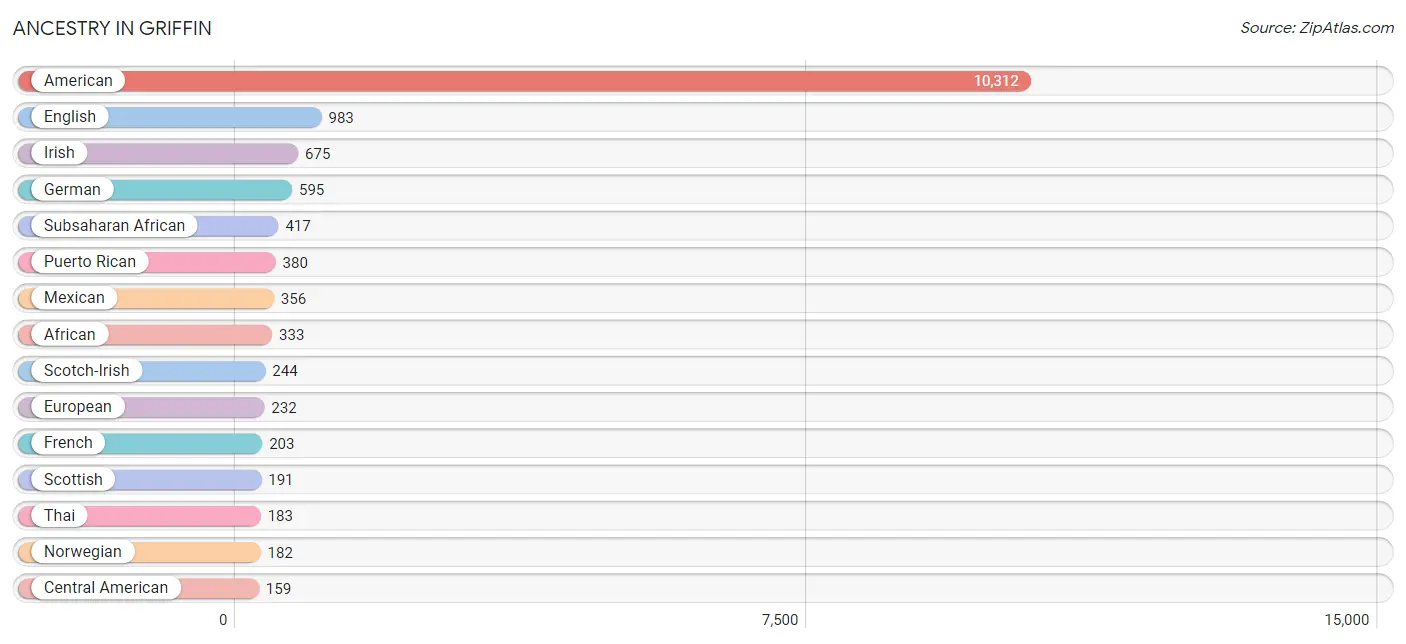
Ancestry in Griffin
The most populous ancestries reported in Griffin are American (10,312 | 43.9%), English (983 | 4.2%), Irish (675 | 2.9%), German (595 | 2.5%), and Subsaharan African (417 | 1.8%), together accounting for 55.3% of all Griffin residents.
| Ancestry | # Population | % Population |
| African | 333 | 1.4% |
| American | 10,312 | 43.9% |
| Arab | 33 | 0.1% |
| Bhutanese | 15 | 0.1% |
| British | 93 | 0.4% |
| Burmese | 52 | 0.2% |
| Canadian | 9 | 0.0% |
| Celtic | 65 | 0.3% |
| Central American | 159 | 0.7% |
| Cuban | 4 | 0.0% |
| Czech | 5 | 0.0% |
| Dutch | 29 | 0.1% |
| Eastern European | 13 | 0.1% |
| Ecuadorian | 60 | 0.3% |
| English | 983 | 4.2% |
| European | 232 | 1.0% |
| French | 203 | 0.9% |
| German | 595 | 2.5% |
| Guatemalan | 16 | 0.1% |
| Honduran | 143 | 0.6% |
| Irish | 675 | 2.9% |
| Italian | 100 | 0.4% |
| Jamaican | 19 | 0.1% |
| Japanese | 16 | 0.1% |
| Korean | 77 | 0.3% |
| Lebanese | 33 | 0.1% |
| Mexican | 356 | 1.5% |
| Northern European | 28 | 0.1% |
| Norwegian | 182 | 0.8% |
| Pakistani | 1 | 0.0% |
| Polish | 44 | 0.2% |
| Puerto Rican | 380 | 1.6% |
| Russian | 118 | 0.5% |
| Scandinavian | 40 | 0.2% |
| Scotch-Irish | 244 | 1.0% |
| Scottish | 191 | 0.8% |
| South African | 84 | 0.4% |
| South American | 60 | 0.3% |
| Spaniard | 80 | 0.3% |
| Subsaharan African | 417 | 1.8% |
| Swedish | 21 | 0.1% |
| Swiss | 23 | 0.1% |
| Syrian | 16 | 0.1% |
| Thai | 183 | 0.8% |
| Trinidadian and Tobagonian | 127 | 0.5% |
| Turkish | 20 | 0.1% |
| Ukrainian | 130 | 0.5% |
| Welsh | 10 | 0.0% |
| West Indian | 20 | 0.1% | View All 49 Rows |
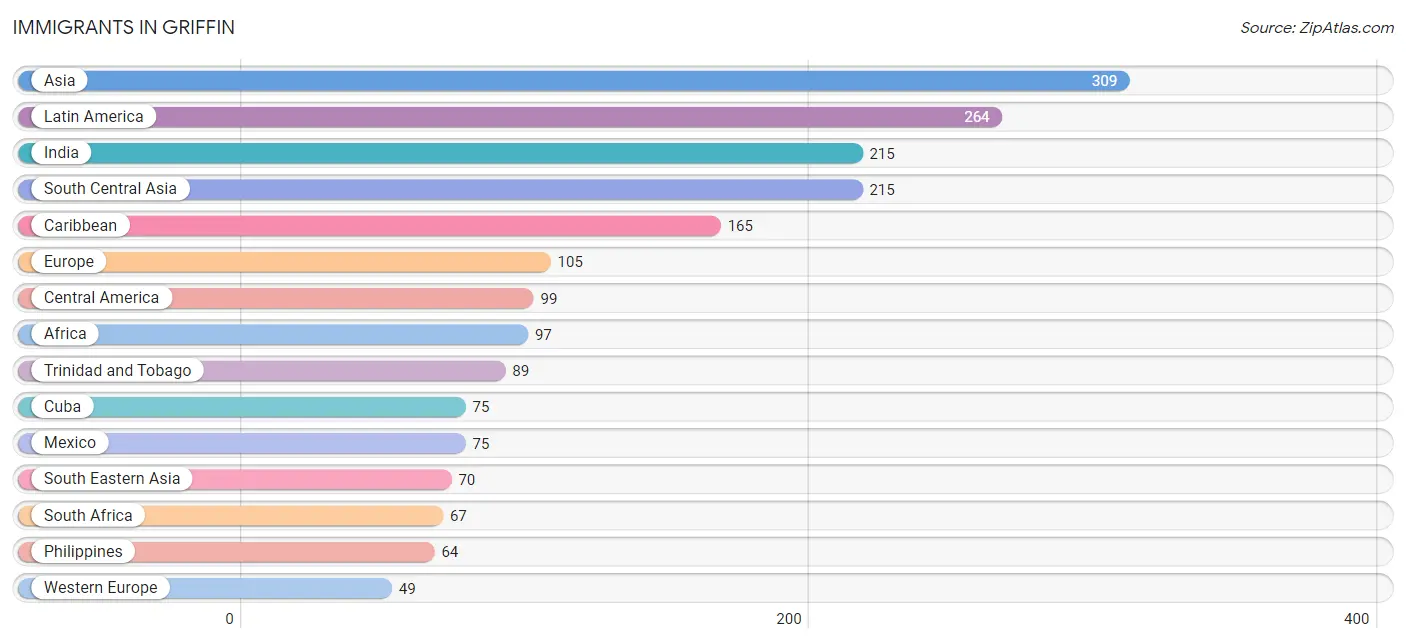
Immigrants in Griffin
The most numerous immigrant groups reported in Griffin came from Asia (309 | 1.3%), Latin America (264 | 1.1%), India (215 | 0.9%), South Central Asia (215 | 0.9%), and Caribbean (165 | 0.7%), together accounting for 5.0% of all Griffin residents.
| Immigration Origin | # Population | % Population |
| Africa | 97 | 0.4% |
| Asia | 309 | 1.3% |
| Cambodia | 5 | 0.0% |
| Caribbean | 165 | 0.7% |
| Central America | 99 | 0.4% |
| Cuba | 75 | 0.3% |
| Eastern Asia | 24 | 0.1% |
| Eastern Europe | 38 | 0.2% |
| England | 18 | 0.1% |
| Europe | 105 | 0.4% |
| Germany | 23 | 0.1% |
| Honduras | 24 | 0.1% |
| India | 215 | 0.9% |
| Jamaica | 1 | 0.0% |
| Korea | 24 | 0.1% |
| Latin America | 264 | 1.1% |
| Mexico | 75 | 0.3% |
| Netherlands | 26 | 0.1% |
| Northern Europe | 18 | 0.1% |
| Philippines | 64 | 0.3% |
| South Africa | 67 | 0.3% |
| South Central Asia | 215 | 0.9% |
| South Eastern Asia | 70 | 0.3% |
| Thailand | 1 | 0.0% |
| Trinidad and Tobago | 89 | 0.4% |
| Western Europe | 49 | 0.2% | View All 26 Rows |
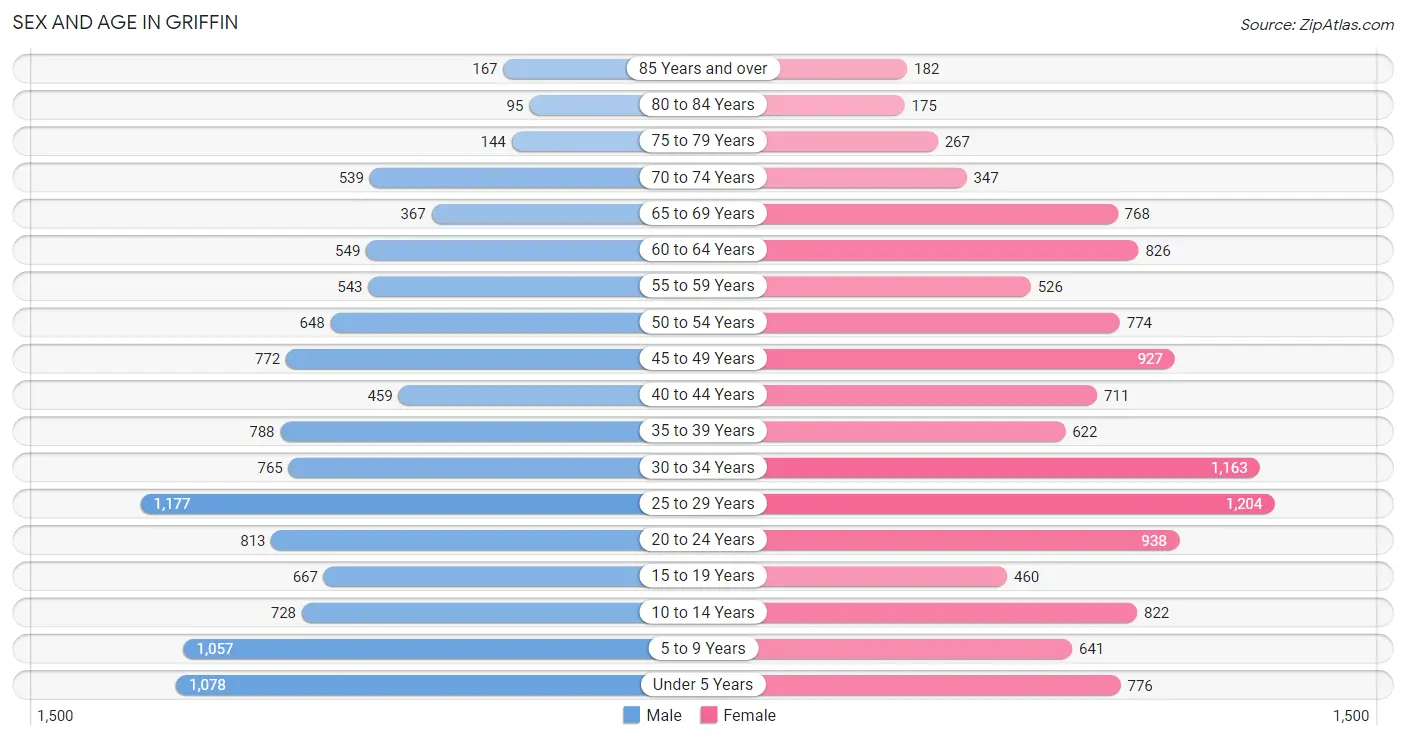
Sex and Age in Griffin
Sex and Age in Griffin
The most populous age groups in Griffin are 25 to 29 Years (1,177 | 10.4%) for men and 25 to 29 Years (1,204 | 9.9%) for women.
| Age Bracket | Male | Female |
| Under 5 Years | 1,078 (9.5%) | 776 (6.4%) |
| 5 to 9 Years | 1,057 (9.3%) | 641 (5.3%) |
| 10 to 14 Years | 728 (6.4%) | 822 (6.8%) |
| 15 to 19 Years | 667 (5.9%) | 460 (3.8%) |
| 20 to 24 Years | 813 (7.2%) | 938 (7.7%) |
| 25 to 29 Years | 1,177 (10.4%) | 1,204 (9.9%) |
| 30 to 34 Years | 765 (6.7%) | 1,163 (9.6%) |
| 35 to 39 Years | 788 (6.9%) | 622 (5.1%) |
| 40 to 44 Years | 459 (4.0%) | 711 (5.9%) |
| 45 to 49 Years | 772 (6.8%) | 927 (7.6%) |
| 50 to 54 Years | 648 (5.7%) | 774 (6.4%) |
| 55 to 59 Years | 543 (4.8%) | 526 (4.3%) |
| 60 to 64 Years | 549 (4.8%) | 826 (6.8%) |
| 65 to 69 Years | 367 (3.2%) | 768 (6.3%) |
| 70 to 74 Years | 539 (4.8%) | 347 (2.9%) |
| 75 to 79 Years | 144 (1.3%) | 267 (2.2%) |
| 80 to 84 Years | 95 (0.8%) | 175 (1.4%) |
| 85 Years and over | 167 (1.5%) | 182 (1.5%) |
| Total | 11,356 (100.0%) | 12,129 (100.0%) |
Families and Households in Griffin
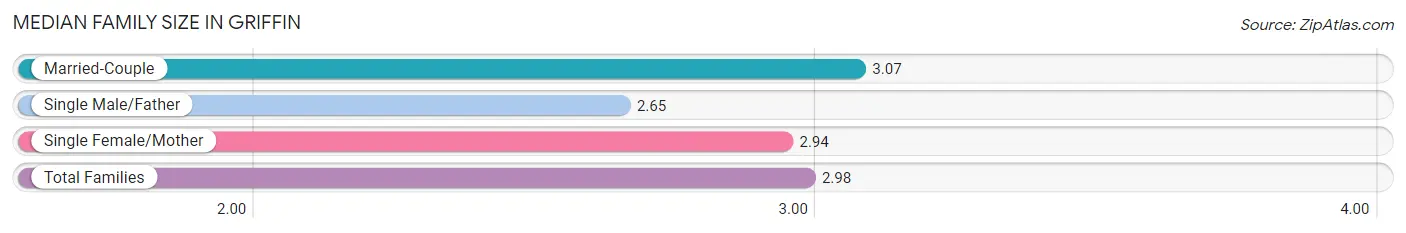
Median Family Size in Griffin
The median family size in Griffin is 2.98 persons per family, with married-couple families (2,974 | 48.9%) accounting for the largest median family size of 3.07 persons per family. On the other hand, single male/father families (615 | 10.1%) represent the smallest median family size with 2.65 persons per family.
| Family Type | # Families | Family Size |
| Married-Couple | 2,974 (48.9%) | 3.07 |
| Single Male/Father | 615 (10.1%) | 2.65 |
| Single Female/Mother | 2,496 (41.0%) | 2.94 |
| Total Families | 6,085 (100.0%) | 2.98 |
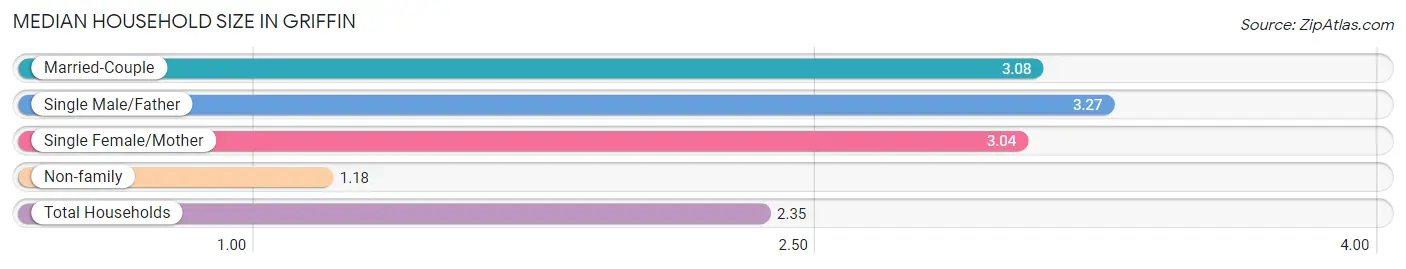
Median Household Size in Griffin
The median household size in Griffin is 2.35 persons per household, with single male/father households (615 | 6.2%) accounting for the largest median household size of 3.27 persons per household. non-family households (3,783 | 38.3%) represent the smallest median household size with 1.18 persons per household.
| Household Type | # Households | Household Size |
| Married-Couple | 2,974 (30.1%) | 3.08 |
| Single Male/Father | 615 (6.2%) | 3.27 |
| Single Female/Mother | 2,496 (25.3%) | 3.04 |
| Non-family | 3,783 (38.3%) | 1.18 |
| Total Households | 9,868 (100.0%) | 2.35 |
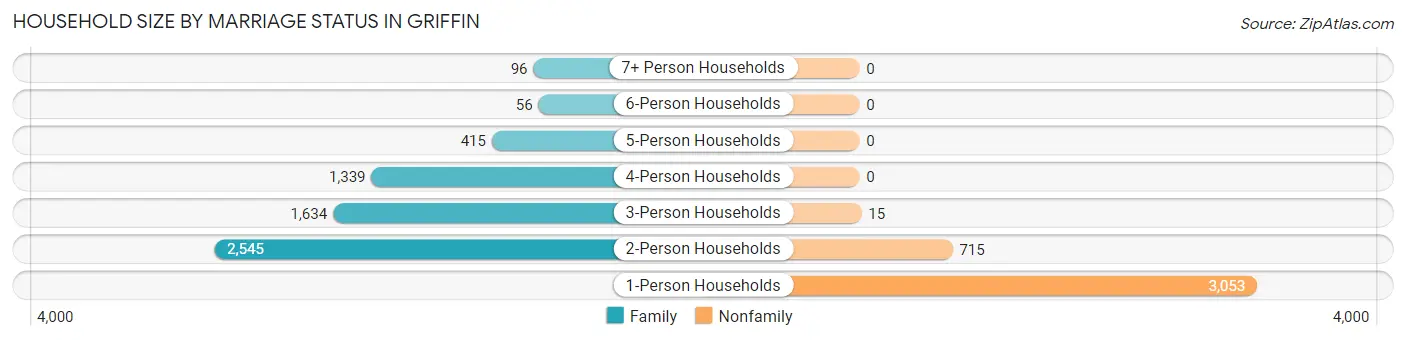
Household Size by Marriage Status in Griffin
Out of a total of 9,868 households in Griffin, 6,085 (61.7%) are family households, while 3,783 (38.3%) are nonfamily households. The most numerous type of family households are 2-person households, comprising 2,545, and the most common type of nonfamily households are 1-person households, comprising 3,053.
| Household Size | Family Households | Nonfamily Households |
| 1-Person Households | - | 3,053 (30.9%) |
| 2-Person Households | 2,545 (25.8%) | 715 (7.2%) |
| 3-Person Households | 1,634 (16.6%) | 15 (0.2%) |
| 4-Person Households | 1,339 (13.6%) | 0 (0.0%) |
| 5-Person Households | 415 (4.2%) | 0 (0.0%) |
| 6-Person Households | 56 (0.6%) | 0 (0.0%) |
| 7+ Person Households | 96 (1.0%) | 0 (0.0%) |
| Total | 6,085 (61.7%) | 3,783 (38.3%) |
Female Fertility in Griffin
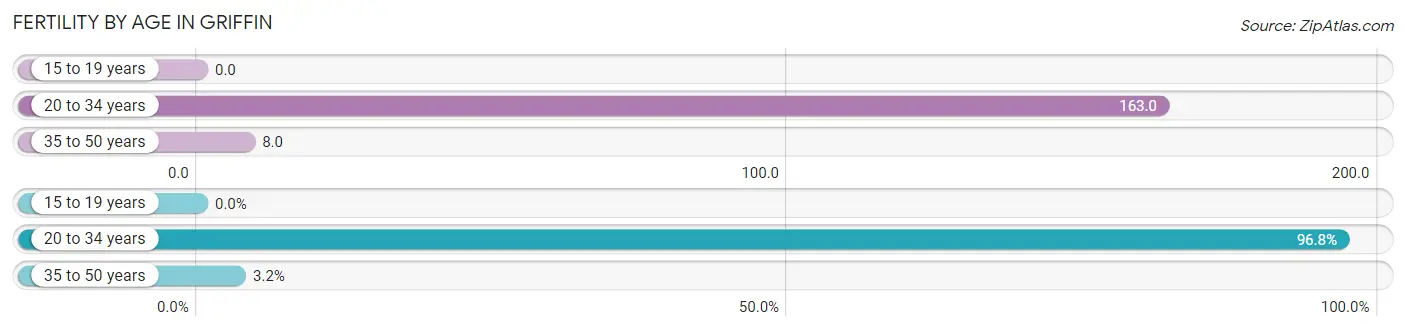
Fertility by Age in Griffin
Average fertility rate in Griffin is 91.0 births per 1,000 women. Women in the age bracket of 20 to 34 years have the highest fertility rate with 163.0 births per 1,000 women. Women in the age bracket of 20 to 34 years acount for 96.8% of all women with births.
| Age Bracket | Women with Births | Births / 1,000 Women |
| 15 to 19 years | 0 (0.0%) | 0.0 |
| 20 to 34 years | 540 (96.8%) | 163.0 |
| 35 to 50 years | 18 (3.2%) | 8.0 |
| Total | 558 (100.0%) | 91.0 |
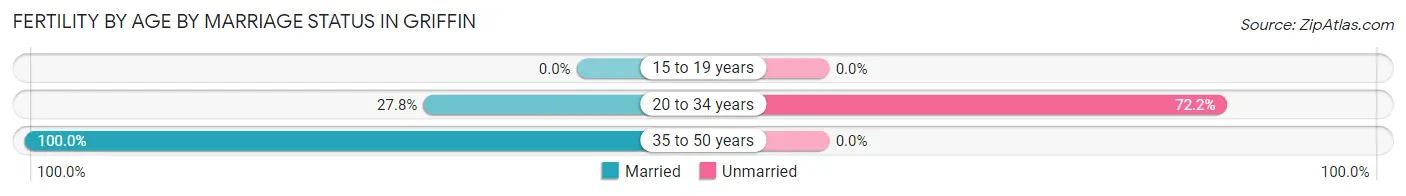
Fertility by Age by Marriage Status in Griffin
30.1% of women with births (558) in Griffin are married. The highest percentage of unmarried women with births falls into 20 to 34 years age bracket with 72.2% of them unmarried at the time of birth, while the lowest percentage of unmarried women with births belong to 35 to 50 years age bracket with 0.0% of them unmarried.
| Age Bracket | Married | Unmarried |
| 15 to 19 years | 0 (0.0%) | 0 (0.0%) |
| 20 to 34 years | 150 (27.8%) | 390 (72.2%) |
| 35 to 50 years | 18 (100.0%) | 0 (0.0%) |
| Total | 168 (30.1%) | 390 (69.9%) |
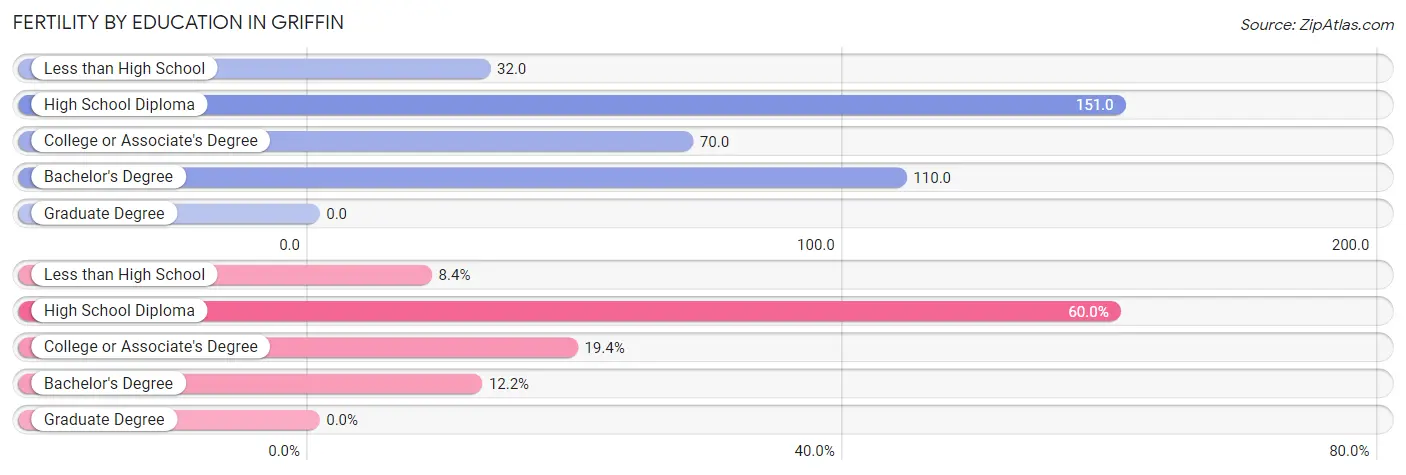
Fertility by Education in Griffin
| Educational Attainment | Women with Births | Births / 1,000 Women |
| Less than High School | 47 (8.4%) | 32.0 |
| High School Diploma | 335 (60.0%) | 151.0 |
| College or Associate's Degree | 108 (19.4%) | 70.0 |
| Bachelor's Degree | 68 (12.2%) | 110.0 |
| Graduate Degree | 0 (0.0%) | 0.0 |
| Total | 558 (100.0%) | 91.0 |
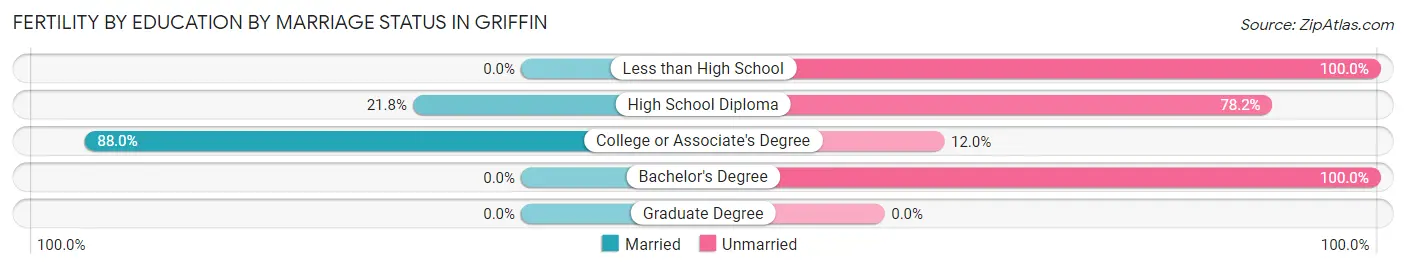
Fertility by Education by Marriage Status in Griffin
69.9% of women with births in Griffin are unmarried. Women with the educational attainment of college or associate's degree are most likely to be married with 88.0% of them married at childbirth, while women with the educational attainment of less than high school are least likely to be married with 100.0% of them unmarried at childbirth.
| Educational Attainment | Married | Unmarried |
| Less than High School | 0 (0.0%) | 47 (100.0%) |
| High School Diploma | 73 (21.8%) | 262 (78.2%) |
| College or Associate's Degree | 95 (88.0%) | 13 (12.0%) |
| Bachelor's Degree | 0 (0.0%) | 68 (100.0%) |
| Graduate Degree | 0 (0.0%) | 0 (0.0%) |
| Total | 168 (30.1%) | 390 (69.9%) |
Income in Griffin
Income Overview in Griffin
Per Capita Income in Griffin is $26,016, while median incomes of families and households are $62,790 and $42,047 respectively.
| Characteristic | Number | Measure |
| Per Capita Income | 23,485 | $26,016 |
| Median Family Income | 6,085 | $62,790 |
| Mean Family Income | 6,085 | $75,315 |
| Median Household Income | 9,868 | $42,047 |
| Mean Household Income | 9,868 | $62,848 |
| Income Deficit | 6,085 | $13,311 |
| Wage / Income Gap (%) | 23,485 | 22.50% |
| Wage / Income Gap ($) | 23,485 | 77.50¢ per $1 |
| Gini / Inequality Index | 23,485 | 0.51 |
Earnings by Sex in Griffin
Average Earnings in Griffin are $35,031, $39,796 for men and $30,841 for women, a difference of 22.5%.
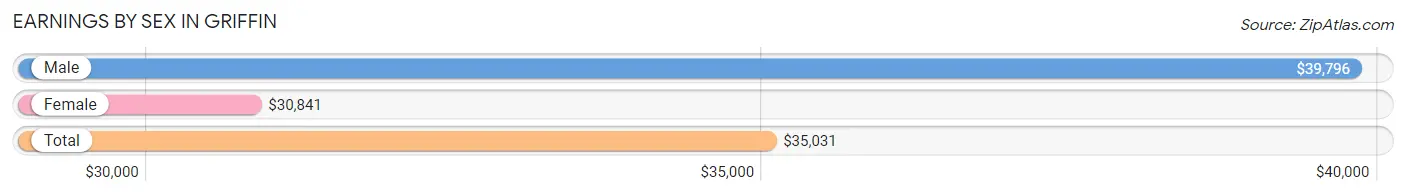
| Sex | Number | Average Earnings |
| Male | 5,498 (51.7%) | $39,796 |
| Female | 5,143 (48.3%) | $30,841 |
| Total | 10,641 (100.0%) | $35,031 |
Earnings by Sex by Income Bracket in Griffin
The most common earnings brackets in Griffin are $100,000+ for men (600 | 10.9%) and $35,000 to $39,999 for women (507 | 9.9%).
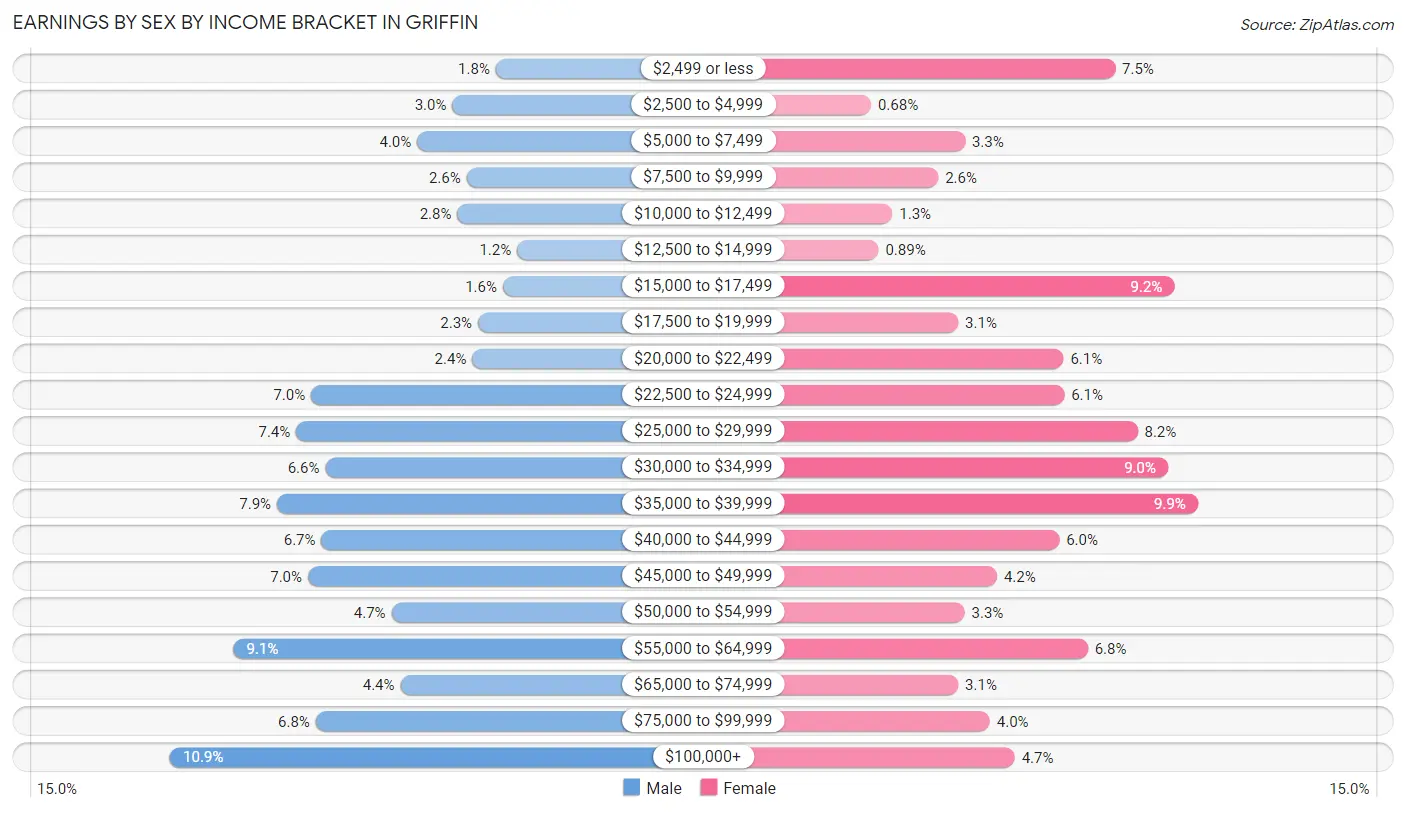
| Income | Male | Female |
| $2,499 or less | 97 (1.8%) | 388 (7.5%) |
| $2,500 to $4,999 | 164 (3.0%) | 35 (0.7%) |
| $5,000 to $7,499 | 218 (4.0%) | 171 (3.3%) |
| $7,500 to $9,999 | 142 (2.6%) | 132 (2.6%) |
| $10,000 to $12,499 | 156 (2.8%) | 66 (1.3%) |
| $12,500 to $14,999 | 64 (1.2%) | 46 (0.9%) |
| $15,000 to $17,499 | 86 (1.6%) | 473 (9.2%) |
| $17,500 to $19,999 | 124 (2.3%) | 161 (3.1%) |
| $20,000 to $22,499 | 133 (2.4%) | 313 (6.1%) |
| $22,500 to $24,999 | 382 (7.0%) | 314 (6.1%) |
| $25,000 to $29,999 | 405 (7.4%) | 420 (8.2%) |
| $30,000 to $34,999 | 360 (6.6%) | 464 (9.0%) |
| $35,000 to $39,999 | 435 (7.9%) | 507 (9.9%) |
| $40,000 to $44,999 | 366 (6.7%) | 307 (6.0%) |
| $45,000 to $49,999 | 387 (7.0%) | 217 (4.2%) |
| $50,000 to $54,999 | 258 (4.7%) | 170 (3.3%) |
| $55,000 to $64,999 | 502 (9.1%) | 348 (6.8%) |
| $65,000 to $74,999 | 244 (4.4%) | 161 (3.1%) |
| $75,000 to $99,999 | 375 (6.8%) | 207 (4.0%) |
| $100,000+ | 600 (10.9%) | 243 (4.7%) |
| Total | 5,498 (100.0%) | 5,143 (100.0%) |
Earnings by Sex by Educational Attainment in Griffin
Average earnings in Griffin are $45,000 for men and $32,872 for women, a difference of 27.0%. Men with an educational attainment of graduate degree enjoy the highest average annual earnings of $140,938, while those with high school diploma education earn the least with $35,922. Women with an educational attainment of graduate degree earn the most with the average annual earnings of $77,981, while those with less than high school education have the smallest earnings of $21,371.
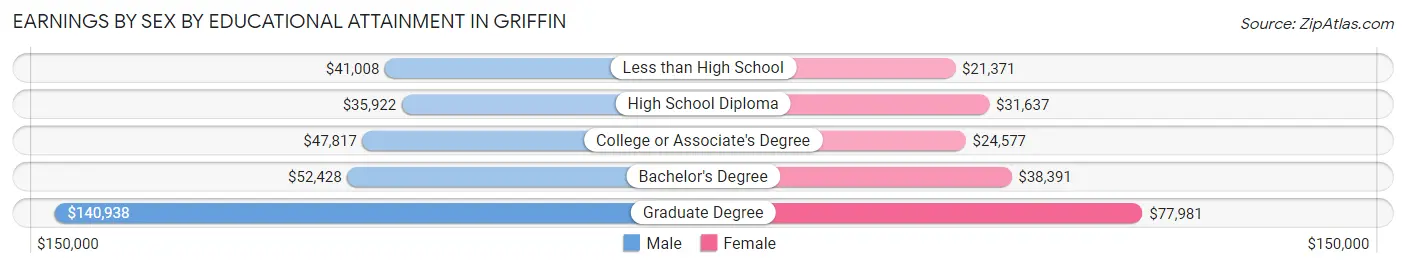
| Educational Attainment | Male Income | Female Income |
| Less than High School | $41,008 | $21,371 |
| High School Diploma | $35,922 | $31,637 |
| College or Associate's Degree | $47,817 | $24,577 |
| Bachelor's Degree | $52,428 | $38,391 |
| Graduate Degree | $140,938 | $77,981 |
| Total | $45,000 | $32,872 |
Family Income in Griffin
Family Income Brackets in Griffin
According to the Griffin family income data, there are 1,345 families falling into the $50,000 to $74,999 income range, which is the most common income bracket and makes up 22.1% of all families. Conversely, the $150,000 to $199,999 income bracket is the least frequent group with only 176 families (2.9%) belonging to this category.
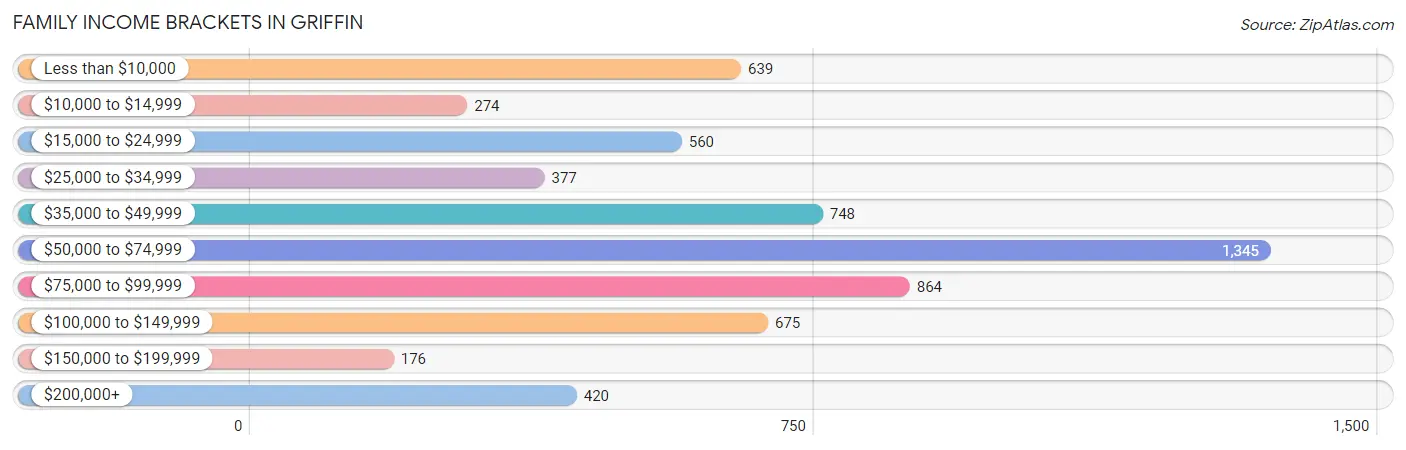
| Income Bracket | # Families | % Families |
| Less than $10,000 | 639 | 10.5% |
| $10,000 to $14,999 | 274 | 4.5% |
| $15,000 to $24,999 | 560 | 9.2% |
| $25,000 to $34,999 | 377 | 6.2% |
| $35,000 to $49,999 | 748 | 12.3% |
| $50,000 to $74,999 | 1,345 | 22.1% |
| $75,000 to $99,999 | 864 | 14.2% |
| $100,000 to $149,999 | 675 | 11.1% |
| $150,000 to $199,999 | 176 | 2.9% |
| $200,000+ | 420 | 6.9% |
Family Income by Famaliy Size in Griffin
5-person families (364 | 6.0%) account for the highest median family income in Griffin with $71,883 per family, while 2-person families (2,806 | 46.1%) have the highest median income of $31,613 per family member.
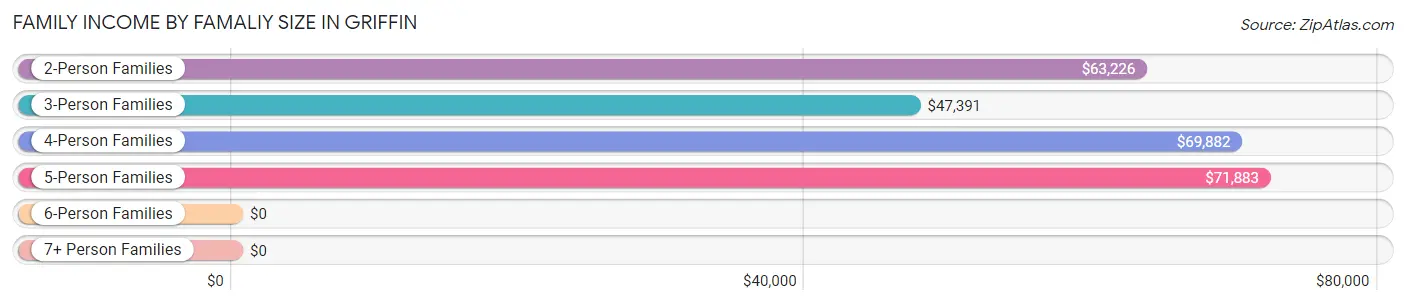
| Income Bracket | # Families | Median Income |
| 2-Person Families | 2,806 (46.1%) | $63,226 |
| 3-Person Families | 1,622 (26.7%) | $47,391 |
| 4-Person Families | 1,159 (19.1%) | $69,882 |
| 5-Person Families | 364 (6.0%) | $71,883 |
| 6-Person Families | 65 (1.1%) | $0 |
| 7+ Person Families | 69 (1.1%) | $0 |
| Total | 6,085 (100.0%) | $62,790 |
Family Income by Number of Earners in Griffin
The median family income in Griffin is $62,790, with families comprising 3+ earners (521) having the highest median family income of $106,018, while families with no earners (1,231) have the lowest median family income of $13,890, accounting for 8.6% and 20.2% of families, respectively.
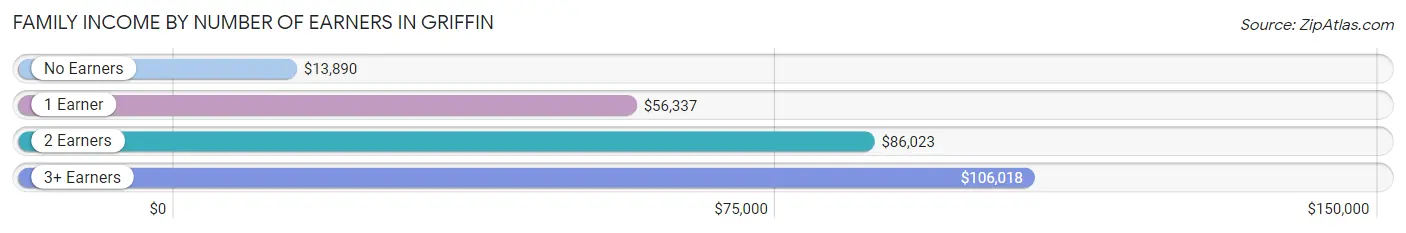
| Number of Earners | # Families | Median Income |
| No Earners | 1,231 (20.2%) | $13,890 |
| 1 Earner | 2,520 (41.4%) | $56,337 |
| 2 Earners | 1,813 (29.8%) | $86,023 |
| 3+ Earners | 521 (8.6%) | $106,018 |
| Total | 6,085 (100.0%) | $62,790 |
Household Income in Griffin
Household Income Brackets in Griffin
With 1,757 households falling in the category, the $50,000 to $74,999 income range is the most frequent in Griffin, accounting for 17.8% of all households. In contrast, only 197 households (2.0%) fall into the $150,000 to $199,999 income bracket, making it the least populous group.
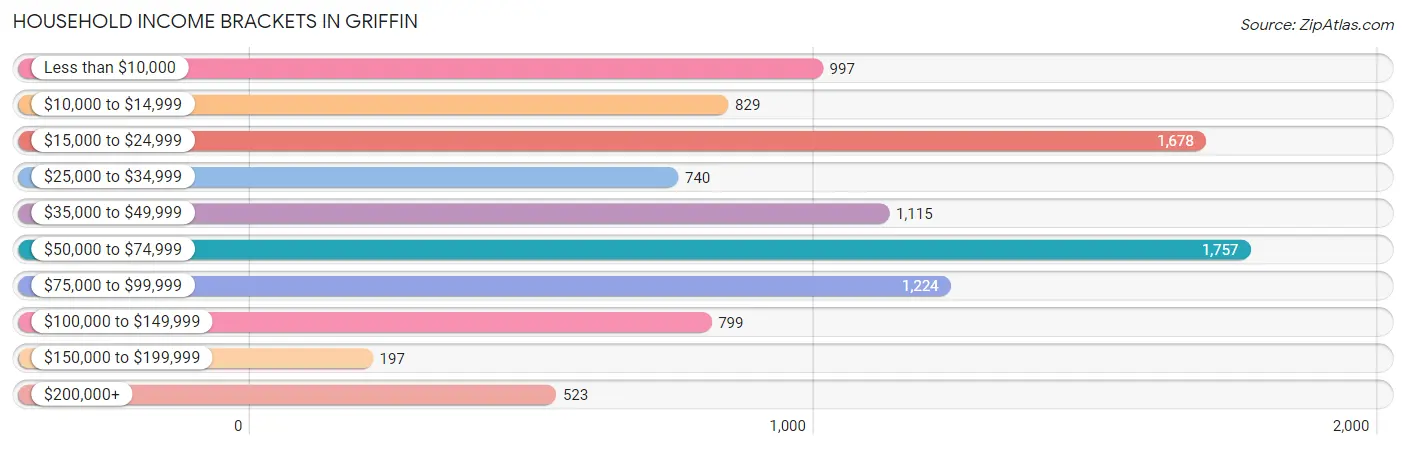
| Income Bracket | # Households | % Households |
| Less than $10,000 | 997 | 10.1% |
| $10,000 to $14,999 | 829 | 8.4% |
| $15,000 to $24,999 | 1,678 | 17.0% |
| $25,000 to $34,999 | 740 | 7.5% |
| $35,000 to $49,999 | 1,115 | 11.3% |
| $50,000 to $74,999 | 1,757 | 17.8% |
| $75,000 to $99,999 | 1,224 | 12.4% |
| $100,000 to $149,999 | 799 | 8.1% |
| $150,000 to $199,999 | 197 | 2.0% |
| $200,000+ | 523 | 5.3% |
Household Income by Householder Age in Griffin
The median household income in Griffin is $42,047, with the highest median household income of $49,083 found in the 45 to 64 years age bracket for the primary householder. A total of 3,470 households (35.2%) fall into this category. Meanwhile, the 65+ years age bracket for the primary householder has the lowest median household income of $31,538, with 2,220 households (22.5%) in this group.
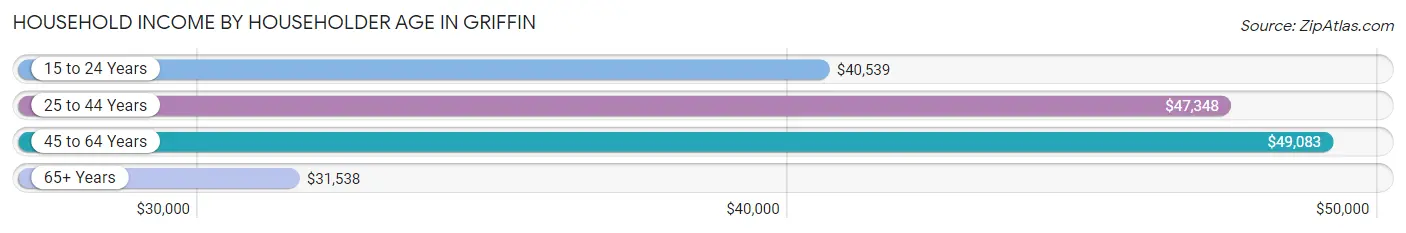
| Income Bracket | # Households | Median Income |
| 15 to 24 Years | 426 (4.3%) | $40,539 |
| 25 to 44 Years | 3,752 (38.0%) | $47,348 |
| 45 to 64 Years | 3,470 (35.2%) | $49,083 |
| 65+ Years | 2,220 (22.5%) | $31,538 |
| Total | 9,868 (100.0%) | $42,047 |
Poverty in Griffin
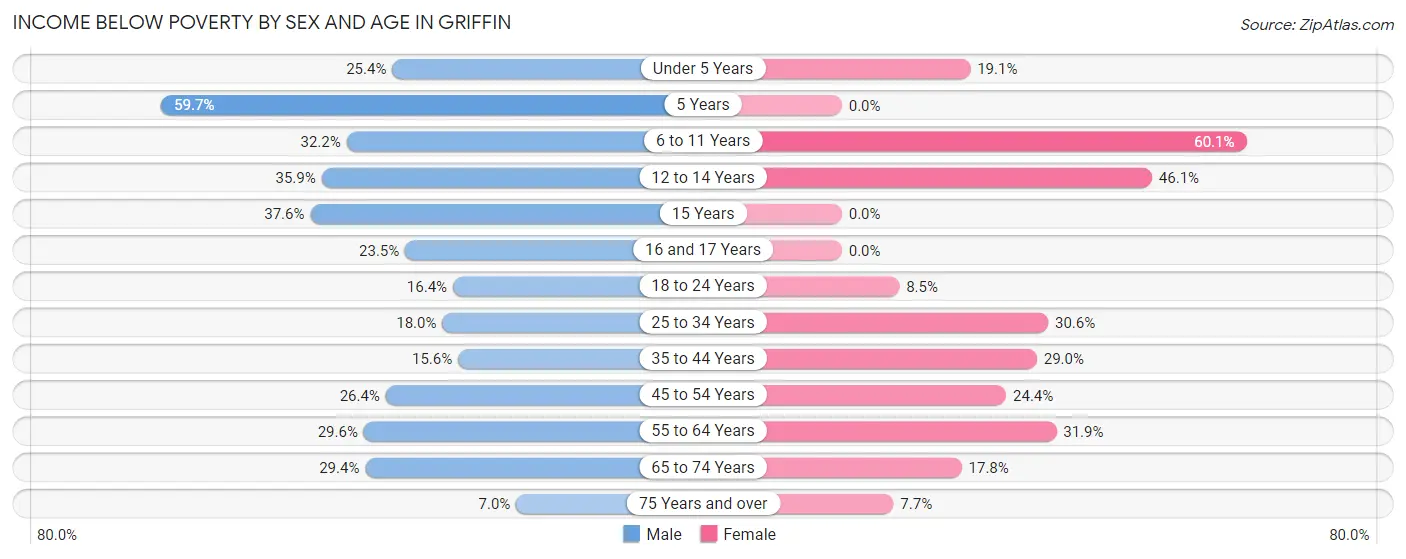
Income Below Poverty by Sex and Age in Griffin
With 24.1% poverty level for males and 26.5% for females among the residents of Griffin, 5 year old males and 6 to 11 year old females are the most vulnerable to poverty, with 126 males (59.7%) and 597 females (60.1%) in their respective age groups living below the poverty level.
| Age Bracket | Male | Female |
| Under 5 Years | 265 (25.4%) | 148 (19.1%) |
| 5 Years | 126 (59.7%) | 0 (0.0%) |
| 6 to 11 Years | 449 (32.2%) | 597 (60.1%) |
| 12 to 14 Years | 56 (35.9%) | 163 (46.1%) |
| 15 Years | 65 (37.6%) | 0 (0.0%) |
| 16 and 17 Years | 55 (23.5%) | 0 (0.0%) |
| 18 to 24 Years | 176 (16.4%) | 88 (8.5%) |
| 25 to 34 Years | 349 (18.0%) | 725 (30.6%) |
| 35 to 44 Years | 195 (15.6%) | 386 (29.0%) |
| 45 to 54 Years | 373 (26.4%) | 415 (24.4%) |
| 55 to 64 Years | 318 (29.6%) | 428 (31.9%) |
| 65 to 74 Years | 263 (29.4%) | 196 (17.8%) |
| 75 Years and over | 28 (7.0%) | 42 (7.7%) |
| Total | 2,718 (24.1%) | 3,188 (26.5%) |
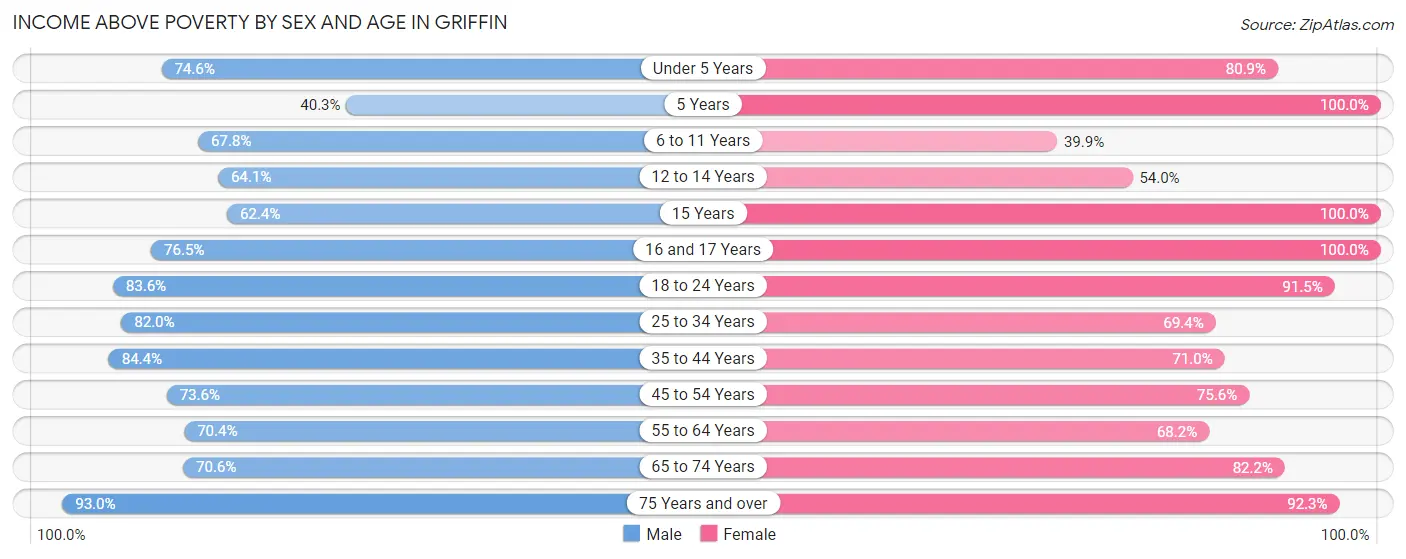
Income Above Poverty by Sex and Age in Griffin
According to the poverty statistics in Griffin, males aged 75 years and over and females aged 5 years are the age groups that are most secure financially, with 93.0% of males and 100.0% of females in these age groups living above the poverty line.
| Age Bracket | Male | Female |
| Under 5 Years | 778 (74.6%) | 628 (80.9%) |
| 5 Years | 85 (40.3%) | 115 (100.0%) |
| 6 to 11 Years | 946 (67.8%) | 397 (39.9%) |
| 12 to 14 Years | 100 (64.1%) | 191 (53.9%) |
| 15 Years | 108 (62.4%) | 89 (100.0%) |
| 16 and 17 Years | 179 (76.5%) | 277 (100.0%) |
| 18 to 24 Years | 897 (83.6%) | 944 (91.5%) |
| 25 to 34 Years | 1,593 (82.0%) | 1,642 (69.4%) |
| 35 to 44 Years | 1,052 (84.4%) | 947 (71.0%) |
| 45 to 54 Years | 1,041 (73.6%) | 1,286 (75.6%) |
| 55 to 64 Years | 755 (70.4%) | 916 (68.1%) |
| 65 to 74 Years | 631 (70.6%) | 906 (82.2%) |
| 75 Years and over | 372 (93.0%) | 506 (92.3%) |
| Total | 8,537 (75.8%) | 8,844 (73.5%) |
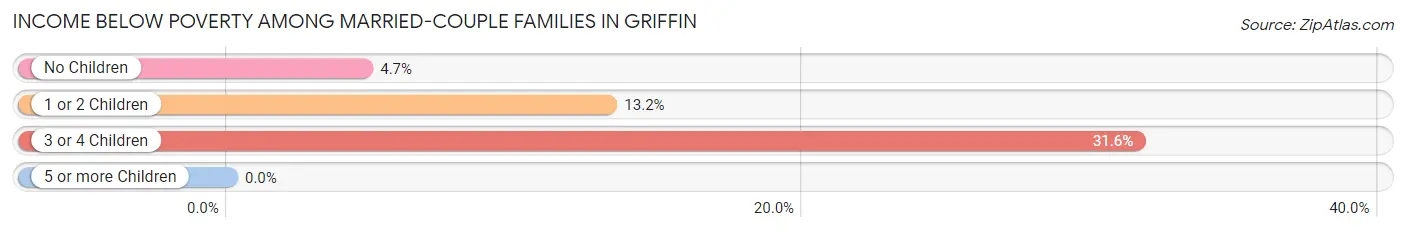
Income Below Poverty Among Married-Couple Families in Griffin
The poverty statistics for married-couple families in Griffin show that 9.7% or 287 of the total 2,974 families live below the poverty line. Families with 3 or 4 children have the highest poverty rate of 31.6%, comprising of 60 families. On the other hand, families with no children have the lowest poverty rate of 4.7%, which includes 78 families.
| Children | Above Poverty | Below Poverty |
| No Children | 1,578 (95.3%) | 78 (4.7%) |
| 1 or 2 Children | 979 (86.8%) | 149 (13.2%) |
| 3 or 4 Children | 130 (68.4%) | 60 (31.6%) |
| 5 or more Children | 0 (0.0%) | 0 (0.0%) |
| Total | 2,687 (90.3%) | 287 (9.7%) |
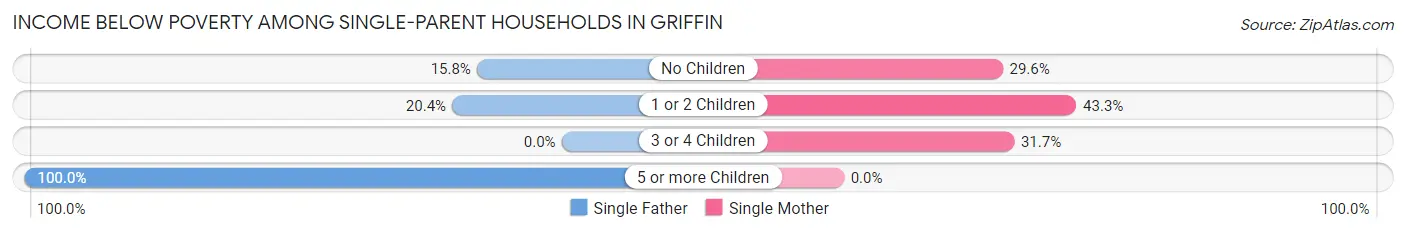
Income Below Poverty Among Single-Parent Households in Griffin
According to the poverty data in Griffin, 21.0% or 129 single-father households and 36.1% or 902 single-mother households are living below the poverty line. Among single-father households, those with 5 or more children have the highest poverty rate, with 27 households (100.0%) experiencing poverty. Likewise, among single-mother households, those with 1 or 2 children have the highest poverty rate, with 498 households (43.3%) falling below the poverty line.
| Children | Single Father | Single Mother |
| No Children | 42 (15.8%) | 319 (29.6%) |
| 1 or 2 Children | 60 (20.4%) | 498 (43.3%) |
| 3 or 4 Children | 0 (0.0%) | 85 (31.7%) |
| 5 or more Children | 27 (100.0%) | 0 (0.0%) |
| Total | 129 (21.0%) | 902 (36.1%) |
Income Below Poverty Among Married-Couple vs Single-Parent Households in Griffin
The poverty data for Griffin shows that 287 of the married-couple family households (9.7%) and 1,031 of the single-parent households (33.1%) are living below the poverty level. Within the married-couple family households, those with 3 or 4 children have the highest poverty rate, with 60 households (31.6%) falling below the poverty line. Among the single-parent households, those with 5 or more children have the highest poverty rate, with 27 household (100.0%) living below poverty.
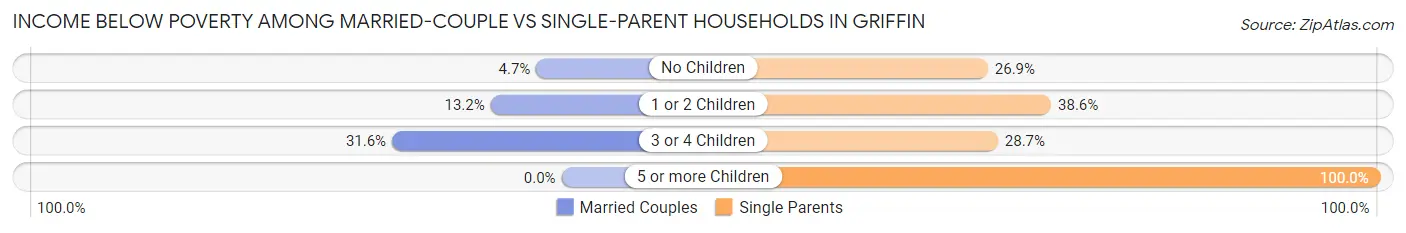
| Children | Married-Couple Families | Single-Parent Households |
| No Children | 78 (4.7%) | 361 (26.9%) |
| 1 or 2 Children | 149 (13.2%) | 558 (38.6%) |
| 3 or 4 Children | 60 (31.6%) | 85 (28.7%) |
| 5 or more Children | 0 (0.0%) | 27 (100.0%) |
| Total | 287 (9.7%) | 1,031 (33.1%) |
Employment Characteristics in Griffin
Employment by Class of Employer in Griffin
Among the 9,799 employed individuals in Griffin, private company employees (7,160 | 73.1%), local government employees (842 | 8.6%), and not-for-profit organizations (451 | 4.6%) make up the most common classes of employment.
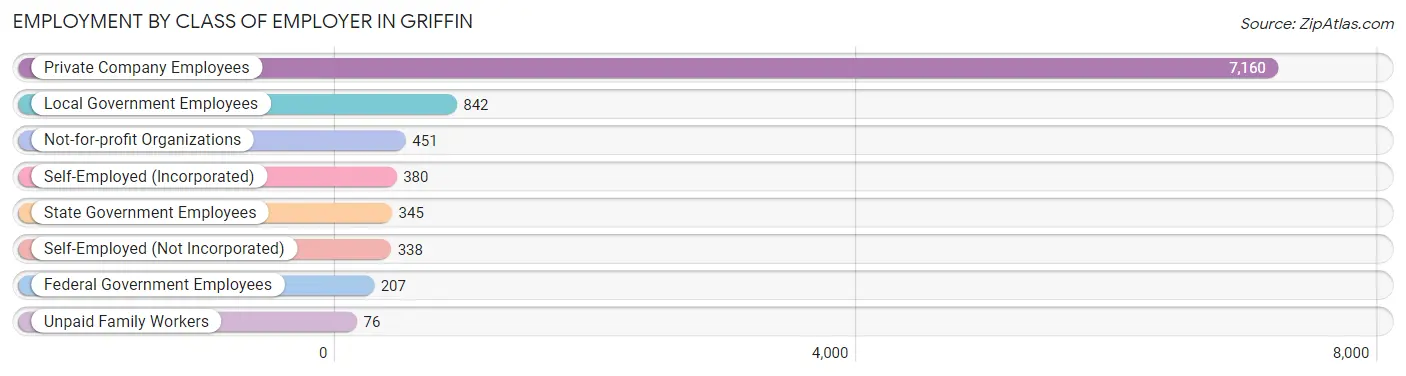
| Employer Class | # Employees | % Employees |
| Private Company Employees | 7,160 | 73.1% |
| Self-Employed (Incorporated) | 380 | 3.9% |
| Self-Employed (Not Incorporated) | 338 | 3.5% |
| Not-for-profit Organizations | 451 | 4.6% |
| Local Government Employees | 842 | 8.6% |
| State Government Employees | 345 | 3.5% |
| Federal Government Employees | 207 | 2.1% |
| Unpaid Family Workers | 76 | 0.8% |
| Total | 9,799 | 100.0% |
Employment Status by Age in Griffin
According to the labor force statistics for Griffin, out of the total population over 16 years of age (18,121), 59.3% or 10,746 individuals are in the labor force, with 5.5% or 591 of them unemployed. The age group with the highest labor force participation rate is 25 to 29 years, with 81.1% or 1,931 individuals in the labor force. Within the labor force, the 30 to 34 years age range has the highest percentage of unemployed individuals, with 12.7% or 180 of them being unemployed.
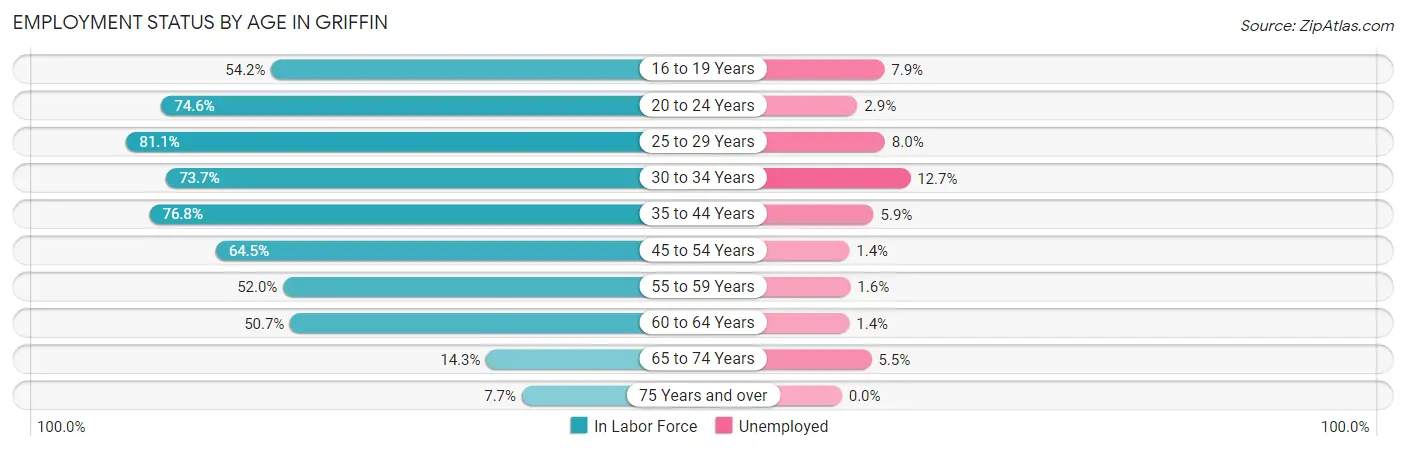
| Age Bracket | In Labor Force | Unemployed |
| 16 to 19 Years | 469 (54.2%) | 37 (7.9%) |
| 20 to 24 Years | 1,306 (74.6%) | 38 (2.9%) |
| 25 to 29 Years | 1,931 (81.1%) | 154 (8.0%) |
| 30 to 34 Years | 1,421 (73.7%) | 180 (12.7%) |
| 35 to 44 Years | 1,981 (76.8%) | 117 (5.9%) |
| 45 to 54 Years | 2,013 (64.5%) | 28 (1.4%) |
| 55 to 59 Years | 556 (52.0%) | 9 (1.6%) |
| 60 to 64 Years | 697 (50.7%) | 10 (1.4%) |
| 65 to 74 Years | 289 (14.3%) | 16 (5.5%) |
| 75 Years and over | 79 (7.7%) | 0 (0.0%) |
| Total | 10,746 (59.3%) | 591 (5.5%) |
Employment Status by Educational Attainment in Griffin
According to labor force statistics for Griffin, 69.0% of individuals (8,593) out of the total population between 25 and 64 years of age (12,454) are in the labor force, with 5.8% or 498 of them being unemployed. The group with the highest labor force participation rate are those with the educational attainment of bachelor's degree or higher, with 88.0% or 1,892 individuals in the labor force. Within the labor force, individuals with high school diploma education have the highest percentage of unemployment, with 8.8% or 332 of them being unemployed.
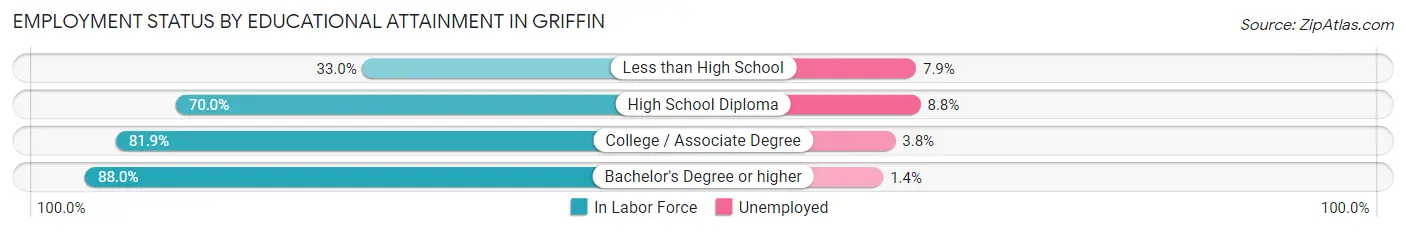
| Educational Attainment | In Labor Force | Unemployed |
| Less than High School | 733 (33.0%) | 175 (7.9%) |
| High School Diploma | 3,770 (70.0%) | 474 (8.8%) |
| College / Associate Degree | 2,209 (81.9%) | 102 (3.8%) |
| Bachelor's Degree or higher | 1,892 (88.0%) | 30 (1.4%) |
| Total | 8,593 (69.0%) | 722 (5.8%) |
Employment Occupations by Sex in Griffin
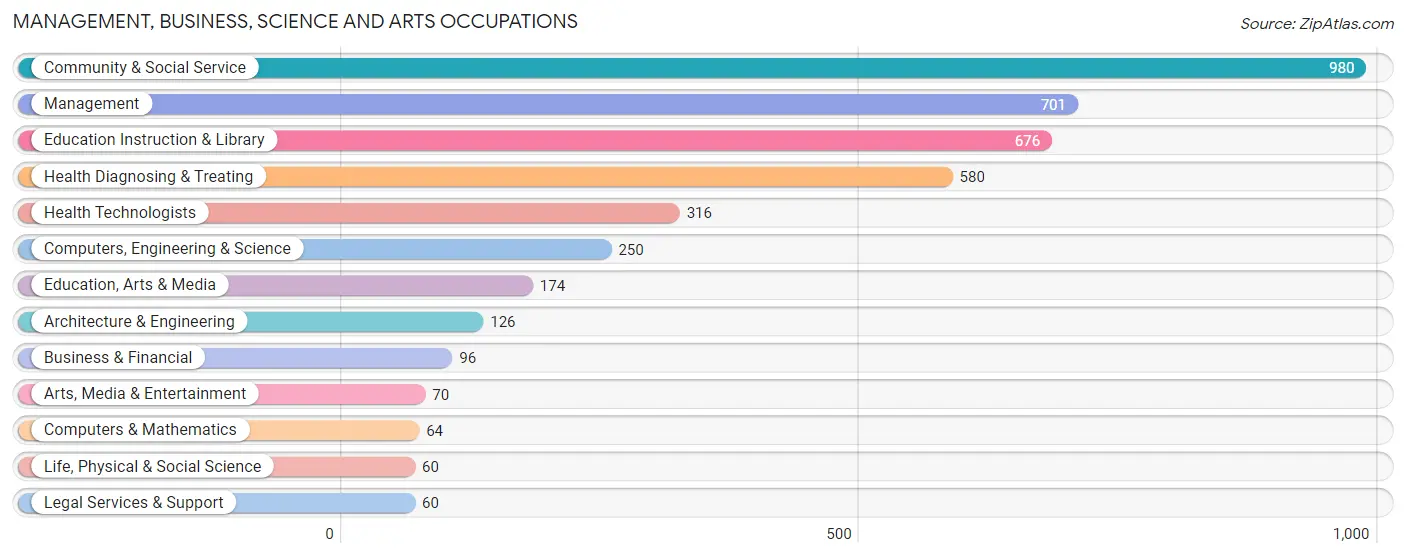
Management, Business, Science and Arts Occupations
The most common Management, Business, Science and Arts occupations in Griffin are Community & Social Service (980 | 9.7%), Management (701 | 7.0%), Education Instruction & Library (676 | 6.7%), Health Diagnosing & Treating (580 | 5.8%), and Health Technologists (316 | 3.1%).
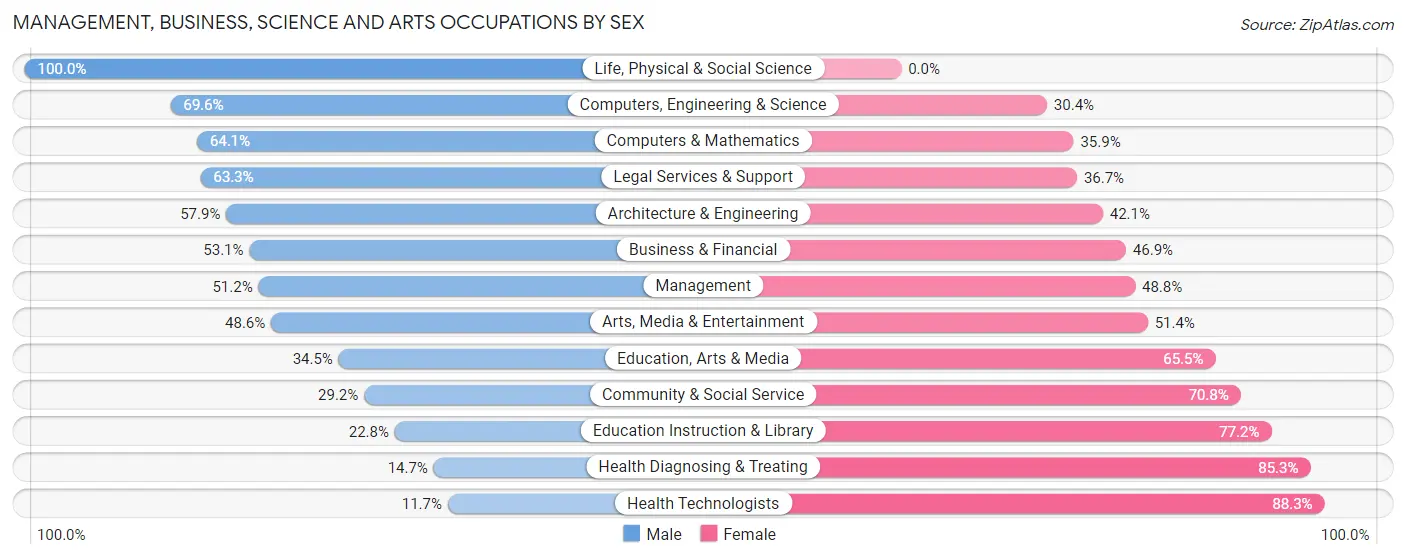
Management, Business, Science and Arts Occupations by Sex
Within the Management, Business, Science and Arts occupations in Griffin, the most male-oriented occupations are Life, Physical & Social Science (100.0%), Computers, Engineering & Science (69.6%), and Computers & Mathematics (64.1%), while the most female-oriented occupations are Health Technologists (88.3%), Health Diagnosing & Treating (85.3%), and Education Instruction & Library (77.2%).
| Occupation | Male | Female |
| Management | 359 (51.2%) | 342 (48.8%) |
| Business & Financial | 51 (53.1%) | 45 (46.9%) |
| Computers, Engineering & Science | 174 (69.6%) | 76 (30.4%) |
| Computers & Mathematics | 41 (64.1%) | 23 (35.9%) |
| Architecture & Engineering | 73 (57.9%) | 53 (42.1%) |
| Life, Physical & Social Science | 60 (100.0%) | 0 (0.0%) |
| Community & Social Service | 286 (29.2%) | 694 (70.8%) |
| Education, Arts & Media | 60 (34.5%) | 114 (65.5%) |
| Legal Services & Support | 38 (63.3%) | 22 (36.7%) |
| Education Instruction & Library | 154 (22.8%) | 522 (77.2%) |
| Arts, Media & Entertainment | 34 (48.6%) | 36 (51.4%) |
| Health Diagnosing & Treating | 85 (14.7%) | 495 (85.3%) |
| Health Technologists | 37 (11.7%) | 279 (88.3%) |
| Total (Category) | 955 (36.6%) | 1,652 (63.4%) |
| Total (Overall) | 5,331 (52.9%) | 4,746 (47.1%) |
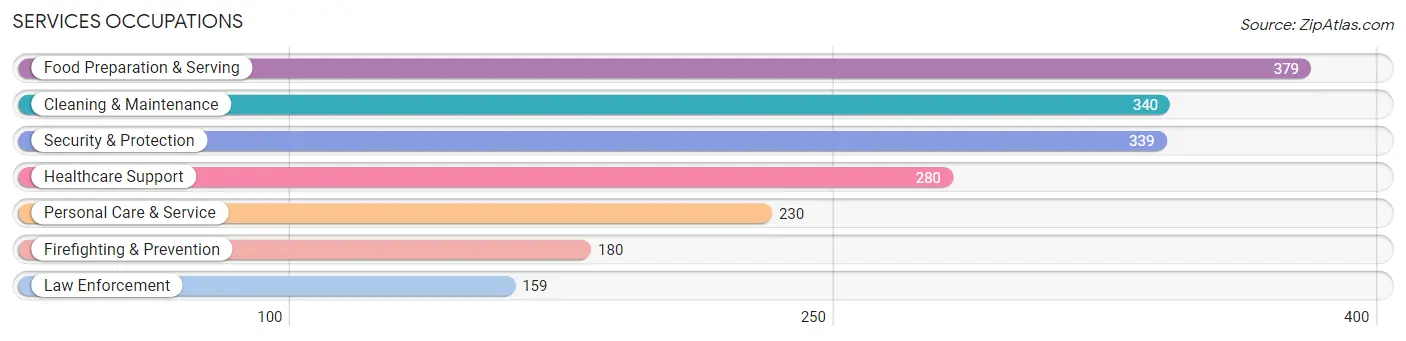
Services Occupations
The most common Services occupations in Griffin are Food Preparation & Serving (379 | 3.8%), Cleaning & Maintenance (340 | 3.4%), Security & Protection (339 | 3.4%), Healthcare Support (280 | 2.8%), and Personal Care & Service (230 | 2.3%).
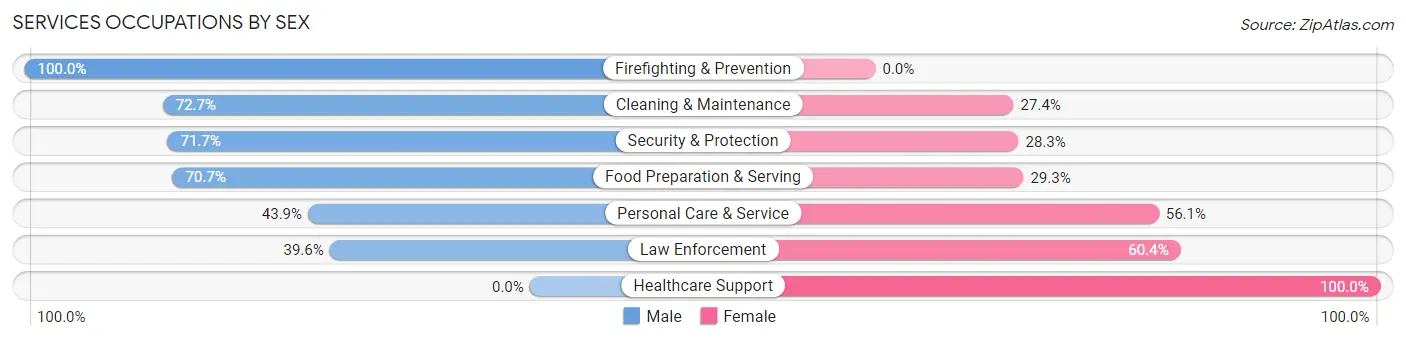
Services Occupations by Sex
Within the Services occupations in Griffin, the most male-oriented occupations are Firefighting & Prevention (100.0%), Cleaning & Maintenance (72.7%), and Security & Protection (71.7%), while the most female-oriented occupations are Healthcare Support (100.0%), Law Enforcement (60.4%), and Personal Care & Service (56.1%).
| Occupation | Male | Female |
| Healthcare Support | 0 (0.0%) | 280 (100.0%) |
| Security & Protection | 243 (71.7%) | 96 (28.3%) |
| Firefighting & Prevention | 180 (100.0%) | 0 (0.0%) |
| Law Enforcement | 63 (39.6%) | 96 (60.4%) |
| Food Preparation & Serving | 268 (70.7%) | 111 (29.3%) |
| Cleaning & Maintenance | 247 (72.7%) | 93 (27.4%) |
| Personal Care & Service | 101 (43.9%) | 129 (56.1%) |
| Total (Category) | 859 (54.8%) | 709 (45.2%) |
| Total (Overall) | 5,331 (52.9%) | 4,746 (47.1%) |
Sales and Office Occupations
The most common Sales and Office occupations in Griffin are Sales & Related (958 | 9.5%), and Office & Administration (944 | 9.4%).
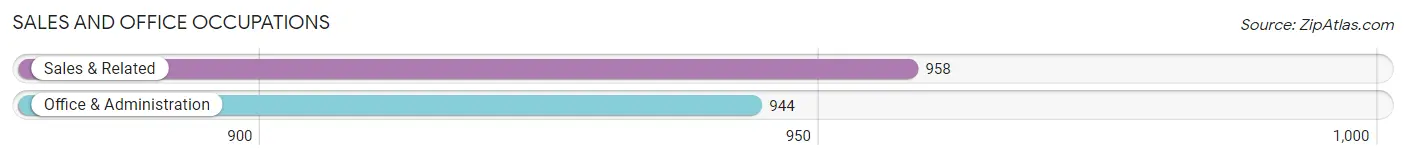
Sales and Office Occupations by Sex
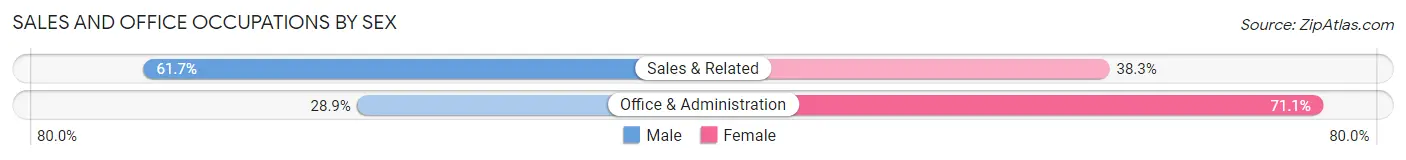
| Occupation | Male | Female |
| Sales & Related | 591 (61.7%) | 367 (38.3%) |
| Office & Administration | 273 (28.9%) | 671 (71.1%) |
| Total (Category) | 864 (45.4%) | 1,038 (54.6%) |
| Total (Overall) | 5,331 (52.9%) | 4,746 (47.1%) |
Natural Resources, Construction and Maintenance Occupations
The most common Natural Resources, Construction and Maintenance occupations in Griffin are Installation, Maintenance & Repair (488 | 4.8%), Construction & Extraction (380 | 3.8%), and Farming, Fishing & Forestry (58 | 0.6%).
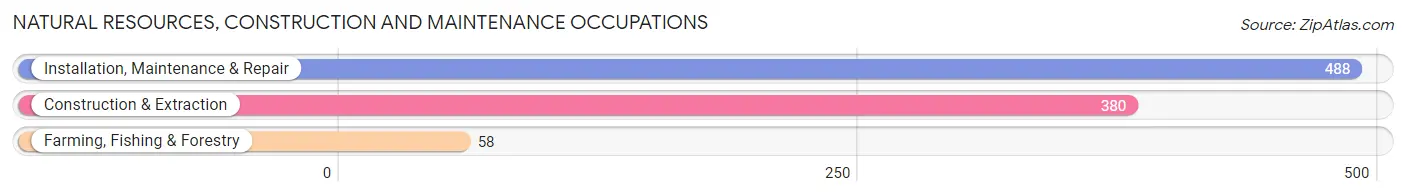
Natural Resources, Construction and Maintenance Occupations by Sex
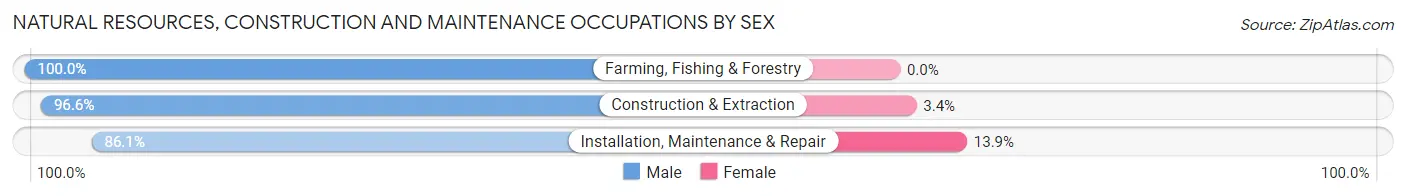
| Occupation | Male | Female |
| Farming, Fishing & Forestry | 58 (100.0%) | 0 (0.0%) |
| Construction & Extraction | 367 (96.6%) | 13 (3.4%) |
| Installation, Maintenance & Repair | 420 (86.1%) | 68 (13.9%) |
| Total (Category) | 845 (91.2%) | 81 (8.7%) |
| Total (Overall) | 5,331 (52.9%) | 4,746 (47.1%) |
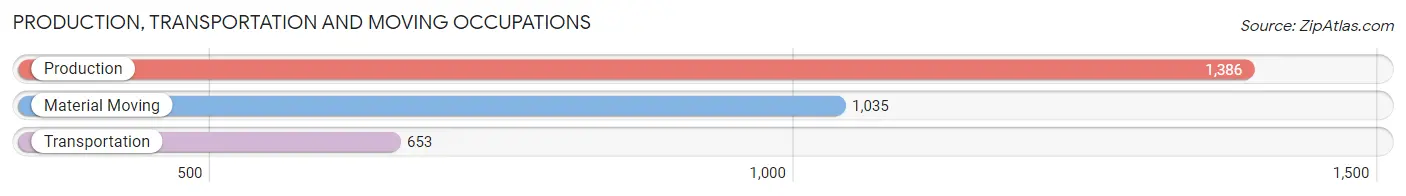
Production, Transportation and Moving Occupations
The most common Production, Transportation and Moving occupations in Griffin are Production (1,386 | 13.8%), Material Moving (1,035 | 10.3%), and Transportation (653 | 6.5%).
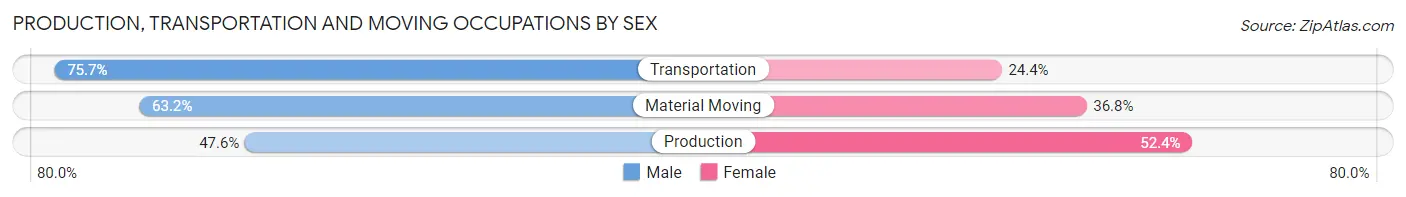
Production, Transportation and Moving Occupations by Sex
| Occupation | Male | Female |
| Production | 660 (47.6%) | 726 (52.4%) |
| Transportation | 494 (75.6%) | 159 (24.3%) |
| Material Moving | 654 (63.2%) | 381 (36.8%) |
| Total (Category) | 1,808 (58.8%) | 1,266 (41.2%) |
| Total (Overall) | 5,331 (52.9%) | 4,746 (47.1%) |
Employment Industries by Sex in Griffin
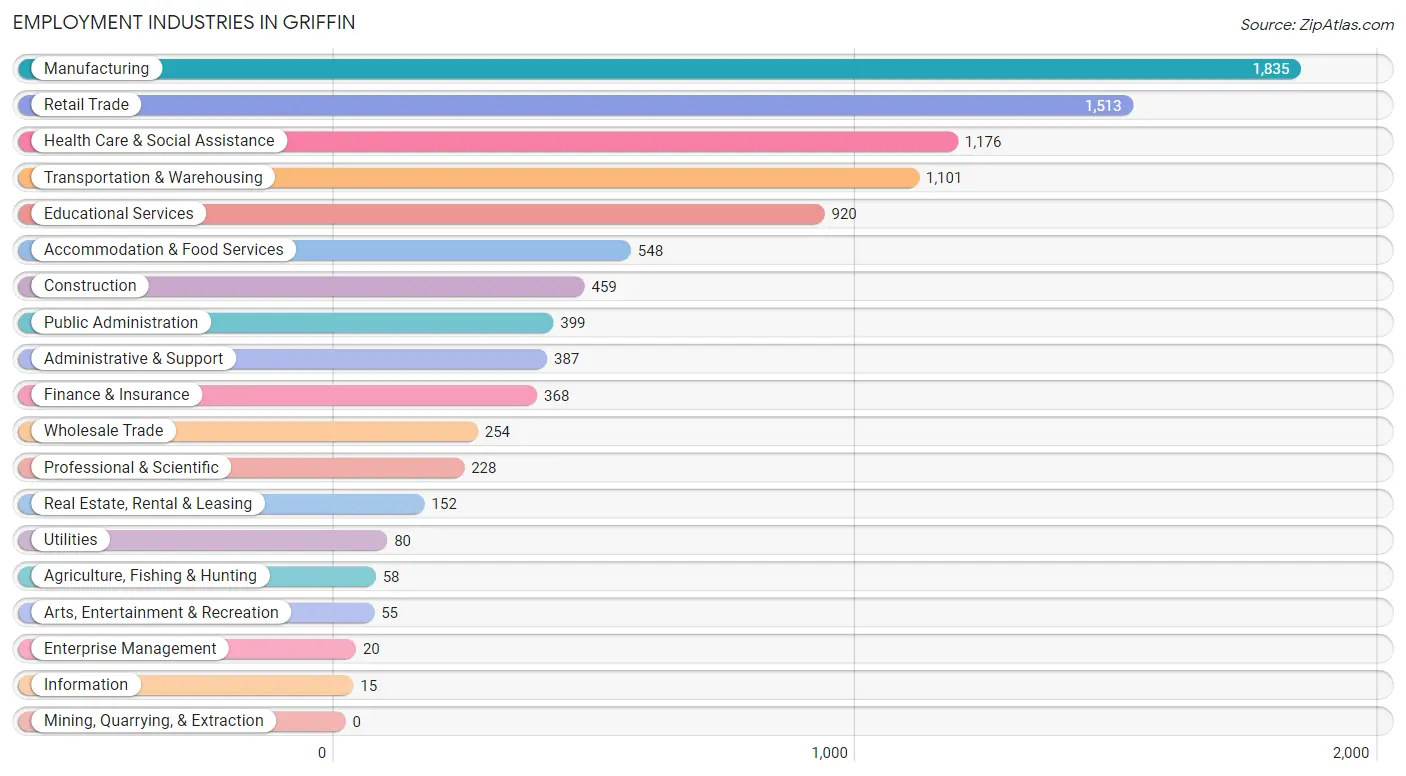
Employment Industries in Griffin
The major employment industries in Griffin include Manufacturing (1,835 | 18.2%), Retail Trade (1,513 | 15.0%), Health Care & Social Assistance (1,176 | 11.7%), Transportation & Warehousing (1,101 | 10.9%), and Educational Services (920 | 9.1%).
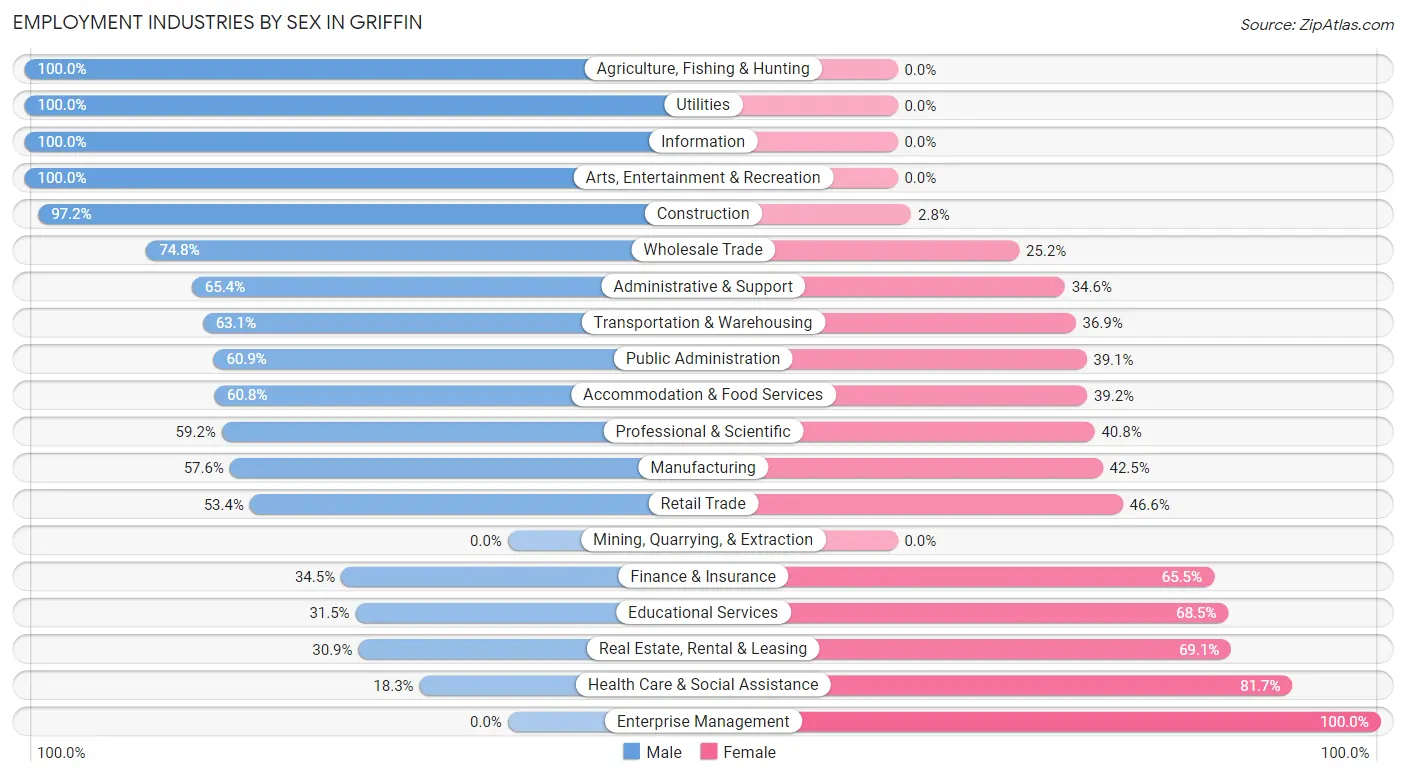
Employment Industries by Sex in Griffin
The Griffin industries that see more men than women are Agriculture, Fishing & Hunting (100.0%), Utilities (100.0%), and Information (100.0%), whereas the industries that tend to have a higher number of women are Enterprise Management (100.0%), Health Care & Social Assistance (81.7%), and Real Estate, Rental & Leasing (69.1%).
| Industry | Male | Female |
| Agriculture, Fishing & Hunting | 58 (100.0%) | 0 (0.0%) |
| Mining, Quarrying, & Extraction | 0 (0.0%) | 0 (0.0%) |
| Construction | 446 (97.2%) | 13 (2.8%) |
| Manufacturing | 1,056 (57.6%) | 779 (42.4%) |
| Wholesale Trade | 190 (74.8%) | 64 (25.2%) |
| Retail Trade | 808 (53.4%) | 705 (46.6%) |
| Transportation & Warehousing | 695 (63.1%) | 406 (36.9%) |
| Utilities | 80 (100.0%) | 0 (0.0%) |
| Information | 15 (100.0%) | 0 (0.0%) |
| Finance & Insurance | 127 (34.5%) | 241 (65.5%) |
| Real Estate, Rental & Leasing | 47 (30.9%) | 105 (69.1%) |
| Professional & Scientific | 135 (59.2%) | 93 (40.8%) |
| Enterprise Management | 0 (0.0%) | 20 (100.0%) |
| Administrative & Support | 253 (65.4%) | 134 (34.6%) |
| Educational Services | 290 (31.5%) | 630 (68.5%) |
| Health Care & Social Assistance | 215 (18.3%) | 961 (81.7%) |
| Arts, Entertainment & Recreation | 55 (100.0%) | 0 (0.0%) |
| Accommodation & Food Services | 333 (60.8%) | 215 (39.2%) |
| Public Administration | 243 (60.9%) | 156 (39.1%) |
| Total | 5,331 (52.9%) | 4,746 (47.1%) |
Education in Griffin
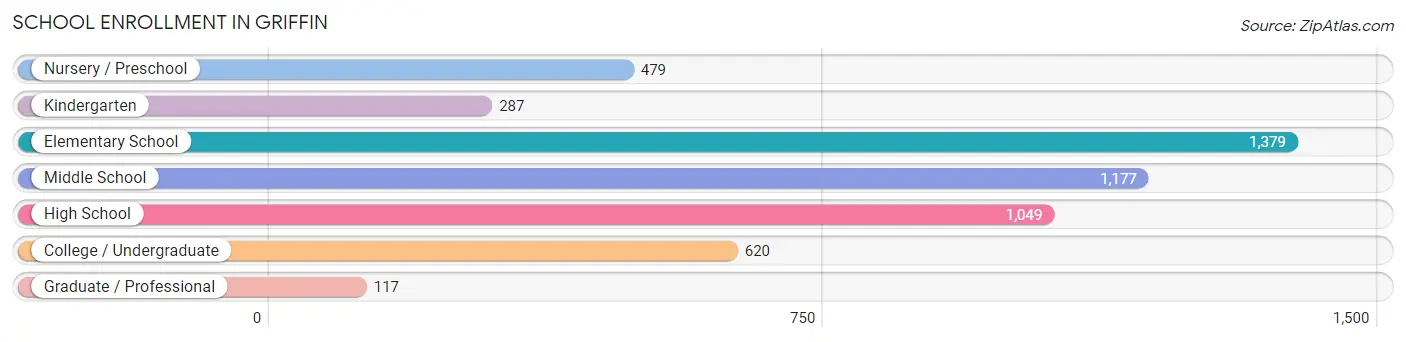
School Enrollment in Griffin
The most common levels of schooling among the 5,108 students in Griffin are elementary school (1,379 | 27.0%), middle school (1,177 | 23.0%), and high school (1,049 | 20.5%).
| School Level | # Students | % Students |
| Nursery / Preschool | 479 | 9.4% |
| Kindergarten | 287 | 5.6% |
| Elementary School | 1,379 | 27.0% |
| Middle School | 1,177 | 23.0% |
| High School | 1,049 | 20.5% |
| College / Undergraduate | 620 | 12.1% |
| Graduate / Professional | 117 | 2.3% |
| Total | 5,108 | 100.0% |
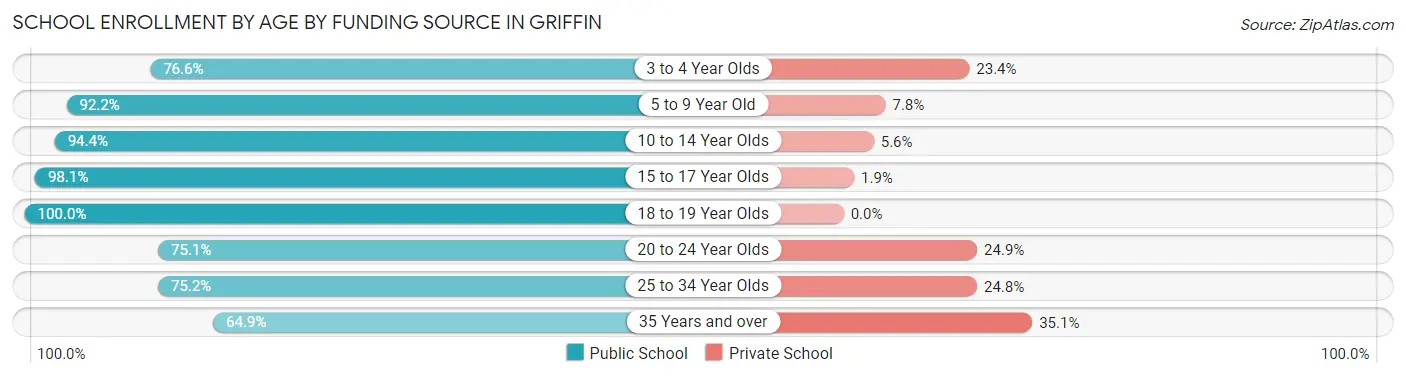
School Enrollment by Age by Funding Source in Griffin
Out of a total of 5,108 students who are enrolled in schools in Griffin, 521 (10.2%) attend a private institution, while the remaining 4,587 (89.8%) are enrolled in public schools. The age group of 35 years and over has the highest likelihood of being enrolled in private schools, with 118 (35.1% in the age bracket) enrolled. Conversely, the age group of 18 to 19 year olds has the lowest likelihood of being enrolled in a private school, with 119 (100.0% in the age bracket) attending a public institution.
| Age Bracket | Public School | Private School |
| 3 to 4 Year Olds | 314 (76.6%) | 96 (23.4%) |
| 5 to 9 Year Old | 1,466 (92.2%) | 124 (7.8%) |
| 10 to 14 Year Olds | 1,463 (94.4%) | 87 (5.6%) |
| 15 to 17 Year Olds | 758 (98.1%) | 15 (1.9%) |
| 18 to 19 Year Olds | 119 (100.0%) | 0 (0.0%) |
| 20 to 24 Year Olds | 130 (75.1%) | 43 (24.9%) |
| 25 to 34 Year Olds | 118 (75.2%) | 39 (24.8%) |
| 35 Years and over | 218 (64.9%) | 118 (35.1%) |
| Total | 4,587 (89.8%) | 521 (10.2%) |
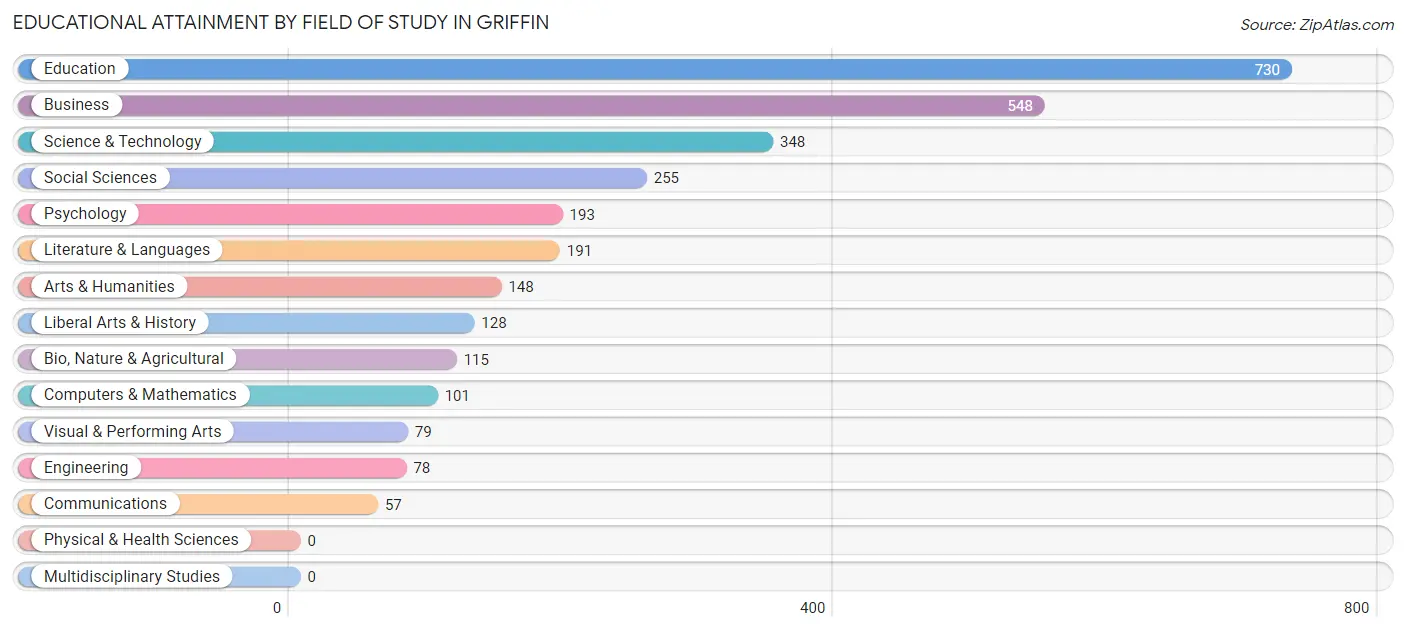
Educational Attainment by Field of Study in Griffin
Education (730 | 24.6%), business (548 | 18.4%), science & technology (348 | 11.7%), social sciences (255 | 8.6%), and psychology (193 | 6.5%) are the most common fields of study among 2,971 individuals in Griffin who have obtained a bachelor's degree or higher.
| Field of Study | # Graduates | % Graduates |
| Computers & Mathematics | 101 | 3.4% |
| Bio, Nature & Agricultural | 115 | 3.9% |
| Physical & Health Sciences | 0 | 0.0% |
| Psychology | 193 | 6.5% |
| Social Sciences | 255 | 8.6% |
| Engineering | 78 | 2.6% |
| Multidisciplinary Studies | 0 | 0.0% |
| Science & Technology | 348 | 11.7% |
| Business | 548 | 18.4% |
| Education | 730 | 24.6% |
| Literature & Languages | 191 | 6.4% |
| Liberal Arts & History | 128 | 4.3% |
| Visual & Performing Arts | 79 | 2.7% |
| Communications | 57 | 1.9% |
| Arts & Humanities | 148 | 5.0% |
| Total | 2,971 | 100.0% |
Transportation & Commute in Griffin
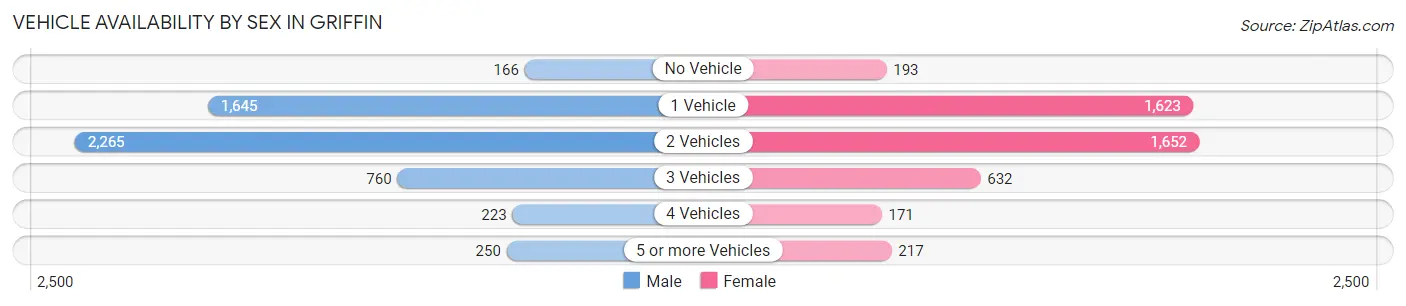
Vehicle Availability by Sex in Griffin
The most prevalent vehicle ownership categories in Griffin are males with 2 vehicles (2,265, accounting for 42.7%) and females with 2 vehicles (1,652, making up 50.5%).
| Vehicles Available | Male | Female |
| No Vehicle | 166 (3.1%) | 193 (4.3%) |
| 1 Vehicle | 1,645 (31.0%) | 1,623 (36.2%) |
| 2 Vehicles | 2,265 (42.7%) | 1,652 (36.8%) |
| 3 Vehicles | 760 (14.3%) | 632 (14.1%) |
| 4 Vehicles | 223 (4.2%) | 171 (3.8%) |
| 5 or more Vehicles | 250 (4.7%) | 217 (4.8%) |
| Total | 5,309 (100.0%) | 4,488 (100.0%) |
Commute Time in Griffin
The most frequently occuring commute durations in Griffin are 15 to 19 minutes (1,643 commuters, 17.6%), 10 to 14 minutes (1,479 commuters, 15.9%), and 30 to 34 minutes (1,409 commuters, 15.1%).
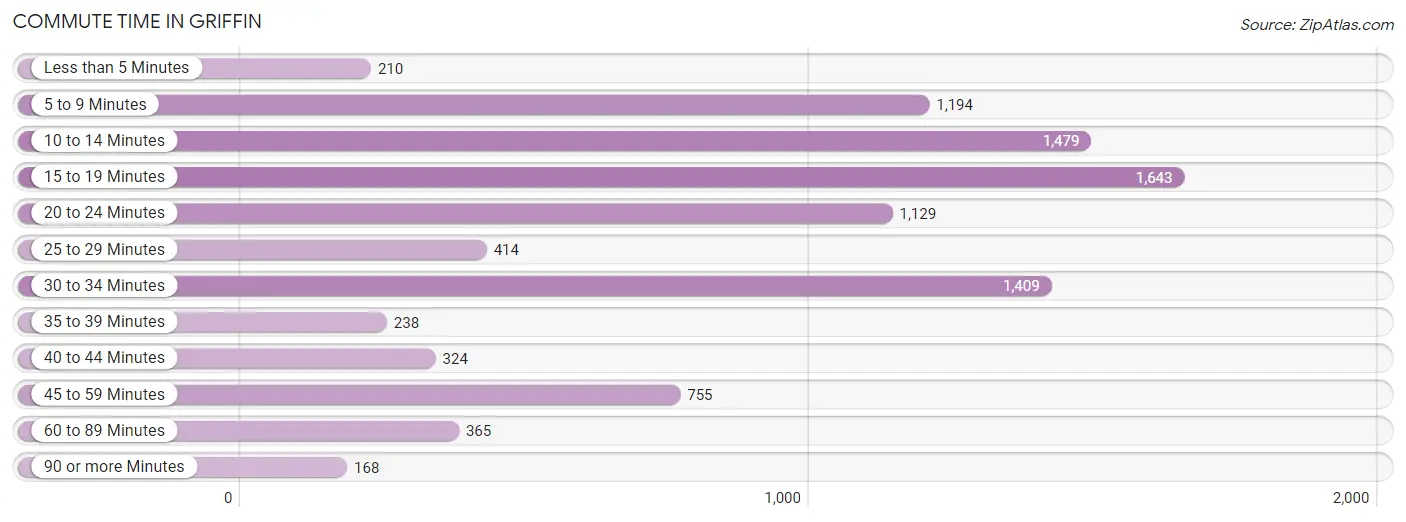
| Commute Time | # Commuters | % Commuters |
| Less than 5 Minutes | 210 | 2.2% |
| 5 to 9 Minutes | 1,194 | 12.8% |
| 10 to 14 Minutes | 1,479 | 15.9% |
| 15 to 19 Minutes | 1,643 | 17.6% |
| 20 to 24 Minutes | 1,129 | 12.1% |
| 25 to 29 Minutes | 414 | 4.4% |
| 30 to 34 Minutes | 1,409 | 15.1% |
| 35 to 39 Minutes | 238 | 2.5% |
| 40 to 44 Minutes | 324 | 3.5% |
| 45 to 59 Minutes | 755 | 8.1% |
| 60 to 89 Minutes | 365 | 3.9% |
| 90 or more Minutes | 168 | 1.8% |
Commute Time by Sex in Griffin
The most common commute times in Griffin are 15 to 19 minutes (1,007 commuters, 19.8%) for males and 10 to 14 minutes (806 commuters, 19.1%) for females.
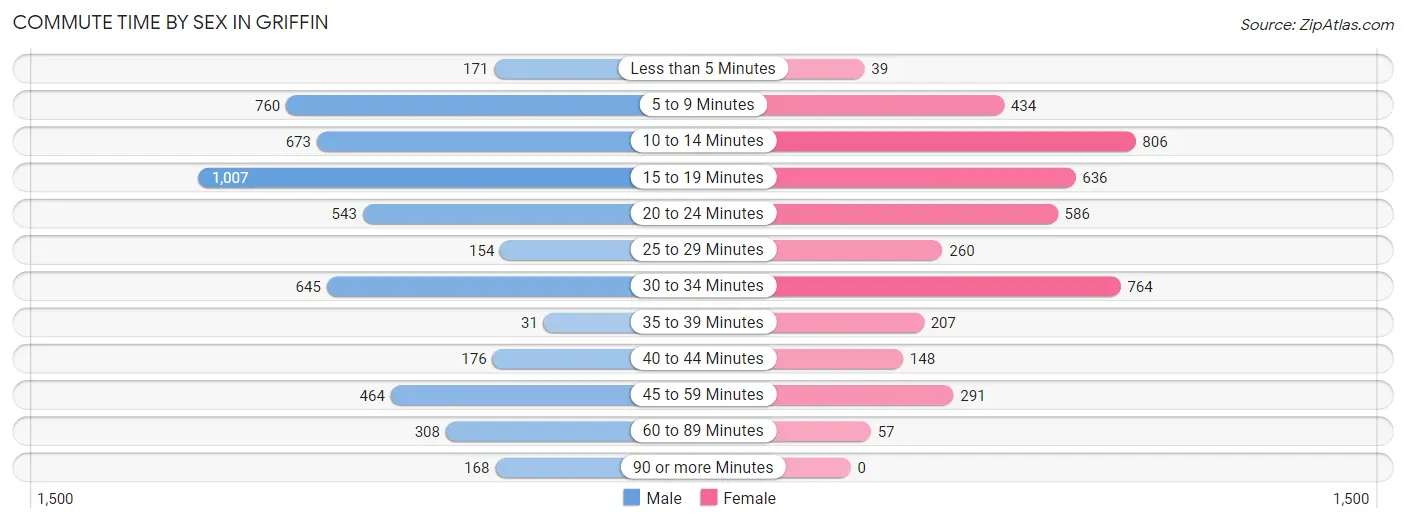
| Commute Time | Male | Female |
| Less than 5 Minutes | 171 (3.4%) | 39 (0.9%) |
| 5 to 9 Minutes | 760 (14.9%) | 434 (10.3%) |
| 10 to 14 Minutes | 673 (13.2%) | 806 (19.1%) |
| 15 to 19 Minutes | 1,007 (19.8%) | 636 (15.0%) |
| 20 to 24 Minutes | 543 (10.6%) | 586 (13.9%) |
| 25 to 29 Minutes | 154 (3.0%) | 260 (6.1%) |
| 30 to 34 Minutes | 645 (12.7%) | 764 (18.1%) |
| 35 to 39 Minutes | 31 (0.6%) | 207 (4.9%) |
| 40 to 44 Minutes | 176 (3.5%) | 148 (3.5%) |
| 45 to 59 Minutes | 464 (9.1%) | 291 (6.9%) |
| 60 to 89 Minutes | 308 (6.0%) | 57 (1.3%) |
| 90 or more Minutes | 168 (3.3%) | 0 (0.0%) |
Time of Departure to Work by Sex in Griffin
The most frequent times of departure to work in Griffin are 7:00 AM to 7:29 AM (870, 17.1%) for males and 7:30 AM to 7:59 AM (693, 16.4%) for females.
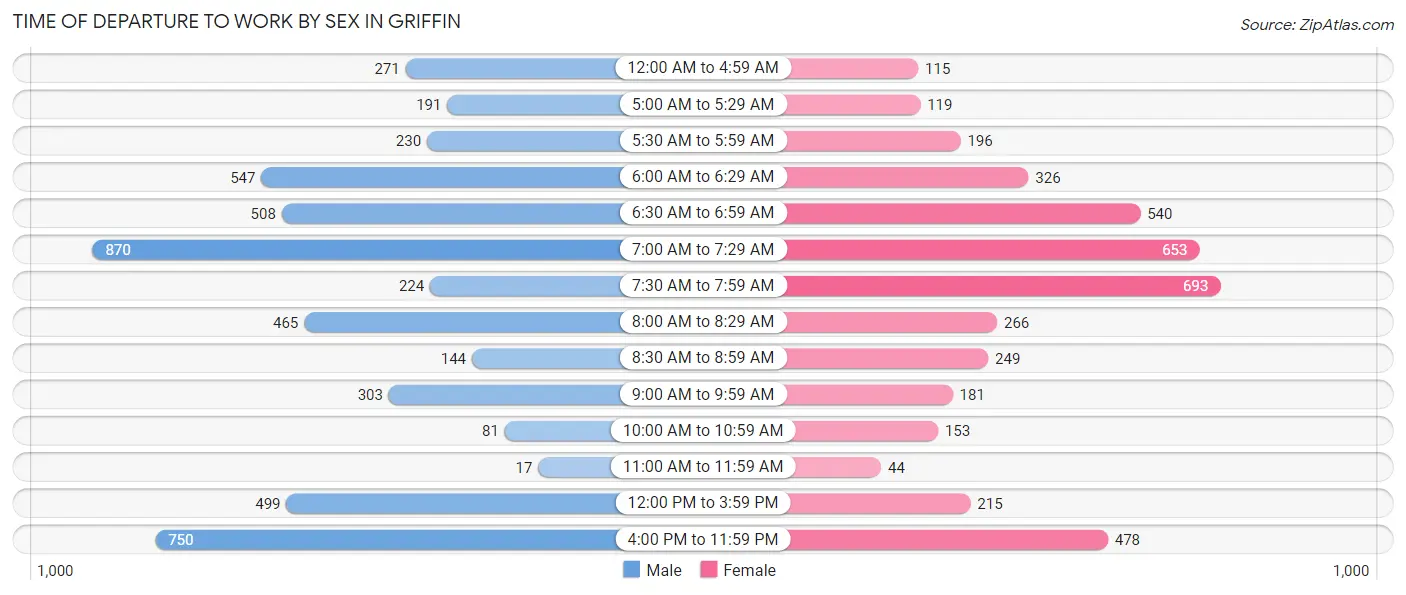
| Time of Departure | Male | Female |
| 12:00 AM to 4:59 AM | 271 (5.3%) | 115 (2.7%) |
| 5:00 AM to 5:29 AM | 191 (3.7%) | 119 (2.8%) |
| 5:30 AM to 5:59 AM | 230 (4.5%) | 196 (4.6%) |
| 6:00 AM to 6:29 AM | 547 (10.7%) | 326 (7.7%) |
| 6:30 AM to 6:59 AM | 508 (10.0%) | 540 (12.8%) |
| 7:00 AM to 7:29 AM | 870 (17.1%) | 653 (15.4%) |
| 7:30 AM to 7:59 AM | 224 (4.4%) | 693 (16.4%) |
| 8:00 AM to 8:29 AM | 465 (9.1%) | 266 (6.3%) |
| 8:30 AM to 8:59 AM | 144 (2.8%) | 249 (5.9%) |
| 9:00 AM to 9:59 AM | 303 (5.9%) | 181 (4.3%) |
| 10:00 AM to 10:59 AM | 81 (1.6%) | 153 (3.6%) |
| 11:00 AM to 11:59 AM | 17 (0.3%) | 44 (1.0%) |
| 12:00 PM to 3:59 PM | 499 (9.8%) | 215 (5.1%) |
| 4:00 PM to 11:59 PM | 750 (14.7%) | 478 (11.3%) |
| Total | 5,100 (100.0%) | 4,228 (100.0%) |
Housing Occupancy in Griffin
Occupancy by Ownership in Griffin
Of the total 9,868 dwellings in Griffin, owner-occupied units account for 3,739 (37.9%), while renter-occupied units make up 6,129 (62.1%).
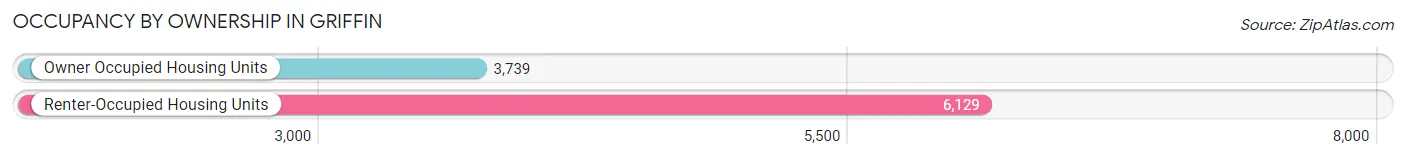
| Occupancy | # Housing Units | % Housing Units |
| Owner Occupied Housing Units | 3,739 | 37.9% |
| Renter-Occupied Housing Units | 6,129 | 62.1% |
| Total Occupied Housing Units | 9,868 | 100.0% |
Occupancy by Household Size in Griffin
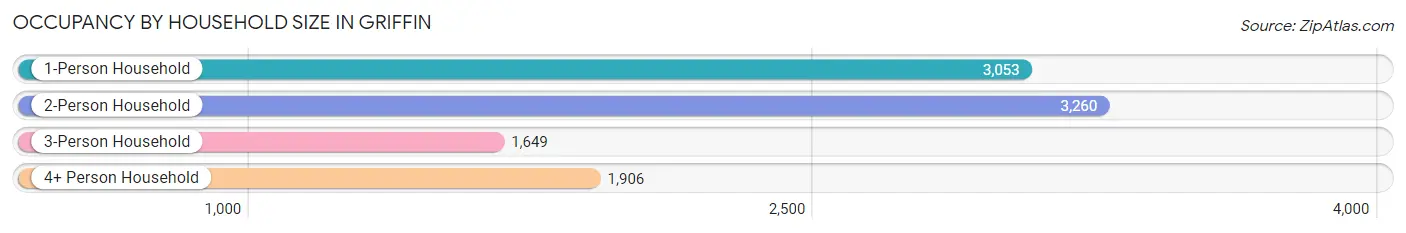
| Household Size | # Housing Units | % Housing Units |
| 1-Person Household | 3,053 | 30.9% |
| 2-Person Household | 3,260 | 33.0% |
| 3-Person Household | 1,649 | 16.7% |
| 4+ Person Household | 1,906 | 19.3% |
| Total Housing Units | 9,868 | 100.0% |
Occupancy by Ownership by Household Size in Griffin
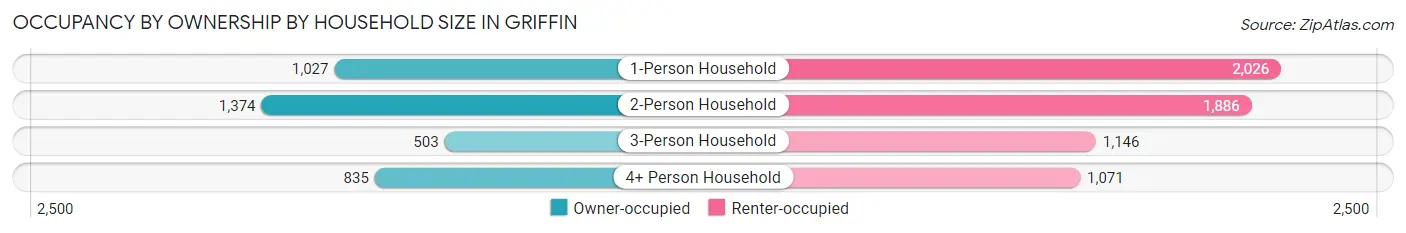
| Household Size | Owner-occupied | Renter-occupied |
| 1-Person Household | 1,027 (33.6%) | 2,026 (66.4%) |
| 2-Person Household | 1,374 (42.1%) | 1,886 (57.9%) |
| 3-Person Household | 503 (30.5%) | 1,146 (69.5%) |
| 4+ Person Household | 835 (43.8%) | 1,071 (56.2%) |
| Total Housing Units | 3,739 (37.9%) | 6,129 (62.1%) |
Occupancy by Educational Attainment in Griffin
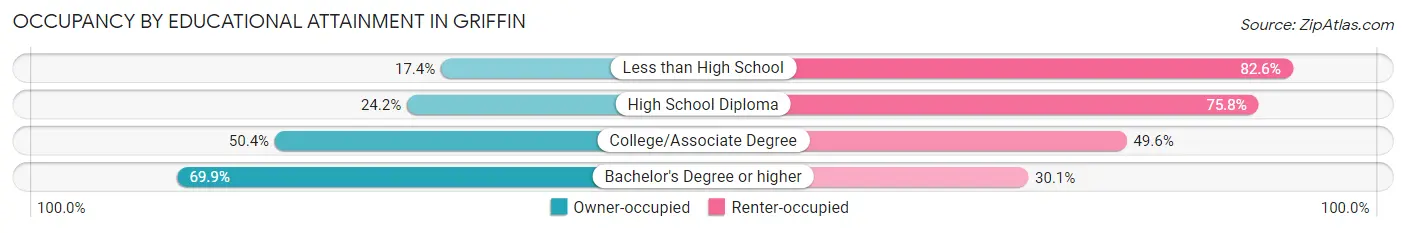
| Household Size | Owner-occupied | Renter-occupied |
| Less than High School | 353 (17.4%) | 1,671 (82.6%) |
| High School Diploma | 847 (24.2%) | 2,655 (75.8%) |
| College/Associate Degree | 1,279 (50.4%) | 1,260 (49.6%) |
| Bachelor's Degree or higher | 1,260 (69.9%) | 543 (30.1%) |
Occupancy by Age of Householder in Griffin
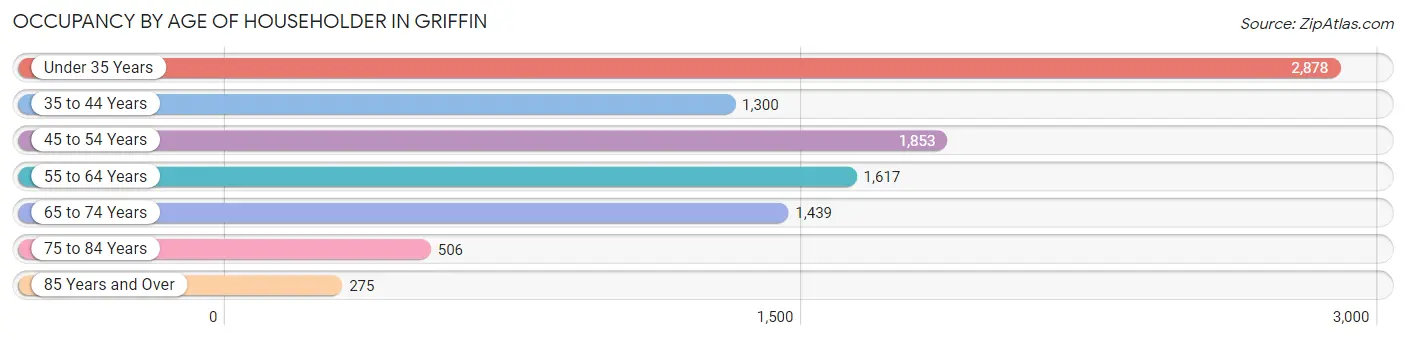
| Age Bracket | # Households | % Households |
| Under 35 Years | 2,878 | 29.2% |
| 35 to 44 Years | 1,300 | 13.2% |
| 45 to 54 Years | 1,853 | 18.8% |
| 55 to 64 Years | 1,617 | 16.4% |
| 65 to 74 Years | 1,439 | 14.6% |
| 75 to 84 Years | 506 | 5.1% |
| 85 Years and Over | 275 | 2.8% |
| Total | 9,868 | 100.0% |
Housing Finances in Griffin
Median Income by Occupancy in Griffin
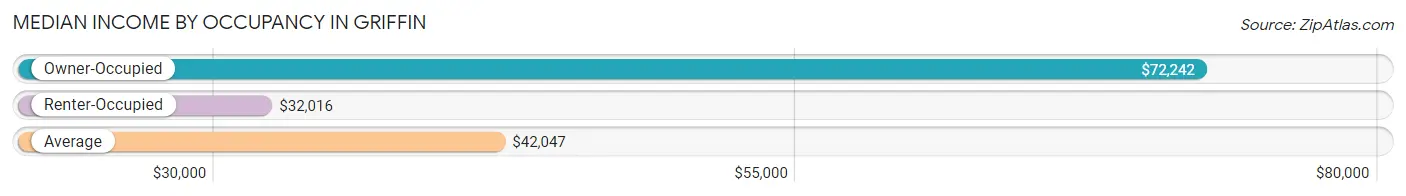
| Occupancy Type | # Households | Median Income |
| Owner-Occupied | 3,739 (37.9%) | $72,242 |
| Renter-Occupied | 6,129 (62.1%) | $32,016 |
| Average | 9,868 (100.0%) | $42,047 |
Occupancy by Householder Income Bracket in Griffin
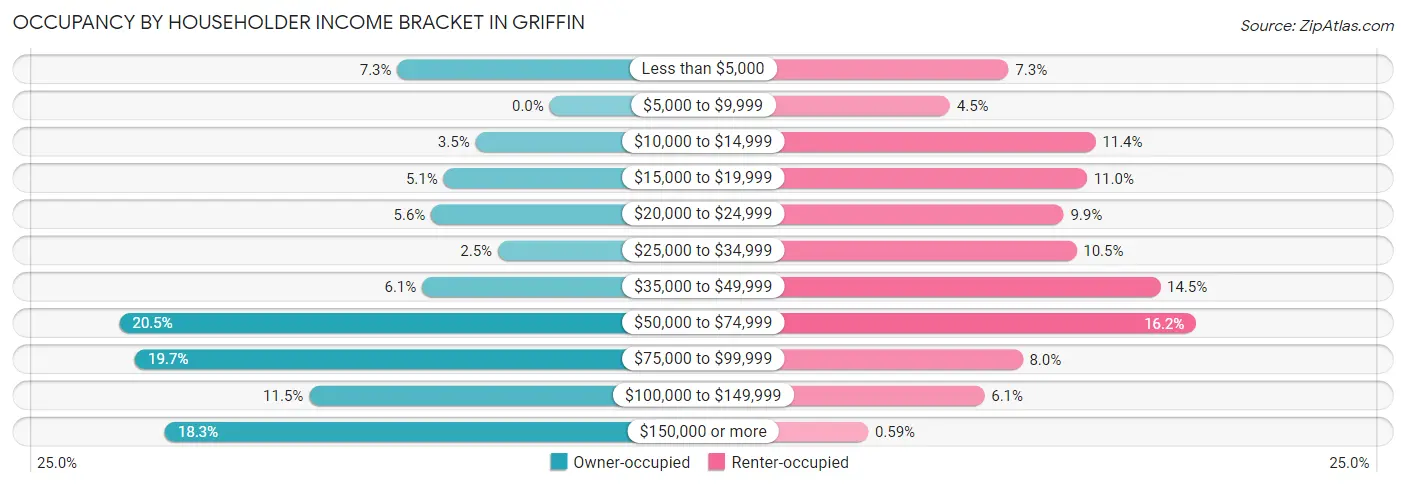
| Income Bracket | Owner-occupied | Renter-occupied |
| Less than $5,000 | 271 (7.2%) | 446 (7.3%) |
| $5,000 to $9,999 | 0 (0.0%) | 275 (4.5%) |
| $10,000 to $14,999 | 132 (3.5%) | 700 (11.4%) |
| $15,000 to $19,999 | 189 (5.1%) | 675 (11.0%) |
| $20,000 to $24,999 | 211 (5.6%) | 607 (9.9%) |
| $25,000 to $34,999 | 92 (2.5%) | 644 (10.5%) |
| $35,000 to $49,999 | 227 (6.1%) | 889 (14.5%) |
| $50,000 to $74,999 | 766 (20.5%) | 994 (16.2%) |
| $75,000 to $99,999 | 738 (19.7%) | 487 (8.0%) |
| $100,000 to $149,999 | 428 (11.5%) | 376 (6.1%) |
| $150,000 or more | 685 (18.3%) | 36 (0.6%) |
| Total | 3,739 (100.0%) | 6,129 (100.0%) |
Monthly Housing Cost Tiers in Griffin
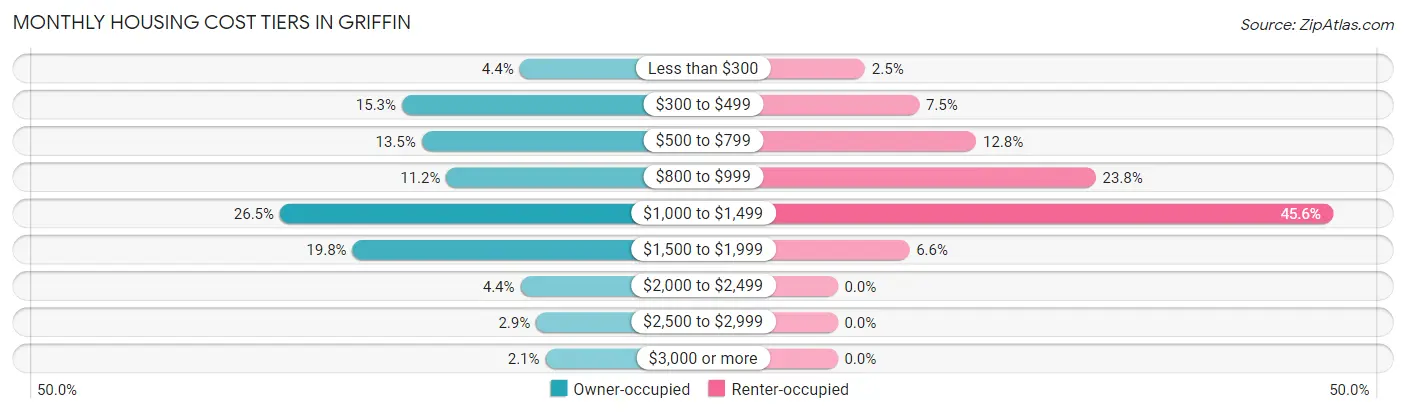
| Monthly Cost | Owner-occupied | Renter-occupied |
| Less than $300 | 166 (4.4%) | 155 (2.5%) |
| $300 to $499 | 571 (15.3%) | 460 (7.5%) |
| $500 to $799 | 503 (13.5%) | 782 (12.8%) |
| $800 to $999 | 418 (11.2%) | 1,456 (23.8%) |
| $1,000 to $1,499 | 991 (26.5%) | 2,794 (45.6%) |
| $1,500 to $1,999 | 741 (19.8%) | 405 (6.6%) |
| $2,000 to $2,499 | 163 (4.4%) | 0 (0.0%) |
| $2,500 to $2,999 | 109 (2.9%) | 0 (0.0%) |
| $3,000 or more | 77 (2.1%) | 0 (0.0%) |
| Total | 3,739 (100.0%) | 6,129 (100.0%) |
Physical Housing Characteristics in Griffin
Housing Structures in Griffin
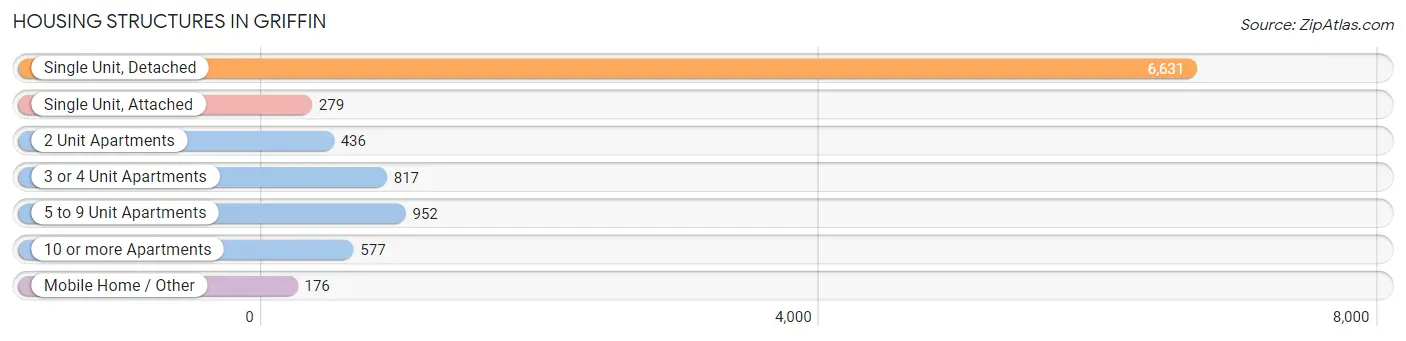
| Structure Type | # Housing Units | % Housing Units |
| Single Unit, Detached | 6,631 | 67.2% |
| Single Unit, Attached | 279 | 2.8% |
| 2 Unit Apartments | 436 | 4.4% |
| 3 or 4 Unit Apartments | 817 | 8.3% |
| 5 to 9 Unit Apartments | 952 | 9.7% |
| 10 or more Apartments | 577 | 5.9% |
| Mobile Home / Other | 176 | 1.8% |
| Total | 9,868 | 100.0% |
Housing Structures by Occupancy in Griffin
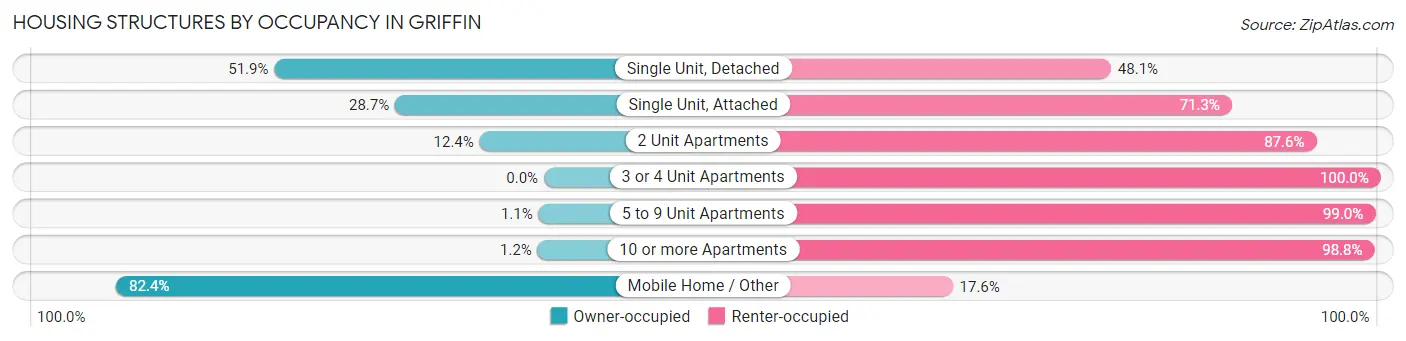
| Structure Type | Owner-occupied | Renter-occupied |
| Single Unit, Detached | 3,443 (51.9%) | 3,188 (48.1%) |
| Single Unit, Attached | 80 (28.7%) | 199 (71.3%) |
| 2 Unit Apartments | 54 (12.4%) | 382 (87.6%) |
| 3 or 4 Unit Apartments | 0 (0.0%) | 817 (100.0%) |
| 5 to 9 Unit Apartments | 10 (1.1%) | 942 (99.0%) |
| 10 or more Apartments | 7 (1.2%) | 570 (98.8%) |
| Mobile Home / Other | 145 (82.4%) | 31 (17.6%) |
| Total | 3,739 (37.9%) | 6,129 (62.1%) |
Housing Structures by Number of Rooms in Griffin
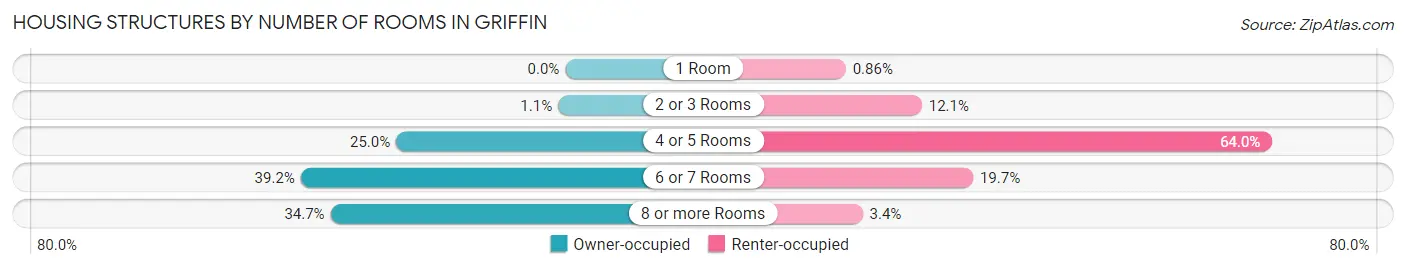
| Number of Rooms | Owner-occupied | Renter-occupied |
| 1 Room | 0 (0.0%) | 53 (0.9%) |
| 2 or 3 Rooms | 40 (1.1%) | 743 (12.1%) |
| 4 or 5 Rooms | 936 (25.0%) | 3,920 (64.0%) |
| 6 or 7 Rooms | 1,464 (39.2%) | 1,207 (19.7%) |
| 8 or more Rooms | 1,299 (34.7%) | 206 (3.4%) |
| Total | 3,739 (100.0%) | 6,129 (100.0%) |
Housing Structure by Heating Type in Griffin
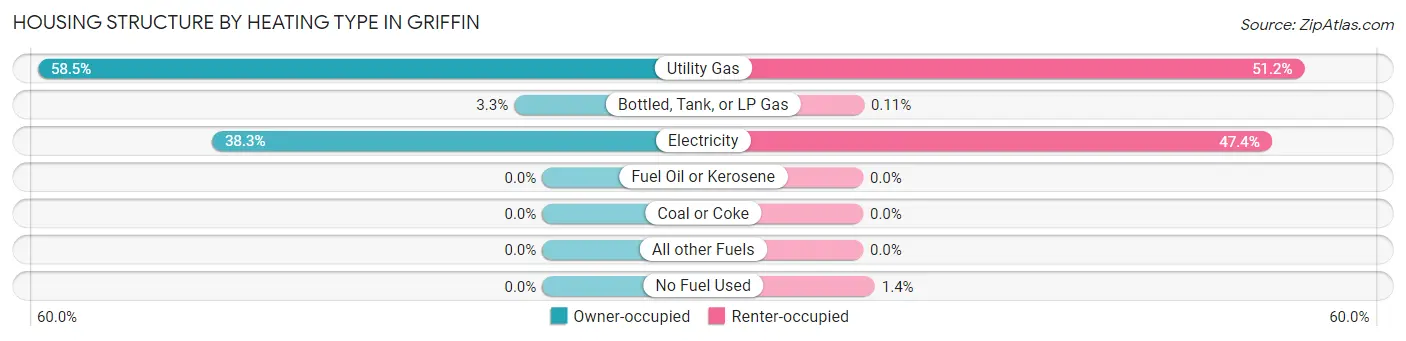
| Heating Type | Owner-occupied | Renter-occupied |
| Utility Gas | 2,186 (58.5%) | 3,135 (51.1%) |
| Bottled, Tank, or LP Gas | 122 (3.3%) | 7 (0.1%) |
| Electricity | 1,431 (38.3%) | 2,903 (47.4%) |
| Fuel Oil or Kerosene | 0 (0.0%) | 0 (0.0%) |
| Coal or Coke | 0 (0.0%) | 0 (0.0%) |
| All other Fuels | 0 (0.0%) | 0 (0.0%) |
| No Fuel Used | 0 (0.0%) | 84 (1.4%) |
| Total | 3,739 (100.0%) | 6,129 (100.0%) |
Household Vehicle Usage in Griffin
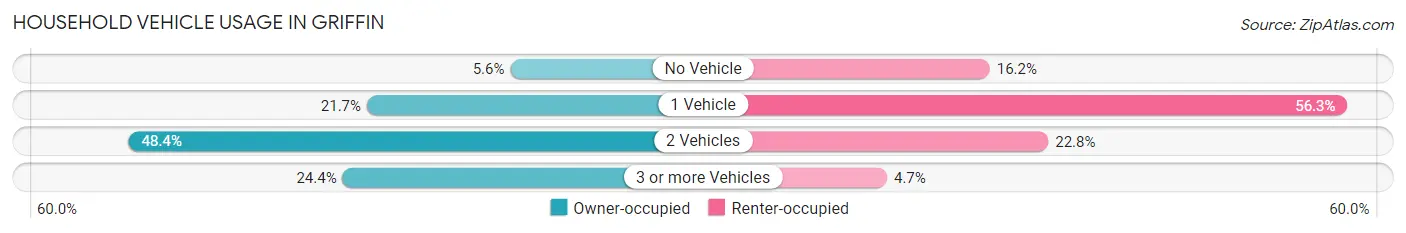
| Vehicles per Household | Owner-occupied | Renter-occupied |
| No Vehicle | 209 (5.6%) | 995 (16.2%) |
| 1 Vehicle | 810 (21.7%) | 3,449 (56.3%) |
| 2 Vehicles | 1,808 (48.4%) | 1,396 (22.8%) |
| 3 or more Vehicles | 912 (24.4%) | 289 (4.7%) |
| Total | 3,739 (100.0%) | 6,129 (100.0%) |
Real Estate & Mortgages in Griffin
Real Estate and Mortgage Overview in Griffin
| Characteristic | Without Mortgage | With Mortgage |
| Housing Units | 1,449 | 2,290 |
| Median Property Value | $139,600 | $205,100 |
| Median Household Income | $60,346 | $540 |
| Monthly Housing Costs | $498 | $75 |
| Real Estate Taxes | $1,114 | $0 |
Property Value by Mortgage Status in Griffin
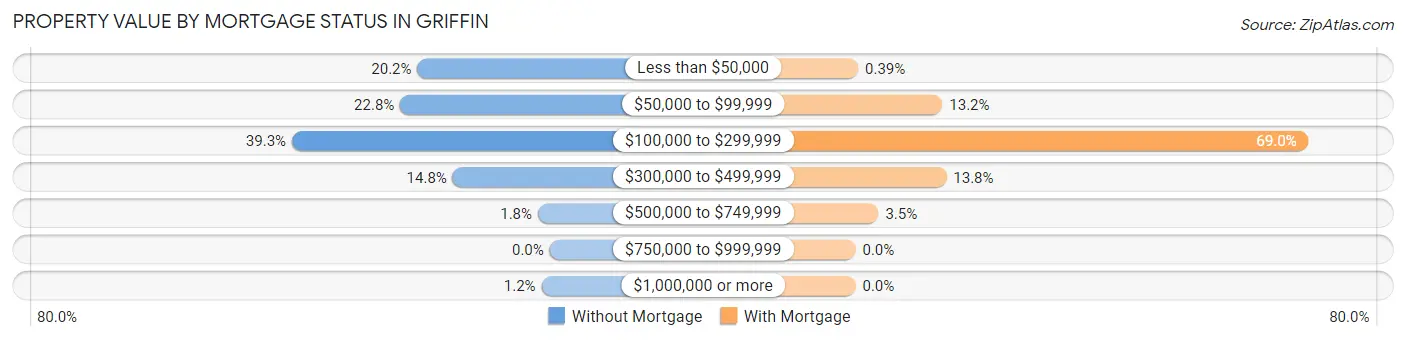
| Property Value | Without Mortgage | With Mortgage |
| Less than $50,000 | 292 (20.2%) | 9 (0.4%) |
| $50,000 to $99,999 | 330 (22.8%) | 303 (13.2%) |
| $100,000 to $299,999 | 569 (39.3%) | 1,581 (69.0%) |
| $300,000 to $499,999 | 214 (14.8%) | 317 (13.8%) |
| $500,000 to $749,999 | 26 (1.8%) | 80 (3.5%) |
| $750,000 to $999,999 | 0 (0.0%) | 0 (0.0%) |
| $1,000,000 or more | 18 (1.2%) | 0 (0.0%) |
| Total | 1,449 (100.0%) | 2,290 (100.0%) |
Household Income by Mortgage Status in Griffin
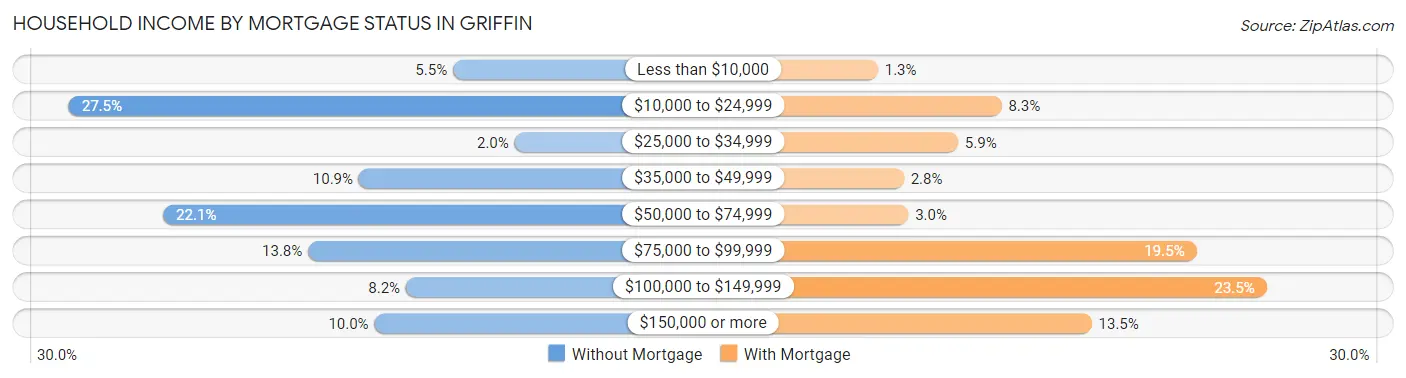
| Household Income | Without Mortgage | With Mortgage |
| Less than $10,000 | 80 (5.5%) | 29 (1.3%) |
| $10,000 to $24,999 | 398 (27.5%) | 191 (8.3%) |
| $25,000 to $34,999 | 29 (2.0%) | 134 (5.9%) |
| $35,000 to $49,999 | 158 (10.9%) | 63 (2.8%) |
| $50,000 to $74,999 | 320 (22.1%) | 69 (3.0%) |
| $75,000 to $99,999 | 200 (13.8%) | 446 (19.5%) |
| $100,000 to $149,999 | 119 (8.2%) | 538 (23.5%) |
| $150,000 or more | 145 (10.0%) | 309 (13.5%) |
| Total | 1,449 (100.0%) | 2,290 (100.0%) |
Property Value to Household Income Ratio in Griffin
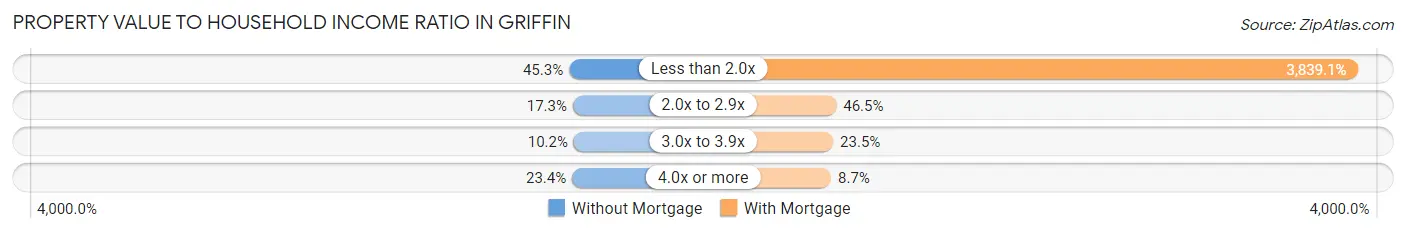
| Value-to-Income Ratio | Without Mortgage | With Mortgage |
| Less than 2.0x | 657 (45.3%) | 87,915 (3,839.1%) |
| 2.0x to 2.9x | 251 (17.3%) | 1,065 (46.5%) |
| 3.0x to 3.9x | 148 (10.2%) | 538 (23.5%) |
| 4.0x or more | 339 (23.4%) | 200 (8.7%) |
| Total | 1,449 (100.0%) | 2,290 (100.0%) |
Real Estate Taxes by Mortgage Status in Griffin
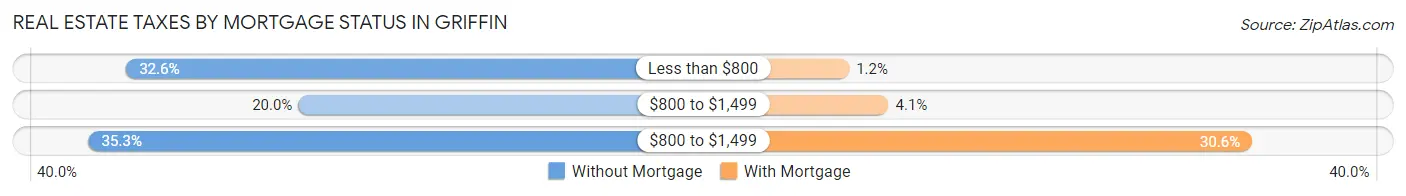
| Property Taxes | Without Mortgage | With Mortgage |
| Less than $800 | 472 (32.6%) | 27 (1.2%) |
| $800 to $1,499 | 290 (20.0%) | 93 (4.1%) |
| $800 to $1,499 | 512 (35.3%) | 701 (30.6%) |
| Total | 1,449 (100.0%) | 2,290 (100.0%) |
Health & Disability in Griffin
Health Insurance Coverage by Age in Griffin
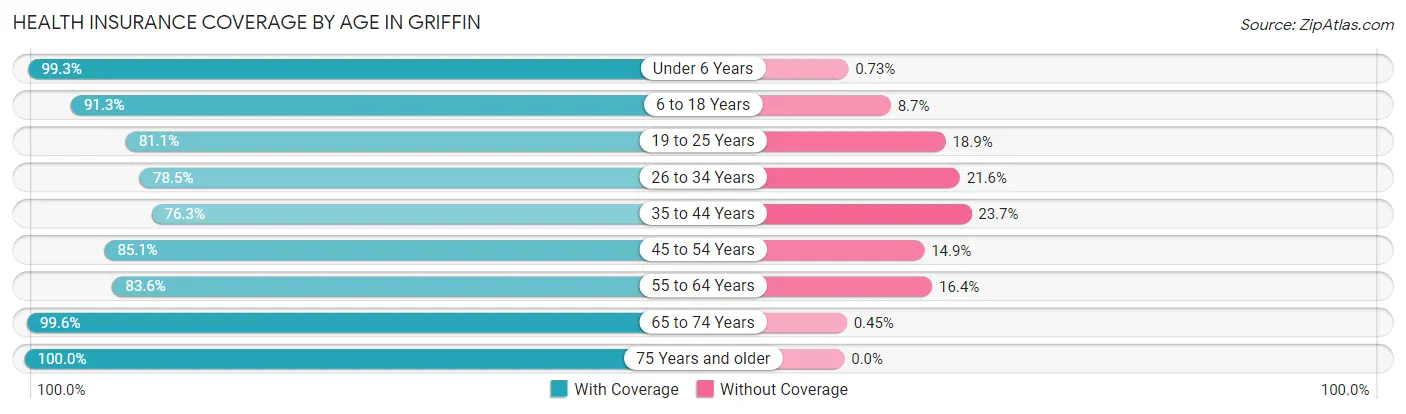
| Age Bracket | With Coverage | Without Coverage |
| Under 6 Years | 2,164 (99.3%) | 16 (0.7%) |
| 6 to 18 Years | 3,479 (91.3%) | 330 (8.7%) |
| 19 to 25 Years | 1,918 (81.1%) | 446 (18.9%) |
| 26 to 34 Years | 3,026 (78.4%) | 831 (21.5%) |
| 35 to 44 Years | 1,969 (76.3%) | 611 (23.7%) |
| 45 to 54 Years | 2,651 (85.1%) | 464 (14.9%) |
| 55 to 64 Years | 2,021 (83.6%) | 396 (16.4%) |
| 65 to 74 Years | 1,987 (99.6%) | 9 (0.4%) |
| 75 Years and older | 948 (100.0%) | 0 (0.0%) |
| Total | 20,163 (86.7%) | 3,103 (13.3%) |
Health Insurance Coverage by Citizenship Status in Griffin
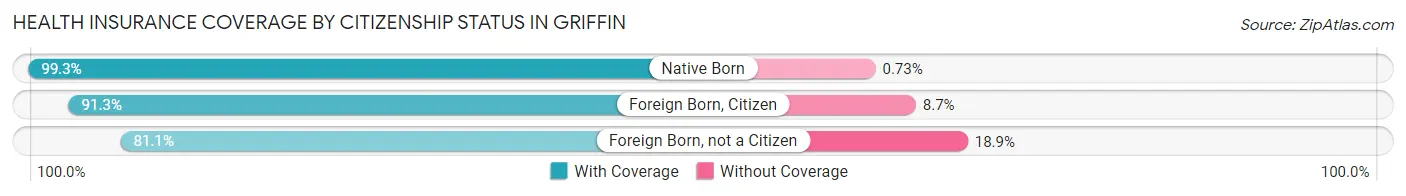
| Citizenship Status | With Coverage | Without Coverage |
| Native Born | 2,164 (99.3%) | 16 (0.7%) |
| Foreign Born, Citizen | 3,479 (91.3%) | 330 (8.7%) |
| Foreign Born, not a Citizen | 1,918 (81.1%) | 446 (18.9%) |
Health Insurance Coverage by Household Income in Griffin
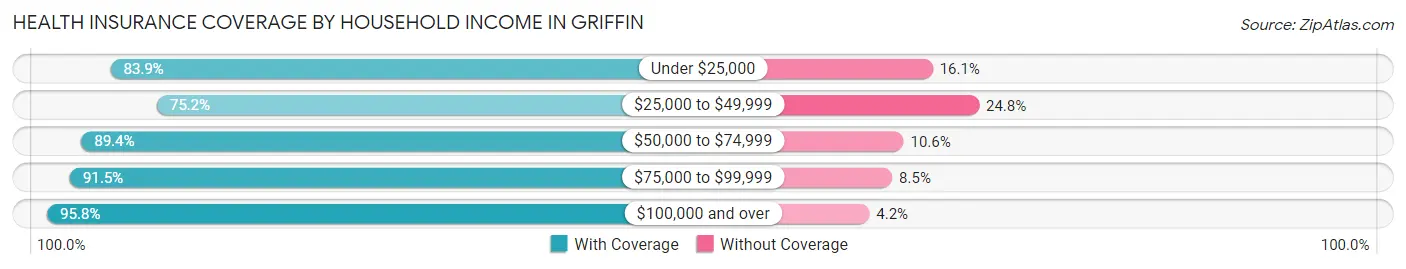
| Household Income | With Coverage | Without Coverage |
| Under $25,000 | 5,326 (83.9%) | 1,021 (16.1%) |
| $25,000 to $49,999 | 3,365 (75.2%) | 1,108 (24.8%) |
| $50,000 to $74,999 | 4,093 (89.4%) | 487 (10.6%) |
| $75,000 to $99,999 | 3,100 (91.5%) | 288 (8.5%) |
| $100,000 and over | 4,178 (95.8%) | 184 (4.2%) |
Public vs Private Health Insurance Coverage by Age in Griffin
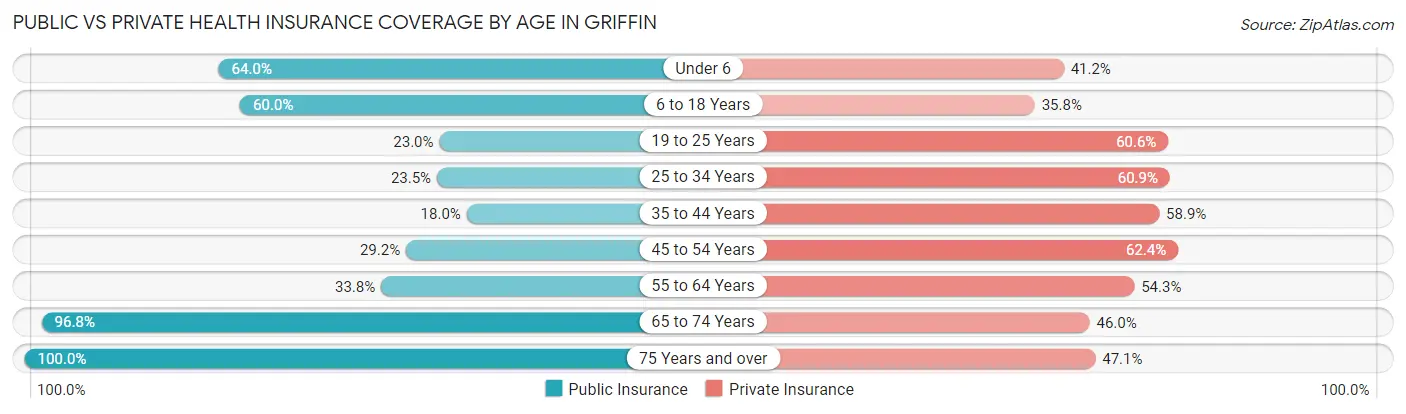
| Age Bracket | Public Insurance | Private Insurance |
| Under 6 | 1,395 (64.0%) | 898 (41.2%) |
| 6 to 18 Years | 2,286 (60.0%) | 1,364 (35.8%) |
| 19 to 25 Years | 544 (23.0%) | 1,432 (60.6%) |
| 25 to 34 Years | 905 (23.5%) | 2,348 (60.9%) |
| 35 to 44 Years | 463 (17.9%) | 1,520 (58.9%) |
| 45 to 54 Years | 910 (29.2%) | 1,944 (62.4%) |
| 55 to 64 Years | 818 (33.8%) | 1,312 (54.3%) |
| 65 to 74 Years | 1,933 (96.8%) | 918 (46.0%) |
| 75 Years and over | 948 (100.0%) | 446 (47.0%) |
| Total | 10,202 (43.9%) | 12,182 (52.4%) |
Disability Status by Sex by Age in Griffin
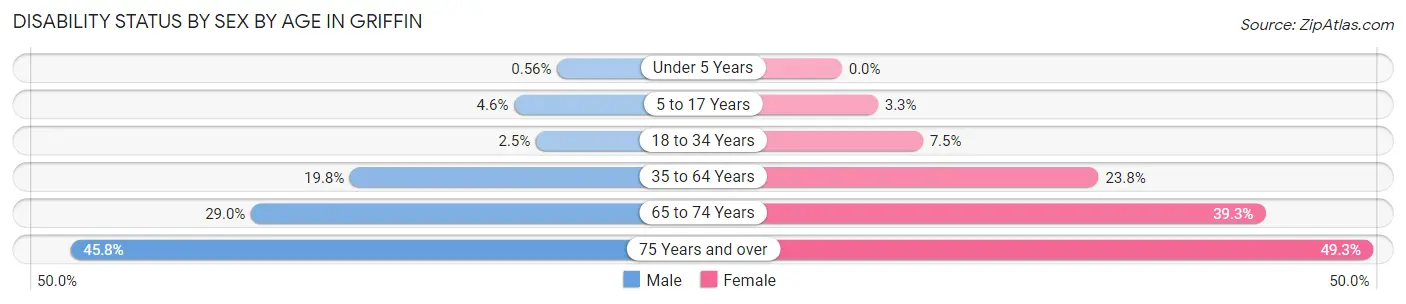
| Age Bracket | Male | Female |
| Under 5 Years | 6 (0.6%) | 0 (0.0%) |
| 5 to 17 Years | 100 (4.6%) | 61 (3.3%) |
| 18 to 34 Years | 76 (2.5%) | 250 (7.5%) |
| 35 to 64 Years | 739 (19.8%) | 1,043 (23.8%) |
| 65 to 74 Years | 259 (29.0%) | 433 (39.3%) |
| 75 Years and over | 183 (45.8%) | 270 (49.3%) |
Disability Class by Sex by Age in Griffin
Disability Class: Hearing Difficulty
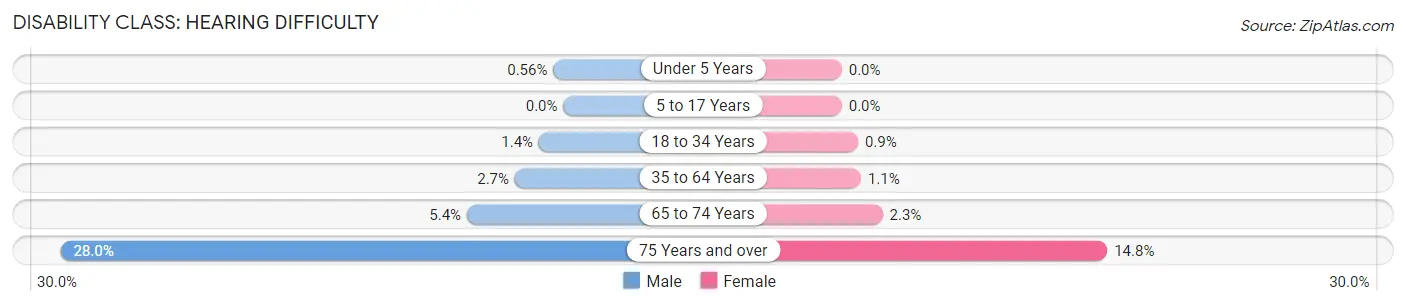
| Age Bracket | Male | Female |
| Under 5 Years | 6 (0.6%) | 0 (0.0%) |
| 5 to 17 Years | 0 (0.0%) | 0 (0.0%) |
| 18 to 34 Years | 41 (1.4%) | 30 (0.9%) |
| 35 to 64 Years | 101 (2.7%) | 47 (1.1%) |
| 65 to 74 Years | 48 (5.4%) | 25 (2.3%) |
| 75 Years and over | 112 (28.0%) | 81 (14.8%) |
Disability Class: Vision Difficulty
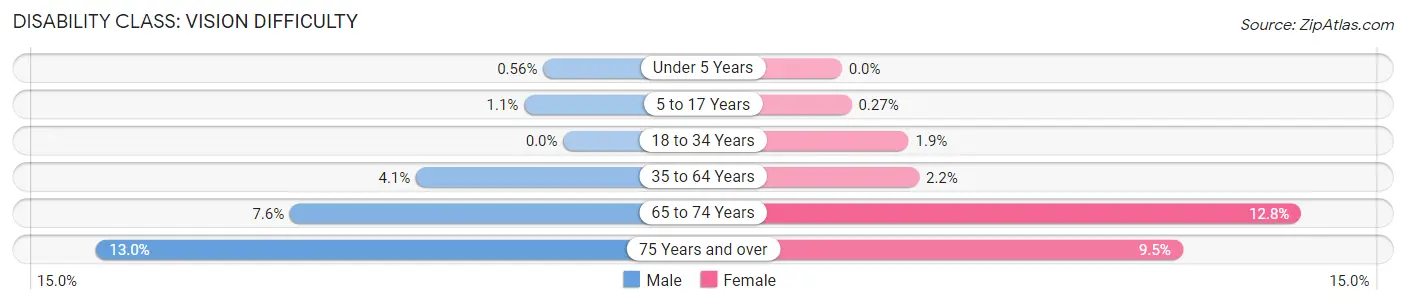
| Age Bracket | Male | Female |
| Under 5 Years | 6 (0.6%) | 0 (0.0%) |
| 5 to 17 Years | 24 (1.1%) | 5 (0.3%) |
| 18 to 34 Years | 0 (0.0%) | 62 (1.9%) |
| 35 to 64 Years | 153 (4.1%) | 94 (2.1%) |
| 65 to 74 Years | 68 (7.6%) | 141 (12.8%) |
| 75 Years and over | 52 (13.0%) | 52 (9.5%) |
Disability Class: Cognitive Difficulty
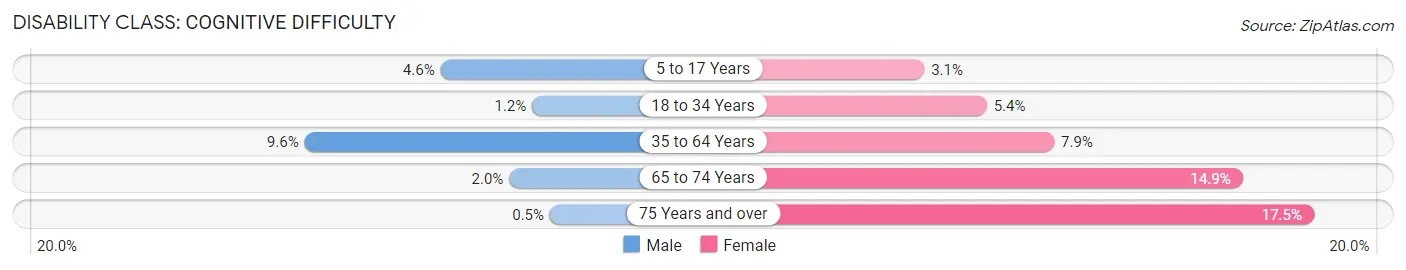
| Age Bracket | Male | Female |
| 5 to 17 Years | 100 (4.6%) | 56 (3.1%) |
| 18 to 34 Years | 35 (1.2%) | 179 (5.4%) |
| 35 to 64 Years | 359 (9.6%) | 345 (7.9%) |
| 65 to 74 Years | 18 (2.0%) | 164 (14.9%) |
| 75 Years and over | 2 (0.5%) | 96 (17.5%) |
Disability Class: Ambulatory Difficulty
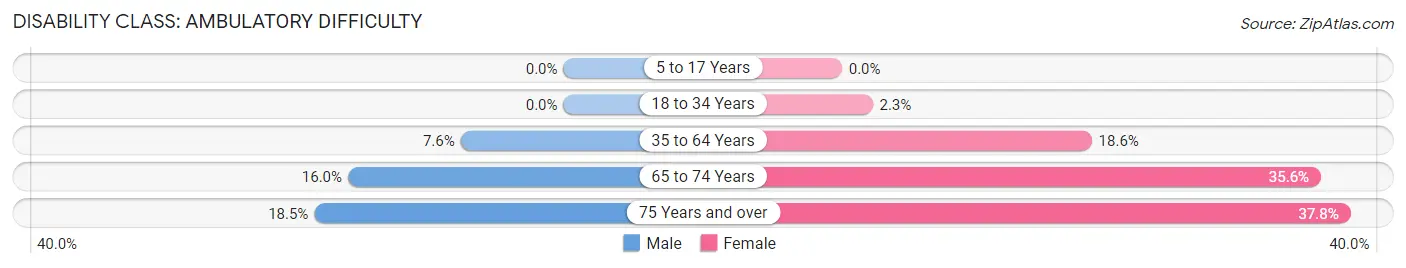
| Age Bracket | Male | Female |
| 5 to 17 Years | 0 (0.0%) | 0 (0.0%) |
| 18 to 34 Years | 0 (0.0%) | 76 (2.3%) |
| 35 to 64 Years | 285 (7.6%) | 812 (18.5%) |
| 65 to 74 Years | 143 (16.0%) | 392 (35.6%) |
| 75 Years and over | 74 (18.5%) | 207 (37.8%) |
Disability Class: Self-Care Difficulty
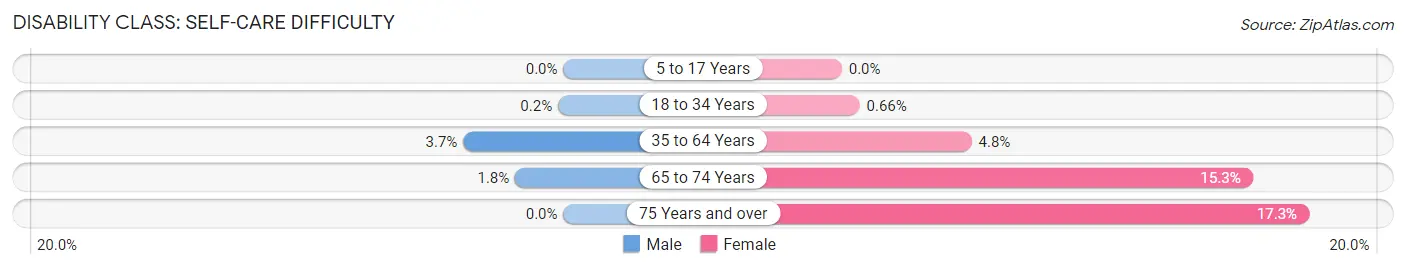
| Age Bracket | Male | Female |
| 5 to 17 Years | 0 (0.0%) | 0 (0.0%) |
| 18 to 34 Years | 6 (0.2%) | 22 (0.7%) |
| 35 to 64 Years | 139 (3.7%) | 211 (4.8%) |
| 65 to 74 Years | 16 (1.8%) | 168 (15.2%) |
| 75 Years and over | 0 (0.0%) | 95 (17.3%) |
Technology Access in Griffin
Computing Device Access in Griffin
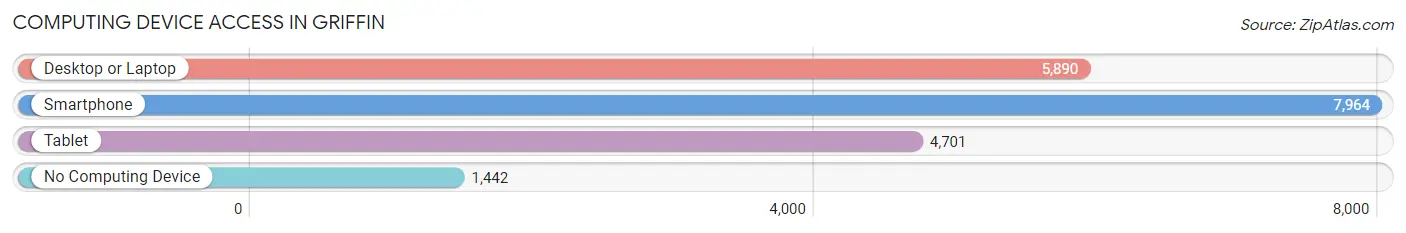
| Device Type | # Households | % Households |
| Desktop or Laptop | 5,890 | 59.7% |
| Smartphone | 7,964 | 80.7% |
| Tablet | 4,701 | 47.6% |
| No Computing Device | 1,442 | 14.6% |
| Total | 9,868 | 100.0% |
Internet Access in Griffin
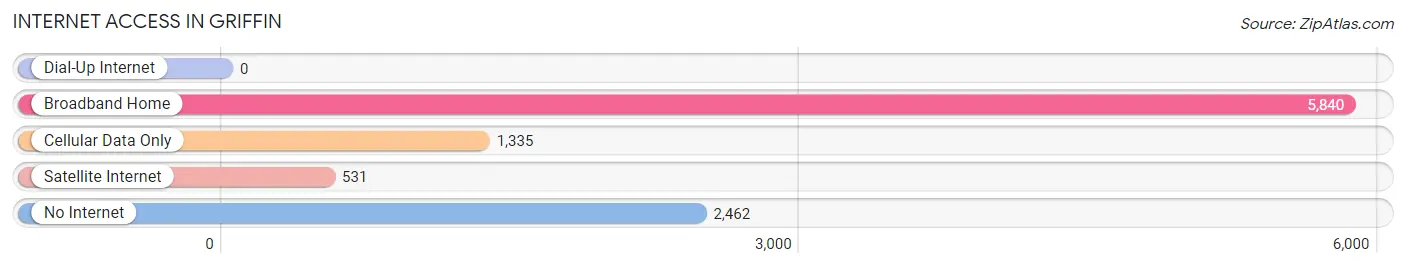
| Internet Type | # Households | % Households |
| Dial-Up Internet | 0 | 0.0% |
| Broadband Home | 5,840 | 59.2% |
| Cellular Data Only | 1,335 | 13.5% |
| Satellite Internet | 531 | 5.4% |
| No Internet | 2,462 | 24.9% |
| Total | 9,868 | 100.0% |
Griffin Summary
Griffin, Georgia is a city located in Spalding County, Georgia, United States. It is the county seat of Spalding County and is part of the Atlanta metropolitan area. The population was 23,451 at the 2010 census.
History
Griffin was founded in 1840 by James M. Griffin, who named the city after his father, James Griffin. The city was incorporated in 1843 and became the county seat of Spalding County in 1851.
Griffin was a major center of cotton production and processing in the late 19th and early 20th centuries. The city was home to several cotton mills, including the Griffin Cotton Mill, which was the largest cotton mill in the world at the time of its construction in 1882. The city was also home to several other industries, including a large brick manufacturing plant and a large shoe factory.
Geography
Griffin is located at 33°14'45" North, 84°16'17" West (33.245833, -84.271444). According to the United States Census Bureau, the city has a total area of 16.2 square miles (41.8 km2), of which 16.1 square miles (41.6 km2) is land and 0.1 square miles (0.2 km2) is water.
Economy
Griffin is home to several major employers, including the Griffin-Spalding County School System, the City of Griffin, Piedmont Henry Hospital, and the Griffin-Spalding County Chamber of Commerce. The city is also home to several manufacturing companies, including Griffin Industries, a manufacturer of plastic products, and Griffin Textiles, a manufacturer of apparel and home furnishings.
Demographics
As of the 2010 census, there were 23,451 people, 8,845 households, and 5,845 families residing in the city. The population density was 1,456.2 people per square mile (563.3/km2). There were 9,845 housing units at an average density of 609.7 per square mile (235.2/km2). The racial makeup of the city was 54.2% White, 39.7% African American, 0.3% Native American, 1.2% Asian, 0.1% Pacific Islander, 2.7% from other races, and 2.0% from two or more races. Hispanic or Latino of any race were 5.7% of the population.
There were 8,845 households, out of which 33.2% had children under the age of 18 living with them, 41.2% were married couples living together, 21.2% had a female householder with no husband present, and 32.3% were non-families. 27.2% of all households were made up of individuals, and 10.7% had someone living alone who was 65 years of age or older. The average household size was 2.60 and the average family size was 3.17.
In the city, the population was spread out, with 27.2% under the age of 18, 9.2% from 18 to 24, 28.7% from 25 to 44, 21.3% from 45 to 64, and 13.6% who were 65 years of age or older. The median age was 34 years. For every 100 females, there were 88.3 males. For every 100 females age 18 and over, there were 83.2 males.
The median income for a household in the city was $33,902, and the median income for a family was $41,845. Males had a median income of $31,945 versus $25,845 for females. The per capita income for the city was $17,845. About 14.2% of families and 17.7% of the population were below the poverty line, including 25.2% of those under age 18 and 13.2% of those age 65 or over.
Common Questions
What is the Total Population of Griffin?
Total Population of Griffin is 23,485.
What is the Total Male Population of Griffin?
Total Male Population of Griffin is 11,356.
What is the Total Female Population of Griffin?
Total Female Population of Griffin is 12,129.
What is the Ratio of Males per 100 Females in Griffin?
There are 93.63 Males per 100 Females in Griffin.
What is the Ratio of Females per 100 Males in Griffin?
There are 106.81 Females per 100 Males in Griffin.
What is the Median Population Age in Griffin?
Median Population Age in Griffin is 33.2 Years.
What is the Average Family Size in Griffin
Average Family Size in Griffin is 3.0 People.
What is the Average Household Size in Griffin
Average Household Size in Griffin is 2.4 People.
What is Per Capita Income in Griffin?
Per Capita income in Griffin is $26,016.
What is the Median Family Income in Griffin?
Median Family Income in Griffin is $62,790.
What is the Median Household income in Griffin?
Median Household Income in Griffin is $42,047.
What is Income or Wage Gap in Griffin?
Income or Wage Gap in Griffin is 22.5%.
Women in Griffin earn 77.5 cents for every dollar earned by a man.
What is Family Income Deficit in Griffin?
Family Income Deficit in Griffin is $13,311.
Families that are below poverty line in Griffin earn $13,311 less on average than the poverty threshold level.
What is Inequality or Gini Index in Griffin?
Inequality or Gini Index in Griffin is 0.51.
How Large is the Labor Force in Griffin?
There are 10,746 People in the Labor Forcein in Griffin.
What is the Percentage of People in the Labor Force in Griffin?
59.3% of People are in the Labor Force in Griffin.
What is the Unemployment Rate in Griffin?
Unemployment Rate in Griffin is 5.5%.