Portuguese vs Immigrants from Honduras College, 1 year or more

COMPARE

Portuguese
Race
Ancestry
AfghanAfricanAlaska NativeAlaskan AthabascanAlbanianAleutAlsatianAmericanApacheArabArapahoArgentineanArmenianAssyrian/Chaldean/SyriacAustralianAustrianBahamianBangladeshiBarbadianBasqueBelgianBelizeanBermudanBhutaneseBlackfeetBolivianBrazilianBritishBritish West IndianBulgarianBurmeseCajunCambodianCanadianCape VerdeanCarpatho RusynCelticCentral AmericanCentral American IndianCherokeeCheyenneChickasawChileanChineseChippewaChoctawColombianColvilleComancheCosta RicanCreeCreekCroatianCrowCubanCypriotCzechCzechoslovakianDanishDelawareDominicanDutchDutch West IndianEastern EuropeanEcuadorianEgyptianEnglishEstonianEthiopianEuropeanFijianFilipinoFinnishFrenchFrench American IndianFrench CanadianGermanGerman RussianGhanaianGreekGuamanian/ChamorroGuatemalanGuyaneseHaitianHmongHonduranHopiHoumaHungarianIcelanderIndian (Asian)IndonesianInupiatIranianIraqiIrishIroquoisIsraeliItalianJamaicanJapaneseJordanianKenyanKiowaKoreanLaotianLatvianLebaneseLiberianLithuanianLumbeeLuxembourgerMacedonianMalaysianMalteseMarshalleseMenomineeMexicanMexican American IndianMongolianMoroccanNative HawaiianNavajoNepaleseNew ZealanderNicaraguanNigerianNorthern EuropeanNorwegianOkinawanOsageOttawaPaiutePakistaniPalestinianPanamanianParaguayanPennsylvania GermanPeruvianPimaPolishPortuguesePotawatomiPuebloPuerto RicanPuget Sound SalishRomanianRussianSalvadoranSamoanScandinavianScotch-IrishScottishSeminoleSenegaleseSerbianShoshoneSierra LeoneanSiouxSlavicSlovakSloveneSomaliSouth AfricanSouth AmericanSouth American IndianSoviet UnionSpaniardSpanishSpanish AmericanSpanish American IndianSri LankanSubsaharan AfricanSudaneseSwedishSwissSyrianTaiwaneseThaiTlingit-HaidaTohono O'OdhamTonganTrinidadian and TobagonianTsimshianTurkishU.S. Virgin IslanderUgandanUkrainianUruguayanUteVenezuelanVietnameseWelshWest IndianYakamaYaquiYugoslavianYumanYup'ikZimbabwean
Immigration
NonimmigrantsImmigrantsAfghanistanAfricaAlbaniaArgentinaArmeniaAsiaAustraliaAustriaBahamasBangladeshBarbadosBelarusBelgiumBelizeBoliviaBosnia and HerzegovinaBrazilBulgariaBurma/MyanmarCabo VerdeCambodiaCameroonCanadaCaribbeanCentral AmericaChileChinaColombiaCongoCosta RicaCroatiaCubaCzechoslovakiaDenmarkDominicaDominican RepublicEastern AfricaEastern AsiaEastern EuropeEcuadorEgyptEl SalvadorEnglandEritreaEthiopiaEuropeFijiFranceGermanyGhanaGreeceGrenadaGuatemalaGuyanaHaitiHong KongHungaryIndiaIndonesiaIranIraqIrelandIsraelItalyJamaicaJapanJordanKazakhstanKenyaKoreaKuwaitLaosLatin AmericaLatviaLebanonLiberiaLithuaniaMalaysiaMexicoMicronesiaMiddle AfricaMoldovaMoroccoNepalNetherlandsNicaraguaNigeriaNorth AmericaNorth MacedoniaNorthern AfricaNorthern EuropeNorwayOceaniaPakistanPanamaPeruPhilippinesPolandPortugalRomaniaRussiaSaudi ArabiaScotlandSenegalSerbiaSierra LeoneSingaporeSomaliaSouth AfricaSouth AmericaSouth Central AsiaSouth Eastern AsiaSouthern EuropeSpainSri LankaSt. Vincent and the GrenadinesSudanSwedenSwitzerlandSyriaTaiwanThailandTrinidad and TobagoTurkeyUgandaUkraineUruguayUzbekistanVenezuelaVietnamWest IndiesWestern AfricaWestern AsiaWestern EuropeYemenZaireZimbabweAzores
Immigrants from Honduras
Race
Ancestry
AfghanAfricanAlaska NativeAlaskan AthabascanAlbanianAleutAlsatianAmericanApacheArabArapahoArgentineanArmenianAssyrian/Chaldean/SyriacAustralianAustrianBahamianBangladeshiBarbadianBasqueBelgianBelizeanBermudanBhutaneseBlackfeetBolivianBrazilianBritishBritish West IndianBulgarianBurmeseCajunCambodianCanadianCape VerdeanCarpatho RusynCelticCentral AmericanCentral American IndianCherokeeCheyenneChickasawChileanChineseChippewaChoctawColombianColvilleComancheCosta RicanCreeCreekCroatianCrowCubanCypriotCzechCzechoslovakianDanishDelawareDominicanDutchDutch West IndianEastern EuropeanEcuadorianEgyptianEnglishEstonianEthiopianEuropeanFijianFilipinoFinnishFrenchFrench American IndianFrench CanadianGermanGerman RussianGhanaianGreekGuamanian/ChamorroGuatemalanGuyaneseHaitianHmongHonduranHopiHoumaHungarianIcelanderIndian (Asian)IndonesianInupiatIranianIraqiIrishIroquoisIsraeliItalianJamaicanJapaneseJordanianKenyanKiowaKoreanLaotianLatvianLebaneseLiberianLithuanianLumbeeLuxembourgerMacedonianMalaysianMalteseMarshalleseMenomineeMexicanMexican American IndianMongolianMoroccanNative HawaiianNavajoNepaleseNew ZealanderNicaraguanNigerianNorthern EuropeanNorwegianOkinawanOsageOttawaPaiutePakistaniPalestinianPanamanianParaguayanPennsylvania GermanPeruvianPimaPolishPotawatomiPuebloPuerto RicanPuget Sound SalishRomanianRussianSalvadoranSamoanScandinavianScotch-IrishScottishSeminoleSenegaleseSerbianShoshoneSierra LeoneanSiouxSlavicSlovakSloveneSomaliSouth AfricanSouth AmericanSouth American IndianSoviet UnionSpaniardSpanishSpanish AmericanSpanish American IndianSri LankanSubsaharan AfricanSudaneseSwedishSwissSyrianTaiwaneseThaiTlingit-HaidaTohono O'OdhamTonganTrinidadian and TobagonianTsimshianTurkishU.S. Virgin IslanderUgandanUkrainianUruguayanUteVenezuelanVietnameseWelshWest IndianYakamaYaquiYugoslavianYumanYup'ikZimbabwean
Immigration
NonimmigrantsImmigrantsAfghanistanAfricaAlbaniaArgentinaArmeniaAsiaAustraliaAustriaBahamasBangladeshBarbadosBelarusBelgiumBelizeBoliviaBosnia and HerzegovinaBrazilBulgariaBurma/MyanmarCabo VerdeCambodiaCameroonCanadaCaribbeanCentral AmericaChileChinaColombiaCongoCosta RicaCroatiaCubaCzechoslovakiaDenmarkDominicaDominican RepublicEastern AfricaEastern AsiaEastern EuropeEcuadorEgyptEl SalvadorEnglandEritreaEthiopiaEuropeFijiFranceGermanyGhanaGreeceGrenadaGuatemalaGuyanaHaitiHondurasHong KongHungaryIndiaIndonesiaIranIraqIrelandIsraelItalyJamaicaJapanJordanKazakhstanKenyaKoreaKuwaitLaosLatin AmericaLatviaLebanonLiberiaLithuaniaMalaysiaMexicoMicronesiaMiddle AfricaMoldovaMoroccoNepalNetherlandsNicaraguaNigeriaNorth AmericaNorth MacedoniaNorthern AfricaNorthern EuropeNorwayOceaniaPakistanPanamaPeruPhilippinesPolandPortugalRomaniaRussiaSaudi ArabiaScotlandSenegalSerbiaSierra LeoneSingaporeSomaliaSouth AfricaSouth AmericaSouth Central AsiaSouth Eastern AsiaSouthern EuropeSpainSri LankaSt. Vincent and the GrenadinesSudanSwedenSwitzerlandSyriaTaiwanThailandTrinidad and TobagoTurkeyUgandaUkraineUruguayUzbekistanVenezuelaVietnamWest IndiesWestern AfricaWestern AsiaWestern EuropeYemenZaireZimbabweAzores
College, 1 year or more
Income
Poverty
Unemployment
Labor Participation
Family Structure
Vehicle Availability
Education Level
Disability

College, 1 year or more Comparison

Portuguese

Immigrants from Honduras

Tragic
Tragic
57.2%
COLLEGE, 1 YEAR OR MORE
5.4/ 100
METRIC RATING
223rd/ 347
METRIC RANK
51.0%
COLLEGE, 1 YEAR OR MORE
0.0/ 100
METRIC RATING
318th/ 347
METRIC RANK

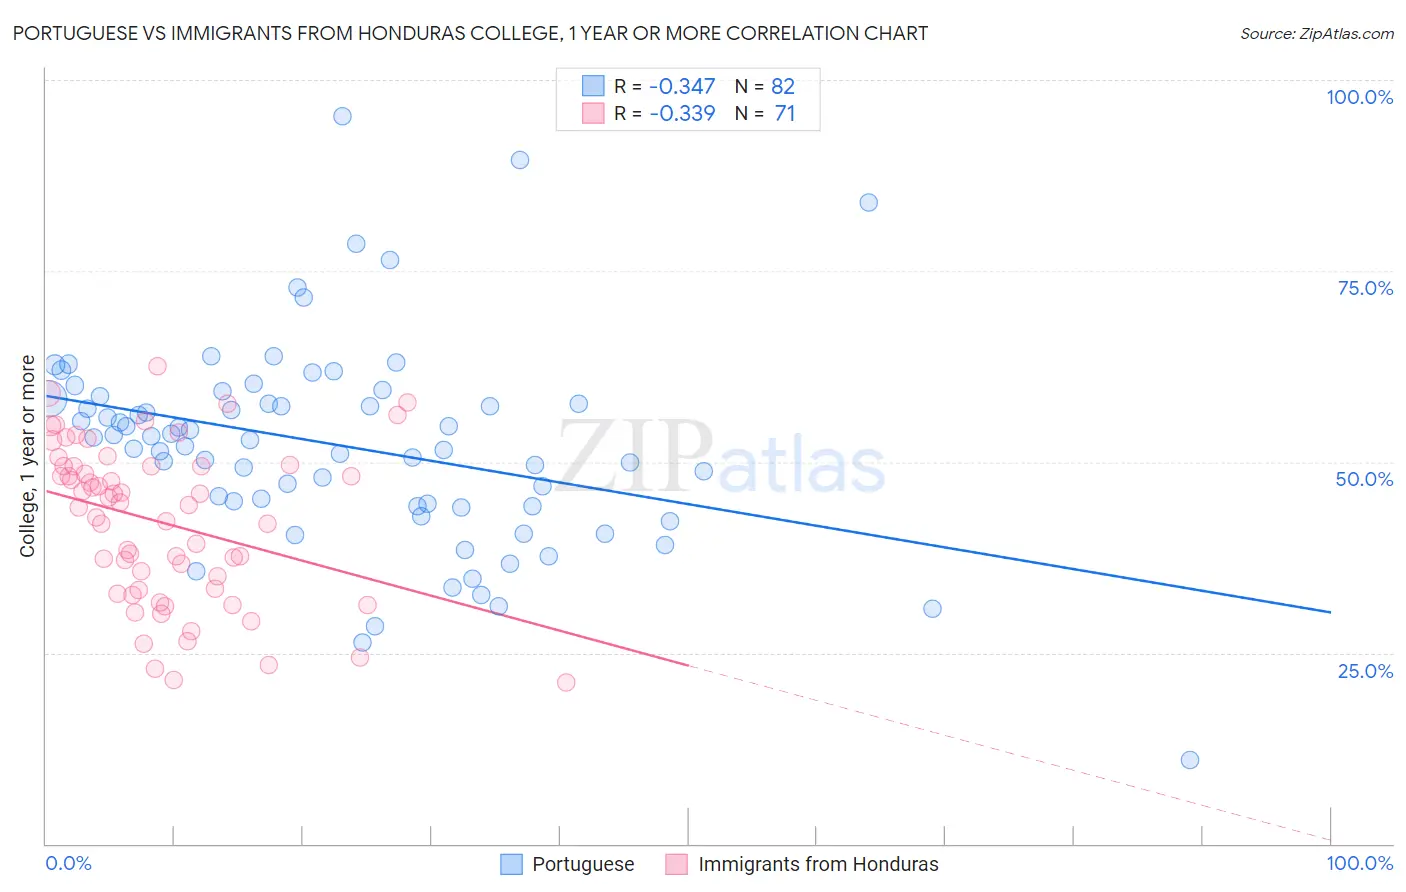
Portuguese vs Immigrants from Honduras College, 1 year or more Correlation Chart

The statistical analysis conducted on geographies consisting of 450,364,670 people shows a mild negative correlation between the proportion of Portuguese and percentage of population with at least college, 1 year or more education in the United States with a correlation coefficient (R) of -0.347 and weighted average of 57.2%. Similarly, the statistical analysis conducted on geographies consisting of 322,637,082 people shows a mild negative correlation between the proportion of Immigrants from Honduras and percentage of population with at least college, 1 year or more education in the United States with a correlation coefficient (R) of -0.339 and weighted average of 51.0%, a difference of 12.0%.
Portuguese vs Immigrants from Honduras College, 1 year or more

College, 1 year or more Correlation Summary

MeasurementPortugueseImmigrants from Honduras
Minimum11.0%21.2%
Maximum95.3%62.6%
Range84.4%41.4%
Mean52.1%42.0%
Median53.0%44.4%
Interquartile 25% (IQ1)44.2%33.2%
Interquartile 75% (IQ3)58.2%49.4%
Interquartile Range (IQR)14.0%16.3%
Standard Deviation (Sample)13.6%10.3%
Standard Deviation (Population)13.5%10.2%

Similar Demographics by College, 1 year or more

Demographics Similar to Portuguese by College, 1 year or more

In terms of college, 1 year or more, the demographic groups most similar to Portuguese are Hmong (57.2%, a difference of 0.0%), Subsaharan African (57.3%, a difference of 0.17%), Vietnamese (57.0%, a difference of 0.21%), Immigrants from Western Africa (57.0%, a difference of 0.23%), and Immigrants (57.0%, a difference of 0.30%).
DemographicsRating | RankCollege, 1 year or more
Immigrants | Peru
10.6
/100
|
#216
Poor
57.7%
Immigrants | Panama
9.1
/100
|
#217
Tragic
57.6%
Native Hawaiians
9.0
/100
|
#218
Tragic
57.6%
Whites/Caucasians
8.7
/100
|
#219
Tragic
57.6%
Immigrants | Costa Rica
8.0
/100
|
#220
Tragic
57.5%
Immigrants | Ghana
7.7
/100
|
#221
Tragic
57.4%
Sub-Saharan Africans
6.1
/100
|
#222
Tragic
57.3%
Portuguese
5.4
/100
|
#223
Tragic
57.2%
Hmong
5.4
/100
|
#224
Tragic
57.2%
Vietnamese
4.7
/100
|
#225
Tragic
57.0%
Immigrants | Western Africa
4.6
/100
|
#226
Tragic
57.0%
Immigrants | Immigrants
4.4
/100
|
#227
Tragic
57.0%
Immigrants | Fiji
4.0
/100
|
#228
Tragic
56.9%
Cree
3.6
/100
|
#229
Tragic
56.8%
Liberians
3.1
/100
|
#230
Tragic
56.7%

Demographics Similar to Immigrants from Honduras by College, 1 year or more

In terms of college, 1 year or more, the demographic groups most similar to Immigrants from Honduras are Immigrants from El Salvador (51.0%, a difference of 0.090%), Hispanic or Latino (51.1%, a difference of 0.13%), Kiowa (51.0%, a difference of 0.15%), Cajun (51.2%, a difference of 0.22%), and Hopi (50.9%, a difference of 0.27%).
DemographicsRating | RankCollege, 1 year or more
Immigrants | Haiti
0.0
/100
|
#311
Tragic
51.5%
Pueblo
0.0
/100
|
#312
Tragic
51.5%
Immigrants | Caribbean
0.0
/100
|
#313
Tragic
51.4%
Fijians
0.0
/100
|
#314
Tragic
51.3%
Guatemalans
0.0
/100
|
#315
Tragic
51.2%
Cajuns
0.0
/100
|
#316
Tragic
51.2%
Hispanics or Latinos
0.0
/100
|
#317
Tragic
51.1%
Immigrants | Honduras
0.0
/100
|
#318
Tragic
51.0%
Immigrants | El Salvador
0.0
/100
|
#319
Tragic
51.0%
Kiowa
0.0
/100
|
#320
Tragic
51.0%
Hopi
0.0
/100
|
#321
Tragic
50.9%
Navajo
0.0
/100
|
#322
Tragic
50.8%
Immigrants | Guatemala
0.0
/100
|
#323
Tragic
50.7%
Immigrants | Cuba
0.0
/100
|
#324
Tragic
50.7%
Immigrants | Latin America
0.0
/100
|
#325
Tragic
50.7%