Lionville, PA
Lionville Map
Lionville Overview
6,724
TOTAL POPULATION
3,397
MALE POPULATION
3,327
FEMALE POPULATION
102.10
MALES / 100 FEMALES
97.94
FEMALES / 100 MALES
41.0
MEDIAN AGE
3.0
AVG FAMILY SIZE
2.2
AVG HOUSEHOLD SIZE
$58,593
PER CAPITA INCOME
$128,068
AVG FAMILY INCOME
$103,156
AVG HOUSEHOLD INCOME
39.9%
WAGE / INCOME GAP [ % ]
60.1¢/ $1
WAGE / INCOME GAP [ $ ]
0.40
INEQUALITY / GINI INDEX
4,227
LABOR FORCE [ PEOPLE ]
77.2%
PERCENT IN LABOR FORCE
5.8%
UNEMPLOYMENT RATE
Lionville Area Codes
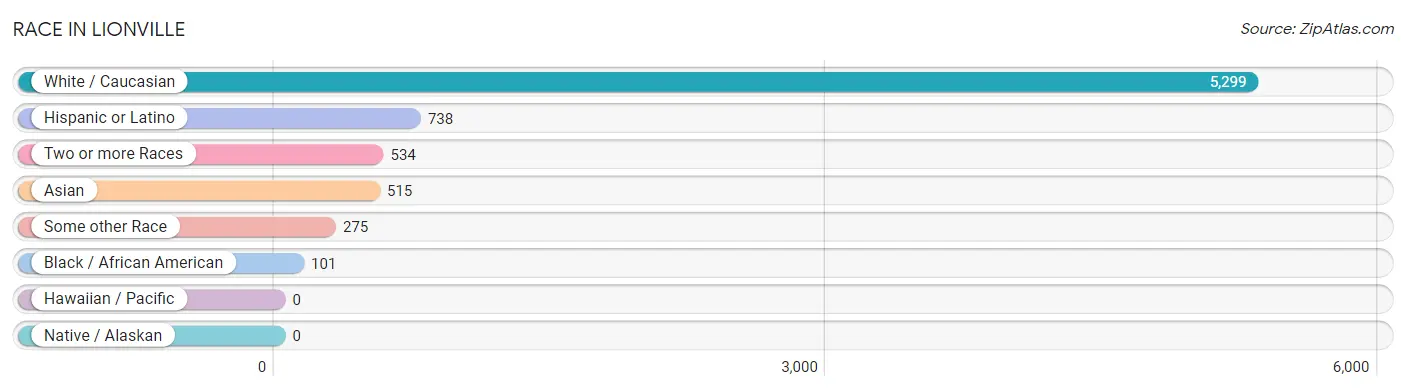
Race in Lionville
The most populous races in Lionville are White / Caucasian (5,299 | 78.8%), Hispanic or Latino (738 | 11.0%), and Two or more Races (534 | 7.9%).
| Race | # Population | % Population |
| Asian | 515 | 7.7% |
| Black / African American | 101 | 1.5% |
| Hawaiian / Pacific | 0 | 0.0% |
| Hispanic or Latino | 738 | 11.0% |
| Native / Alaskan | 0 | 0.0% |
| White / Caucasian | 5,299 | 78.8% |
| Two or more Races | 534 | 7.9% |
| Some other Race | 275 | 4.1% |
| Total | 6,724 | 100.0% |
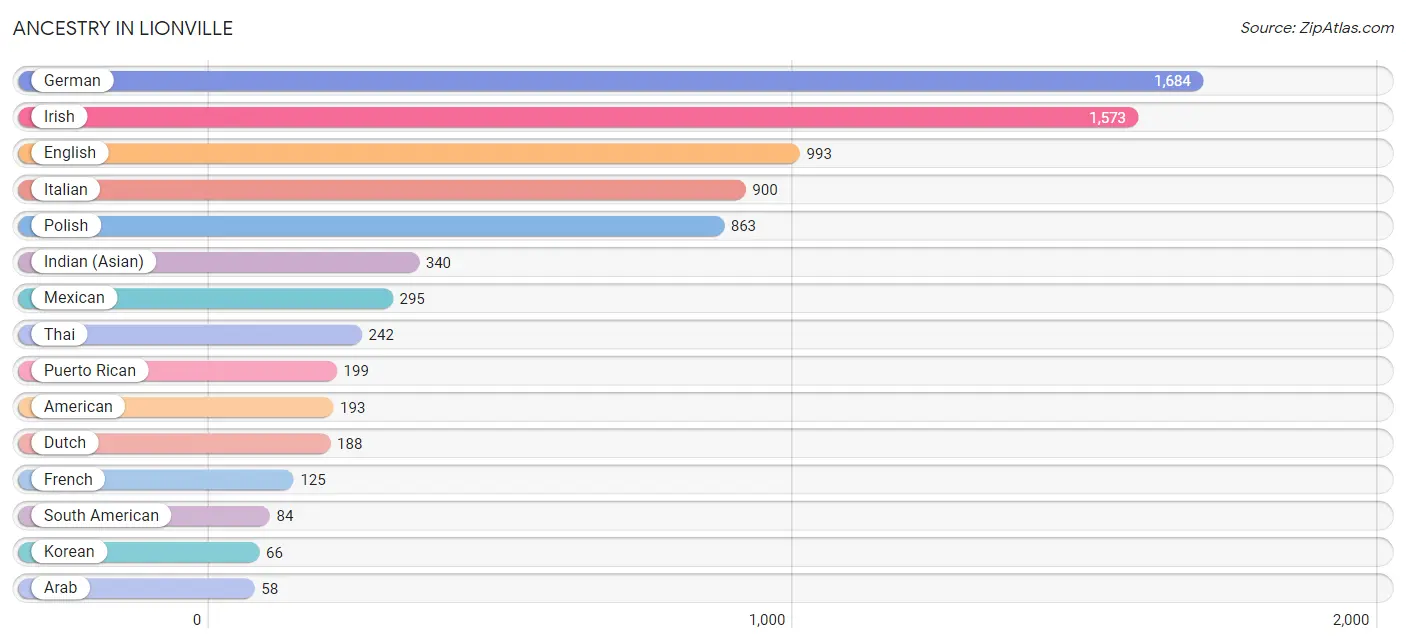
Ancestry in Lionville
The most populous ancestries reported in Lionville are German (1,684 | 25.0%), Irish (1,573 | 23.4%), English (993 | 14.8%), Italian (900 | 13.4%), and Polish (863 | 12.8%), together accounting for 89.4% of all Lionville residents.
| Ancestry | # Population | % Population |
| African | 28 | 0.4% |
| American | 193 | 2.9% |
| Arab | 58 | 0.9% |
| Argentinean | 35 | 0.5% |
| Armenian | 19 | 0.3% |
| Austrian | 38 | 0.6% |
| Brazilian | 8 | 0.1% |
| British | 9 | 0.1% |
| Canadian | 29 | 0.4% |
| Colombian | 34 | 0.5% |
| Cuban | 30 | 0.4% |
| Czech | 19 | 0.3% |
| Czechoslovakian | 15 | 0.2% |
| Danish | 6 | 0.1% |
| Dominican | 53 | 0.8% |
| Dutch | 188 | 2.8% |
| Eastern European | 43 | 0.6% |
| Ecuadorian | 15 | 0.2% |
| Egyptian | 37 | 0.5% |
| English | 993 | 14.8% |
| European | 48 | 0.7% |
| French | 125 | 1.9% |
| French Canadian | 15 | 0.2% |
| German | 1,684 | 25.0% |
| Greek | 13 | 0.2% |
| Hungarian | 27 | 0.4% |
| Indian (Asian) | 340 | 5.1% |
| Irish | 1,573 | 23.4% |
| Italian | 900 | 13.4% |
| Korean | 66 | 1.0% |
| Mexican | 295 | 4.4% |
| Native Hawaiian | 17 | 0.3% |
| Norwegian | 23 | 0.3% |
| Pennsylvania German | 29 | 0.4% |
| Pima | 54 | 0.8% |
| Polish | 863 | 12.8% |
| Puerto Rican | 199 | 3.0% |
| Russian | 41 | 0.6% |
| Scandinavian | 45 | 0.7% |
| Scotch-Irish | 21 | 0.3% |
| Scottish | 21 | 0.3% |
| Serbian | 15 | 0.2% |
| Slovak | 17 | 0.3% |
| Slovene | 21 | 0.3% |
| South American | 84 | 1.3% |
| Spaniard | 34 | 0.5% |
| Spanish | 43 | 0.6% |
| Subsaharan African | 28 | 0.4% |
| Swedish | 27 | 0.4% |
| Swiss | 15 | 0.2% |
| Thai | 242 | 3.6% |
| Trinidadian and Tobagonian | 51 | 0.8% |
| Ukrainian | 14 | 0.2% |
| Welsh | 25 | 0.4% | View All 54 Rows |
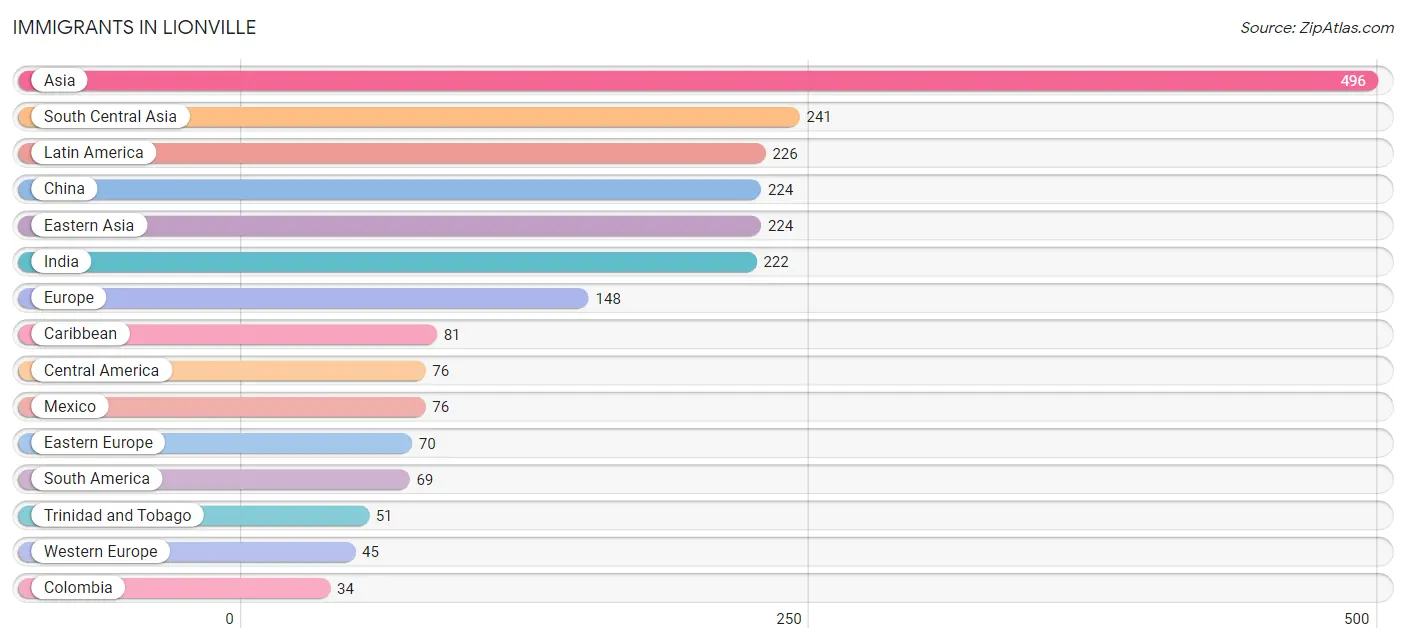
Immigrants in Lionville
The most numerous immigrant groups reported in Lionville came from Asia (496 | 7.4%), South Central Asia (241 | 3.6%), Latin America (226 | 3.4%), China (224 | 3.3%), and Eastern Asia (224 | 3.3%), together accounting for 21.0% of all Lionville residents.
| Immigration Origin | # Population | % Population |
| Africa | 24 | 0.4% |
| Argentina | 27 | 0.4% |
| Asia | 496 | 7.4% |
| Brazil | 8 | 0.1% |
| Canada | 29 | 0.4% |
| Caribbean | 81 | 1.2% |
| Central America | 76 | 1.1% |
| China | 224 | 3.3% |
| Colombia | 34 | 0.5% |
| Czechoslovakia | 16 | 0.2% |
| Dominican Republic | 30 | 0.4% |
| Eastern Asia | 224 | 3.3% |
| Eastern Europe | 70 | 1.0% |
| Egypt | 19 | 0.3% |
| Europe | 148 | 2.2% |
| Germany | 30 | 0.4% |
| India | 222 | 3.3% |
| Iran | 19 | 0.3% |
| Ireland | 10 | 0.2% |
| Israel | 7 | 0.1% |
| Latin America | 226 | 3.4% |
| Latvia | 14 | 0.2% |
| Mexico | 76 | 1.1% |
| Northern Africa | 19 | 0.3% |
| Northern Europe | 33 | 0.5% |
| Philippines | 24 | 0.4% |
| Poland | 14 | 0.2% |
| Russia | 26 | 0.4% |
| South Africa | 5 | 0.1% |
| South America | 69 | 1.0% |
| South Central Asia | 241 | 3.6% |
| South Eastern Asia | 24 | 0.4% |
| Switzerland | 15 | 0.2% |
| Trinidad and Tobago | 51 | 0.8% |
| Western Asia | 7 | 0.1% |
| Western Europe | 45 | 0.7% | View All 36 Rows |
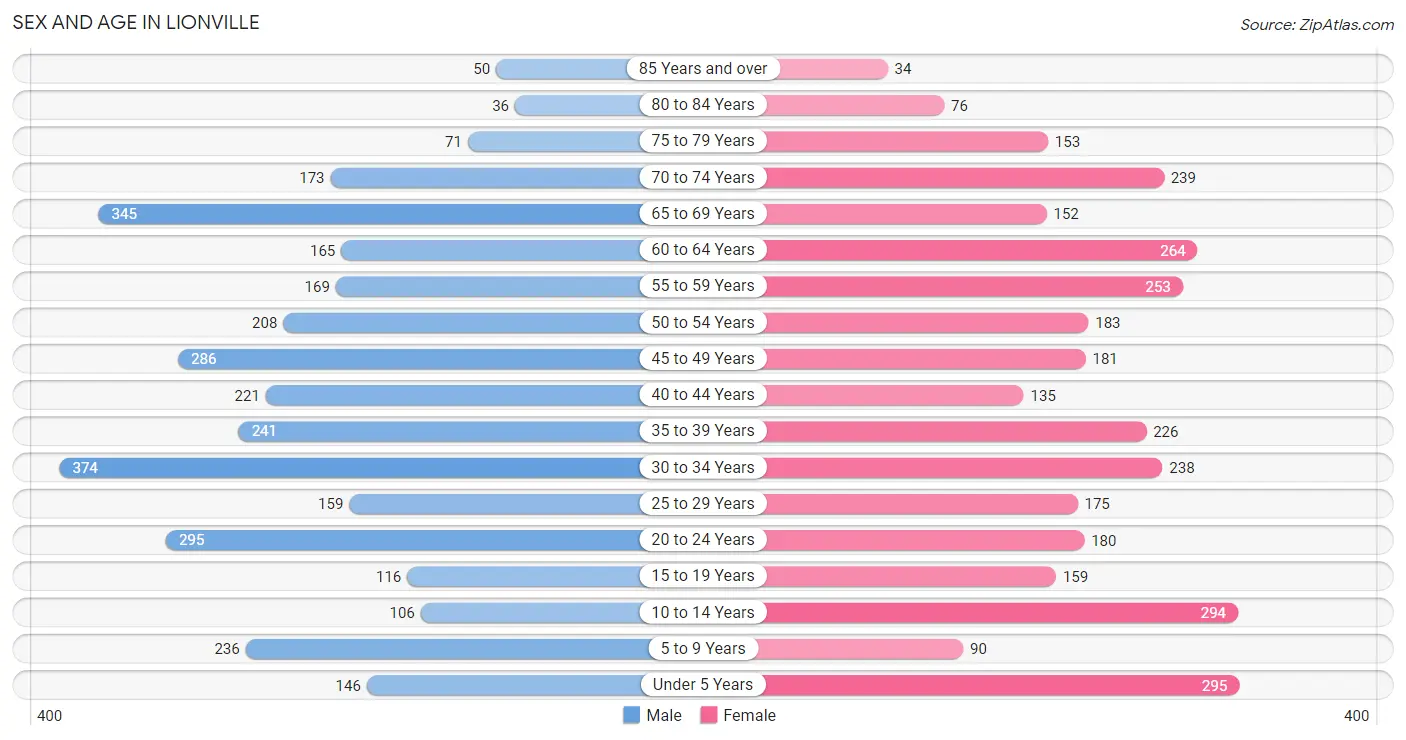
Sex and Age in Lionville
Sex and Age in Lionville
The most populous age groups in Lionville are 30 to 34 Years (374 | 11.0%) for men and Under 5 Years (295 | 8.9%) for women.
| Age Bracket | Male | Female |
| Under 5 Years | 146 (4.3%) | 295 (8.9%) |
| 5 to 9 Years | 236 (7.0%) | 90 (2.7%) |
| 10 to 14 Years | 106 (3.1%) | 294 (8.8%) |
| 15 to 19 Years | 116 (3.4%) | 159 (4.8%) |
| 20 to 24 Years | 295 (8.7%) | 180 (5.4%) |
| 25 to 29 Years | 159 (4.7%) | 175 (5.3%) |
| 30 to 34 Years | 374 (11.0%) | 238 (7.1%) |
| 35 to 39 Years | 241 (7.1%) | 226 (6.8%) |
| 40 to 44 Years | 221 (6.5%) | 135 (4.1%) |
| 45 to 49 Years | 286 (8.4%) | 181 (5.4%) |
| 50 to 54 Years | 208 (6.1%) | 183 (5.5%) |
| 55 to 59 Years | 169 (5.0%) | 253 (7.6%) |
| 60 to 64 Years | 165 (4.9%) | 264 (7.9%) |
| 65 to 69 Years | 345 (10.2%) | 152 (4.6%) |
| 70 to 74 Years | 173 (5.1%) | 239 (7.2%) |
| 75 to 79 Years | 71 (2.1%) | 153 (4.6%) |
| 80 to 84 Years | 36 (1.1%) | 76 (2.3%) |
| 85 Years and over | 50 (1.5%) | 34 (1.0%) |
| Total | 3,397 (100.0%) | 3,327 (100.0%) |
Families and Households in Lionville
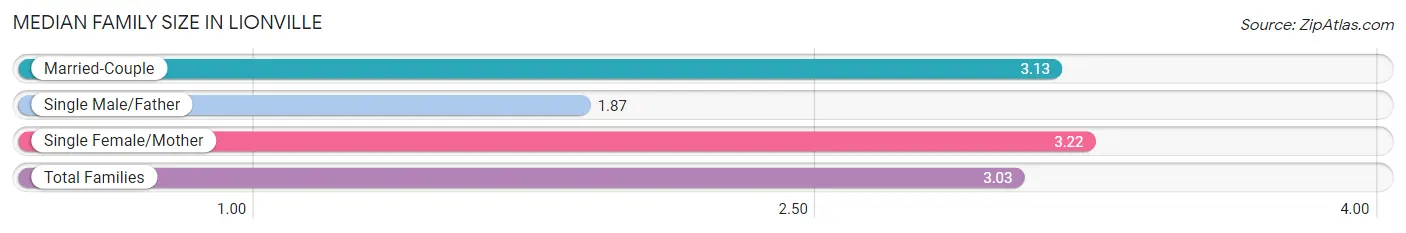
Median Family Size in Lionville
The median family size in Lionville is 3.03 persons per family, with single female/mother families (215 | 12.7%) accounting for the largest median family size of 3.22 persons per family. On the other hand, single male/father families (158 | 9.3%) represent the smallest median family size with 1.87 persons per family.
| Family Type | # Families | Family Size |
| Married-Couple | 1,317 (77.9%) | 3.13 |
| Single Male/Father | 158 (9.3%) | 1.87 |
| Single Female/Mother | 215 (12.7%) | 3.22 |
| Total Families | 1,690 (100.0%) | 3.03 |
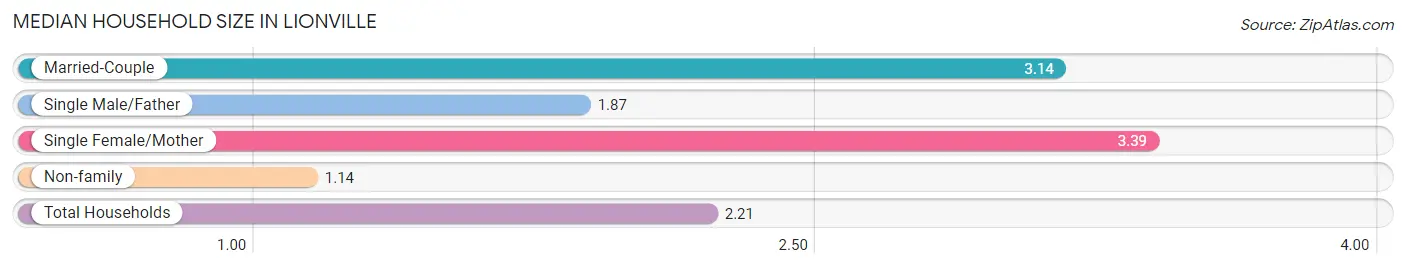
Median Household Size in Lionville
The median household size in Lionville is 2.21 persons per household, with single female/mother households (215 | 7.1%) accounting for the largest median household size of 3.39 persons per household. non-family households (1,353 | 44.5%) represent the smallest median household size with 1.14 persons per household.
| Household Type | # Households | Household Size |
| Married-Couple | 1,317 (43.3%) | 3.14 |
| Single Male/Father | 158 (5.2%) | 1.87 |
| Single Female/Mother | 215 (7.1%) | 3.39 |
| Non-family | 1,353 (44.5%) | 1.14 |
| Total Households | 3,043 (100.0%) | 2.21 |
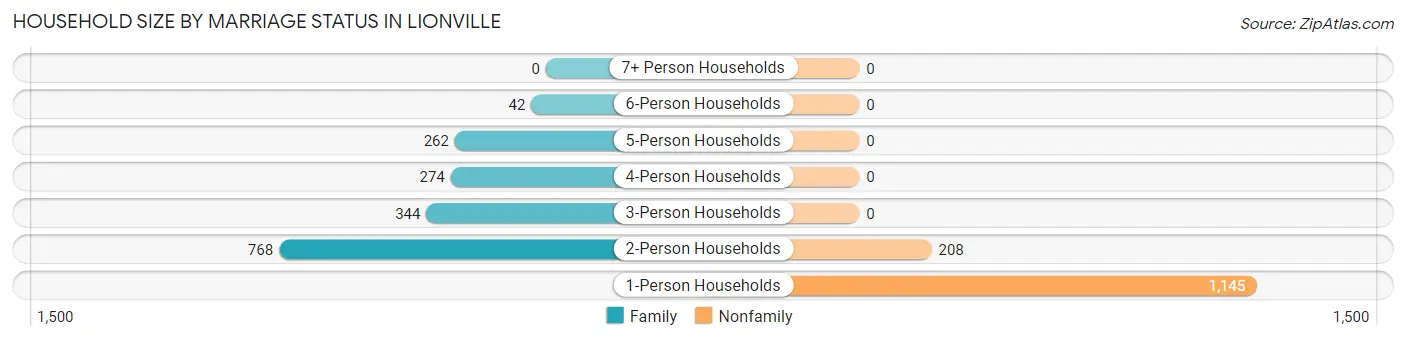
Household Size by Marriage Status in Lionville
Out of a total of 3,043 households in Lionville, 1,690 (55.5%) are family households, while 1,353 (44.5%) are nonfamily households. The most numerous type of family households are 2-person households, comprising 768, and the most common type of nonfamily households are 1-person households, comprising 1,145.
| Household Size | Family Households | Nonfamily Households |
| 1-Person Households | - | 1,145 (37.6%) |
| 2-Person Households | 768 (25.2%) | 208 (6.8%) |
| 3-Person Households | 344 (11.3%) | 0 (0.0%) |
| 4-Person Households | 274 (9.0%) | 0 (0.0%) |
| 5-Person Households | 262 (8.6%) | 0 (0.0%) |
| 6-Person Households | 42 (1.4%) | 0 (0.0%) |
| 7+ Person Households | 0 (0.0%) | 0 (0.0%) |
| Total | 1,690 (55.5%) | 1,353 (44.5%) |
Female Fertility in Lionville
Fertility by Age in Lionville
Average fertility rate in Lionville is 105.0 births per 1,000 women. Women in the age bracket of 35 to 50 years have the highest fertility rate with 201.0 births per 1,000 women. Women in the age bracket of 35 to 50 years acount for 82.0% of all women with births.
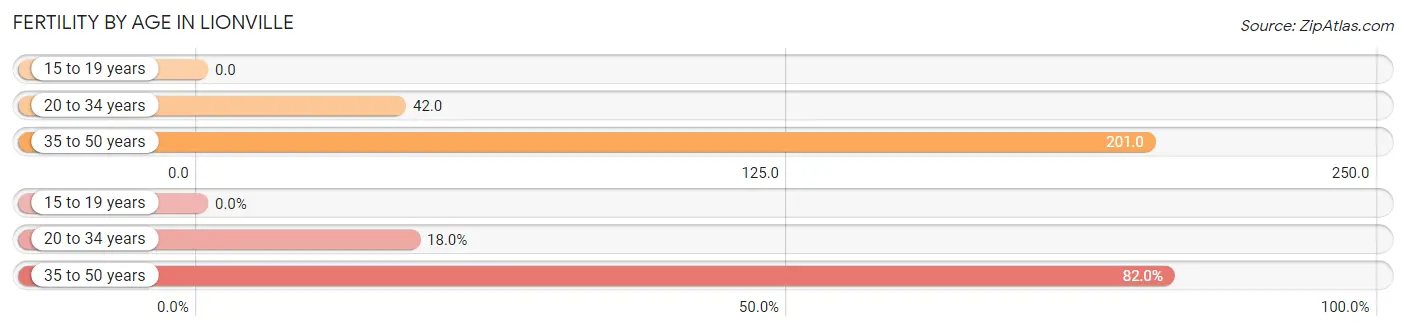
| Age Bracket | Women with Births | Births / 1,000 Women |
| 15 to 19 years | 0 (0.0%) | 0.0 |
| 20 to 34 years | 25 (18.0%) | 42.0 |
| 35 to 50 years | 114 (82.0%) | 201.0 |
| Total | 139 (100.0%) | 105.0 |
Fertility by Age by Marriage Status in Lionville
71.9% of women with births (139) in Lionville are married. The highest percentage of unmarried women with births falls into 35 to 50 years age bracket with 34.2% of them unmarried at the time of birth, while the lowest percentage of unmarried women with births belong to 20 to 34 years age bracket with 0.0% of them unmarried.
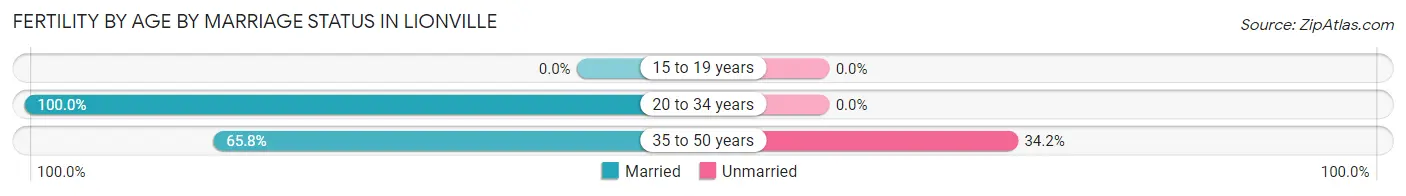
| Age Bracket | Married | Unmarried |
| 15 to 19 years | 0 (0.0%) | 0 (0.0%) |
| 20 to 34 years | 25 (100.0%) | 0 (0.0%) |
| 35 to 50 years | 75 (65.8%) | 39 (34.2%) |
| Total | 100 (71.9%) | 39 (28.1%) |
Fertility by Education in Lionville
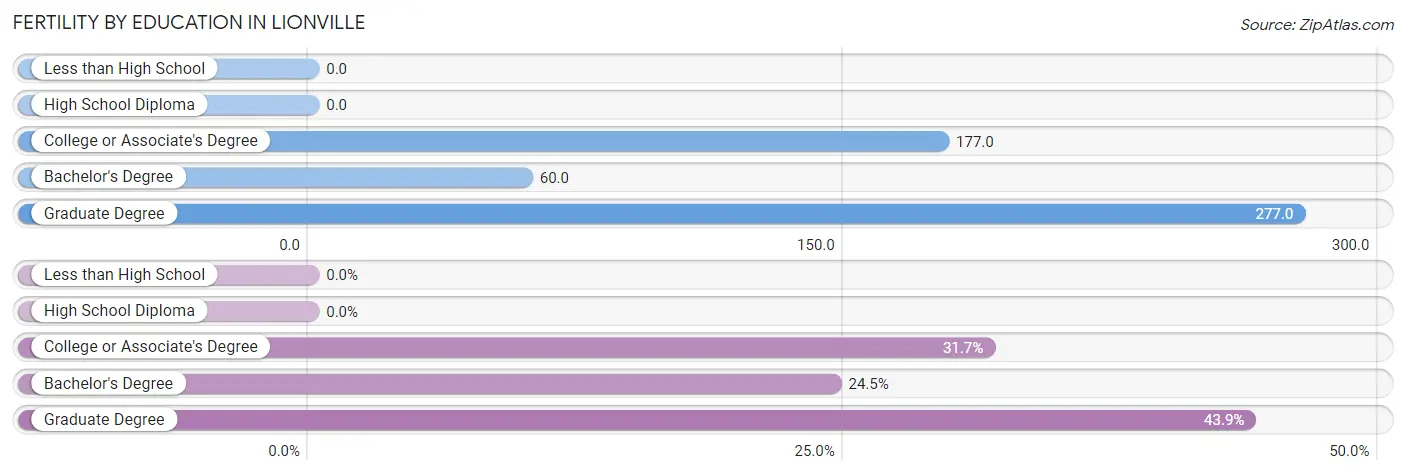
| Educational Attainment | Women with Births | Births / 1,000 Women |
| Less than High School | 0 (0.0%) | 0.0 |
| High School Diploma | 0 (0.0%) | 0.0 |
| College or Associate's Degree | 44 (31.7%) | 177.0 |
| Bachelor's Degree | 34 (24.5%) | 60.0 |
| Graduate Degree | 61 (43.9%) | 277.0 |
| Total | 139 (100.0%) | 105.0 |
Fertility by Education by Marriage Status in Lionville
28.1% of women with births in Lionville are unmarried. Women with the educational attainment of bachelor's degree are most likely to be married with 100.0% of them married at childbirth, while women with the educational attainment of college or associate's degree are least likely to be married with 88.6% of them unmarried at childbirth.
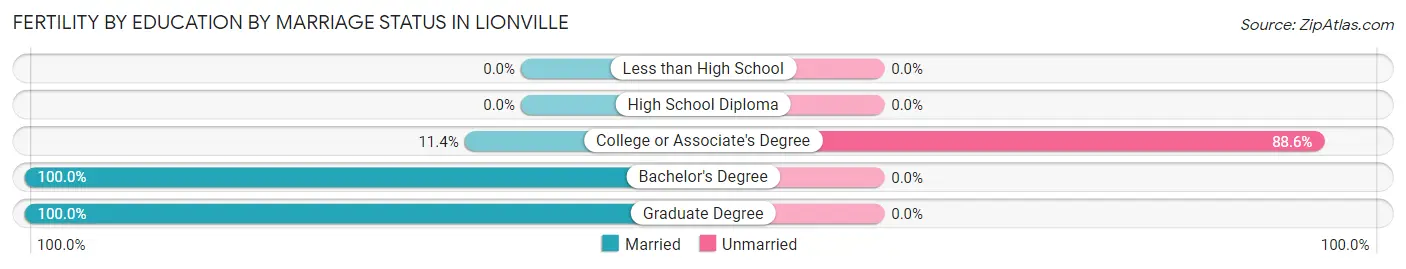
| Educational Attainment | Married | Unmarried |
| Less than High School | 0 (0.0%) | 0 (0.0%) |
| High School Diploma | 0 (0.0%) | 0 (0.0%) |
| College or Associate's Degree | 5 (11.4%) | 39 (88.6%) |
| Bachelor's Degree | 34 (100.0%) | 0 (0.0%) |
| Graduate Degree | 61 (100.0%) | 0 (0.0%) |
| Total | 100 (71.9%) | 39 (28.1%) |
Income in Lionville
Income Overview in Lionville
Per Capita Income in Lionville is $58,593, while median incomes of families and households are $128,068 and $103,156 respectively.
| Characteristic | Number | Measure |
| Per Capita Income | 6,724 | $58,593 |
| Median Family Income | 1,690 | $128,068 |
| Mean Family Income | 1,690 | $160,186 |
| Median Household Income | 3,043 | $103,156 |
| Mean Household Income | 3,043 | $126,600 |
| Income Deficit | 1,690 | $0 |
| Wage / Income Gap (%) | 6,724 | 39.88% |
| Wage / Income Gap ($) | 6,724 | 60.12¢ per $1 |
| Gini / Inequality Index | 6,724 | 0.40 |
Earnings by Sex in Lionville
Average Earnings in Lionville are $55,197, $70,425 for men and $42,339 for women, a difference of 39.9%.
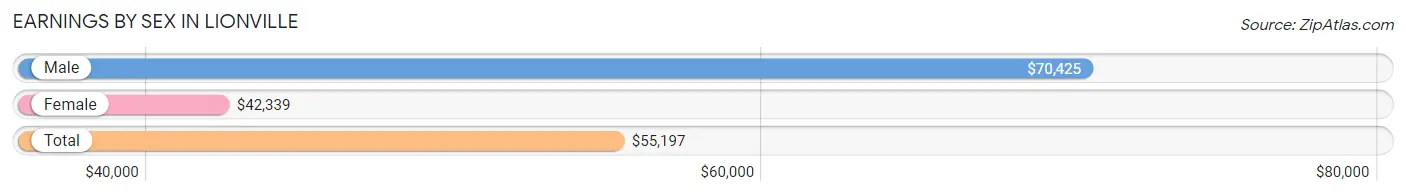
| Sex | Number | Average Earnings |
| Male | 2,471 (56.8%) | $70,425 |
| Female | 1,879 (43.2%) | $42,339 |
| Total | 4,350 (100.0%) | $55,197 |
Earnings by Sex by Income Bracket in Lionville
The most common earnings brackets in Lionville are $100,000+ for men (966 | 39.1%) and $55,000 to $64,999 for women (223 | 11.9%).
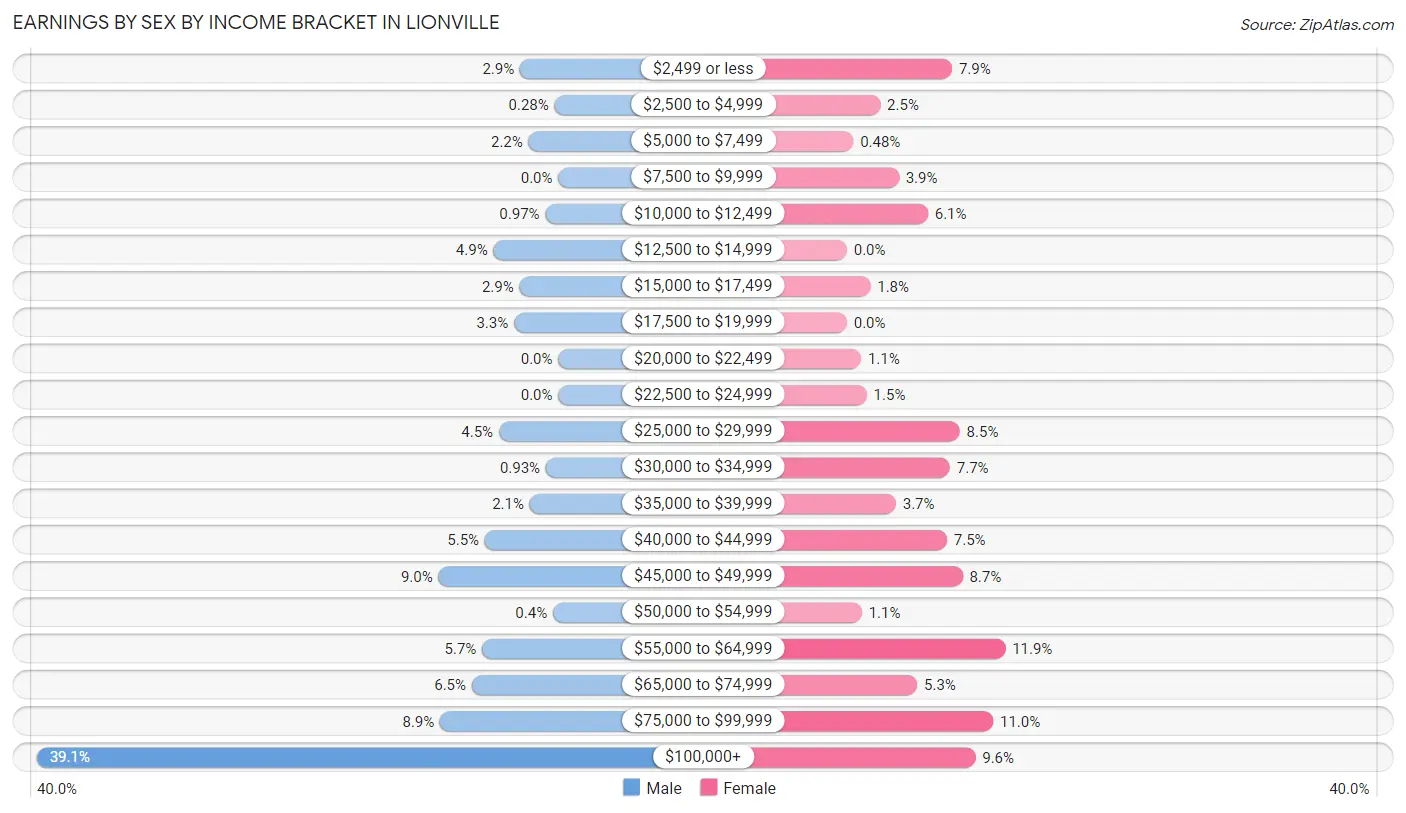
| Income | Male | Female |
| $2,499 or less | 71 (2.9%) | 148 (7.9%) |
| $2,500 to $4,999 | 7 (0.3%) | 47 (2.5%) |
| $5,000 to $7,499 | 55 (2.2%) | 9 (0.5%) |
| $7,500 to $9,999 | 0 (0.0%) | 73 (3.9%) |
| $10,000 to $12,499 | 24 (1.0%) | 114 (6.1%) |
| $12,500 to $14,999 | 120 (4.9%) | 0 (0.0%) |
| $15,000 to $17,499 | 72 (2.9%) | 33 (1.8%) |
| $17,500 to $19,999 | 82 (3.3%) | 0 (0.0%) |
| $20,000 to $22,499 | 0 (0.0%) | 20 (1.1%) |
| $22,500 to $24,999 | 0 (0.0%) | 28 (1.5%) |
| $25,000 to $29,999 | 110 (4.4%) | 159 (8.5%) |
| $30,000 to $34,999 | 23 (0.9%) | 145 (7.7%) |
| $35,000 to $39,999 | 53 (2.1%) | 69 (3.7%) |
| $40,000 to $44,999 | 136 (5.5%) | 141 (7.5%) |
| $45,000 to $49,999 | 222 (9.0%) | 163 (8.7%) |
| $50,000 to $54,999 | 10 (0.4%) | 21 (1.1%) |
| $55,000 to $64,999 | 141 (5.7%) | 223 (11.9%) |
| $65,000 to $74,999 | 160 (6.5%) | 99 (5.3%) |
| $75,000 to $99,999 | 219 (8.9%) | 206 (11.0%) |
| $100,000+ | 966 (39.1%) | 181 (9.6%) |
| Total | 2,471 (100.0%) | 1,879 (100.0%) |
Earnings by Sex by Educational Attainment in Lionville
Average earnings in Lionville are $81,910 for men and $46,591 for women, a difference of 43.1%. Men with an educational attainment of graduate degree enjoy the highest average annual earnings of $105,385, while those with high school diploma education earn the least with $41,458. Women with an educational attainment of graduate degree earn the most with the average annual earnings of $86,875, while those with high school diploma education have the smallest earnings of $15,069.
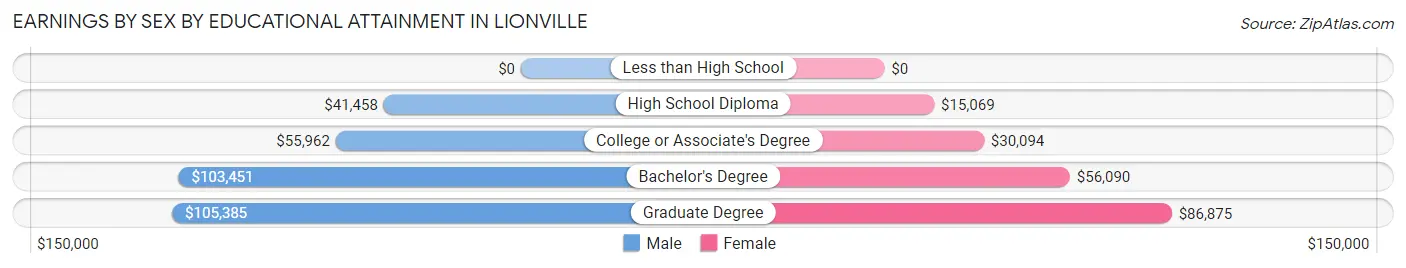
| Educational Attainment | Male Income | Female Income |
| Less than High School | - | - |
| High School Diploma | $41,458 | $15,069 |
| College or Associate's Degree | $55,962 | $30,094 |
| Bachelor's Degree | $103,451 | $56,090 |
| Graduate Degree | $105,385 | $86,875 |
| Total | $81,910 | $46,591 |
Family Income in Lionville
Family Income Brackets in Lionville
According to the Lionville family income data, there are 384 families falling into the $100,000 to $149,999 income range, which is the most common income bracket and makes up 22.7% of all families.
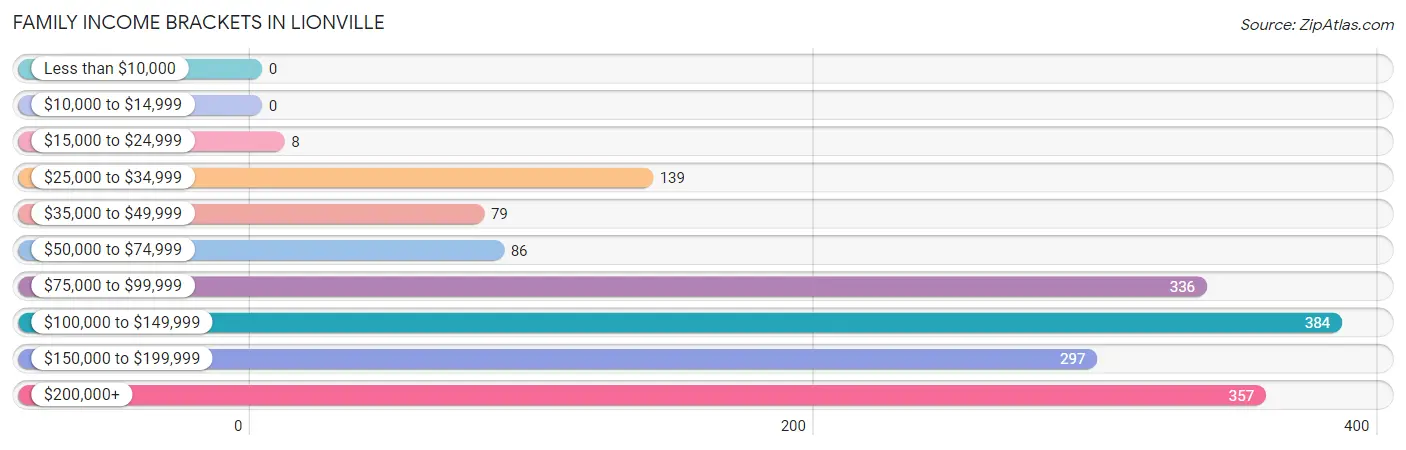
| Income Bracket | # Families | % Families |
| Less than $10,000 | 0 | 0.0% |
| $10,000 to $14,999 | 0 | 0.0% |
| $15,000 to $24,999 | 8 | 0.5% |
| $25,000 to $34,999 | 139 | 8.2% |
| $35,000 to $49,999 | 79 | 4.7% |
| $50,000 to $74,999 | 86 | 5.1% |
| $75,000 to $99,999 | 336 | 19.9% |
| $100,000 to $149,999 | 384 | 22.7% |
| $150,000 to $199,999 | 297 | 17.6% |
| $200,000+ | 357 | 21.1% |
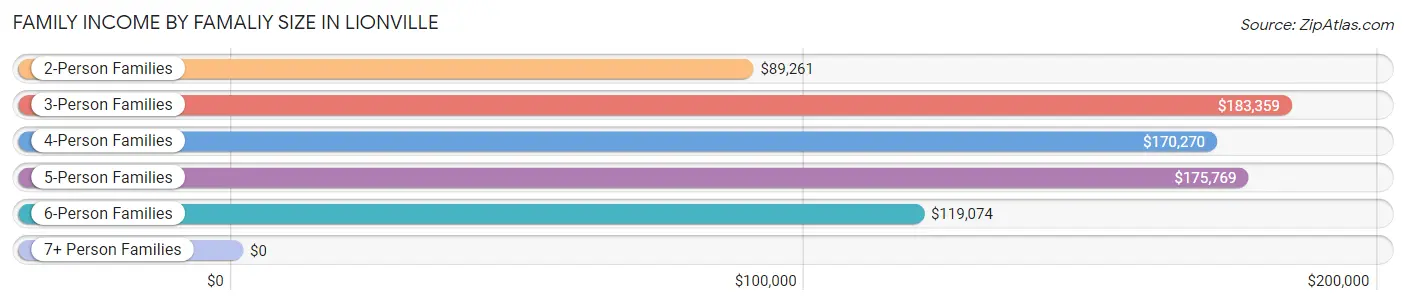
Family Income by Famaliy Size in Lionville
3-person families (395 | 23.4%) account for the highest median family income in Lionville with $183,359 per family, while 3-person families (395 | 23.4%) have the highest median income of $61,120 per family member.
| Income Bracket | # Families | Median Income |
| 2-Person Families | 768 (45.4%) | $89,261 |
| 3-Person Families | 395 (23.4%) | $183,359 |
| 4-Person Families | 223 (13.2%) | $170,270 |
| 5-Person Families | 262 (15.5%) | $175,769 |
| 6-Person Families | 42 (2.5%) | $119,074 |
| 7+ Person Families | 0 (0.0%) | $0 |
| Total | 1,690 (100.0%) | $128,068 |
Family Income by Number of Earners in Lionville
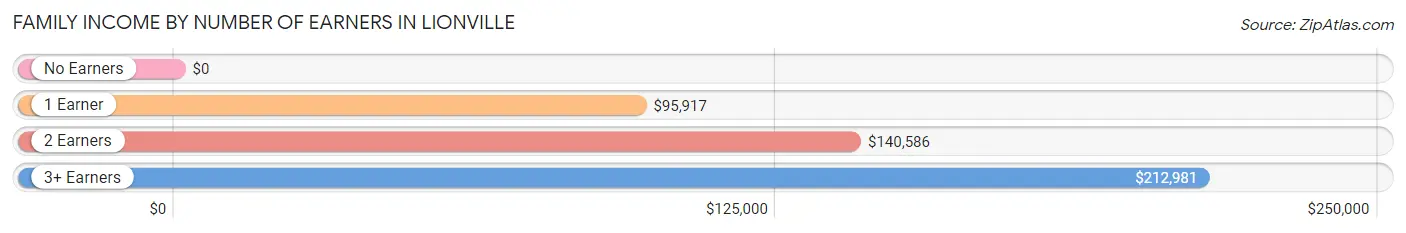
| Number of Earners | # Families | Median Income |
| No Earners | 231 (13.7%) | $0 |
| 1 Earner | 461 (27.3%) | $95,917 |
| 2 Earners | 677 (40.1%) | $140,586 |
| 3+ Earners | 321 (19.0%) | $212,981 |
| Total | 1,690 (100.0%) | $128,068 |
Household Income in Lionville
Household Income Brackets in Lionville
With 788 households falling in the category, the $100,000 to $149,999 income range is the most frequent in Lionville, accounting for 25.9% of all households.
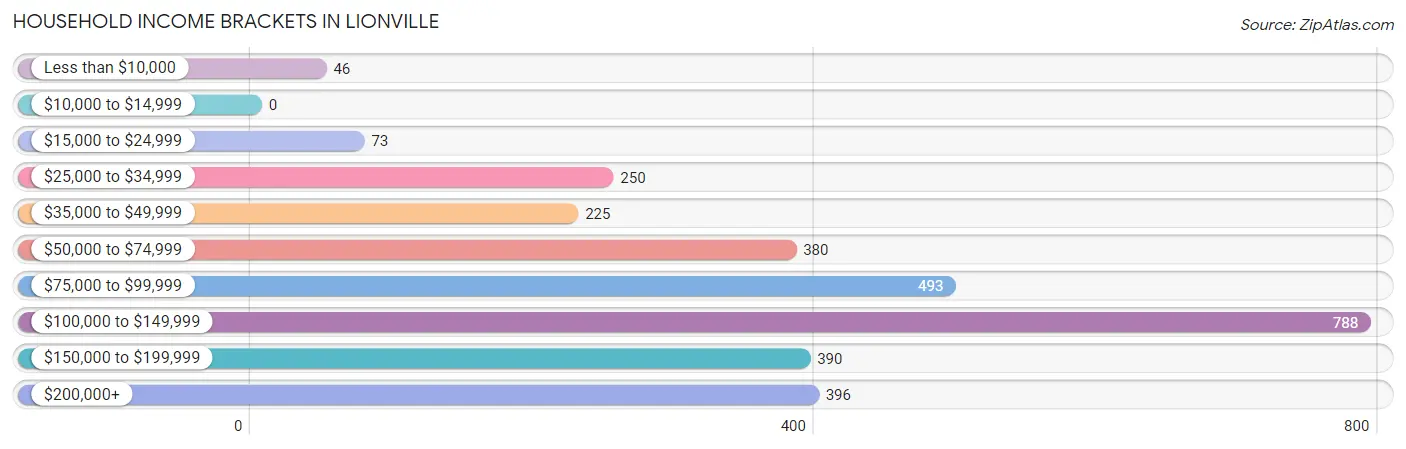
| Income Bracket | # Households | % Households |
| Less than $10,000 | 46 | 1.5% |
| $10,000 to $14,999 | 0 | 0.0% |
| $15,000 to $24,999 | 73 | 2.4% |
| $25,000 to $34,999 | 250 | 8.2% |
| $35,000 to $49,999 | 225 | 7.4% |
| $50,000 to $74,999 | 380 | 12.5% |
| $75,000 to $99,999 | 493 | 16.2% |
| $100,000 to $149,999 | 788 | 25.9% |
| $150,000 to $199,999 | 390 | 12.8% |
| $200,000+ | 396 | 13.0% |
Household Income by Householder Age in Lionville
The median household income in Lionville is $103,156, with the highest median household income of $109,575 found in the 25 to 44 years age bracket for the primary householder. A total of 993 households (32.6%) fall into this category. Meanwhile, the 15 to 24 years age bracket for the primary householder has the lowest median household income of $0, with 77 households (2.5%) in this group.
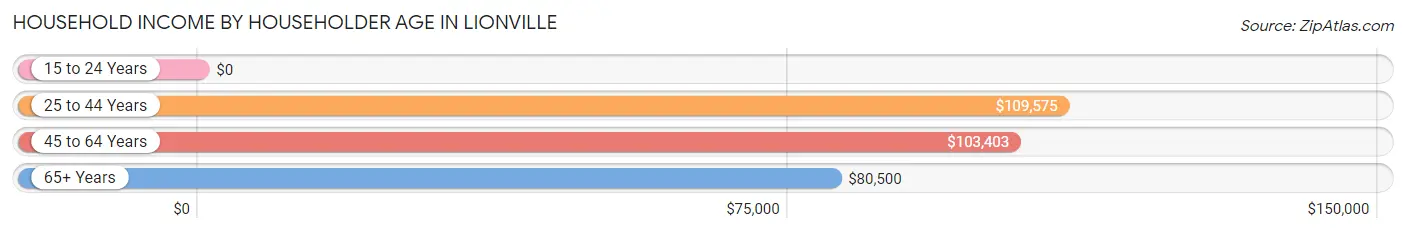
| Income Bracket | # Households | Median Income |
| 15 to 24 Years | 77 (2.5%) | $0 |
| 25 to 44 Years | 993 (32.6%) | $109,575 |
| 45 to 64 Years | 1,111 (36.5%) | $103,403 |
| 65+ Years | 862 (28.3%) | $80,500 |
| Total | 3,043 (100.0%) | $103,156 |
Poverty in Lionville
Income Below Poverty by Sex and Age in Lionville
With 1.6% poverty level for males and 3.2% for females among the residents of Lionville, 15 year old males and 18 to 24 year old females are the most vulnerable to poverty, with 4 males (6.2%) and 33 females (13.4%) in their respective age groups living below the poverty level.
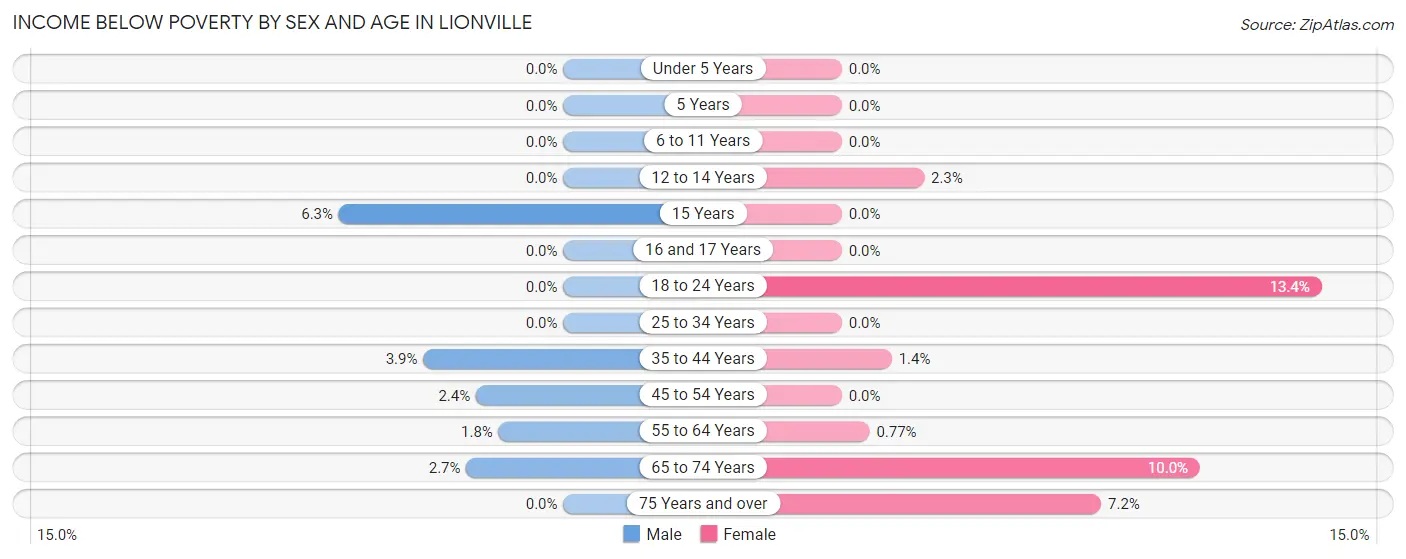
| Age Bracket | Male | Female |
| Under 5 Years | 0 (0.0%) | 0 (0.0%) |
| 5 Years | 0 (0.0%) | 0 (0.0%) |
| 6 to 11 Years | 0 (0.0%) | 0 (0.0%) |
| 12 to 14 Years | 0 (0.0%) | 5 (2.3%) |
| 15 Years | 4 (6.2%) | 0 (0.0%) |
| 16 and 17 Years | 0 (0.0%) | 0 (0.0%) |
| 18 to 24 Years | 0 (0.0%) | 33 (13.4%) |
| 25 to 34 Years | 0 (0.0%) | 0 (0.0%) |
| 35 to 44 Years | 18 (3.9%) | 5 (1.4%) |
| 45 to 54 Years | 12 (2.4%) | 0 (0.0%) |
| 55 to 64 Years | 6 (1.8%) | 4 (0.8%) |
| 65 to 74 Years | 14 (2.7%) | 39 (10.0%) |
| 75 Years and over | 0 (0.0%) | 19 (7.2%) |
| Total | 54 (1.6%) | 105 (3.2%) |
Income Above Poverty by Sex and Age in Lionville
According to the poverty statistics in Lionville, males aged under 5 years and females aged under 5 years are the age groups that are most secure financially, with 100.0% of males and 100.0% of females in these age groups living above the poverty line.
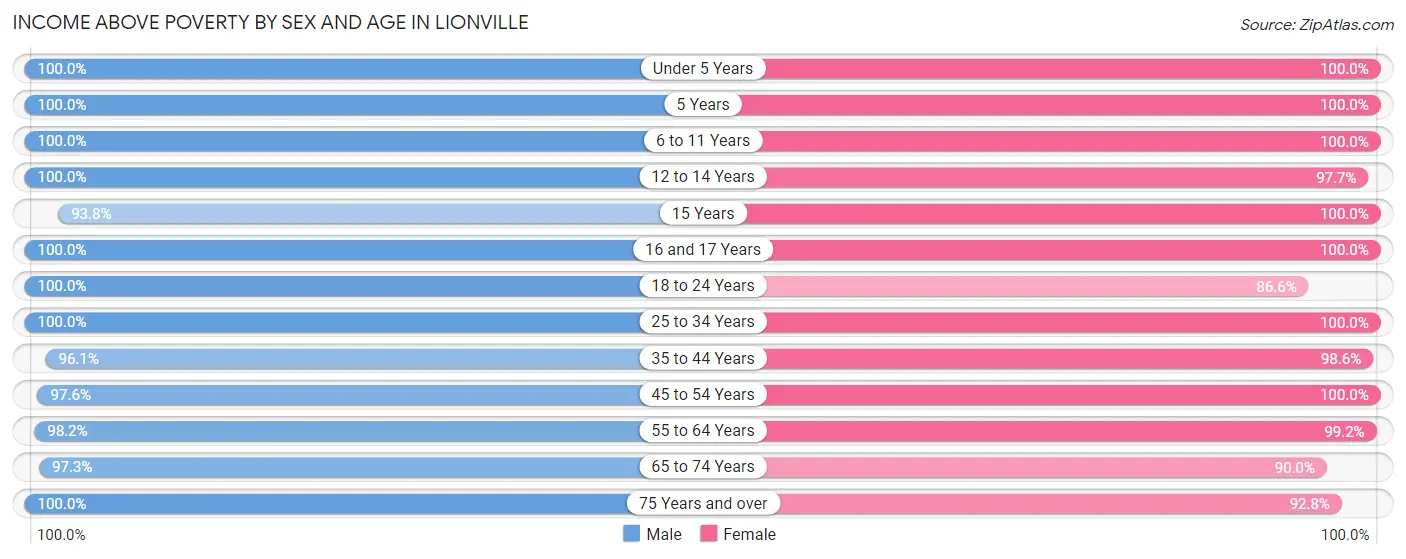
| Age Bracket | Male | Female |
| Under 5 Years | 146 (100.0%) | 295 (100.0%) |
| 5 Years | 17 (100.0%) | 6 (100.0%) |
| 6 to 11 Years | 300 (100.0%) | 160 (100.0%) |
| 12 to 14 Years | 25 (100.0%) | 213 (97.7%) |
| 15 Years | 60 (93.8%) | 18 (100.0%) |
| 16 and 17 Years | 25 (100.0%) | 74 (100.0%) |
| 18 to 24 Years | 322 (100.0%) | 214 (86.6%) |
| 25 to 34 Years | 533 (100.0%) | 413 (100.0%) |
| 35 to 44 Years | 444 (96.1%) | 356 (98.6%) |
| 45 to 54 Years | 482 (97.6%) | 364 (100.0%) |
| 55 to 64 Years | 328 (98.2%) | 513 (99.2%) |
| 65 to 74 Years | 504 (97.3%) | 352 (90.0%) |
| 75 Years and over | 157 (100.0%) | 244 (92.8%) |
| Total | 3,343 (98.4%) | 3,222 (96.8%) |
Income Below Poverty Among Married-Couple Families in Lionville
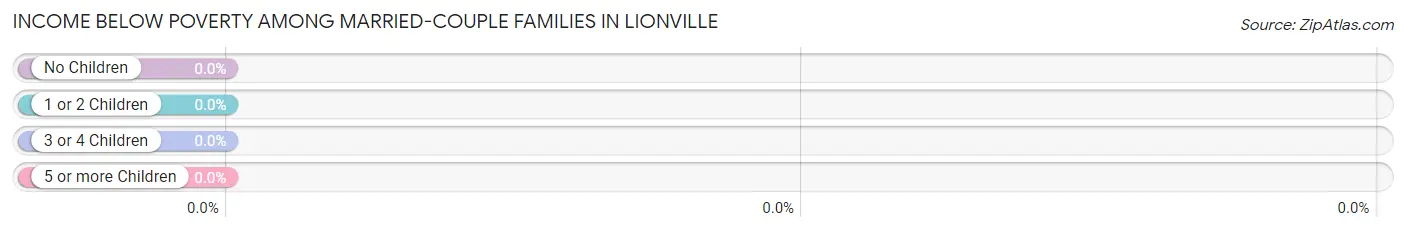
| Children | Above Poverty | Below Poverty |
| No Children | 763 (100.0%) | 0 (0.0%) |
| 1 or 2 Children | 331 (100.0%) | 0 (0.0%) |
| 3 or 4 Children | 223 (100.0%) | 0 (0.0%) |
| 5 or more Children | 0 (0.0%) | 0 (0.0%) |
| Total | 1,317 (100.0%) | 0 (0.0%) |
Income Below Poverty Among Single-Parent Households in Lionville
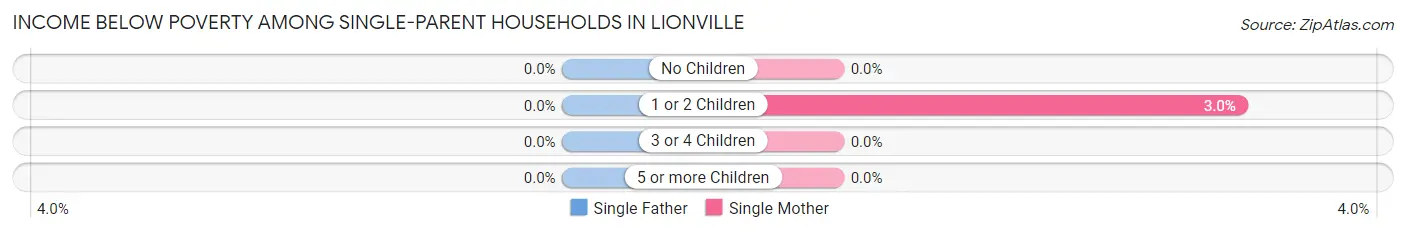
| Children | Single Father | Single Mother |
| No Children | 0 (0.0%) | 0 (0.0%) |
| 1 or 2 Children | 0 (0.0%) | 4 (3.0%) |
| 3 or 4 Children | 0 (0.0%) | 0 (0.0%) |
| 5 or more Children | 0 (0.0%) | 0 (0.0%) |
| Total | 0 (0.0%) | 4 (1.9%) |
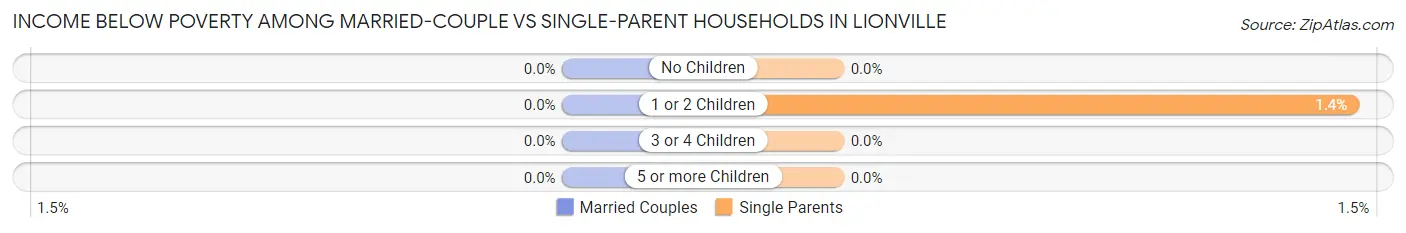
Income Below Poverty Among Married-Couple vs Single-Parent Households in Lionville
| Children | Married-Couple Families | Single-Parent Households |
| No Children | 0 (0.0%) | 0 (0.0%) |
| 1 or 2 Children | 0 (0.0%) | 4 (1.4%) |
| 3 or 4 Children | 0 (0.0%) | 0 (0.0%) |
| 5 or more Children | 0 (0.0%) | 0 (0.0%) |
| Total | 0 (0.0%) | 4 (1.1%) |
Employment Characteristics in Lionville
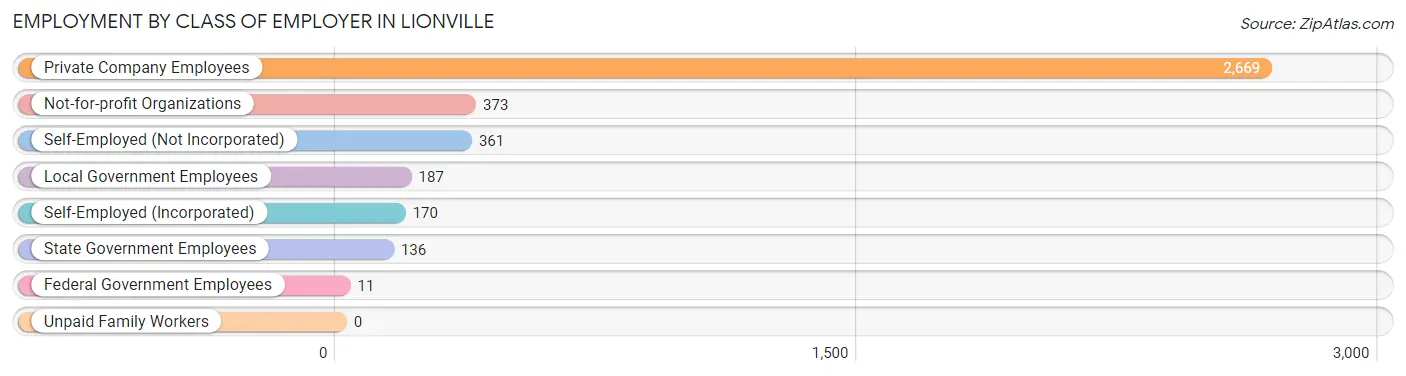
Employment by Class of Employer in Lionville
Among the 3,907 employed individuals in Lionville, private company employees (2,669 | 68.3%), not-for-profit organizations (373 | 9.6%), and self-employed (not incorporated) (361 | 9.2%) make up the most common classes of employment.
| Employer Class | # Employees | % Employees |
| Private Company Employees | 2,669 | 68.3% |
| Self-Employed (Incorporated) | 170 | 4.3% |
| Self-Employed (Not Incorporated) | 361 | 9.2% |
| Not-for-profit Organizations | 373 | 9.6% |
| Local Government Employees | 187 | 4.8% |
| State Government Employees | 136 | 3.5% |
| Federal Government Employees | 11 | 0.3% |
| Unpaid Family Workers | 0 | 0.0% |
| Total | 3,907 | 100.0% |
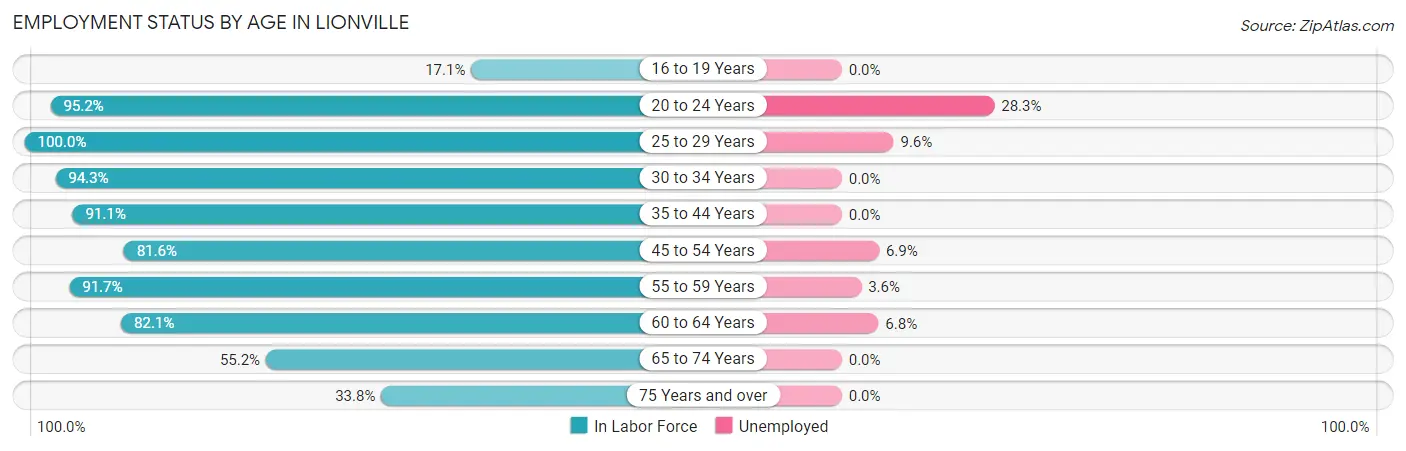
Employment Status by Age in Lionville
According to the labor force statistics for Lionville, out of the total population over 16 years of age (5,475), 77.2% or 4,227 individuals are in the labor force, with 5.8% or 245 of them unemployed. The age group with the highest labor force participation rate is 25 to 29 years, with 100.0% or 334 individuals in the labor force. Within the labor force, the 20 to 24 years age range has the highest percentage of unemployed individuals, with 28.3% or 128 of them being unemployed.
| Age Bracket | In Labor Force | Unemployed |
| 16 to 19 Years | 33 (17.1%) | 0 (0.0%) |
| 20 to 24 Years | 452 (95.2%) | 128 (28.3%) |
| 25 to 29 Years | 334 (100.0%) | 32 (9.6%) |
| 30 to 34 Years | 577 (94.3%) | 0 (0.0%) |
| 35 to 44 Years | 750 (91.1%) | 0 (0.0%) |
| 45 to 54 Years | 700 (81.6%) | 48 (6.9%) |
| 55 to 59 Years | 387 (91.7%) | 14 (3.6%) |
| 60 to 64 Years | 352 (82.1%) | 24 (6.8%) |
| 65 to 74 Years | 502 (55.2%) | 0 (0.0%) |
| 75 Years and over | 142 (33.8%) | 0 (0.0%) |
| Total | 4,227 (77.2%) | 245 (5.8%) |
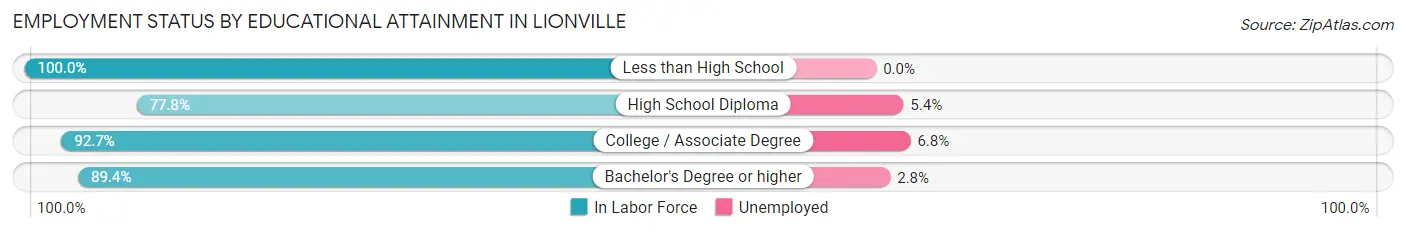
Employment Status by Educational Attainment in Lionville
According to labor force statistics for Lionville, 89.1% of individuals (3,099) out of the total population between 25 and 64 years of age (3,478) are in the labor force, with 3.8% or 118 of them being unemployed. The group with the highest labor force participation rate are those with the educational attainment of less than high school, with 100.0% or 115 individuals in the labor force. Within the labor force, individuals with college / associate degree education have the highest percentage of unemployment, with 6.8% or 45 of them being unemployed.
| Educational Attainment | In Labor Force | Unemployed |
| Less than High School | 115 (100.0%) | 0 (0.0%) |
| High School Diploma | 298 (77.8%) | 21 (5.4%) |
| College / Associate Degree | 657 (92.7%) | 48 (6.8%) |
| Bachelor's Degree or higher | 2,030 (89.4%) | 64 (2.8%) |
| Total | 3,099 (89.1%) | 132 (3.8%) |
Employment Occupations by Sex in Lionville
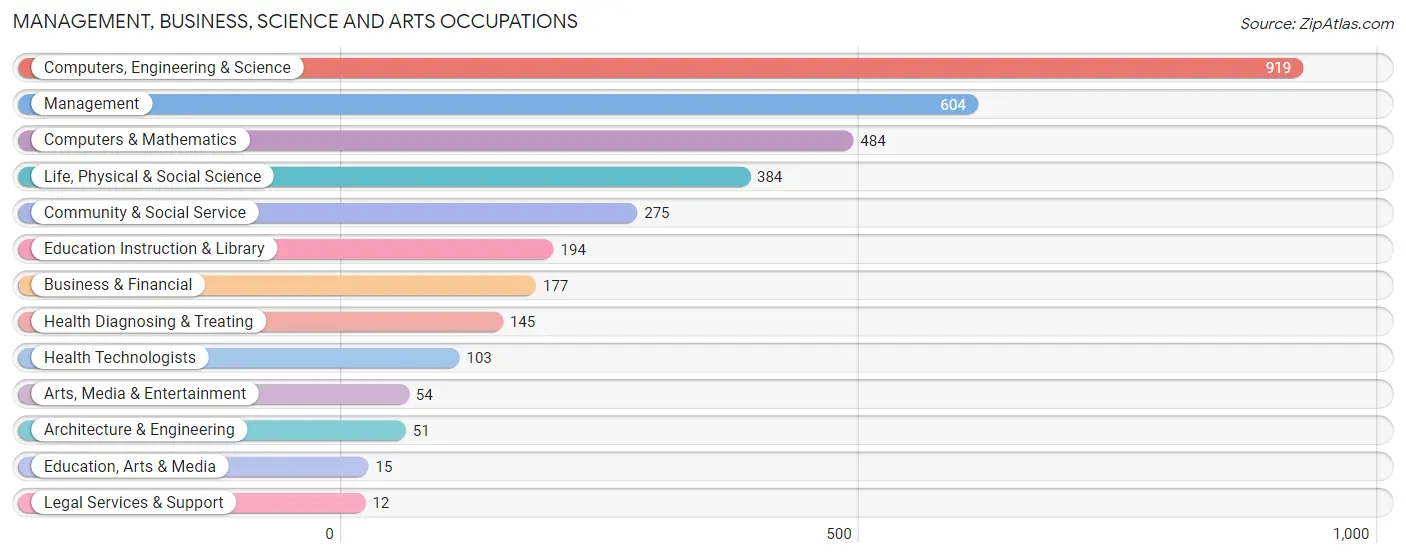
Management, Business, Science and Arts Occupations
The most common Management, Business, Science and Arts occupations in Lionville are Computers, Engineering & Science (919 | 23.1%), Management (604 | 15.2%), Computers & Mathematics (484 | 12.2%), Life, Physical & Social Science (384 | 9.7%), and Community & Social Service (275 | 6.9%).
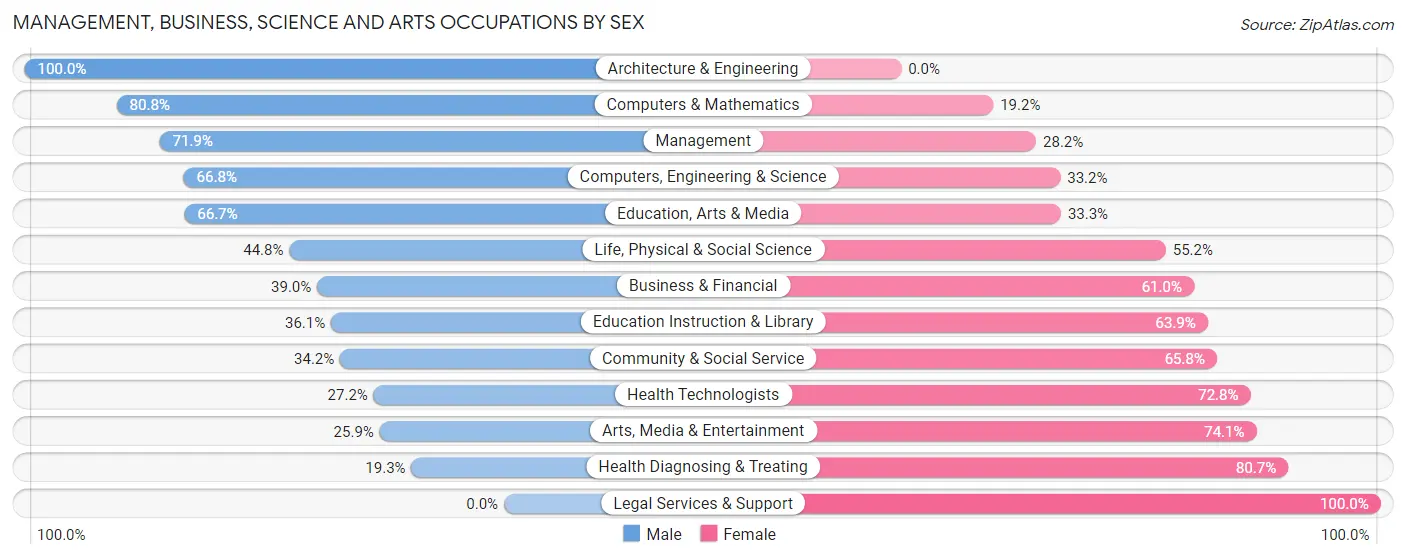
Management, Business, Science and Arts Occupations by Sex
Within the Management, Business, Science and Arts occupations in Lionville, the most male-oriented occupations are Architecture & Engineering (100.0%), Computers & Mathematics (80.8%), and Management (71.9%), while the most female-oriented occupations are Legal Services & Support (100.0%), Health Diagnosing & Treating (80.7%), and Arts, Media & Entertainment (74.1%).
| Occupation | Male | Female |
| Management | 434 (71.9%) | 170 (28.1%) |
| Business & Financial | 69 (39.0%) | 108 (61.0%) |
| Computers, Engineering & Science | 614 (66.8%) | 305 (33.2%) |
| Computers & Mathematics | 391 (80.8%) | 93 (19.2%) |
| Architecture & Engineering | 51 (100.0%) | 0 (0.0%) |
| Life, Physical & Social Science | 172 (44.8%) | 212 (55.2%) |
| Community & Social Service | 94 (34.2%) | 181 (65.8%) |
| Education, Arts & Media | 10 (66.7%) | 5 (33.3%) |
| Legal Services & Support | 0 (0.0%) | 12 (100.0%) |
| Education Instruction & Library | 70 (36.1%) | 124 (63.9%) |
| Arts, Media & Entertainment | 14 (25.9%) | 40 (74.1%) |
| Health Diagnosing & Treating | 28 (19.3%) | 117 (80.7%) |
| Health Technologists | 28 (27.2%) | 75 (72.8%) |
| Total (Category) | 1,239 (58.4%) | 881 (41.6%) |
| Total (Overall) | 2,324 (58.5%) | 1,648 (41.5%) |
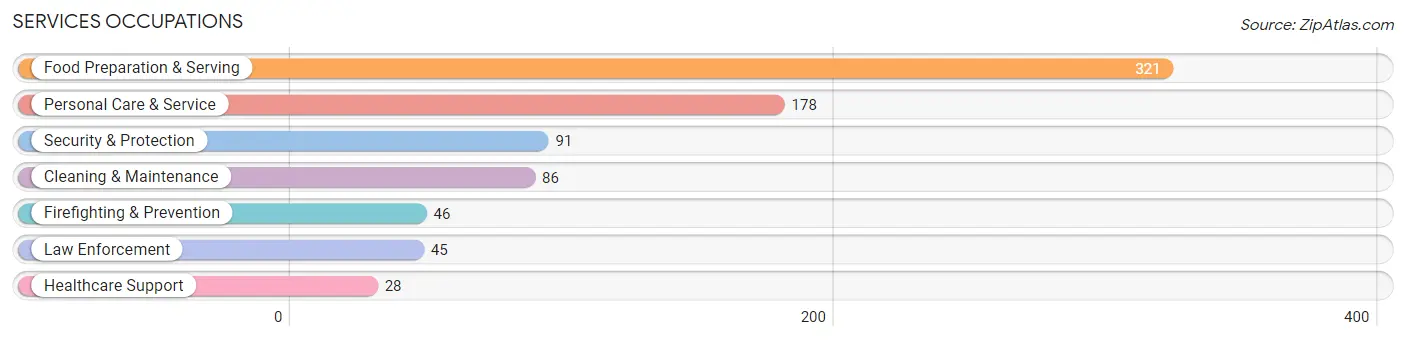
Services Occupations
The most common Services occupations in Lionville are Food Preparation & Serving (321 | 8.1%), Personal Care & Service (178 | 4.5%), Security & Protection (91 | 2.3%), Cleaning & Maintenance (86 | 2.2%), and Firefighting & Prevention (46 | 1.2%).
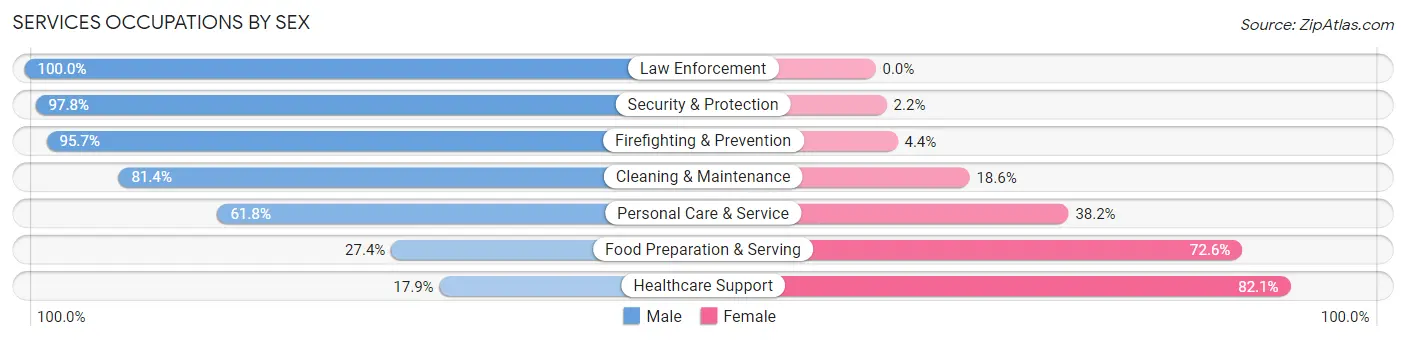
Services Occupations by Sex
Within the Services occupations in Lionville, the most male-oriented occupations are Law Enforcement (100.0%), Security & Protection (97.8%), and Firefighting & Prevention (95.7%), while the most female-oriented occupations are Healthcare Support (82.1%), Food Preparation & Serving (72.6%), and Personal Care & Service (38.2%).
| Occupation | Male | Female |
| Healthcare Support | 5 (17.9%) | 23 (82.1%) |
| Security & Protection | 89 (97.8%) | 2 (2.2%) |
| Firefighting & Prevention | 44 (95.7%) | 2 (4.3%) |
| Law Enforcement | 45 (100.0%) | 0 (0.0%) |
| Food Preparation & Serving | 88 (27.4%) | 233 (72.6%) |
| Cleaning & Maintenance | 70 (81.4%) | 16 (18.6%) |
| Personal Care & Service | 110 (61.8%) | 68 (38.2%) |
| Total (Category) | 362 (51.4%) | 342 (48.6%) |
| Total (Overall) | 2,324 (58.5%) | 1,648 (41.5%) |
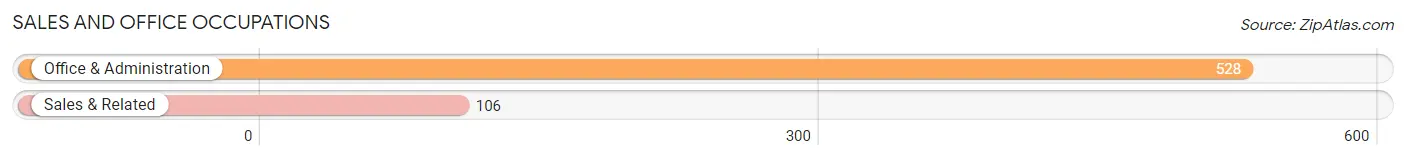
Sales and Office Occupations
The most common Sales and Office occupations in Lionville are Office & Administration (528 | 13.3%), and Sales & Related (106 | 2.7%).
Sales and Office Occupations by Sex
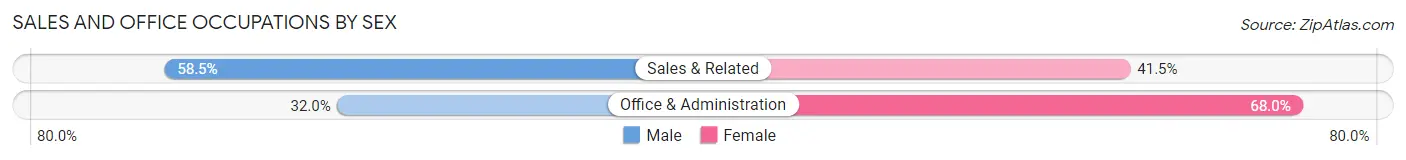
| Occupation | Male | Female |
| Sales & Related | 62 (58.5%) | 44 (41.5%) |
| Office & Administration | 169 (32.0%) | 359 (68.0%) |
| Total (Category) | 231 (36.4%) | 403 (63.6%) |
| Total (Overall) | 2,324 (58.5%) | 1,648 (41.5%) |
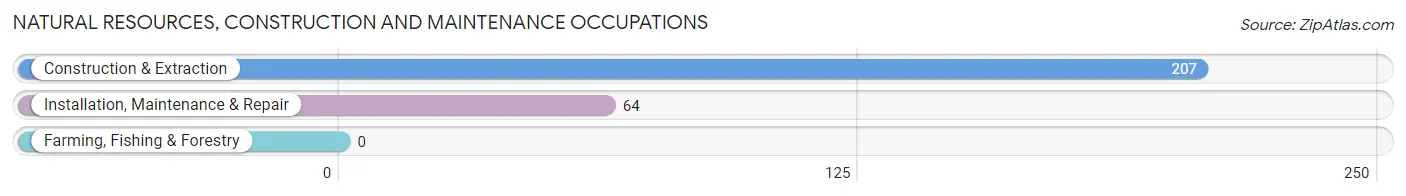
Natural Resources, Construction and Maintenance Occupations
The most common Natural Resources, Construction and Maintenance occupations in Lionville are Construction & Extraction (207 | 5.2%), and Installation, Maintenance & Repair (64 | 1.6%).
Natural Resources, Construction and Maintenance Occupations by Sex
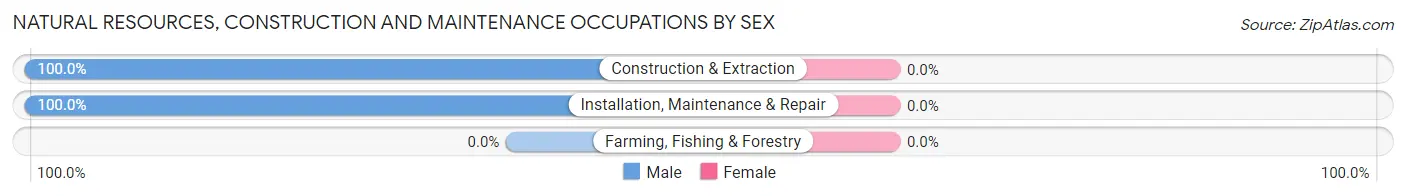
| Occupation | Male | Female |
| Farming, Fishing & Forestry | 0 (0.0%) | 0 (0.0%) |
| Construction & Extraction | 207 (100.0%) | 0 (0.0%) |
| Installation, Maintenance & Repair | 64 (100.0%) | 0 (0.0%) |
| Total (Category) | 271 (100.0%) | 0 (0.0%) |
| Total (Overall) | 2,324 (58.5%) | 1,648 (41.5%) |
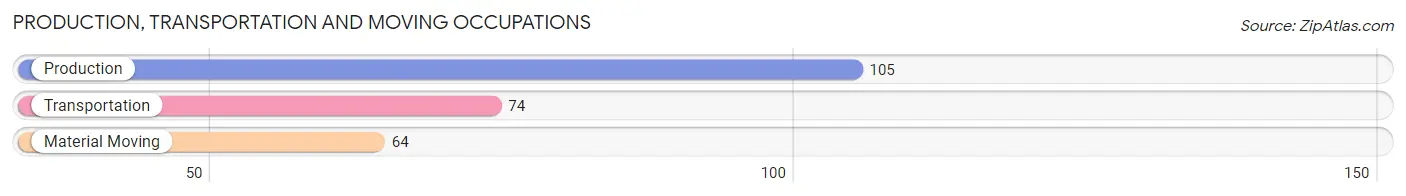
Production, Transportation and Moving Occupations
The most common Production, Transportation and Moving occupations in Lionville are Production (105 | 2.6%), Transportation (74 | 1.9%), and Material Moving (64 | 1.6%).
Production, Transportation and Moving Occupations by Sex
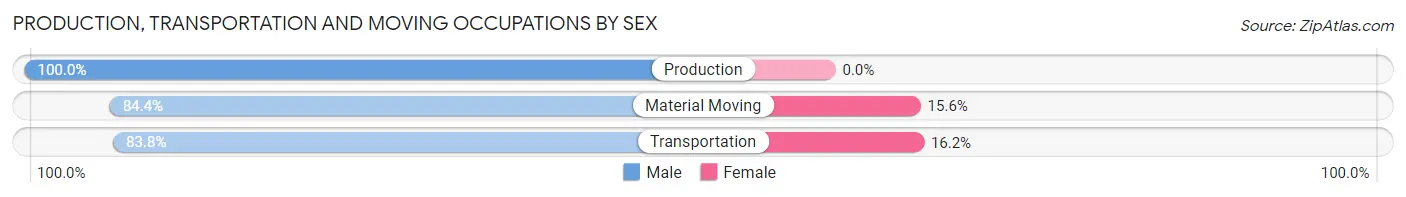
| Occupation | Male | Female |
| Production | 105 (100.0%) | 0 (0.0%) |
| Transportation | 62 (83.8%) | 12 (16.2%) |
| Material Moving | 54 (84.4%) | 10 (15.6%) |
| Total (Category) | 221 (90.9%) | 22 (9.0%) |
| Total (Overall) | 2,324 (58.5%) | 1,648 (41.5%) |
Employment Industries by Sex in Lionville
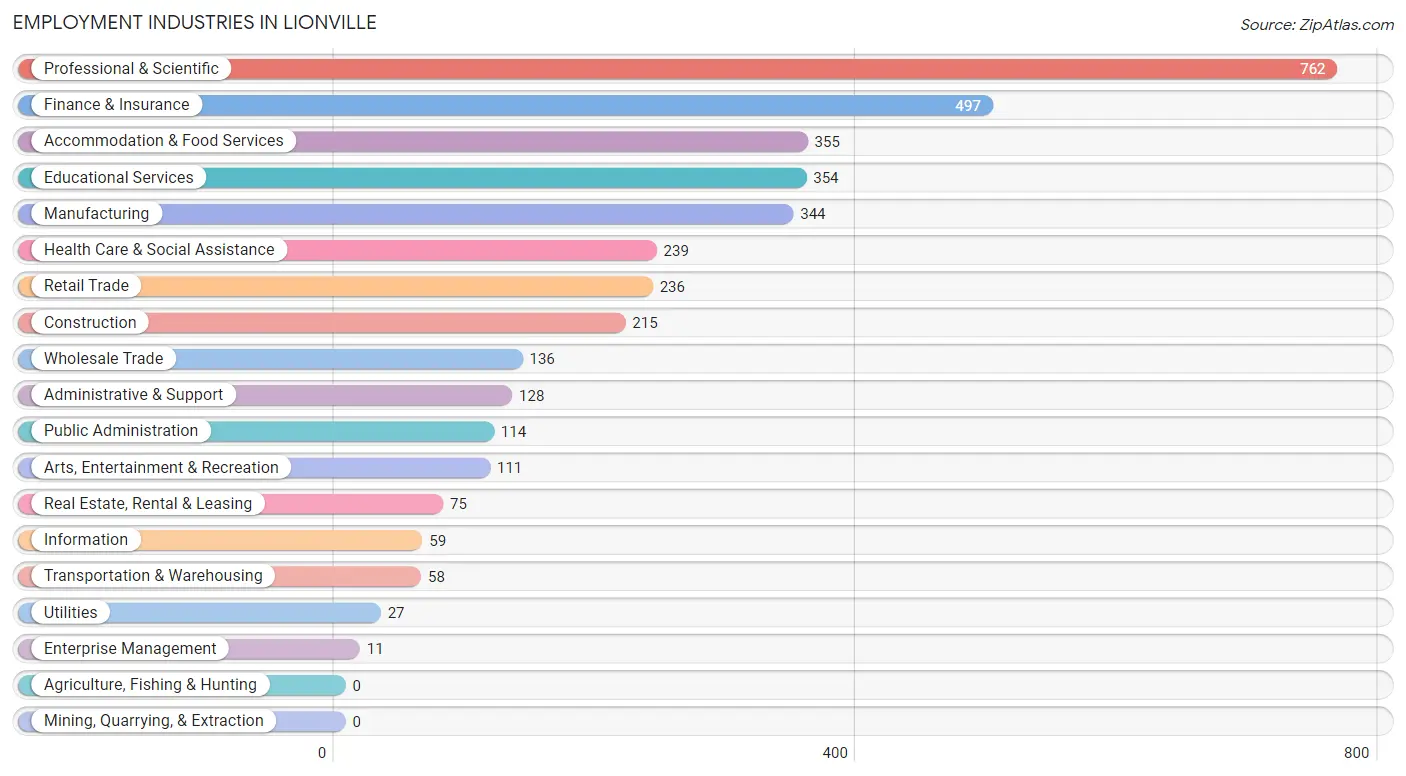
Employment Industries in Lionville
The major employment industries in Lionville include Professional & Scientific (762 | 19.2%), Finance & Insurance (497 | 12.5%), Accommodation & Food Services (355 | 8.9%), Educational Services (354 | 8.9%), and Manufacturing (344 | 8.7%).
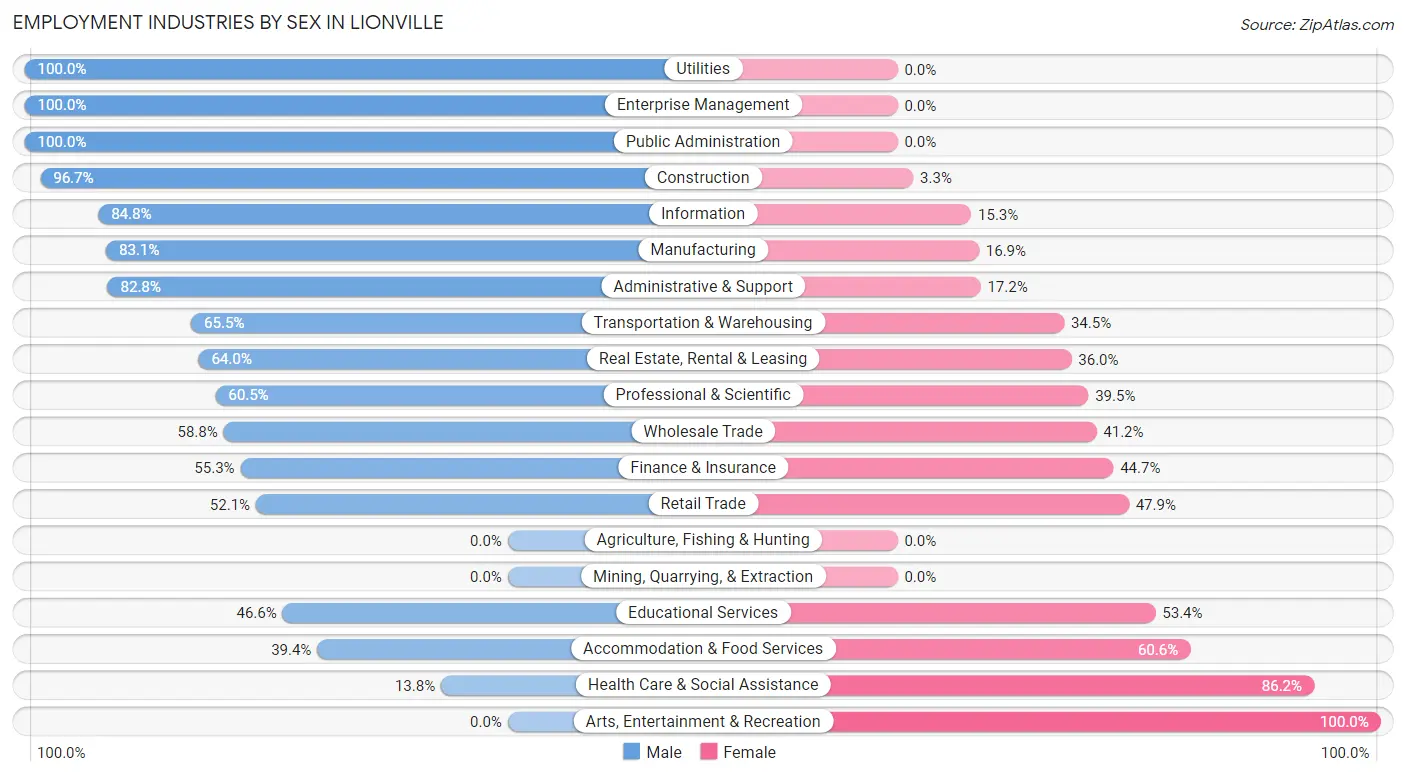
Employment Industries by Sex in Lionville
The Lionville industries that see more men than women are Utilities (100.0%), Enterprise Management (100.0%), and Public Administration (100.0%), whereas the industries that tend to have a higher number of women are Arts, Entertainment & Recreation (100.0%), Health Care & Social Assistance (86.2%), and Accommodation & Food Services (60.6%).
| Industry | Male | Female |
| Agriculture, Fishing & Hunting | 0 (0.0%) | 0 (0.0%) |
| Mining, Quarrying, & Extraction | 0 (0.0%) | 0 (0.0%) |
| Construction | 208 (96.7%) | 7 (3.3%) |
| Manufacturing | 286 (83.1%) | 58 (16.9%) |
| Wholesale Trade | 80 (58.8%) | 56 (41.2%) |
| Retail Trade | 123 (52.1%) | 113 (47.9%) |
| Transportation & Warehousing | 38 (65.5%) | 20 (34.5%) |
| Utilities | 27 (100.0%) | 0 (0.0%) |
| Information | 50 (84.8%) | 9 (15.2%) |
| Finance & Insurance | 275 (55.3%) | 222 (44.7%) |
| Real Estate, Rental & Leasing | 48 (64.0%) | 27 (36.0%) |
| Professional & Scientific | 461 (60.5%) | 301 (39.5%) |
| Enterprise Management | 11 (100.0%) | 0 (0.0%) |
| Administrative & Support | 106 (82.8%) | 22 (17.2%) |
| Educational Services | 165 (46.6%) | 189 (53.4%) |
| Health Care & Social Assistance | 33 (13.8%) | 206 (86.2%) |
| Arts, Entertainment & Recreation | 0 (0.0%) | 111 (100.0%) |
| Accommodation & Food Services | 140 (39.4%) | 215 (60.6%) |
| Public Administration | 114 (100.0%) | 0 (0.0%) |
| Total | 2,324 (58.5%) | 1,648 (41.5%) |
Education in Lionville
School Enrollment in Lionville
The most common levels of schooling among the 1,410 students in Lionville are high school (380 | 27.0%), elementary school (355 | 25.2%), and college / undergraduate (317 | 22.5%).
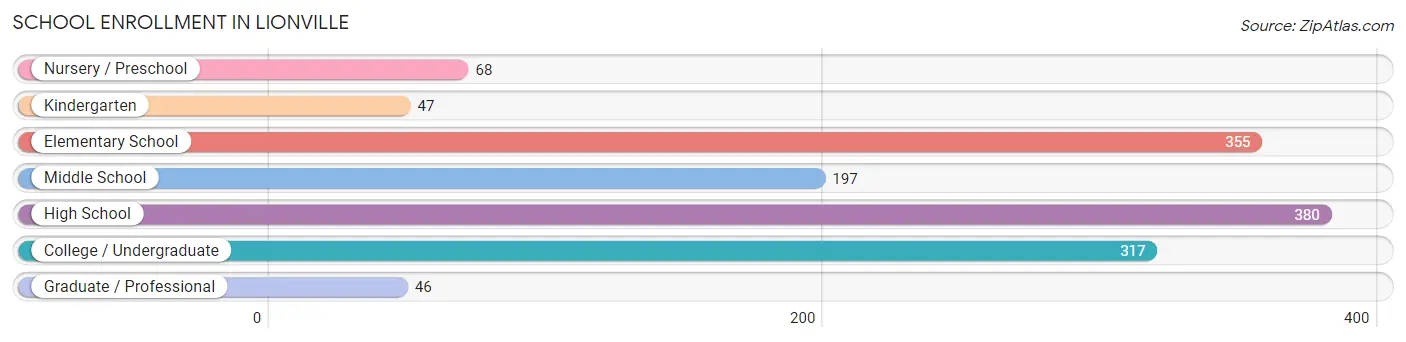
| School Level | # Students | % Students |
| Nursery / Preschool | 68 | 4.8% |
| Kindergarten | 47 | 3.3% |
| Elementary School | 355 | 25.2% |
| Middle School | 197 | 14.0% |
| High School | 380 | 27.0% |
| College / Undergraduate | 317 | 22.5% |
| Graduate / Professional | 46 | 3.3% |
| Total | 1,410 | 100.0% |
School Enrollment by Age by Funding Source in Lionville
Out of a total of 1,410 students who are enrolled in schools in Lionville, 216 (15.3%) attend a private institution, while the remaining 1,194 (84.7%) are enrolled in public schools. The age group of 25 to 34 year olds has the highest likelihood of being enrolled in private schools, with 42 (84.0% in the age bracket) enrolled. Conversely, the age group of 10 to 14 year olds has the lowest likelihood of being enrolled in a private school, with 393 (98.3% in the age bracket) attending a public institution.
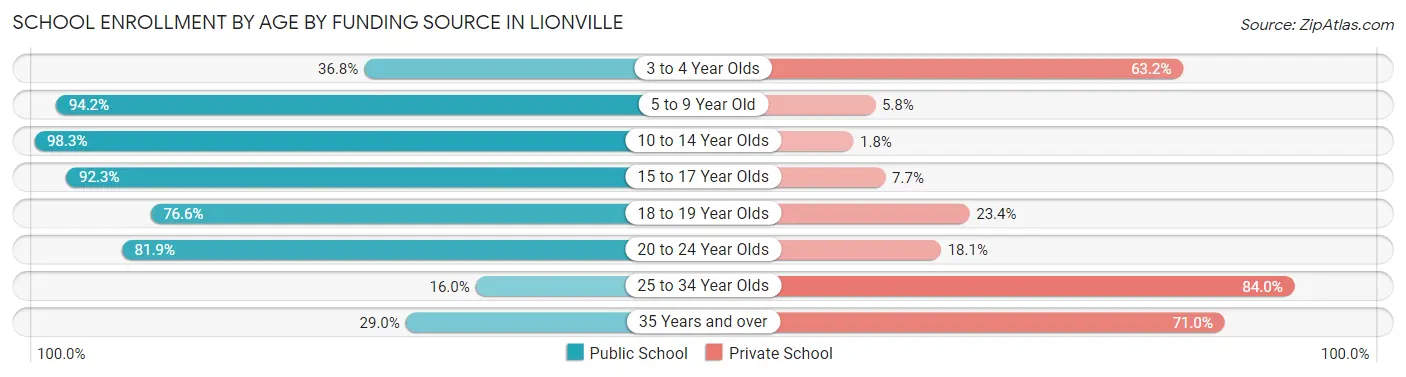
| Age Bracket | Public School | Private School |
| 3 to 4 Year Olds | 25 (36.8%) | 43 (63.2%) |
| 5 to 9 Year Old | 307 (94.2%) | 19 (5.8%) |
| 10 to 14 Year Olds | 393 (98.3%) | 7 (1.8%) |
| 15 to 17 Year Olds | 167 (92.3%) | 14 (7.7%) |
| 18 to 19 Year Olds | 72 (76.6%) | 22 (23.4%) |
| 20 to 24 Year Olds | 213 (81.9%) | 47 (18.1%) |
| 25 to 34 Year Olds | 8 (16.0%) | 42 (84.0%) |
| 35 Years and over | 9 (29.0%) | 22 (71.0%) |
| Total | 1,194 (84.7%) | 216 (15.3%) |
Educational Attainment by Field of Study in Lionville
Business (424 | 13.7%), computers & mathematics (303 | 9.8%), education (299 | 9.7%), psychology (284 | 9.2%), and science & technology (284 | 9.2%) are the most common fields of study among 3,090 individuals in Lionville who have obtained a bachelor's degree or higher.
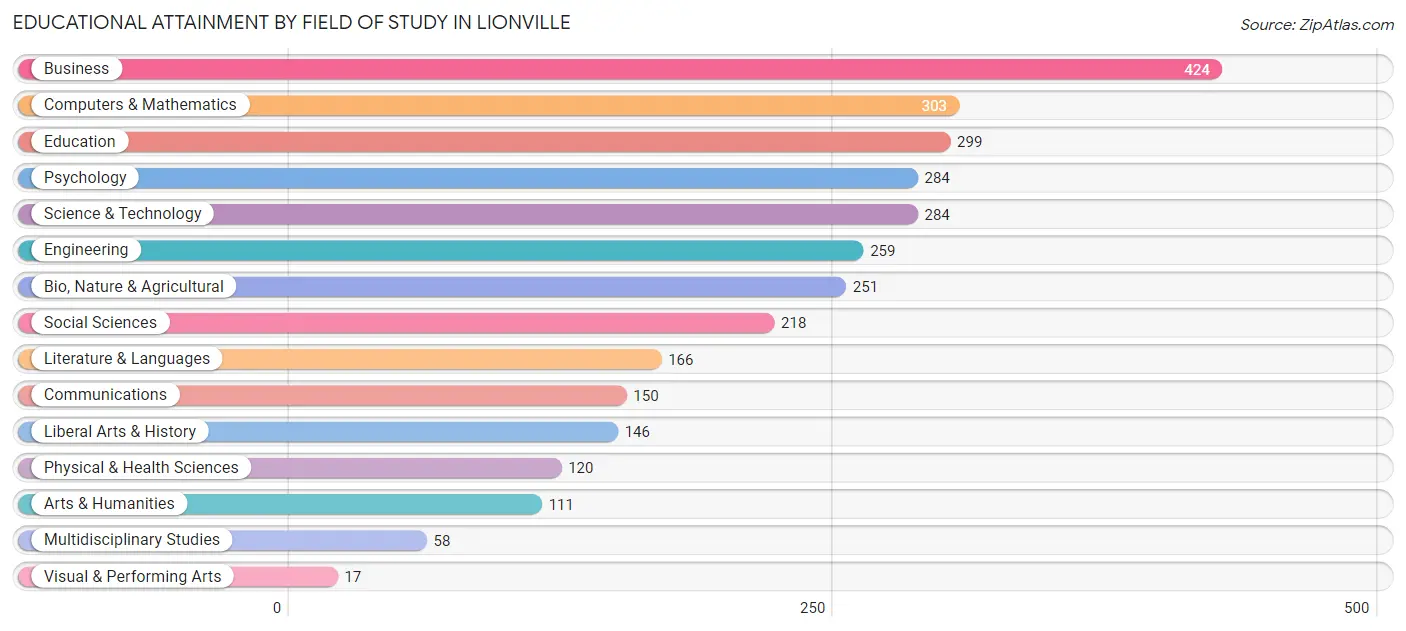
| Field of Study | # Graduates | % Graduates |
| Computers & Mathematics | 303 | 9.8% |
| Bio, Nature & Agricultural | 251 | 8.1% |
| Physical & Health Sciences | 120 | 3.9% |
| Psychology | 284 | 9.2% |
| Social Sciences | 218 | 7.1% |
| Engineering | 259 | 8.4% |
| Multidisciplinary Studies | 58 | 1.9% |
| Science & Technology | 284 | 9.2% |
| Business | 424 | 13.7% |
| Education | 299 | 9.7% |
| Literature & Languages | 166 | 5.4% |
| Liberal Arts & History | 146 | 4.7% |
| Visual & Performing Arts | 17 | 0.5% |
| Communications | 150 | 4.9% |
| Arts & Humanities | 111 | 3.6% |
| Total | 3,090 | 100.0% |
Transportation & Commute in Lionville
Vehicle Availability by Sex in Lionville
The most prevalent vehicle ownership categories in Lionville are males with 2 vehicles (1,158, accounting for 51.3%) and females with 2 vehicles (787, making up 70.3%).
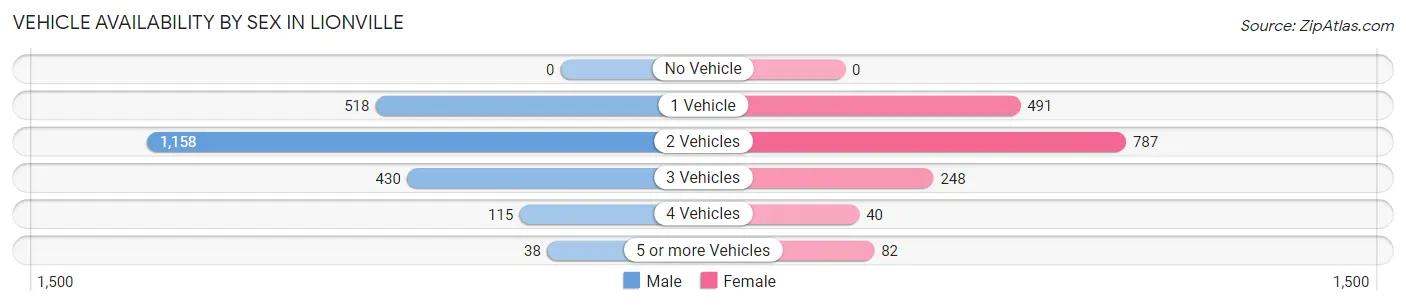
| Vehicles Available | Male | Female |
| No Vehicle | 0 (0.0%) | 0 (0.0%) |
| 1 Vehicle | 518 (22.9%) | 491 (29.8%) |
| 2 Vehicles | 1,158 (51.3%) | 787 (47.7%) |
| 3 Vehicles | 430 (19.0%) | 248 (15.0%) |
| 4 Vehicles | 115 (5.1%) | 40 (2.4%) |
| 5 or more Vehicles | 38 (1.7%) | 82 (5.0%) |
| Total | 2,259 (100.0%) | 1,648 (100.0%) |
Commute Time in Lionville
The most frequently occuring commute durations in Lionville are 5 to 9 minutes (669 commuters, 20.6%), 20 to 24 minutes (637 commuters, 19.6%), and 15 to 19 minutes (421 commuters, 13.0%).
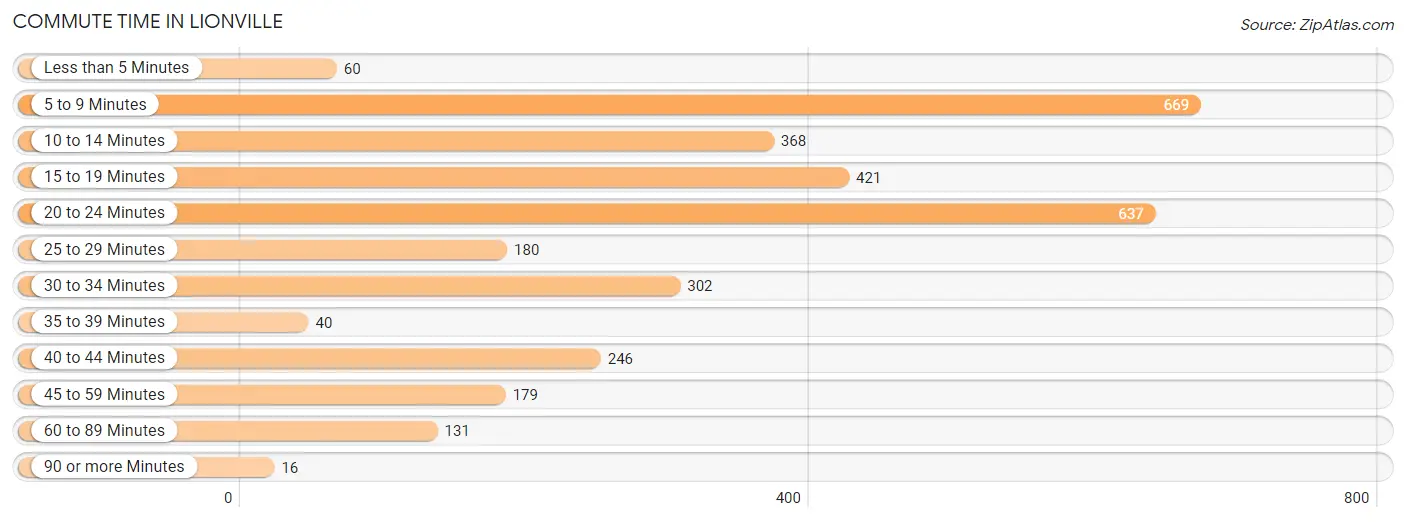
| Commute Time | # Commuters | % Commuters |
| Less than 5 Minutes | 60 | 1.8% |
| 5 to 9 Minutes | 669 | 20.6% |
| 10 to 14 Minutes | 368 | 11.3% |
| 15 to 19 Minutes | 421 | 13.0% |
| 20 to 24 Minutes | 637 | 19.6% |
| 25 to 29 Minutes | 180 | 5.5% |
| 30 to 34 Minutes | 302 | 9.3% |
| 35 to 39 Minutes | 40 | 1.2% |
| 40 to 44 Minutes | 246 | 7.6% |
| 45 to 59 Minutes | 179 | 5.5% |
| 60 to 89 Minutes | 131 | 4.0% |
| 90 or more Minutes | 16 | 0.5% |
Commute Time by Sex in Lionville
The most common commute times in Lionville are 20 to 24 minutes (498 commuters, 25.9%) for males and 5 to 9 minutes (387 commuters, 29.2%) for females.
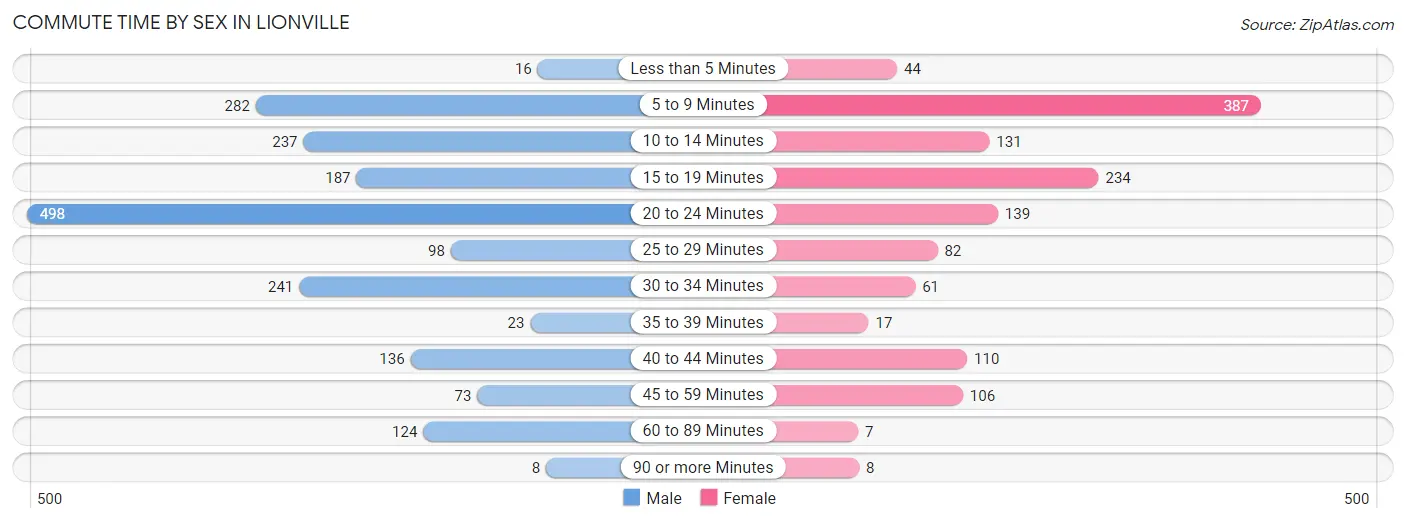
| Commute Time | Male | Female |
| Less than 5 Minutes | 16 (0.8%) | 44 (3.3%) |
| 5 to 9 Minutes | 282 (14.7%) | 387 (29.2%) |
| 10 to 14 Minutes | 237 (12.3%) | 131 (9.9%) |
| 15 to 19 Minutes | 187 (9.7%) | 234 (17.6%) |
| 20 to 24 Minutes | 498 (25.9%) | 139 (10.5%) |
| 25 to 29 Minutes | 98 (5.1%) | 82 (6.2%) |
| 30 to 34 Minutes | 241 (12.5%) | 61 (4.6%) |
| 35 to 39 Minutes | 23 (1.2%) | 17 (1.3%) |
| 40 to 44 Minutes | 136 (7.1%) | 110 (8.3%) |
| 45 to 59 Minutes | 73 (3.8%) | 106 (8.0%) |
| 60 to 89 Minutes | 124 (6.5%) | 7 (0.5%) |
| 90 or more Minutes | 8 (0.4%) | 8 (0.6%) |
Time of Departure to Work by Sex in Lionville
The most frequent times of departure to work in Lionville are 7:30 AM to 7:59 AM (347, 18.0%) for males and 7:30 AM to 7:59 AM (202, 15.2%) for females.
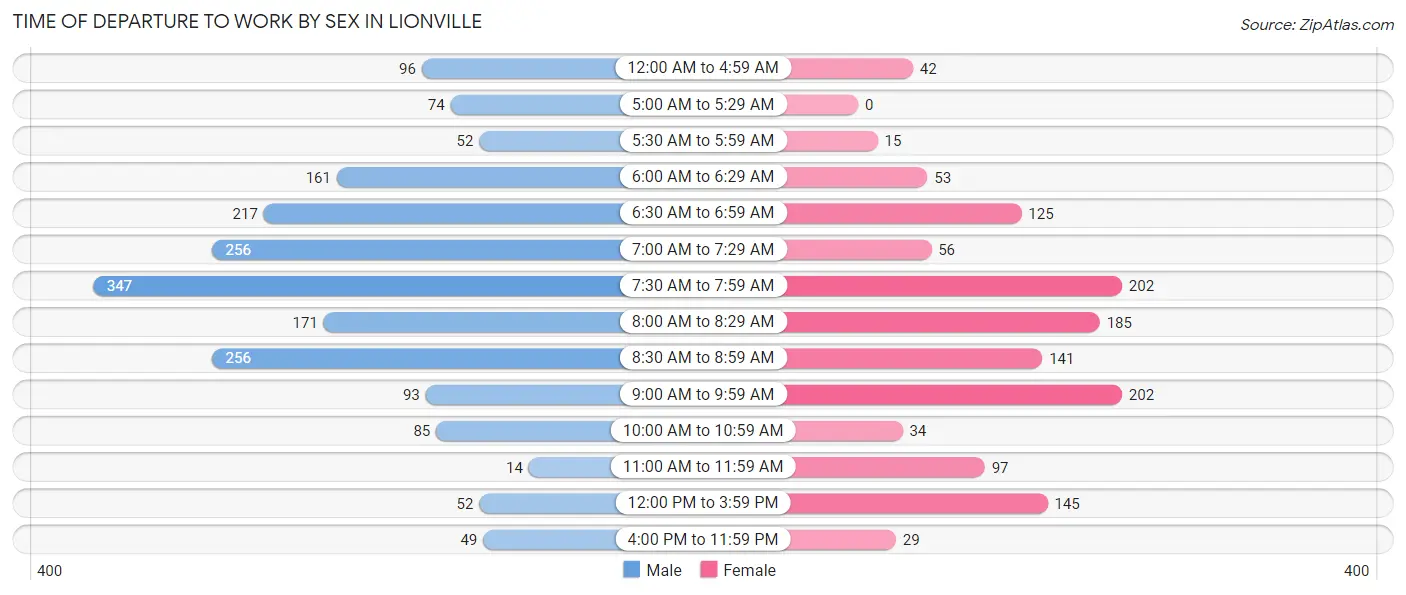
| Time of Departure | Male | Female |
| 12:00 AM to 4:59 AM | 96 (5.0%) | 42 (3.2%) |
| 5:00 AM to 5:29 AM | 74 (3.8%) | 0 (0.0%) |
| 5:30 AM to 5:59 AM | 52 (2.7%) | 15 (1.1%) |
| 6:00 AM to 6:29 AM | 161 (8.4%) | 53 (4.0%) |
| 6:30 AM to 6:59 AM | 217 (11.3%) | 125 (9.4%) |
| 7:00 AM to 7:29 AM | 256 (13.3%) | 56 (4.2%) |
| 7:30 AM to 7:59 AM | 347 (18.0%) | 202 (15.2%) |
| 8:00 AM to 8:29 AM | 171 (8.9%) | 185 (14.0%) |
| 8:30 AM to 8:59 AM | 256 (13.3%) | 141 (10.6%) |
| 9:00 AM to 9:59 AM | 93 (4.8%) | 202 (15.2%) |
| 10:00 AM to 10:59 AM | 85 (4.4%) | 34 (2.6%) |
| 11:00 AM to 11:59 AM | 14 (0.7%) | 97 (7.3%) |
| 12:00 PM to 3:59 PM | 52 (2.7%) | 145 (10.9%) |
| 4:00 PM to 11:59 PM | 49 (2.5%) | 29 (2.2%) |
| Total | 1,923 (100.0%) | 1,326 (100.0%) |
Housing Occupancy in Lionville
Occupancy by Ownership in Lionville
Of the total 3,043 dwellings in Lionville, owner-occupied units account for 1,690 (55.5%), while renter-occupied units make up 1,353 (44.5%).
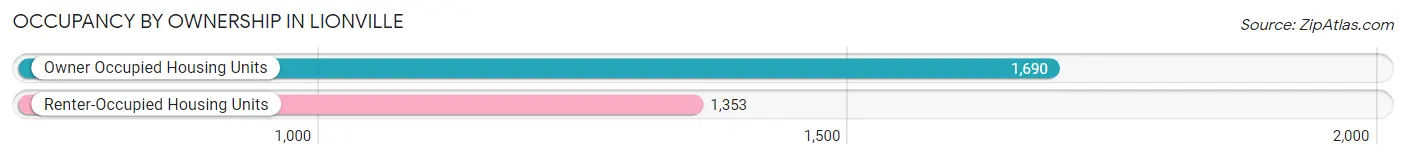
| Occupancy | # Housing Units | % Housing Units |
| Owner Occupied Housing Units | 1,690 | 55.5% |
| Renter-Occupied Housing Units | 1,353 | 44.5% |
| Total Occupied Housing Units | 3,043 | 100.0% |
Occupancy by Household Size in Lionville
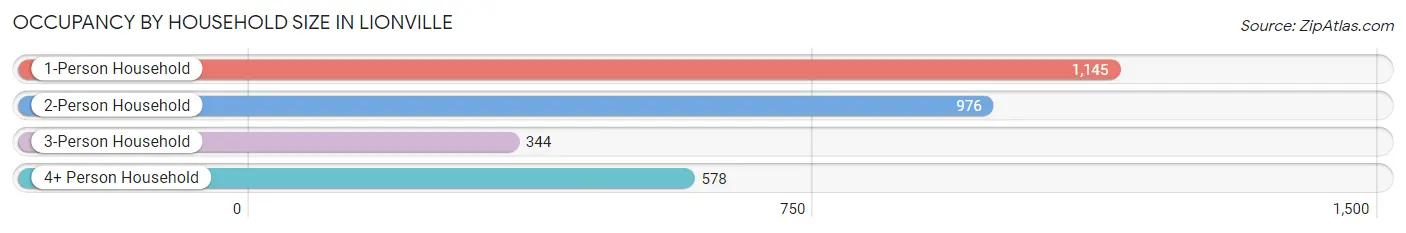
| Household Size | # Housing Units | % Housing Units |
| 1-Person Household | 1,145 | 37.6% |
| 2-Person Household | 976 | 32.1% |
| 3-Person Household | 344 | 11.3% |
| 4+ Person Household | 578 | 19.0% |
| Total Housing Units | 3,043 | 100.0% |
Occupancy by Ownership by Household Size in Lionville
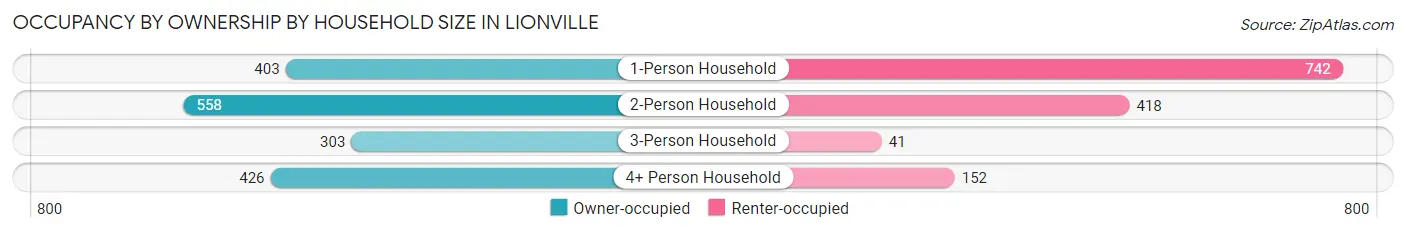
| Household Size | Owner-occupied | Renter-occupied |
| 1-Person Household | 403 (35.2%) | 742 (64.8%) |
| 2-Person Household | 558 (57.2%) | 418 (42.8%) |
| 3-Person Household | 303 (88.1%) | 41 (11.9%) |
| 4+ Person Household | 426 (73.7%) | 152 (26.3%) |
| Total Housing Units | 1,690 (55.5%) | 1,353 (44.5%) |
Occupancy by Educational Attainment in Lionville
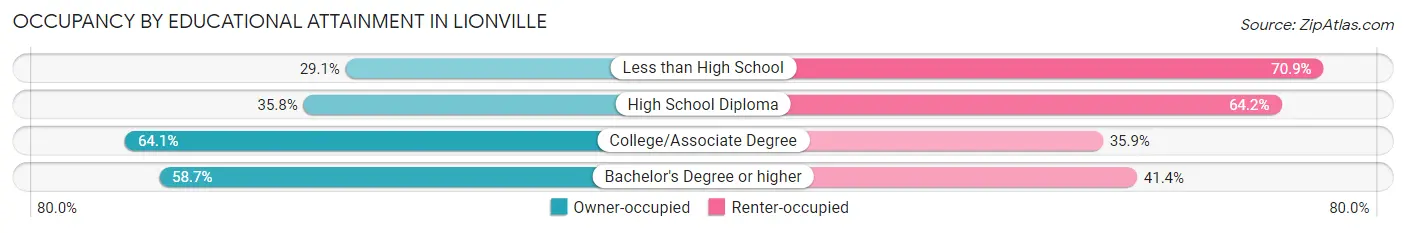
| Household Size | Owner-occupied | Renter-occupied |
| Less than High School | 25 (29.1%) | 61 (70.9%) |
| High School Diploma | 167 (35.8%) | 300 (64.2%) |
| College/Associate Degree | 444 (64.1%) | 249 (35.9%) |
| Bachelor's Degree or higher | 1,054 (58.7%) | 743 (41.3%) |
Occupancy by Age of Householder in Lionville
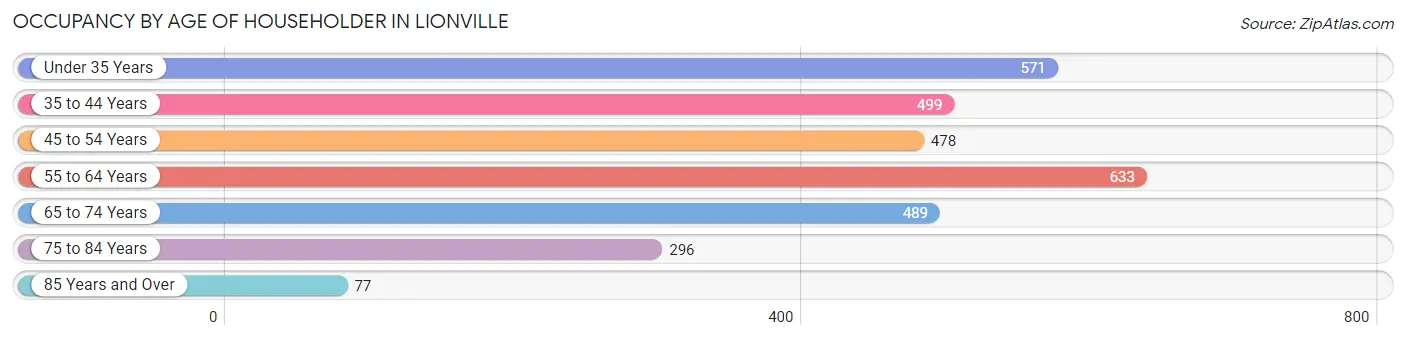
| Age Bracket | # Households | % Households |
| Under 35 Years | 571 | 18.8% |
| 35 to 44 Years | 499 | 16.4% |
| 45 to 54 Years | 478 | 15.7% |
| 55 to 64 Years | 633 | 20.8% |
| 65 to 74 Years | 489 | 16.1% |
| 75 to 84 Years | 296 | 9.7% |
| 85 Years and Over | 77 | 2.5% |
| Total | 3,043 | 100.0% |
Housing Finances in Lionville
Median Income by Occupancy in Lionville
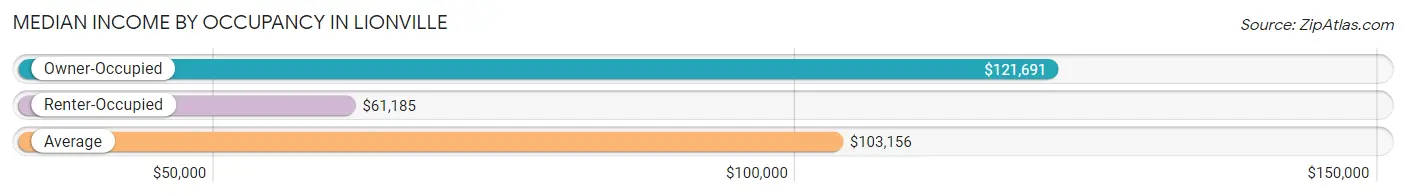
| Occupancy Type | # Households | Median Income |
| Owner-Occupied | 1,690 (55.5%) | $121,691 |
| Renter-Occupied | 1,353 (44.5%) | $61,185 |
| Average | 3,043 (100.0%) | $103,156 |
Occupancy by Householder Income Bracket in Lionville
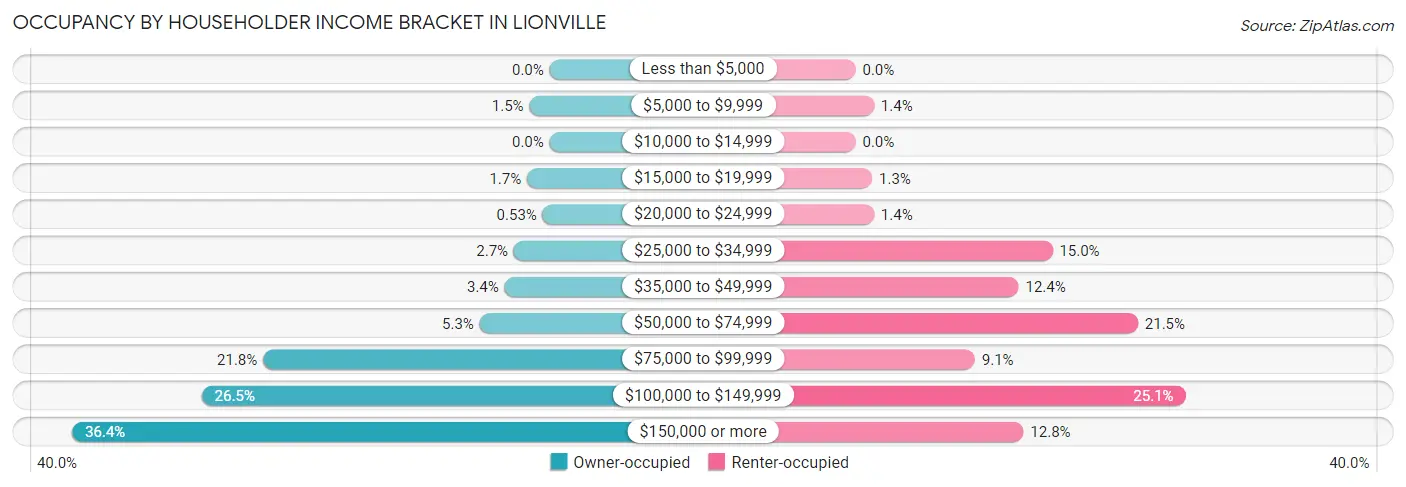
| Income Bracket | Owner-occupied | Renter-occupied |
| Less than $5,000 | 0 (0.0%) | 0 (0.0%) |
| $5,000 to $9,999 | 26 (1.5%) | 19 (1.4%) |
| $10,000 to $14,999 | 0 (0.0%) | 0 (0.0%) |
| $15,000 to $19,999 | 29 (1.7%) | 17 (1.3%) |
| $20,000 to $24,999 | 9 (0.5%) | 19 (1.4%) |
| $25,000 to $34,999 | 46 (2.7%) | 203 (15.0%) |
| $35,000 to $49,999 | 58 (3.4%) | 168 (12.4%) |
| $50,000 to $74,999 | 90 (5.3%) | 291 (21.5%) |
| $75,000 to $99,999 | 369 (21.8%) | 123 (9.1%) |
| $100,000 to $149,999 | 448 (26.5%) | 340 (25.1%) |
| $150,000 or more | 615 (36.4%) | 173 (12.8%) |
| Total | 1,690 (100.0%) | 1,353 (100.0%) |
Monthly Housing Cost Tiers in Lionville
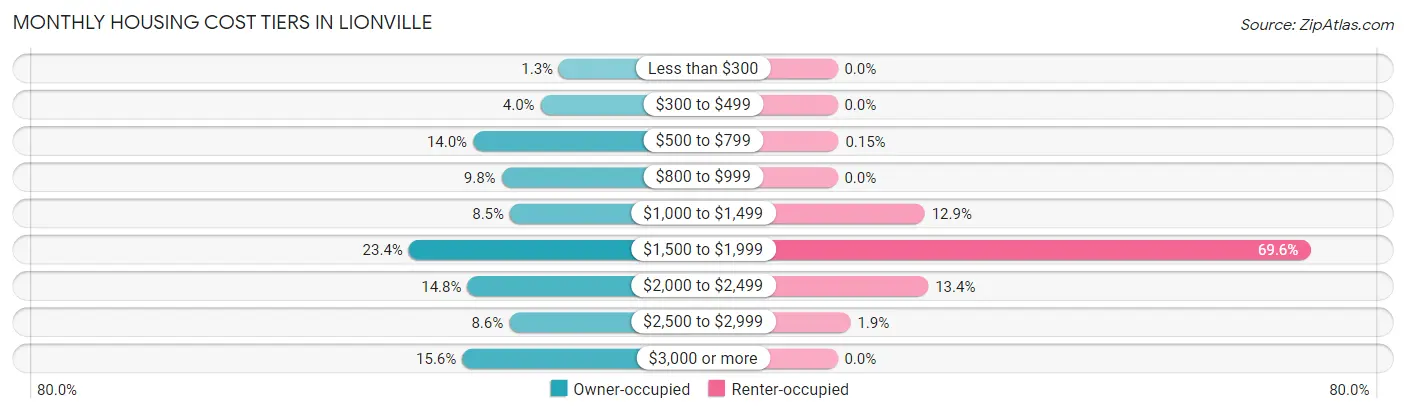
| Monthly Cost | Owner-occupied | Renter-occupied |
| Less than $300 | 22 (1.3%) | 0 (0.0%) |
| $300 to $499 | 68 (4.0%) | 0 (0.0%) |
| $500 to $799 | 236 (14.0%) | 2 (0.2%) |
| $800 to $999 | 165 (9.8%) | 0 (0.0%) |
| $1,000 to $1,499 | 144 (8.5%) | 174 (12.9%) |
| $1,500 to $1,999 | 396 (23.4%) | 942 (69.6%) |
| $2,000 to $2,499 | 250 (14.8%) | 181 (13.4%) |
| $2,500 to $2,999 | 146 (8.6%) | 26 (1.9%) |
| $3,000 or more | 263 (15.6%) | 0 (0.0%) |
| Total | 1,690 (100.0%) | 1,353 (100.0%) |
Physical Housing Characteristics in Lionville
Housing Structures in Lionville
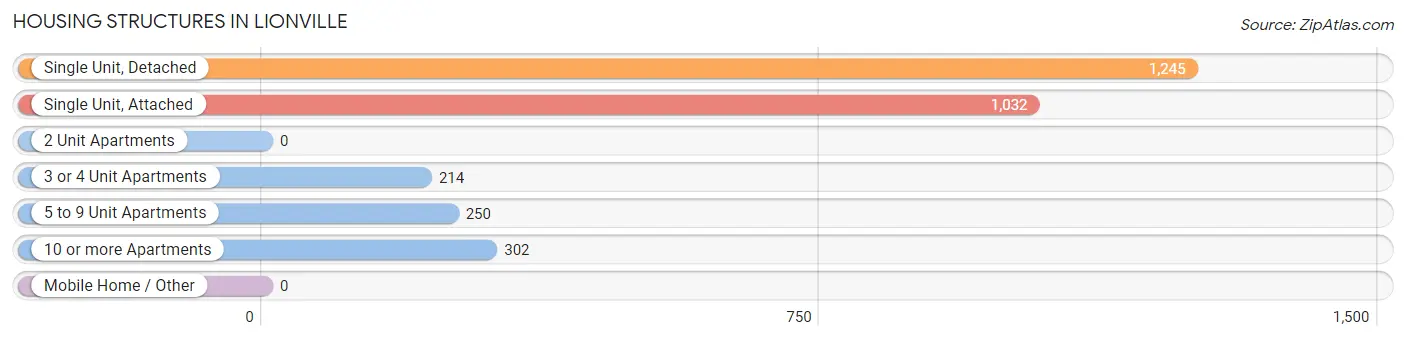
| Structure Type | # Housing Units | % Housing Units |
| Single Unit, Detached | 1,245 | 40.9% |
| Single Unit, Attached | 1,032 | 33.9% |
| 2 Unit Apartments | 0 | 0.0% |
| 3 or 4 Unit Apartments | 214 | 7.0% |
| 5 to 9 Unit Apartments | 250 | 8.2% |
| 10 or more Apartments | 302 | 9.9% |
| Mobile Home / Other | 0 | 0.0% |
| Total | 3,043 | 100.0% |
Housing Structures by Occupancy in Lionville
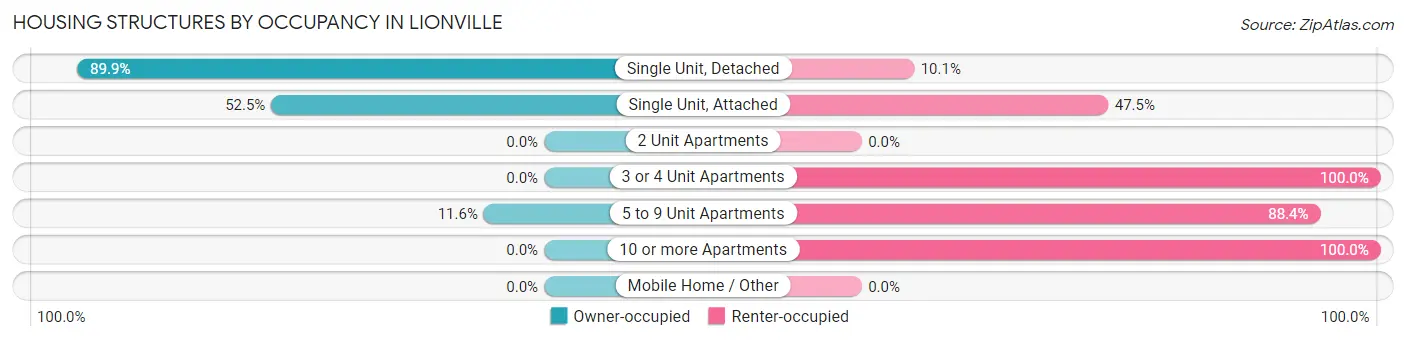
| Structure Type | Owner-occupied | Renter-occupied |
| Single Unit, Detached | 1,119 (89.9%) | 126 (10.1%) |
| Single Unit, Attached | 542 (52.5%) | 490 (47.5%) |
| 2 Unit Apartments | 0 (0.0%) | 0 (0.0%) |
| 3 or 4 Unit Apartments | 0 (0.0%) | 214 (100.0%) |
| 5 to 9 Unit Apartments | 29 (11.6%) | 221 (88.4%) |
| 10 or more Apartments | 0 (0.0%) | 302 (100.0%) |
| Mobile Home / Other | 0 (0.0%) | 0 (0.0%) |
| Total | 1,690 (55.5%) | 1,353 (44.5%) |
Housing Structures by Number of Rooms in Lionville
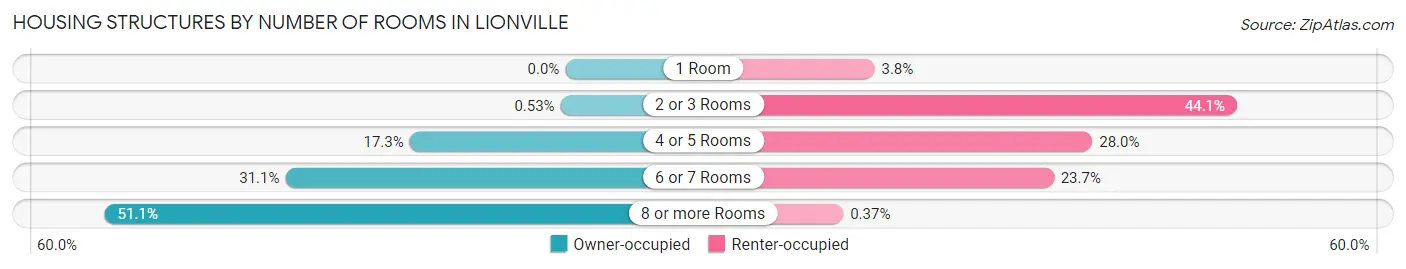
| Number of Rooms | Owner-occupied | Renter-occupied |
| 1 Room | 0 (0.0%) | 52 (3.8%) |
| 2 or 3 Rooms | 9 (0.5%) | 596 (44.1%) |
| 4 or 5 Rooms | 292 (17.3%) | 379 (28.0%) |
| 6 or 7 Rooms | 525 (31.1%) | 321 (23.7%) |
| 8 or more Rooms | 864 (51.1%) | 5 (0.4%) |
| Total | 1,690 (100.0%) | 1,353 (100.0%) |
Housing Structure by Heating Type in Lionville
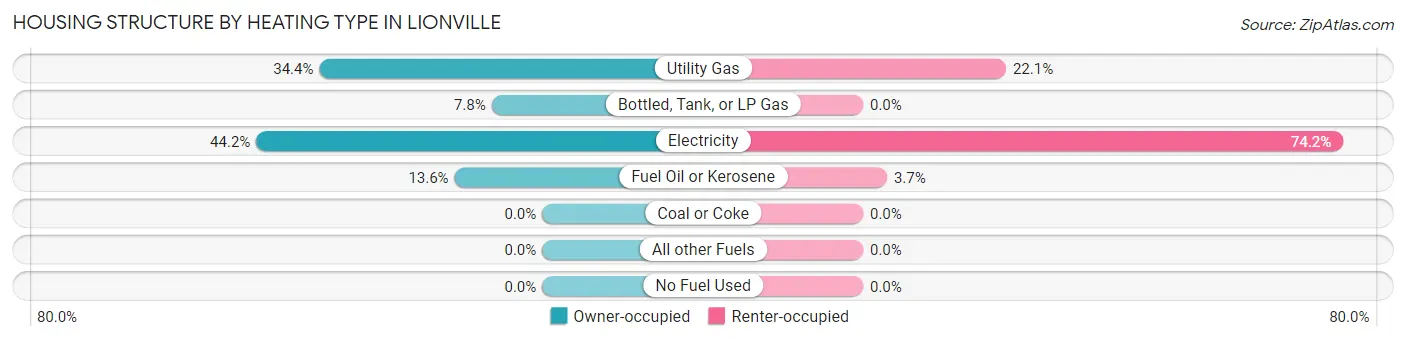
| Heating Type | Owner-occupied | Renter-occupied |
| Utility Gas | 582 (34.4%) | 299 (22.1%) |
| Bottled, Tank, or LP Gas | 132 (7.8%) | 0 (0.0%) |
| Electricity | 747 (44.2%) | 1,004 (74.2%) |
| Fuel Oil or Kerosene | 229 (13.6%) | 50 (3.7%) |
| Coal or Coke | 0 (0.0%) | 0 (0.0%) |
| All other Fuels | 0 (0.0%) | 0 (0.0%) |
| No Fuel Used | 0 (0.0%) | 0 (0.0%) |
| Total | 1,690 (100.0%) | 1,353 (100.0%) |
Household Vehicle Usage in Lionville
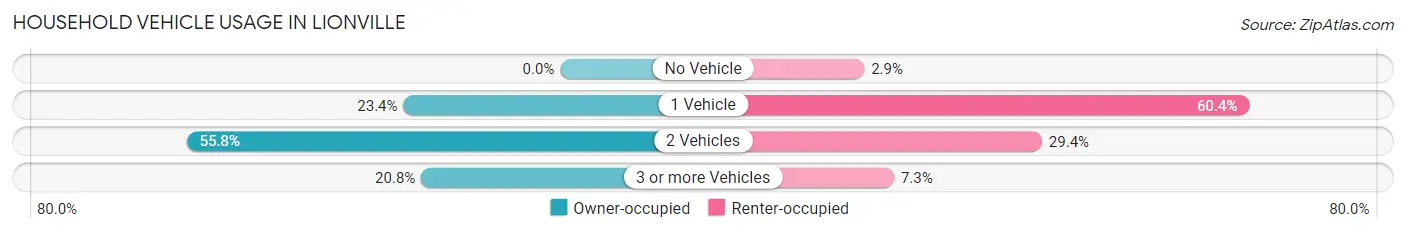
| Vehicles per Household | Owner-occupied | Renter-occupied |
| No Vehicle | 0 (0.0%) | 39 (2.9%) |
| 1 Vehicle | 396 (23.4%) | 817 (60.4%) |
| 2 Vehicles | 943 (55.8%) | 398 (29.4%) |
| 3 or more Vehicles | 351 (20.8%) | 99 (7.3%) |
| Total | 1,690 (100.0%) | 1,353 (100.0%) |
Real Estate & Mortgages in Lionville
Real Estate and Mortgage Overview in Lionville
| Characteristic | Without Mortgage | With Mortgage |
| Housing Units | 495 | 1,195 |
| Median Property Value | $387,600 | $418,500 |
| Median Household Income | $102,422 | $487 |
| Monthly Housing Costs | $704 | $263 |
| Real Estate Taxes | $4,206 | $0 |
Property Value by Mortgage Status in Lionville
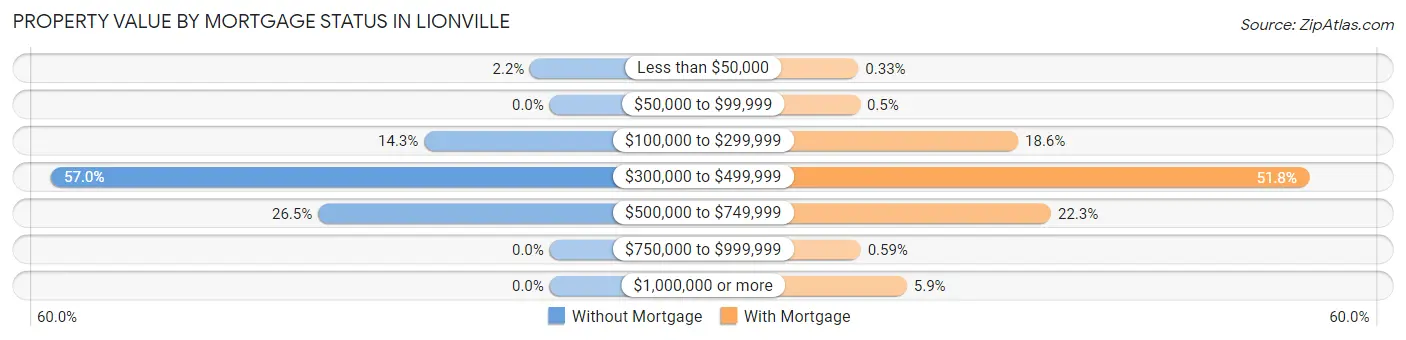
| Property Value | Without Mortgage | With Mortgage |
| Less than $50,000 | 11 (2.2%) | 4 (0.3%) |
| $50,000 to $99,999 | 0 (0.0%) | 6 (0.5%) |
| $100,000 to $299,999 | 71 (14.3%) | 222 (18.6%) |
| $300,000 to $499,999 | 282 (57.0%) | 619 (51.8%) |
| $500,000 to $749,999 | 131 (26.5%) | 267 (22.3%) |
| $750,000 to $999,999 | 0 (0.0%) | 7 (0.6%) |
| $1,000,000 or more | 0 (0.0%) | 70 (5.9%) |
| Total | 495 (100.0%) | 1,195 (100.0%) |
Household Income by Mortgage Status in Lionville
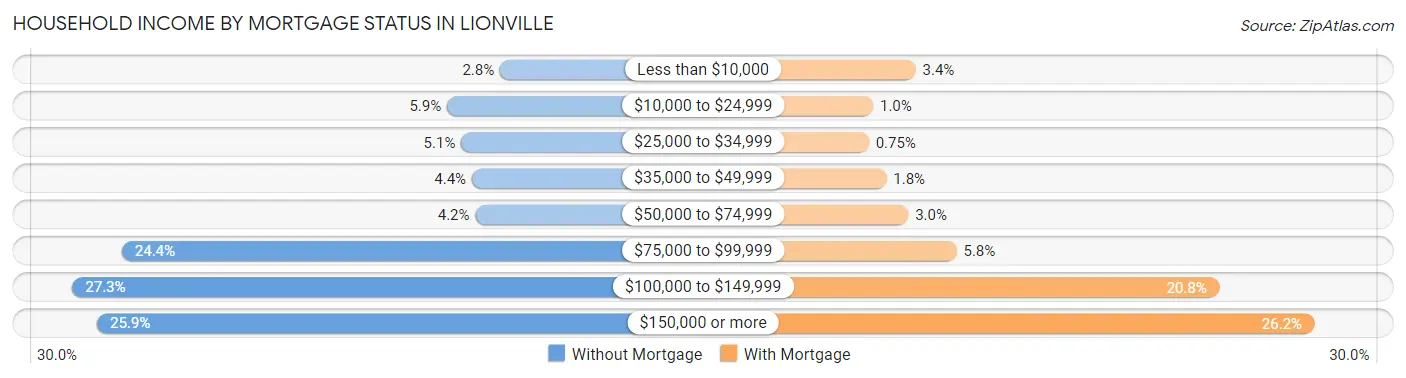
| Household Income | Without Mortgage | With Mortgage |
| Less than $10,000 | 14 (2.8%) | 41 (3.4%) |
| $10,000 to $24,999 | 29 (5.9%) | 12 (1.0%) |
| $25,000 to $34,999 | 25 (5.1%) | 9 (0.7%) |
| $35,000 to $49,999 | 22 (4.4%) | 21 (1.8%) |
| $50,000 to $74,999 | 21 (4.2%) | 36 (3.0%) |
| $75,000 to $99,999 | 121 (24.4%) | 69 (5.8%) |
| $100,000 to $149,999 | 135 (27.3%) | 248 (20.7%) |
| $150,000 or more | 128 (25.9%) | 313 (26.2%) |
| Total | 495 (100.0%) | 1,195 (100.0%) |
Property Value to Household Income Ratio in Lionville
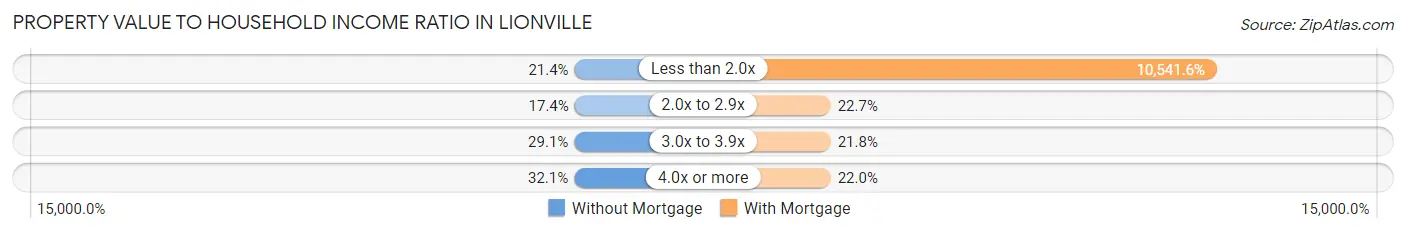
| Value-to-Income Ratio | Without Mortgage | With Mortgage |
| Less than 2.0x | 106 (21.4%) | 125,972 (10,541.6%) |
| 2.0x to 2.9x | 86 (17.4%) | 271 (22.7%) |
| 3.0x to 3.9x | 144 (29.1%) | 261 (21.8%) |
| 4.0x or more | 159 (32.1%) | 263 (22.0%) |
| Total | 495 (100.0%) | 1,195 (100.0%) |
Real Estate Taxes by Mortgage Status in Lionville
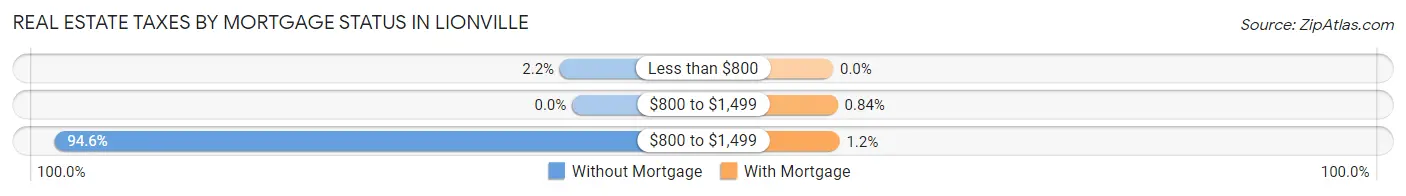
| Property Taxes | Without Mortgage | With Mortgage |
| Less than $800 | 11 (2.2%) | 0 (0.0%) |
| $800 to $1,499 | 0 (0.0%) | 10 (0.8%) |
| $800 to $1,499 | 468 (94.6%) | 14 (1.2%) |
| Total | 495 (100.0%) | 1,195 (100.0%) |
Health & Disability in Lionville
Health Insurance Coverage by Age in Lionville
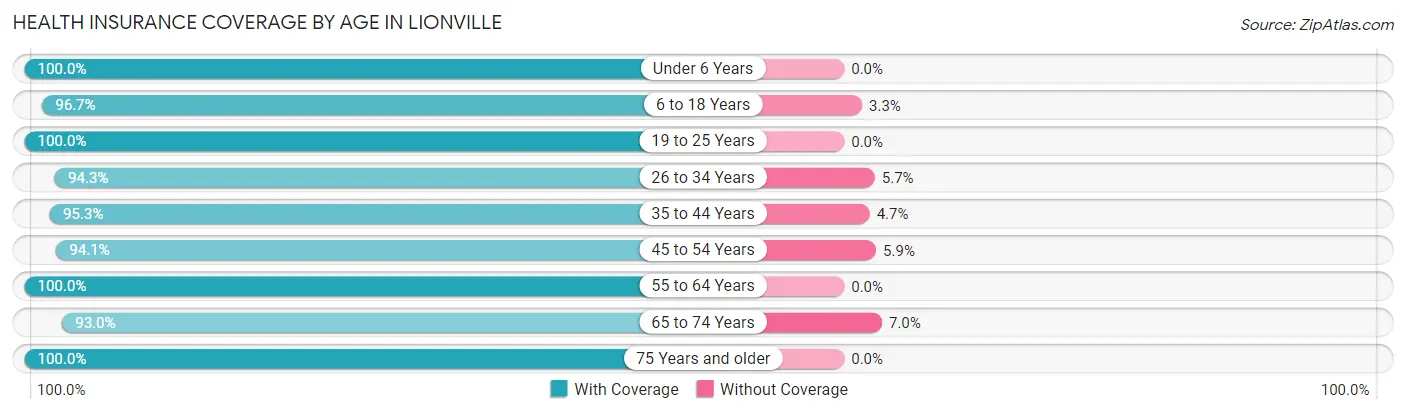
| Age Bracket | With Coverage | Without Coverage |
| Under 6 Years | 464 (100.0%) | 0 (0.0%) |
| 6 to 18 Years | 931 (96.7%) | 32 (3.3%) |
| 19 to 25 Years | 530 (100.0%) | 0 (0.0%) |
| 26 to 34 Years | 844 (94.3%) | 51 (5.7%) |
| 35 to 44 Years | 784 (95.3%) | 39 (4.7%) |
| 45 to 54 Years | 807 (94.1%) | 51 (5.9%) |
| 55 to 64 Years | 851 (100.0%) | 0 (0.0%) |
| 65 to 74 Years | 845 (93.0%) | 64 (7.0%) |
| 75 Years and older | 420 (100.0%) | 0 (0.0%) |
| Total | 6,476 (96.5%) | 237 (3.5%) |
Health Insurance Coverage by Citizenship Status in Lionville
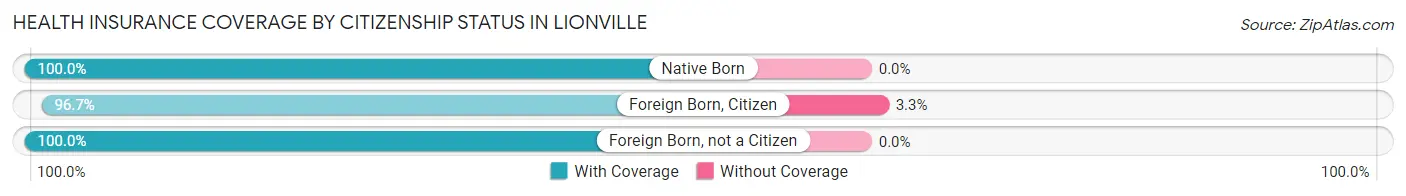
| Citizenship Status | With Coverage | Without Coverage |
| Native Born | 464 (100.0%) | 0 (0.0%) |
| Foreign Born, Citizen | 931 (96.7%) | 32 (3.3%) |
| Foreign Born, not a Citizen | 530 (100.0%) | 0 (0.0%) |
Health Insurance Coverage by Household Income in Lionville
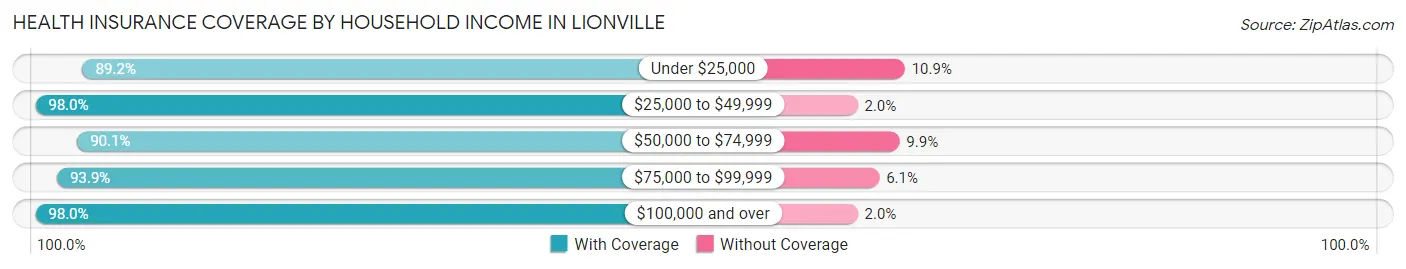
| Household Income | With Coverage | Without Coverage |
| Under $25,000 | 115 (89.1%) | 14 (10.8%) |
| $25,000 to $49,999 | 684 (98.0%) | 14 (2.0%) |
| $50,000 to $74,999 | 457 (90.1%) | 50 (9.9%) |
| $75,000 to $99,999 | 1,176 (93.9%) | 76 (6.1%) |
| $100,000 and over | 4,031 (98.0%) | 83 (2.0%) |
Public vs Private Health Insurance Coverage by Age in Lionville
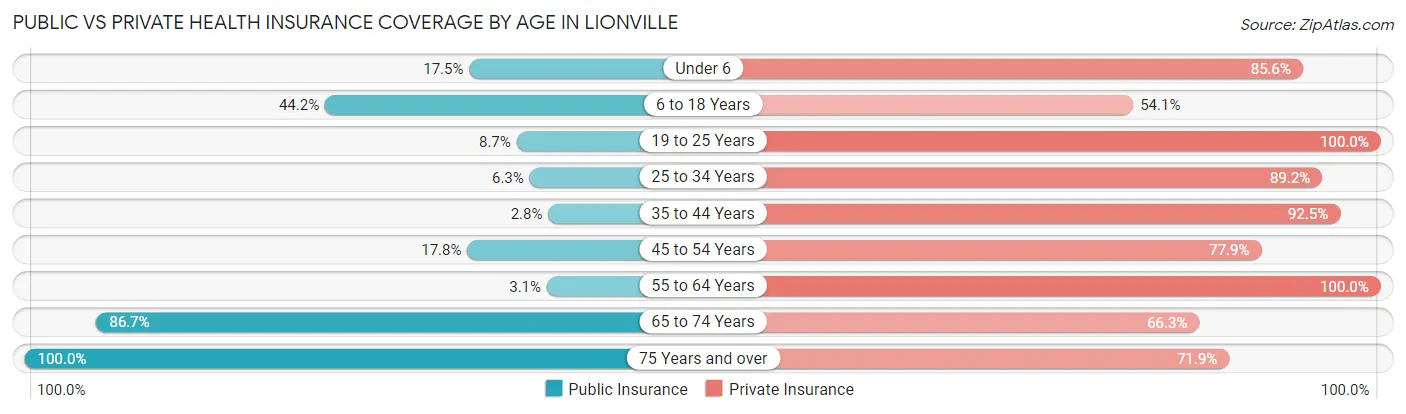
| Age Bracket | Public Insurance | Private Insurance |
| Under 6 | 81 (17.5%) | 397 (85.6%) |
| 6 to 18 Years | 426 (44.2%) | 521 (54.1%) |
| 19 to 25 Years | 46 (8.7%) | 530 (100.0%) |
| 25 to 34 Years | 56 (6.3%) | 798 (89.2%) |
| 35 to 44 Years | 23 (2.8%) | 761 (92.5%) |
| 45 to 54 Years | 153 (17.8%) | 668 (77.9%) |
| 55 to 64 Years | 26 (3.1%) | 851 (100.0%) |
| 65 to 74 Years | 788 (86.7%) | 603 (66.3%) |
| 75 Years and over | 420 (100.0%) | 302 (71.9%) |
| Total | 2,019 (30.1%) | 5,431 (80.9%) |
Disability Status by Sex by Age in Lionville
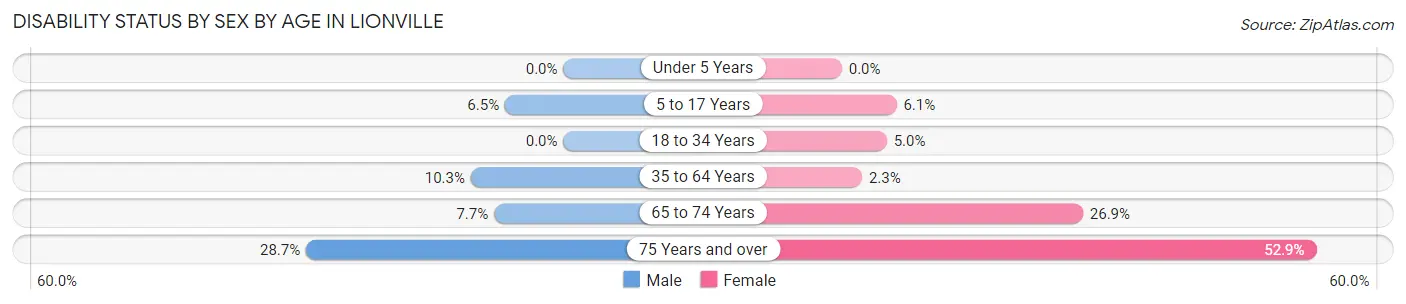
| Age Bracket | Male | Female |
| Under 5 Years | 0 (0.0%) | 0 (0.0%) |
| 5 to 17 Years | 28 (6.5%) | 29 (6.1%) |
| 18 to 34 Years | 0 (0.0%) | 33 (5.0%) |
| 35 to 64 Years | 133 (10.3%) | 28 (2.2%) |
| 65 to 74 Years | 40 (7.7%) | 105 (26.9%) |
| 75 Years and over | 45 (28.7%) | 139 (52.8%) |
Disability Class by Sex by Age in Lionville
Disability Class: Hearing Difficulty
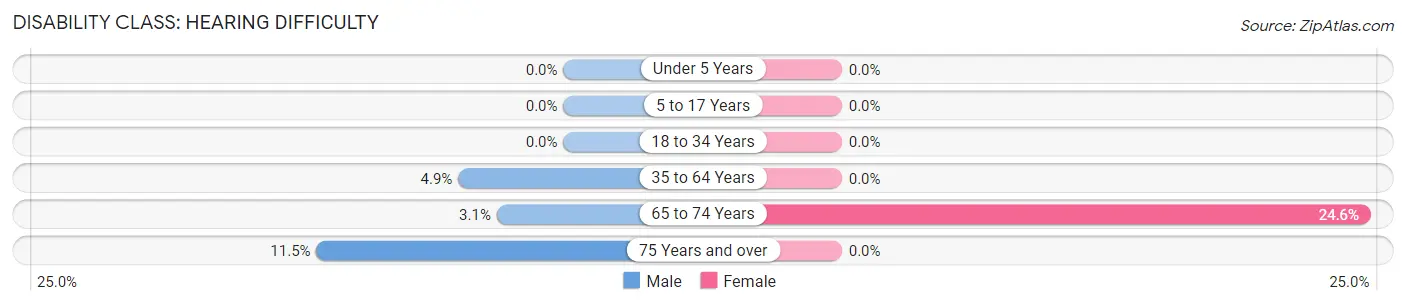
| Age Bracket | Male | Female |
| Under 5 Years | 0 (0.0%) | 0 (0.0%) |
| 5 to 17 Years | 0 (0.0%) | 0 (0.0%) |
| 18 to 34 Years | 0 (0.0%) | 0 (0.0%) |
| 35 to 64 Years | 63 (4.9%) | 0 (0.0%) |
| 65 to 74 Years | 16 (3.1%) | 96 (24.5%) |
| 75 Years and over | 18 (11.5%) | 0 (0.0%) |
Disability Class: Vision Difficulty
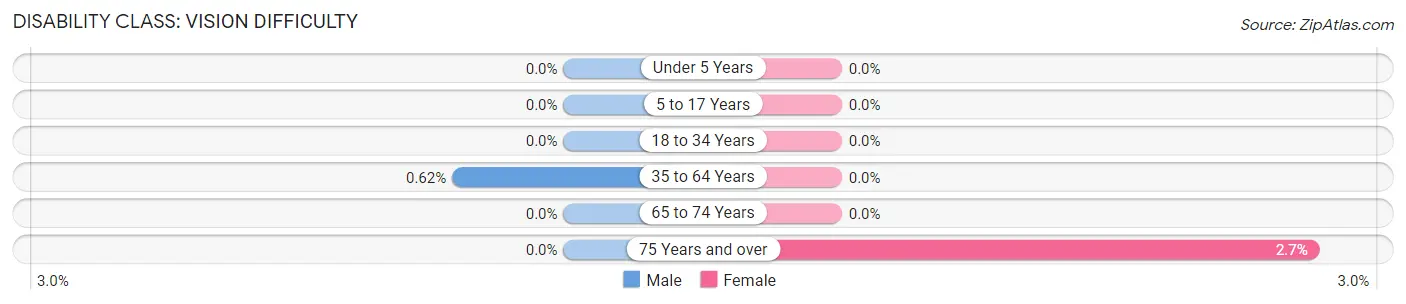
| Age Bracket | Male | Female |
| Under 5 Years | 0 (0.0%) | 0 (0.0%) |
| 5 to 17 Years | 0 (0.0%) | 0 (0.0%) |
| 18 to 34 Years | 0 (0.0%) | 0 (0.0%) |
| 35 to 64 Years | 8 (0.6%) | 0 (0.0%) |
| 65 to 74 Years | 0 (0.0%) | 0 (0.0%) |
| 75 Years and over | 0 (0.0%) | 7 (2.7%) |
Disability Class: Cognitive Difficulty
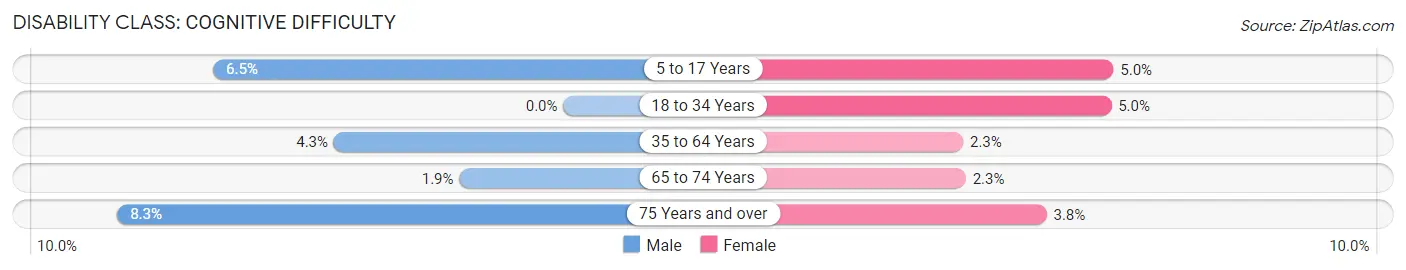
| Age Bracket | Male | Female |
| 5 to 17 Years | 28 (6.5%) | 24 (5.0%) |
| 18 to 34 Years | 0 (0.0%) | 33 (5.0%) |
| 35 to 64 Years | 55 (4.3%) | 28 (2.2%) |
| 65 to 74 Years | 10 (1.9%) | 9 (2.3%) |
| 75 Years and over | 13 (8.3%) | 10 (3.8%) |
Disability Class: Ambulatory Difficulty
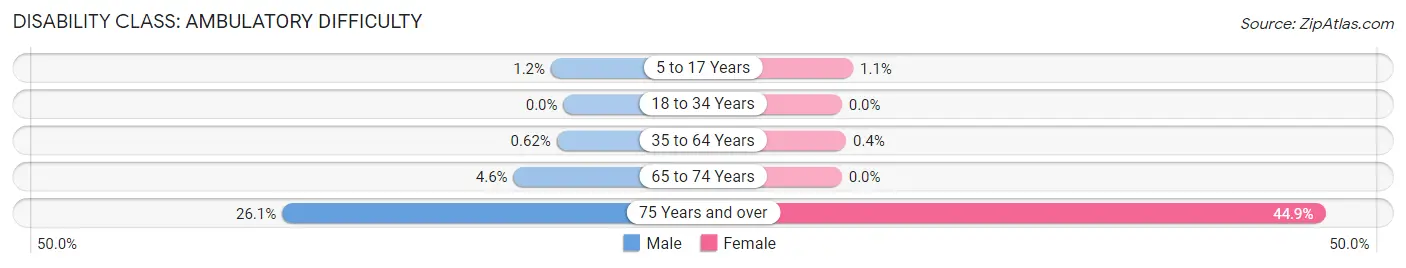
| Age Bracket | Male | Female |
| 5 to 17 Years | 5 (1.2%) | 5 (1.1%) |
| 18 to 34 Years | 0 (0.0%) | 0 (0.0%) |
| 35 to 64 Years | 8 (0.6%) | 5 (0.4%) |
| 65 to 74 Years | 24 (4.6%) | 0 (0.0%) |
| 75 Years and over | 41 (26.1%) | 118 (44.9%) |
Disability Class: Self-Care Difficulty
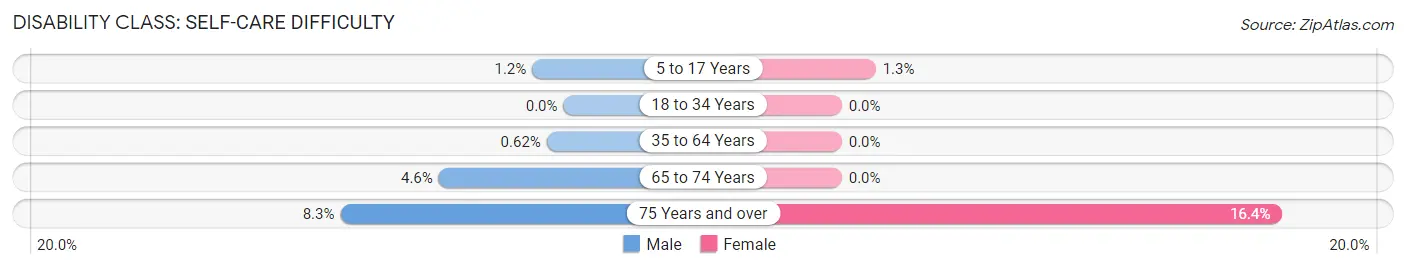
| Age Bracket | Male | Female |
| 5 to 17 Years | 5 (1.2%) | 6 (1.3%) |
| 18 to 34 Years | 0 (0.0%) | 0 (0.0%) |
| 35 to 64 Years | 8 (0.6%) | 0 (0.0%) |
| 65 to 74 Years | 24 (4.6%) | 0 (0.0%) |
| 75 Years and over | 13 (8.3%) | 43 (16.4%) |
Technology Access in Lionville
Computing Device Access in Lionville
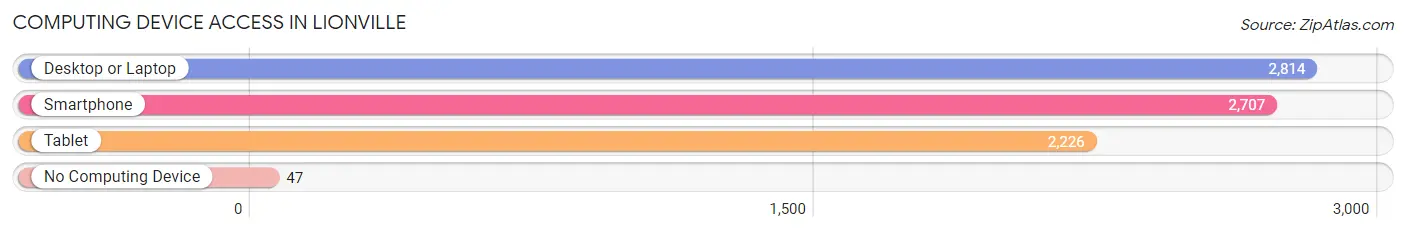
| Device Type | # Households | % Households |
| Desktop or Laptop | 2,814 | 92.5% |
| Smartphone | 2,707 | 89.0% |
| Tablet | 2,226 | 73.2% |
| No Computing Device | 47 | 1.5% |
| Total | 3,043 | 100.0% |
Internet Access in Lionville
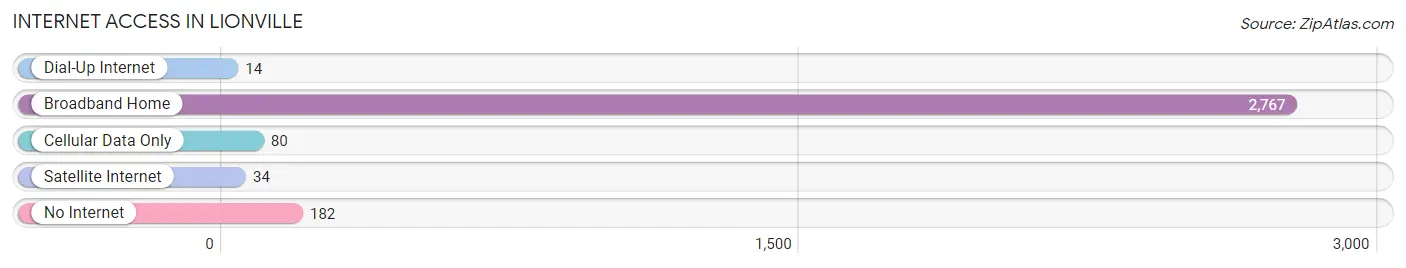
| Internet Type | # Households | % Households |
| Dial-Up Internet | 14 | 0.5% |
| Broadband Home | 2,767 | 90.9% |
| Cellular Data Only | 80 | 2.6% |
| Satellite Internet | 34 | 1.1% |
| No Internet | 182 | 6.0% |
| Total | 3,043 | 100.0% |
Lionville Summary
Lionville is a census-designated place (CDP) located in Uwchlan Township, Chester County, Pennsylvania. It is located in the southeastern corner of the state, about 25 miles west of Philadelphia. The population of Lionville was 8,845 at the 2010 census.
History
Lionville was first settled in the late 1700s by a group of Quakers from England. The area was originally known as “Uwchlan”, which is derived from the Welsh word for “highland”. The area was later renamed “Lionville” after the Lionville Hotel, which was built in 1820. The hotel was named after the lion that was carved into the stone above the entrance.
The area was primarily agricultural until the late 19th century, when the Pennsylvania Railroad built a line through the area. This allowed for the development of industry and commerce in the area, and the population began to grow.
Geography
Lionville is located at 40°3′17″N 75°35′45″W (40.054722, -75.595833). According to the United States Census Bureau, the CDP has a total area of 4.2 square miles (10.8 km2), all of it land.
Economy
Lionville’s economy is primarily based on retail and services. The area is home to several large shopping centers, including the Lionville Shopping Center, which is anchored by a Walmart Supercenter. Other major employers in the area include the Lionville YMCA, Lionville Elementary School, and the Lionville Fire Company.
Demographics
As of the 2010 census, there were 8,845 people, 3,541 households, and 2,541 families residing in the CDP. The population density was 2,097.3 people per square mile (808.7/km2). There were 3,717 housing units at an average density of 883.3/sq mi (341.2/km2). The racial makeup of the CDP was 87.2% White, 5.2% African American, 0.2% Native American, 4.2% Asian, 0.1% Pacific Islander, 1.2% from other races, and 2.1% from two or more races. Hispanic or Latino of any race were 3.7% of the population.
There were 3,541 households, out of which 33.2% had children under the age of 18 living with them, 57.2% were married couples living together, 10.2% had a female householder with no husband present, and 28.7% were non-families. 22.7% of all households were made up of individuals, and 8.2% had someone living alone who was 65 years of age or older. The average household size was 2.51 and the average family size was 2.97.
In the CDP, the population was spread out, with 24.2% under the age of 18, 6.2% from 18 to 24, 30.2% from 25 to 44, 25.2% from 45 to 64, and 14.2% who were 65 years of age or older. The median age was 38 years. For every 100 females, there were 94.2 males. For every 100 females age 18 and over, there were 91.2 males.
The median income for a household in the CDP was $68,945, and the median income for a family was $77,917. Males had a median income of $51,964 versus $41,919 for females. The per capita income for the CDP was $30,945. About 2.2% of families and 3.3% of the population were below the poverty line, including 4.2% of those under age 18 and 4.2% of those age 65 or over.
Common Questions
What is the Total Population of Lionville?
Total Population of Lionville is 6,724.
What is the Total Male Population of Lionville?
Total Male Population of Lionville is 3,397.
What is the Total Female Population of Lionville?
Total Female Population of Lionville is 3,327.
What is the Ratio of Males per 100 Females in Lionville?
There are 102.10 Males per 100 Females in Lionville.
What is the Ratio of Females per 100 Males in Lionville?
There are 97.94 Females per 100 Males in Lionville.
What is the Median Population Age in Lionville?
Median Population Age in Lionville is 41.0 Years.
What is the Average Family Size in Lionville
Average Family Size in Lionville is 3.0 People.
What is the Average Household Size in Lionville
Average Household Size in Lionville is 2.2 People.
What is Per Capita Income in Lionville?
Per Capita income in Lionville is $58,593.
What is the Median Family Income in Lionville?
Median Family Income in Lionville is $128,068.
What is the Median Household income in Lionville?
Median Household Income in Lionville is $103,156.
What is Income or Wage Gap in Lionville?
Income or Wage Gap in Lionville is 39.9%.
Women in Lionville earn 60.1 cents for every dollar earned by a man.
What is Inequality or Gini Index in Lionville?
Inequality or Gini Index in Lionville is 0.40.
How Large is the Labor Force in Lionville?
There are 4,227 People in the Labor Forcein in Lionville.
What is the Percentage of People in the Labor Force in Lionville?
77.2% of People are in the Labor Force in Lionville.
What is the Unemployment Rate in Lionville?
Unemployment Rate in Lionville is 5.8%.