Uniontown, PA
Uniontown Map
Uniontown Overview
9,913
TOTAL POPULATION
4,692
MALE POPULATION
5,221
FEMALE POPULATION
89.87
MALES / 100 FEMALES
111.27
FEMALES / 100 MALES
42.6
MEDIAN AGE
2.8
AVG FAMILY SIZE
2.0
AVG HOUSEHOLD SIZE
$27,646
PER CAPITA INCOME
$64,032
AVG FAMILY INCOME
$37,886
AVG HOUSEHOLD INCOME
12.7%
WAGE / INCOME GAP [ % ]
87.3¢/ $1
WAGE / INCOME GAP [ $ ]
0.51
INEQUALITY / GINI INDEX
4,442
LABOR FORCE [ PEOPLE ]
55.1%
PERCENT IN LABOR FORCE
12.7%
UNEMPLOYMENT RATE
Uniontown Zip Codes
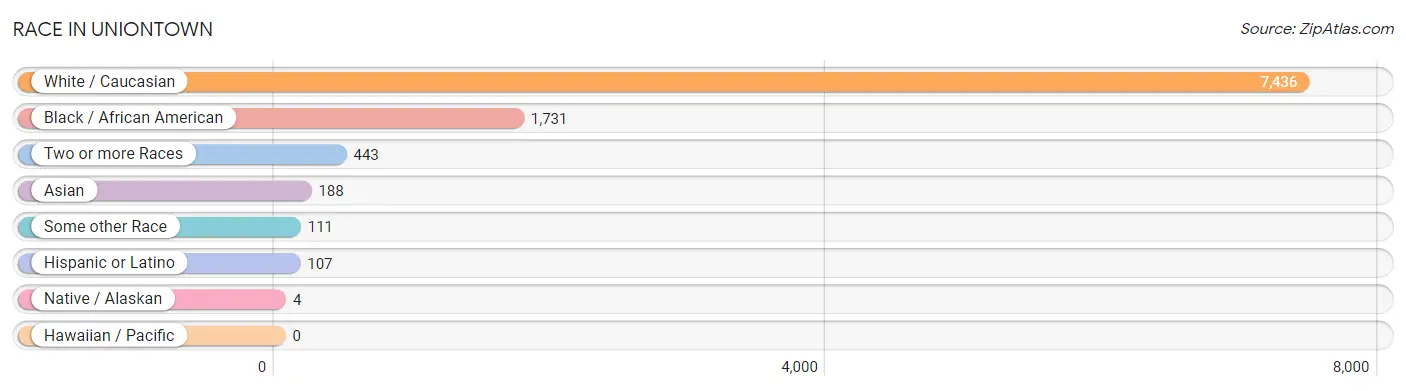
Race in Uniontown
The most populous races in Uniontown are White / Caucasian (7,436 | 75.0%), Black / African American (1,731 | 17.5%), and Two or more Races (443 | 4.5%).
| Race | # Population | % Population |
| Asian | 188 | 1.9% |
| Black / African American | 1,731 | 17.5% |
| Hawaiian / Pacific | 0 | 0.0% |
| Hispanic or Latino | 107 | 1.1% |
| Native / Alaskan | 4 | 0.0% |
| White / Caucasian | 7,436 | 75.0% |
| Two or more Races | 443 | 4.5% |
| Some other Race | 111 | 1.1% |
| Total | 9,913 | 100.0% |
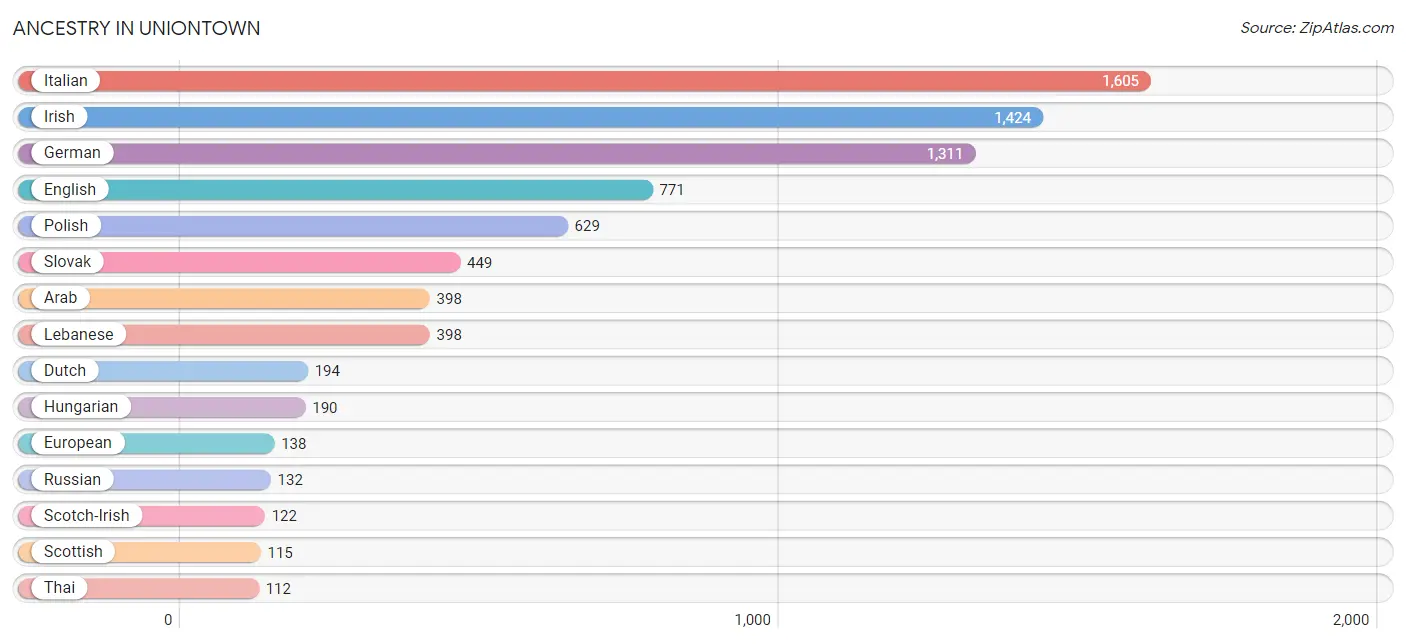
Ancestry in Uniontown
The most populous ancestries reported in Uniontown are Italian (1,605 | 16.2%), Irish (1,424 | 14.4%), German (1,311 | 13.2%), English (771 | 7.8%), and Polish (629 | 6.4%), together accounting for 57.9% of all Uniontown residents.
| Ancestry | # Population | % Population |
| African | 72 | 0.7% |
| American | 84 | 0.9% |
| Apache | 26 | 0.3% |
| Arab | 398 | 4.0% |
| Belgian | 22 | 0.2% |
| Bhutanese | 1 | 0.0% |
| Blackfeet | 21 | 0.2% |
| Carpatho Rusyn | 18 | 0.2% |
| Cherokee | 102 | 1.0% |
| Croatian | 38 | 0.4% |
| Cuban | 9 | 0.1% |
| Czech | 69 | 0.7% |
| Czechoslovakian | 9 | 0.1% |
| Dominican | 6 | 0.1% |
| Dutch | 194 | 2.0% |
| Eastern European | 30 | 0.3% |
| English | 771 | 7.8% |
| European | 138 | 1.4% |
| French Canadian | 73 | 0.7% |
| German | 1,311 | 13.2% |
| Greek | 26 | 0.3% |
| Hungarian | 190 | 1.9% |
| Irish | 1,424 | 14.4% |
| Italian | 1,605 | 16.2% |
| Jamaican | 70 | 0.7% |
| Korean | 103 | 1.0% |
| Lebanese | 398 | 4.0% |
| Mexican | 78 | 0.8% |
| Norwegian | 5 | 0.1% |
| Pennsylvania German | 99 | 1.0% |
| Polish | 629 | 6.4% |
| Puerto Rican | 9 | 0.1% |
| Russian | 132 | 1.3% |
| Scotch-Irish | 122 | 1.2% |
| Scottish | 115 | 1.2% |
| Slovak | 449 | 4.5% |
| Slovene | 16 | 0.2% |
| Subsaharan African | 72 | 0.7% |
| Swiss | 32 | 0.3% |
| Thai | 112 | 1.1% |
| Trinidadian and Tobagonian | 53 | 0.5% |
| Welsh | 43 | 0.4% | View All 42 Rows |
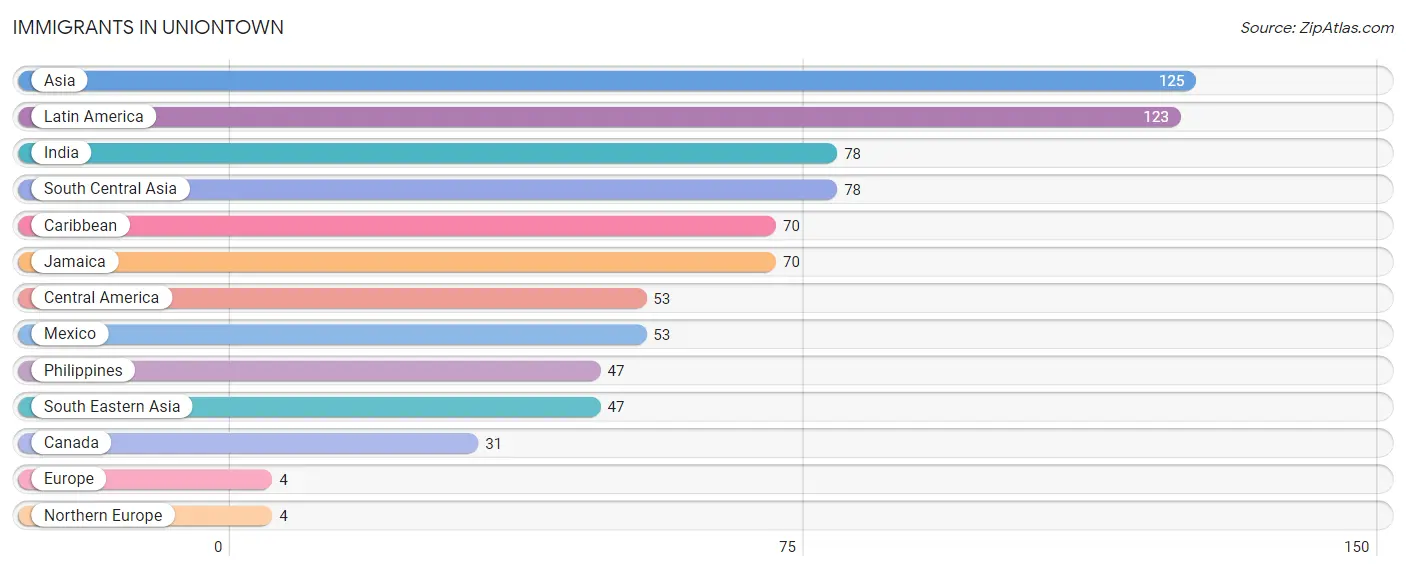
Immigrants in Uniontown
The most numerous immigrant groups reported in Uniontown came from Asia (125 | 1.3%), Latin America (123 | 1.2%), India (78 | 0.8%), South Central Asia (78 | 0.8%), and Caribbean (70 | 0.7%), together accounting for 4.8% of all Uniontown residents.
| Immigration Origin | # Population | % Population |
| Asia | 125 | 1.3% |
| Canada | 31 | 0.3% |
| Caribbean | 70 | 0.7% |
| Central America | 53 | 0.5% |
| Europe | 4 | 0.0% |
| India | 78 | 0.8% |
| Jamaica | 70 | 0.7% |
| Latin America | 123 | 1.2% |
| Mexico | 53 | 0.5% |
| Northern Europe | 4 | 0.0% |
| Philippines | 47 | 0.5% |
| South Central Asia | 78 | 0.8% |
| South Eastern Asia | 47 | 0.5% | View All 13 Rows |
Sex and Age in Uniontown
Sex and Age in Uniontown
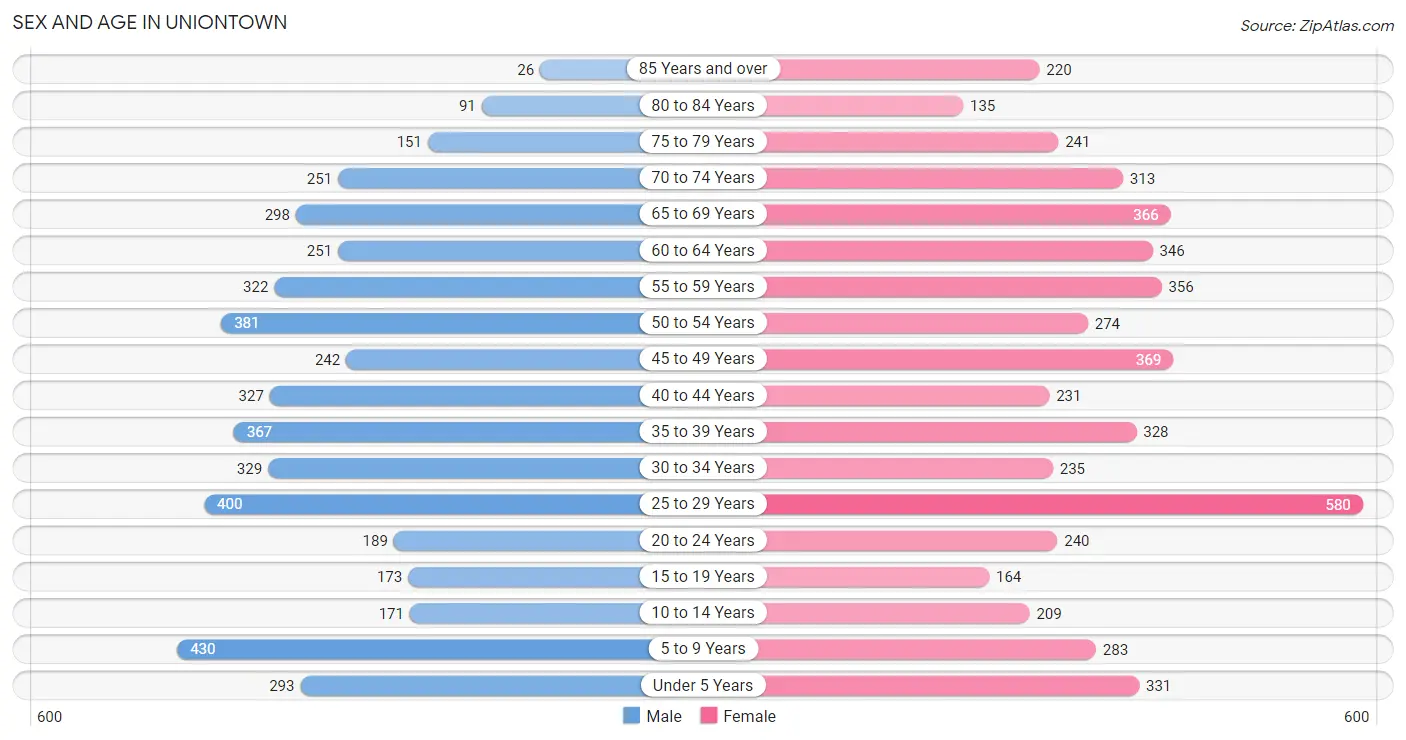
The most populous age groups in Uniontown are 5 to 9 Years (430 | 9.2%) for men and 25 to 29 Years (580 | 11.1%) for women.
| Age Bracket | Male | Female |
| Under 5 Years | 293 (6.2%) | 331 (6.3%) |
| 5 to 9 Years | 430 (9.2%) | 283 (5.4%) |
| 10 to 14 Years | 171 (3.6%) | 209 (4.0%) |
| 15 to 19 Years | 173 (3.7%) | 164 (3.1%) |
| 20 to 24 Years | 189 (4.0%) | 240 (4.6%) |
| 25 to 29 Years | 400 (8.5%) | 580 (11.1%) |
| 30 to 34 Years | 329 (7.0%) | 235 (4.5%) |
| 35 to 39 Years | 367 (7.8%) | 328 (6.3%) |
| 40 to 44 Years | 327 (7.0%) | 231 (4.4%) |
| 45 to 49 Years | 242 (5.2%) | 369 (7.1%) |
| 50 to 54 Years | 381 (8.1%) | 274 (5.2%) |
| 55 to 59 Years | 322 (6.9%) | 356 (6.8%) |
| 60 to 64 Years | 251 (5.3%) | 346 (6.6%) |
| 65 to 69 Years | 298 (6.4%) | 366 (7.0%) |
| 70 to 74 Years | 251 (5.3%) | 313 (6.0%) |
| 75 to 79 Years | 151 (3.2%) | 241 (4.6%) |
| 80 to 84 Years | 91 (1.9%) | 135 (2.6%) |
| 85 Years and over | 26 (0.5%) | 220 (4.2%) |
| Total | 4,692 (100.0%) | 5,221 (100.0%) |
Families and Households in Uniontown
Median Family Size in Uniontown
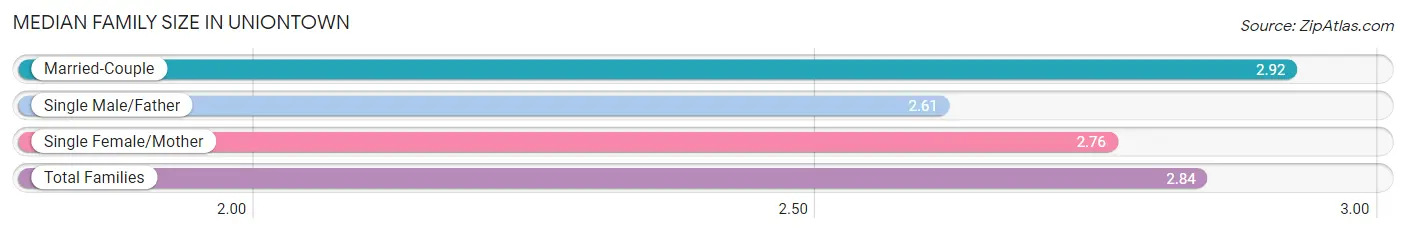
The median family size in Uniontown is 2.84 persons per family, with married-couple families (1,302 | 60.3%) accounting for the largest median family size of 2.92 persons per family. On the other hand, single male/father families (267 | 12.4%) represent the smallest median family size with 2.61 persons per family.
| Family Type | # Families | Family Size |
| Married-Couple | 1,302 (60.3%) | 2.92 |
| Single Male/Father | 267 (12.4%) | 2.61 |
| Single Female/Mother | 589 (27.3%) | 2.76 |
| Total Families | 2,158 (100.0%) | 2.84 |
Median Household Size in Uniontown
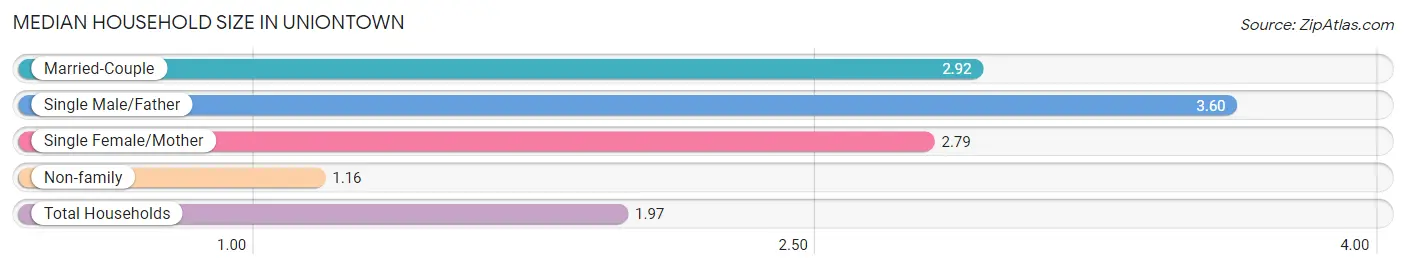
The median household size in Uniontown is 1.97 persons per household, with single male/father households (267 | 5.5%) accounting for the largest median household size of 3.6 persons per household. non-family households (2,687 | 55.5%) represent the smallest median household size with 1.16 persons per household.
| Household Type | # Households | Household Size |
| Married-Couple | 1,302 (26.9%) | 2.92 |
| Single Male/Father | 267 (5.5%) | 3.60 |
| Single Female/Mother | 589 (12.2%) | 2.79 |
| Non-family | 2,687 (55.5%) | 1.16 |
| Total Households | 4,845 (100.0%) | 1.97 |
Household Size by Marriage Status in Uniontown
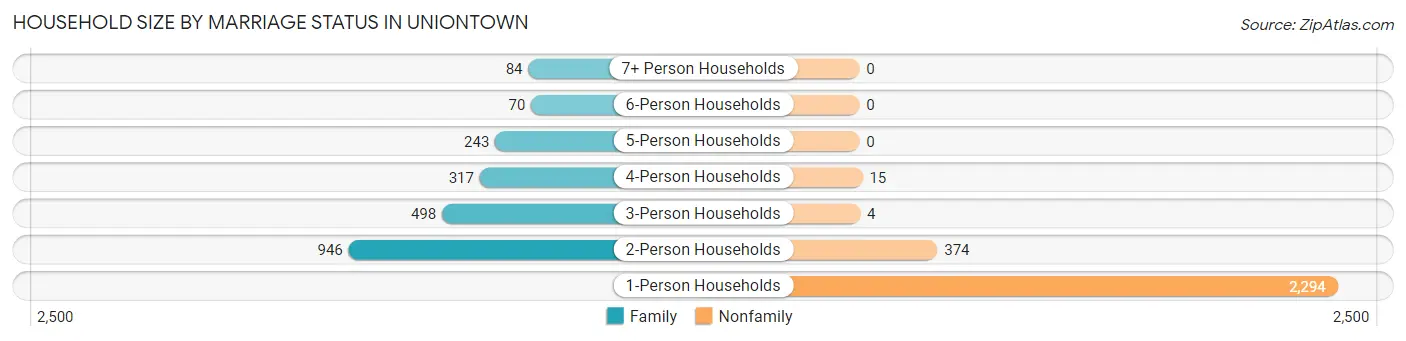
Out of a total of 4,845 households in Uniontown, 2,158 (44.5%) are family households, while 2,687 (55.5%) are nonfamily households. The most numerous type of family households are 2-person households, comprising 946, and the most common type of nonfamily households are 1-person households, comprising 2,294.
| Household Size | Family Households | Nonfamily Households |
| 1-Person Households | - | 2,294 (47.3%) |
| 2-Person Households | 946 (19.5%) | 374 (7.7%) |
| 3-Person Households | 498 (10.3%) | 4 (0.1%) |
| 4-Person Households | 317 (6.5%) | 15 (0.3%) |
| 5-Person Households | 243 (5.0%) | 0 (0.0%) |
| 6-Person Households | 70 (1.4%) | 0 (0.0%) |
| 7+ Person Households | 84 (1.7%) | 0 (0.0%) |
| Total | 2,158 (44.5%) | 2,687 (55.5%) |
Female Fertility in Uniontown
Fertility by Age in Uniontown
Average fertility rate in Uniontown is 87.0 births per 1,000 women. Women in the age bracket of 20 to 34 years have the highest fertility rate with 179.0 births per 1,000 women. Women in the age bracket of 20 to 34 years acount for 99.5% of all women with births.
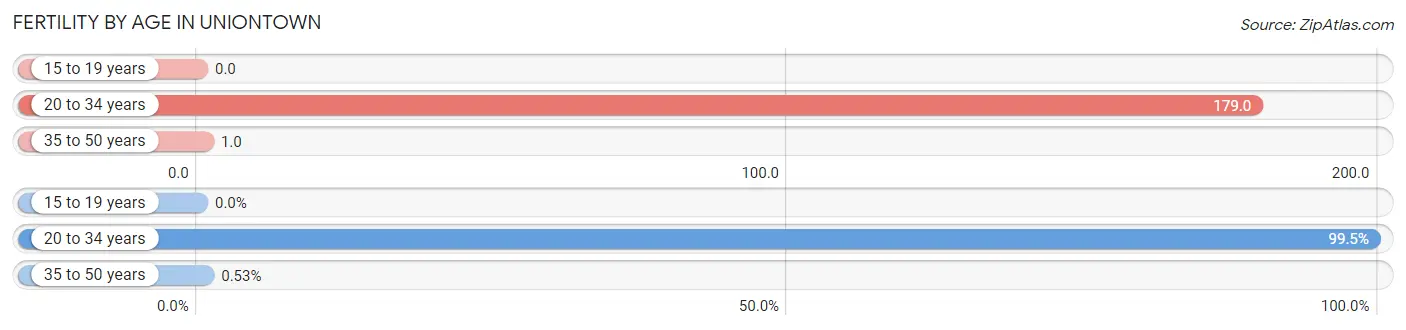
| Age Bracket | Women with Births | Births / 1,000 Women |
| 15 to 19 years | 0 (0.0%) | 0.0 |
| 20 to 34 years | 189 (99.5%) | 179.0 |
| 35 to 50 years | 1 (0.5%) | 1.0 |
| Total | 190 (100.0%) | 87.0 |
Fertility by Age by Marriage Status in Uniontown
22.1% of women with births (190) in Uniontown are married. The highest percentage of unmarried women with births falls into 35 to 50 years age bracket with 100.0% of them unmarried at the time of birth, while the lowest percentage of unmarried women with births belong to 20 to 34 years age bracket with 77.8% of them unmarried.
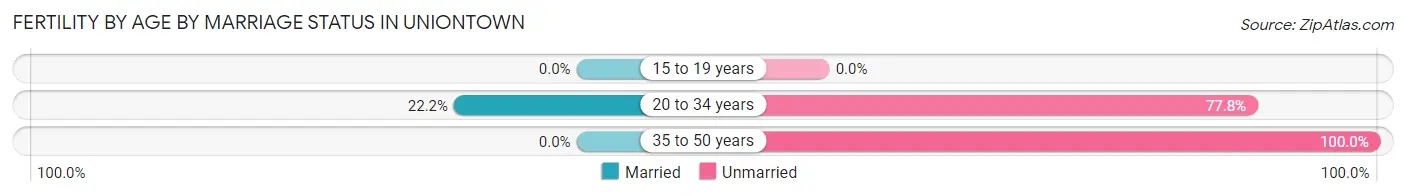
| Age Bracket | Married | Unmarried |
| 15 to 19 years | 0 (0.0%) | 0 (0.0%) |
| 20 to 34 years | 42 (22.2%) | 147 (77.8%) |
| 35 to 50 years | 0 (0.0%) | 1 (100.0%) |
| Total | 42 (22.1%) | 148 (77.9%) |
Fertility by Education in Uniontown
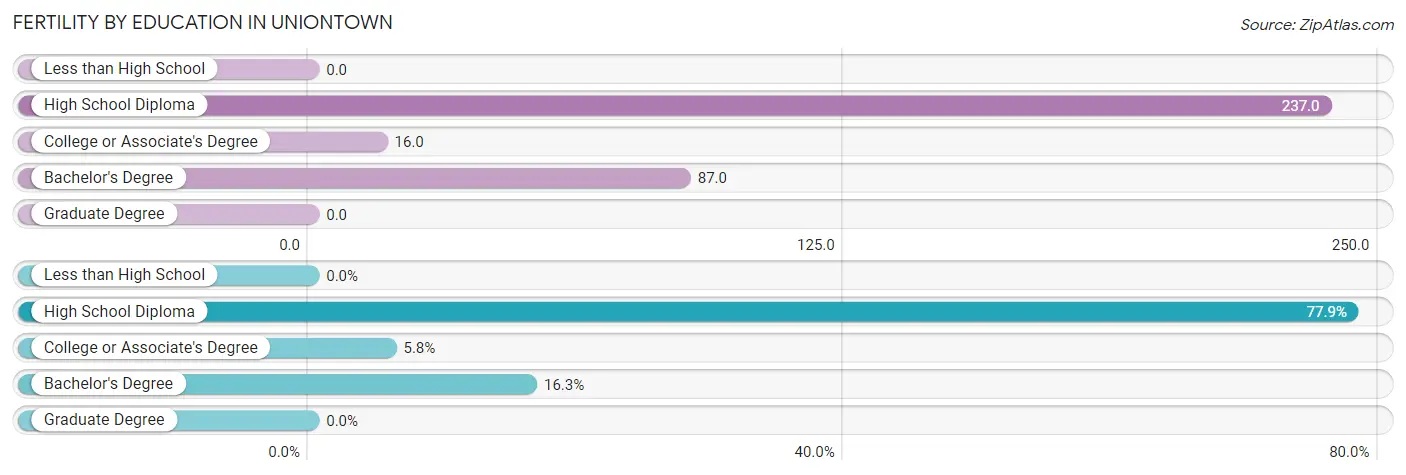
| Educational Attainment | Women with Births | Births / 1,000 Women |
| Less than High School | 0 (0.0%) | 0.0 |
| High School Diploma | 148 (77.9%) | 237.0 |
| College or Associate's Degree | 11 (5.8%) | 16.0 |
| Bachelor's Degree | 31 (16.3%) | 87.0 |
| Graduate Degree | 0 (0.0%) | 0.0 |
| Total | 190 (100.0%) | 87.0 |
Fertility by Education by Marriage Status in Uniontown
77.9% of women with births in Uniontown are unmarried. Women with the educational attainment of college or associate's degree are most likely to be married with 100.0% of them married at childbirth, while women with the educational attainment of high school diploma are least likely to be married with 100.0% of them unmarried at childbirth.
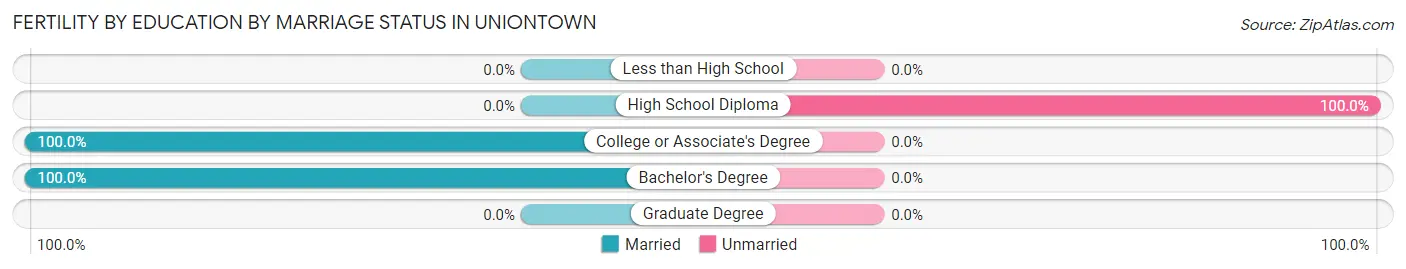
| Educational Attainment | Married | Unmarried |
| Less than High School | 0 (0.0%) | 0 (0.0%) |
| High School Diploma | 0 (0.0%) | 148 (100.0%) |
| College or Associate's Degree | 11 (100.0%) | 0 (0.0%) |
| Bachelor's Degree | 31 (100.0%) | 0 (0.0%) |
| Graduate Degree | 0 (0.0%) | 0 (0.0%) |
| Total | 42 (22.1%) | 148 (77.9%) |
Income in Uniontown
Income Overview in Uniontown
Per Capita Income in Uniontown is $27,646, while median incomes of families and households are $64,032 and $37,886 respectively.
| Characteristic | Number | Measure |
| Per Capita Income | 9,913 | $27,646 |
| Median Family Income | 2,158 | $64,032 |
| Mean Family Income | 2,158 | $77,095 |
| Median Household Income | 4,845 | $37,886 |
| Mean Household Income | 4,845 | $55,186 |
| Income Deficit | 2,158 | $0 |
| Wage / Income Gap (%) | 9,913 | 12.72% |
| Wage / Income Gap ($) | 9,913 | 87.28¢ per $1 |
| Gini / Inequality Index | 9,913 | 0.51 |
Earnings by Sex in Uniontown
Average Earnings in Uniontown are $34,191, $37,589 for men and $32,806 for women, a difference of 12.7%.
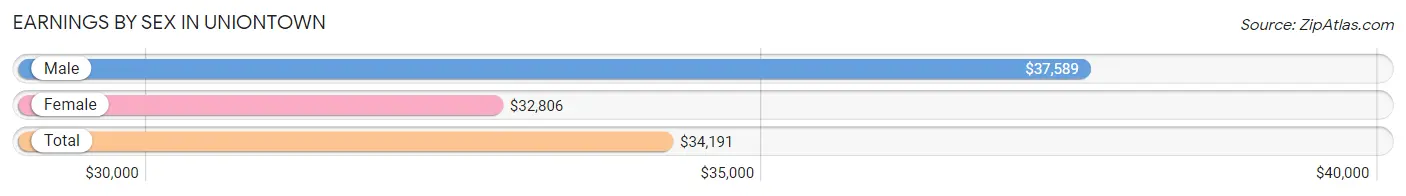
| Sex | Number | Average Earnings |
| Male | 2,475 (53.0%) | $37,589 |
| Female | 2,194 (47.0%) | $32,806 |
| Total | 4,669 (100.0%) | $34,191 |
Earnings by Sex by Income Bracket in Uniontown
The most common earnings brackets in Uniontown are $25,000 to $29,999 for men (258 | 10.4%) and $2,499 or less for women (226 | 10.3%).
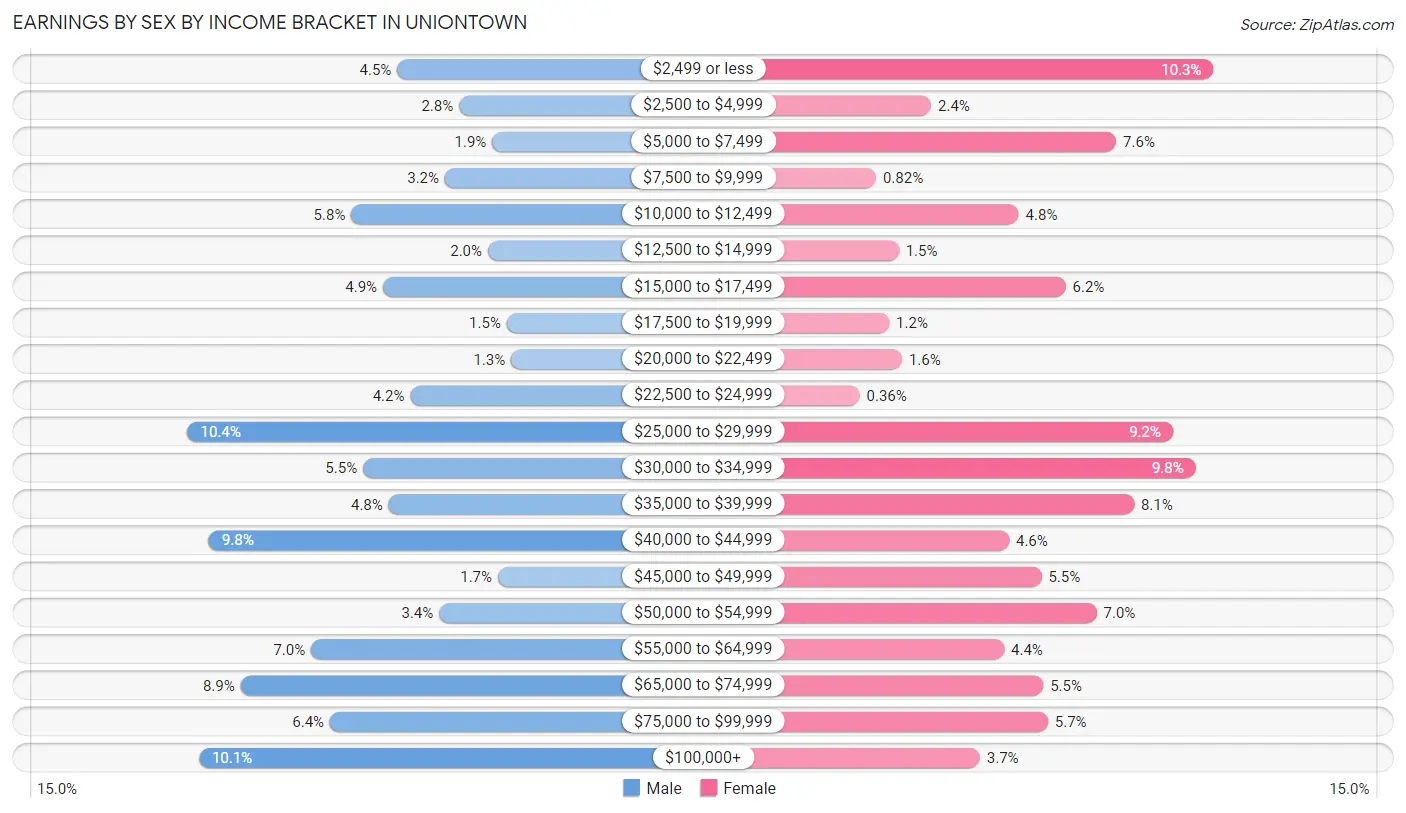
| Income | Male | Female |
| $2,499 or less | 112 (4.5%) | 226 (10.3%) |
| $2,500 to $4,999 | 69 (2.8%) | 52 (2.4%) |
| $5,000 to $7,499 | 46 (1.9%) | 166 (7.6%) |
| $7,500 to $9,999 | 79 (3.2%) | 18 (0.8%) |
| $10,000 to $12,499 | 144 (5.8%) | 106 (4.8%) |
| $12,500 to $14,999 | 49 (2.0%) | 32 (1.5%) |
| $15,000 to $17,499 | 122 (4.9%) | 135 (6.1%) |
| $17,500 to $19,999 | 36 (1.5%) | 26 (1.2%) |
| $20,000 to $22,499 | 33 (1.3%) | 34 (1.5%) |
| $22,500 to $24,999 | 103 (4.2%) | 8 (0.4%) |
| $25,000 to $29,999 | 258 (10.4%) | 201 (9.2%) |
| $30,000 to $34,999 | 136 (5.5%) | 215 (9.8%) |
| $35,000 to $39,999 | 118 (4.8%) | 177 (8.1%) |
| $40,000 to $44,999 | 243 (9.8%) | 100 (4.6%) |
| $45,000 to $49,999 | 42 (1.7%) | 120 (5.5%) |
| $50,000 to $54,999 | 83 (3.4%) | 154 (7.0%) |
| $55,000 to $64,999 | 172 (7.0%) | 97 (4.4%) |
| $65,000 to $74,999 | 221 (8.9%) | 121 (5.5%) |
| $75,000 to $99,999 | 159 (6.4%) | 124 (5.7%) |
| $100,000+ | 250 (10.1%) | 82 (3.7%) |
| Total | 2,475 (100.0%) | 2,194 (100.0%) |
Earnings by Sex by Educational Attainment in Uniontown
Average earnings in Uniontown are $38,643 for men and $33,465 for women, a difference of 13.4%. Men with an educational attainment of graduate degree enjoy the highest average annual earnings of $85,833, while those with high school diploma education earn the least with $30,552. Women with an educational attainment of bachelor's degree earn the most with the average annual earnings of $64,519, while those with high school diploma education have the smallest earnings of $27,216.
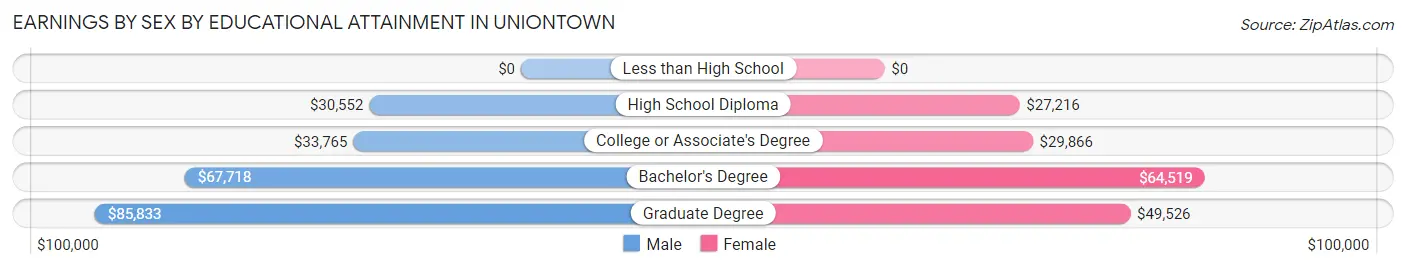
| Educational Attainment | Male Income | Female Income |
| Less than High School | - | - |
| High School Diploma | $30,552 | $27,216 |
| College or Associate's Degree | $33,765 | $29,866 |
| Bachelor's Degree | $67,718 | $64,519 |
| Graduate Degree | $85,833 | $49,526 |
| Total | $38,643 | $33,465 |
Family Income in Uniontown
Family Income Brackets in Uniontown
According to the Uniontown family income data, there are 438 families falling into the $50,000 to $74,999 income range, which is the most common income bracket and makes up 20.3% of all families. Conversely, the $10,000 to $14,999 income bracket is the least frequent group with only 56 families (2.6%) belonging to this category.
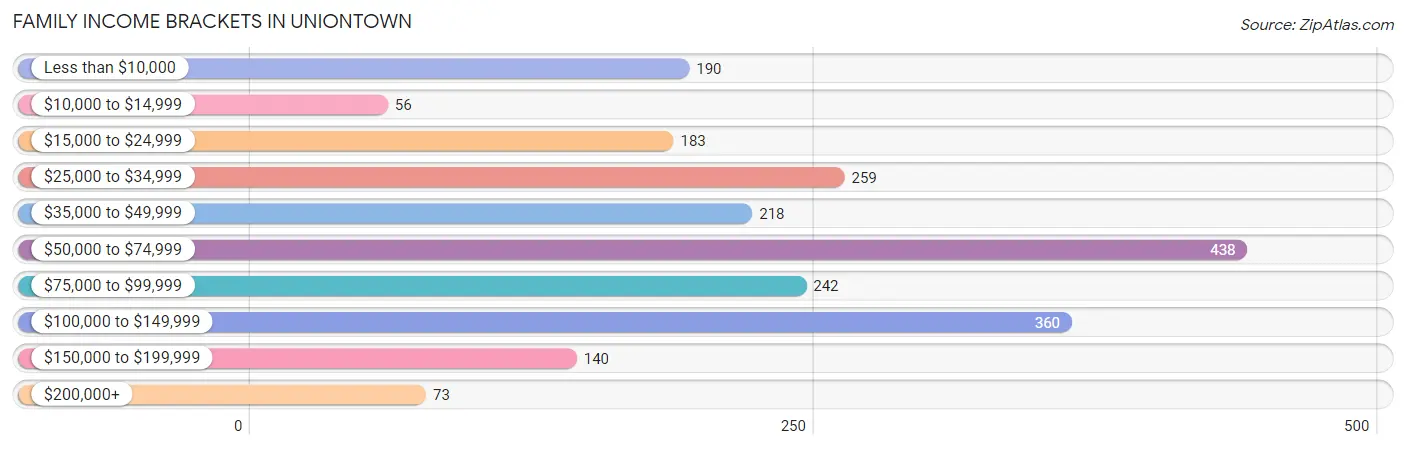
| Income Bracket | # Families | % Families |
| Less than $10,000 | 190 | 8.8% |
| $10,000 to $14,999 | 56 | 2.6% |
| $15,000 to $24,999 | 183 | 8.5% |
| $25,000 to $34,999 | 259 | 12.0% |
| $35,000 to $49,999 | 218 | 10.1% |
| $50,000 to $74,999 | 438 | 20.3% |
| $75,000 to $99,999 | 242 | 11.2% |
| $100,000 to $149,999 | 360 | 16.7% |
| $150,000 to $199,999 | 140 | 6.5% |
| $200,000+ | 73 | 3.4% |
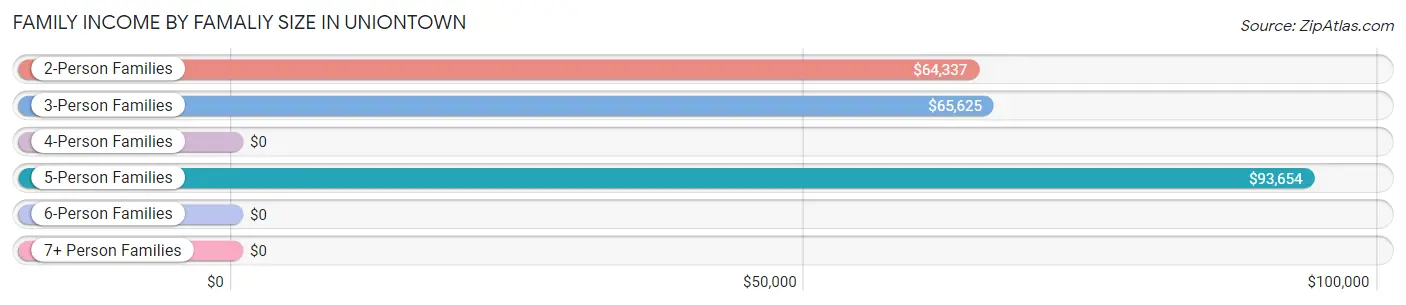
Family Income by Famaliy Size in Uniontown
5-person families (196 | 9.1%) account for the highest median family income in Uniontown with $93,654 per family, while 2-person families (984 | 45.6%) have the highest median income of $32,168 per family member.
| Income Bracket | # Families | Median Income |
| 2-Person Families | 984 (45.6%) | $64,337 |
| 3-Person Families | 534 (24.7%) | $65,625 |
| 4-Person Families | 360 (16.7%) | $0 |
| 5-Person Families | 196 (9.1%) | $93,654 |
| 6-Person Families | 0 (0.0%) | $0 |
| 7+ Person Families | 84 (3.9%) | $0 |
| Total | 2,158 (100.0%) | $64,032 |
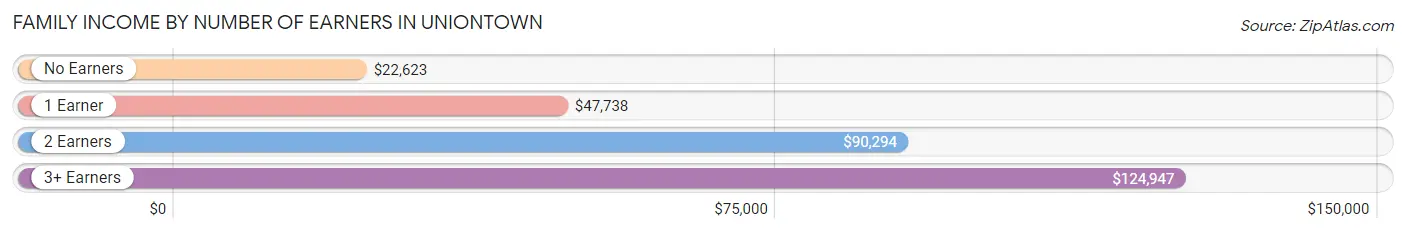
Family Income by Number of Earners in Uniontown
The median family income in Uniontown is $64,032, with families comprising 3+ earners (92) having the highest median family income of $124,947, while families with no earners (390) have the lowest median family income of $22,623, accounting for 4.3% and 18.1% of families, respectively.
| Number of Earners | # Families | Median Income |
| No Earners | 390 (18.1%) | $22,623 |
| 1 Earner | 956 (44.3%) | $47,738 |
| 2 Earners | 720 (33.4%) | $90,294 |
| 3+ Earners | 92 (4.3%) | $124,947 |
| Total | 2,158 (100.0%) | $64,032 |
Household Income in Uniontown
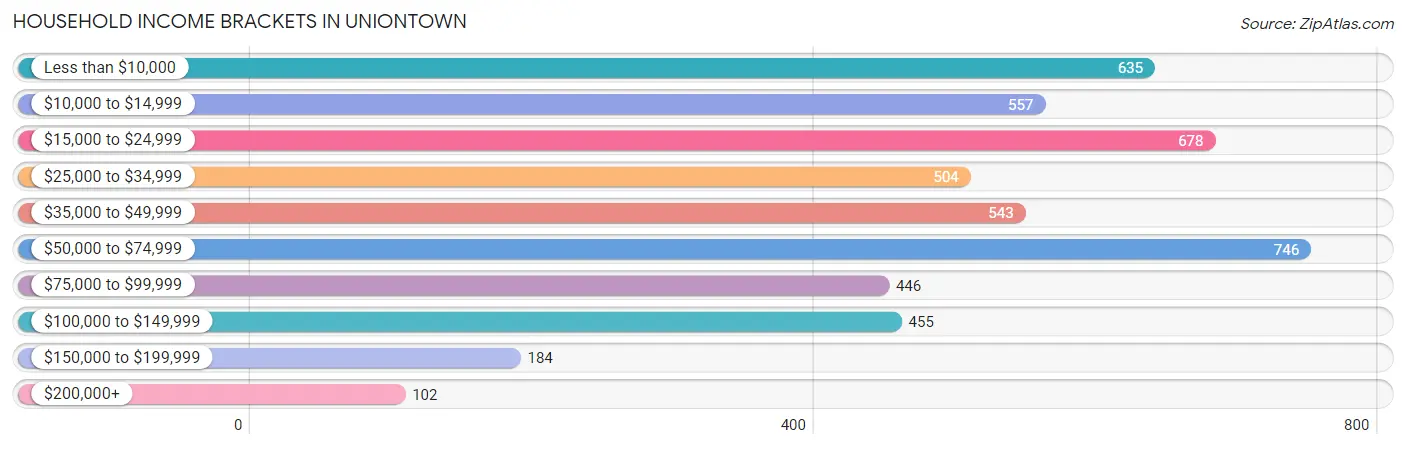
Household Income Brackets in Uniontown
With 746 households falling in the category, the $50,000 to $74,999 income range is the most frequent in Uniontown, accounting for 15.4% of all households. In contrast, only 102 households (2.1%) fall into the $200,000+ income bracket, making it the least populous group.
| Income Bracket | # Households | % Households |
| Less than $10,000 | 635 | 13.1% |
| $10,000 to $14,999 | 557 | 11.5% |
| $15,000 to $24,999 | 678 | 14.0% |
| $25,000 to $34,999 | 504 | 10.4% |
| $35,000 to $49,999 | 543 | 11.2% |
| $50,000 to $74,999 | 746 | 15.4% |
| $75,000 to $99,999 | 446 | 9.2% |
| $100,000 to $149,999 | 455 | 9.4% |
| $150,000 to $199,999 | 184 | 3.8% |
| $200,000+ | 102 | 2.1% |
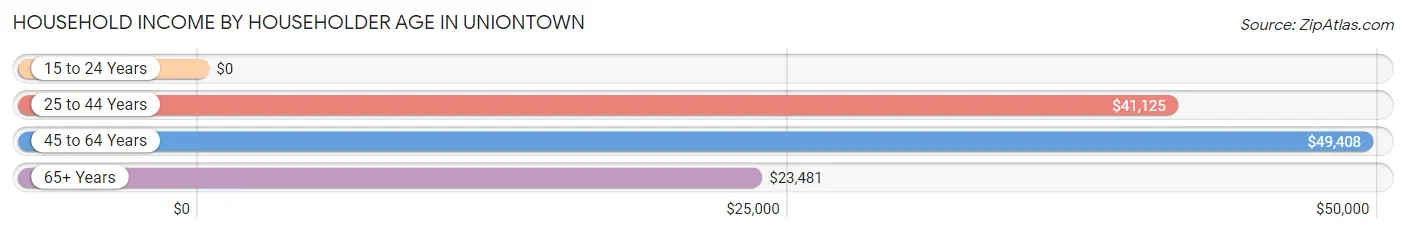
Household Income by Householder Age in Uniontown
The median household income in Uniontown is $37,886, with the highest median household income of $49,408 found in the 45 to 64 years age bracket for the primary householder. A total of 1,653 households (34.1%) fall into this category. Meanwhile, the 15 to 24 years age bracket for the primary householder has the lowest median household income of $0, with 168 households (3.5%) in this group.
| Income Bracket | # Households | Median Income |
| 15 to 24 Years | 168 (3.5%) | $0 |
| 25 to 44 Years | 1,574 (32.5%) | $41,125 |
| 45 to 64 Years | 1,653 (34.1%) | $49,408 |
| 65+ Years | 1,450 (29.9%) | $23,481 |
| Total | 4,845 (100.0%) | $37,886 |
Poverty in Uniontown
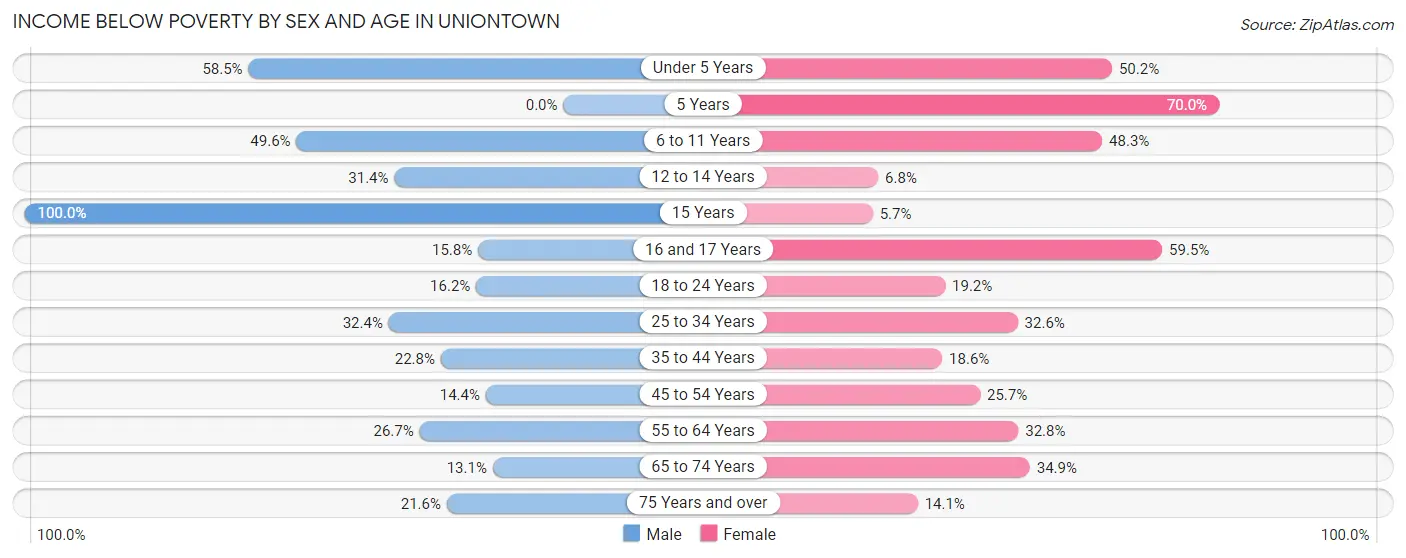
Income Below Poverty by Sex and Age in Uniontown
With 26.2% poverty level for males and 28.9% for females among the residents of Uniontown, 15 year old males and 5 year old females are the most vulnerable to poverty, with 13 males (100.0%) and 42 females (70.0%) in their respective age groups living below the poverty level.
| Age Bracket | Male | Female |
| Under 5 Years | 166 (58.5%) | 166 (50.1%) |
| 5 Years | 0 (0.0%) | 42 (70.0%) |
| 6 to 11 Years | 165 (49.5%) | 130 (48.3%) |
| 12 to 14 Years | 32 (31.4%) | 11 (6.8%) |
| 15 Years | 13 (100.0%) | 7 (5.7%) |
| 16 and 17 Years | 19 (15.8%) | 22 (59.5%) |
| 18 to 24 Years | 33 (16.2%) | 47 (19.2%) |
| 25 to 34 Years | 200 (32.4%) | 266 (32.6%) |
| 35 to 44 Years | 144 (22.8%) | 103 (18.6%) |
| 45 to 54 Years | 87 (14.4%) | 165 (25.7%) |
| 55 to 64 Years | 150 (26.7%) | 230 (32.8%) |
| 65 to 74 Years | 72 (13.1%) | 237 (34.9%) |
| 75 Years and over | 58 (21.6%) | 84 (14.1%) |
| Total | 1,139 (26.2%) | 1,510 (28.9%) |
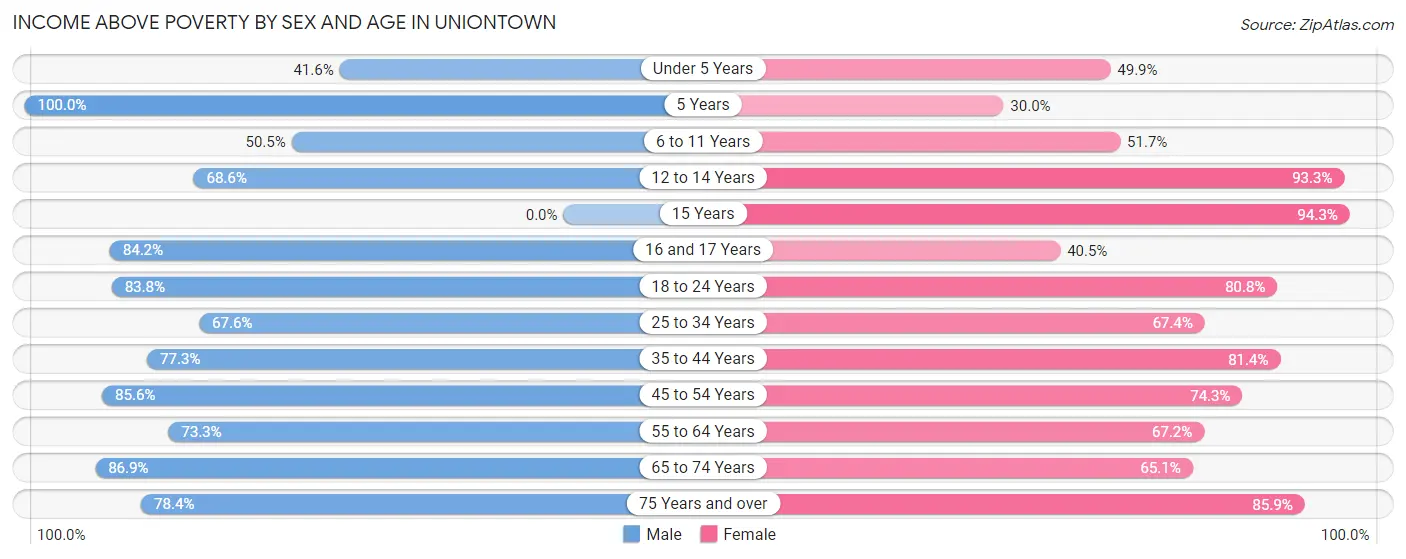
Income Above Poverty by Sex and Age in Uniontown
According to the poverty statistics in Uniontown, males aged 5 years and females aged 15 years are the age groups that are most secure financially, with 100.0% of males and 94.3% of females in these age groups living above the poverty line.
| Age Bracket | Male | Female |
| Under 5 Years | 118 (41.5%) | 165 (49.8%) |
| 5 Years | 52 (100.0%) | 18 (30.0%) |
| 6 to 11 Years | 168 (50.4%) | 139 (51.7%) |
| 12 to 14 Years | 70 (68.6%) | 152 (93.2%) |
| 15 Years | 0 (0.0%) | 115 (94.3%) |
| 16 and 17 Years | 101 (84.2%) | 15 (40.5%) |
| 18 to 24 Years | 171 (83.8%) | 198 (80.8%) |
| 25 to 34 Years | 417 (67.6%) | 549 (67.4%) |
| 35 to 44 Years | 489 (77.2%) | 450 (81.4%) |
| 45 to 54 Years | 517 (85.6%) | 478 (74.3%) |
| 55 to 64 Years | 412 (73.3%) | 472 (67.2%) |
| 65 to 74 Years | 477 (86.9%) | 442 (65.1%) |
| 75 Years and over | 210 (78.4%) | 512 (85.9%) |
| Total | 3,202 (73.8%) | 3,705 (71.1%) |
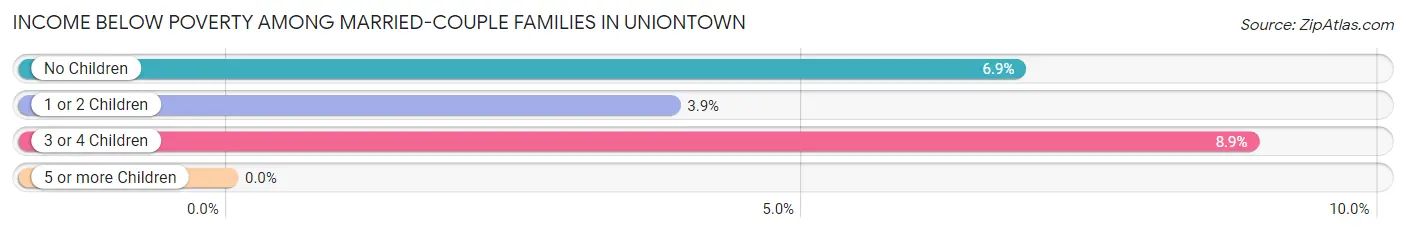
Income Below Poverty Among Married-Couple Families in Uniontown
The poverty statistics for married-couple families in Uniontown show that 5.8% or 76 of the total 1,302 families live below the poverty line. Families with 3 or 4 children have the highest poverty rate of 8.9%, comprising of 8 families. On the other hand, families with 5 or more children have the lowest poverty rate of 0.0%, which includes 0 families.
| Children | Above Poverty | Below Poverty |
| No Children | 760 (93.1%) | 56 (6.9%) |
| 1 or 2 Children | 300 (96.2%) | 12 (3.8%) |
| 3 or 4 Children | 82 (91.1%) | 8 (8.9%) |
| 5 or more Children | 84 (100.0%) | 0 (0.0%) |
| Total | 1,226 (94.2%) | 76 (5.8%) |
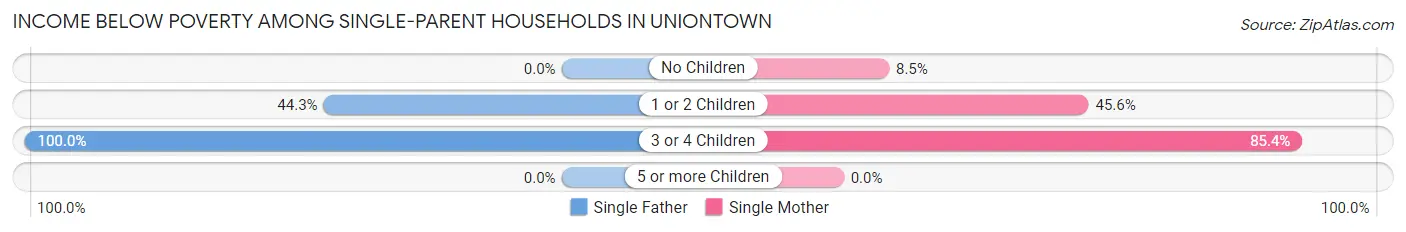
Income Below Poverty Among Single-Parent Households in Uniontown
According to the poverty data in Uniontown, 43.8% or 117 single-father households and 41.4% or 244 single-mother households are living below the poverty line. Among single-father households, those with 3 or 4 children have the highest poverty rate, with 70 households (100.0%) experiencing poverty. Likewise, among single-mother households, those with 3 or 4 children have the highest poverty rate, with 117 households (85.4%) falling below the poverty line.
| Children | Single Father | Single Mother |
| No Children | 0 (0.0%) | 18 (8.5%) |
| 1 or 2 Children | 47 (44.3%) | 109 (45.6%) |
| 3 or 4 Children | 70 (100.0%) | 117 (85.4%) |
| 5 or more Children | 0 (0.0%) | 0 (0.0%) |
| Total | 117 (43.8%) | 244 (41.4%) |
Income Below Poverty Among Married-Couple vs Single-Parent Households in Uniontown
The poverty data for Uniontown shows that 76 of the married-couple family households (5.8%) and 361 of the single-parent households (42.2%) are living below the poverty level. Within the married-couple family households, those with 3 or 4 children have the highest poverty rate, with 8 households (8.9%) falling below the poverty line. Among the single-parent households, those with 3 or 4 children have the highest poverty rate, with 187 household (90.3%) living below poverty.
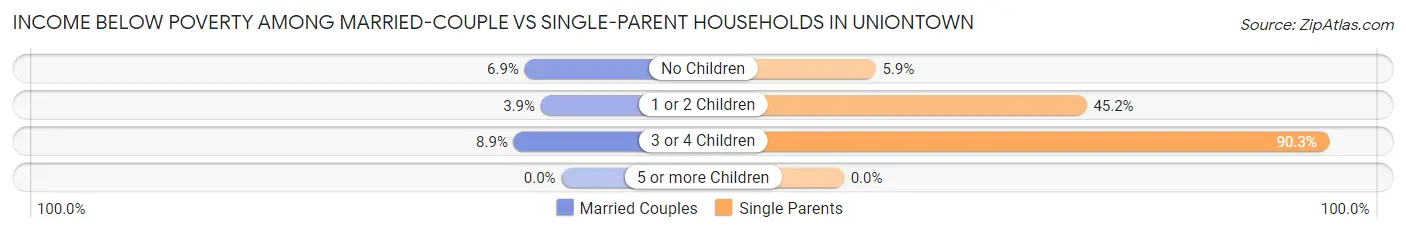
| Children | Married-Couple Families | Single-Parent Households |
| No Children | 56 (6.9%) | 18 (5.9%) |
| 1 or 2 Children | 12 (3.8%) | 156 (45.2%) |
| 3 or 4 Children | 8 (8.9%) | 187 (90.3%) |
| 5 or more Children | 0 (0.0%) | 0 (0.0%) |
| Total | 76 (5.8%) | 361 (42.2%) |
Employment Characteristics in Uniontown
Employment by Class of Employer in Uniontown
Among the 3,808 employed individuals in Uniontown, private company employees (2,864 | 75.2%), not-for-profit organizations (312 | 8.2%), and local government employees (211 | 5.5%) make up the most common classes of employment.
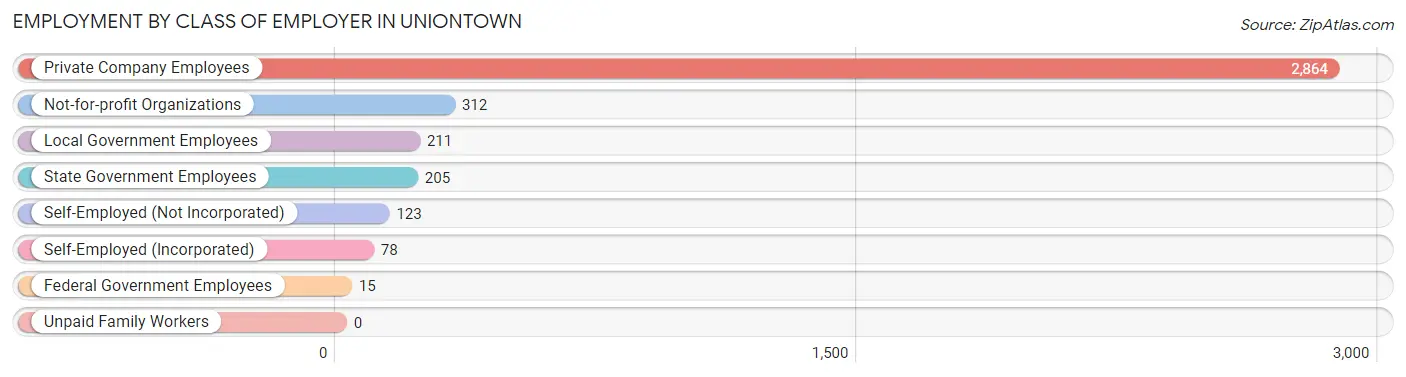
| Employer Class | # Employees | % Employees |
| Private Company Employees | 2,864 | 75.2% |
| Self-Employed (Incorporated) | 78 | 2.1% |
| Self-Employed (Not Incorporated) | 123 | 3.2% |
| Not-for-profit Organizations | 312 | 8.2% |
| Local Government Employees | 211 | 5.5% |
| State Government Employees | 205 | 5.4% |
| Federal Government Employees | 15 | 0.4% |
| Unpaid Family Workers | 0 | 0.0% |
| Total | 3,808 | 100.0% |
Employment Status by Age in Uniontown
According to the labor force statistics for Uniontown, out of the total population over 16 years of age (8,061), 55.1% or 4,442 individuals are in the labor force, with 12.7% or 564 of them unemployed. The age group with the highest labor force participation rate is 25 to 29 years, with 85.0% or 833 individuals in the labor force. Within the labor force, the 25 to 29 years age range has the highest percentage of unemployed individuals, with 24.6% or 205 of them being unemployed.
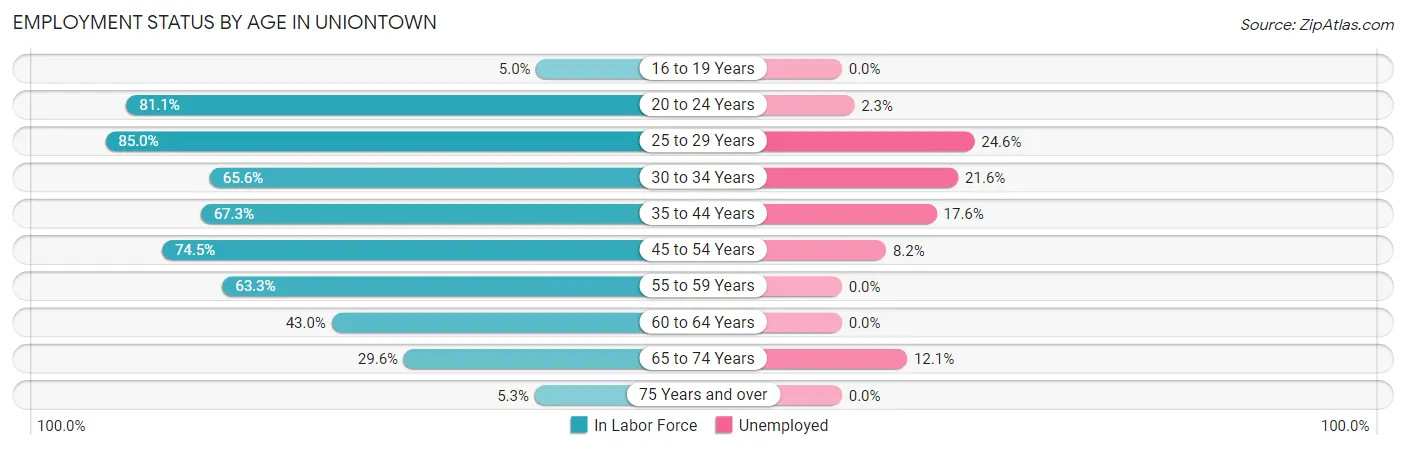
| Age Bracket | In Labor Force | Unemployed |
| 16 to 19 Years | 10 (5.0%) | 0 (0.0%) |
| 20 to 24 Years | 348 (81.1%) | 8 (2.3%) |
| 25 to 29 Years | 833 (85.0%) | 205 (24.6%) |
| 30 to 34 Years | 370 (65.6%) | 80 (21.6%) |
| 35 to 44 Years | 843 (67.3%) | 148 (17.6%) |
| 45 to 54 Years | 943 (74.5%) | 77 (8.2%) |
| 55 to 59 Years | 429 (63.3%) | 0 (0.0%) |
| 60 to 64 Years | 257 (43.0%) | 0 (0.0%) |
| 65 to 74 Years | 363 (29.6%) | 44 (12.1%) |
| 75 Years and over | 46 (5.3%) | 0 (0.0%) |
| Total | 4,442 (55.1%) | 564 (12.7%) |
Employment Status by Educational Attainment in Uniontown
According to labor force statistics for Uniontown, 68.8% of individuals (3,673) out of the total population between 25 and 64 years of age (5,338) are in the labor force, with 13.9% or 511 of them being unemployed. The group with the highest labor force participation rate are those with the educational attainment of bachelor's degree or higher, with 86.7% or 1,035 individuals in the labor force. Within the labor force, individuals with less than high school education have the highest percentage of unemployment, with 49.8% or 116 of them being unemployed.
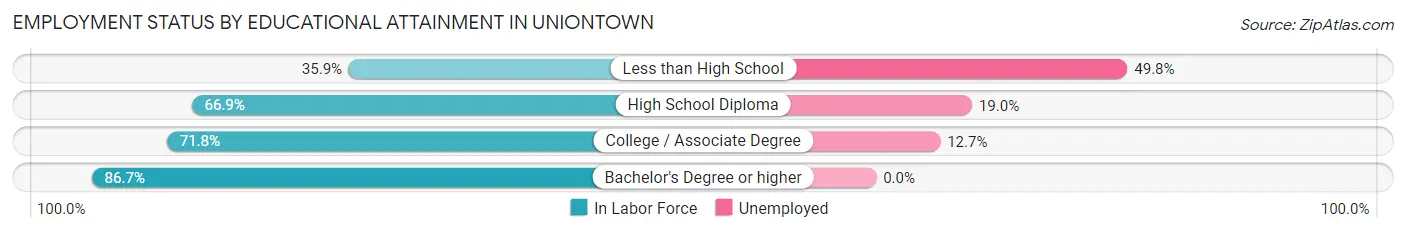
| Educational Attainment | In Labor Force | Unemployed |
| Less than High School | 233 (35.9%) | 323 (49.8%) |
| High School Diploma | 1,402 (66.9%) | 398 (19.0%) |
| College / Associate Degree | 1,005 (71.8%) | 178 (12.7%) |
| Bachelor's Degree or higher | 1,035 (86.7%) | 0 (0.0%) |
| Total | 3,673 (68.8%) | 742 (13.9%) |
Employment Occupations by Sex in Uniontown
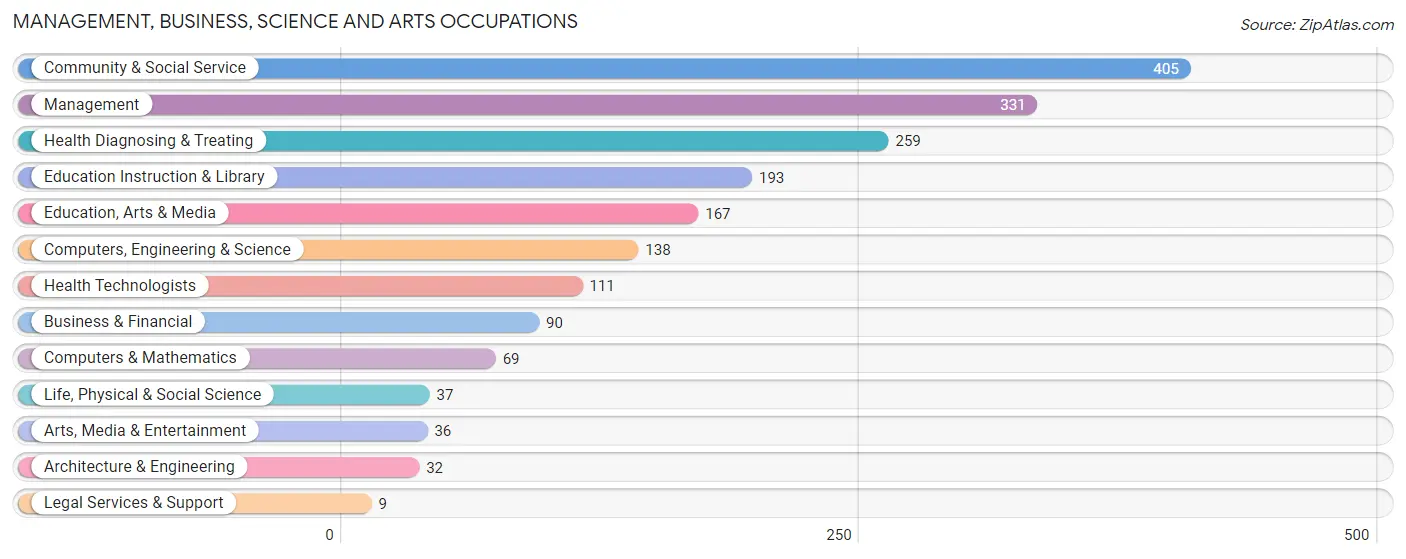
Management, Business, Science and Arts Occupations
The most common Management, Business, Science and Arts occupations in Uniontown are Community & Social Service (405 | 10.4%), Management (331 | 8.5%), Health Diagnosing & Treating (259 | 6.7%), Education Instruction & Library (193 | 5.0%), and Education, Arts & Media (167 | 4.3%).
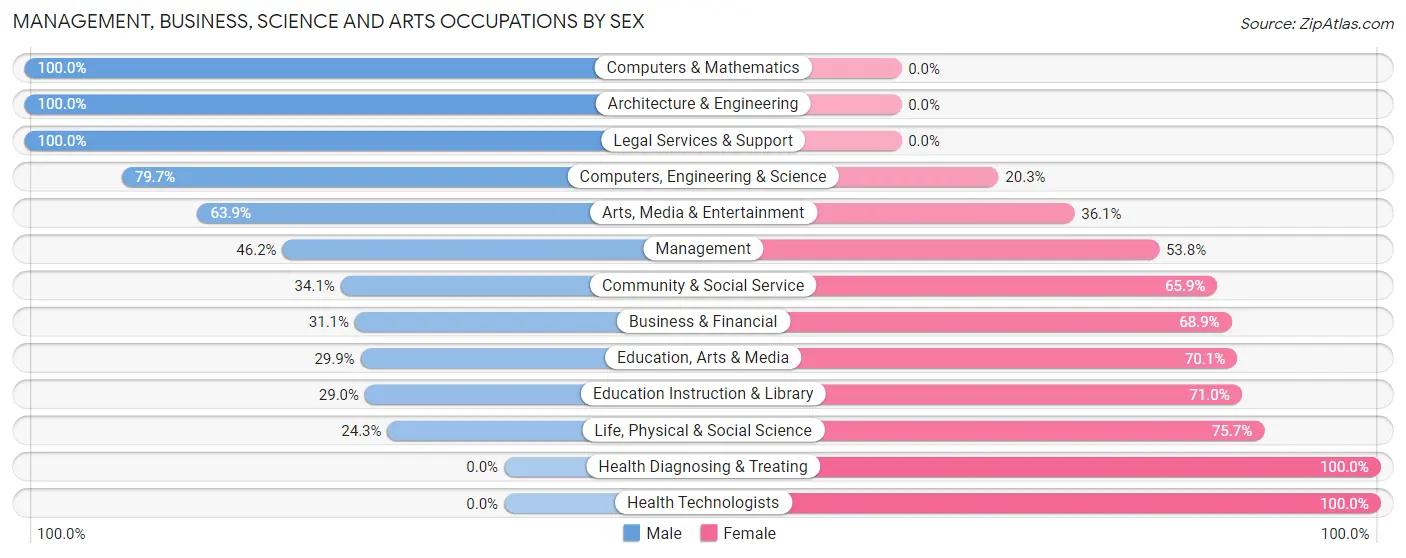
Management, Business, Science and Arts Occupations by Sex
Within the Management, Business, Science and Arts occupations in Uniontown, the most male-oriented occupations are Computers & Mathematics (100.0%), Architecture & Engineering (100.0%), and Legal Services & Support (100.0%), while the most female-oriented occupations are Health Diagnosing & Treating (100.0%), Health Technologists (100.0%), and Life, Physical & Social Science (75.7%).
| Occupation | Male | Female |
| Management | 153 (46.2%) | 178 (53.8%) |
| Business & Financial | 28 (31.1%) | 62 (68.9%) |
| Computers, Engineering & Science | 110 (79.7%) | 28 (20.3%) |
| Computers & Mathematics | 69 (100.0%) | 0 (0.0%) |
| Architecture & Engineering | 32 (100.0%) | 0 (0.0%) |
| Life, Physical & Social Science | 9 (24.3%) | 28 (75.7%) |
| Community & Social Service | 138 (34.1%) | 267 (65.9%) |
| Education, Arts & Media | 50 (29.9%) | 117 (70.1%) |
| Legal Services & Support | 9 (100.0%) | 0 (0.0%) |
| Education Instruction & Library | 56 (29.0%) | 137 (71.0%) |
| Arts, Media & Entertainment | 23 (63.9%) | 13 (36.1%) |
| Health Diagnosing & Treating | 0 (0.0%) | 259 (100.0%) |
| Health Technologists | 0 (0.0%) | 111 (100.0%) |
| Total (Category) | 429 (35.1%) | 794 (64.9%) |
| Total (Overall) | 1,907 (49.1%) | 1,973 (50.8%) |
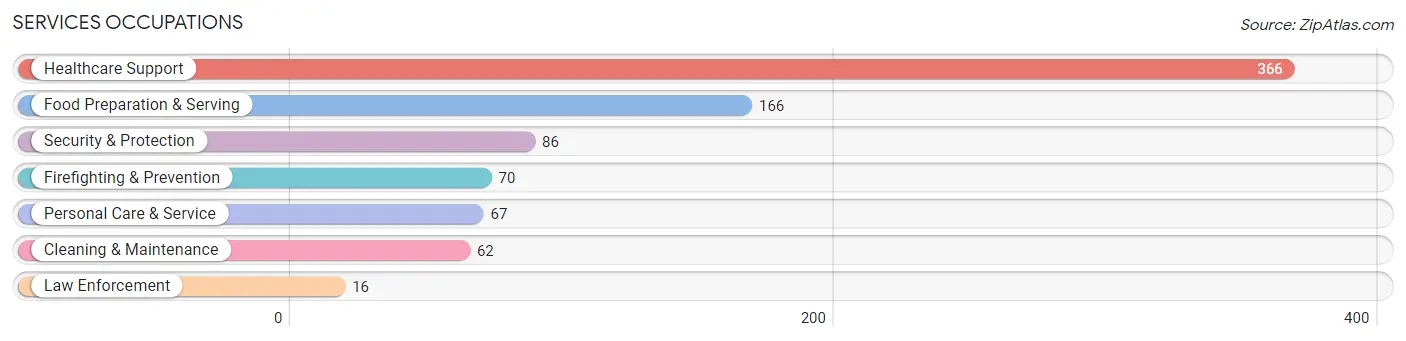
Services Occupations
The most common Services occupations in Uniontown are Healthcare Support (366 | 9.4%), Food Preparation & Serving (166 | 4.3%), Security & Protection (86 | 2.2%), Firefighting & Prevention (70 | 1.8%), and Personal Care & Service (67 | 1.7%).
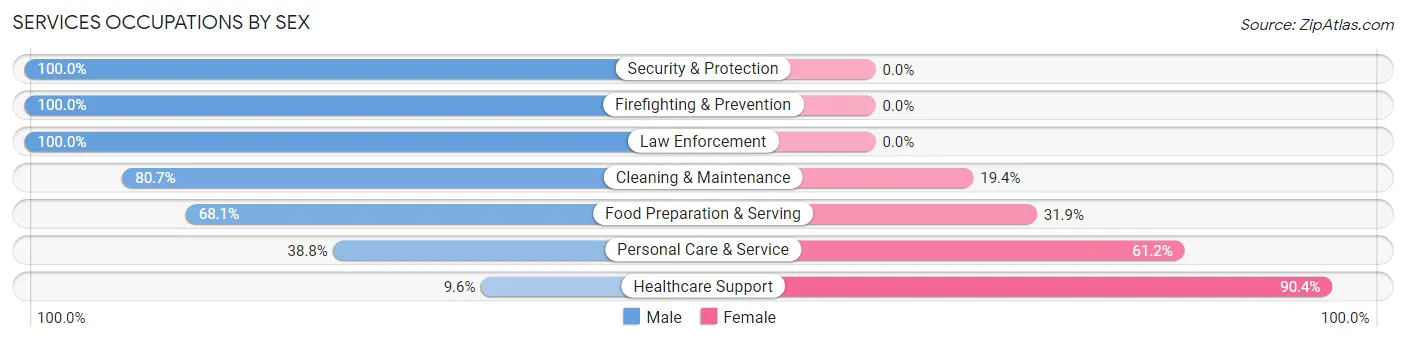
Services Occupations by Sex
Within the Services occupations in Uniontown, the most male-oriented occupations are Security & Protection (100.0%), Firefighting & Prevention (100.0%), and Law Enforcement (100.0%), while the most female-oriented occupations are Healthcare Support (90.4%), Personal Care & Service (61.2%), and Food Preparation & Serving (31.9%).
| Occupation | Male | Female |
| Healthcare Support | 35 (9.6%) | 331 (90.4%) |
| Security & Protection | 86 (100.0%) | 0 (0.0%) |
| Firefighting & Prevention | 70 (100.0%) | 0 (0.0%) |
| Law Enforcement | 16 (100.0%) | 0 (0.0%) |
| Food Preparation & Serving | 113 (68.1%) | 53 (31.9%) |
| Cleaning & Maintenance | 50 (80.6%) | 12 (19.4%) |
| Personal Care & Service | 26 (38.8%) | 41 (61.2%) |
| Total (Category) | 310 (41.5%) | 437 (58.5%) |
| Total (Overall) | 1,907 (49.1%) | 1,973 (50.8%) |
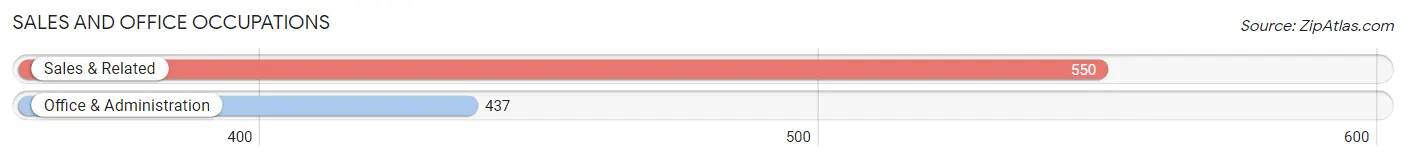
Sales and Office Occupations
The most common Sales and Office occupations in Uniontown are Sales & Related (550 | 14.2%), and Office & Administration (437 | 11.3%).
Sales and Office Occupations by Sex
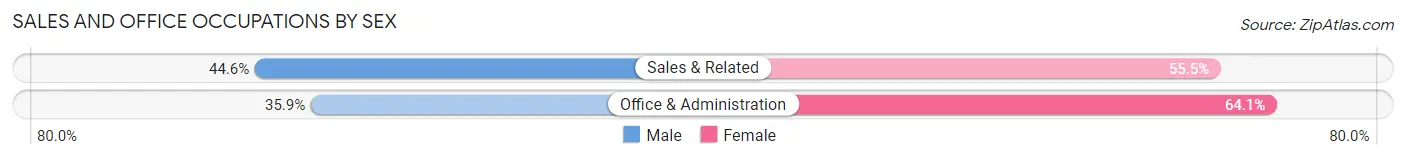
| Occupation | Male | Female |
| Sales & Related | 245 (44.6%) | 305 (55.4%) |
| Office & Administration | 157 (35.9%) | 280 (64.1%) |
| Total (Category) | 402 (40.7%) | 585 (59.3%) |
| Total (Overall) | 1,907 (49.1%) | 1,973 (50.8%) |
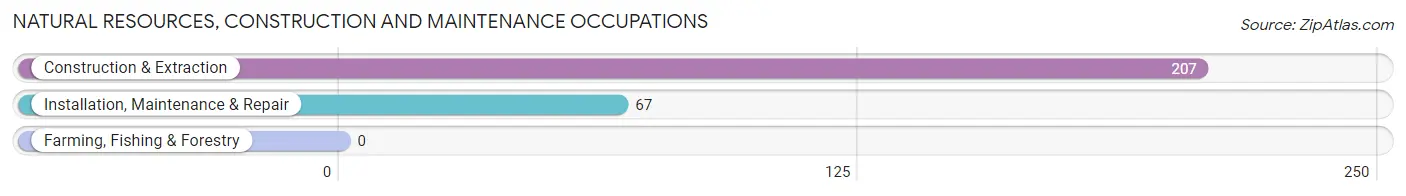
Natural Resources, Construction and Maintenance Occupations
The most common Natural Resources, Construction and Maintenance occupations in Uniontown are Construction & Extraction (207 | 5.3%), and Installation, Maintenance & Repair (67 | 1.7%).
Natural Resources, Construction and Maintenance Occupations by Sex
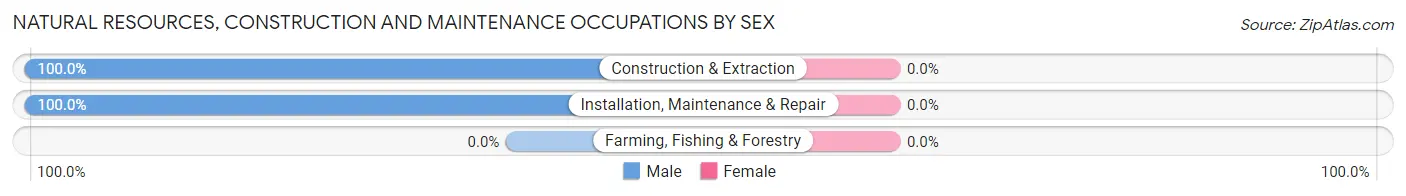
| Occupation | Male | Female |
| Farming, Fishing & Forestry | 0 (0.0%) | 0 (0.0%) |
| Construction & Extraction | 207 (100.0%) | 0 (0.0%) |
| Installation, Maintenance & Repair | 67 (100.0%) | 0 (0.0%) |
| Total (Category) | 274 (100.0%) | 0 (0.0%) |
| Total (Overall) | 1,907 (49.1%) | 1,973 (50.8%) |
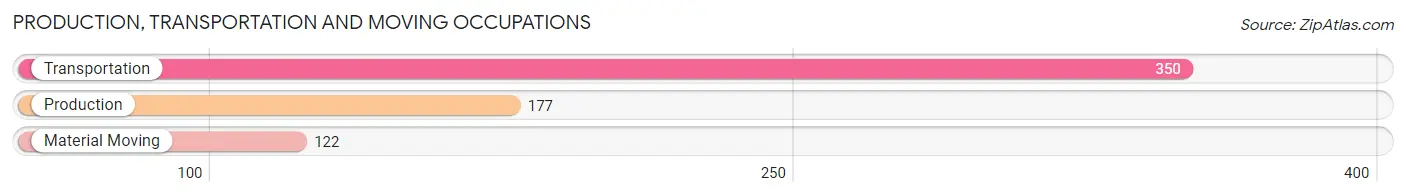
Production, Transportation and Moving Occupations
The most common Production, Transportation and Moving occupations in Uniontown are Transportation (350 | 9.0%), Production (177 | 4.6%), and Material Moving (122 | 3.1%).
Production, Transportation and Moving Occupations by Sex
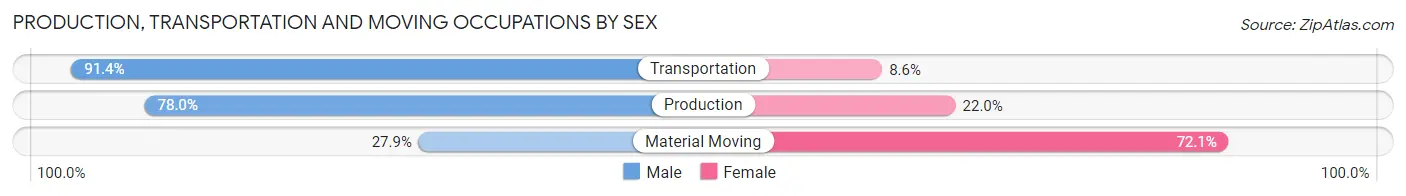
| Occupation | Male | Female |
| Production | 138 (78.0%) | 39 (22.0%) |
| Transportation | 320 (91.4%) | 30 (8.6%) |
| Material Moving | 34 (27.9%) | 88 (72.1%) |
| Total (Category) | 492 (75.8%) | 157 (24.2%) |
| Total (Overall) | 1,907 (49.1%) | 1,973 (50.8%) |
Employment Industries by Sex in Uniontown
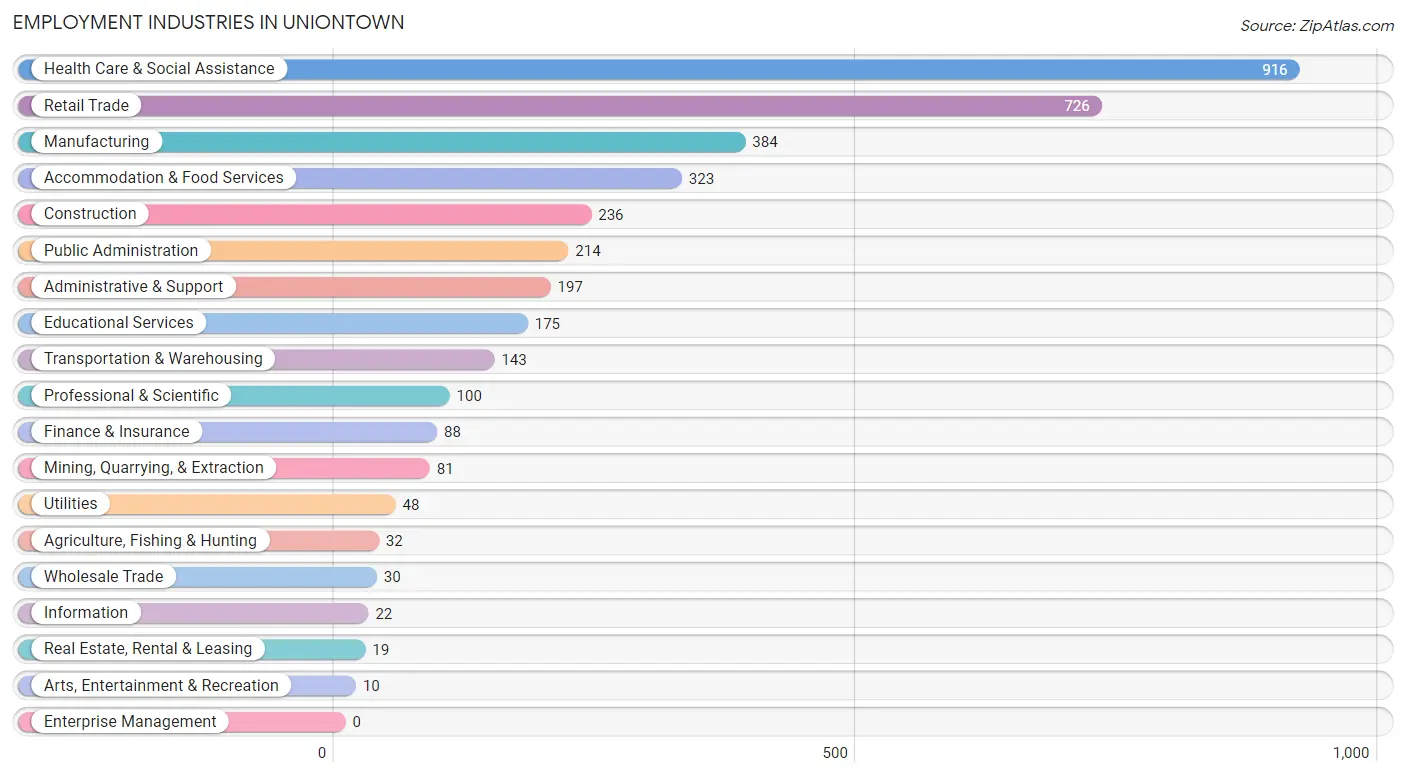
Employment Industries in Uniontown
The major employment industries in Uniontown include Health Care & Social Assistance (916 | 23.6%), Retail Trade (726 | 18.7%), Manufacturing (384 | 9.9%), Accommodation & Food Services (323 | 8.3%), and Construction (236 | 6.1%).
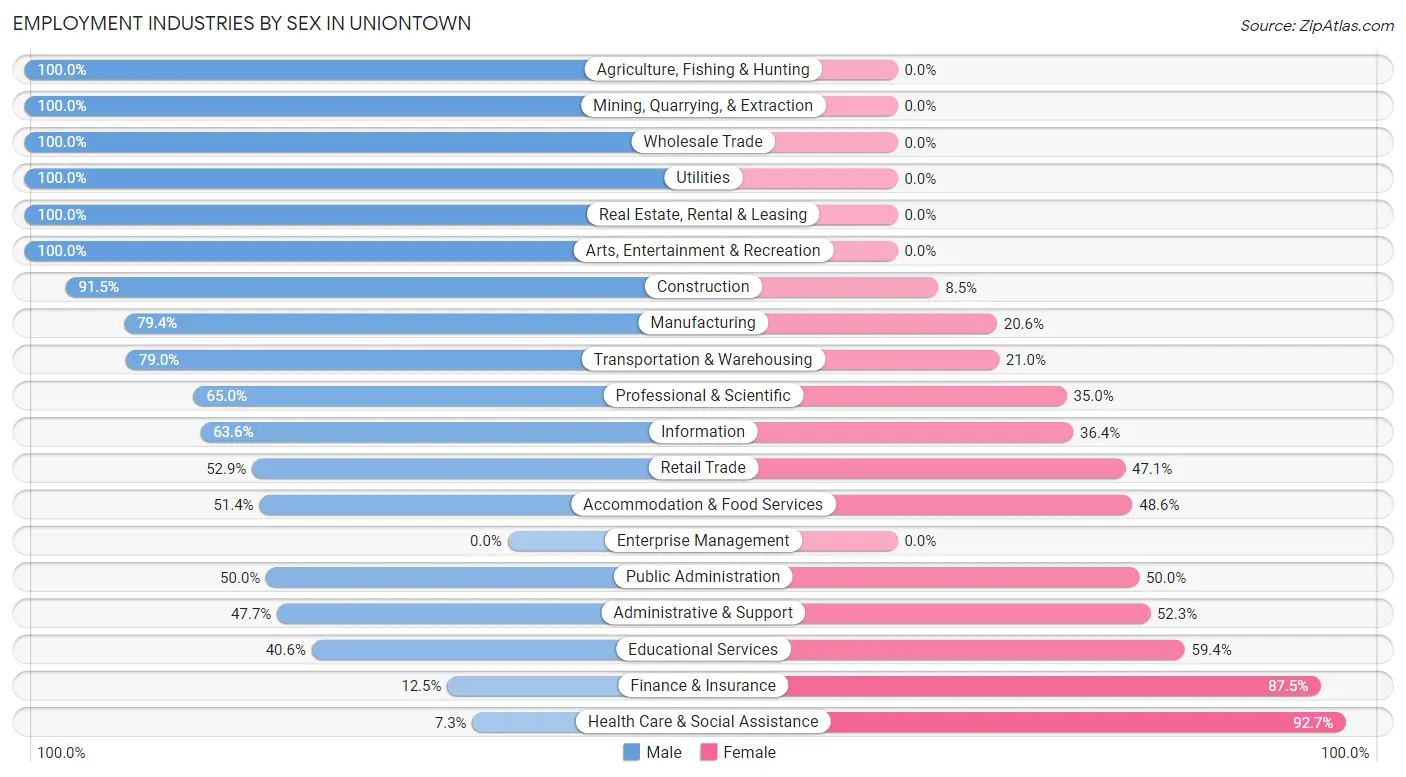
Employment Industries by Sex in Uniontown
The Uniontown industries that see more men than women are Agriculture, Fishing & Hunting (100.0%), Mining, Quarrying, & Extraction (100.0%), and Wholesale Trade (100.0%), whereas the industries that tend to have a higher number of women are Health Care & Social Assistance (92.7%), Finance & Insurance (87.5%), and Educational Services (59.4%).
| Industry | Male | Female |
| Agriculture, Fishing & Hunting | 32 (100.0%) | 0 (0.0%) |
| Mining, Quarrying, & Extraction | 81 (100.0%) | 0 (0.0%) |
| Construction | 216 (91.5%) | 20 (8.5%) |
| Manufacturing | 305 (79.4%) | 79 (20.6%) |
| Wholesale Trade | 30 (100.0%) | 0 (0.0%) |
| Retail Trade | 384 (52.9%) | 342 (47.1%) |
| Transportation & Warehousing | 113 (79.0%) | 30 (21.0%) |
| Utilities | 48 (100.0%) | 0 (0.0%) |
| Information | 14 (63.6%) | 8 (36.4%) |
| Finance & Insurance | 11 (12.5%) | 77 (87.5%) |
| Real Estate, Rental & Leasing | 19 (100.0%) | 0 (0.0%) |
| Professional & Scientific | 65 (65.0%) | 35 (35.0%) |
| Enterprise Management | 0 (0.0%) | 0 (0.0%) |
| Administrative & Support | 94 (47.7%) | 103 (52.3%) |
| Educational Services | 71 (40.6%) | 104 (59.4%) |
| Health Care & Social Assistance | 67 (7.3%) | 849 (92.7%) |
| Arts, Entertainment & Recreation | 10 (100.0%) | 0 (0.0%) |
| Accommodation & Food Services | 166 (51.4%) | 157 (48.6%) |
| Public Administration | 107 (50.0%) | 107 (50.0%) |
| Total | 1,907 (49.1%) | 1,973 (50.8%) |
Education in Uniontown
School Enrollment in Uniontown
The most common levels of schooling among the 1,697 students in Uniontown are elementary school (476 | 28.1%), high school (386 | 22.8%), and middle school (345 | 20.3%).
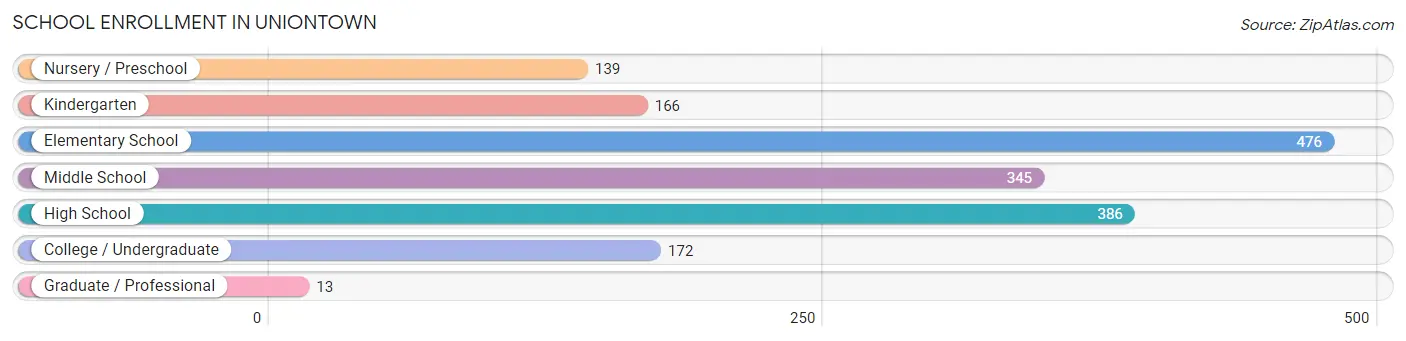
| School Level | # Students | % Students |
| Nursery / Preschool | 139 | 8.2% |
| Kindergarten | 166 | 9.8% |
| Elementary School | 476 | 28.1% |
| Middle School | 345 | 20.3% |
| High School | 386 | 22.8% |
| College / Undergraduate | 172 | 10.1% |
| Graduate / Professional | 13 | 0.8% |
| Total | 1,697 | 100.0% |
School Enrollment by Age by Funding Source in Uniontown
Out of a total of 1,697 students who are enrolled in schools in Uniontown, 231 (13.6%) attend a private institution, while the remaining 1,466 (86.4%) are enrolled in public schools. The age group of 25 to 34 year olds has the highest likelihood of being enrolled in private schools, with 37 (71.2% in the age bracket) enrolled. Conversely, the age group of 20 to 24 year olds has the lowest likelihood of being enrolled in a private school, with 109 (100.0% in the age bracket) attending a public institution.
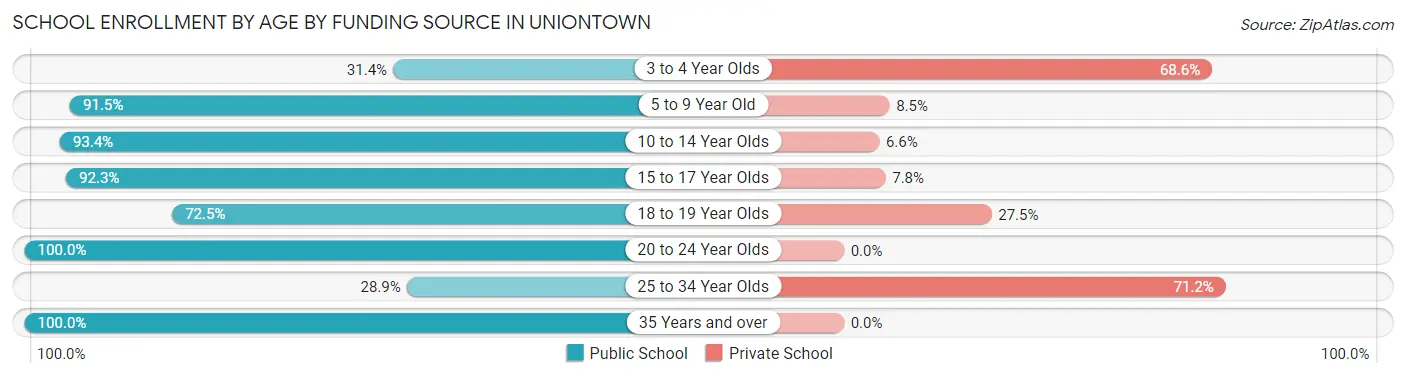
| Age Bracket | Public School | Private School |
| 3 to 4 Year Olds | 38 (31.4%) | 83 (68.6%) |
| 5 to 9 Year Old | 572 (91.5%) | 53 (8.5%) |
| 10 to 14 Year Olds | 355 (93.4%) | 25 (6.6%) |
| 15 to 17 Year Olds | 262 (92.2%) | 22 (7.7%) |
| 18 to 19 Year Olds | 29 (72.5%) | 11 (27.5%) |
| 20 to 24 Year Olds | 109 (100.0%) | 0 (0.0%) |
| 25 to 34 Year Olds | 15 (28.8%) | 37 (71.2%) |
| 35 Years and over | 86 (100.0%) | 0 (0.0%) |
| Total | 1,466 (86.4%) | 231 (13.6%) |
Educational Attainment by Field of Study in Uniontown
Business (284 | 17.5%), education (251 | 15.5%), social sciences (145 | 8.9%), literature & languages (134 | 8.3%), and arts & humanities (124 | 7.6%) are the most common fields of study among 1,623 individuals in Uniontown who have obtained a bachelor's degree or higher.
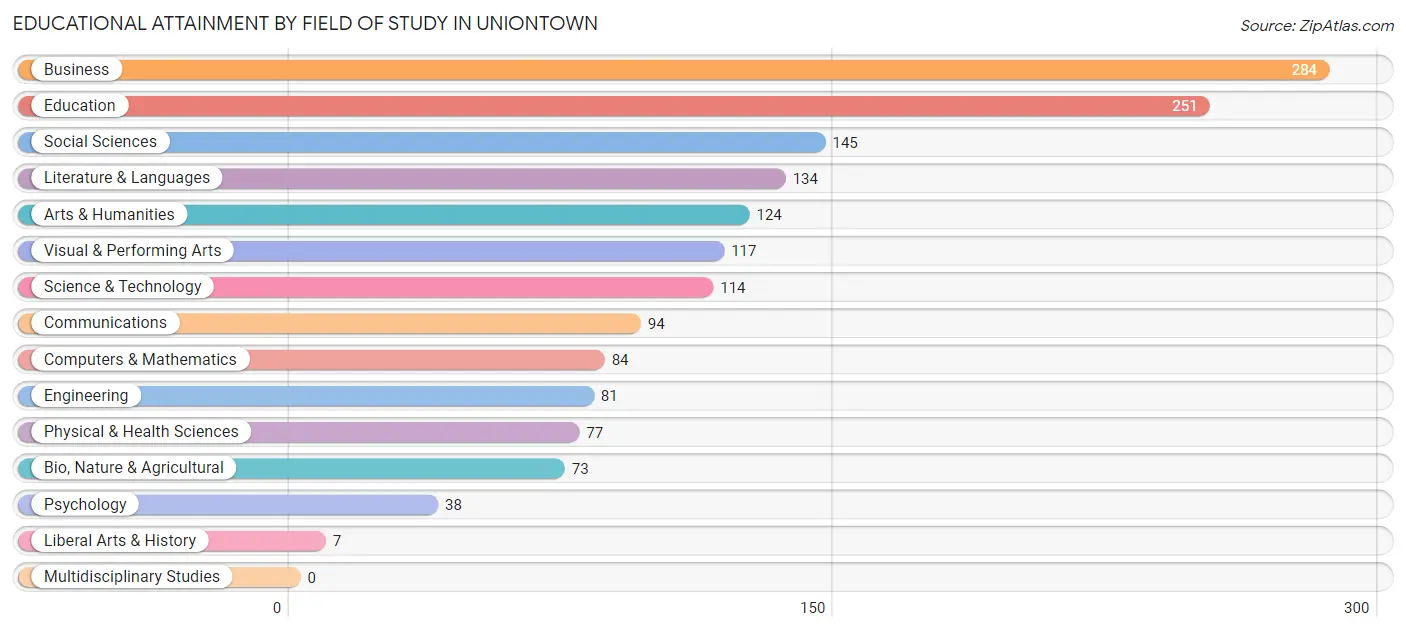
| Field of Study | # Graduates | % Graduates |
| Computers & Mathematics | 84 | 5.2% |
| Bio, Nature & Agricultural | 73 | 4.5% |
| Physical & Health Sciences | 77 | 4.7% |
| Psychology | 38 | 2.3% |
| Social Sciences | 145 | 8.9% |
| Engineering | 81 | 5.0% |
| Multidisciplinary Studies | 0 | 0.0% |
| Science & Technology | 114 | 7.0% |
| Business | 284 | 17.5% |
| Education | 251 | 15.5% |
| Literature & Languages | 134 | 8.3% |
| Liberal Arts & History | 7 | 0.4% |
| Visual & Performing Arts | 117 | 7.2% |
| Communications | 94 | 5.8% |
| Arts & Humanities | 124 | 7.6% |
| Total | 1,623 | 100.0% |
Transportation & Commute in Uniontown
Vehicle Availability by Sex in Uniontown
The most prevalent vehicle ownership categories in Uniontown are males with 2 vehicles (984, accounting for 51.7%) and females with 2 vehicles (744, making up 51.8%).
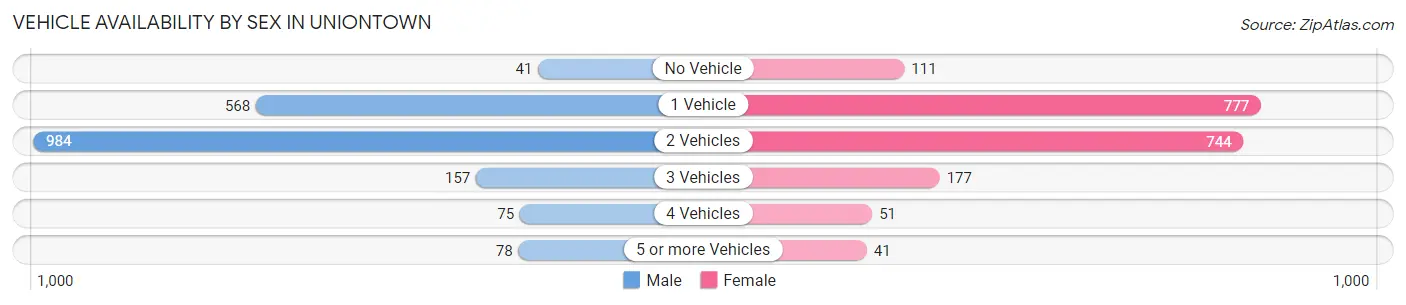
| Vehicles Available | Male | Female |
| No Vehicle | 41 (2.1%) | 111 (5.8%) |
| 1 Vehicle | 568 (29.8%) | 777 (40.9%) |
| 2 Vehicles | 984 (51.7%) | 744 (39.1%) |
| 3 Vehicles | 157 (8.3%) | 177 (9.3%) |
| 4 Vehicles | 75 (3.9%) | 51 (2.7%) |
| 5 or more Vehicles | 78 (4.1%) | 41 (2.2%) |
| Total | 1,903 (100.0%) | 1,901 (100.0%) |
Commute Time in Uniontown
The most frequently occuring commute durations in Uniontown are 10 to 14 minutes (762 commuters, 21.4%), 5 to 9 minutes (689 commuters, 19.4%), and 45 to 59 minutes (416 commuters, 11.7%).
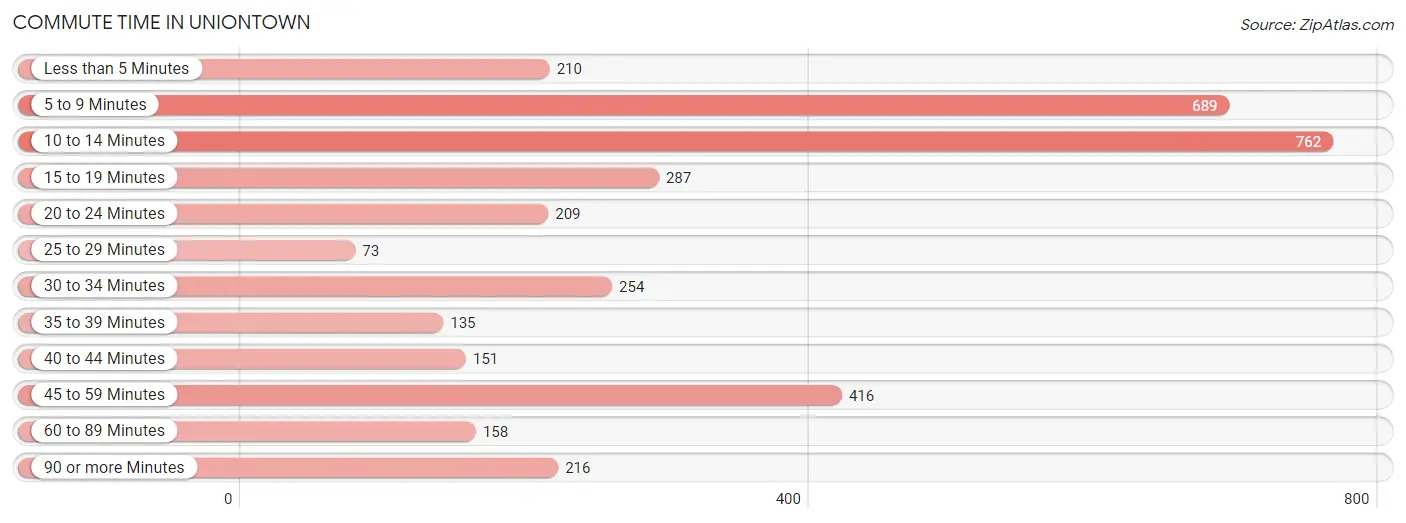
| Commute Time | # Commuters | % Commuters |
| Less than 5 Minutes | 210 | 5.9% |
| 5 to 9 Minutes | 689 | 19.4% |
| 10 to 14 Minutes | 762 | 21.4% |
| 15 to 19 Minutes | 287 | 8.1% |
| 20 to 24 Minutes | 209 | 5.9% |
| 25 to 29 Minutes | 73 | 2.1% |
| 30 to 34 Minutes | 254 | 7.1% |
| 35 to 39 Minutes | 135 | 3.8% |
| 40 to 44 Minutes | 151 | 4.2% |
| 45 to 59 Minutes | 416 | 11.7% |
| 60 to 89 Minutes | 158 | 4.4% |
| 90 or more Minutes | 216 | 6.1% |
Commute Time by Sex in Uniontown
The most common commute times in Uniontown are 5 to 9 minutes (404 commuters, 22.8%) for males and 10 to 14 minutes (515 commuters, 28.7%) for females.
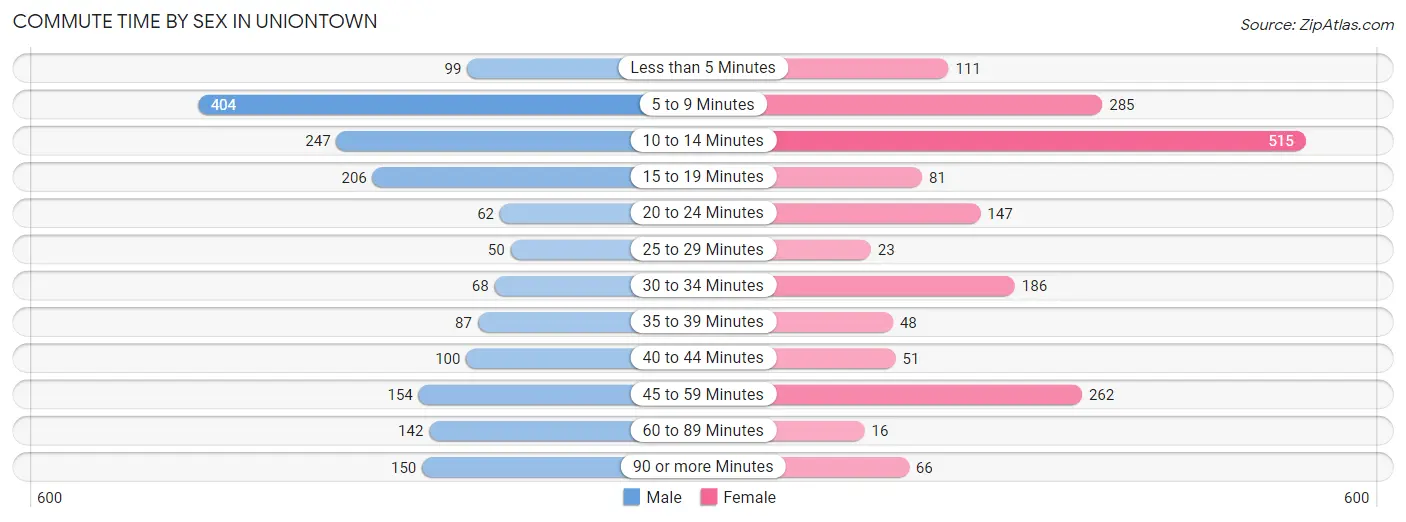
| Commute Time | Male | Female |
| Less than 5 Minutes | 99 (5.6%) | 111 (6.2%) |
| 5 to 9 Minutes | 404 (22.8%) | 285 (15.9%) |
| 10 to 14 Minutes | 247 (14.0%) | 515 (28.7%) |
| 15 to 19 Minutes | 206 (11.6%) | 81 (4.5%) |
| 20 to 24 Minutes | 62 (3.5%) | 147 (8.2%) |
| 25 to 29 Minutes | 50 (2.8%) | 23 (1.3%) |
| 30 to 34 Minutes | 68 (3.8%) | 186 (10.4%) |
| 35 to 39 Minutes | 87 (4.9%) | 48 (2.7%) |
| 40 to 44 Minutes | 100 (5.7%) | 51 (2.9%) |
| 45 to 59 Minutes | 154 (8.7%) | 262 (14.6%) |
| 60 to 89 Minutes | 142 (8.0%) | 16 (0.9%) |
| 90 or more Minutes | 150 (8.5%) | 66 (3.7%) |
Time of Departure to Work by Sex in Uniontown
The most frequent times of departure to work in Uniontown are 12:00 AM to 4:59 AM (274, 15.5%) for males and 8:00 AM to 8:29 AM (269, 15.0%) for females.
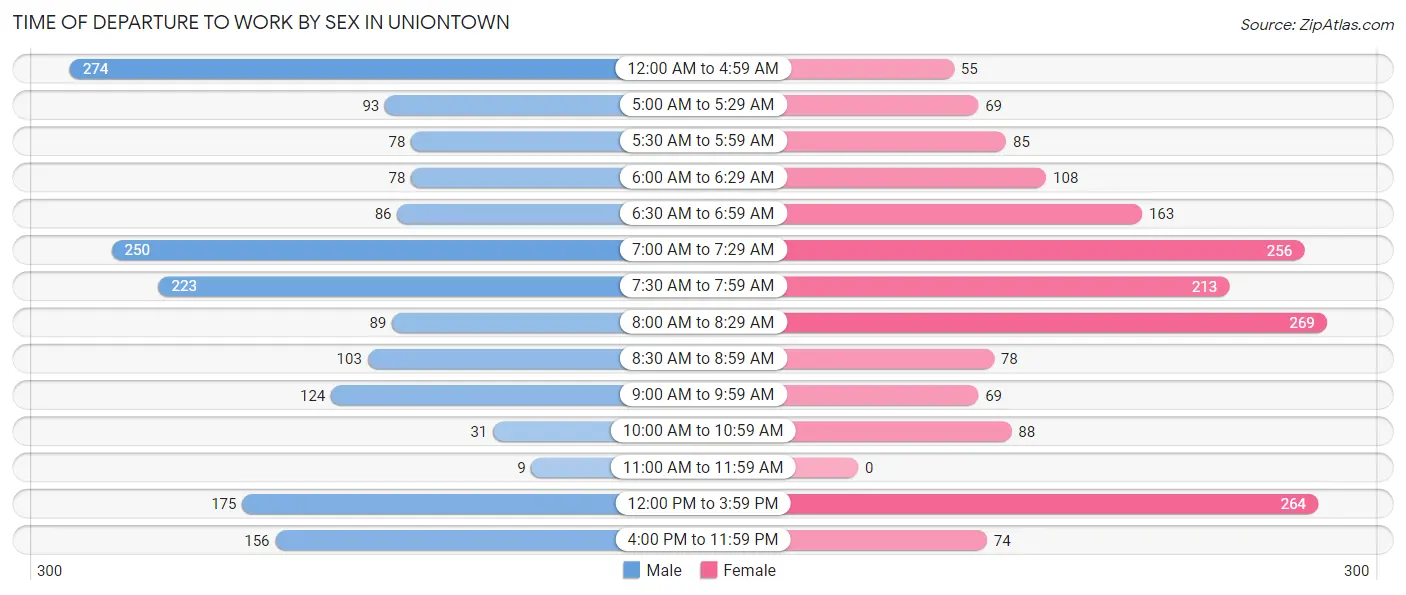
| Time of Departure | Male | Female |
| 12:00 AM to 4:59 AM | 274 (15.5%) | 55 (3.1%) |
| 5:00 AM to 5:29 AM | 93 (5.3%) | 69 (3.8%) |
| 5:30 AM to 5:59 AM | 78 (4.4%) | 85 (4.8%) |
| 6:00 AM to 6:29 AM | 78 (4.4%) | 108 (6.0%) |
| 6:30 AM to 6:59 AM | 86 (4.9%) | 163 (9.1%) |
| 7:00 AM to 7:29 AM | 250 (14.1%) | 256 (14.3%) |
| 7:30 AM to 7:59 AM | 223 (12.6%) | 213 (11.9%) |
| 8:00 AM to 8:29 AM | 89 (5.0%) | 269 (15.0%) |
| 8:30 AM to 8:59 AM | 103 (5.8%) | 78 (4.4%) |
| 9:00 AM to 9:59 AM | 124 (7.0%) | 69 (3.8%) |
| 10:00 AM to 10:59 AM | 31 (1.8%) | 88 (4.9%) |
| 11:00 AM to 11:59 AM | 9 (0.5%) | 0 (0.0%) |
| 12:00 PM to 3:59 PM | 175 (9.9%) | 264 (14.7%) |
| 4:00 PM to 11:59 PM | 156 (8.8%) | 74 (4.1%) |
| Total | 1,769 (100.0%) | 1,791 (100.0%) |
Housing Occupancy in Uniontown
Occupancy by Ownership in Uniontown
Of the total 4,845 dwellings in Uniontown, owner-occupied units account for 2,526 (52.1%), while renter-occupied units make up 2,319 (47.9%).
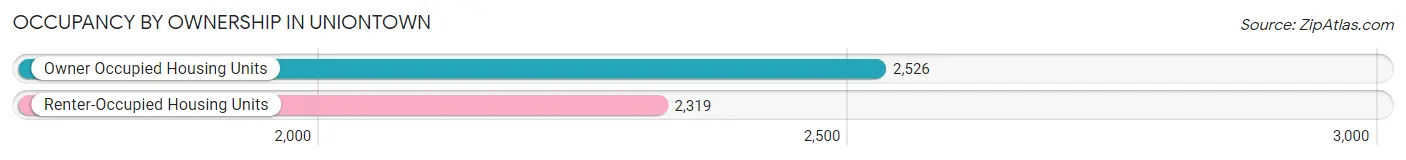
| Occupancy | # Housing Units | % Housing Units |
| Owner Occupied Housing Units | 2,526 | 52.1% |
| Renter-Occupied Housing Units | 2,319 | 47.9% |
| Total Occupied Housing Units | 4,845 | 100.0% |
Occupancy by Household Size in Uniontown
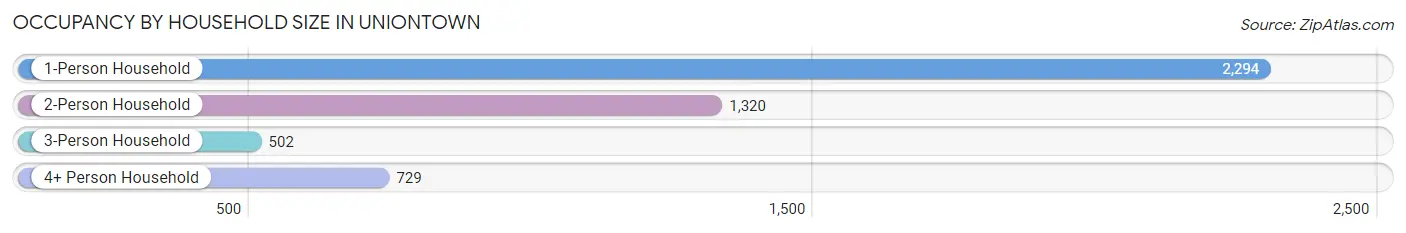
| Household Size | # Housing Units | % Housing Units |
| 1-Person Household | 2,294 | 47.3% |
| 2-Person Household | 1,320 | 27.2% |
| 3-Person Household | 502 | 10.4% |
| 4+ Person Household | 729 | 15.0% |
| Total Housing Units | 4,845 | 100.0% |
Occupancy by Ownership by Household Size in Uniontown
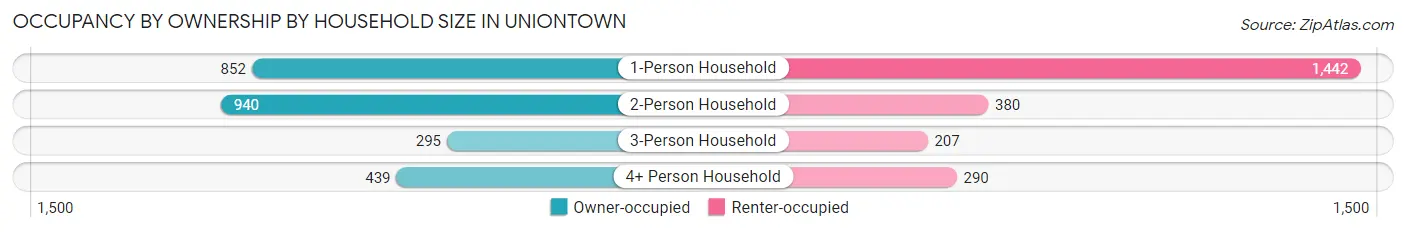
| Household Size | Owner-occupied | Renter-occupied |
| 1-Person Household | 852 (37.1%) | 1,442 (62.9%) |
| 2-Person Household | 940 (71.2%) | 380 (28.8%) |
| 3-Person Household | 295 (58.8%) | 207 (41.2%) |
| 4+ Person Household | 439 (60.2%) | 290 (39.8%) |
| Total Housing Units | 2,526 (52.1%) | 2,319 (47.9%) |
Occupancy by Educational Attainment in Uniontown
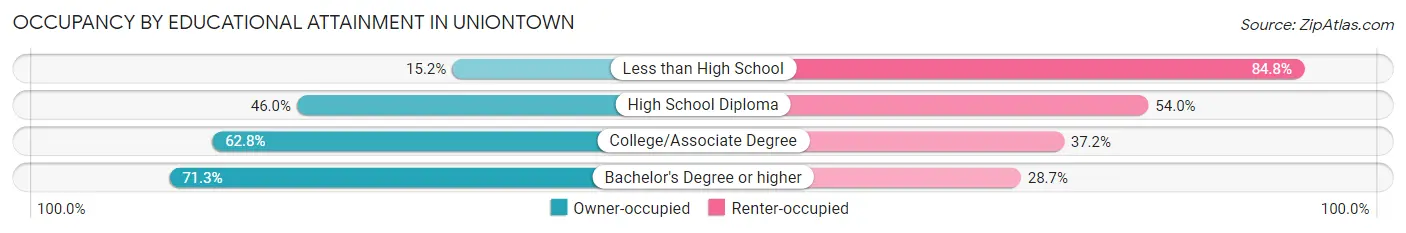
| Household Size | Owner-occupied | Renter-occupied |
| Less than High School | 91 (15.2%) | 506 (84.8%) |
| High School Diploma | 875 (46.0%) | 1,026 (54.0%) |
| College/Associate Degree | 839 (62.8%) | 497 (37.2%) |
| Bachelor's Degree or higher | 721 (71.3%) | 290 (28.7%) |
Occupancy by Age of Householder in Uniontown
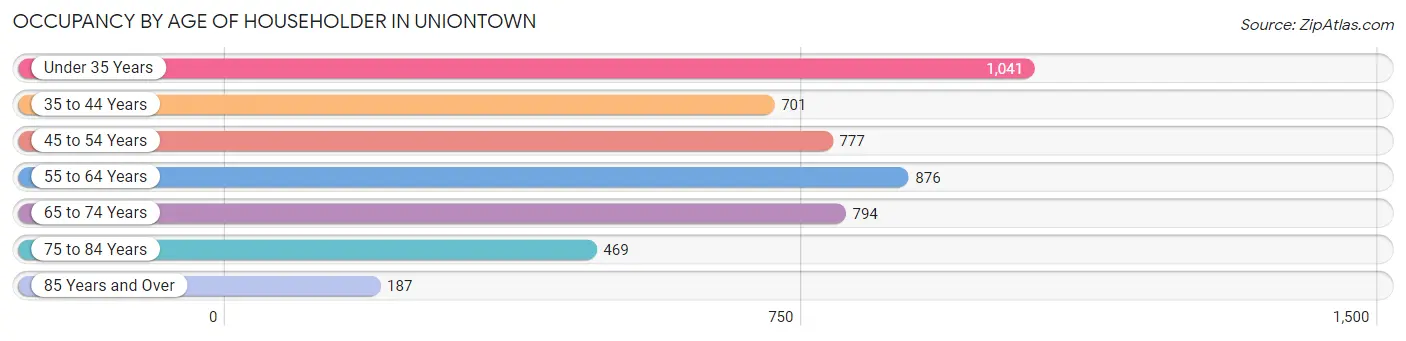
| Age Bracket | # Households | % Households |
| Under 35 Years | 1,041 | 21.5% |
| 35 to 44 Years | 701 | 14.5% |
| 45 to 54 Years | 777 | 16.0% |
| 55 to 64 Years | 876 | 18.1% |
| 65 to 74 Years | 794 | 16.4% |
| 75 to 84 Years | 469 | 9.7% |
| 85 Years and Over | 187 | 3.9% |
| Total | 4,845 | 100.0% |
Housing Finances in Uniontown
Median Income by Occupancy in Uniontown
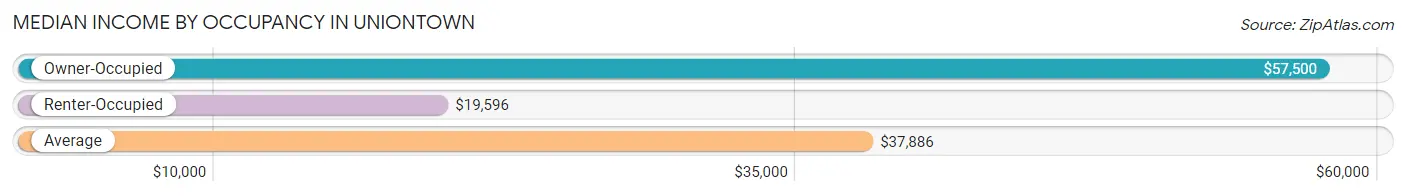
| Occupancy Type | # Households | Median Income |
| Owner-Occupied | 2,526 (52.1%) | $57,500 |
| Renter-Occupied | 2,319 (47.9%) | $19,596 |
| Average | 4,845 (100.0%) | $37,886 |
Occupancy by Householder Income Bracket in Uniontown
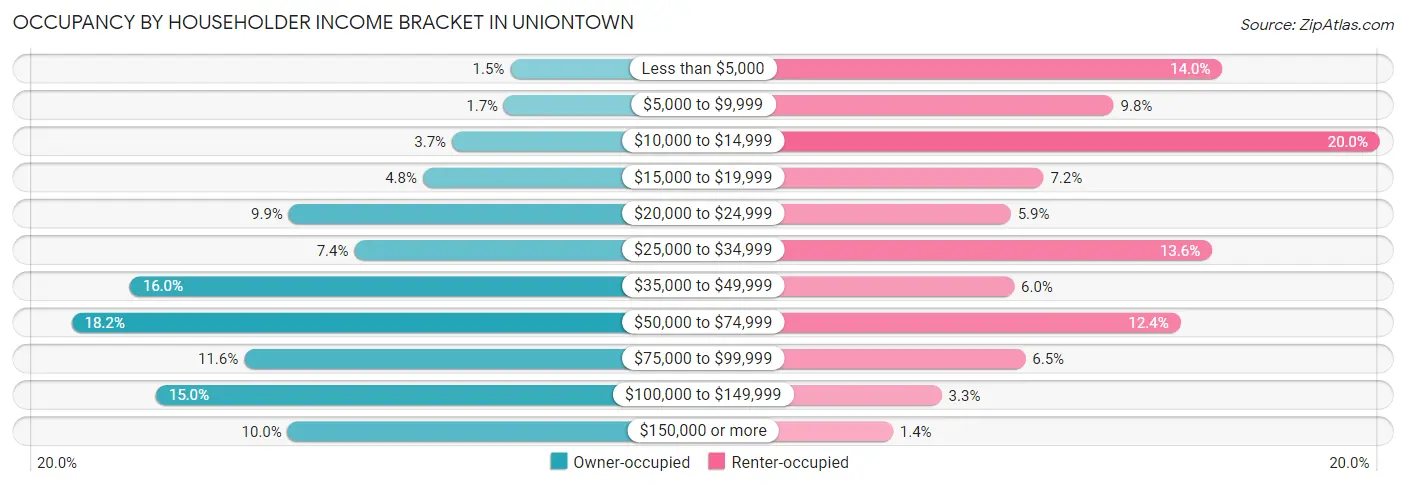
| Income Bracket | Owner-occupied | Renter-occupied |
| Less than $5,000 | 38 (1.5%) | 324 (14.0%) |
| $5,000 to $9,999 | 44 (1.7%) | 228 (9.8%) |
| $10,000 to $14,999 | 94 (3.7%) | 463 (20.0%) |
| $15,000 to $19,999 | 122 (4.8%) | 166 (7.2%) |
| $20,000 to $24,999 | 251 (9.9%) | 137 (5.9%) |
| $25,000 to $34,999 | 188 (7.4%) | 315 (13.6%) |
| $35,000 to $49,999 | 404 (16.0%) | 140 (6.0%) |
| $50,000 to $74,999 | 460 (18.2%) | 287 (12.4%) |
| $75,000 to $99,999 | 294 (11.6%) | 150 (6.5%) |
| $100,000 to $149,999 | 379 (15.0%) | 76 (3.3%) |
| $150,000 or more | 252 (10.0%) | 33 (1.4%) |
| Total | 2,526 (100.0%) | 2,319 (100.0%) |
Monthly Housing Cost Tiers in Uniontown
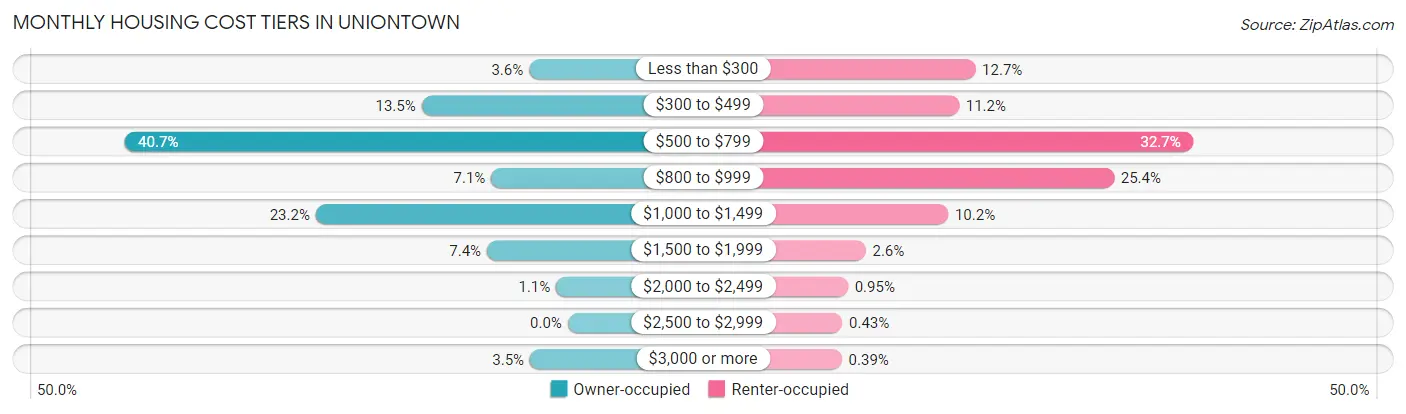
| Monthly Cost | Owner-occupied | Renter-occupied |
| Less than $300 | 90 (3.6%) | 294 (12.7%) |
| $300 to $499 | 340 (13.5%) | 259 (11.2%) |
| $500 to $799 | 1,029 (40.7%) | 758 (32.7%) |
| $800 to $999 | 178 (7.0%) | 590 (25.4%) |
| $1,000 to $1,499 | 586 (23.2%) | 236 (10.2%) |
| $1,500 to $1,999 | 188 (7.4%) | 60 (2.6%) |
| $2,000 to $2,499 | 27 (1.1%) | 22 (0.9%) |
| $2,500 to $2,999 | 0 (0.0%) | 10 (0.4%) |
| $3,000 or more | 88 (3.5%) | 9 (0.4%) |
| Total | 2,526 (100.0%) | 2,319 (100.0%) |
Physical Housing Characteristics in Uniontown
Housing Structures in Uniontown
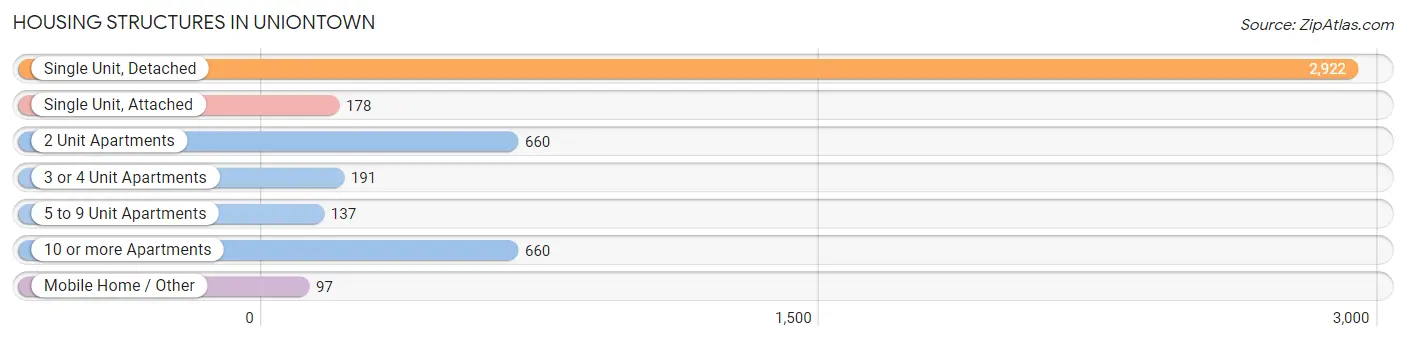
| Structure Type | # Housing Units | % Housing Units |
| Single Unit, Detached | 2,922 | 60.3% |
| Single Unit, Attached | 178 | 3.7% |
| 2 Unit Apartments | 660 | 13.6% |
| 3 or 4 Unit Apartments | 191 | 3.9% |
| 5 to 9 Unit Apartments | 137 | 2.8% |
| 10 or more Apartments | 660 | 13.6% |
| Mobile Home / Other | 97 | 2.0% |
| Total | 4,845 | 100.0% |
Housing Structures by Occupancy in Uniontown
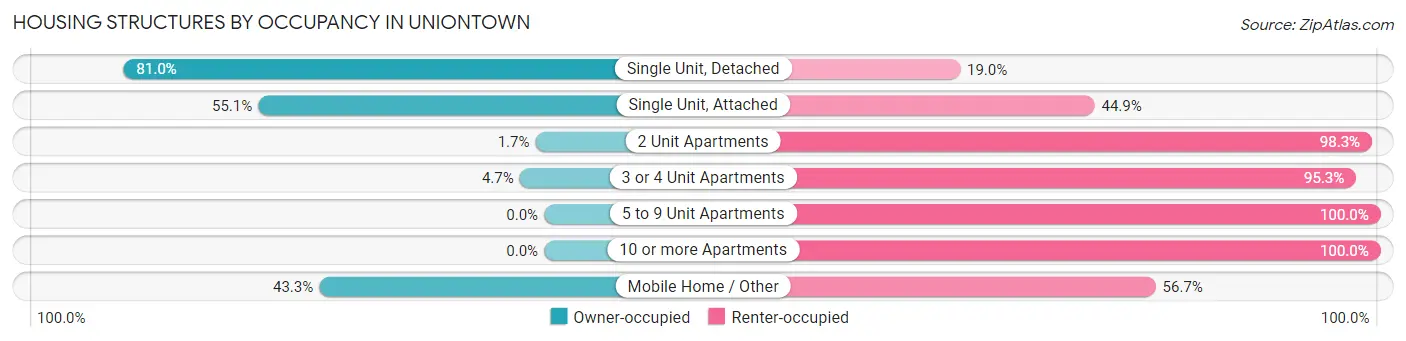
| Structure Type | Owner-occupied | Renter-occupied |
| Single Unit, Detached | 2,366 (81.0%) | 556 (19.0%) |
| Single Unit, Attached | 98 (55.1%) | 80 (44.9%) |
| 2 Unit Apartments | 11 (1.7%) | 649 (98.3%) |
| 3 or 4 Unit Apartments | 9 (4.7%) | 182 (95.3%) |
| 5 to 9 Unit Apartments | 0 (0.0%) | 137 (100.0%) |
| 10 or more Apartments | 0 (0.0%) | 660 (100.0%) |
| Mobile Home / Other | 42 (43.3%) | 55 (56.7%) |
| Total | 2,526 (52.1%) | 2,319 (47.9%) |
Housing Structures by Number of Rooms in Uniontown
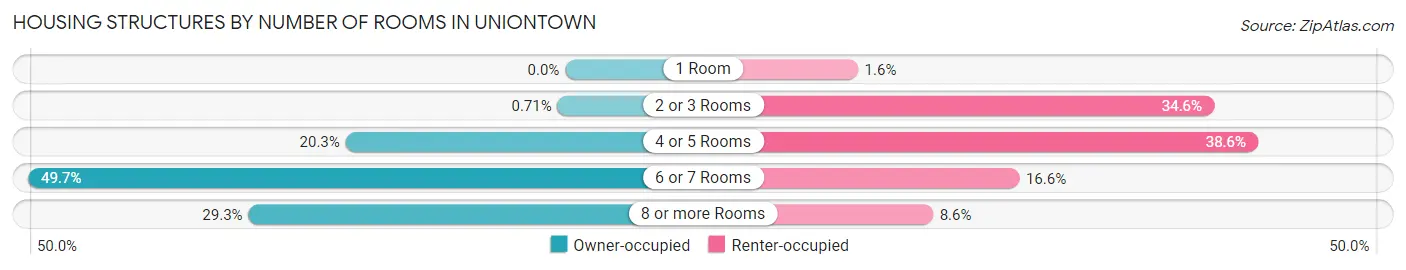
| Number of Rooms | Owner-occupied | Renter-occupied |
| 1 Room | 0 (0.0%) | 38 (1.6%) |
| 2 or 3 Rooms | 18 (0.7%) | 802 (34.6%) |
| 4 or 5 Rooms | 513 (20.3%) | 896 (38.6%) |
| 6 or 7 Rooms | 1,255 (49.7%) | 384 (16.6%) |
| 8 or more Rooms | 740 (29.3%) | 199 (8.6%) |
| Total | 2,526 (100.0%) | 2,319 (100.0%) |
Housing Structure by Heating Type in Uniontown
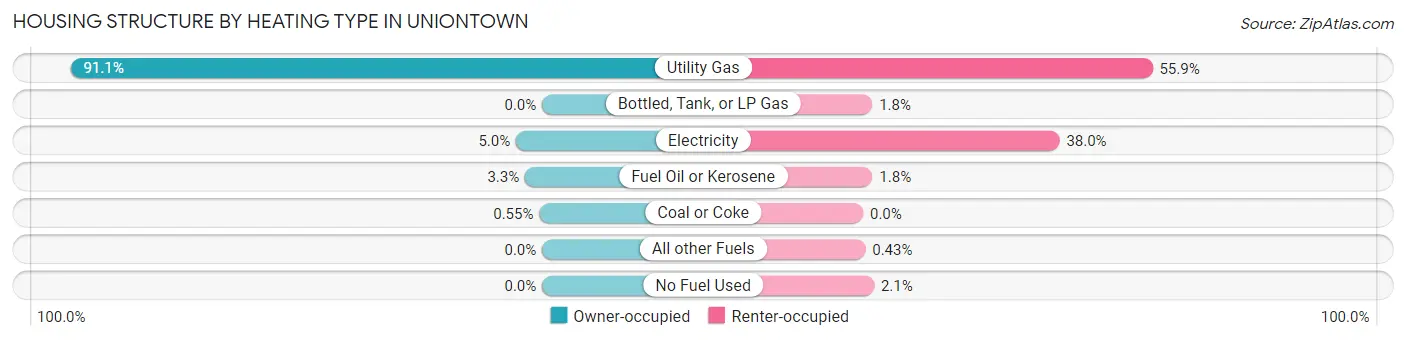
| Heating Type | Owner-occupied | Renter-occupied |
| Utility Gas | 2,302 (91.1%) | 1,297 (55.9%) |
| Bottled, Tank, or LP Gas | 0 (0.0%) | 41 (1.8%) |
| Electricity | 127 (5.0%) | 880 (38.0%) |
| Fuel Oil or Kerosene | 83 (3.3%) | 42 (1.8%) |
| Coal or Coke | 14 (0.5%) | 0 (0.0%) |
| All other Fuels | 0 (0.0%) | 10 (0.4%) |
| No Fuel Used | 0 (0.0%) | 49 (2.1%) |
| Total | 2,526 (100.0%) | 2,319 (100.0%) |
Household Vehicle Usage in Uniontown
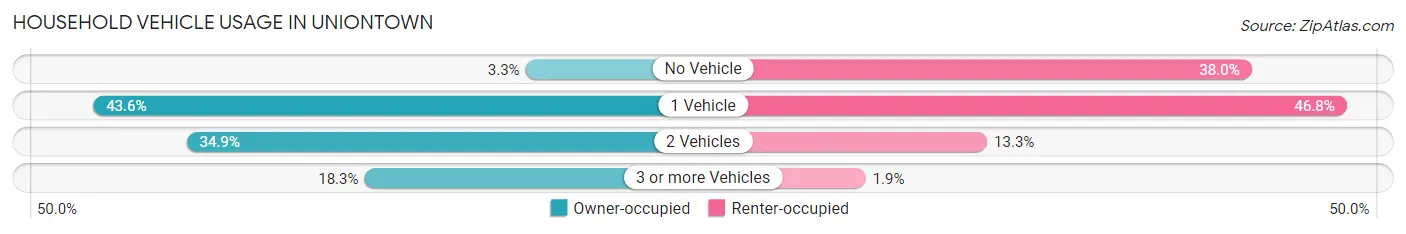
| Vehicles per Household | Owner-occupied | Renter-occupied |
| No Vehicle | 82 (3.3%) | 880 (38.0%) |
| 1 Vehicle | 1,101 (43.6%) | 1,086 (46.8%) |
| 2 Vehicles | 881 (34.9%) | 308 (13.3%) |
| 3 or more Vehicles | 462 (18.3%) | 45 (1.9%) |
| Total | 2,526 (100.0%) | 2,319 (100.0%) |
Real Estate & Mortgages in Uniontown
Real Estate and Mortgage Overview in Uniontown
| Characteristic | Without Mortgage | With Mortgage |
| Housing Units | 1,254 | 1,272 |
| Median Property Value | $91,100 | $87,700 |
| Median Household Income | $41,844 | $140 |
| Monthly Housing Costs | $570 | $88 |
| Real Estate Taxes | $1,282 | $11 |
Property Value by Mortgage Status in Uniontown
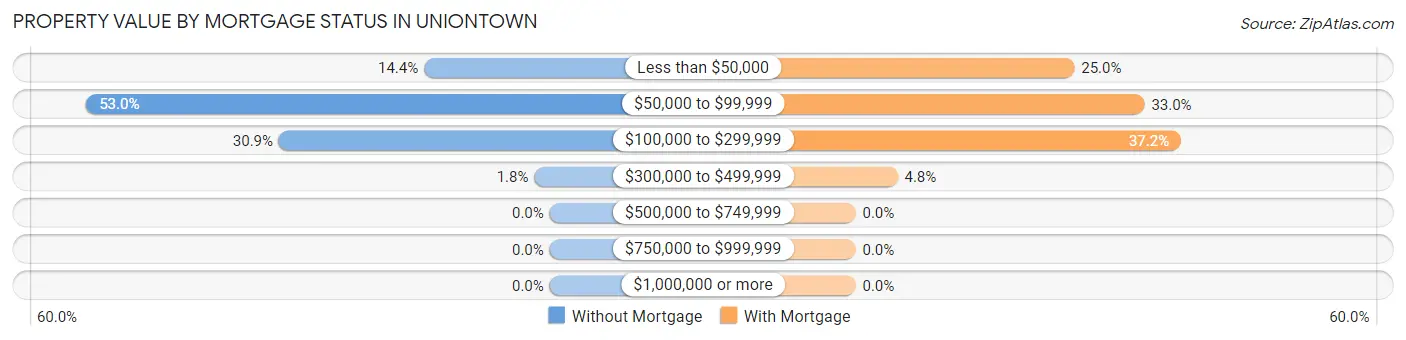
| Property Value | Without Mortgage | With Mortgage |
| Less than $50,000 | 180 (14.3%) | 318 (25.0%) |
| $50,000 to $99,999 | 664 (52.9%) | 420 (33.0%) |
| $100,000 to $299,999 | 388 (30.9%) | 473 (37.2%) |
| $300,000 to $499,999 | 22 (1.8%) | 61 (4.8%) |
| $500,000 to $749,999 | 0 (0.0%) | 0 (0.0%) |
| $750,000 to $999,999 | 0 (0.0%) | 0 (0.0%) |
| $1,000,000 or more | 0 (0.0%) | 0 (0.0%) |
| Total | 1,254 (100.0%) | 1,272 (100.0%) |
Household Income by Mortgage Status in Uniontown
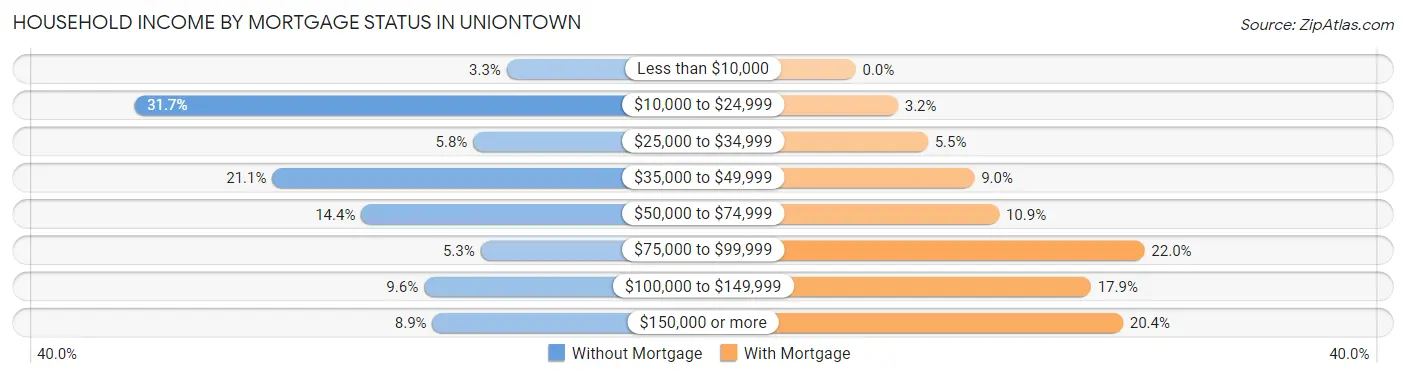
| Household Income | Without Mortgage | With Mortgage |
| Less than $10,000 | 41 (3.3%) | 0 (0.0%) |
| $10,000 to $24,999 | 397 (31.7%) | 41 (3.2%) |
| $25,000 to $34,999 | 73 (5.8%) | 70 (5.5%) |
| $35,000 to $49,999 | 265 (21.1%) | 115 (9.0%) |
| $50,000 to $74,999 | 180 (14.3%) | 139 (10.9%) |
| $75,000 to $99,999 | 66 (5.3%) | 280 (22.0%) |
| $100,000 to $149,999 | 120 (9.6%) | 228 (17.9%) |
| $150,000 or more | 112 (8.9%) | 259 (20.4%) |
| Total | 1,254 (100.0%) | 1,272 (100.0%) |
Property Value to Household Income Ratio in Uniontown
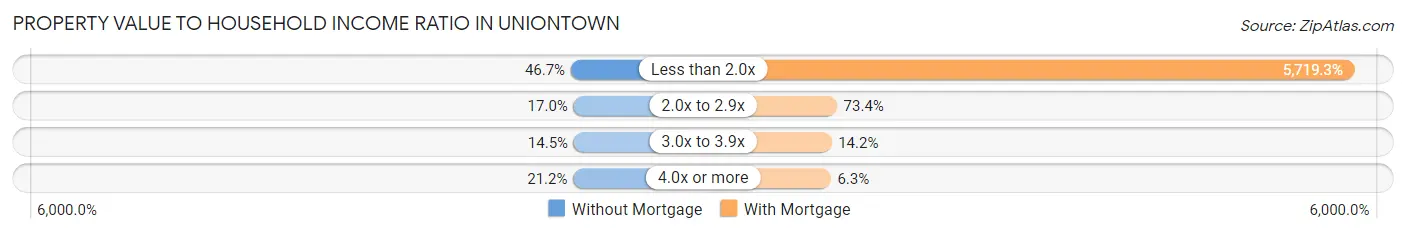
| Value-to-Income Ratio | Without Mortgage | With Mortgage |
| Less than 2.0x | 585 (46.7%) | 72,750 (5,719.3%) |
| 2.0x to 2.9x | 213 (17.0%) | 933 (73.4%) |
| 3.0x to 3.9x | 182 (14.5%) | 181 (14.2%) |
| 4.0x or more | 266 (21.2%) | 80 (6.3%) |
| Total | 1,254 (100.0%) | 1,272 (100.0%) |
Real Estate Taxes by Mortgage Status in Uniontown
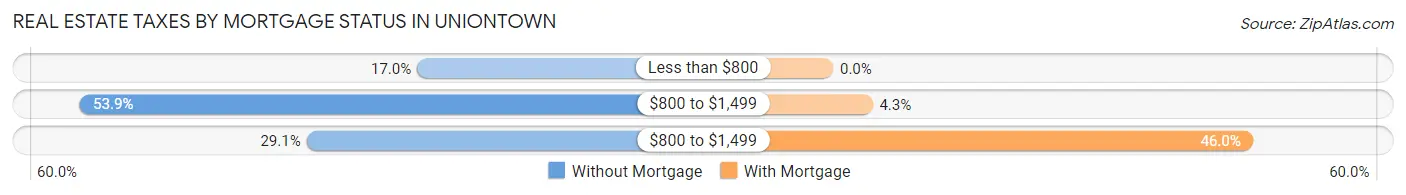
| Property Taxes | Without Mortgage | With Mortgage |
| Less than $800 | 213 (17.0%) | 0 (0.0%) |
| $800 to $1,499 | 676 (53.9%) | 55 (4.3%) |
| $800 to $1,499 | 365 (29.1%) | 585 (46.0%) |
| Total | 1,254 (100.0%) | 1,272 (100.0%) |
Health & Disability in Uniontown
Health Insurance Coverage by Age in Uniontown
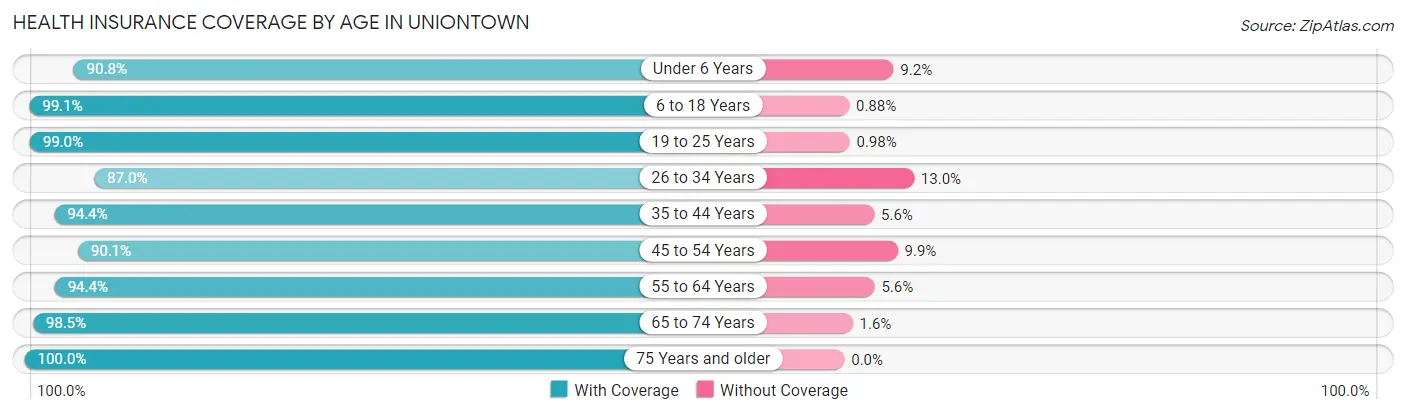
| Age Bracket | With Coverage | Without Coverage |
| Under 6 Years | 714 (90.8%) | 72 (9.2%) |
| 6 to 18 Years | 1,236 (99.1%) | 11 (0.9%) |
| 19 to 25 Years | 504 (99.0%) | 5 (1.0%) |
| 26 to 34 Years | 1,173 (87.0%) | 175 (13.0%) |
| 35 to 44 Years | 1,120 (94.4%) | 66 (5.6%) |
| 45 to 54 Years | 1,123 (90.1%) | 124 (9.9%) |
| 55 to 64 Years | 1,193 (94.4%) | 71 (5.6%) |
| 65 to 74 Years | 1,209 (98.5%) | 19 (1.5%) |
| 75 Years and older | 864 (100.0%) | 0 (0.0%) |
| Total | 9,136 (94.4%) | 543 (5.6%) |
Health Insurance Coverage by Citizenship Status in Uniontown
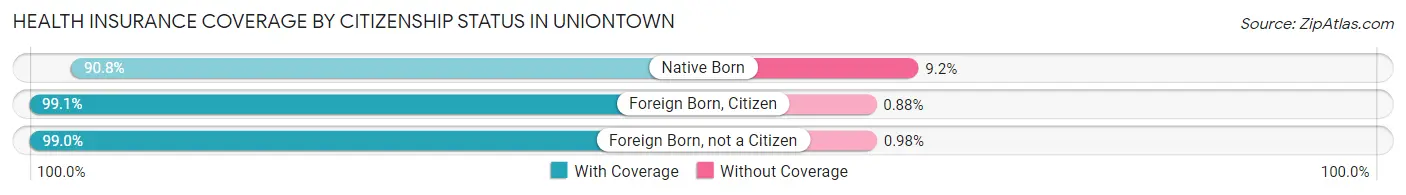
| Citizenship Status | With Coverage | Without Coverage |
| Native Born | 714 (90.8%) | 72 (9.2%) |
| Foreign Born, Citizen | 1,236 (99.1%) | 11 (0.9%) |
| Foreign Born, not a Citizen | 504 (99.0%) | 5 (1.0%) |
Health Insurance Coverage by Household Income in Uniontown
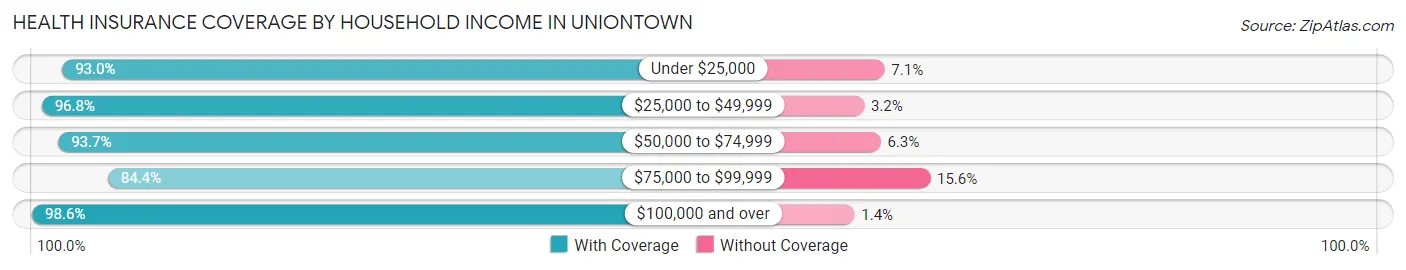
| Household Income | With Coverage | Without Coverage |
| Under $25,000 | 2,307 (92.9%) | 175 (7.0%) |
| $25,000 to $49,999 | 2,319 (96.8%) | 77 (3.2%) |
| $50,000 to $74,999 | 1,366 (93.7%) | 92 (6.3%) |
| $75,000 to $99,999 | 915 (84.4%) | 169 (15.6%) |
| $100,000 and over | 2,082 (98.6%) | 30 (1.4%) |
Public vs Private Health Insurance Coverage by Age in Uniontown
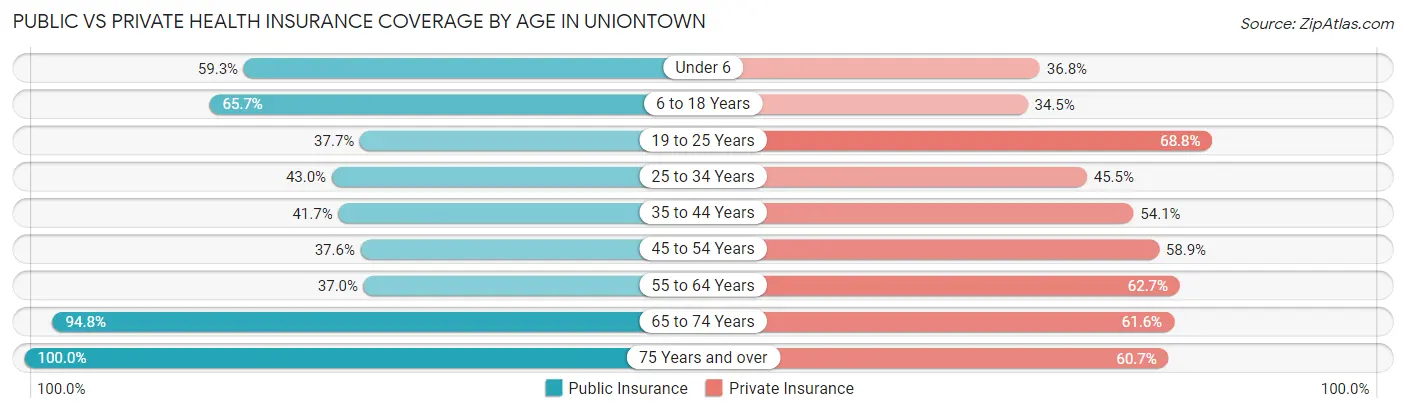
| Age Bracket | Public Insurance | Private Insurance |
| Under 6 | 466 (59.3%) | 289 (36.8%) |
| 6 to 18 Years | 819 (65.7%) | 430 (34.5%) |
| 19 to 25 Years | 192 (37.7%) | 350 (68.8%) |
| 25 to 34 Years | 579 (42.9%) | 613 (45.5%) |
| 35 to 44 Years | 495 (41.7%) | 642 (54.1%) |
| 45 to 54 Years | 469 (37.6%) | 734 (58.9%) |
| 55 to 64 Years | 468 (37.0%) | 793 (62.7%) |
| 65 to 74 Years | 1,164 (94.8%) | 757 (61.6%) |
| 75 Years and over | 864 (100.0%) | 524 (60.7%) |
| Total | 5,516 (57.0%) | 5,132 (53.0%) |
Disability Status by Sex by Age in Uniontown
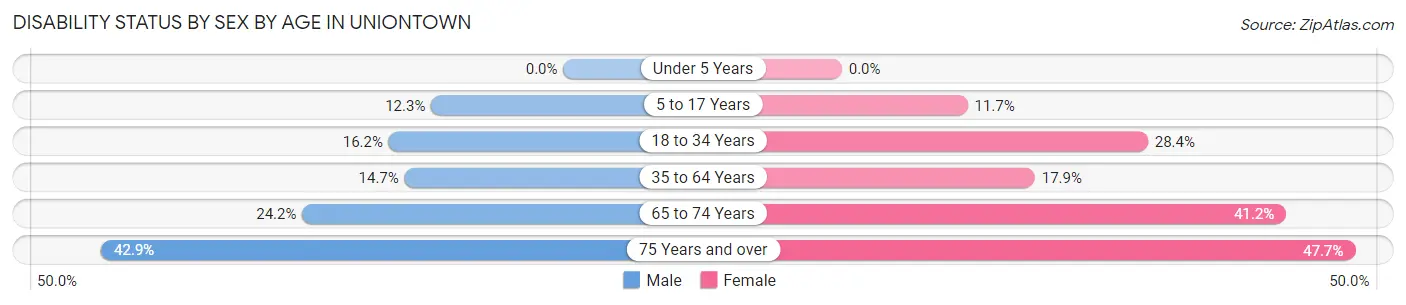
| Age Bracket | Male | Female |
| Under 5 Years | 0 (0.0%) | 0 (0.0%) |
| 5 to 17 Years | 90 (12.3%) | 76 (11.7%) |
| 18 to 34 Years | 133 (16.2%) | 301 (28.4%) |
| 35 to 64 Years | 265 (14.7%) | 340 (17.9%) |
| 65 to 74 Years | 133 (24.2%) | 280 (41.2%) |
| 75 Years and over | 115 (42.9%) | 284 (47.6%) |
Disability Class by Sex by Age in Uniontown
Disability Class: Hearing Difficulty
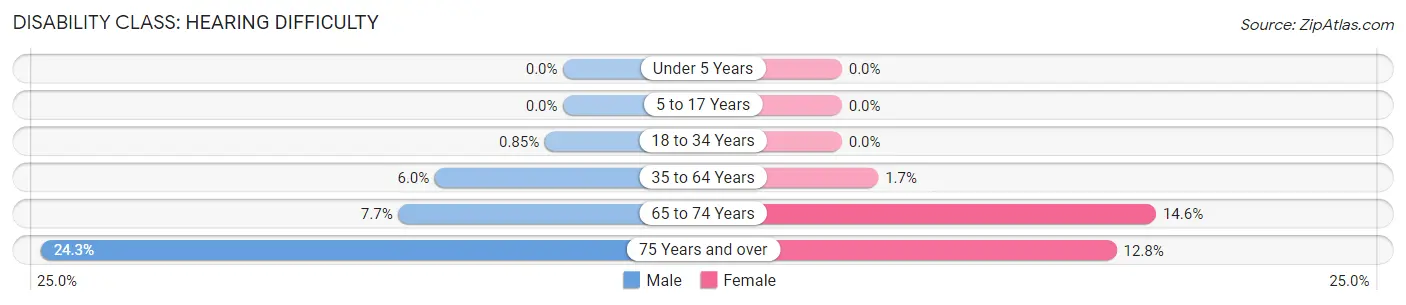
| Age Bracket | Male | Female |
| Under 5 Years | 0 (0.0%) | 0 (0.0%) |
| 5 to 17 Years | 0 (0.0%) | 0 (0.0%) |
| 18 to 34 Years | 7 (0.9%) | 0 (0.0%) |
| 35 to 64 Years | 107 (5.9%) | 32 (1.7%) |
| 65 to 74 Years | 42 (7.6%) | 99 (14.6%) |
| 75 Years and over | 65 (24.2%) | 76 (12.8%) |
Disability Class: Vision Difficulty
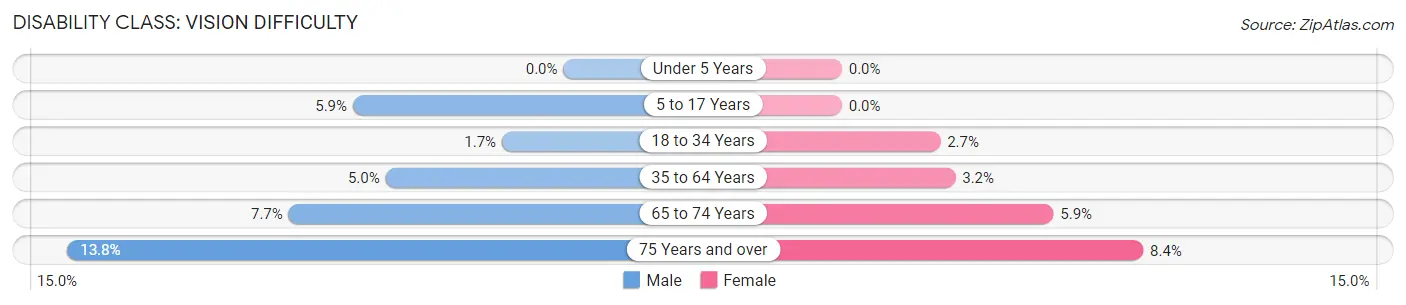
| Age Bracket | Male | Female |
| Under 5 Years | 0 (0.0%) | 0 (0.0%) |
| 5 to 17 Years | 43 (5.9%) | 0 (0.0%) |
| 18 to 34 Years | 14 (1.7%) | 29 (2.7%) |
| 35 to 64 Years | 89 (5.0%) | 60 (3.2%) |
| 65 to 74 Years | 42 (7.6%) | 40 (5.9%) |
| 75 Years and over | 37 (13.8%) | 50 (8.4%) |
Disability Class: Cognitive Difficulty
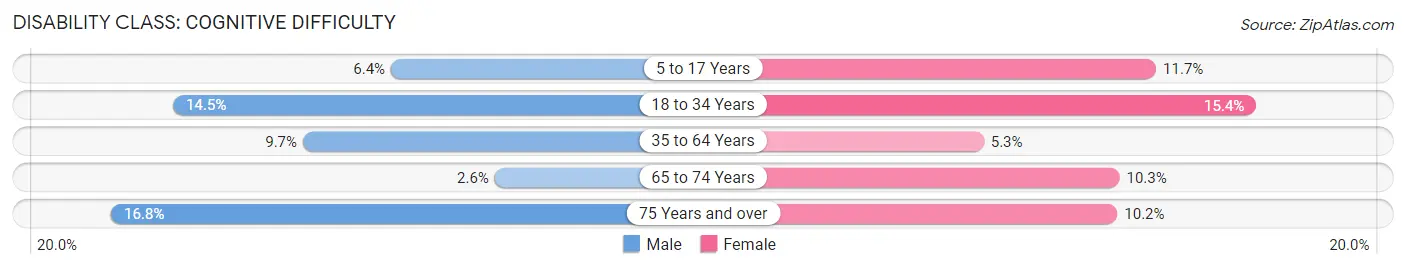
| Age Bracket | Male | Female |
| 5 to 17 Years | 47 (6.4%) | 76 (11.7%) |
| 18 to 34 Years | 119 (14.5%) | 163 (15.4%) |
| 35 to 64 Years | 174 (9.7%) | 100 (5.3%) |
| 65 to 74 Years | 14 (2.5%) | 70 (10.3%) |
| 75 Years and over | 45 (16.8%) | 61 (10.2%) |
Disability Class: Ambulatory Difficulty
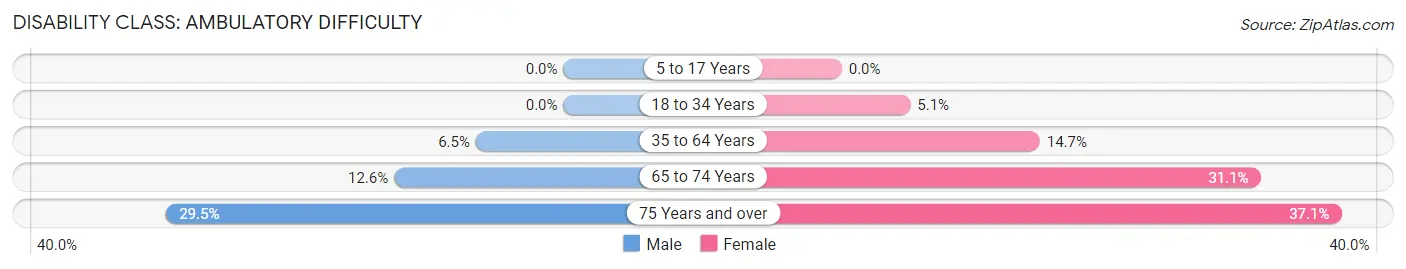
| Age Bracket | Male | Female |
| 5 to 17 Years | 0 (0.0%) | 0 (0.0%) |
| 18 to 34 Years | 0 (0.0%) | 54 (5.1%) |
| 35 to 64 Years | 117 (6.5%) | 279 (14.7%) |
| 65 to 74 Years | 69 (12.6%) | 211 (31.1%) |
| 75 Years and over | 79 (29.5%) | 221 (37.1%) |
Disability Class: Self-Care Difficulty
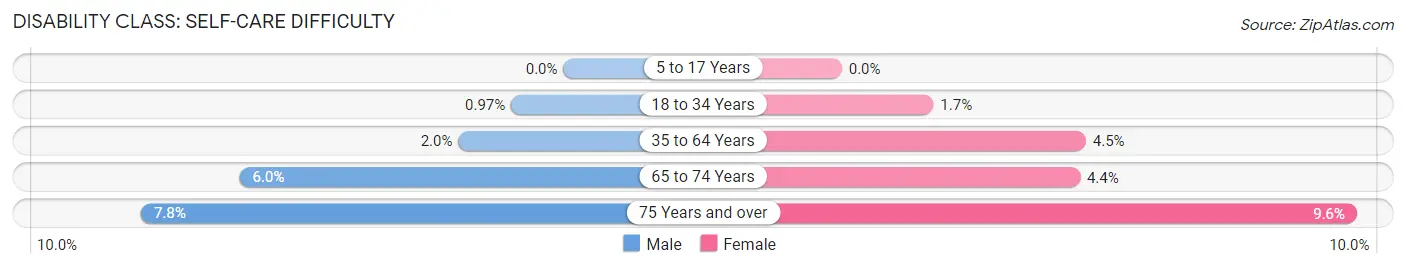
| Age Bracket | Male | Female |
| 5 to 17 Years | 0 (0.0%) | 0 (0.0%) |
| 18 to 34 Years | 8 (1.0%) | 18 (1.7%) |
| 35 to 64 Years | 35 (1.9%) | 86 (4.5%) |
| 65 to 74 Years | 33 (6.0%) | 30 (4.4%) |
| 75 Years and over | 21 (7.8%) | 57 (9.6%) |
Technology Access in Uniontown
Computing Device Access in Uniontown
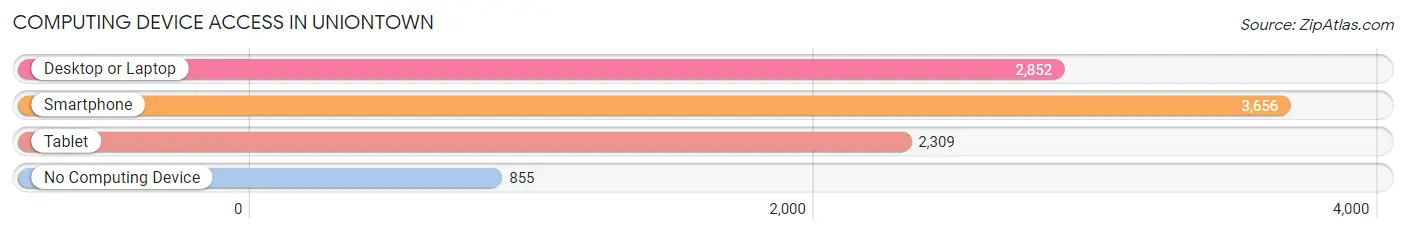
| Device Type | # Households | % Households |
| Desktop or Laptop | 2,852 | 58.9% |
| Smartphone | 3,656 | 75.5% |
| Tablet | 2,309 | 47.7% |
| No Computing Device | 855 | 17.6% |
| Total | 4,845 | 100.0% |
Internet Access in Uniontown
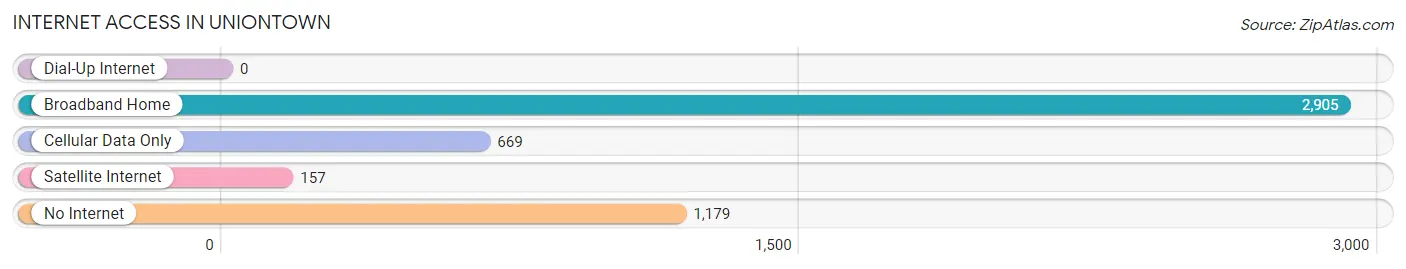
| Internet Type | # Households | % Households |
| Dial-Up Internet | 0 | 0.0% |
| Broadband Home | 2,905 | 60.0% |
| Cellular Data Only | 669 | 13.8% |
| Satellite Internet | 157 | 3.2% |
| No Internet | 1,179 | 24.3% |
| Total | 4,845 | 100.0% |
Uniontown Summary
Introduction
Uniontown is a city located in Fayette County, Pennsylvania, United States. It is the county seat of Fayette County and is located in the southwestern part of the state. The city is situated in the Laurel Highlands region of the Allegheny Mountains. Uniontown is located approximately 50 miles south of Pittsburgh and is part of the Pittsburgh metropolitan area. The population of Uniontown was 10,372 at the 2010 census, making it the largest city in Fayette County.
History
Uniontown was founded in 1776 by William Crawford, a settler from Virginia. The town was originally named Union Town or Unionville in honor of the Union forces that fought in the Revolutionary War. The town was incorporated as a borough in 1808 and as a city in 1866.
Uniontown was an important center of the coal mining industry in the late 19th and early 20th centuries. The city was the site of the infamous Homestead Strike of 1892, which pitted the workers of the Carnegie Steel Company against the company’s management. The strike was eventually broken by the intervention of the Pennsylvania National Guard.
Geography
Uniontown is located at 39°54′N 79°43′W (39.9000, -79.7167). According to the United States Census Bureau, the city has a total area of 4.2 square miles (10.8 km2), all of it land.
Uniontown is located in the Laurel Highlands region of the Allegheny Mountains. The city is situated in a valley between Chestnut Ridge to the east and the Allegheny Front to the west. The Youghiogheny River flows through the city.
Economy
Uniontown’s economy is largely based on the service sector. The city is home to several large employers, including the Uniontown Hospital, the Uniontown Mall, and the Uniontown Area School District. The city is also home to several small businesses, including restaurants, retail stores, and professional services.
The city is also home to several manufacturing companies, including the Uniontown Foundry, which produces cast iron products, and the Uniontown Glass Company, which produces glass products.
Demographics
As of the 2010 census, there were 10,372 people, 4,541 households, and 2,717 families residing in the city. The population density was 2,468.2 people per square mile (953.3/km2). There were 5,068 housing units at an average density of 1,212.3 per square mile (468.2/km2). The racial makeup of the city was 87.2% White, 10.2% African American, 0.2% Native American, 0.4% Asian, 0.1% Pacific Islander, 0.7% from other races, and 1.2% from two or more races. Hispanic or Latino of any race were 1.7% of the population.
There were 4,541 households, out of which 25.2% had children under the age of 18 living with them, 37.2% were married couples living together, 17.7% had a female householder with no husband present, and 39.7% were non-families. 33.7% of all households were made up of individuals, and 15.2% had someone living alone who was 65 years of age or older. The average household size was 2.27 and the average family size was 2.89.
In the city, the population was spread out, with 22.2% under the age of 18, 8.2% from 18 to 24, 27.2% from 25 to 44, 24.2% from 45 to 64, and 18.2% who were 65 years of age or older. The median age was 39 years. For every 100 females, there were 87.2 males. For every 100 females age 18 and over, there were 82.2 males.
The median income for a household in the city was $26,945, and the median income for a family was $33,945. Males had a median income of $30,945 versus $21,945 for females. The per capita income for the city was $15,945. About 16.2% of families and 19.2% of the population were below the poverty line, including 28.2% of those under age 18 and 11.2% of those age 65 or over.
Conclusion
Uniontown is a city located in Fayette County, Pennsylvania. It is the county seat of Fayette County and is located in the southwestern part of the state. The city is situated in the Laurel Highlands region of the Allegheny Mountains. Uniontown was founded in 1776 and was an important center of the coal mining industry in the late 19th and early 20th centuries. The population of Uniontown was 10,372 at the 2010 census, making it the largest city in Fayette County. The city’s economy is largely based on the service sector, with several large employers and small businesses. The racial makeup of the city was 87.2% White, 10.2% African American, 0.2% Native American, 0.4% Asian, 0.1% Pacific Islander, 0.7% from other races, and 1.2% from two or more races. The median income for a household in the city was $26,945, and the median income for a family was $33,945. About 16.2% of families and 19.2% of the population were below the poverty line.
Common Questions
What is the Total Population of Uniontown?
Total Population of Uniontown is 9,913.
What is the Total Male Population of Uniontown?
Total Male Population of Uniontown is 4,692.
What is the Total Female Population of Uniontown?
Total Female Population of Uniontown is 5,221.
What is the Ratio of Males per 100 Females in Uniontown?
There are 89.87 Males per 100 Females in Uniontown.
What is the Ratio of Females per 100 Males in Uniontown?
There are 111.27 Females per 100 Males in Uniontown.
What is the Median Population Age in Uniontown?
Median Population Age in Uniontown is 42.6 Years.
What is the Average Family Size in Uniontown
Average Family Size in Uniontown is 2.8 People.
What is the Average Household Size in Uniontown
Average Household Size in Uniontown is 2.0 People.
What is Per Capita Income in Uniontown?
Per Capita income in Uniontown is $27,646.
What is the Median Family Income in Uniontown?
Median Family Income in Uniontown is $64,032.
What is the Median Household income in Uniontown?
Median Household Income in Uniontown is $37,886.
What is Income or Wage Gap in Uniontown?
Income or Wage Gap in Uniontown is 12.7%.
Women in Uniontown earn 87.3 cents for every dollar earned by a man.
What is Inequality or Gini Index in Uniontown?
Inequality or Gini Index in Uniontown is 0.51.
How Large is the Labor Force in Uniontown?
There are 4,442 People in the Labor Forcein in Uniontown.
What is the Percentage of People in the Labor Force in Uniontown?
55.1% of People are in the Labor Force in Uniontown.
What is the Unemployment Rate in Uniontown?
Unemployment Rate in Uniontown is 12.7%.