Manchester borough, PA
Manchester borough Overview
2,802
TOTAL POPULATION
1,422
MALE POPULATION
1,380
FEMALE POPULATION
103.04
MALES / 100 FEMALES
97.05
FEMALES / 100 MALES
40.2
MEDIAN AGE
2.9
AVG FAMILY SIZE
2.2
AVG HOUSEHOLD SIZE
$34,649
PER CAPITA INCOME
$93,354
AVG FAMILY INCOME
$71,202
AVG HOUSEHOLD INCOME
60.4%
WAGE / INCOME GAP [ % ]
39.6¢/ $1
WAGE / INCOME GAP [ $ ]
0.40
INEQUALITY / GINI INDEX
1,478
LABOR FORCE [ PEOPLE ]
65.2%
PERCENT IN LABOR FORCE
1.8%
UNEMPLOYMENT RATE
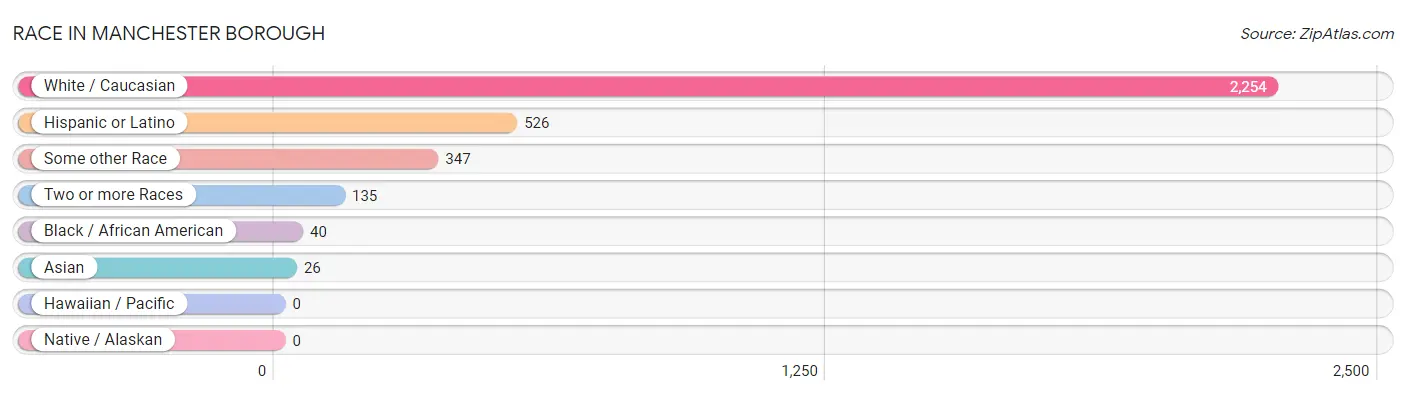
Race in Manchester borough
The most populous races in Manchester borough are White / Caucasian (2,254 | 80.4%), Hispanic or Latino (526 | 18.8%), and Some other Race (347 | 12.4%).
| Race | # Population | % Population |
| Asian | 26 | 0.9% |
| Black / African American | 40 | 1.4% |
| Hawaiian / Pacific | 0 | 0.0% |
| Hispanic or Latino | 526 | 18.8% |
| Native / Alaskan | 0 | 0.0% |
| White / Caucasian | 2,254 | 80.4% |
| Two or more Races | 135 | 4.8% |
| Some other Race | 347 | 12.4% |
| Total | 2,802 | 100.0% |
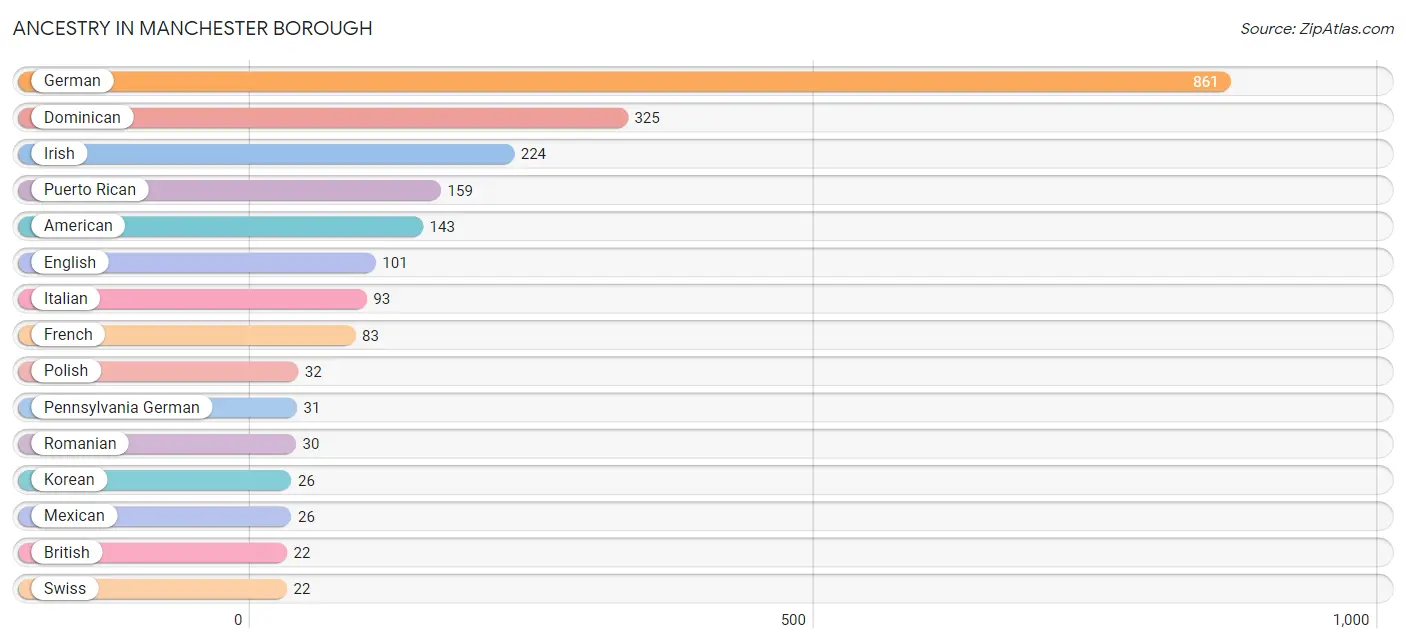
Ancestry in Manchester borough
The most populous ancestries reported in Manchester borough are German (861 | 30.7%), Dominican (325 | 11.6%), Irish (224 | 8.0%), Puerto Rican (159 | 5.7%), and American (143 | 5.1%), together accounting for 61.1% of all Manchester borough residents.
| Ancestry | # Population | % Population |
| American | 143 | 5.1% |
| Belgian | 14 | 0.5% |
| British | 22 | 0.8% |
| Canadian | 8 | 0.3% |
| Dominican | 325 | 11.6% |
| Dutch | 15 | 0.5% |
| English | 101 | 3.6% |
| French | 83 | 3.0% |
| German | 861 | 30.7% |
| Irish | 224 | 8.0% |
| Italian | 93 | 3.3% |
| Korean | 26 | 0.9% |
| Mexican | 26 | 0.9% |
| Native Hawaiian | 12 | 0.4% |
| Pennsylvania German | 31 | 1.1% |
| Peruvian | 10 | 0.4% |
| Polish | 32 | 1.1% |
| Puerto Rican | 159 | 5.7% |
| Romanian | 30 | 1.1% |
| Scotch-Irish | 17 | 0.6% |
| Scottish | 13 | 0.5% |
| Slovak | 6 | 0.2% |
| South American | 10 | 0.4% |
| Spanish | 6 | 0.2% |
| Swiss | 22 | 0.8% |
| Welsh | 7 | 0.3% | View All 26 Rows |
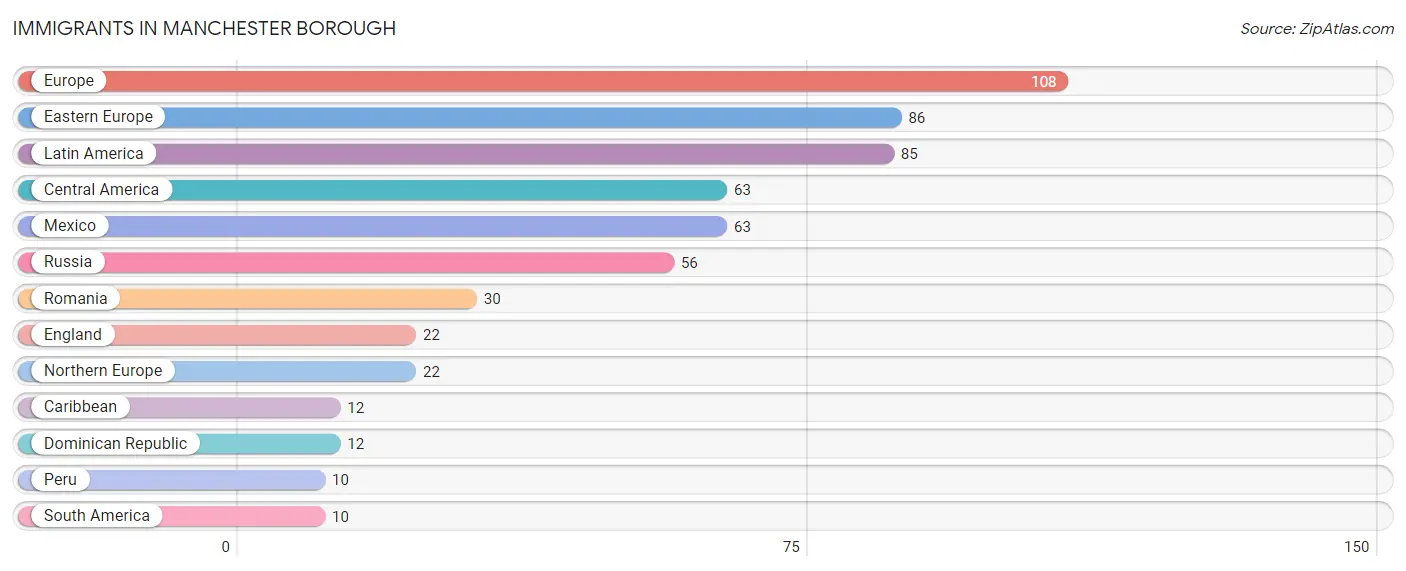
Immigrants in Manchester borough
The most numerous immigrant groups reported in Manchester borough came from Europe (108 | 3.8%), Eastern Europe (86 | 3.1%), Latin America (85 | 3.0%), Central America (63 | 2.2%), and Mexico (63 | 2.2%), together accounting for 14.4% of all Manchester borough residents.
| Immigration Origin | # Population | % Population |
| Caribbean | 12 | 0.4% |
| Central America | 63 | 2.2% |
| Dominican Republic | 12 | 0.4% |
| Eastern Europe | 86 | 3.1% |
| England | 22 | 0.8% |
| Europe | 108 | 3.8% |
| Latin America | 85 | 3.0% |
| Mexico | 63 | 2.2% |
| Northern Europe | 22 | 0.8% |
| Peru | 10 | 0.4% |
| Romania | 30 | 1.1% |
| Russia | 56 | 2.0% |
| South America | 10 | 0.4% | View All 13 Rows |
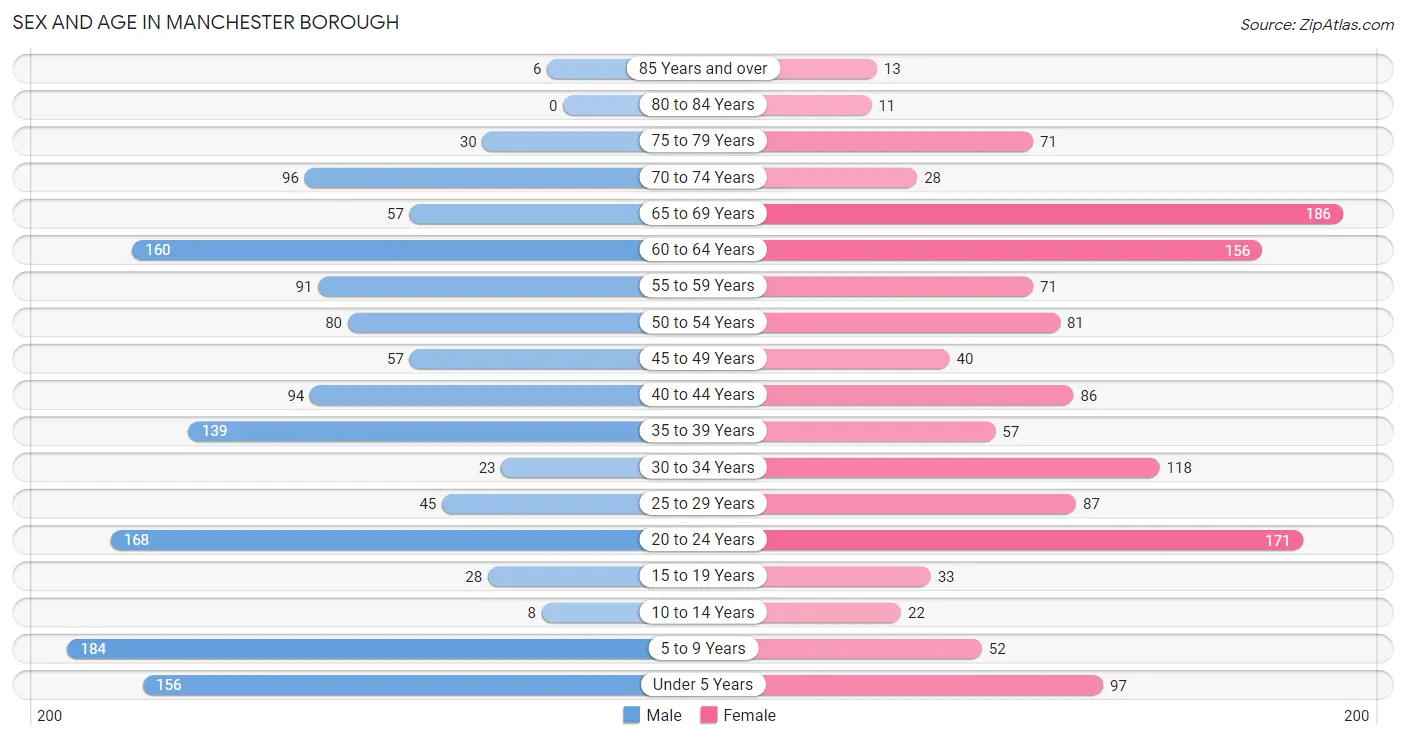
Sex and Age in Manchester borough
Sex and Age in Manchester borough
The most populous age groups in Manchester borough are 5 to 9 Years (184 | 12.9%) for men and 65 to 69 Years (186 | 13.5%) for women.
| Age Bracket | Male | Female |
| Under 5 Years | 156 (11.0%) | 97 (7.0%) |
| 5 to 9 Years | 184 (12.9%) | 52 (3.8%) |
| 10 to 14 Years | 8 (0.6%) | 22 (1.6%) |
| 15 to 19 Years | 28 (2.0%) | 33 (2.4%) |
| 20 to 24 Years | 168 (11.8%) | 171 (12.4%) |
| 25 to 29 Years | 45 (3.2%) | 87 (6.3%) |
| 30 to 34 Years | 23 (1.6%) | 118 (8.6%) |
| 35 to 39 Years | 139 (9.8%) | 57 (4.1%) |
| 40 to 44 Years | 94 (6.6%) | 86 (6.2%) |
| 45 to 49 Years | 57 (4.0%) | 40 (2.9%) |
| 50 to 54 Years | 80 (5.6%) | 81 (5.9%) |
| 55 to 59 Years | 91 (6.4%) | 71 (5.1%) |
| 60 to 64 Years | 160 (11.3%) | 156 (11.3%) |
| 65 to 69 Years | 57 (4.0%) | 186 (13.5%) |
| 70 to 74 Years | 96 (6.8%) | 28 (2.0%) |
| 75 to 79 Years | 30 (2.1%) | 71 (5.1%) |
| 80 to 84 Years | 0 (0.0%) | 11 (0.8%) |
| 85 Years and over | 6 (0.4%) | 13 (0.9%) |
| Total | 1,422 (100.0%) | 1,380 (100.0%) |
Families and Households in Manchester borough
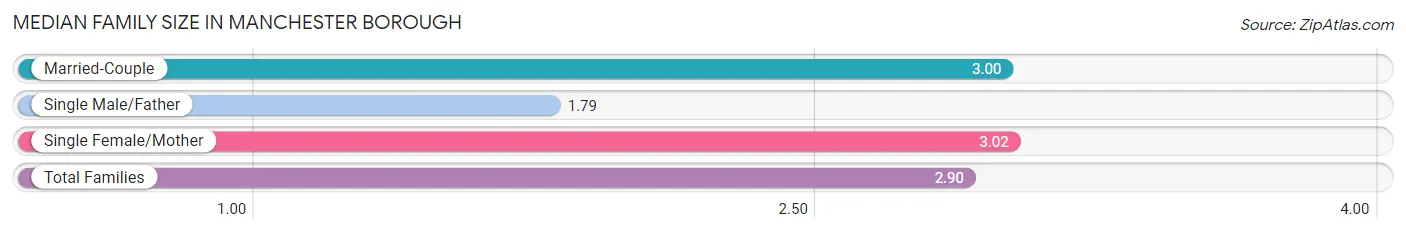
Median Family Size in Manchester borough
The median family size in Manchester borough is 2.90 persons per family, with single female/mother families (58 | 8.3%) accounting for the largest median family size of 3.02 persons per family. On the other hand, single male/father families (61 | 8.7%) represent the smallest median family size with 1.79 persons per family.
| Family Type | # Families | Family Size |
| Married-Couple | 581 (83.0%) | 3.00 |
| Single Male/Father | 61 (8.7%) | 1.79 |
| Single Female/Mother | 58 (8.3%) | 3.02 |
| Total Families | 700 (100.0%) | 2.90 |
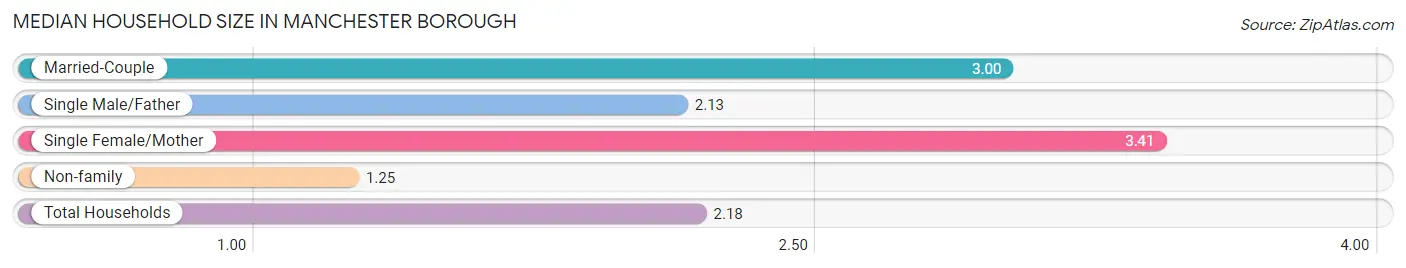
Median Household Size in Manchester borough
The median household size in Manchester borough is 2.18 persons per household, with single female/mother households (58 | 4.5%) accounting for the largest median household size of 3.41 persons per household. non-family households (587 | 45.6%) represent the smallest median household size with 1.25 persons per household.
| Household Type | # Households | Household Size |
| Married-Couple | 581 (45.1%) | 3.00 |
| Single Male/Father | 61 (4.7%) | 2.13 |
| Single Female/Mother | 58 (4.5%) | 3.41 |
| Non-family | 587 (45.6%) | 1.25 |
| Total Households | 1,287 (100.0%) | 2.18 |
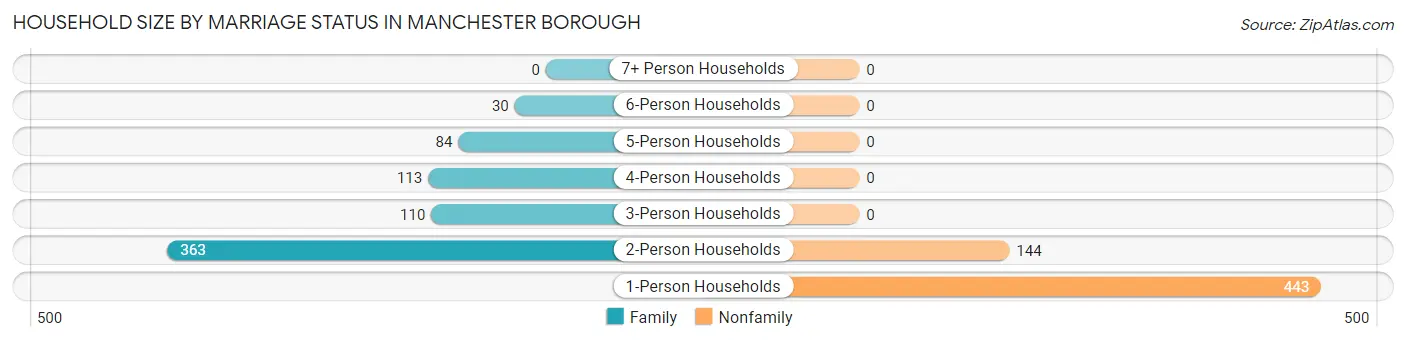
Household Size by Marriage Status in Manchester borough
Out of a total of 1,287 households in Manchester borough, 700 (54.4%) are family households, while 587 (45.6%) are nonfamily households. The most numerous type of family households are 2-person households, comprising 363, and the most common type of nonfamily households are 1-person households, comprising 443.
| Household Size | Family Households | Nonfamily Households |
| 1-Person Households | - | 443 (34.4%) |
| 2-Person Households | 363 (28.2%) | 144 (11.2%) |
| 3-Person Households | 110 (8.6%) | 0 (0.0%) |
| 4-Person Households | 113 (8.8%) | 0 (0.0%) |
| 5-Person Households | 84 (6.5%) | 0 (0.0%) |
| 6-Person Households | 30 (2.3%) | 0 (0.0%) |
| 7+ Person Households | 0 (0.0%) | 0 (0.0%) |
| Total | 700 (54.4%) | 587 (45.6%) |
Female Fertility in Manchester borough
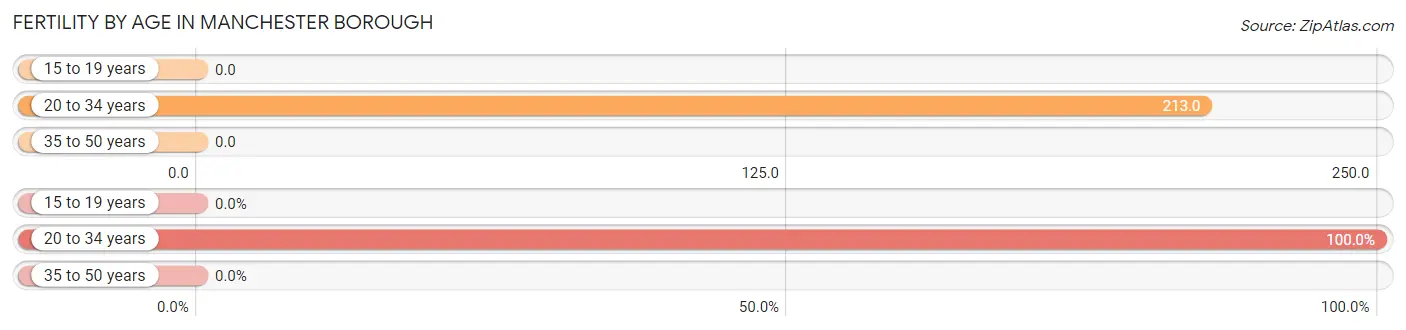
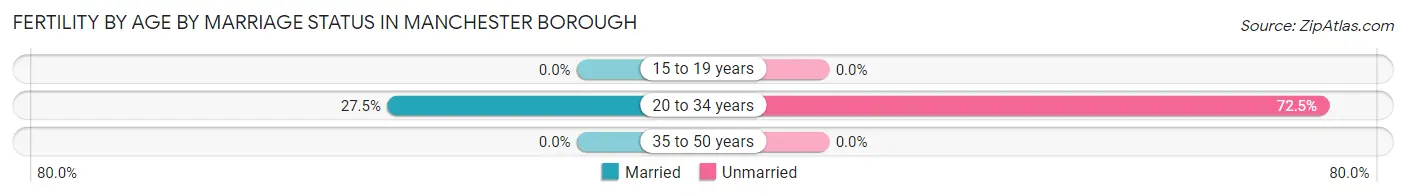
Fertility by Age in Manchester borough
Average fertility rate in Manchester borough is 133.0 births per 1,000 women. Women in the age bracket of 20 to 34 years have the highest fertility rate with 213.0 births per 1,000 women. Women in the age bracket of 20 to 34 years acount for 100.0% of all women with births.
| Age Bracket | Women with Births | Births / 1,000 Women |
| 15 to 19 years | 0 (0.0%) | 0.0 |
| 20 to 34 years | 80 (100.0%) | 213.0 |
| 35 to 50 years | 0 (0.0%) | 0.0 |
| Total | 80 (100.0%) | 133.0 |
Fertility by Age by Marriage Status in Manchester borough
27.5% of women with births (80) in Manchester borough are married. The highest percentage of unmarried women with births falls into 20 to 34 years age bracket with 72.5% of them unmarried at the time of birth, while the lowest percentage of unmarried women with births belong to 20 to 34 years age bracket with 72.5% of them unmarried.
| Age Bracket | Married | Unmarried |
| 15 to 19 years | 0 (0.0%) | 0 (0.0%) |
| 20 to 34 years | 22 (27.5%) | 58 (72.5%) |
| 35 to 50 years | 0 (0.0%) | 0 (0.0%) |
| Total | 22 (27.5%) | 58 (72.5%) |
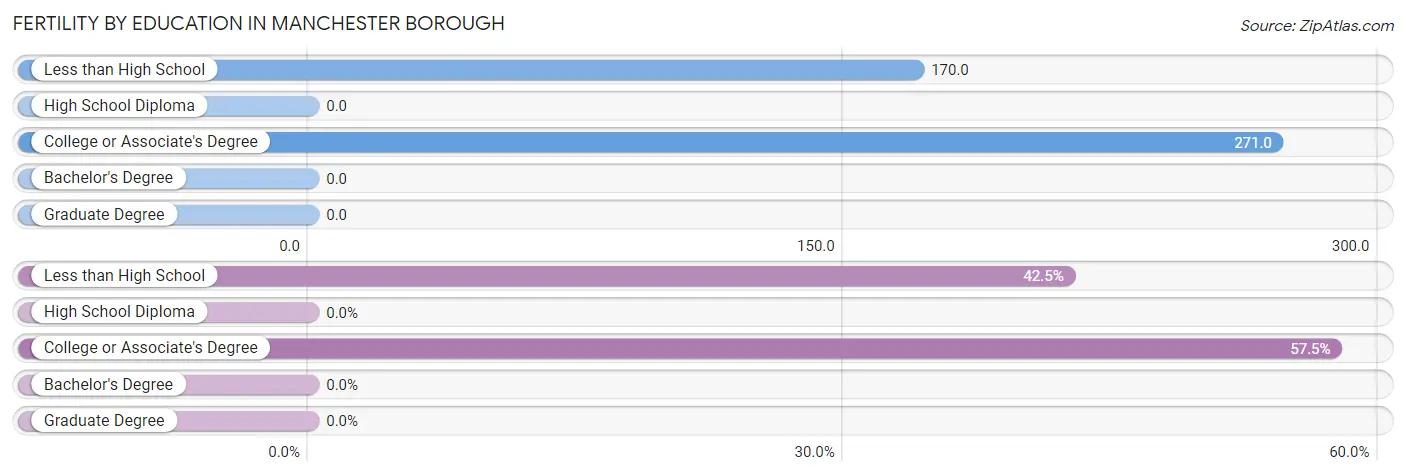
Fertility by Education in Manchester borough
| Educational Attainment | Women with Births | Births / 1,000 Women |
| Less than High School | 34 (42.5%) | 170.0 |
| High School Diploma | 0 (0.0%) | 0.0 |
| College or Associate's Degree | 46 (57.5%) | 271.0 |
| Bachelor's Degree | 0 (0.0%) | 0.0 |
| Graduate Degree | 0 (0.0%) | 0.0 |
| Total | 80 (100.0%) | 133.0 |
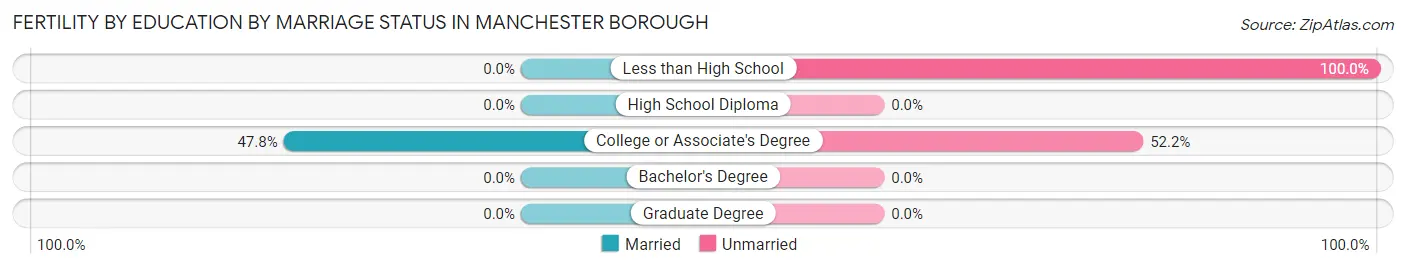
Fertility by Education by Marriage Status in Manchester borough
72.5% of women with births in Manchester borough are unmarried. Women with the educational attainment of college or associate's degree are most likely to be married with 47.8% of them married at childbirth, while women with the educational attainment of less than high school are least likely to be married with 100.0% of them unmarried at childbirth.
| Educational Attainment | Married | Unmarried |
| Less than High School | 0 (0.0%) | 34 (100.0%) |
| High School Diploma | 0 (0.0%) | 0 (0.0%) |
| College or Associate's Degree | 22 (47.8%) | 24 (52.2%) |
| Bachelor's Degree | 0 (0.0%) | 0 (0.0%) |
| Graduate Degree | 0 (0.0%) | 0 (0.0%) |
| Total | 22 (27.5%) | 58 (72.5%) |
Income in Manchester borough
Income Overview in Manchester borough
Per Capita Income in Manchester borough is $34,649, while median incomes of families and households are $93,354 and $71,202 respectively.
| Characteristic | Number | Measure |
| Per Capita Income | 2,802 | $34,649 |
| Median Family Income | 700 | $93,354 |
| Mean Family Income | 700 | $92,513 |
| Median Household Income | 1,287 | $71,202 |
| Mean Household Income | 1,287 | $75,212 |
| Income Deficit | 700 | $0 |
| Wage / Income Gap (%) | 2,802 | 60.42% |
| Wage / Income Gap ($) | 2,802 | 39.58¢ per $1 |
| Gini / Inequality Index | 2,802 | 0.40 |
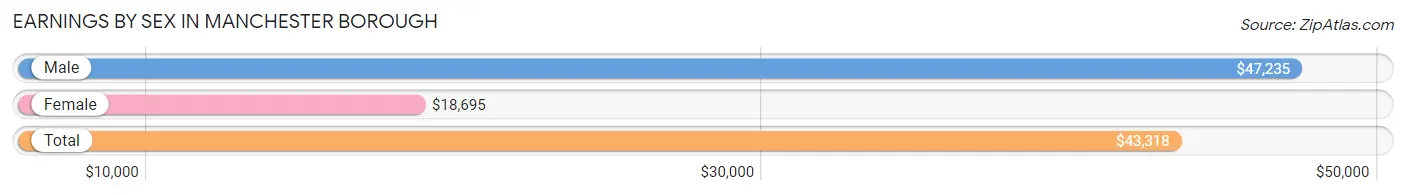
Earnings by Sex in Manchester borough
Average Earnings in Manchester borough are $43,318, $47,235 for men and $18,695 for women, a difference of 60.4%.
| Sex | Number | Average Earnings |
| Male | 842 (54.8%) | $47,235 |
| Female | 695 (45.2%) | $18,695 |
| Total | 1,537 (100.0%) | $43,318 |
Earnings by Sex by Income Bracket in Manchester borough
The most common earnings brackets in Manchester borough are $40,000 to $44,999 for men (212 | 25.2%) and $17,500 to $19,999 for women (114 | 16.4%).
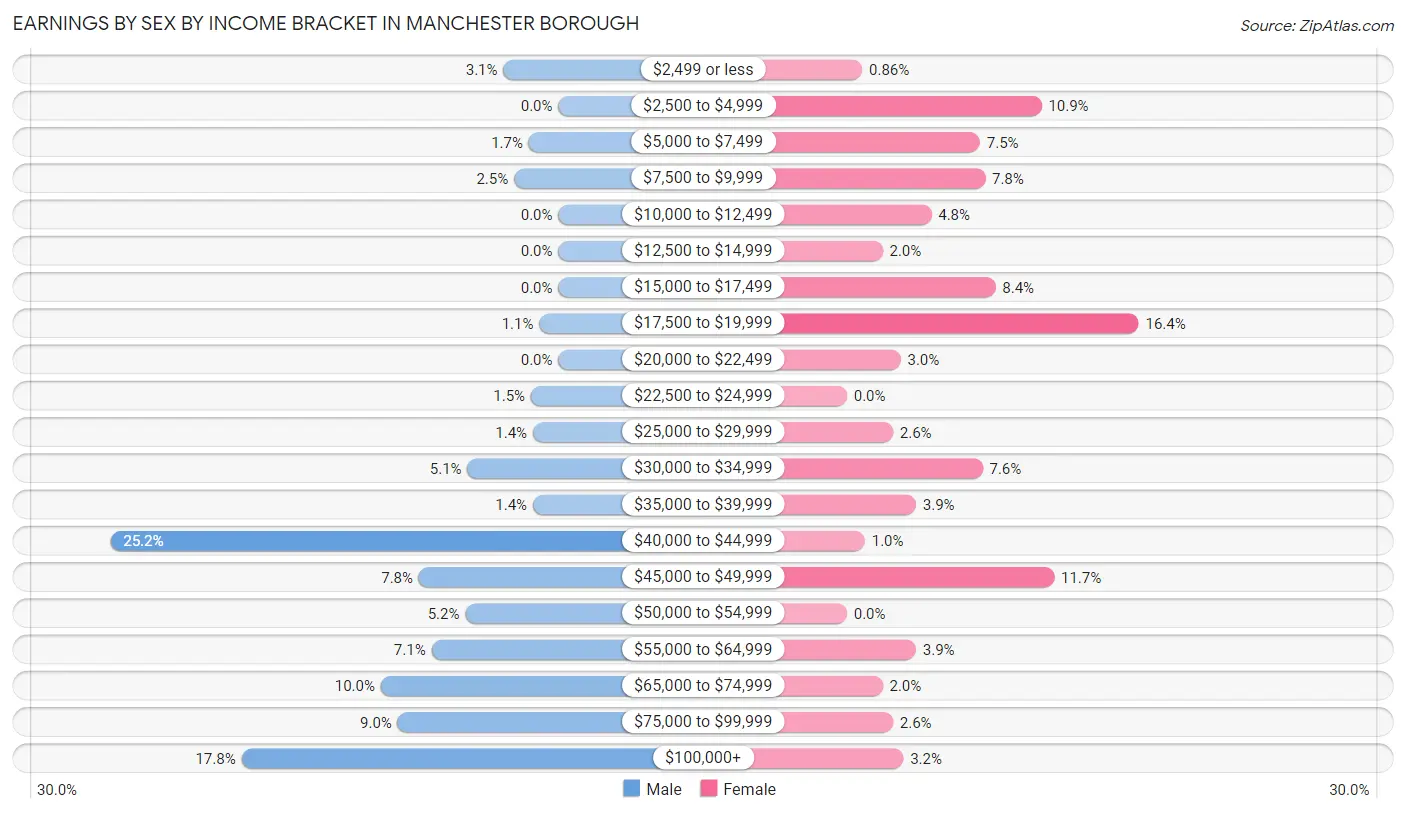
| Income | Male | Female |
| $2,499 or less | 26 (3.1%) | 6 (0.9%) |
| $2,500 to $4,999 | 0 (0.0%) | 76 (10.9%) |
| $5,000 to $7,499 | 14 (1.7%) | 52 (7.5%) |
| $7,500 to $9,999 | 21 (2.5%) | 54 (7.8%) |
| $10,000 to $12,499 | 0 (0.0%) | 33 (4.8%) |
| $12,500 to $14,999 | 0 (0.0%) | 14 (2.0%) |
| $15,000 to $17,499 | 0 (0.0%) | 58 (8.4%) |
| $17,500 to $19,999 | 9 (1.1%) | 114 (16.4%) |
| $20,000 to $22,499 | 0 (0.0%) | 21 (3.0%) |
| $22,500 to $24,999 | 13 (1.5%) | 0 (0.0%) |
| $25,000 to $29,999 | 12 (1.4%) | 18 (2.6%) |
| $30,000 to $34,999 | 43 (5.1%) | 53 (7.6%) |
| $35,000 to $39,999 | 12 (1.4%) | 27 (3.9%) |
| $40,000 to $44,999 | 212 (25.2%) | 7 (1.0%) |
| $45,000 to $49,999 | 66 (7.8%) | 81 (11.7%) |
| $50,000 to $54,999 | 44 (5.2%) | 0 (0.0%) |
| $55,000 to $64,999 | 60 (7.1%) | 27 (3.9%) |
| $65,000 to $74,999 | 84 (10.0%) | 14 (2.0%) |
| $75,000 to $99,999 | 76 (9.0%) | 18 (2.6%) |
| $100,000+ | 150 (17.8%) | 22 (3.2%) |
| Total | 842 (100.0%) | 695 (100.0%) |
Earnings by Sex by Educational Attainment in Manchester borough
Average earnings in Manchester borough are $53,889 for men and $18,761 for women, a difference of 65.2%. Men with an educational attainment of high school diploma enjoy the highest average annual earnings of $58,875, while those with college or associate's degree education earn the least with $53,315. Women with an educational attainment of college or associate's degree earn the most with the average annual earnings of $48,415, while those with high school diploma education have the smallest earnings of $18,385.
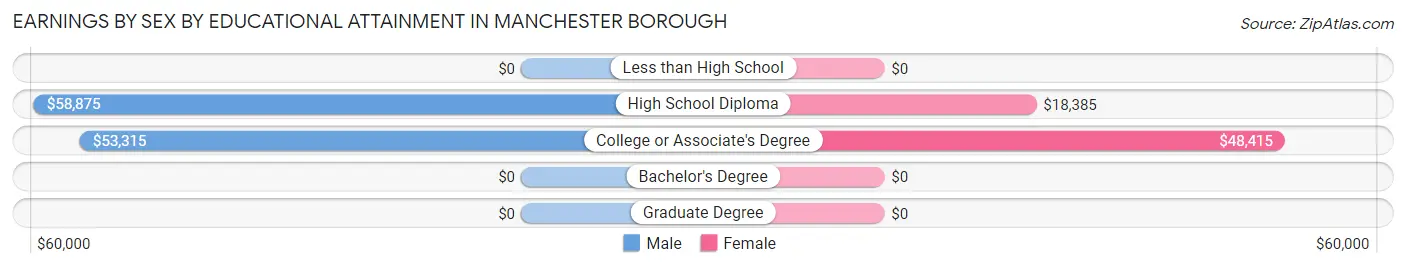
| Educational Attainment | Male Income | Female Income |
| Less than High School | - | - |
| High School Diploma | $58,875 | $18,385 |
| College or Associate's Degree | $53,315 | $48,415 |
| Bachelor's Degree | - | - |
| Graduate Degree | - | - |
| Total | $53,889 | $18,761 |
Family Income in Manchester borough
Family Income Brackets in Manchester borough
According to the Manchester borough family income data, there are 196 families falling into the $75,000 to $99,999 income range, which is the most common income bracket and makes up 28.0% of all families.
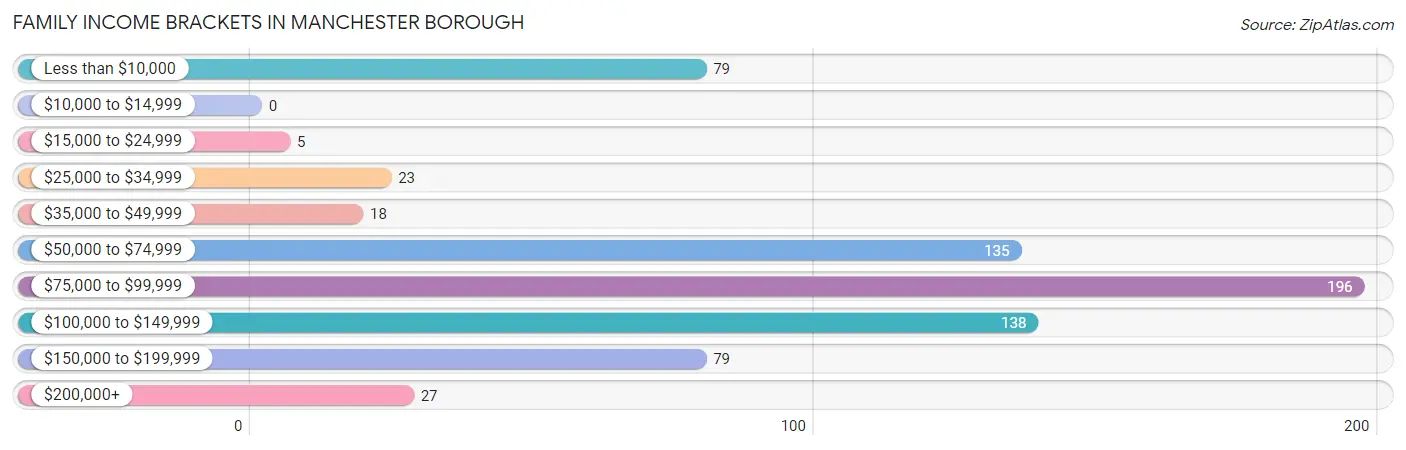
| Income Bracket | # Families | % Families |
| Less than $10,000 | 79 | 11.3% |
| $10,000 to $14,999 | 0 | 0.0% |
| $15,000 to $24,999 | 5 | 0.7% |
| $25,000 to $34,999 | 23 | 3.3% |
| $35,000 to $49,999 | 18 | 2.6% |
| $50,000 to $74,999 | 135 | 19.3% |
| $75,000 to $99,999 | 196 | 28.0% |
| $100,000 to $149,999 | 138 | 19.7% |
| $150,000 to $199,999 | 79 | 11.3% |
| $200,000+ | 27 | 3.9% |
Family Income by Famaliy Size in Manchester borough
6-person families (30 | 4.3%) account for the highest median family income in Manchester borough with $166,406 per family, while 2-person families (384 | 54.9%) have the highest median income of $43,618 per family member.
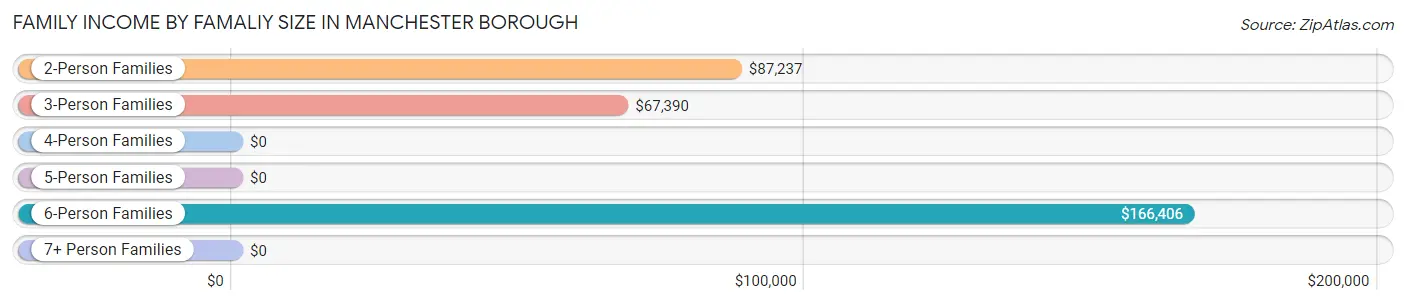
| Income Bracket | # Families | Median Income |
| 2-Person Families | 384 (54.9%) | $87,237 |
| 3-Person Families | 113 (16.1%) | $67,390 |
| 4-Person Families | 89 (12.7%) | $0 |
| 5-Person Families | 84 (12.0%) | $0 |
| 6-Person Families | 30 (4.3%) | $166,406 |
| 7+ Person Families | 0 (0.0%) | $0 |
| Total | 700 (100.0%) | $93,354 |
Family Income by Number of Earners in Manchester borough
The median family income in Manchester borough is $93,354, with families comprising 3+ earners (140) having the highest median family income of $100,372, while families with no earners (156) have the lowest median family income of $34,130, accounting for 20.0% and 22.3% of families, respectively.
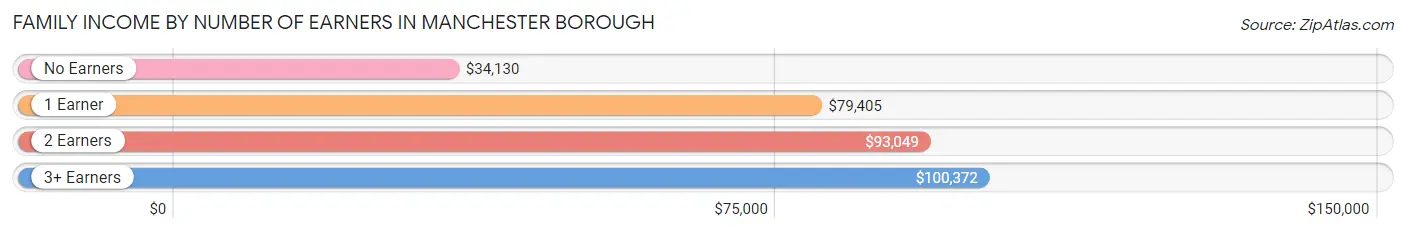
| Number of Earners | # Families | Median Income |
| No Earners | 156 (22.3%) | $34,130 |
| 1 Earner | 198 (28.3%) | $79,405 |
| 2 Earners | 206 (29.4%) | $93,049 |
| 3+ Earners | 140 (20.0%) | $100,372 |
| Total | 700 (100.0%) | $93,354 |
Household Income in Manchester borough
Household Income Brackets in Manchester borough
With 299 households falling in the category, the $75,000 to $99,999 income range is the most frequent in Manchester borough, accounting for 23.2% of all households. In contrast, only 27 households (2.1%) fall into the $200,000+ income bracket, making it the least populous group.
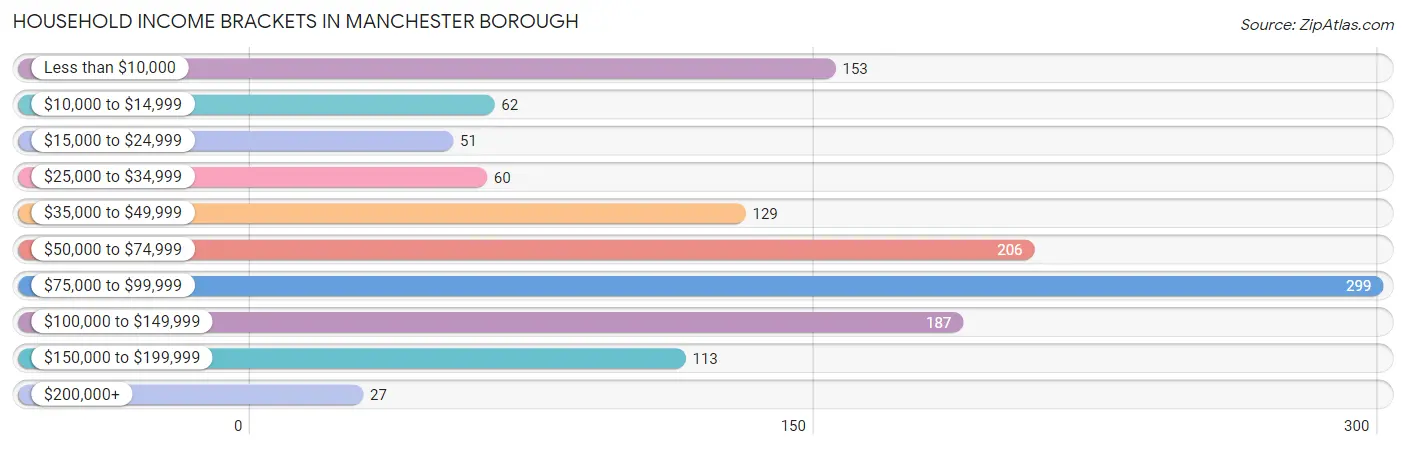
| Income Bracket | # Households | % Households |
| Less than $10,000 | 153 | 11.9% |
| $10,000 to $14,999 | 62 | 4.8% |
| $15,000 to $24,999 | 51 | 4.0% |
| $25,000 to $34,999 | 60 | 4.7% |
| $35,000 to $49,999 | 129 | 10.0% |
| $50,000 to $74,999 | 206 | 16.0% |
| $75,000 to $99,999 | 299 | 23.2% |
| $100,000 to $149,999 | 187 | 14.5% |
| $150,000 to $199,999 | 113 | 8.8% |
| $200,000+ | 27 | 2.1% |
Household Income by Householder Age in Manchester borough
The median household income in Manchester borough is $71,202, with the highest median household income of $91,250 found in the 45 to 64 years age bracket for the primary householder. A total of 433 households (33.6%) fall into this category. Meanwhile, the 65+ years age bracket for the primary householder has the lowest median household income of $41,420, with 333 households (25.9%) in this group.
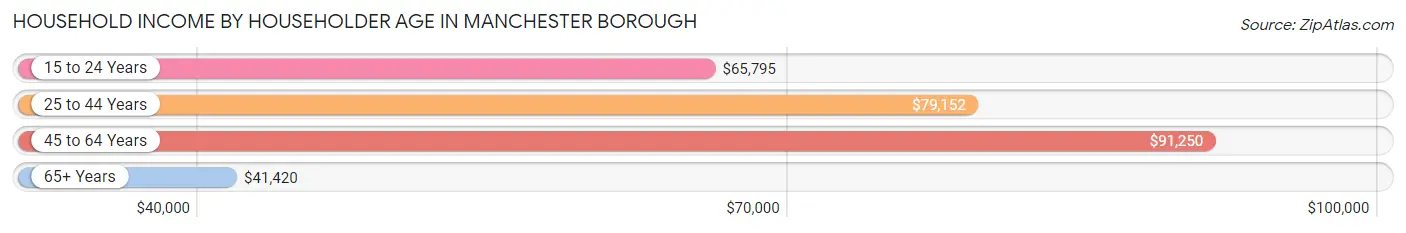
| Income Bracket | # Households | Median Income |
| 15 to 24 Years | 122 (9.5%) | $65,795 |
| 25 to 44 Years | 399 (31.0%) | $79,152 |
| 45 to 64 Years | 433 (33.6%) | $91,250 |
| 65+ Years | 333 (25.9%) | $41,420 |
| Total | 1,287 (100.0%) | $71,202 |
Poverty in Manchester borough
Income Below Poverty by Sex and Age in Manchester borough
With 6.8% poverty level for males and 23.5% for females among the residents of Manchester borough, under 5 year old males and under 5 year old females are the most vulnerable to poverty, with 50 males (32.1%) and 67 females (69.1%) in their respective age groups living below the poverty level.
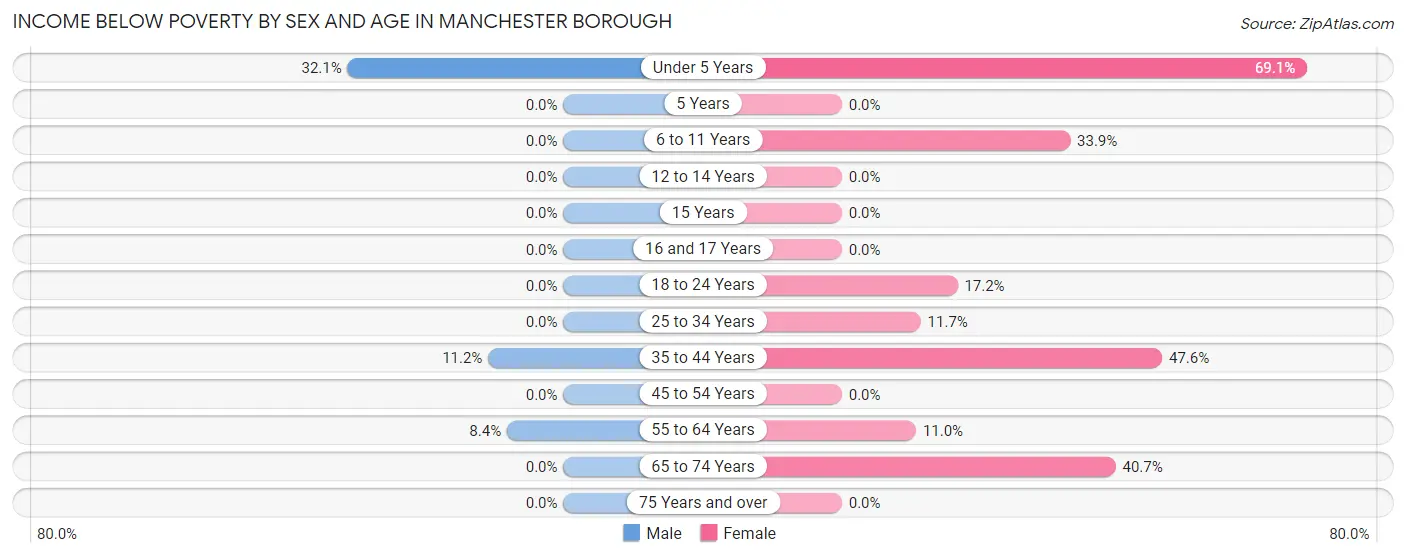
| Age Bracket | Male | Female |
| Under 5 Years | 50 (32.1%) | 67 (69.1%) |
| 5 Years | 0 (0.0%) | 0 (0.0%) |
| 6 to 11 Years | 0 (0.0%) | 20 (33.9%) |
| 12 to 14 Years | 0 (0.0%) | 0 (0.0%) |
| 15 Years | 0 (0.0%) | 0 (0.0%) |
| 16 and 17 Years | 0 (0.0%) | 0 (0.0%) |
| 18 to 24 Years | 0 (0.0%) | 34 (17.2%) |
| 25 to 34 Years | 0 (0.0%) | 24 (11.7%) |
| 35 to 44 Years | 26 (11.2%) | 68 (47.5%) |
| 45 to 54 Years | 0 (0.0%) | 0 (0.0%) |
| 55 to 64 Years | 21 (8.4%) | 25 (11.0%) |
| 65 to 74 Years | 0 (0.0%) | 87 (40.6%) |
| 75 Years and over | 0 (0.0%) | 0 (0.0%) |
| Total | 97 (6.8%) | 325 (23.5%) |
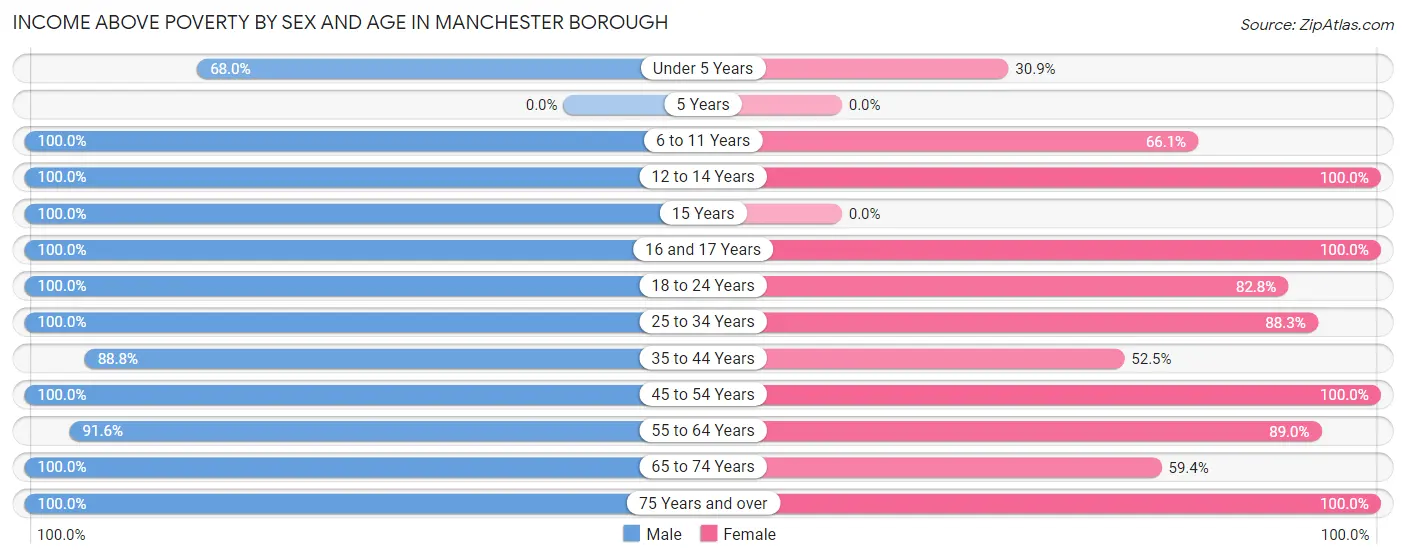
Income Above Poverty by Sex and Age in Manchester borough
According to the poverty statistics in Manchester borough, males aged 6 to 11 years and females aged 12 to 14 years are the age groups that are most secure financially, with 100.0% of males and 100.0% of females in these age groups living above the poverty line.
| Age Bracket | Male | Female |
| Under 5 Years | 106 (67.9%) | 30 (30.9%) |
| 5 Years | 0 (0.0%) | 0 (0.0%) |
| 6 to 11 Years | 184 (100.0%) | 39 (66.1%) |
| 12 to 14 Years | 8 (100.0%) | 15 (100.0%) |
| 15 Years | 16 (100.0%) | 0 (0.0%) |
| 16 and 17 Years | 12 (100.0%) | 6 (100.0%) |
| 18 to 24 Years | 168 (100.0%) | 164 (82.8%) |
| 25 to 34 Years | 68 (100.0%) | 181 (88.3%) |
| 35 to 44 Years | 207 (88.8%) | 75 (52.4%) |
| 45 to 54 Years | 137 (100.0%) | 121 (100.0%) |
| 55 to 64 Years | 230 (91.6%) | 202 (89.0%) |
| 65 to 74 Years | 153 (100.0%) | 127 (59.4%) |
| 75 Years and over | 36 (100.0%) | 95 (100.0%) |
| Total | 1,325 (93.2%) | 1,055 (76.4%) |
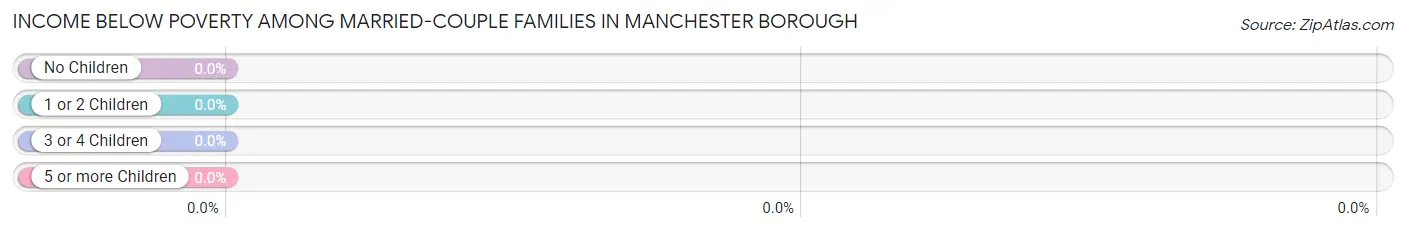
Income Below Poverty Among Married-Couple Families in Manchester borough
| Children | Above Poverty | Below Poverty |
| No Children | 382 (100.0%) | 0 (0.0%) |
| 1 or 2 Children | 154 (100.0%) | 0 (0.0%) |
| 3 or 4 Children | 45 (100.0%) | 0 (0.0%) |
| 5 or more Children | 0 (0.0%) | 0 (0.0%) |
| Total | 581 (100.0%) | 0 (0.0%) |
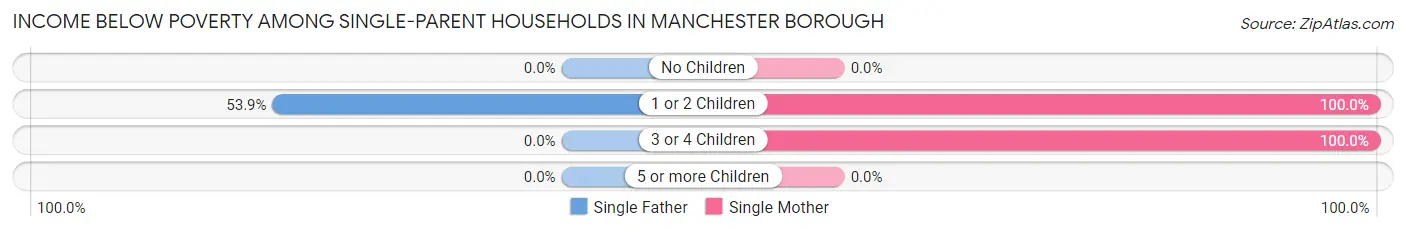
Income Below Poverty Among Single-Parent Households in Manchester borough
According to the poverty data in Manchester borough, 34.4% or 21 single-father households and 100.0% or 58 single-mother households are living below the poverty line. Among single-father households, those with 1 or 2 children have the highest poverty rate, with 21 households (53.8%) experiencing poverty. Likewise, among single-mother households, those with 1 or 2 children have the highest poverty rate, with 24 households (100.0%) falling below the poverty line.
| Children | Single Father | Single Mother |
| No Children | 0 (0.0%) | 0 (0.0%) |
| 1 or 2 Children | 21 (53.8%) | 24 (100.0%) |
| 3 or 4 Children | 0 (0.0%) | 34 (100.0%) |
| 5 or more Children | 0 (0.0%) | 0 (0.0%) |
| Total | 21 (34.4%) | 58 (100.0%) |
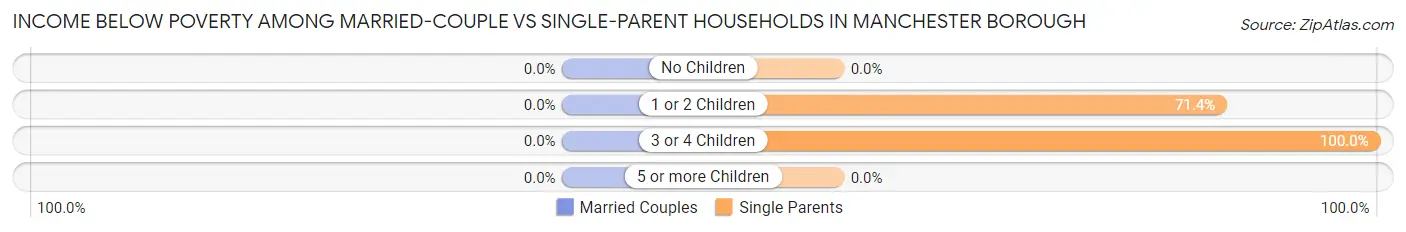
Income Below Poverty Among Married-Couple vs Single-Parent Households in Manchester borough
| Children | Married-Couple Families | Single-Parent Households |
| No Children | 0 (0.0%) | 0 (0.0%) |
| 1 or 2 Children | 0 (0.0%) | 45 (71.4%) |
| 3 or 4 Children | 0 (0.0%) | 34 (100.0%) |
| 5 or more Children | 0 (0.0%) | 0 (0.0%) |
| Total | 0 (0.0%) | 79 (66.4%) |
Employment Characteristics in Manchester borough
Employment by Class of Employer in Manchester borough
Among the 1,406 employed individuals in Manchester borough, private company employees (1,103 | 78.4%), not-for-profit organizations (136 | 9.7%), and local government employees (100 | 7.1%) make up the most common classes of employment.
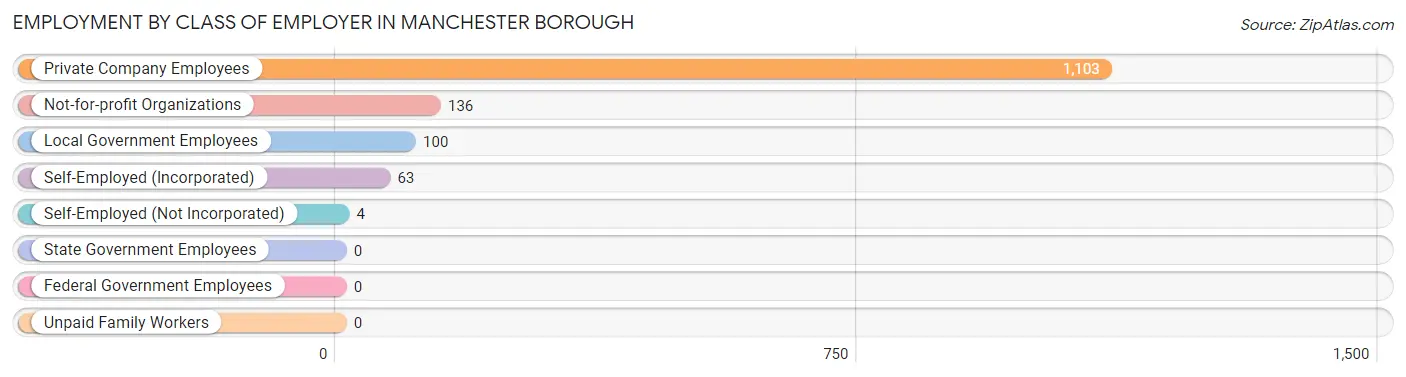
| Employer Class | # Employees | % Employees |
| Private Company Employees | 1,103 | 78.4% |
| Self-Employed (Incorporated) | 63 | 4.5% |
| Self-Employed (Not Incorporated) | 4 | 0.3% |
| Not-for-profit Organizations | 136 | 9.7% |
| Local Government Employees | 100 | 7.1% |
| State Government Employees | 0 | 0.0% |
| Federal Government Employees | 0 | 0.0% |
| Unpaid Family Workers | 0 | 0.0% |
| Total | 1,406 | 100.0% |
Employment Status by Age in Manchester borough
According to the labor force statistics for Manchester borough, out of the total population over 16 years of age (2,267), 65.2% or 1,478 individuals are in the labor force, with 1.8% or 27 of them unemployed. The age group with the highest labor force participation rate is 45 to 54 years, with 100.0% or 258 individuals in the labor force. Within the labor force, the 35 to 44 years age range has the highest percentage of unemployed individuals, with 8.4% or 26 of them being unemployed.
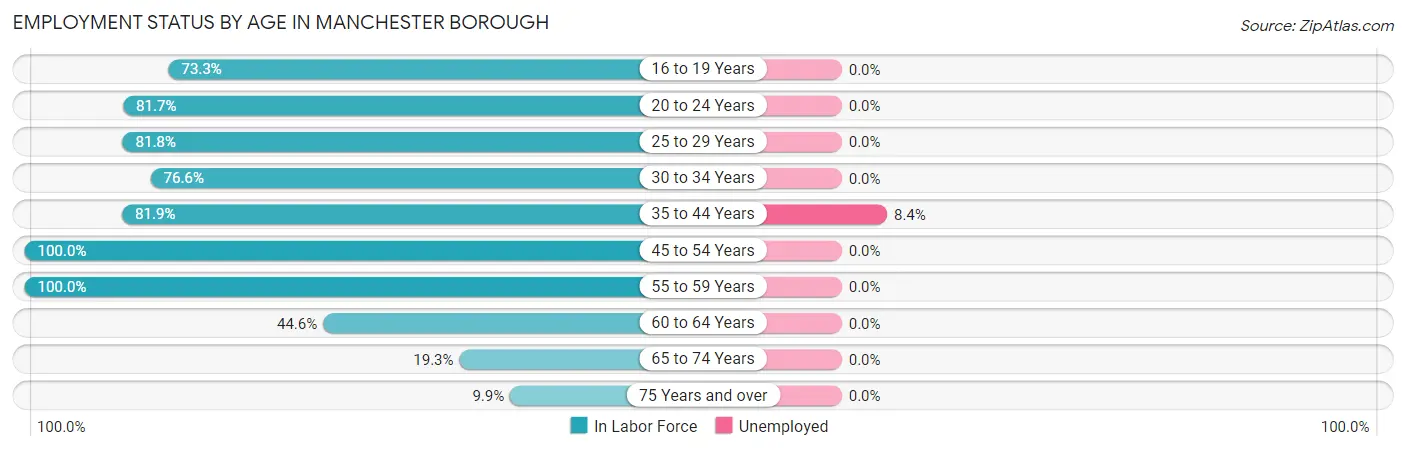
| Age Bracket | In Labor Force | Unemployed |
| 16 to 19 Years | 33 (73.3%) | 0 (0.0%) |
| 20 to 24 Years | 277 (81.7%) | 0 (0.0%) |
| 25 to 29 Years | 108 (81.8%) | 0 (0.0%) |
| 30 to 34 Years | 108 (76.6%) | 0 (0.0%) |
| 35 to 44 Years | 308 (81.9%) | 26 (8.4%) |
| 45 to 54 Years | 258 (100.0%) | 0 (0.0%) |
| 55 to 59 Years | 162 (100.0%) | 0 (0.0%) |
| 60 to 64 Years | 141 (44.6%) | 0 (0.0%) |
| 65 to 74 Years | 71 (19.3%) | 0 (0.0%) |
| 75 Years and over | 13 (9.9%) | 0 (0.0%) |
| Total | 1,478 (65.2%) | 27 (1.8%) |
Employment Status by Educational Attainment in Manchester borough
According to labor force statistics for Manchester borough, 78.3% of individuals (1,084) out of the total population between 25 and 64 years of age (1,385) are in the labor force, with 2.4% or 26 of them being unemployed. The group with the highest labor force participation rate are those with the educational attainment of high school diploma, with 86.3% or 516 individuals in the labor force. Within the labor force, individuals with high school diploma education have the highest percentage of unemployment, with 5.0% or 26 of them being unemployed.
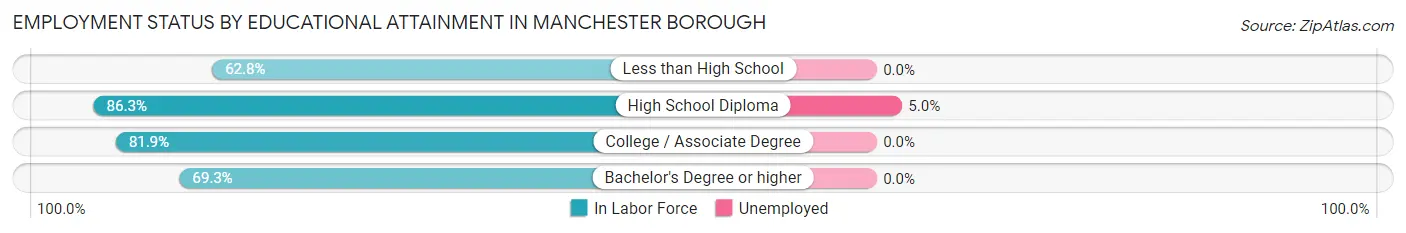
| Educational Attainment | In Labor Force | Unemployed |
| Less than High School | 174 (62.8%) | 0 (0.0%) |
| High School Diploma | 516 (86.3%) | 30 (5.0%) |
| College / Associate Degree | 271 (81.9%) | 0 (0.0%) |
| Bachelor's Degree or higher | 124 (69.3%) | 0 (0.0%) |
| Total | 1,084 (78.3%) | 33 (2.4%) |
Employment Occupations by Sex in Manchester borough
Management, Business, Science and Arts Occupations
The most common Management, Business, Science and Arts occupations in Manchester borough are Management (168 | 11.6%), Community & Social Service (75 | 5.2%), Computers, Engineering & Science (68 | 4.7%), Computers & Mathematics (68 | 4.7%), and Education Instruction & Library (50 | 3.4%).
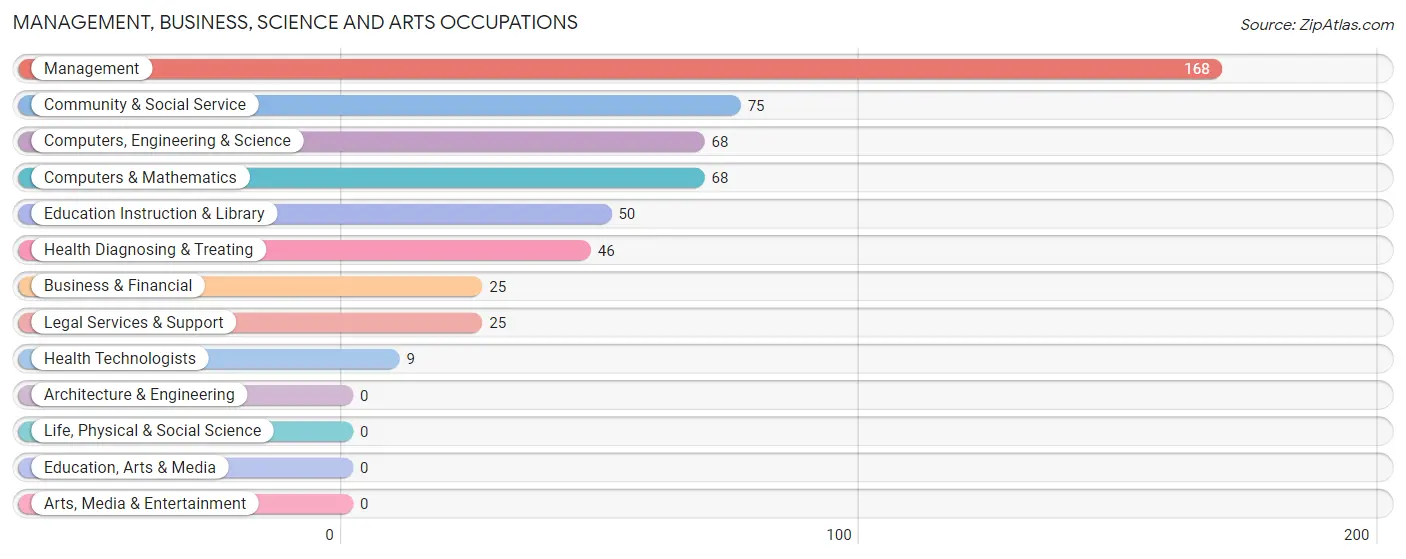
Management, Business, Science and Arts Occupations by Sex
Within the Management, Business, Science and Arts occupations in Manchester borough, the most male-oriented occupations are Health Technologists (100.0%), Computers, Engineering & Science (88.2%), and Computers & Mathematics (88.2%), while the most female-oriented occupations are Business & Financial (100.0%), Legal Services & Support (100.0%), and Health Diagnosing & Treating (80.4%).
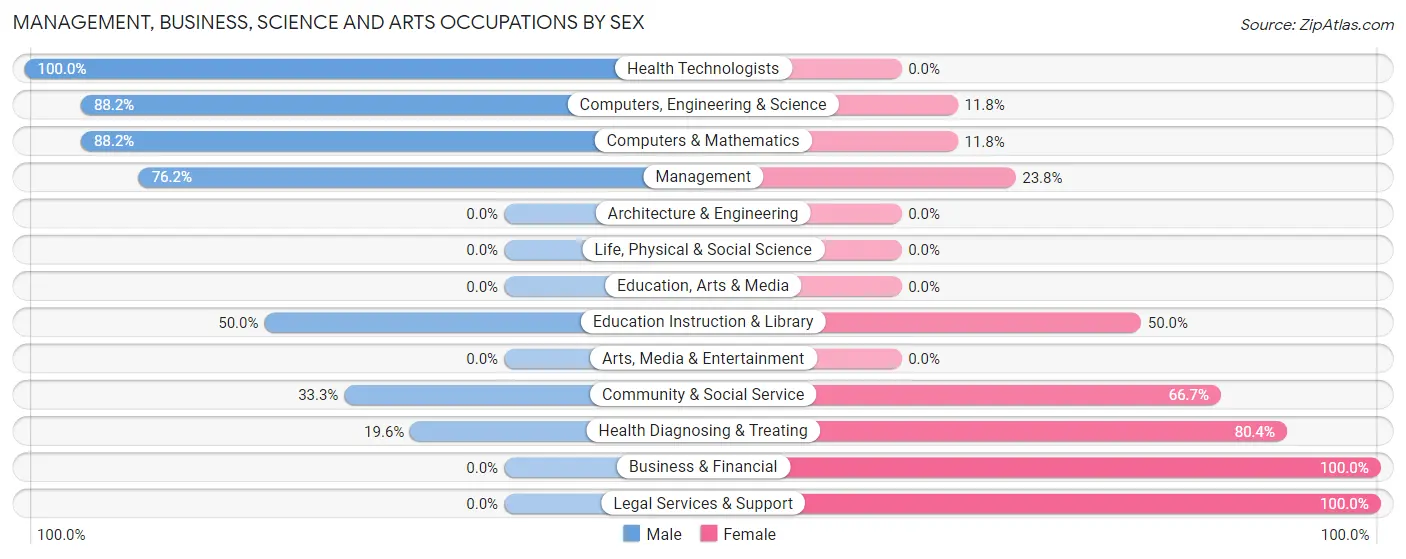
| Occupation | Male | Female |
| Management | 128 (76.2%) | 40 (23.8%) |
| Business & Financial | 0 (0.0%) | 25 (100.0%) |
| Computers, Engineering & Science | 60 (88.2%) | 8 (11.8%) |
| Computers & Mathematics | 60 (88.2%) | 8 (11.8%) |
| Architecture & Engineering | 0 (0.0%) | 0 (0.0%) |
| Life, Physical & Social Science | 0 (0.0%) | 0 (0.0%) |
| Community & Social Service | 25 (33.3%) | 50 (66.7%) |
| Education, Arts & Media | 0 (0.0%) | 0 (0.0%) |
| Legal Services & Support | 0 (0.0%) | 25 (100.0%) |
| Education Instruction & Library | 25 (50.0%) | 25 (50.0%) |
| Arts, Media & Entertainment | 0 (0.0%) | 0 (0.0%) |
| Health Diagnosing & Treating | 9 (19.6%) | 37 (80.4%) |
| Health Technologists | 9 (100.0%) | 0 (0.0%) |
| Total (Category) | 222 (58.1%) | 160 (41.9%) |
| Total (Overall) | 802 (55.2%) | 651 (44.8%) |
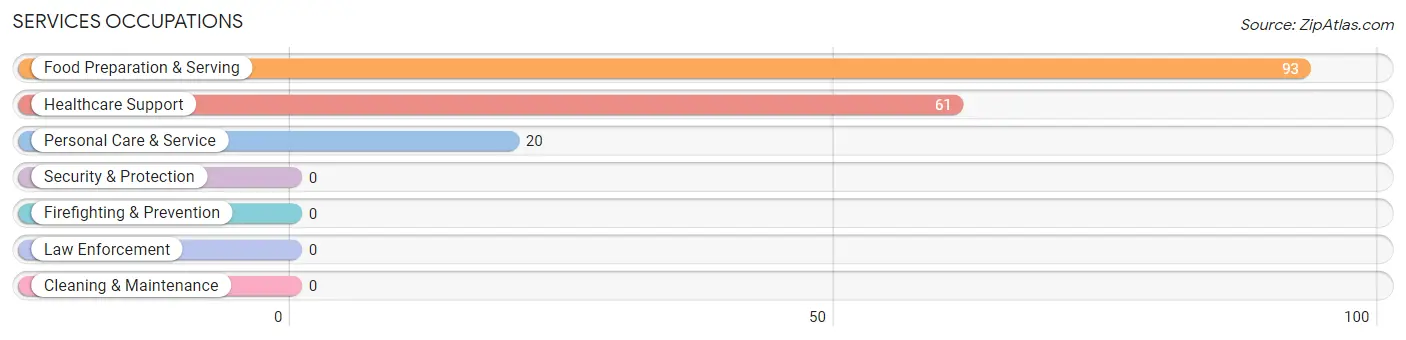
Services Occupations
The most common Services occupations in Manchester borough are Food Preparation & Serving (93 | 6.4%), Healthcare Support (61 | 4.2%), and Personal Care & Service (20 | 1.4%).
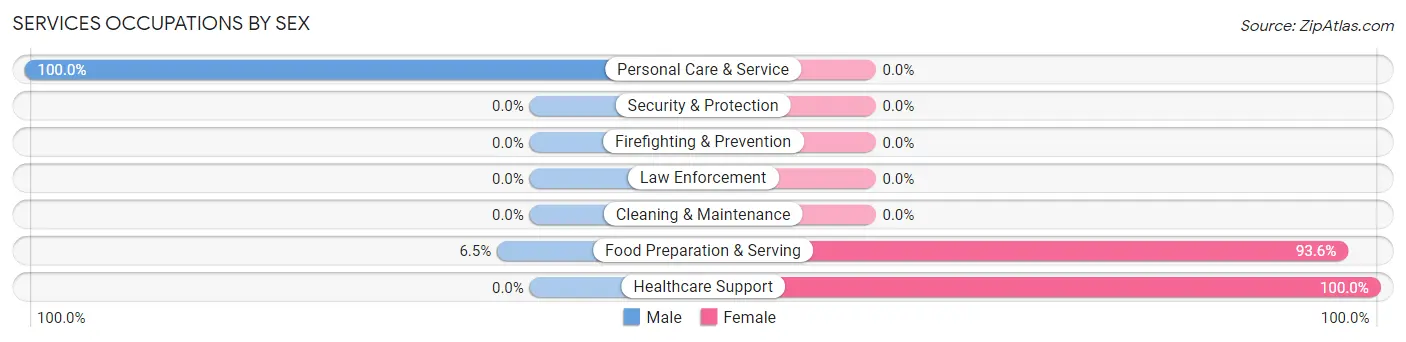
Services Occupations by Sex
Within the Services occupations in Manchester borough, the most male-oriented occupations are Personal Care & Service (100.0%), and Food Preparation & Serving (6.5%), while the most female-oriented occupations are Healthcare Support (100.0%), and Food Preparation & Serving (93.5%).
| Occupation | Male | Female |
| Healthcare Support | 0 (0.0%) | 61 (100.0%) |
| Security & Protection | 0 (0.0%) | 0 (0.0%) |
| Firefighting & Prevention | 0 (0.0%) | 0 (0.0%) |
| Law Enforcement | 0 (0.0%) | 0 (0.0%) |
| Food Preparation & Serving | 6 (6.5%) | 87 (93.5%) |
| Cleaning & Maintenance | 0 (0.0%) | 0 (0.0%) |
| Personal Care & Service | 20 (100.0%) | 0 (0.0%) |
| Total (Category) | 26 (14.9%) | 148 (85.1%) |
| Total (Overall) | 802 (55.2%) | 651 (44.8%) |
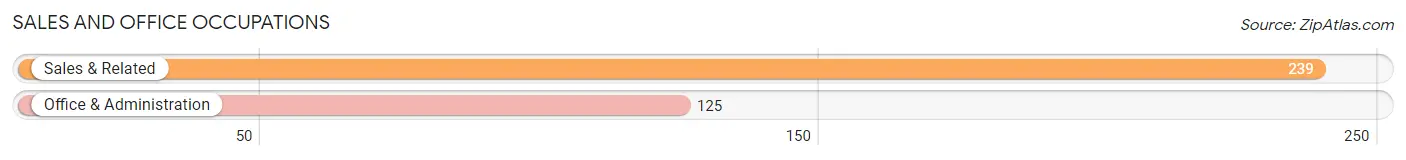
Sales and Office Occupations
The most common Sales and Office occupations in Manchester borough are Sales & Related (239 | 16.5%), and Office & Administration (125 | 8.6%).
Sales and Office Occupations by Sex
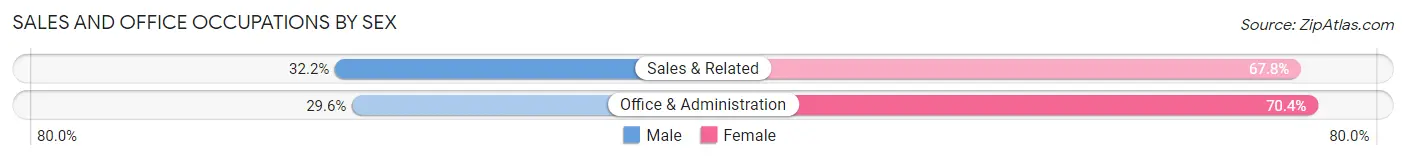
| Occupation | Male | Female |
| Sales & Related | 77 (32.2%) | 162 (67.8%) |
| Office & Administration | 37 (29.6%) | 88 (70.4%) |
| Total (Category) | 114 (31.3%) | 250 (68.7%) |
| Total (Overall) | 802 (55.2%) | 651 (44.8%) |
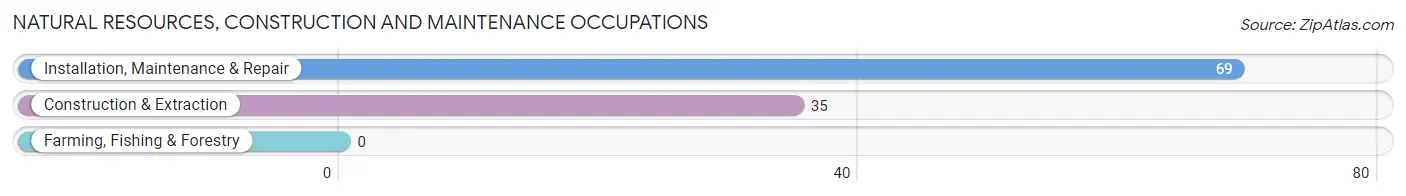
Natural Resources, Construction and Maintenance Occupations
The most common Natural Resources, Construction and Maintenance occupations in Manchester borough are Installation, Maintenance & Repair (69 | 4.8%), and Construction & Extraction (35 | 2.4%).
Natural Resources, Construction and Maintenance Occupations by Sex
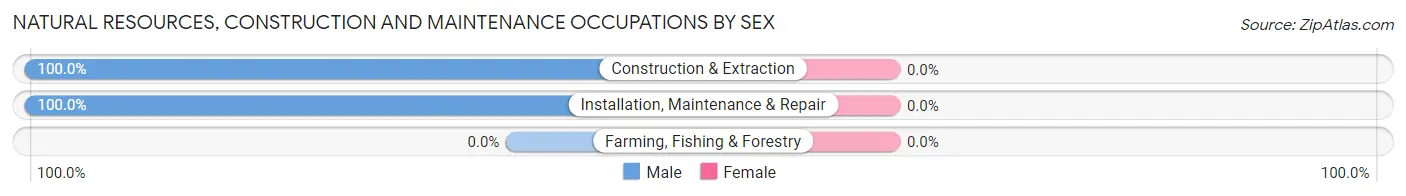
| Occupation | Male | Female |
| Farming, Fishing & Forestry | 0 (0.0%) | 0 (0.0%) |
| Construction & Extraction | 35 (100.0%) | 0 (0.0%) |
| Installation, Maintenance & Repair | 69 (100.0%) | 0 (0.0%) |
| Total (Category) | 104 (100.0%) | 0 (0.0%) |
| Total (Overall) | 802 (55.2%) | 651 (44.8%) |
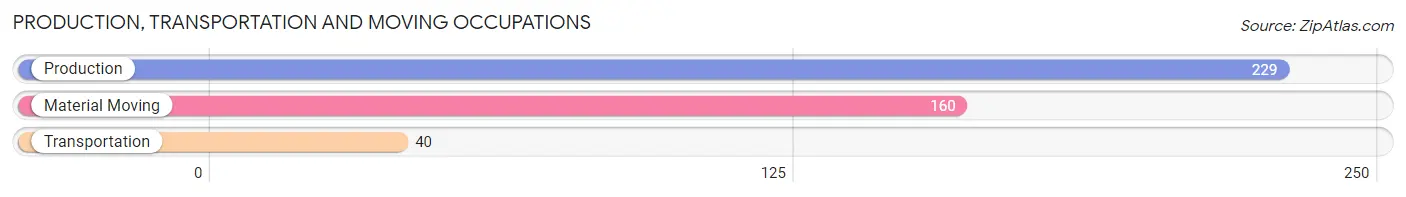
Production, Transportation and Moving Occupations
The most common Production, Transportation and Moving occupations in Manchester borough are Production (229 | 15.8%), Material Moving (160 | 11.0%), and Transportation (40 | 2.8%).
Production, Transportation and Moving Occupations by Sex
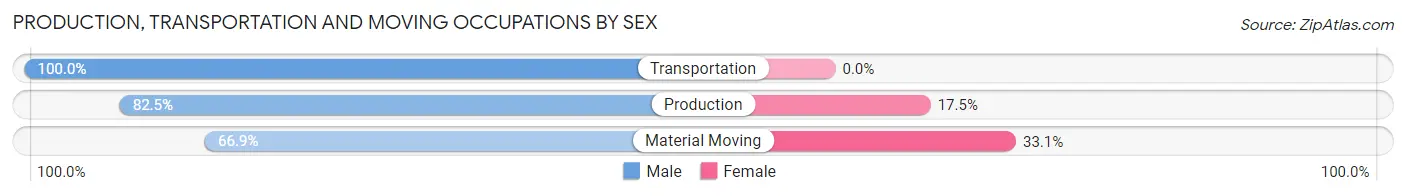
| Occupation | Male | Female |
| Production | 189 (82.5%) | 40 (17.5%) |
| Transportation | 40 (100.0%) | 0 (0.0%) |
| Material Moving | 107 (66.9%) | 53 (33.1%) |
| Total (Category) | 336 (78.3%) | 93 (21.7%) |
| Total (Overall) | 802 (55.2%) | 651 (44.8%) |
Employment Industries by Sex in Manchester borough
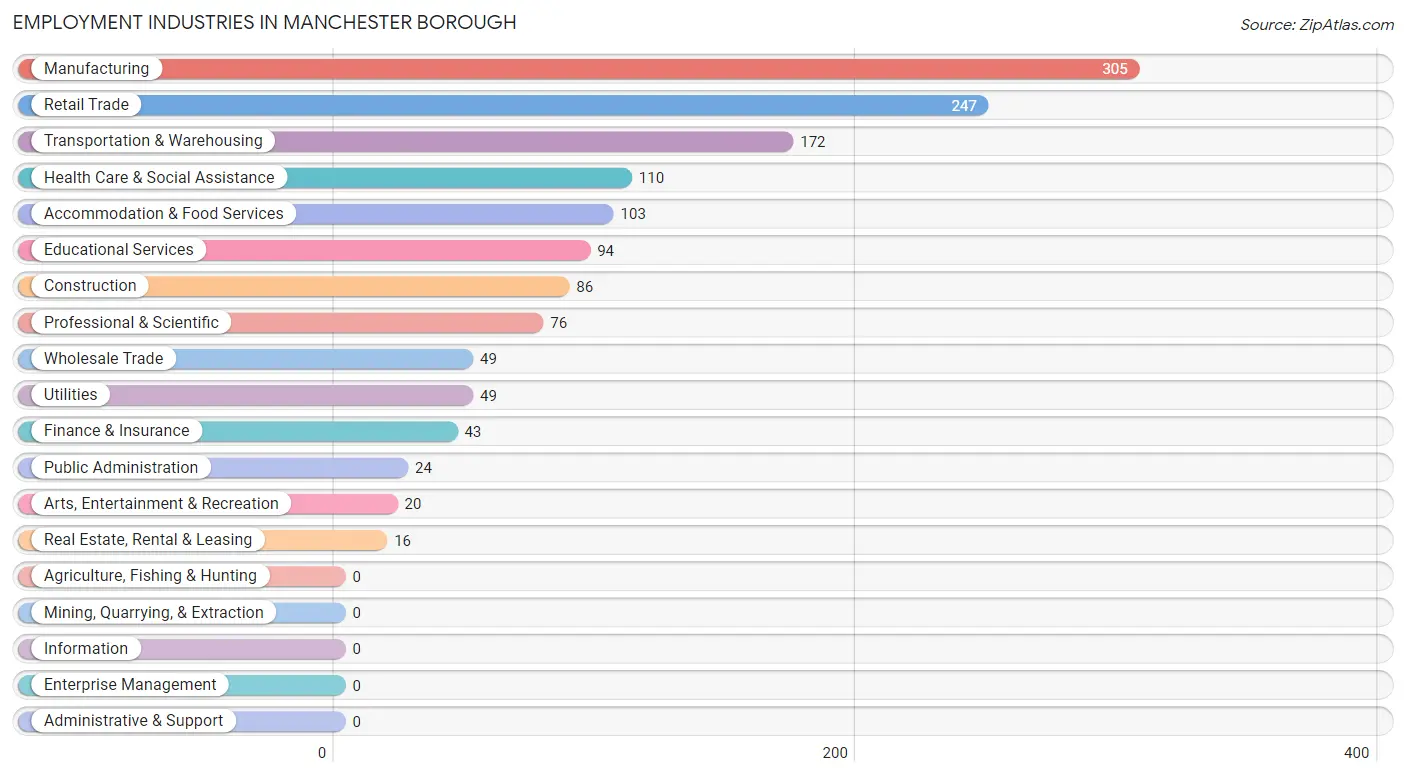
Employment Industries in Manchester borough
The major employment industries in Manchester borough include Manufacturing (305 | 21.0%), Retail Trade (247 | 17.0%), Transportation & Warehousing (172 | 11.8%), Health Care & Social Assistance (110 | 7.6%), and Accommodation & Food Services (103 | 7.1%).
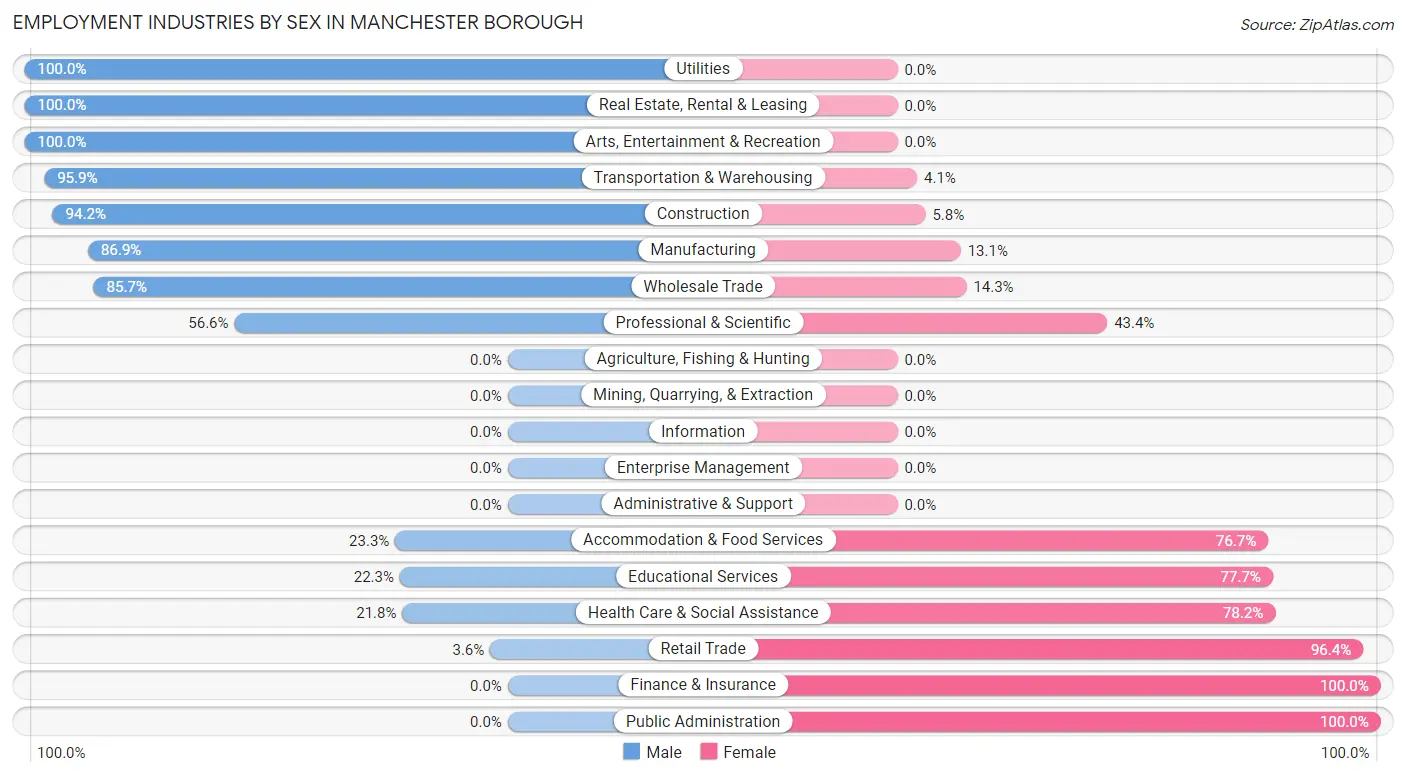
Employment Industries by Sex in Manchester borough
The Manchester borough industries that see more men than women are Utilities (100.0%), Real Estate, Rental & Leasing (100.0%), and Arts, Entertainment & Recreation (100.0%), whereas the industries that tend to have a higher number of women are Finance & Insurance (100.0%), Public Administration (100.0%), and Retail Trade (96.4%).
| Industry | Male | Female |
| Agriculture, Fishing & Hunting | 0 (0.0%) | 0 (0.0%) |
| Mining, Quarrying, & Extraction | 0 (0.0%) | 0 (0.0%) |
| Construction | 81 (94.2%) | 5 (5.8%) |
| Manufacturing | 265 (86.9%) | 40 (13.1%) |
| Wholesale Trade | 42 (85.7%) | 7 (14.3%) |
| Retail Trade | 9 (3.6%) | 238 (96.4%) |
| Transportation & Warehousing | 165 (95.9%) | 7 (4.1%) |
| Utilities | 49 (100.0%) | 0 (0.0%) |
| Information | 0 (0.0%) | 0 (0.0%) |
| Finance & Insurance | 0 (0.0%) | 43 (100.0%) |
| Real Estate, Rental & Leasing | 16 (100.0%) | 0 (0.0%) |
| Professional & Scientific | 43 (56.6%) | 33 (43.4%) |
| Enterprise Management | 0 (0.0%) | 0 (0.0%) |
| Administrative & Support | 0 (0.0%) | 0 (0.0%) |
| Educational Services | 21 (22.3%) | 73 (77.7%) |
| Health Care & Social Assistance | 24 (21.8%) | 86 (78.2%) |
| Arts, Entertainment & Recreation | 20 (100.0%) | 0 (0.0%) |
| Accommodation & Food Services | 24 (23.3%) | 79 (76.7%) |
| Public Administration | 0 (0.0%) | 24 (100.0%) |
| Total | 802 (55.2%) | 651 (44.8%) |
Education in Manchester borough
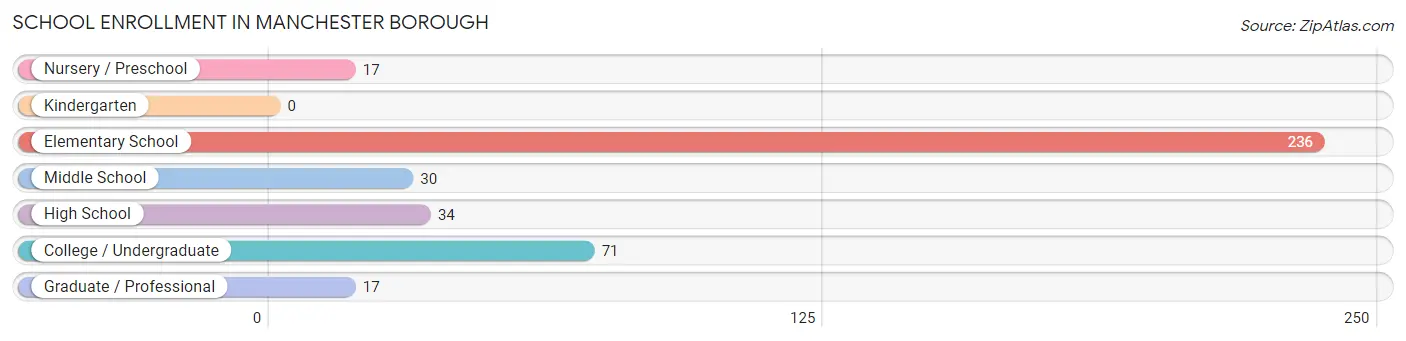
School Enrollment in Manchester borough
The most common levels of schooling among the 405 students in Manchester borough are elementary school (236 | 58.3%), college / undergraduate (71 | 17.5%), and high school (34 | 8.4%).
| School Level | # Students | % Students |
| Nursery / Preschool | 17 | 4.2% |
| Kindergarten | 0 | 0.0% |
| Elementary School | 236 | 58.3% |
| Middle School | 30 | 7.4% |
| High School | 34 | 8.4% |
| College / Undergraduate | 71 | 17.5% |
| Graduate / Professional | 17 | 4.2% |
| Total | 405 | 100.0% |
School Enrollment by Age by Funding Source in Manchester borough
Out of a total of 405 students who are enrolled in schools in Manchester borough, 86 (21.2%) attend a private institution, while the remaining 319 (78.8%) are enrolled in public schools. The age group of 3 to 4 year olds has the highest likelihood of being enrolled in private schools, with 17 (100.0% in the age bracket) enrolled. Conversely, the age group of 10 to 14 year olds has the lowest likelihood of being enrolled in a private school, with 30 (100.0% in the age bracket) attending a public institution.
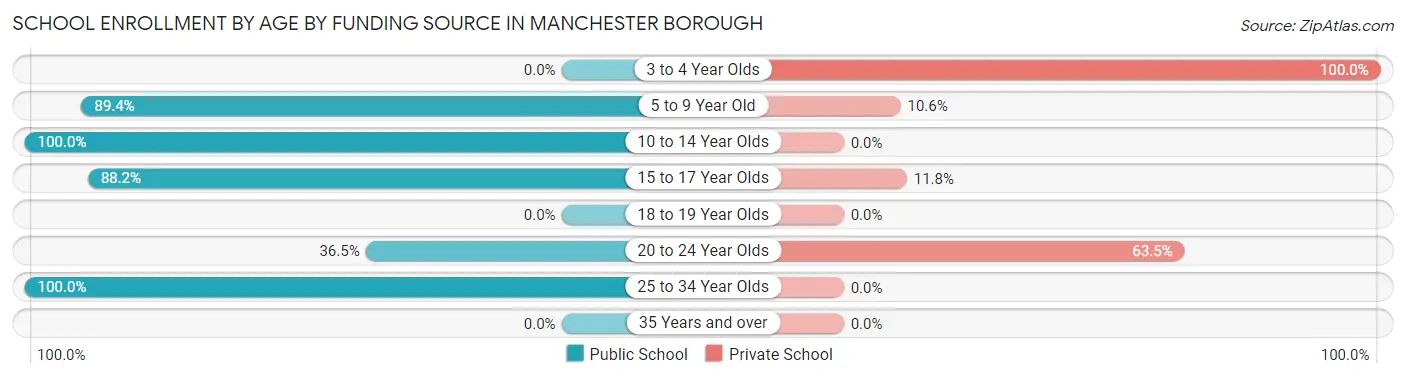
| Age Bracket | Public School | Private School |
| 3 to 4 Year Olds | 0 (0.0%) | 17 (100.0%) |
| 5 to 9 Year Old | 211 (89.4%) | 25 (10.6%) |
| 10 to 14 Year Olds | 30 (100.0%) | 0 (0.0%) |
| 15 to 17 Year Olds | 30 (88.2%) | 4 (11.8%) |
| 18 to 19 Year Olds | 0 (0.0%) | 0 (0.0%) |
| 20 to 24 Year Olds | 23 (36.5%) | 40 (63.5%) |
| 25 to 34 Year Olds | 25 (100.0%) | 0 (0.0%) |
| 35 Years and over | 0 (0.0%) | 0 (0.0%) |
| Total | 319 (78.8%) | 86 (21.2%) |
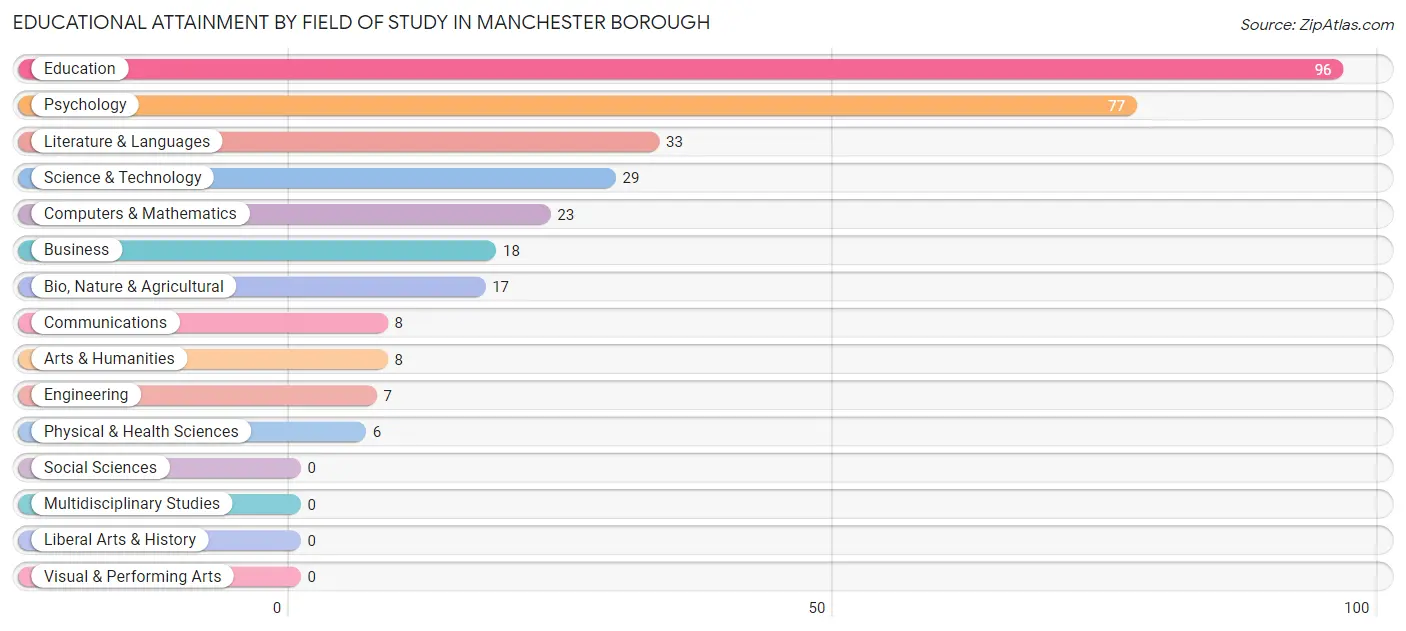
Educational Attainment by Field of Study in Manchester borough
Education (96 | 29.8%), psychology (77 | 23.9%), literature & languages (33 | 10.2%), science & technology (29 | 9.0%), and computers & mathematics (23 | 7.1%) are the most common fields of study among 322 individuals in Manchester borough who have obtained a bachelor's degree or higher.
| Field of Study | # Graduates | % Graduates |
| Computers & Mathematics | 23 | 7.1% |
| Bio, Nature & Agricultural | 17 | 5.3% |
| Physical & Health Sciences | 6 | 1.9% |
| Psychology | 77 | 23.9% |
| Social Sciences | 0 | 0.0% |
| Engineering | 7 | 2.2% |
| Multidisciplinary Studies | 0 | 0.0% |
| Science & Technology | 29 | 9.0% |
| Business | 18 | 5.6% |
| Education | 96 | 29.8% |
| Literature & Languages | 33 | 10.2% |
| Liberal Arts & History | 0 | 0.0% |
| Visual & Performing Arts | 0 | 0.0% |
| Communications | 8 | 2.5% |
| Arts & Humanities | 8 | 2.5% |
| Total | 322 | 100.0% |
Transportation & Commute in Manchester borough
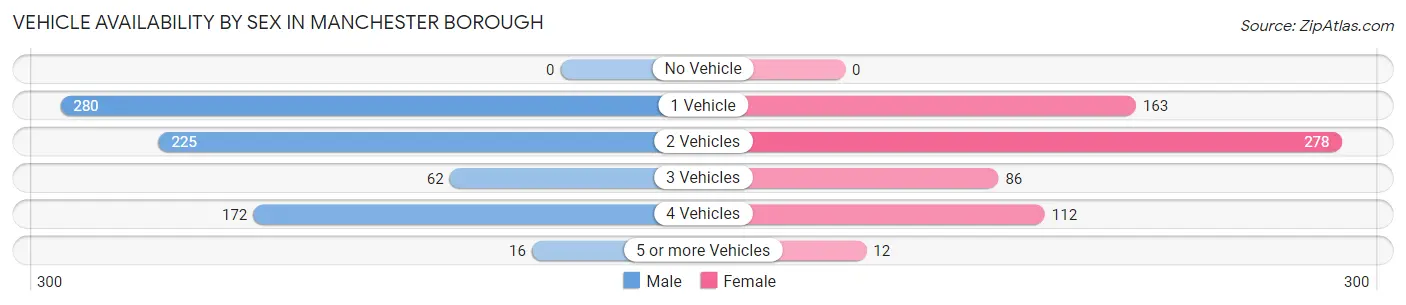
Vehicle Availability by Sex in Manchester borough
The most prevalent vehicle ownership categories in Manchester borough are males with 1 vehicle (280, accounting for 37.1%) and females with 1 vehicle (163, making up 43.0%).
| Vehicles Available | Male | Female |
| No Vehicle | 0 (0.0%) | 0 (0.0%) |
| 1 Vehicle | 280 (37.1%) | 163 (25.0%) |
| 2 Vehicles | 225 (29.8%) | 278 (42.7%) |
| 3 Vehicles | 62 (8.2%) | 86 (13.2%) |
| 4 Vehicles | 172 (22.8%) | 112 (17.2%) |
| 5 or more Vehicles | 16 (2.1%) | 12 (1.8%) |
| Total | 755 (100.0%) | 651 (100.0%) |
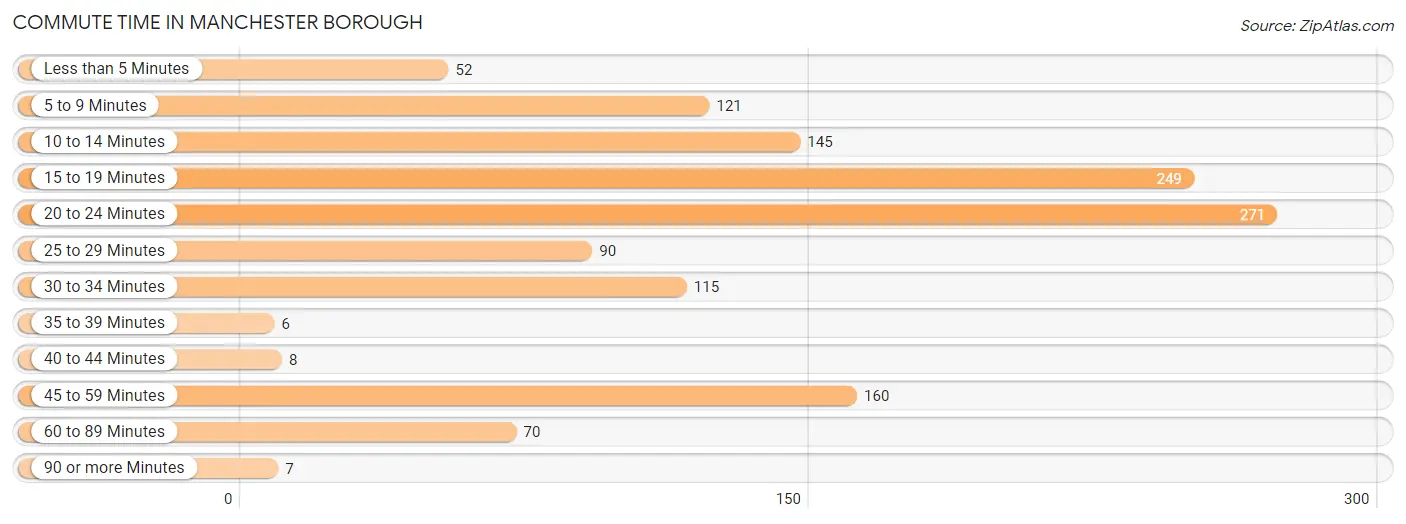
Commute Time in Manchester borough
The most frequently occuring commute durations in Manchester borough are 20 to 24 minutes (271 commuters, 20.9%), 15 to 19 minutes (249 commuters, 19.2%), and 45 to 59 minutes (160 commuters, 12.4%).
| Commute Time | # Commuters | % Commuters |
| Less than 5 Minutes | 52 | 4.0% |
| 5 to 9 Minutes | 121 | 9.3% |
| 10 to 14 Minutes | 145 | 11.2% |
| 15 to 19 Minutes | 249 | 19.2% |
| 20 to 24 Minutes | 271 | 20.9% |
| 25 to 29 Minutes | 90 | 7.0% |
| 30 to 34 Minutes | 115 | 8.9% |
| 35 to 39 Minutes | 6 | 0.5% |
| 40 to 44 Minutes | 8 | 0.6% |
| 45 to 59 Minutes | 160 | 12.4% |
| 60 to 89 Minutes | 70 | 5.4% |
| 90 or more Minutes | 7 | 0.5% |
Commute Time by Sex in Manchester borough
The most common commute times in Manchester borough are 15 to 19 minutes (172 commuters, 23.6%) for males and 20 to 24 minutes (167 commuters, 29.5%) for females.
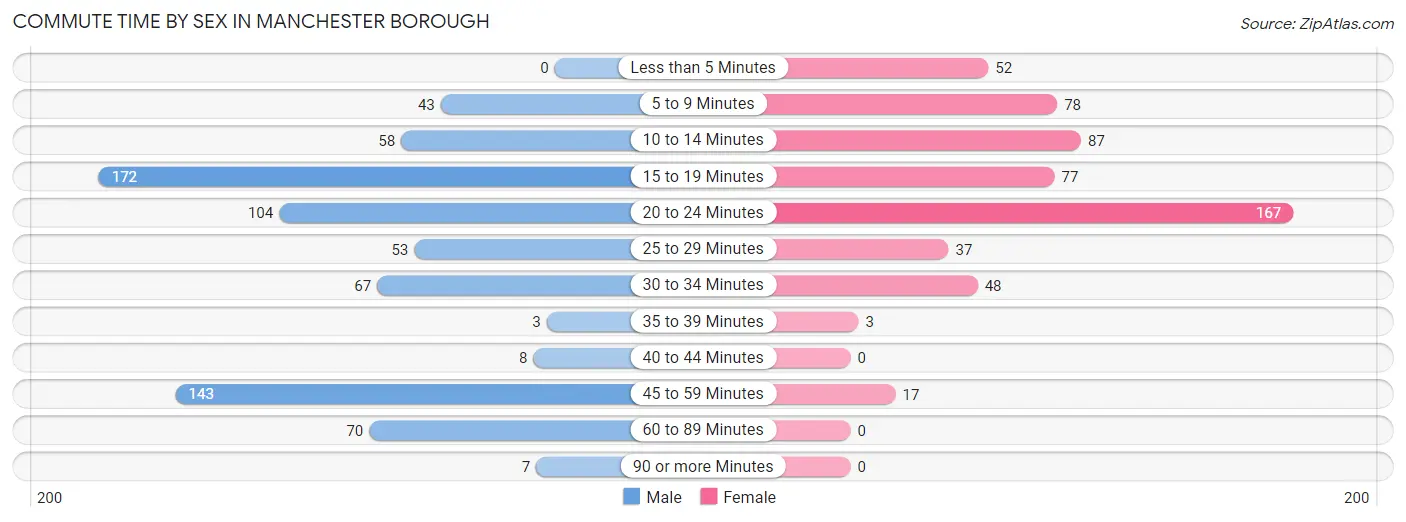
| Commute Time | Male | Female |
| Less than 5 Minutes | 0 (0.0%) | 52 (9.2%) |
| 5 to 9 Minutes | 43 (5.9%) | 78 (13.8%) |
| 10 to 14 Minutes | 58 (8.0%) | 87 (15.4%) |
| 15 to 19 Minutes | 172 (23.6%) | 77 (13.6%) |
| 20 to 24 Minutes | 104 (14.3%) | 167 (29.5%) |
| 25 to 29 Minutes | 53 (7.3%) | 37 (6.5%) |
| 30 to 34 Minutes | 67 (9.2%) | 48 (8.5%) |
| 35 to 39 Minutes | 3 (0.4%) | 3 (0.5%) |
| 40 to 44 Minutes | 8 (1.1%) | 0 (0.0%) |
| 45 to 59 Minutes | 143 (19.6%) | 17 (3.0%) |
| 60 to 89 Minutes | 70 (9.6%) | 0 (0.0%) |
| 90 or more Minutes | 7 (1.0%) | 0 (0.0%) |
Time of Departure to Work by Sex in Manchester borough
The most frequent times of departure to work in Manchester borough are 12:00 PM to 3:59 PM (122, 16.8%) for males and 8:30 AM to 8:59 AM (121, 21.4%) for females.
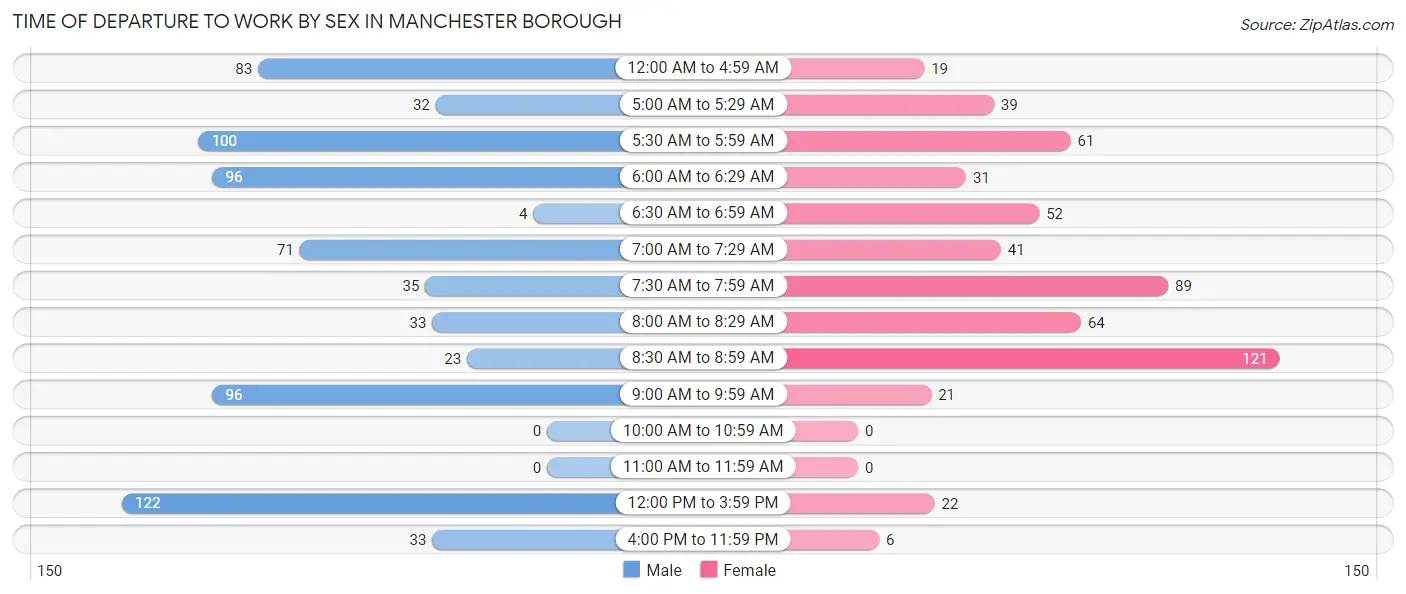
| Time of Departure | Male | Female |
| 12:00 AM to 4:59 AM | 83 (11.4%) | 19 (3.4%) |
| 5:00 AM to 5:29 AM | 32 (4.4%) | 39 (6.9%) |
| 5:30 AM to 5:59 AM | 100 (13.7%) | 61 (10.8%) |
| 6:00 AM to 6:29 AM | 96 (13.2%) | 31 (5.5%) |
| 6:30 AM to 6:59 AM | 4 (0.5%) | 52 (9.2%) |
| 7:00 AM to 7:29 AM | 71 (9.8%) | 41 (7.2%) |
| 7:30 AM to 7:59 AM | 35 (4.8%) | 89 (15.7%) |
| 8:00 AM to 8:29 AM | 33 (4.5%) | 64 (11.3%) |
| 8:30 AM to 8:59 AM | 23 (3.2%) | 121 (21.4%) |
| 9:00 AM to 9:59 AM | 96 (13.2%) | 21 (3.7%) |
| 10:00 AM to 10:59 AM | 0 (0.0%) | 0 (0.0%) |
| 11:00 AM to 11:59 AM | 0 (0.0%) | 0 (0.0%) |
| 12:00 PM to 3:59 PM | 122 (16.8%) | 22 (3.9%) |
| 4:00 PM to 11:59 PM | 33 (4.5%) | 6 (1.1%) |
| Total | 728 (100.0%) | 566 (100.0%) |
Housing Occupancy in Manchester borough
Occupancy by Ownership in Manchester borough
Of the total 1,287 dwellings in Manchester borough, owner-occupied units account for 707 (54.9%), while renter-occupied units make up 580 (45.1%).
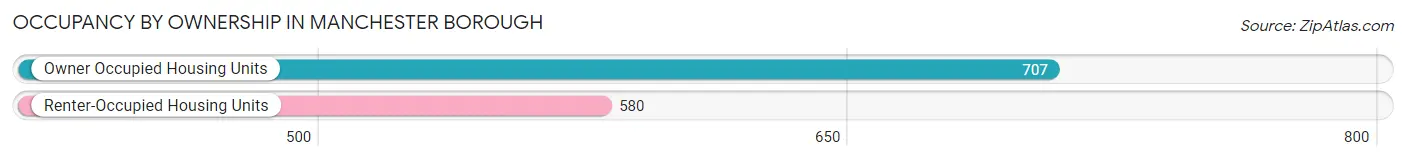
| Occupancy | # Housing Units | % Housing Units |
| Owner Occupied Housing Units | 707 | 54.9% |
| Renter-Occupied Housing Units | 580 | 45.1% |
| Total Occupied Housing Units | 1,287 | 100.0% |
Occupancy by Household Size in Manchester borough
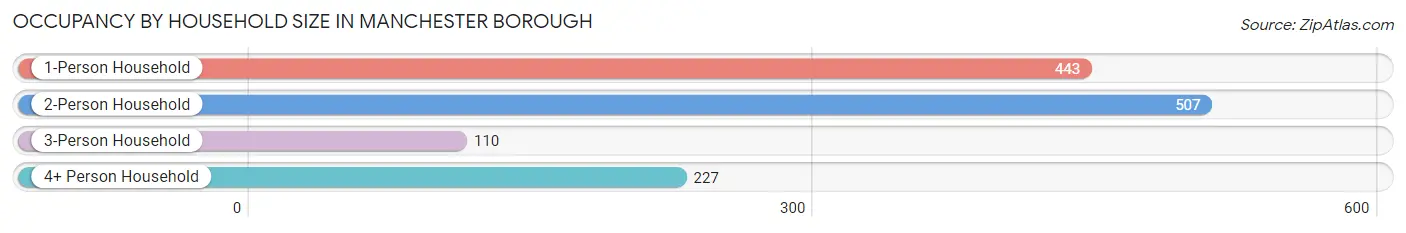
| Household Size | # Housing Units | % Housing Units |
| 1-Person Household | 443 | 34.4% |
| 2-Person Household | 507 | 39.4% |
| 3-Person Household | 110 | 8.6% |
| 4+ Person Household | 227 | 17.6% |
| Total Housing Units | 1,287 | 100.0% |
Occupancy by Ownership by Household Size in Manchester borough
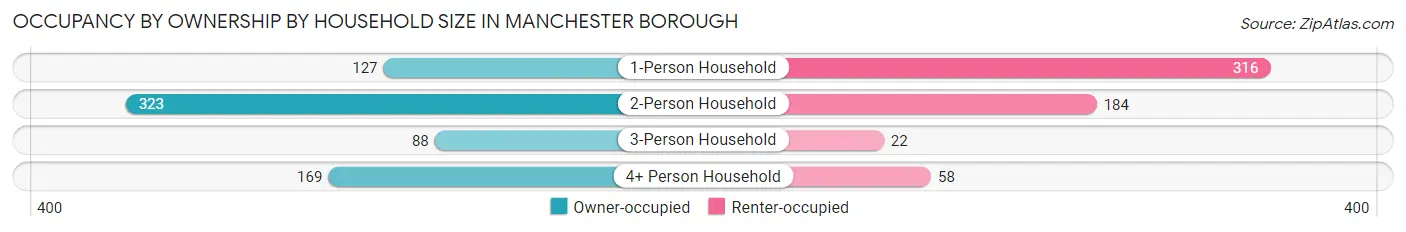
| Household Size | Owner-occupied | Renter-occupied |
| 1-Person Household | 127 (28.7%) | 316 (71.3%) |
| 2-Person Household | 323 (63.7%) | 184 (36.3%) |
| 3-Person Household | 88 (80.0%) | 22 (20.0%) |
| 4+ Person Household | 169 (74.5%) | 58 (25.6%) |
| Total Housing Units | 707 (54.9%) | 580 (45.1%) |
Occupancy by Educational Attainment in Manchester borough
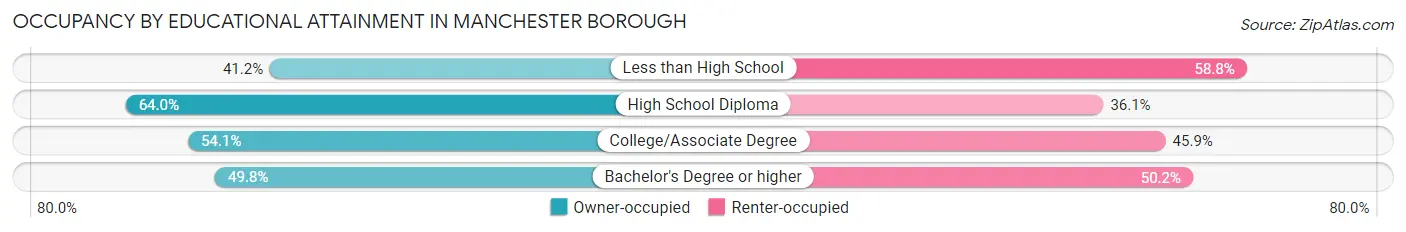
| Household Size | Owner-occupied | Renter-occupied |
| Less than High School | 80 (41.2%) | 114 (58.8%) |
| High School Diploma | 298 (63.9%) | 168 (36.0%) |
| College/Associate Degree | 212 (54.1%) | 180 (45.9%) |
| Bachelor's Degree or higher | 117 (49.8%) | 118 (50.2%) |
Occupancy by Age of Householder in Manchester borough
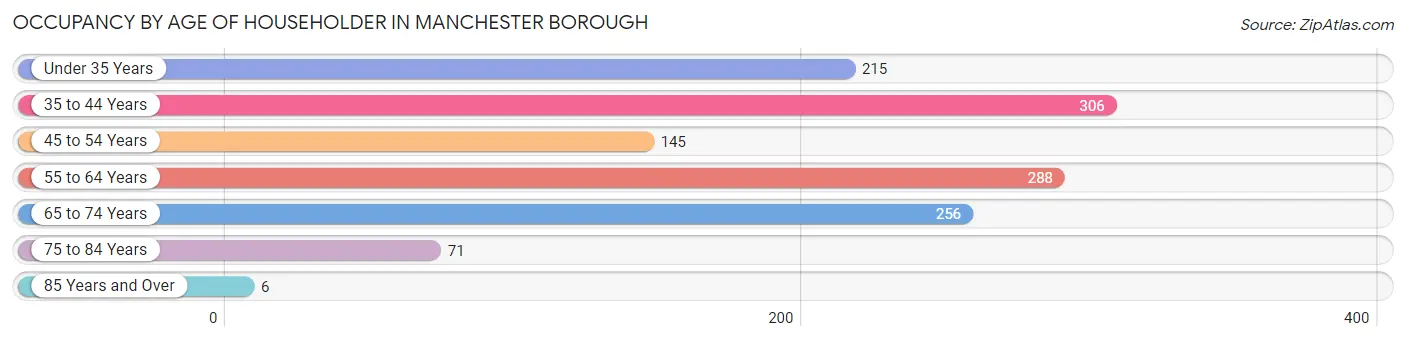
| Age Bracket | # Households | % Households |
| Under 35 Years | 215 | 16.7% |
| 35 to 44 Years | 306 | 23.8% |
| 45 to 54 Years | 145 | 11.3% |
| 55 to 64 Years | 288 | 22.4% |
| 65 to 74 Years | 256 | 19.9% |
| 75 to 84 Years | 71 | 5.5% |
| 85 Years and Over | 6 | 0.5% |
| Total | 1,287 | 100.0% |
Housing Finances in Manchester borough
Median Income by Occupancy in Manchester borough
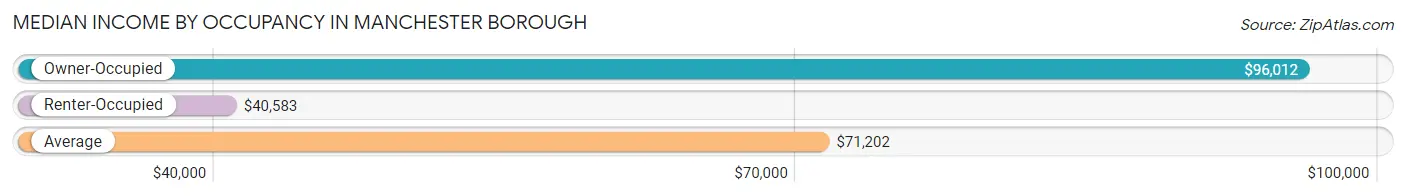
| Occupancy Type | # Households | Median Income |
| Owner-Occupied | 707 (54.9%) | $96,012 |
| Renter-Occupied | 580 (45.1%) | $40,583 |
| Average | 1,287 (100.0%) | $71,202 |
Occupancy by Householder Income Bracket in Manchester borough
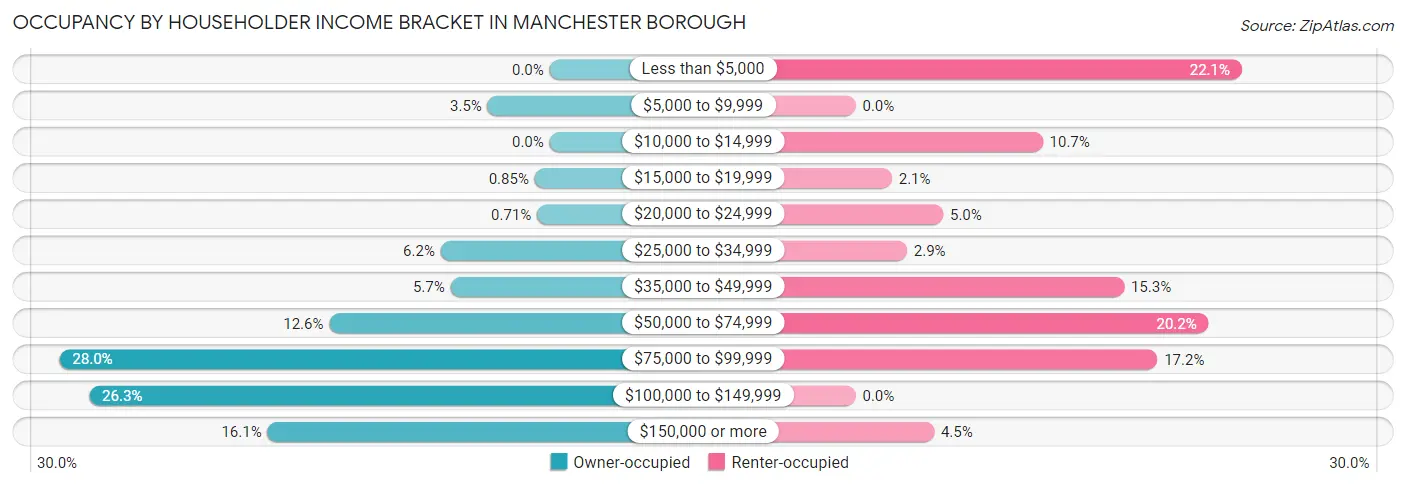
| Income Bracket | Owner-occupied | Renter-occupied |
| Less than $5,000 | 0 (0.0%) | 128 (22.1%) |
| $5,000 to $9,999 | 25 (3.5%) | 0 (0.0%) |
| $10,000 to $14,999 | 0 (0.0%) | 62 (10.7%) |
| $15,000 to $19,999 | 6 (0.9%) | 12 (2.1%) |
| $20,000 to $24,999 | 5 (0.7%) | 29 (5.0%) |
| $25,000 to $34,999 | 44 (6.2%) | 17 (2.9%) |
| $35,000 to $49,999 | 40 (5.7%) | 89 (15.3%) |
| $50,000 to $74,999 | 89 (12.6%) | 117 (20.2%) |
| $75,000 to $99,999 | 198 (28.0%) | 100 (17.2%) |
| $100,000 to $149,999 | 186 (26.3%) | 0 (0.0%) |
| $150,000 or more | 114 (16.1%) | 26 (4.5%) |
| Total | 707 (100.0%) | 580 (100.0%) |
Monthly Housing Cost Tiers in Manchester borough
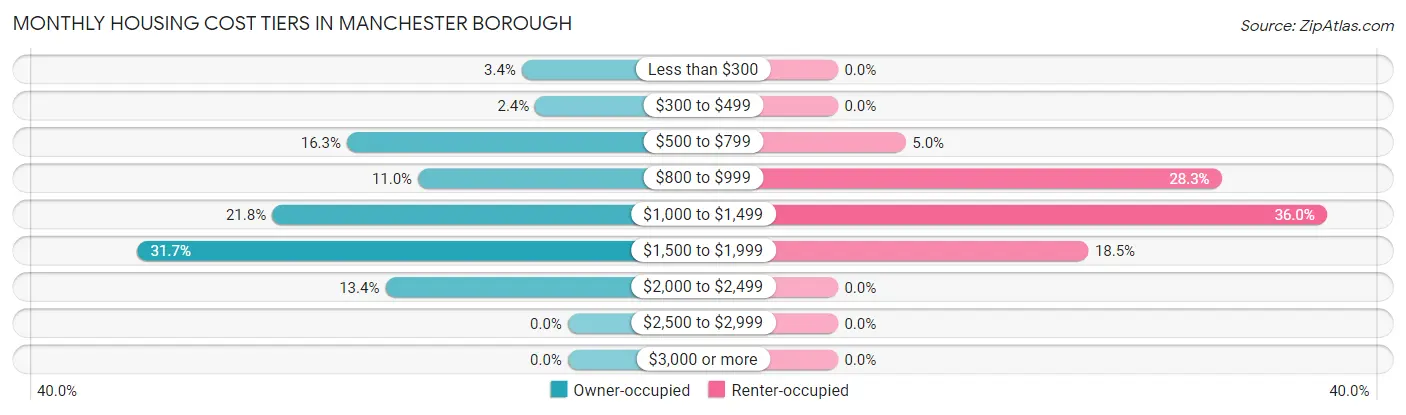
| Monthly Cost | Owner-occupied | Renter-occupied |
| Less than $300 | 24 (3.4%) | 0 (0.0%) |
| $300 to $499 | 17 (2.4%) | 0 (0.0%) |
| $500 to $799 | 115 (16.3%) | 29 (5.0%) |
| $800 to $999 | 78 (11.0%) | 164 (28.3%) |
| $1,000 to $1,499 | 154 (21.8%) | 209 (36.0%) |
| $1,500 to $1,999 | 224 (31.7%) | 107 (18.4%) |
| $2,000 to $2,499 | 95 (13.4%) | 0 (0.0%) |
| $2,500 to $2,999 | 0 (0.0%) | 0 (0.0%) |
| $3,000 or more | 0 (0.0%) | 0 (0.0%) |
| Total | 707 (100.0%) | 580 (100.0%) |
Physical Housing Characteristics in Manchester borough
Housing Structures in Manchester borough
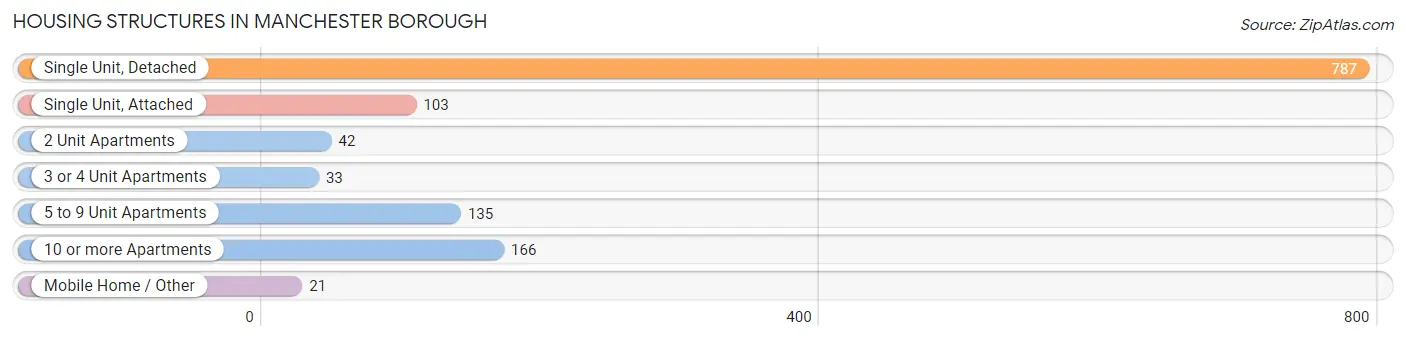
| Structure Type | # Housing Units | % Housing Units |
| Single Unit, Detached | 787 | 61.2% |
| Single Unit, Attached | 103 | 8.0% |
| 2 Unit Apartments | 42 | 3.3% |
| 3 or 4 Unit Apartments | 33 | 2.6% |
| 5 to 9 Unit Apartments | 135 | 10.5% |
| 10 or more Apartments | 166 | 12.9% |
| Mobile Home / Other | 21 | 1.6% |
| Total | 1,287 | 100.0% |
Housing Structures by Occupancy in Manchester borough
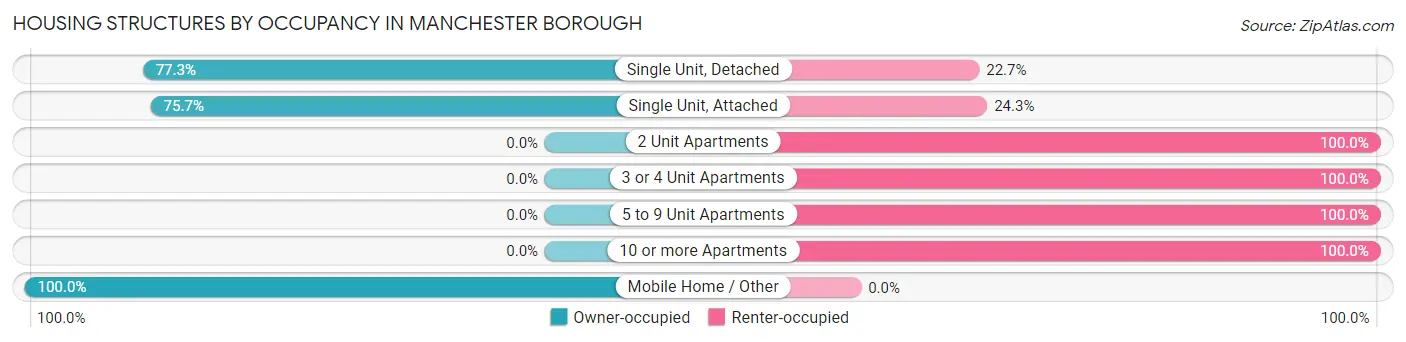
| Structure Type | Owner-occupied | Renter-occupied |
| Single Unit, Detached | 608 (77.3%) | 179 (22.7%) |
| Single Unit, Attached | 78 (75.7%) | 25 (24.3%) |
| 2 Unit Apartments | 0 (0.0%) | 42 (100.0%) |
| 3 or 4 Unit Apartments | 0 (0.0%) | 33 (100.0%) |
| 5 to 9 Unit Apartments | 0 (0.0%) | 135 (100.0%) |
| 10 or more Apartments | 0 (0.0%) | 166 (100.0%) |
| Mobile Home / Other | 21 (100.0%) | 0 (0.0%) |
| Total | 707 (54.9%) | 580 (45.1%) |
Housing Structures by Number of Rooms in Manchester borough
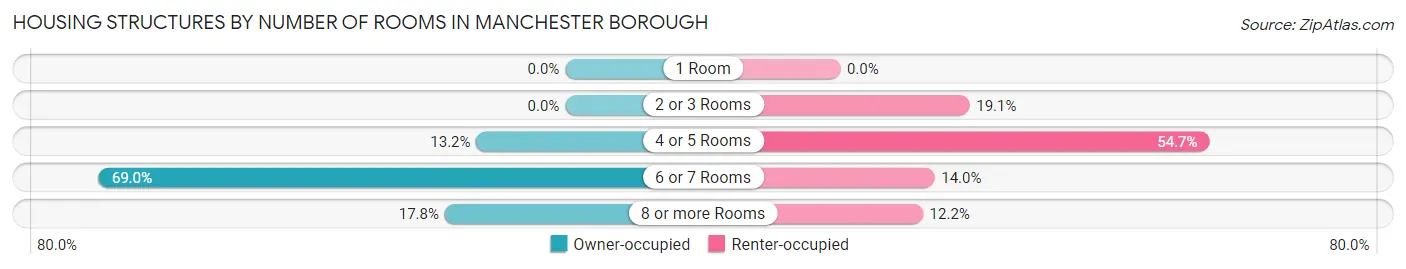
| Number of Rooms | Owner-occupied | Renter-occupied |
| 1 Room | 0 (0.0%) | 0 (0.0%) |
| 2 or 3 Rooms | 0 (0.0%) | 111 (19.1%) |
| 4 or 5 Rooms | 93 (13.2%) | 317 (54.7%) |
| 6 or 7 Rooms | 488 (69.0%) | 81 (14.0%) |
| 8 or more Rooms | 126 (17.8%) | 71 (12.2%) |
| Total | 707 (100.0%) | 580 (100.0%) |
Housing Structure by Heating Type in Manchester borough
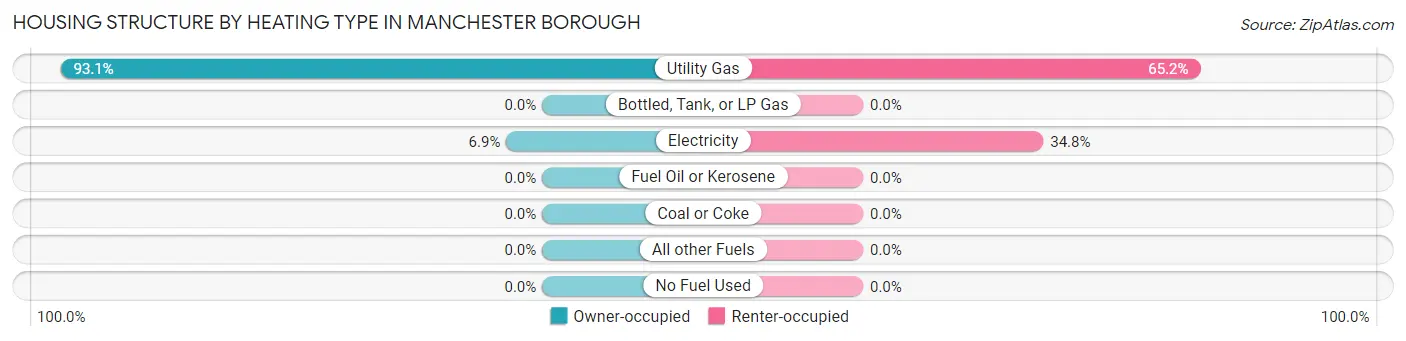
| Heating Type | Owner-occupied | Renter-occupied |
| Utility Gas | 658 (93.1%) | 378 (65.2%) |
| Bottled, Tank, or LP Gas | 0 (0.0%) | 0 (0.0%) |
| Electricity | 49 (6.9%) | 202 (34.8%) |
| Fuel Oil or Kerosene | 0 (0.0%) | 0 (0.0%) |
| Coal or Coke | 0 (0.0%) | 0 (0.0%) |
| All other Fuels | 0 (0.0%) | 0 (0.0%) |
| No Fuel Used | 0 (0.0%) | 0 (0.0%) |
| Total | 707 (100.0%) | 580 (100.0%) |
Household Vehicle Usage in Manchester borough
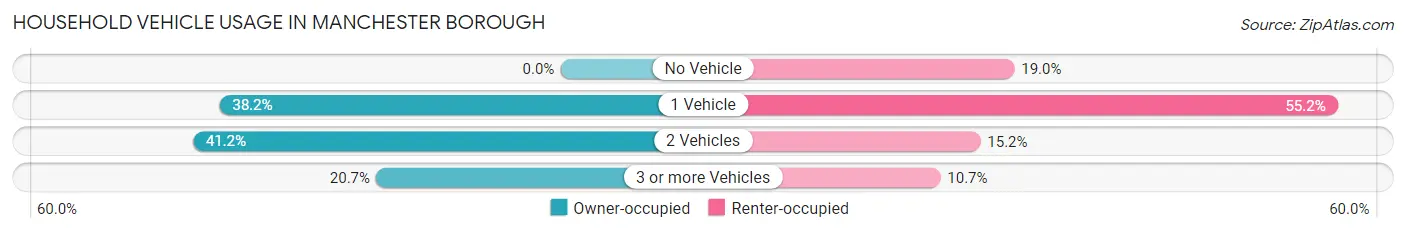
| Vehicles per Household | Owner-occupied | Renter-occupied |
| No Vehicle | 0 (0.0%) | 110 (19.0%) |
| 1 Vehicle | 270 (38.2%) | 320 (55.2%) |
| 2 Vehicles | 291 (41.2%) | 88 (15.2%) |
| 3 or more Vehicles | 146 (20.6%) | 62 (10.7%) |
| Total | 707 (100.0%) | 580 (100.0%) |
Real Estate & Mortgages in Manchester borough
Real Estate and Mortgage Overview in Manchester borough
| Characteristic | Without Mortgage | With Mortgage |
| Housing Units | 154 | 553 |
| Median Property Value | $157,900 | $180,400 |
| Median Household Income | $115,357 | $91 |
| Monthly Housing Costs | $700 | $0 |
| Real Estate Taxes | $4,133 | $63 |
Property Value by Mortgage Status in Manchester borough
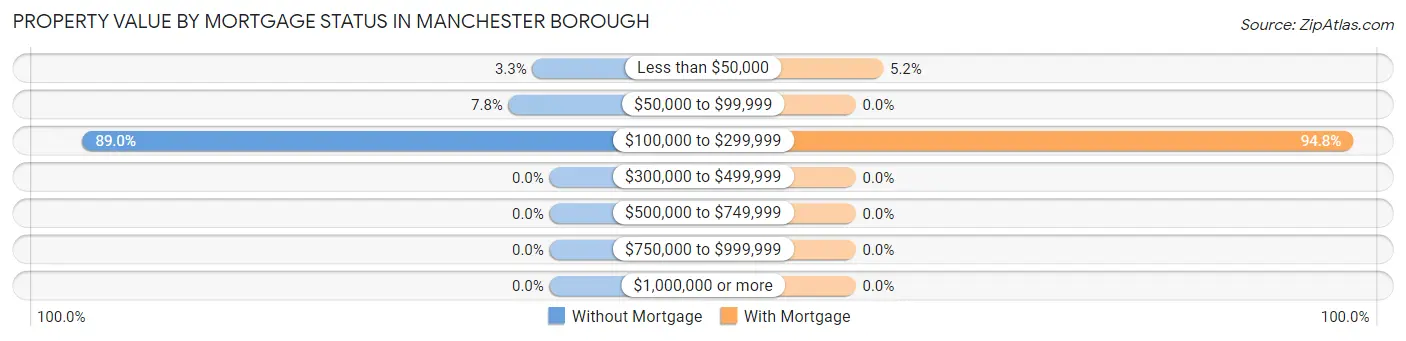
| Property Value | Without Mortgage | With Mortgage |
| Less than $50,000 | 5 (3.3%) | 29 (5.2%) |
| $50,000 to $99,999 | 12 (7.8%) | 0 (0.0%) |
| $100,000 to $299,999 | 137 (89.0%) | 524 (94.8%) |
| $300,000 to $499,999 | 0 (0.0%) | 0 (0.0%) |
| $500,000 to $749,999 | 0 (0.0%) | 0 (0.0%) |
| $750,000 to $999,999 | 0 (0.0%) | 0 (0.0%) |
| $1,000,000 or more | 0 (0.0%) | 0 (0.0%) |
| Total | 154 (100.0%) | 553 (100.0%) |
Household Income by Mortgage Status in Manchester borough
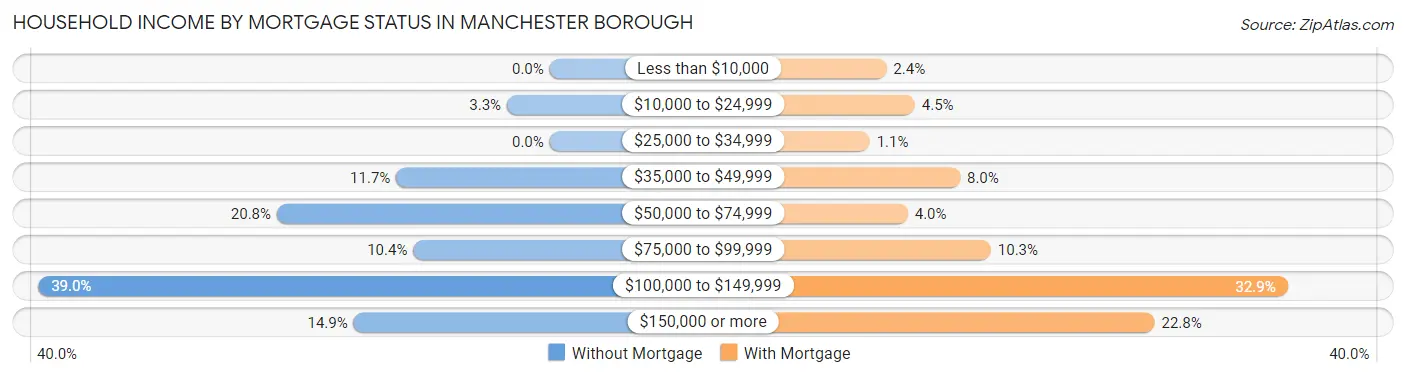
| Household Income | Without Mortgage | With Mortgage |
| Less than $10,000 | 0 (0.0%) | 13 (2.4%) |
| $10,000 to $24,999 | 5 (3.3%) | 25 (4.5%) |
| $25,000 to $34,999 | 0 (0.0%) | 6 (1.1%) |
| $35,000 to $49,999 | 18 (11.7%) | 44 (8.0%) |
| $50,000 to $74,999 | 32 (20.8%) | 22 (4.0%) |
| $75,000 to $99,999 | 16 (10.4%) | 57 (10.3%) |
| $100,000 to $149,999 | 60 (39.0%) | 182 (32.9%) |
| $150,000 or more | 23 (14.9%) | 126 (22.8%) |
| Total | 154 (100.0%) | 553 (100.0%) |
Property Value to Household Income Ratio in Manchester borough
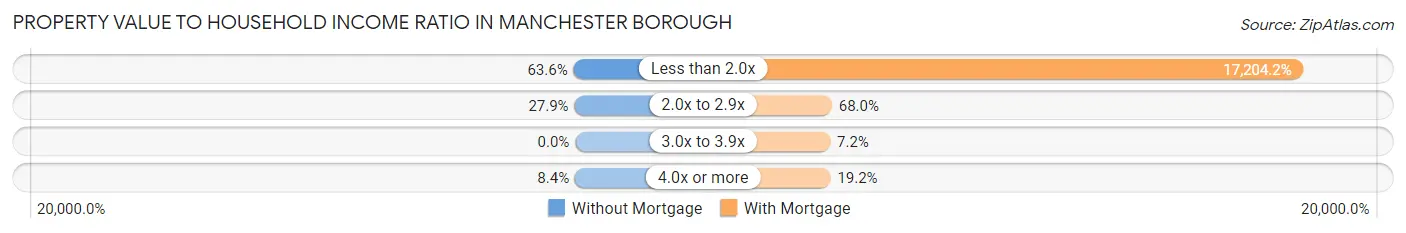
| Value-to-Income Ratio | Without Mortgage | With Mortgage |
| Less than 2.0x | 98 (63.6%) | 95,139 (17,204.2%) |
| 2.0x to 2.9x | 43 (27.9%) | 376 (68.0%) |
| 3.0x to 3.9x | 0 (0.0%) | 40 (7.2%) |
| 4.0x or more | 13 (8.4%) | 106 (19.2%) |
| Total | 154 (100.0%) | 553 (100.0%) |
Real Estate Taxes by Mortgage Status in Manchester borough
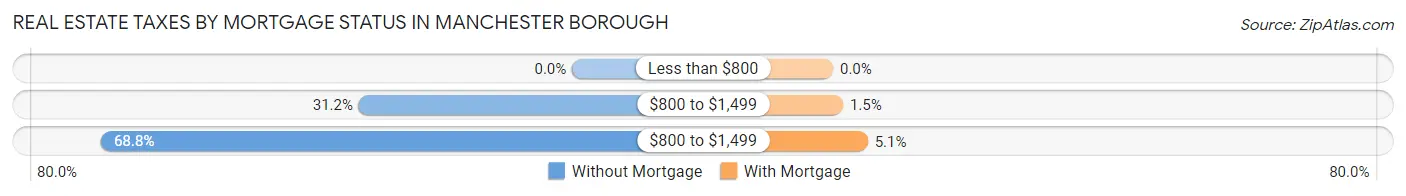
| Property Taxes | Without Mortgage | With Mortgage |
| Less than $800 | 0 (0.0%) | 0 (0.0%) |
| $800 to $1,499 | 48 (31.2%) | 8 (1.5%) |
| $800 to $1,499 | 106 (68.8%) | 28 (5.1%) |
| Total | 154 (100.0%) | 553 (100.0%) |
Health & Disability in Manchester borough
Health Insurance Coverage by Age in Manchester borough
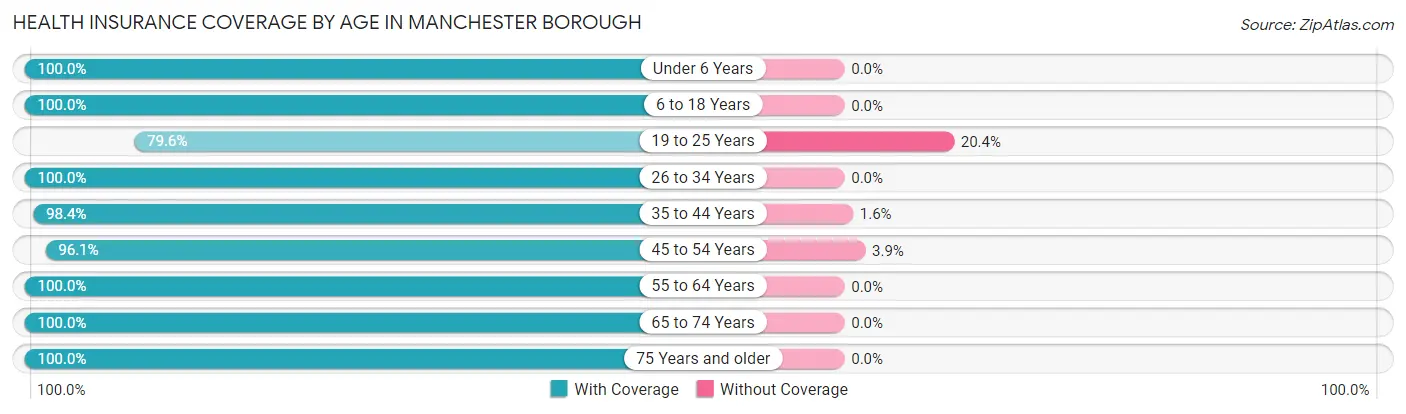
| Age Bracket | With Coverage | Without Coverage |
| Under 6 Years | 253 (100.0%) | 0 (0.0%) |
| 6 to 18 Years | 300 (100.0%) | 0 (0.0%) |
| 19 to 25 Years | 304 (79.6%) | 78 (20.4%) |
| 26 to 34 Years | 257 (100.0%) | 0 (0.0%) |
| 35 to 44 Years | 370 (98.4%) | 6 (1.6%) |
| 45 to 54 Years | 248 (96.1%) | 10 (3.9%) |
| 55 to 64 Years | 478 (100.0%) | 0 (0.0%) |
| 65 to 74 Years | 367 (100.0%) | 0 (0.0%) |
| 75 Years and older | 131 (100.0%) | 0 (0.0%) |
| Total | 2,708 (96.7%) | 94 (3.4%) |
Health Insurance Coverage by Citizenship Status in Manchester borough
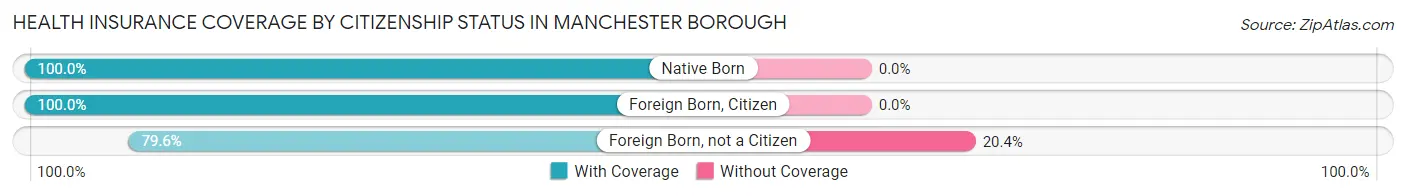
| Citizenship Status | With Coverage | Without Coverage |
| Native Born | 253 (100.0%) | 0 (0.0%) |
| Foreign Born, Citizen | 300 (100.0%) | 0 (0.0%) |
| Foreign Born, not a Citizen | 304 (79.6%) | 78 (20.4%) |
Health Insurance Coverage by Household Income in Manchester borough
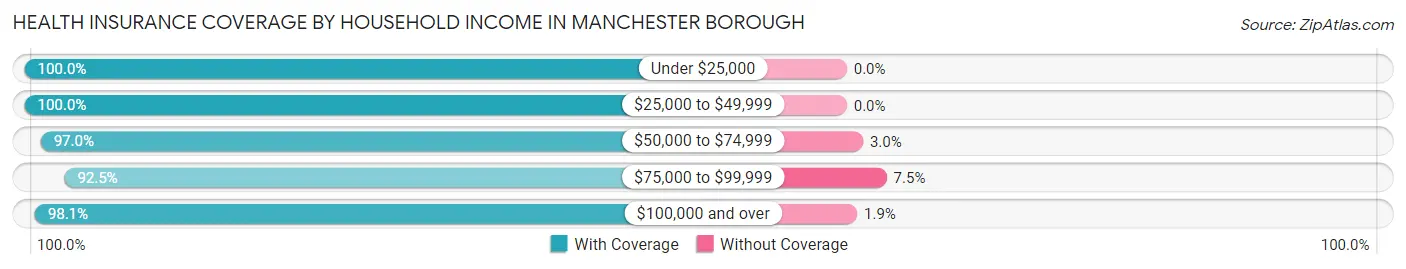
| Household Income | With Coverage | Without Coverage |
| Under $25,000 | 324 (100.0%) | 0 (0.0%) |
| $25,000 to $49,999 | 370 (100.0%) | 0 (0.0%) |
| $50,000 to $74,999 | 384 (97.0%) | 12 (3.0%) |
| $75,000 to $99,999 | 817 (92.5%) | 66 (7.5%) |
| $100,000 and over | 813 (98.1%) | 16 (1.9%) |
Public vs Private Health Insurance Coverage by Age in Manchester borough
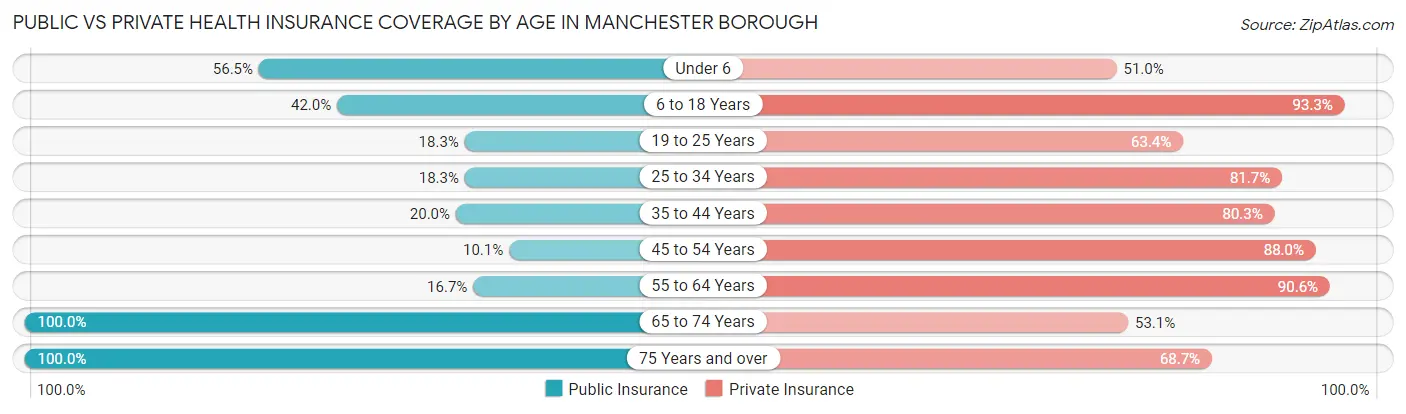
| Age Bracket | Public Insurance | Private Insurance |
| Under 6 | 143 (56.5%) | 129 (51.0%) |
| 6 to 18 Years | 126 (42.0%) | 280 (93.3%) |
| 19 to 25 Years | 70 (18.3%) | 242 (63.3%) |
| 25 to 34 Years | 47 (18.3%) | 210 (81.7%) |
| 35 to 44 Years | 75 (20.0%) | 302 (80.3%) |
| 45 to 54 Years | 26 (10.1%) | 227 (88.0%) |
| 55 to 64 Years | 80 (16.7%) | 433 (90.6%) |
| 65 to 74 Years | 367 (100.0%) | 195 (53.1%) |
| 75 Years and over | 131 (100.0%) | 90 (68.7%) |
| Total | 1,065 (38.0%) | 2,108 (75.2%) |
Disability Status by Sex by Age in Manchester borough
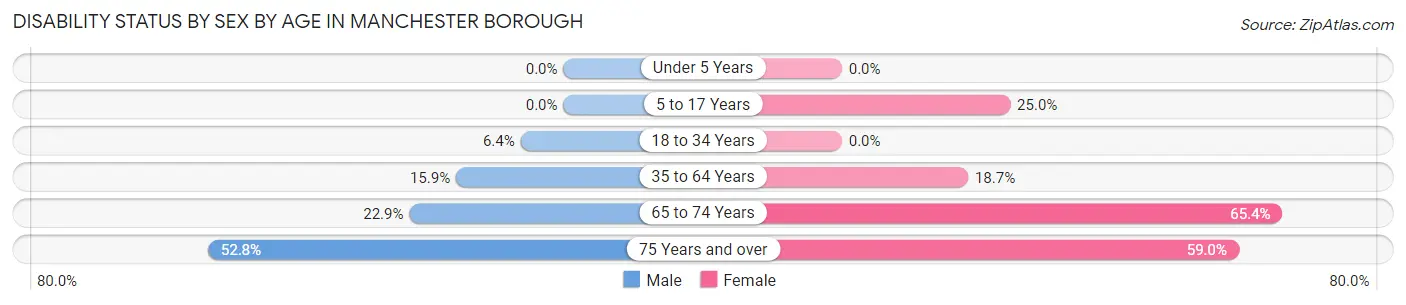
| Age Bracket | Male | Female |
| Under 5 Years | 0 (0.0%) | 0 (0.0%) |
| 5 to 17 Years | 0 (0.0%) | 20 (25.0%) |
| 18 to 34 Years | 15 (6.4%) | 0 (0.0%) |
| 35 to 64 Years | 99 (15.9%) | 92 (18.7%) |
| 65 to 74 Years | 35 (22.9%) | 140 (65.4%) |
| 75 Years and over | 19 (52.8%) | 56 (59.0%) |
Disability Class by Sex by Age in Manchester borough
Disability Class: Hearing Difficulty
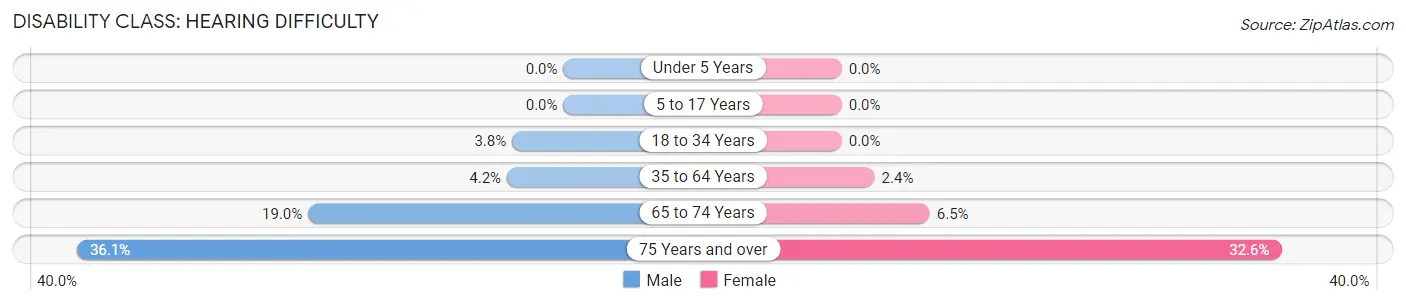
| Age Bracket | Male | Female |
| Under 5 Years | 0 (0.0%) | 0 (0.0%) |
| 5 to 17 Years | 0 (0.0%) | 0 (0.0%) |
| 18 to 34 Years | 9 (3.8%) | 0 (0.0%) |
| 35 to 64 Years | 26 (4.2%) | 12 (2.4%) |
| 65 to 74 Years | 29 (19.0%) | 14 (6.5%) |
| 75 Years and over | 13 (36.1%) | 31 (32.6%) |
Disability Class: Vision Difficulty
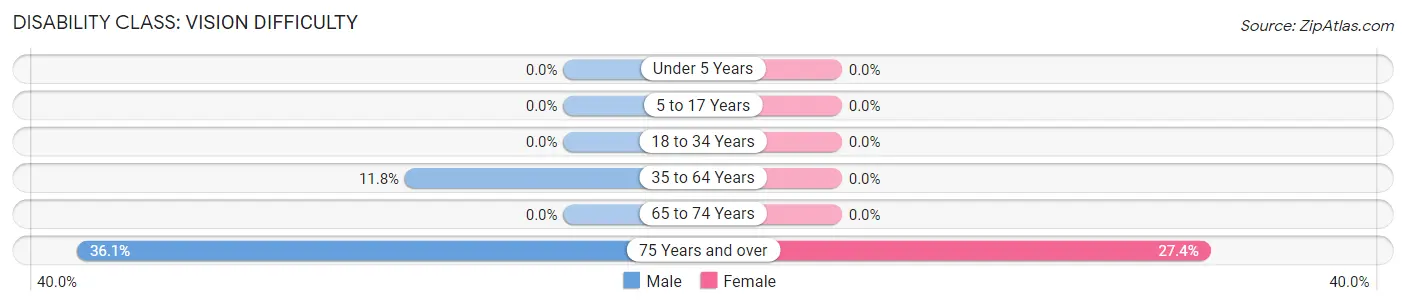
| Age Bracket | Male | Female |
| Under 5 Years | 0 (0.0%) | 0 (0.0%) |
| 5 to 17 Years | 0 (0.0%) | 0 (0.0%) |
| 18 to 34 Years | 0 (0.0%) | 0 (0.0%) |
| 35 to 64 Years | 73 (11.8%) | 0 (0.0%) |
| 65 to 74 Years | 0 (0.0%) | 0 (0.0%) |
| 75 Years and over | 13 (36.1%) | 26 (27.4%) |
Disability Class: Cognitive Difficulty
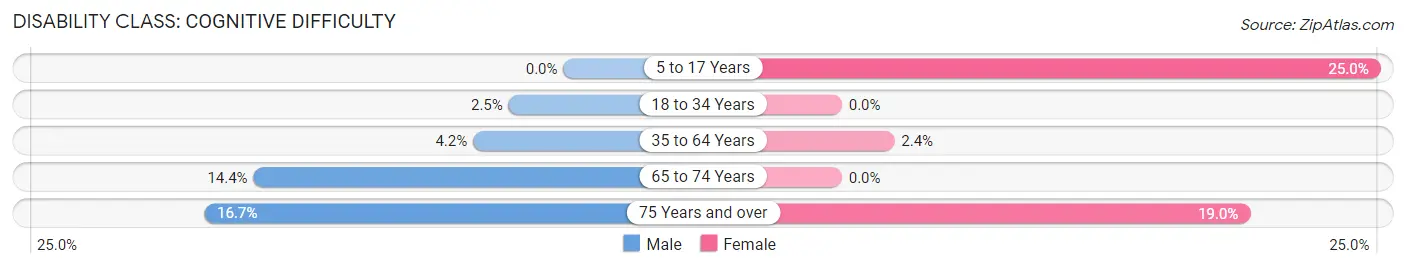
| Age Bracket | Male | Female |
| 5 to 17 Years | 0 (0.0%) | 20 (25.0%) |
| 18 to 34 Years | 6 (2.5%) | 0 (0.0%) |
| 35 to 64 Years | 26 (4.2%) | 12 (2.4%) |
| 65 to 74 Years | 22 (14.4%) | 0 (0.0%) |
| 75 Years and over | 6 (16.7%) | 18 (19.0%) |
Disability Class: Ambulatory Difficulty
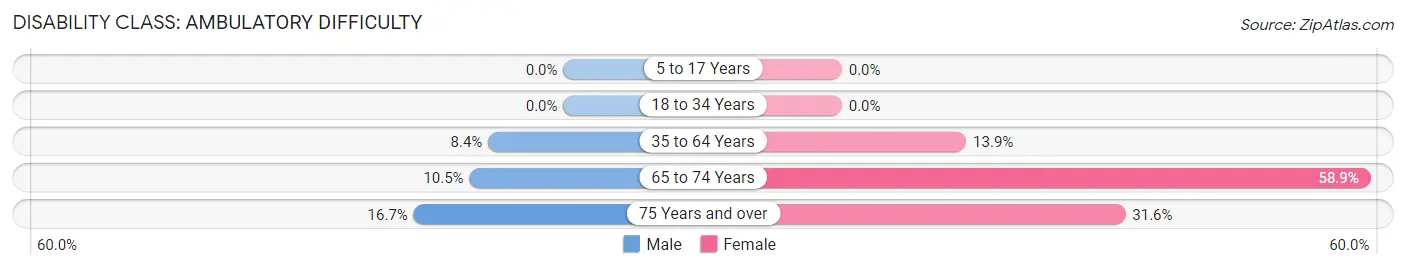
| Age Bracket | Male | Female |
| 5 to 17 Years | 0 (0.0%) | 0 (0.0%) |
| 18 to 34 Years | 0 (0.0%) | 0 (0.0%) |
| 35 to 64 Years | 52 (8.4%) | 68 (13.9%) |
| 65 to 74 Years | 16 (10.5%) | 126 (58.9%) |
| 75 Years and over | 6 (16.7%) | 30 (31.6%) |
Disability Class: Self-Care Difficulty
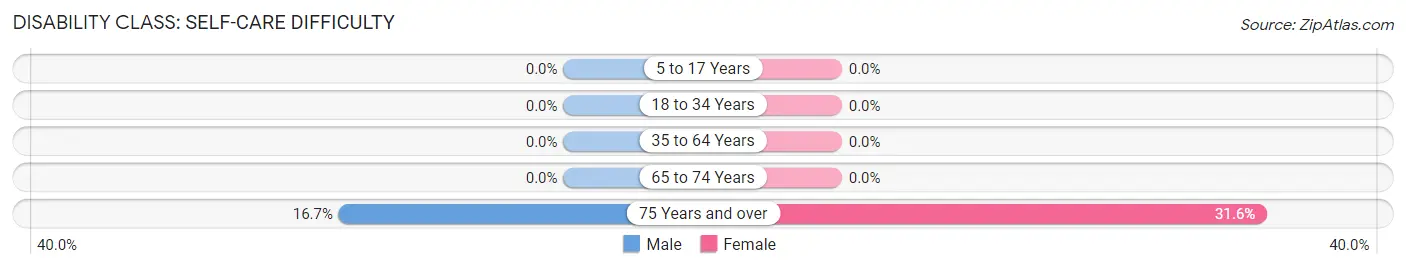
| Age Bracket | Male | Female |
| 5 to 17 Years | 0 (0.0%) | 0 (0.0%) |
| 18 to 34 Years | 0 (0.0%) | 0 (0.0%) |
| 35 to 64 Years | 0 (0.0%) | 0 (0.0%) |
| 65 to 74 Years | 0 (0.0%) | 0 (0.0%) |
| 75 Years and over | 6 (16.7%) | 30 (31.6%) |
Technology Access in Manchester borough
Computing Device Access in Manchester borough
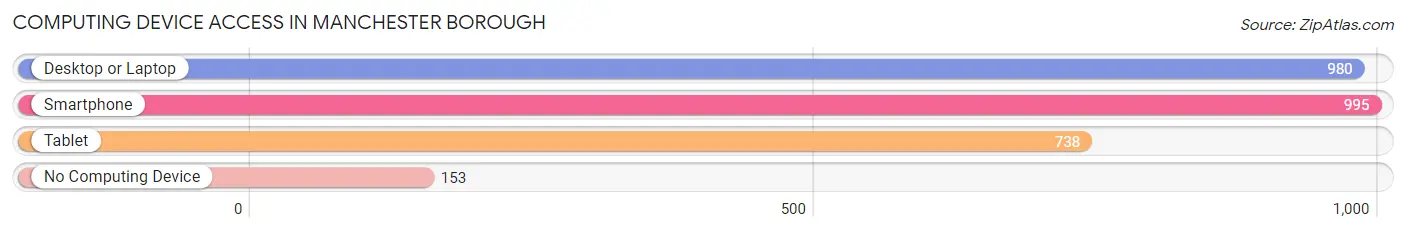
| Device Type | # Households | % Households |
| Desktop or Laptop | 980 | 76.1% |
| Smartphone | 995 | 77.3% |
| Tablet | 738 | 57.3% |
| No Computing Device | 153 | 11.9% |
| Total | 1,287 | 100.0% |
Internet Access in Manchester borough
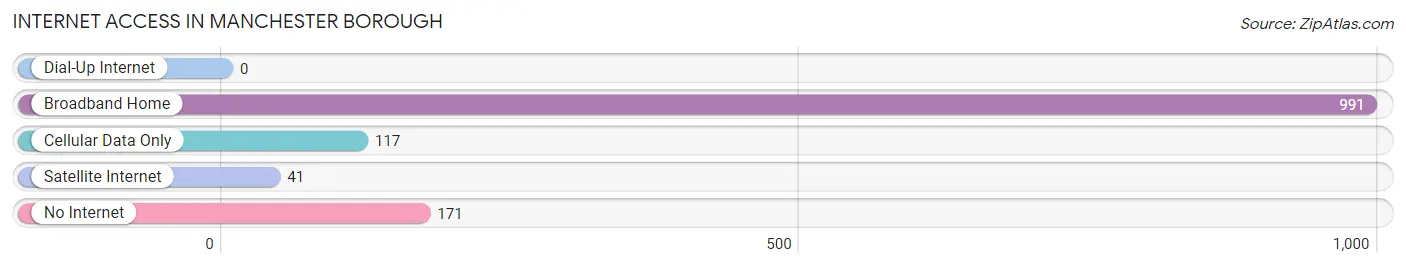
| Internet Type | # Households | % Households |
| Dial-Up Internet | 0 | 0.0% |
| Broadband Home | 991 | 77.0% |
| Cellular Data Only | 117 | 9.1% |
| Satellite Internet | 41 | 3.2% |
| No Internet | 171 | 13.3% |
| Total | 1,287 | 100.0% |
Manchester borough Summary
Municipal Borough of Manchester is a borough located in the county of Lancashire, England. It is situated in the south-west of the county, and is bordered by the cities of Salford and Bolton to the north, and the towns of Oldham and Rochdale to the east. The borough is home to a population of approximately 530,000 people, making it the third largest local authority in the county.
Geography
Manchester Borough is located in the south-west of Lancashire, and is bordered by the cities of Salford and Bolton to the north, and the towns of Oldham and Rochdale to the east. The borough is situated on the River Irwell, which flows through the centre of the borough, and is surrounded by the Pennines to the east and the Cheshire Plain to the west. The borough is divided into two distinct areas; the urban centre of Manchester, and the surrounding rural areas. The urban centre is home to the majority of the borough’s population, and is the main commercial and cultural hub of the borough. The rural areas are mainly agricultural, and are home to a number of small villages and hamlets.
History
The history of Manchester Borough dates back to the Roman period, when it was known as Mamucium. The area was an important trading post for the Romans, and was the site of a fort. The area was later occupied by the Saxons, and was known as Mameceaster. The area was then taken over by the Normans, who built a castle in the area. The area was then granted a charter in 1301, and was granted the status of a borough in 1835. The area then experienced a period of rapid growth and industrialisation during the 19th century, and was home to a number of large cotton mills and factories. The area was heavily damaged during the Second World War, but was rebuilt in the post-war period.
Economy
Manchester Borough has a diverse and vibrant economy, and is home to a number of large companies and organisations. The borough is home to a number of large financial and professional services firms, such as Deloitte, PwC, and KPMG. The borough is also home to a number of large retail and leisure companies, such as the Trafford Centre, and the Manchester Arndale Centre. The borough is also home to a number of large manufacturing companies, such as BAE Systems, Rolls-Royce, and Siemens. The borough is also home to a number of universities, such as the University of Manchester, Manchester Metropolitan University, and the University of Salford.
Demographics
As of the 2011 census, the population of Manchester Borough was 530,000. The borough is ethnically diverse, with the largest ethnic group being White British, at 63.3%. Other ethnic groups include Asian (14.2%), Black (7.2%), and Mixed (7.1%). The borough is also home to a large number of religious groups, with the largest being Christian (59.3%), followed by Muslim (14.2%), Hindu (4.2%), and Sikh (2.2%). The borough is also home to a large number of languages, with the most common being English (93.2%), followed by Urdu (2.2%), and Polish (1.2%).
Conclusion
Manchester Borough is a vibrant and diverse borough located in the county of Lancashire, England. The borough is home to a population of approximately 530,000 people, and is home to a number of large companies and organisations. The borough has a diverse economy, and is home to a number of large financial and professional services firms, as well as a number of large retail and leisure companies. The borough is also home to a number of universities, and is ethnically and religiously diverse.
Common Questions
What is the Total Population of Manchester borough?
Total Population of Manchester borough is 2,802.
What is the Total Male Population of Manchester borough?
Total Male Population of Manchester borough is 1,422.
What is the Total Female Population of Manchester borough?
Total Female Population of Manchester borough is 1,380.
What is the Ratio of Males per 100 Females in Manchester borough?
There are 103.04 Males per 100 Females in Manchester borough.
What is the Ratio of Females per 100 Males in Manchester borough?
There are 97.05 Females per 100 Males in Manchester borough.
What is the Median Population Age in Manchester borough?
Median Population Age in Manchester borough is 40.2 Years.
What is the Average Family Size in Manchester borough
Average Family Size in Manchester borough is 2.9 People.
What is the Average Household Size in Manchester borough
Average Household Size in Manchester borough is 2.2 People.
What is Per Capita Income in Manchester borough?
Per Capita income in Manchester borough is $34,649.
What is the Median Family Income in Manchester borough?
Median Family Income in Manchester borough is $93,354.
What is the Median Household income in Manchester borough?
Median Household Income in Manchester borough is $71,202.
What is Income or Wage Gap in Manchester borough?
Income or Wage Gap in Manchester borough is 60.4%.
Women in Manchester borough earn 39.6 cents for every dollar earned by a man.
What is Inequality or Gini Index in Manchester borough?
Inequality or Gini Index in Manchester borough is 0.40.
How Large is the Labor Force in Manchester borough?
There are 1,478 People in the Labor Forcein in Manchester borough.
What is the Percentage of People in the Labor Force in Manchester borough?
65.2% of People are in the Labor Force in Manchester borough.
What is the Unemployment Rate in Manchester borough?
Unemployment Rate in Manchester borough is 1.8%.