Oliver, PA
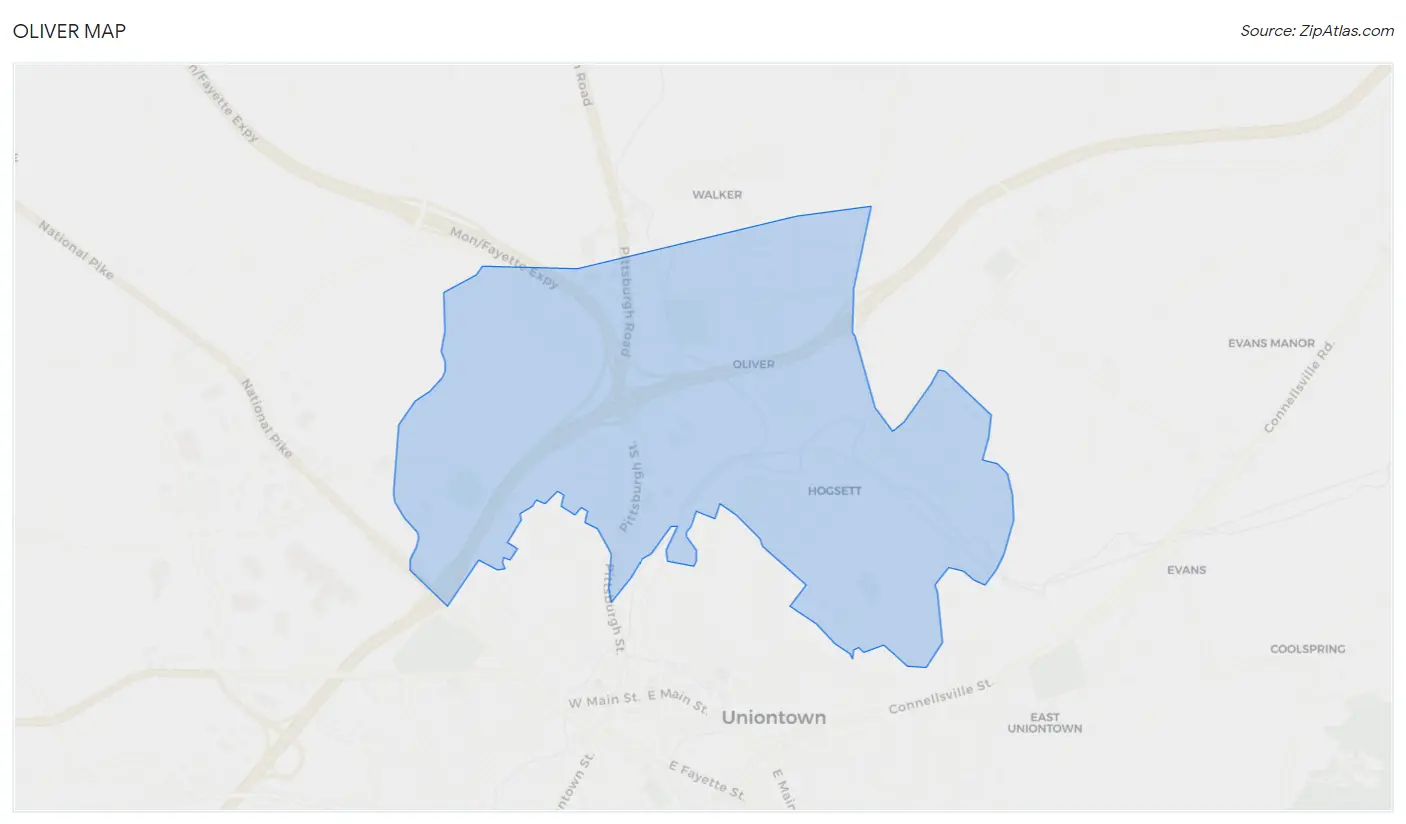
Oliver Map
Oliver Overview
2,283
TOTAL POPULATION
1,117
MALE POPULATION
1,166
FEMALE POPULATION
95.80
MALES / 100 FEMALES
104.39
FEMALES / 100 MALES
49.7
MEDIAN AGE
2.6
AVG FAMILY SIZE
1.7
AVG HOUSEHOLD SIZE
$31,563
PER CAPITA INCOME
$57,750
AVG FAMILY INCOME
$51,301
AVG HOUSEHOLD INCOME
16.5%
WAGE / INCOME GAP [ % ]
83.5¢/ $1
WAGE / INCOME GAP [ $ ]
0.41
INEQUALITY / GINI INDEX
1,205
LABOR FORCE [ PEOPLE ]
61.2%
PERCENT IN LABOR FORCE
6.4%
UNEMPLOYMENT RATE
Oliver Zip Codes
Oliver Area Codes
Race in Oliver
The most populous races in Oliver are White / Caucasian (2,090 | 91.5%), Hispanic or Latino (129 | 5.7%), and Black / African American (102 | 4.5%).
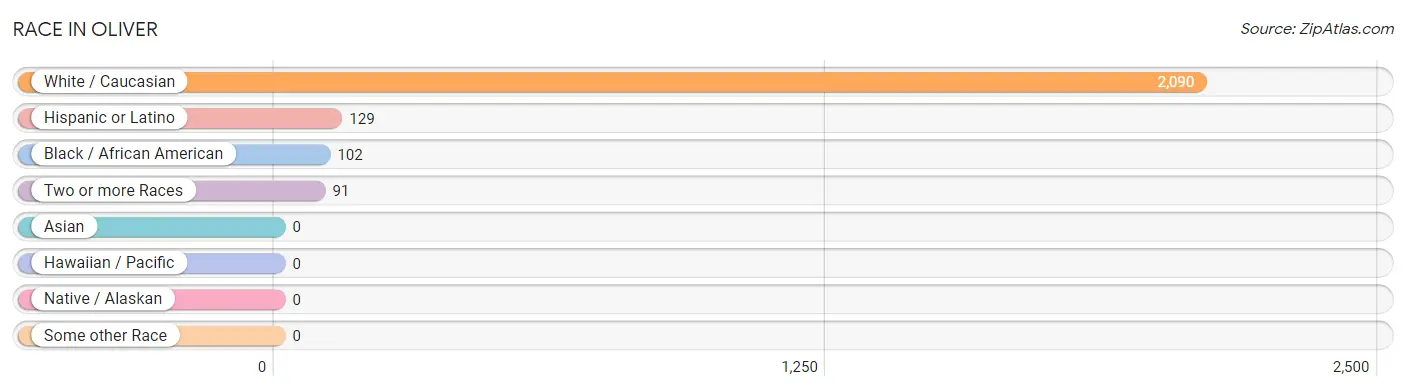
| Race | # Population | % Population |
| Asian | 0 | 0.0% |
| Black / African American | 102 | 4.5% |
| Hawaiian / Pacific | 0 | 0.0% |
| Hispanic or Latino | 129 | 5.7% |
| Native / Alaskan | 0 | 0.0% |
| White / Caucasian | 2,090 | 91.5% |
| Two or more Races | 91 | 4.0% |
| Some other Race | 0 | 0.0% |
| Total | 2,283 | 100.0% |
Ancestry in Oliver
The most populous ancestries reported in Oliver are Italian (363 | 15.9%), English (345 | 15.1%), Irish (328 | 14.4%), Polish (245 | 10.7%), and German (217 | 9.5%), together accounting for 65.6% of all Oliver residents.
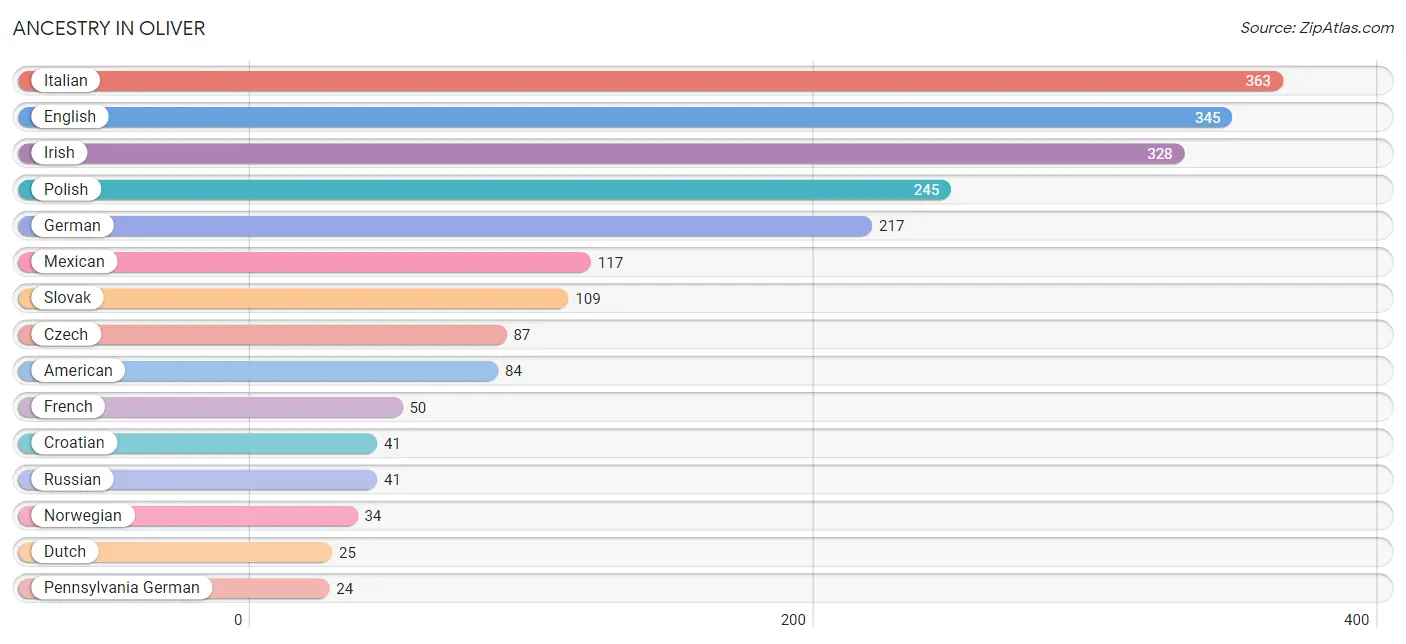
| Ancestry | # Population | % Population |
| American | 84 | 3.7% |
| Arab | 11 | 0.5% |
| Cherokee | 7 | 0.3% |
| Croatian | 41 | 1.8% |
| Czech | 87 | 3.8% |
| Dutch | 25 | 1.1% |
| English | 345 | 15.1% |
| French | 50 | 2.2% |
| German | 217 | 9.5% |
| Irish | 328 | 14.4% |
| Italian | 363 | 15.9% |
| Lebanese | 11 | 0.5% |
| Mexican | 117 | 5.1% |
| Norwegian | 34 | 1.5% |
| Pennsylvania German | 24 | 1.1% |
| Polish | 245 | 10.7% |
| Romanian | 12 | 0.5% |
| Russian | 41 | 1.8% |
| Slovak | 109 | 4.8% |
| Swiss | 11 | 0.5% | View All 20 Rows |
Immigrants in Oliver
The most numerous immigrant groups reported in Oliver came from Central America (71 | 3.1%), Latin America (71 | 3.1%), Mexico (71 | 3.1%), Europe (15 | 0.7%), and Northern Europe (12 | 0.5%), together accounting for 10.5% of all Oliver residents.
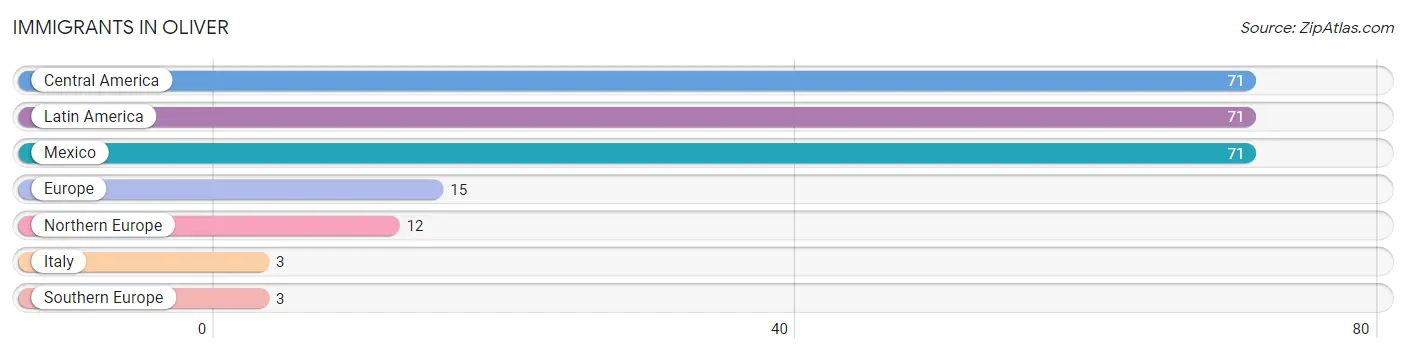
| Immigration Origin | # Population | % Population |
| Central America | 71 | 3.1% |
| Europe | 15 | 0.7% |
| Italy | 3 | 0.1% |
| Latin America | 71 | 3.1% |
| Mexico | 71 | 3.1% |
| Northern Europe | 12 | 0.5% |
| Southern Europe | 3 | 0.1% | View All 7 Rows |
Sex and Age in Oliver
Sex and Age in Oliver
The most populous age groups in Oliver are 30 to 34 Years (189 | 16.9%) for men and 55 to 59 Years (128 | 11.0%) for women.
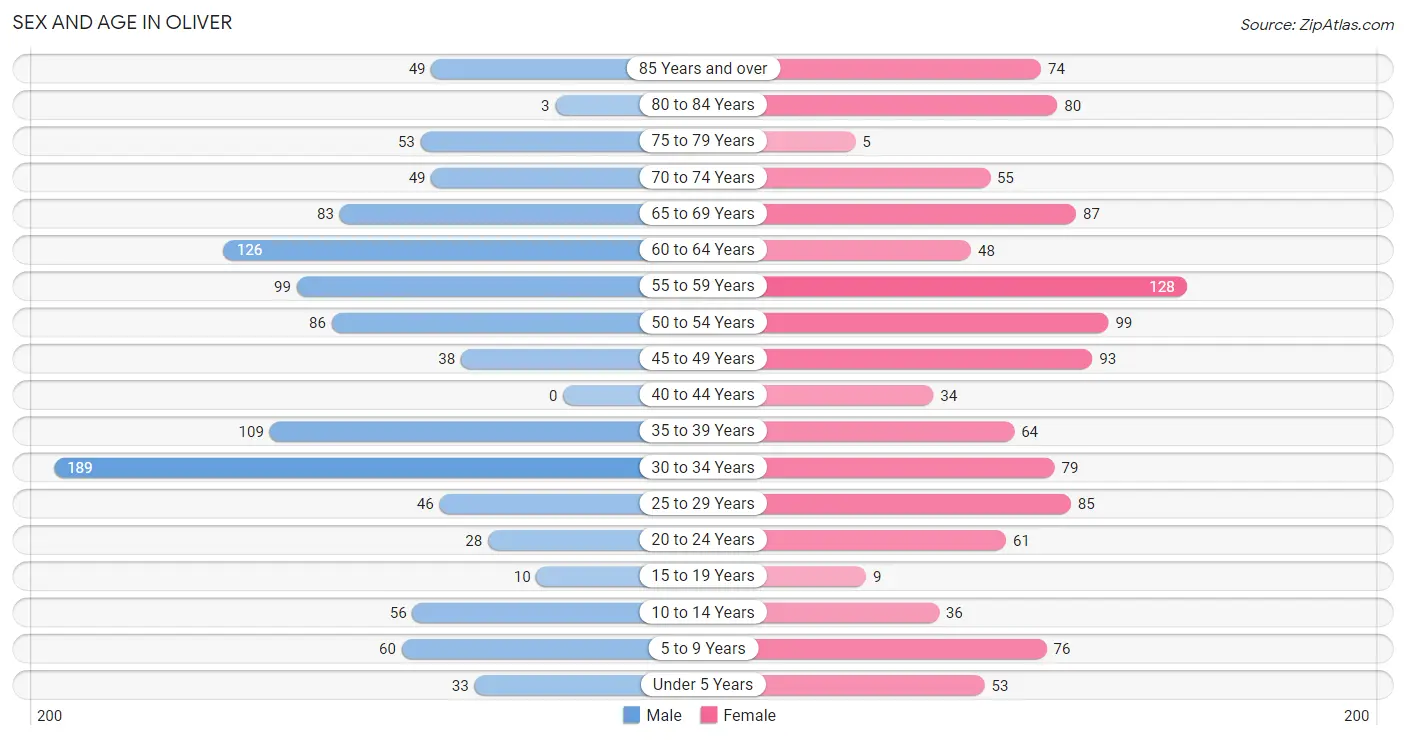
| Age Bracket | Male | Female |
| Under 5 Years | 33 (2.9%) | 53 (4.5%) |
| 5 to 9 Years | 60 (5.4%) | 76 (6.5%) |
| 10 to 14 Years | 56 (5.0%) | 36 (3.1%) |
| 15 to 19 Years | 10 (0.9%) | 9 (0.8%) |
| 20 to 24 Years | 28 (2.5%) | 61 (5.2%) |
| 25 to 29 Years | 46 (4.1%) | 85 (7.3%) |
| 30 to 34 Years | 189 (16.9%) | 79 (6.8%) |
| 35 to 39 Years | 109 (9.8%) | 64 (5.5%) |
| 40 to 44 Years | 0 (0.0%) | 34 (2.9%) |
| 45 to 49 Years | 38 (3.4%) | 93 (8.0%) |
| 50 to 54 Years | 86 (7.7%) | 99 (8.5%) |
| 55 to 59 Years | 99 (8.9%) | 128 (11.0%) |
| 60 to 64 Years | 126 (11.3%) | 48 (4.1%) |
| 65 to 69 Years | 83 (7.4%) | 87 (7.5%) |
| 70 to 74 Years | 49 (4.4%) | 55 (4.7%) |
| 75 to 79 Years | 53 (4.7%) | 5 (0.4%) |
| 80 to 84 Years | 3 (0.3%) | 80 (6.9%) |
| 85 Years and over | 49 (4.4%) | 74 (6.4%) |
| Total | 1,117 (100.0%) | 1,166 (100.0%) |
Families and Households in Oliver
Median Family Size in Oliver
The median family size in Oliver is 2.62 persons per family, with married-couple families (345 | 70.1%) accounting for the largest median family size of 2.81 persons per family. On the other hand, single male/father families (35 | 7.1%) represent the smallest median family size with 2.09 persons per family.
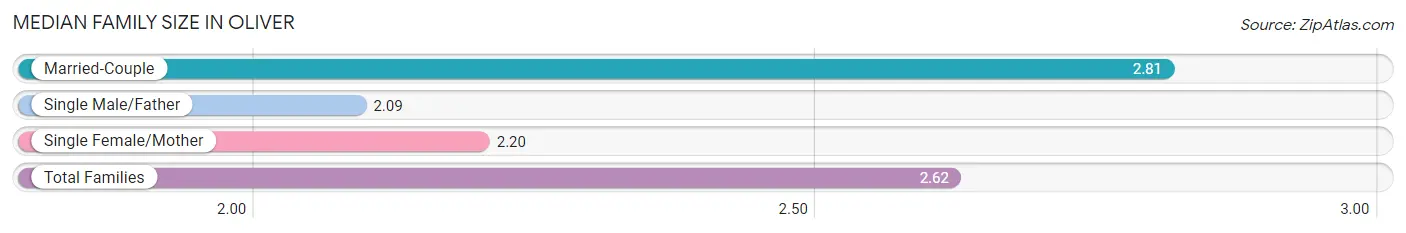
| Family Type | # Families | Family Size |
| Married-Couple | 345 (70.1%) | 2.81 |
| Single Male/Father | 35 (7.1%) | 2.09 |
| Single Female/Mother | 112 (22.8%) | 2.20 |
| Total Families | 492 (100.0%) | 2.62 |
Median Household Size in Oliver
The median household size in Oliver is 1.74 persons per household, with single male/father households (35 | 2.9%) accounting for the largest median household size of 2.86 persons per household. non-family households (709 | 59.0%) represent the smallest median household size with 1.06 persons per household.
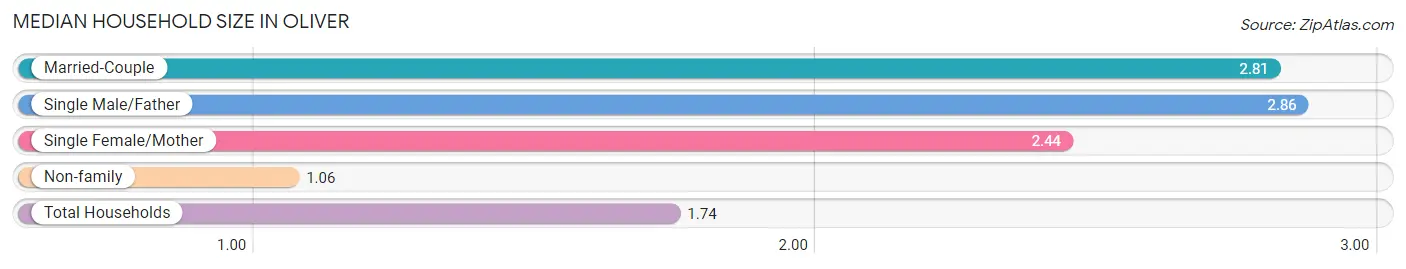
| Household Type | # Households | Household Size |
| Married-Couple | 345 (28.7%) | 2.81 |
| Single Male/Father | 35 (2.9%) | 2.86 |
| Single Female/Mother | 112 (9.3%) | 2.44 |
| Non-family | 709 (59.0%) | 1.06 |
| Total Households | 1,201 (100.0%) | 1.74 |
Household Size by Marriage Status in Oliver
Out of a total of 1,201 households in Oliver, 492 (41.0%) are family households, while 709 (59.0%) are nonfamily households. The most numerous type of family households are 2-person households, comprising 335, and the most common type of nonfamily households are 1-person households, comprising 660.
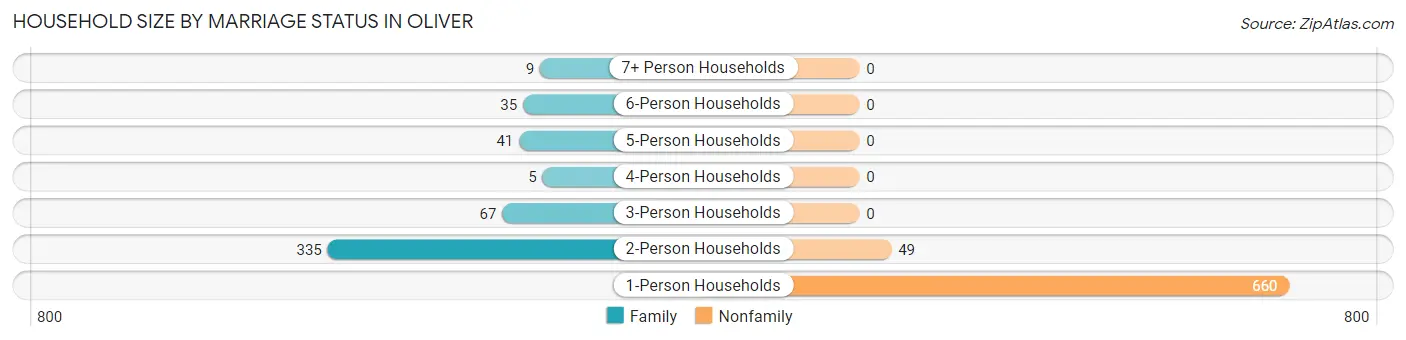
| Household Size | Family Households | Nonfamily Households |
| 1-Person Households | - | 660 (54.9%) |
| 2-Person Households | 335 (27.9%) | 49 (4.1%) |
| 3-Person Households | 67 (5.6%) | 0 (0.0%) |
| 4-Person Households | 5 (0.4%) | 0 (0.0%) |
| 5-Person Households | 41 (3.4%) | 0 (0.0%) |
| 6-Person Households | 35 (2.9%) | 0 (0.0%) |
| 7+ Person Households | 9 (0.7%) | 0 (0.0%) |
| Total | 492 (41.0%) | 709 (59.0%) |
Female Fertility in Oliver
Fertility by Age in Oliver
Average fertility rate in Oliver is 51.0 births per 1,000 women. Women in the age bracket of 20 to 34 years have the highest fertility rate with 102.0 births per 1,000 women. Women in the age bracket of 20 to 34 years acount for 100.0% of all women with births.
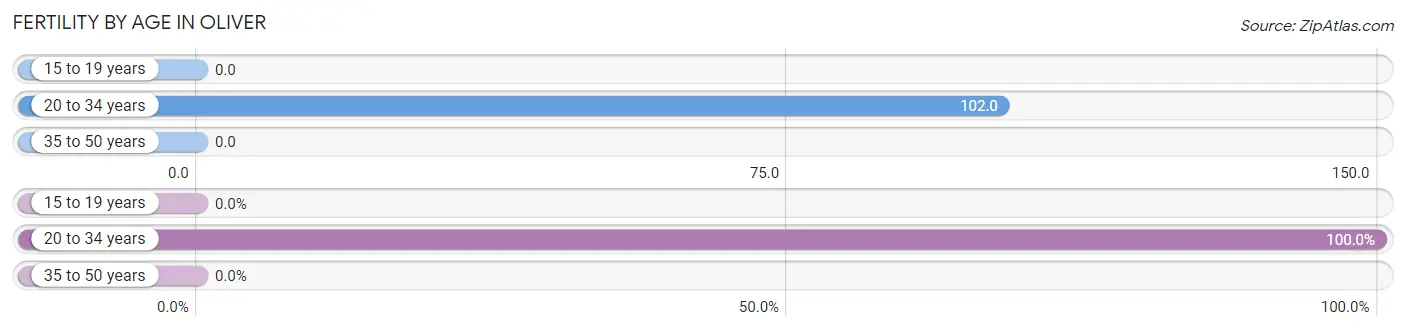
| Age Bracket | Women with Births | Births / 1,000 Women |
| 15 to 19 years | 0 (0.0%) | 0.0 |
| 20 to 34 years | 23 (100.0%) | 102.0 |
| 35 to 50 years | 0 (0.0%) | 0.0 |
| Total | 23 (100.0%) | 51.0 |
Fertility by Age by Marriage Status in Oliver
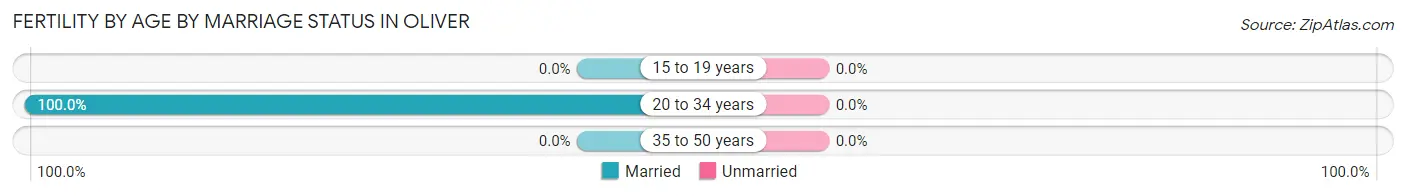
| Age Bracket | Married | Unmarried |
| 15 to 19 years | 0 (0.0%) | 0 (0.0%) |
| 20 to 34 years | 23 (100.0%) | 0 (0.0%) |
| 35 to 50 years | 0 (0.0%) | 0 (0.0%) |
| Total | 23 (100.0%) | 0 (0.0%) |
Fertility by Education in Oliver
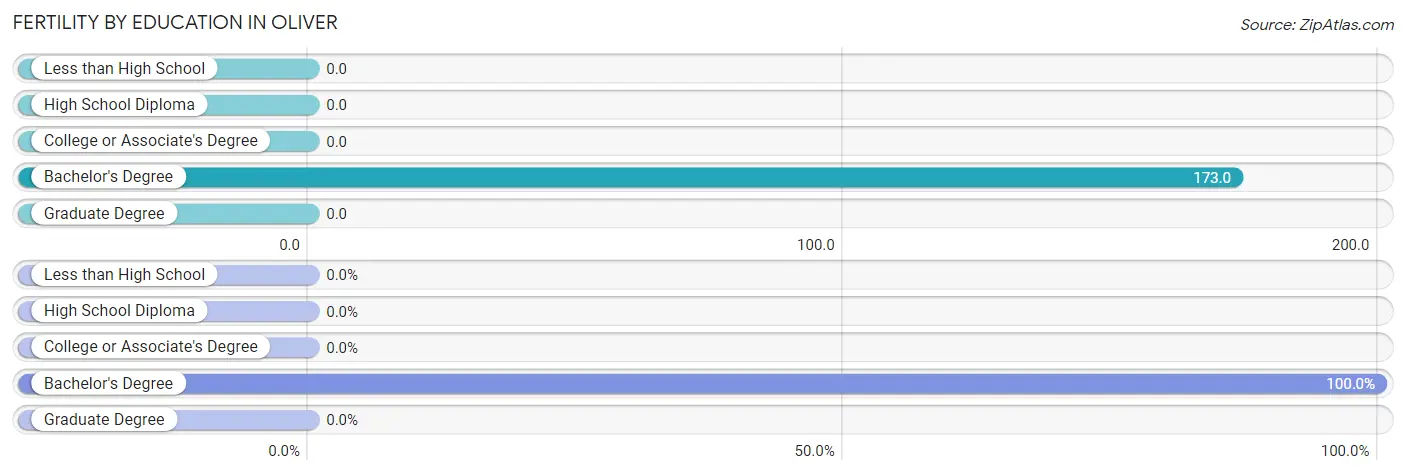
| Educational Attainment | Women with Births | Births / 1,000 Women |
| Less than High School | 0 (0.0%) | 0.0 |
| High School Diploma | 0 (0.0%) | 0.0 |
| College or Associate's Degree | 0 (0.0%) | 0.0 |
| Bachelor's Degree | 23 (100.0%) | 173.0 |
| Graduate Degree | 0 (0.0%) | 0.0 |
| Total | 23 (100.0%) | 51.0 |
Fertility by Education by Marriage Status in Oliver
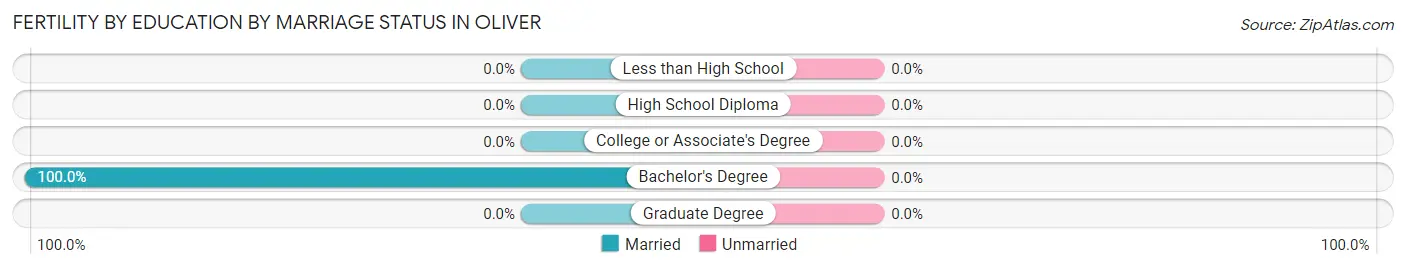
| Educational Attainment | Married | Unmarried |
| Less than High School | 0 (0.0%) | 0 (0.0%) |
| High School Diploma | 0 (0.0%) | 0 (0.0%) |
| College or Associate's Degree | 0 (0.0%) | 0 (0.0%) |
| Bachelor's Degree | 23 (100.0%) | 0 (0.0%) |
| Graduate Degree | 0 (0.0%) | 0 (0.0%) |
| Total | 23 (100.0%) | 0 (0.0%) |
Income in Oliver
Income Overview in Oliver
Per Capita Income in Oliver is $31,563, while median incomes of families and households are $57,750 and $51,301 respectively.
| Characteristic | Number | Measure |
| Per Capita Income | 2,283 | $31,563 |
| Median Family Income | 492 | $57,750 |
| Mean Family Income | 492 | $72,075 |
| Median Household Income | 1,201 | $51,301 |
| Mean Household Income | 1,201 | $59,862 |
| Income Deficit | 492 | $0 |
| Wage / Income Gap (%) | 2,283 | 16.50% |
| Wage / Income Gap ($) | 2,283 | 83.50¢ per $1 |
| Gini / Inequality Index | 2,283 | 0.41 |
Earnings by Sex in Oliver
Average Earnings in Oliver are $45,733, $50,000 for men and $41,750 for women, a difference of 16.5%.
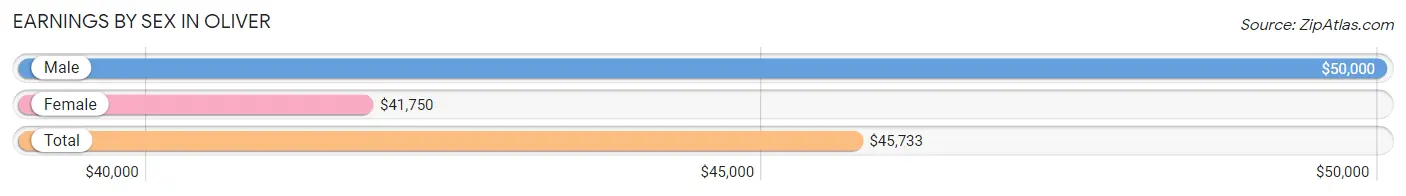
| Sex | Number | Average Earnings |
| Male | 622 (51.5%) | $50,000 |
| Female | 586 (48.5%) | $41,750 |
| Total | 1,208 (100.0%) | $45,733 |
Earnings by Sex by Income Bracket in Oliver
The most common earnings brackets in Oliver are $100,000+ for men (145 | 23.3%) and $50,000 to $54,999 for women (82 | 14.0%).
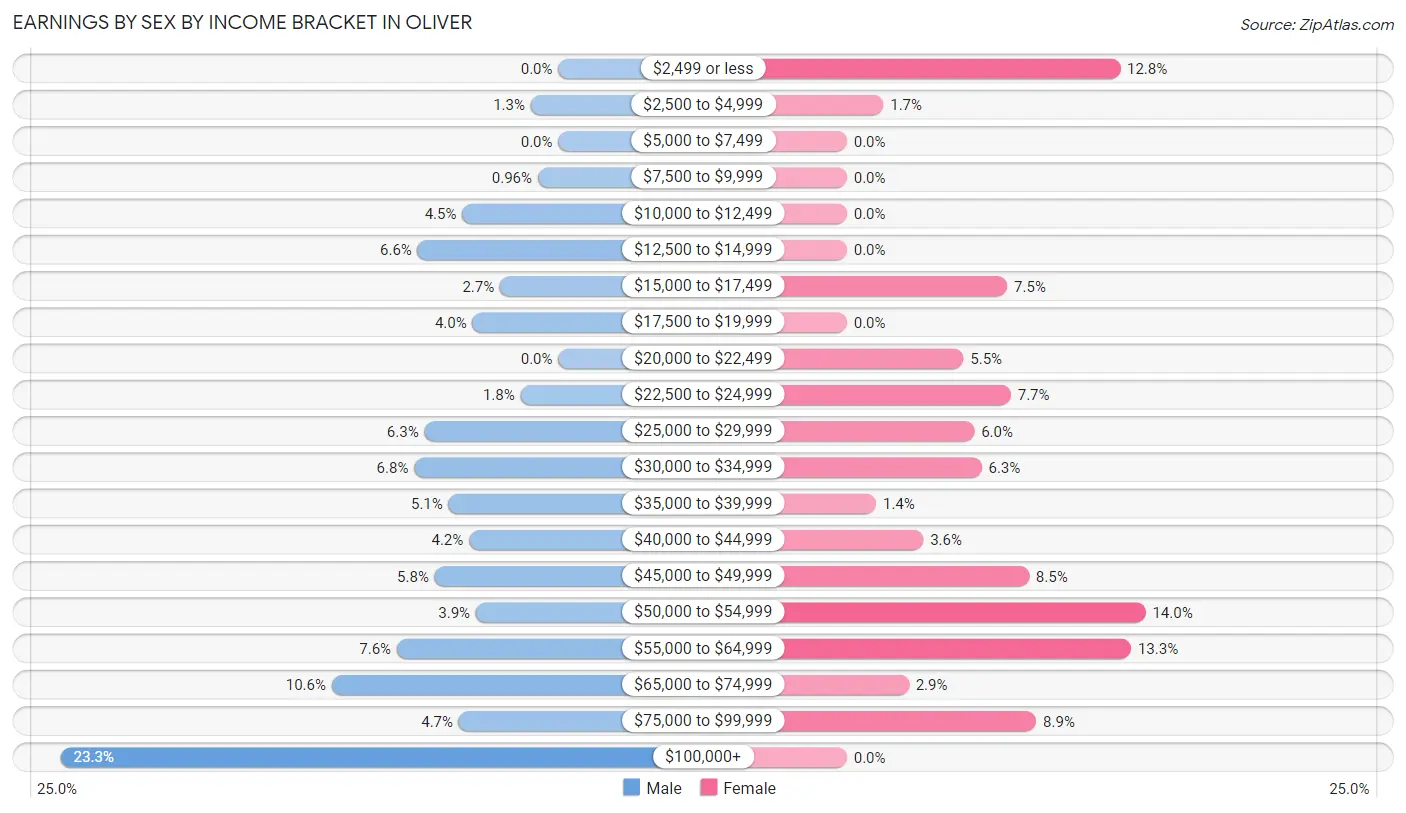
| Income | Male | Female |
| $2,499 or less | 0 (0.0%) | 75 (12.8%) |
| $2,500 to $4,999 | 8 (1.3%) | 10 (1.7%) |
| $5,000 to $7,499 | 0 (0.0%) | 0 (0.0%) |
| $7,500 to $9,999 | 6 (1.0%) | 0 (0.0%) |
| $10,000 to $12,499 | 28 (4.5%) | 0 (0.0%) |
| $12,500 to $14,999 | 41 (6.6%) | 0 (0.0%) |
| $15,000 to $17,499 | 17 (2.7%) | 44 (7.5%) |
| $17,500 to $19,999 | 25 (4.0%) | 0 (0.0%) |
| $20,000 to $22,499 | 0 (0.0%) | 32 (5.5%) |
| $22,500 to $24,999 | 11 (1.8%) | 45 (7.7%) |
| $25,000 to $29,999 | 39 (6.3%) | 35 (6.0%) |
| $30,000 to $34,999 | 42 (6.8%) | 37 (6.3%) |
| $35,000 to $39,999 | 32 (5.1%) | 8 (1.4%) |
| $40,000 to $44,999 | 26 (4.2%) | 21 (3.6%) |
| $45,000 to $49,999 | 36 (5.8%) | 50 (8.5%) |
| $50,000 to $54,999 | 24 (3.9%) | 82 (14.0%) |
| $55,000 to $64,999 | 47 (7.6%) | 78 (13.3%) |
| $65,000 to $74,999 | 66 (10.6%) | 17 (2.9%) |
| $75,000 to $99,999 | 29 (4.7%) | 52 (8.9%) |
| $100,000+ | 145 (23.3%) | 0 (0.0%) |
| Total | 622 (100.0%) | 586 (100.0%) |
Earnings by Sex by Educational Attainment in Oliver
Average earnings in Oliver are $51,458 for men and $45,625 for women, a difference of 11.3%. Men with an educational attainment of bachelor's degree enjoy the highest average annual earnings of $118,509, while those with high school diploma education earn the least with $29,000. Women with an educational attainment of bachelor's degree earn the most with the average annual earnings of $58,492, while those with high school diploma education have the smallest earnings of $23,611.
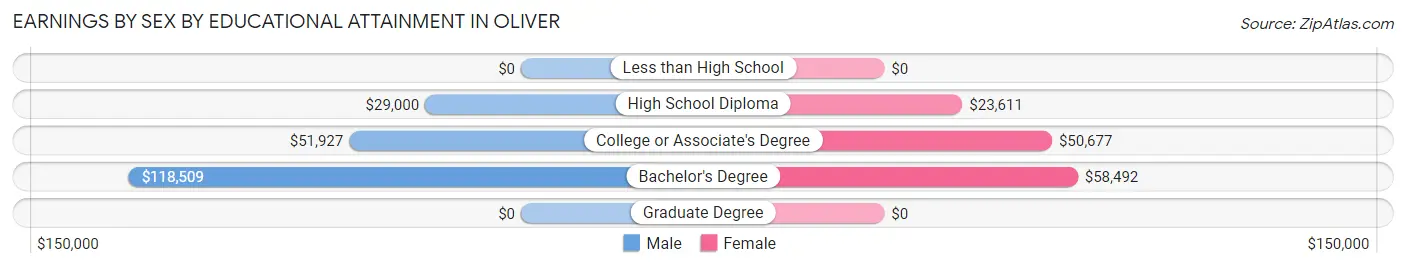
| Educational Attainment | Male Income | Female Income |
| Less than High School | - | - |
| High School Diploma | $29,000 | $23,611 |
| College or Associate's Degree | $51,927 | $50,677 |
| Bachelor's Degree | $118,509 | $58,492 |
| Graduate Degree | - | - |
| Total | $51,458 | $45,625 |
Family Income in Oliver
Family Income Brackets in Oliver
According to the Oliver family income data, there are 189 families falling into the $50,000 to $74,999 income range, which is the most common income bracket and makes up 38.4% of all families.
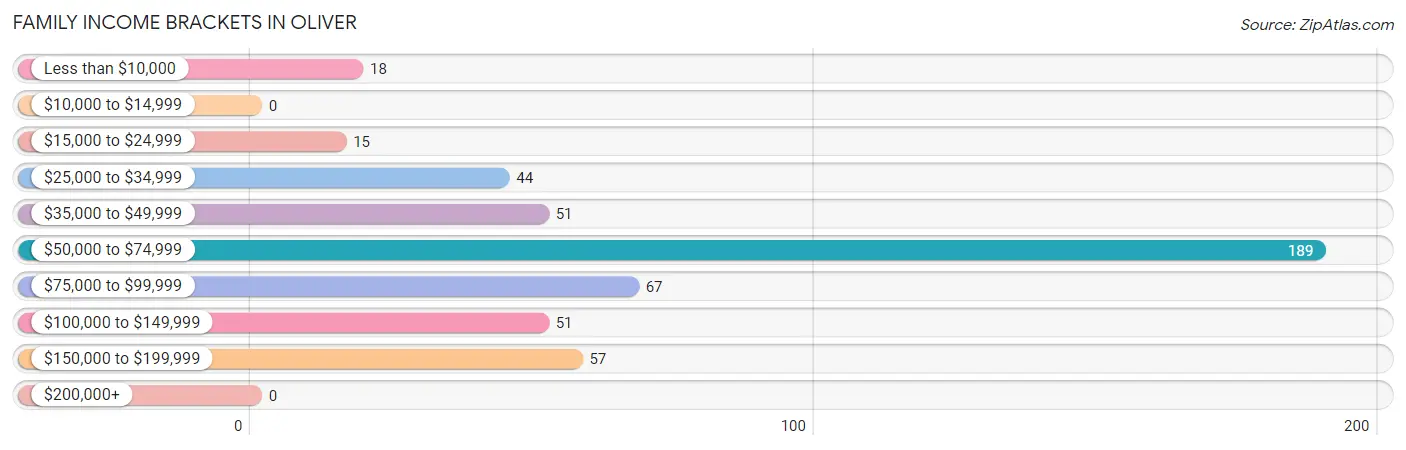
| Income Bracket | # Families | % Families |
| Less than $10,000 | 18 | 3.7% |
| $10,000 to $14,999 | 0 | 0.0% |
| $15,000 to $24,999 | 15 | 3.0% |
| $25,000 to $34,999 | 44 | 8.9% |
| $35,000 to $49,999 | 51 | 10.4% |
| $50,000 to $74,999 | 189 | 38.4% |
| $75,000 to $99,999 | 67 | 13.6% |
| $100,000 to $149,999 | 51 | 10.4% |
| $150,000 to $199,999 | 57 | 11.6% |
| $200,000+ | 0 | 0.0% |
Family Income by Famaliy Size in Oliver
3-person families (61 | 12.4%) account for the highest median family income in Oliver with $63,194 per family, while 2-person families (350 | 71.1%) have the highest median income of $26,138 per family member.
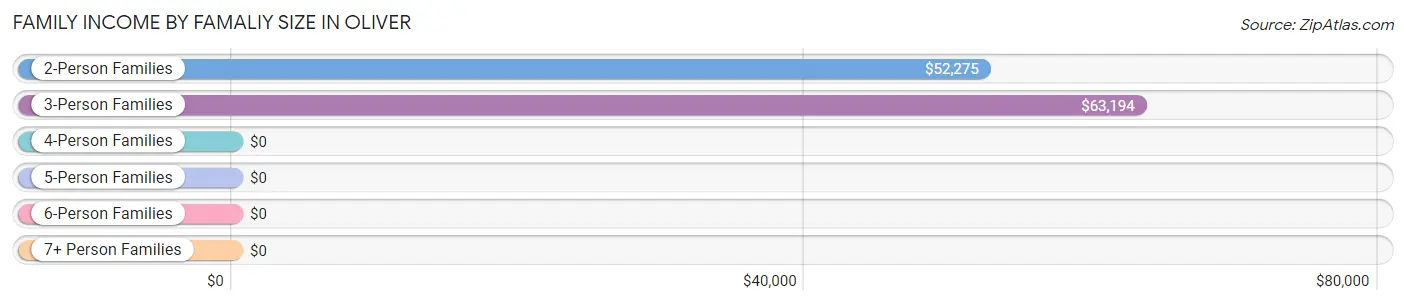
| Income Bracket | # Families | Median Income |
| 2-Person Families | 350 (71.1%) | $52,275 |
| 3-Person Families | 61 (12.4%) | $63,194 |
| 4-Person Families | 23 (4.7%) | $0 |
| 5-Person Families | 23 (4.7%) | $0 |
| 6-Person Families | 26 (5.3%) | $0 |
| 7+ Person Families | 9 (1.8%) | $0 |
| Total | 492 (100.0%) | $57,750 |
Family Income by Number of Earners in Oliver
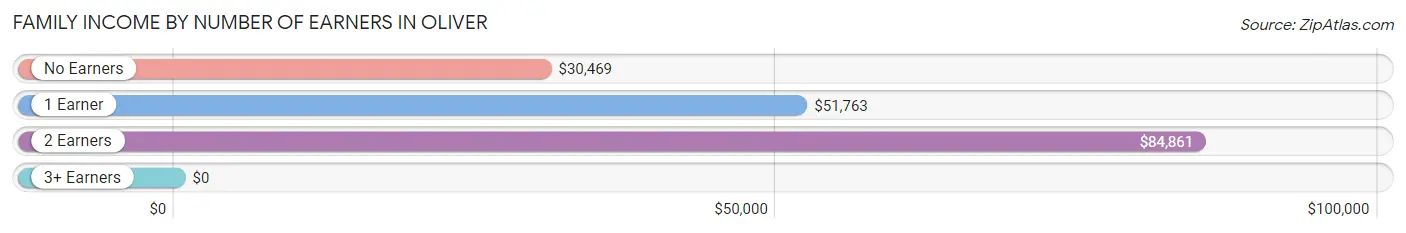
| Number of Earners | # Families | Median Income |
| No Earners | 98 (19.9%) | $30,469 |
| 1 Earner | 119 (24.2%) | $51,763 |
| 2 Earners | 251 (51.0%) | $84,861 |
| 3+ Earners | 24 (4.9%) | $0 |
| Total | 492 (100.0%) | $57,750 |
Household Income in Oliver
Household Income Brackets in Oliver
With 265 households falling in the category, the $50,000 to $74,999 income range is the most frequent in Oliver, accounting for 22.1% of all households.
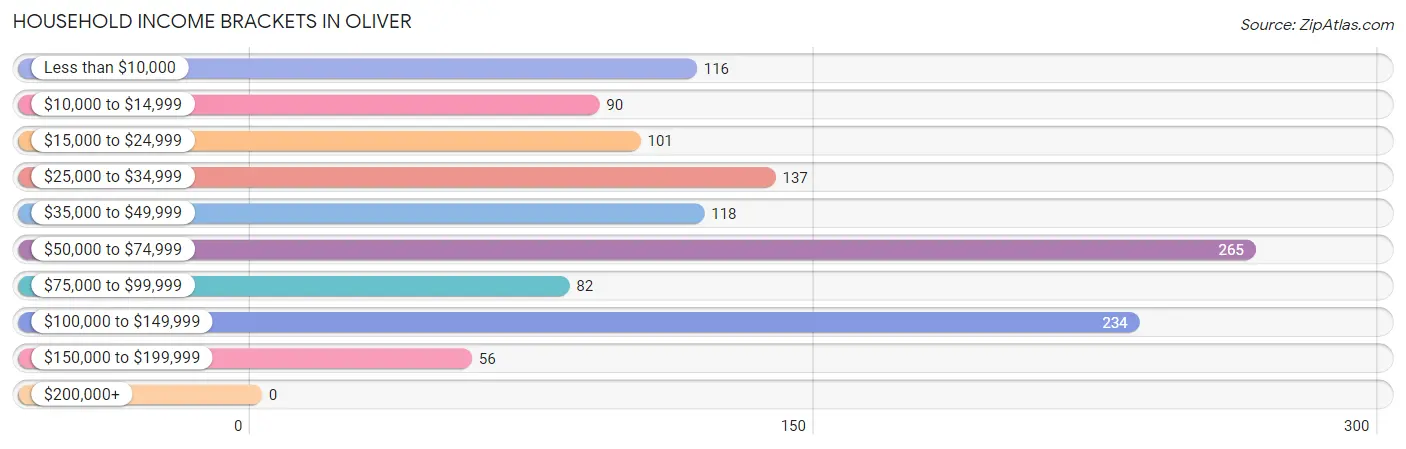
| Income Bracket | # Households | % Households |
| Less than $10,000 | 116 | 9.7% |
| $10,000 to $14,999 | 90 | 7.5% |
| $15,000 to $24,999 | 101 | 8.4% |
| $25,000 to $34,999 | 137 | 11.4% |
| $35,000 to $49,999 | 118 | 9.8% |
| $50,000 to $74,999 | 265 | 22.1% |
| $75,000 to $99,999 | 82 | 6.8% |
| $100,000 to $149,999 | 234 | 19.5% |
| $150,000 to $199,999 | 56 | 4.7% |
| $200,000+ | 0 | 0.0% |
Household Income by Householder Age in Oliver
The median household income in Oliver is $51,301, with the highest median household income of $103,333 found in the 25 to 44 years age bracket for the primary householder. A total of 366 households (30.5%) fall into this category. Meanwhile, the 15 to 24 years age bracket for the primary householder has the lowest median household income of $0, with 39 households (3.3%) in this group.
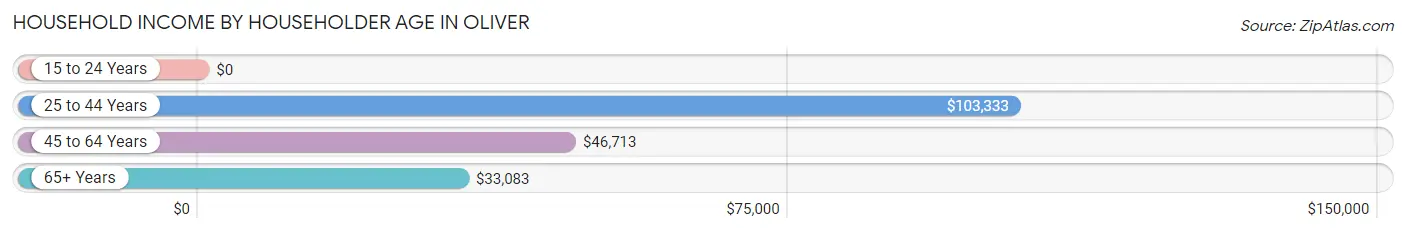
| Income Bracket | # Households | Median Income |
| 15 to 24 Years | 39 (3.3%) | $0 |
| 25 to 44 Years | 366 (30.5%) | $103,333 |
| 45 to 64 Years | 503 (41.9%) | $46,713 |
| 65+ Years | 293 (24.4%) | $33,083 |
| Total | 1,201 (100.0%) | $51,301 |
Poverty in Oliver
Income Below Poverty by Sex and Age in Oliver
With 18.8% poverty level for males and 23.0% for females among the residents of Oliver, 16 and 17 year old males and 6 to 11 year old females are the most vulnerable to poverty, with 10 males (100.0%) and 35 females (100.0%) in their respective age groups living below the poverty level.
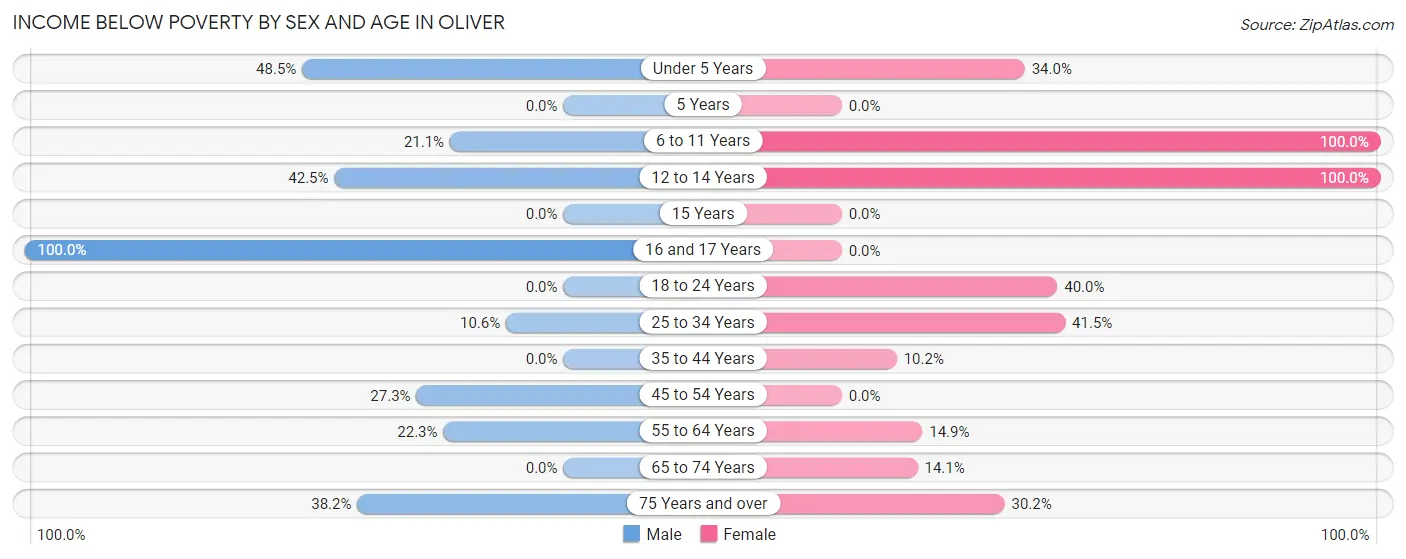
| Age Bracket | Male | Female |
| Under 5 Years | 16 (48.5%) | 18 (34.0%) |
| 5 Years | 0 (0.0%) | 0 (0.0%) |
| 6 to 11 Years | 16 (21.0%) | 35 (100.0%) |
| 12 to 14 Years | 17 (42.5%) | 11 (100.0%) |
| 15 Years | 0 (0.0%) | 0 (0.0%) |
| 16 and 17 Years | 10 (100.0%) | 0 (0.0%) |
| 18 to 24 Years | 0 (0.0%) | 28 (40.0%) |
| 25 to 34 Years | 25 (10.6%) | 68 (41.5%) |
| 35 to 44 Years | 0 (0.0%) | 10 (10.2%) |
| 45 to 54 Years | 27 (27.3%) | 0 (0.0%) |
| 55 to 64 Years | 49 (22.3%) | 26 (14.9%) |
| 65 to 74 Years | 0 (0.0%) | 18 (14.1%) |
| 75 Years and over | 39 (38.2%) | 29 (30.2%) |
| Total | 199 (18.8%) | 243 (23.0%) |
Income Above Poverty by Sex and Age in Oliver
According to the poverty statistics in Oliver, males aged 18 to 24 years and females aged 5 years are the age groups that are most secure financially, with 100.0% of males and 100.0% of females in these age groups living above the poverty line.
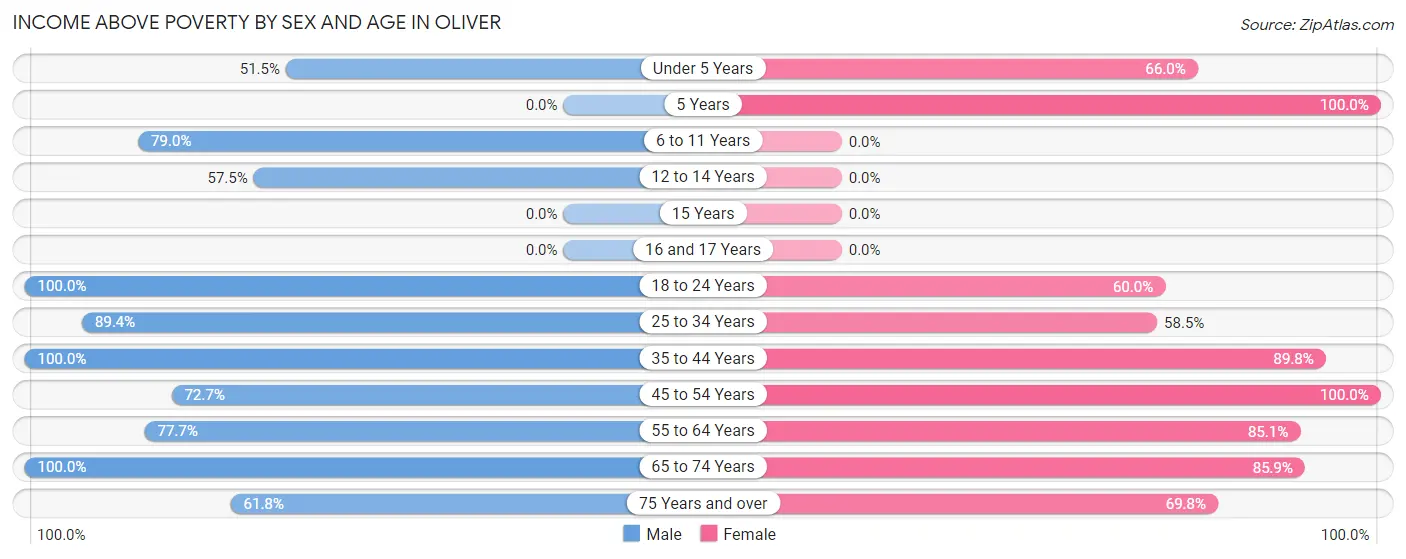
| Age Bracket | Male | Female |
| Under 5 Years | 17 (51.5%) | 35 (66.0%) |
| 5 Years | 0 (0.0%) | 40 (100.0%) |
| 6 to 11 Years | 60 (78.9%) | 0 (0.0%) |
| 12 to 14 Years | 23 (57.5%) | 0 (0.0%) |
| 15 Years | 0 (0.0%) | 0 (0.0%) |
| 16 and 17 Years | 0 (0.0%) | 0 (0.0%) |
| 18 to 24 Years | 28 (100.0%) | 42 (60.0%) |
| 25 to 34 Years | 210 (89.4%) | 96 (58.5%) |
| 35 to 44 Years | 109 (100.0%) | 88 (89.8%) |
| 45 to 54 Years | 72 (72.7%) | 189 (100.0%) |
| 55 to 64 Years | 171 (77.7%) | 148 (85.1%) |
| 65 to 74 Years | 104 (100.0%) | 110 (85.9%) |
| 75 Years and over | 63 (61.8%) | 67 (69.8%) |
| Total | 857 (81.2%) | 815 (77.0%) |
Income Below Poverty Among Married-Couple Families in Oliver
The poverty statistics for married-couple families in Oliver show that 4.6% or 16 of the total 345 families live below the poverty line. Families with 3 or 4 children have the highest poverty rate of 27.6%, comprising of 16 families. On the other hand, families with no children have the lowest poverty rate of 0.0%, which includes 0 families.
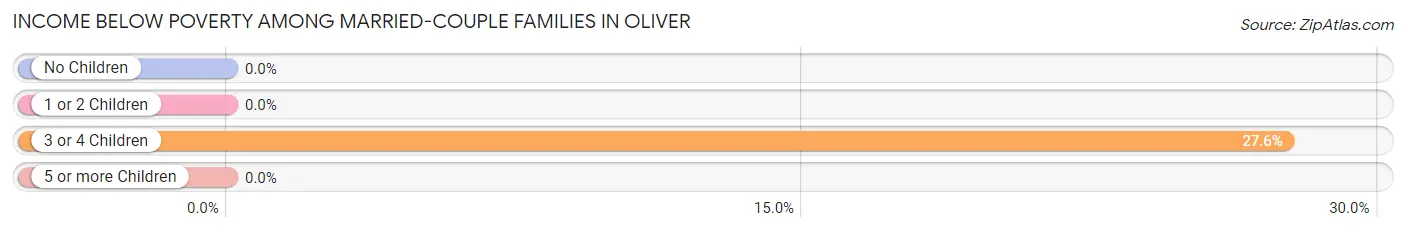
| Children | Above Poverty | Below Poverty |
| No Children | 270 (100.0%) | 0 (0.0%) |
| 1 or 2 Children | 17 (100.0%) | 0 (0.0%) |
| 3 or 4 Children | 42 (72.4%) | 16 (27.6%) |
| 5 or more Children | 0 (0.0%) | 0 (0.0%) |
| Total | 329 (95.4%) | 16 (4.6%) |
Income Below Poverty Among Single-Parent Households in Oliver
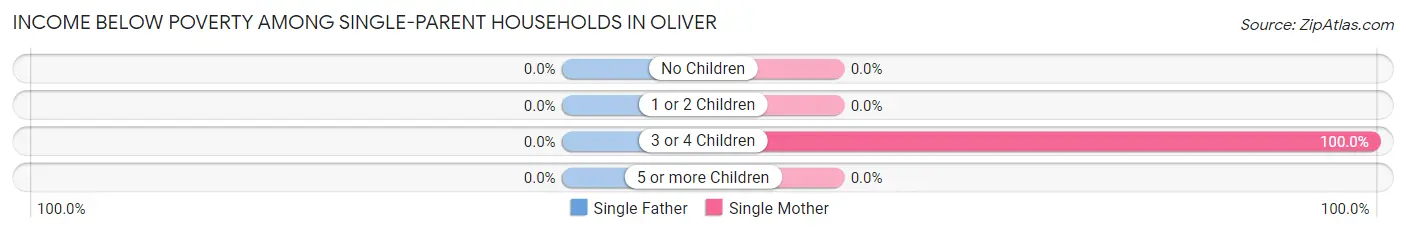
| Children | Single Father | Single Mother |
| No Children | 0 (0.0%) | 0 (0.0%) |
| 1 or 2 Children | 0 (0.0%) | 0 (0.0%) |
| 3 or 4 Children | 0 (0.0%) | 18 (100.0%) |
| 5 or more Children | 0 (0.0%) | 0 (0.0%) |
| Total | 0 (0.0%) | 18 (16.1%) |
Income Below Poverty Among Married-Couple vs Single-Parent Households in Oliver
The poverty data for Oliver shows that 16 of the married-couple family households (4.6%) and 18 of the single-parent households (12.2%) are living below the poverty level. Within the married-couple family households, those with 3 or 4 children have the highest poverty rate, with 16 households (27.6%) falling below the poverty line. Among the single-parent households, those with 3 or 4 children have the highest poverty rate, with 18 household (100.0%) living below poverty.
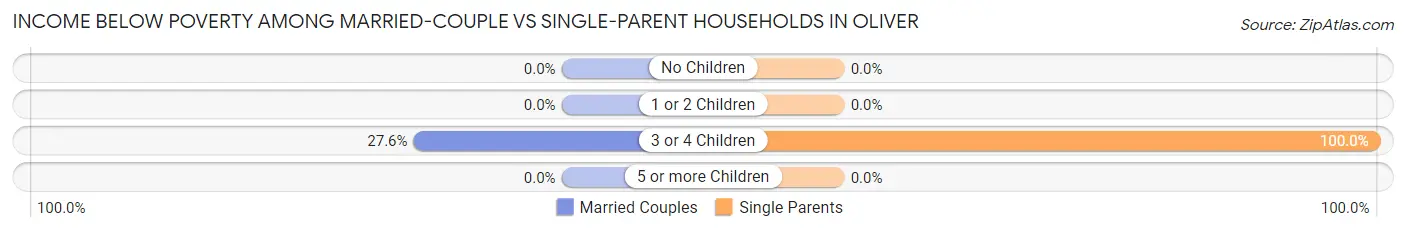
| Children | Married-Couple Families | Single-Parent Households |
| No Children | 0 (0.0%) | 0 (0.0%) |
| 1 or 2 Children | 0 (0.0%) | 0 (0.0%) |
| 3 or 4 Children | 16 (27.6%) | 18 (100.0%) |
| 5 or more Children | 0 (0.0%) | 0 (0.0%) |
| Total | 16 (4.6%) | 18 (12.2%) |
Employment Characteristics in Oliver
Employment by Class of Employer in Oliver
Among the 1,129 employed individuals in Oliver, private company employees (742 | 65.7%), not-for-profit organizations (252 | 22.3%), and self-employed (not incorporated) (74 | 6.6%) make up the most common classes of employment.
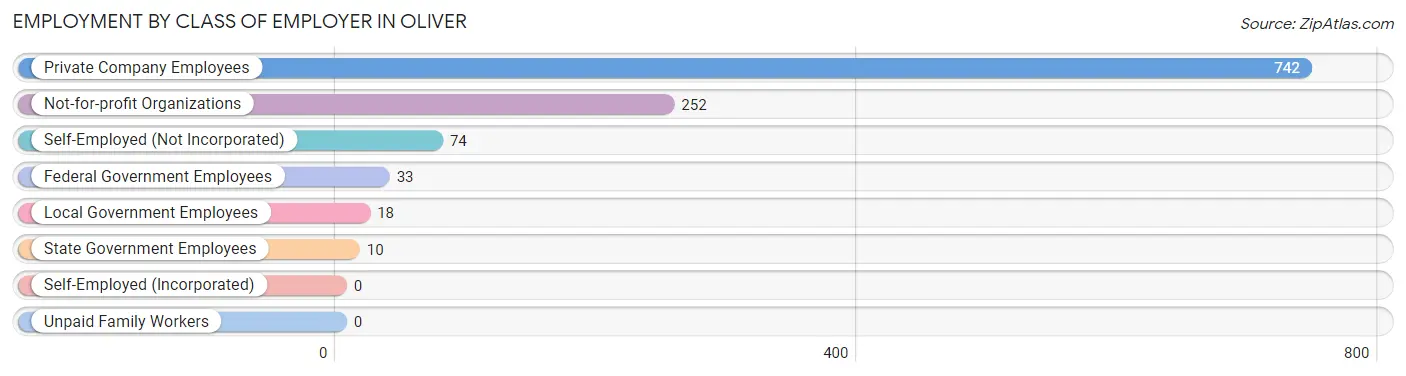
| Employer Class | # Employees | % Employees |
| Private Company Employees | 742 | 65.7% |
| Self-Employed (Incorporated) | 0 | 0.0% |
| Self-Employed (Not Incorporated) | 74 | 6.6% |
| Not-for-profit Organizations | 252 | 22.3% |
| Local Government Employees | 18 | 1.6% |
| State Government Employees | 10 | 0.9% |
| Federal Government Employees | 33 | 2.9% |
| Unpaid Family Workers | 0 | 0.0% |
| Total | 1,129 | 100.0% |
Employment Status by Age in Oliver
According to the labor force statistics for Oliver, out of the total population over 16 years of age (1,969), 61.2% or 1,205 individuals are in the labor force, with 6.4% or 77 of them unemployed. The age group with the highest labor force participation rate is 35 to 44 years, with 95.2% or 197 individuals in the labor force. Within the labor force, the 25 to 29 years age range has the highest percentage of unemployed individuals, with 31.4% or 38 of them being unemployed.
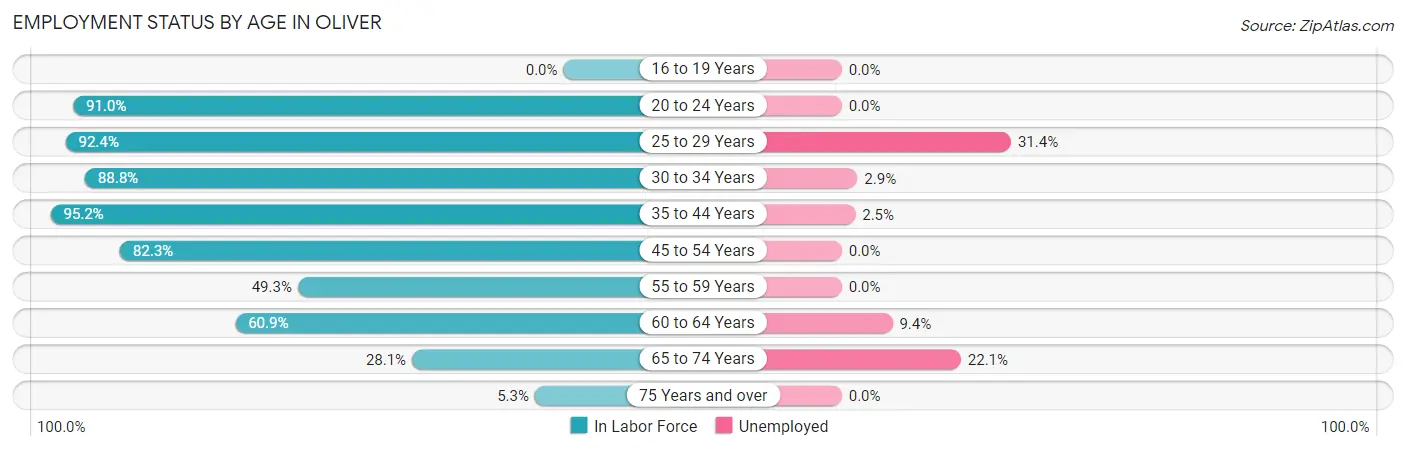
| Age Bracket | In Labor Force | Unemployed |
| 16 to 19 Years | 0 (0.0%) | 0 (0.0%) |
| 20 to 24 Years | 81 (91.0%) | 0 (0.0%) |
| 25 to 29 Years | 121 (92.4%) | 38 (31.4%) |
| 30 to 34 Years | 238 (88.8%) | 7 (2.9%) |
| 35 to 44 Years | 197 (95.2%) | 5 (2.5%) |
| 45 to 54 Years | 260 (82.3%) | 0 (0.0%) |
| 55 to 59 Years | 112 (49.3%) | 0 (0.0%) |
| 60 to 64 Years | 106 (60.9%) | 10 (9.4%) |
| 65 to 74 Years | 77 (28.1%) | 17 (22.1%) |
| 75 Years and over | 14 (5.3%) | 0 (0.0%) |
| Total | 1,205 (61.2%) | 77 (6.4%) |
Employment Status by Educational Attainment in Oliver
According to labor force statistics for Oliver, 78.2% of individuals (1,035) out of the total population between 25 and 64 years of age (1,323) are in the labor force, with 5.8% or 60 of them being unemployed. The group with the highest labor force participation rate are those with the educational attainment of bachelor's degree or higher, with 96.7% or 327 individuals in the labor force. Within the labor force, individuals with high school diploma education have the highest percentage of unemployment, with 8.9% or 32 of them being unemployed.
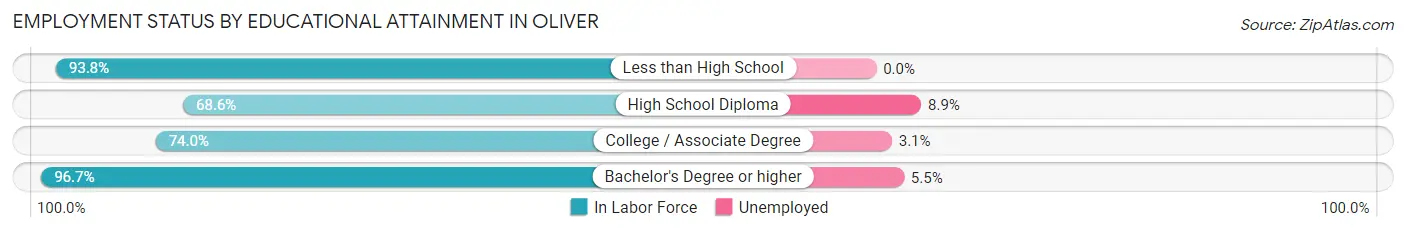
| Educational Attainment | In Labor Force | Unemployed |
| Less than High School | 30 (93.8%) | 0 (0.0%) |
| High School Diploma | 359 (68.6%) | 47 (8.9%) |
| College / Associate Degree | 318 (74.0%) | 13 (3.1%) |
| Bachelor's Degree or higher | 327 (96.7%) | 19 (5.5%) |
| Total | 1,035 (78.2%) | 77 (5.8%) |
Employment Occupations by Sex in Oliver
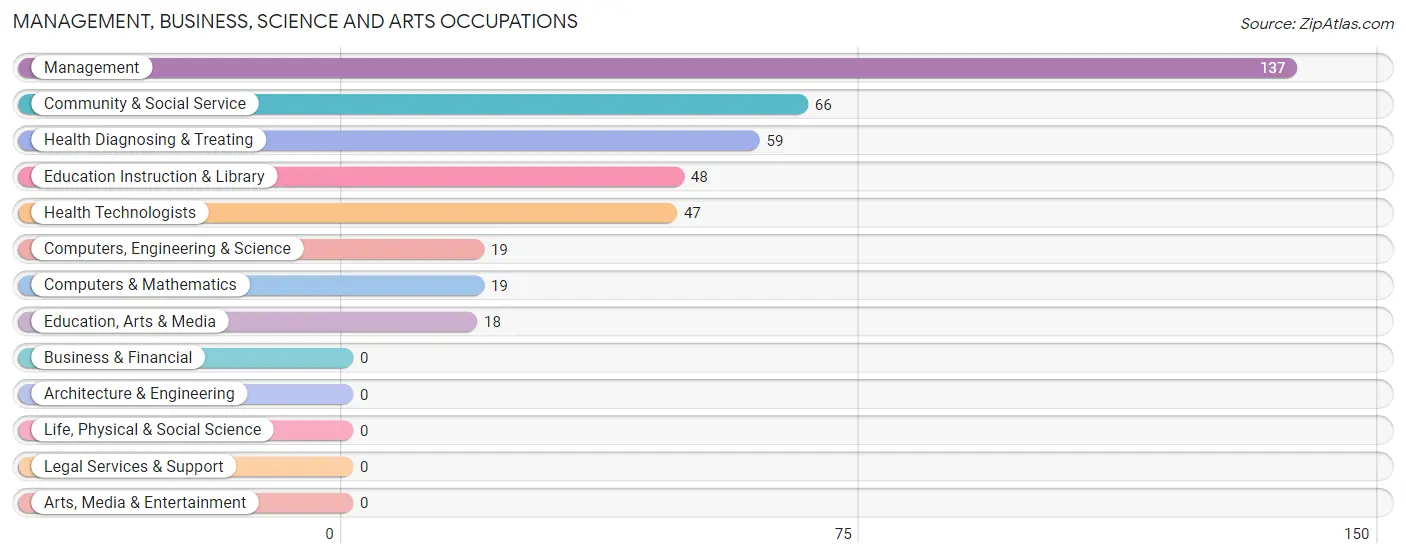
Management, Business, Science and Arts Occupations
The most common Management, Business, Science and Arts occupations in Oliver are Management (137 | 12.1%), Community & Social Service (66 | 5.9%), Health Diagnosing & Treating (59 | 5.2%), Education Instruction & Library (48 | 4.3%), and Health Technologists (47 | 4.2%).
Management, Business, Science and Arts Occupations by Sex
Within the Management, Business, Science and Arts occupations in Oliver, the most male-oriented occupations are Education Instruction & Library (39.6%), Computers, Engineering & Science (36.8%), and Computers & Mathematics (36.8%), while the most female-oriented occupations are Education, Arts & Media (100.0%), Health Diagnosing & Treating (100.0%), and Health Technologists (100.0%).
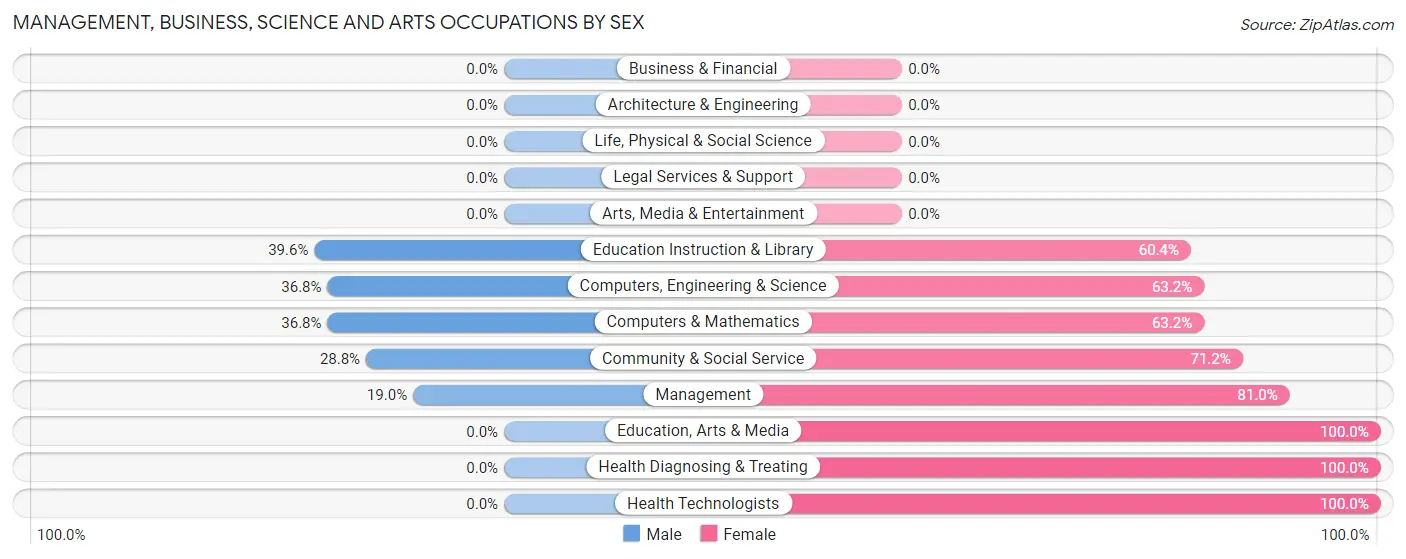
| Occupation | Male | Female |
| Management | 26 (19.0%) | 111 (81.0%) |
| Business & Financial | 0 (0.0%) | 0 (0.0%) |
| Computers, Engineering & Science | 7 (36.8%) | 12 (63.2%) |
| Computers & Mathematics | 7 (36.8%) | 12 (63.2%) |
| Architecture & Engineering | 0 (0.0%) | 0 (0.0%) |
| Life, Physical & Social Science | 0 (0.0%) | 0 (0.0%) |
| Community & Social Service | 19 (28.8%) | 47 (71.2%) |
| Education, Arts & Media | 0 (0.0%) | 18 (100.0%) |
| Legal Services & Support | 0 (0.0%) | 0 (0.0%) |
| Education Instruction & Library | 19 (39.6%) | 29 (60.4%) |
| Arts, Media & Entertainment | 0 (0.0%) | 0 (0.0%) |
| Health Diagnosing & Treating | 0 (0.0%) | 59 (100.0%) |
| Health Technologists | 0 (0.0%) | 47 (100.0%) |
| Total (Category) | 52 (18.5%) | 229 (81.5%) |
| Total (Overall) | 576 (51.0%) | 553 (49.0%) |
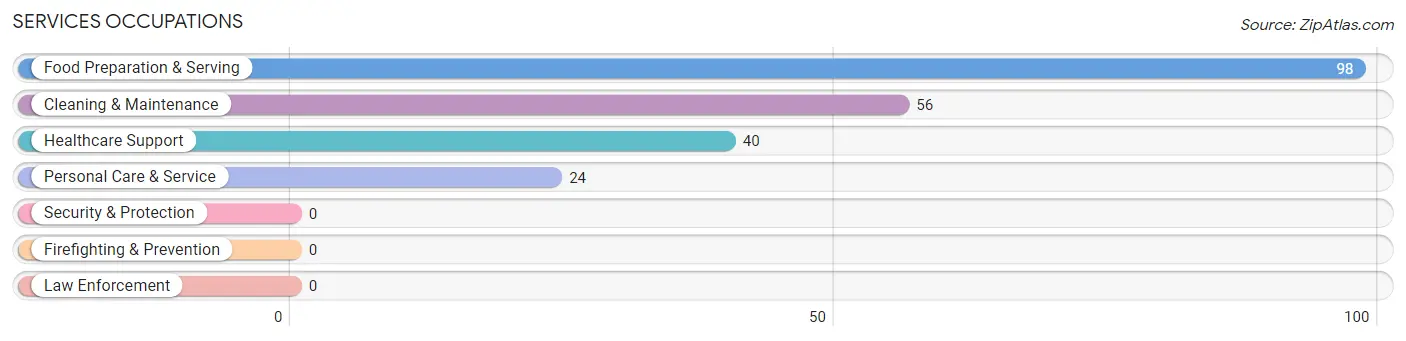
Services Occupations
The most common Services occupations in Oliver are Food Preparation & Serving (98 | 8.7%), Cleaning & Maintenance (56 | 5.0%), Healthcare Support (40 | 3.5%), and Personal Care & Service (24 | 2.1%).
Services Occupations by Sex
Within the Services occupations in Oliver, the most male-oriented occupations are Personal Care & Service (100.0%), Cleaning & Maintenance (75.0%), and Healthcare Support (17.5%), while the most female-oriented occupations are Food Preparation & Serving (100.0%), Healthcare Support (82.5%), and Cleaning & Maintenance (25.0%).
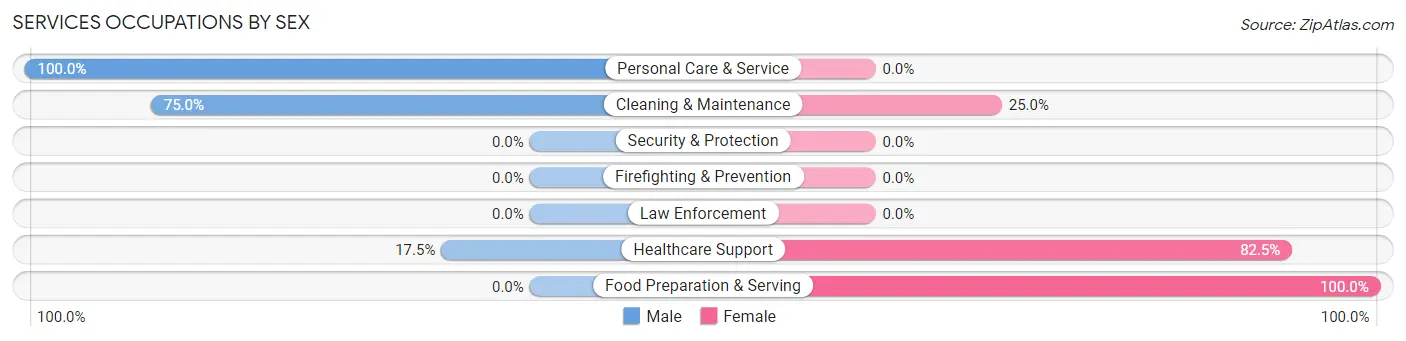
| Occupation | Male | Female |
| Healthcare Support | 7 (17.5%) | 33 (82.5%) |
| Security & Protection | 0 (0.0%) | 0 (0.0%) |
| Firefighting & Prevention | 0 (0.0%) | 0 (0.0%) |
| Law Enforcement | 0 (0.0%) | 0 (0.0%) |
| Food Preparation & Serving | 0 (0.0%) | 98 (100.0%) |
| Cleaning & Maintenance | 42 (75.0%) | 14 (25.0%) |
| Personal Care & Service | 24 (100.0%) | 0 (0.0%) |
| Total (Category) | 73 (33.5%) | 145 (66.5%) |
| Total (Overall) | 576 (51.0%) | 553 (49.0%) |
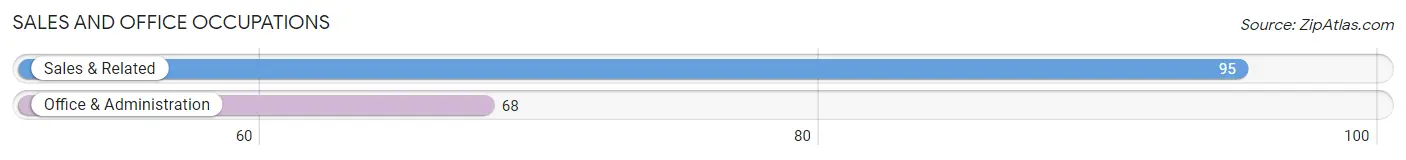
Sales and Office Occupations
The most common Sales and Office occupations in Oliver are Sales & Related (95 | 8.4%), and Office & Administration (68 | 6.0%).
Sales and Office Occupations by Sex
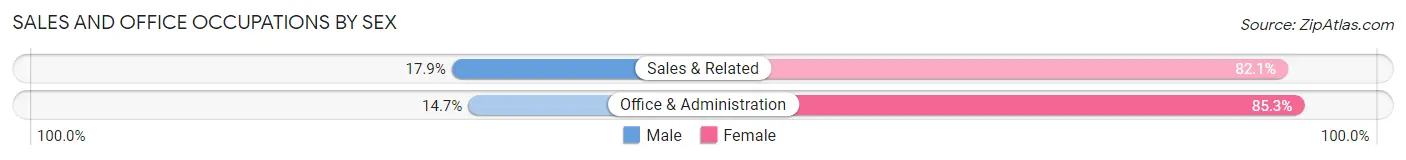
| Occupation | Male | Female |
| Sales & Related | 17 (17.9%) | 78 (82.1%) |
| Office & Administration | 10 (14.7%) | 58 (85.3%) |
| Total (Category) | 27 (16.6%) | 136 (83.4%) |
| Total (Overall) | 576 (51.0%) | 553 (49.0%) |
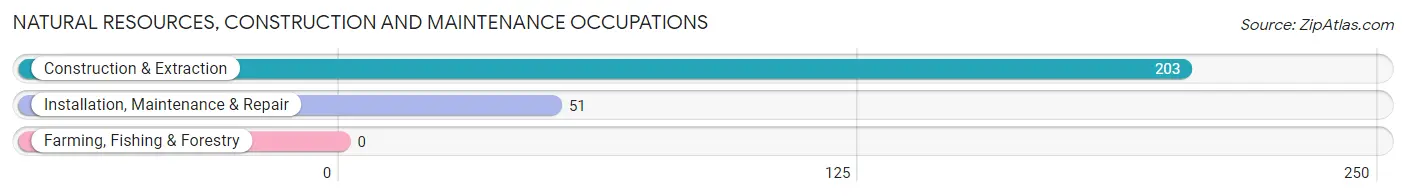
Natural Resources, Construction and Maintenance Occupations
The most common Natural Resources, Construction and Maintenance occupations in Oliver are Construction & Extraction (203 | 18.0%), and Installation, Maintenance & Repair (51 | 4.5%).
Natural Resources, Construction and Maintenance Occupations by Sex
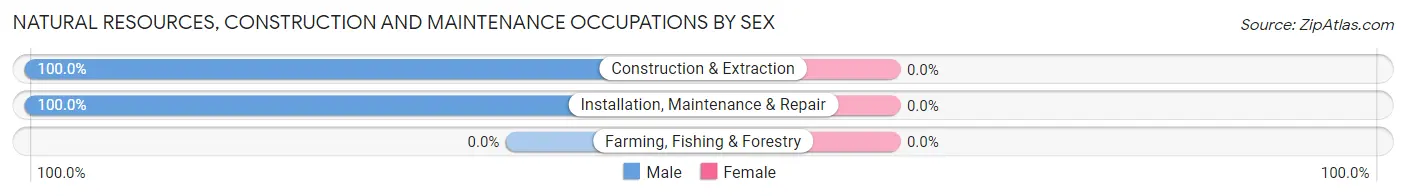
| Occupation | Male | Female |
| Farming, Fishing & Forestry | 0 (0.0%) | 0 (0.0%) |
| Construction & Extraction | 203 (100.0%) | 0 (0.0%) |
| Installation, Maintenance & Repair | 51 (100.0%) | 0 (0.0%) |
| Total (Category) | 254 (100.0%) | 0 (0.0%) |
| Total (Overall) | 576 (51.0%) | 553 (49.0%) |
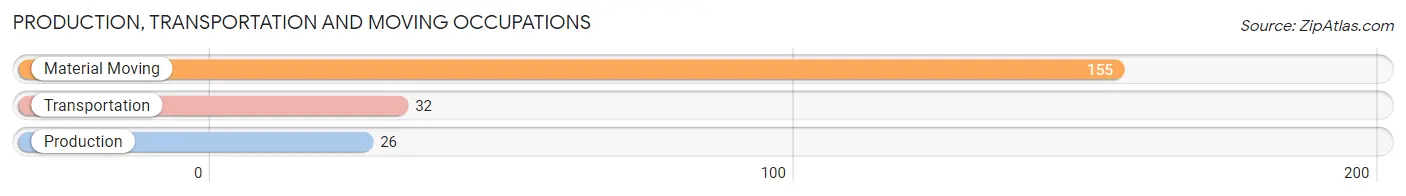
Production, Transportation and Moving Occupations
The most common Production, Transportation and Moving occupations in Oliver are Material Moving (155 | 13.7%), Transportation (32 | 2.8%), and Production (26 | 2.3%).
Production, Transportation and Moving Occupations by Sex
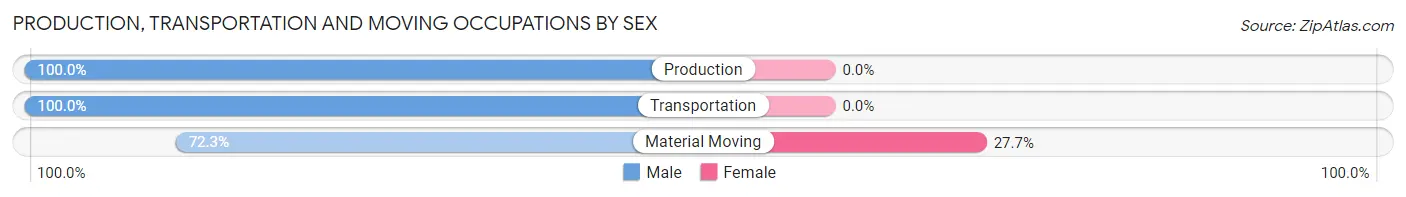
| Occupation | Male | Female |
| Production | 26 (100.0%) | 0 (0.0%) |
| Transportation | 32 (100.0%) | 0 (0.0%) |
| Material Moving | 112 (72.3%) | 43 (27.7%) |
| Total (Category) | 170 (79.8%) | 43 (20.2%) |
| Total (Overall) | 576 (51.0%) | 553 (49.0%) |
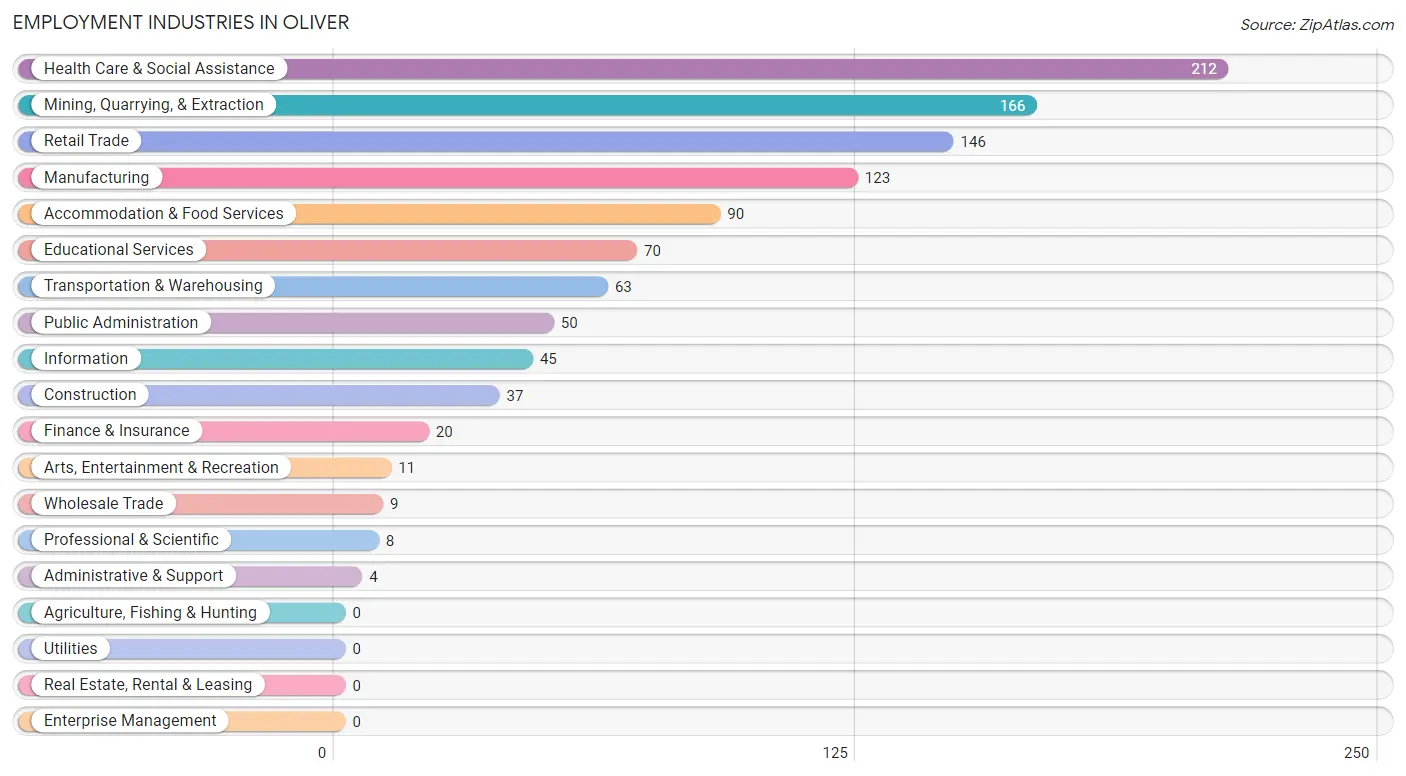
Employment Industries by Sex in Oliver
Employment Industries in Oliver
The major employment industries in Oliver include Health Care & Social Assistance (212 | 18.8%), Mining, Quarrying, & Extraction (166 | 14.7%), Retail Trade (146 | 12.9%), Manufacturing (123 | 10.9%), and Accommodation & Food Services (90 | 8.0%).
Employment Industries by Sex in Oliver
The Oliver industries that see more men than women are Mining, Quarrying, & Extraction (100.0%), Construction (100.0%), and Information (100.0%), whereas the industries that tend to have a higher number of women are Wholesale Trade (100.0%), Finance & Insurance (100.0%), and Professional & Scientific (100.0%).
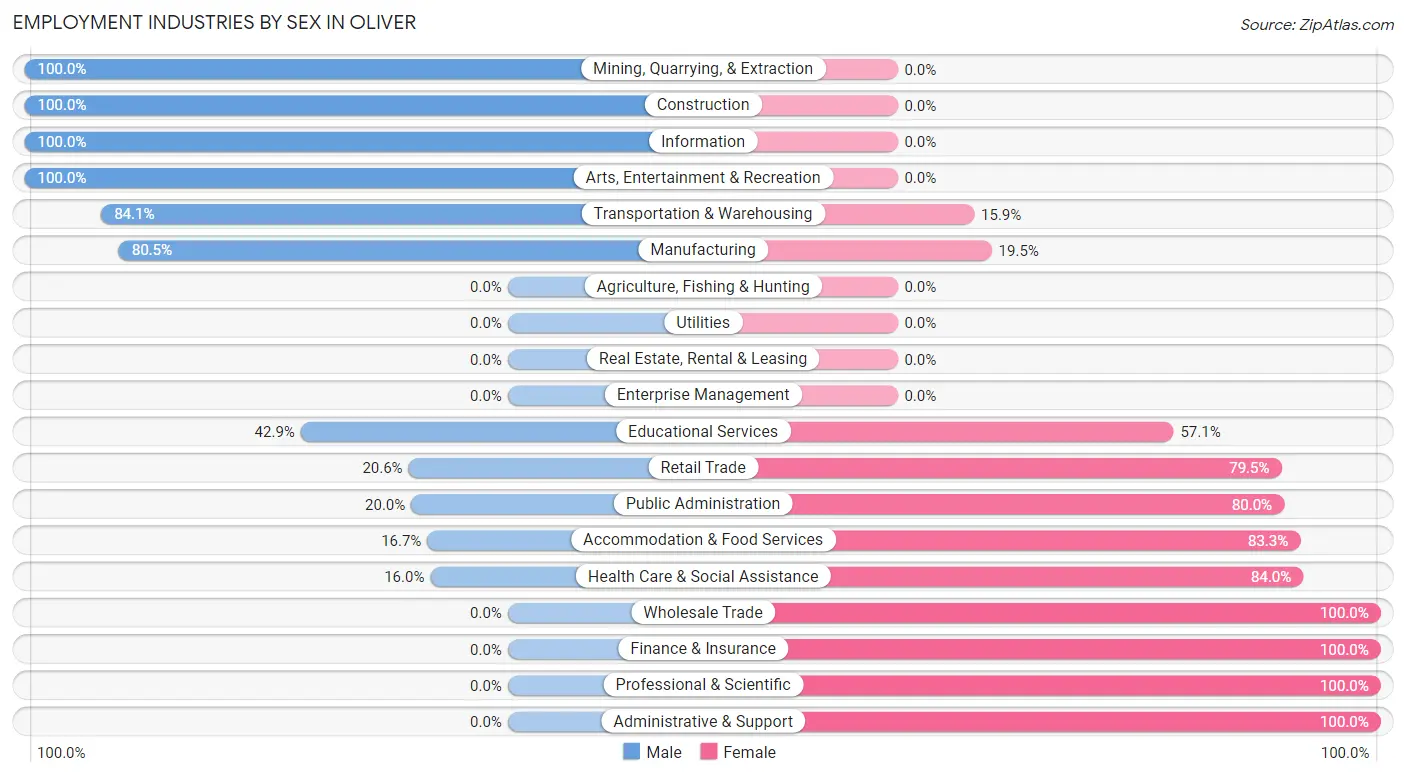
| Industry | Male | Female |
| Agriculture, Fishing & Hunting | 0 (0.0%) | 0 (0.0%) |
| Mining, Quarrying, & Extraction | 166 (100.0%) | 0 (0.0%) |
| Construction | 37 (100.0%) | 0 (0.0%) |
| Manufacturing | 99 (80.5%) | 24 (19.5%) |
| Wholesale Trade | 0 (0.0%) | 9 (100.0%) |
| Retail Trade | 30 (20.5%) | 116 (79.4%) |
| Transportation & Warehousing | 53 (84.1%) | 10 (15.9%) |
| Utilities | 0 (0.0%) | 0 (0.0%) |
| Information | 45 (100.0%) | 0 (0.0%) |
| Finance & Insurance | 0 (0.0%) | 20 (100.0%) |
| Real Estate, Rental & Leasing | 0 (0.0%) | 0 (0.0%) |
| Professional & Scientific | 0 (0.0%) | 8 (100.0%) |
| Enterprise Management | 0 (0.0%) | 0 (0.0%) |
| Administrative & Support | 0 (0.0%) | 4 (100.0%) |
| Educational Services | 30 (42.9%) | 40 (57.1%) |
| Health Care & Social Assistance | 34 (16.0%) | 178 (84.0%) |
| Arts, Entertainment & Recreation | 11 (100.0%) | 0 (0.0%) |
| Accommodation & Food Services | 15 (16.7%) | 75 (83.3%) |
| Public Administration | 10 (20.0%) | 40 (80.0%) |
| Total | 576 (51.0%) | 553 (49.0%) |
Education in Oliver
School Enrollment in Oliver
The most common levels of schooling among the 388 students in Oliver are elementary school (101 | 26.0%), college / undergraduate (91 | 23.4%), and kindergarten (51 | 13.1%).
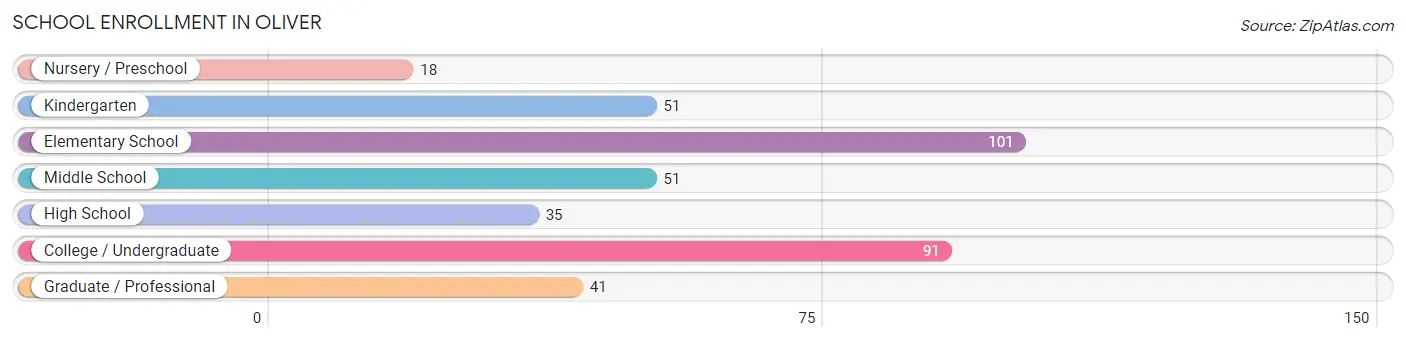
| School Level | # Students | % Students |
| Nursery / Preschool | 18 | 4.6% |
| Kindergarten | 51 | 13.1% |
| Elementary School | 101 | 26.0% |
| Middle School | 51 | 13.1% |
| High School | 35 | 9.0% |
| College / Undergraduate | 91 | 23.4% |
| Graduate / Professional | 41 | 10.6% |
| Total | 388 | 100.0% |
School Enrollment by Age by Funding Source in Oliver
Out of a total of 388 students who are enrolled in schools in Oliver, 26 (6.7%) attend a private institution, while the remaining 362 (93.3%) are enrolled in public schools. The age group of 10 to 14 year olds has the highest likelihood of being enrolled in private schools, with 15 (16.3% in the age bracket) enrolled. Conversely, the age group of 3 to 4 year olds has the lowest likelihood of being enrolled in a private school, with 18 (100.0% in the age bracket) attending a public institution.
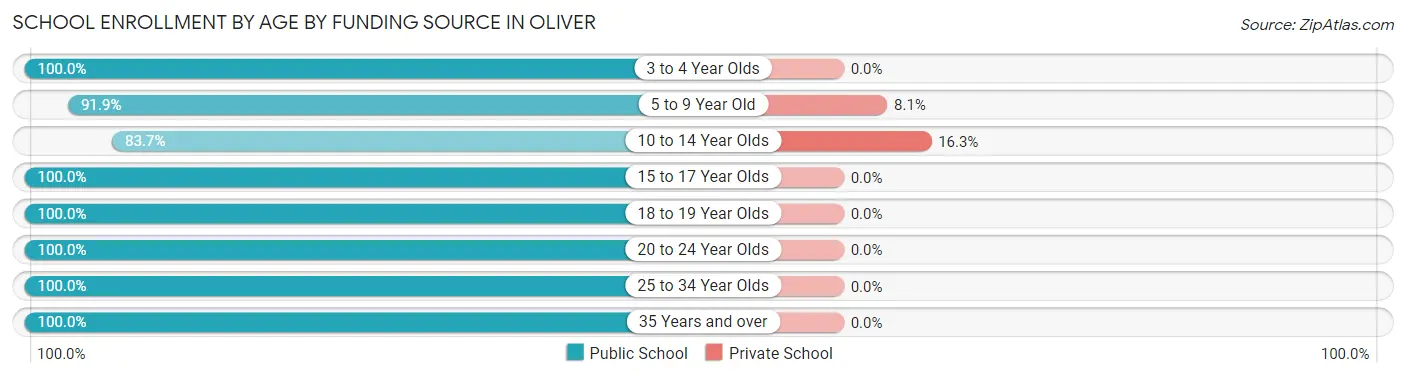
| Age Bracket | Public School | Private School |
| 3 to 4 Year Olds | 18 (100.0%) | 0 (0.0%) |
| 5 to 9 Year Old | 125 (91.9%) | 11 (8.1%) |
| 10 to 14 Year Olds | 77 (83.7%) | 15 (16.3%) |
| 15 to 17 Year Olds | 10 (100.0%) | 0 (0.0%) |
| 18 to 19 Year Olds | 9 (100.0%) | 0 (0.0%) |
| 20 to 24 Year Olds | 56 (100.0%) | 0 (0.0%) |
| 25 to 34 Year Olds | 35 (100.0%) | 0 (0.0%) |
| 35 Years and over | 32 (100.0%) | 0 (0.0%) |
| Total | 362 (93.3%) | 26 (6.7%) |
Educational Attainment by Field of Study in Oliver
Engineering (138 | 36.4%), science & technology (74 | 19.5%), literature & languages (63 | 16.6%), arts & humanities (43 | 11.4%), and education (42 | 11.1%) are the most common fields of study among 379 individuals in Oliver who have obtained a bachelor's degree or higher.
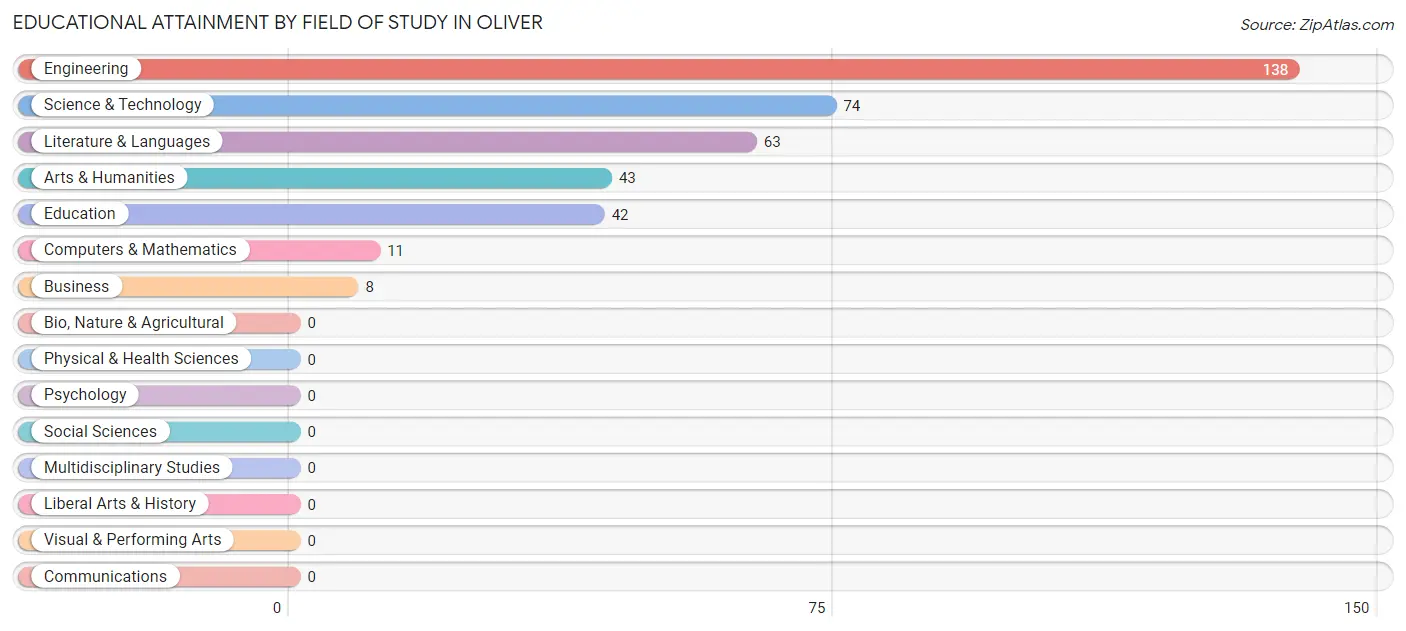
| Field of Study | # Graduates | % Graduates |
| Computers & Mathematics | 11 | 2.9% |
| Bio, Nature & Agricultural | 0 | 0.0% |
| Physical & Health Sciences | 0 | 0.0% |
| Psychology | 0 | 0.0% |
| Social Sciences | 0 | 0.0% |
| Engineering | 138 | 36.4% |
| Multidisciplinary Studies | 0 | 0.0% |
| Science & Technology | 74 | 19.5% |
| Business | 8 | 2.1% |
| Education | 42 | 11.1% |
| Literature & Languages | 63 | 16.6% |
| Liberal Arts & History | 0 | 0.0% |
| Visual & Performing Arts | 0 | 0.0% |
| Communications | 0 | 0.0% |
| Arts & Humanities | 43 | 11.4% |
| Total | 379 | 100.0% |
Transportation & Commute in Oliver
Vehicle Availability by Sex in Oliver
The most prevalent vehicle ownership categories in Oliver are males with 2 vehicles (239, accounting for 41.5%) and females with 2 vehicles (250, making up 43.2%).
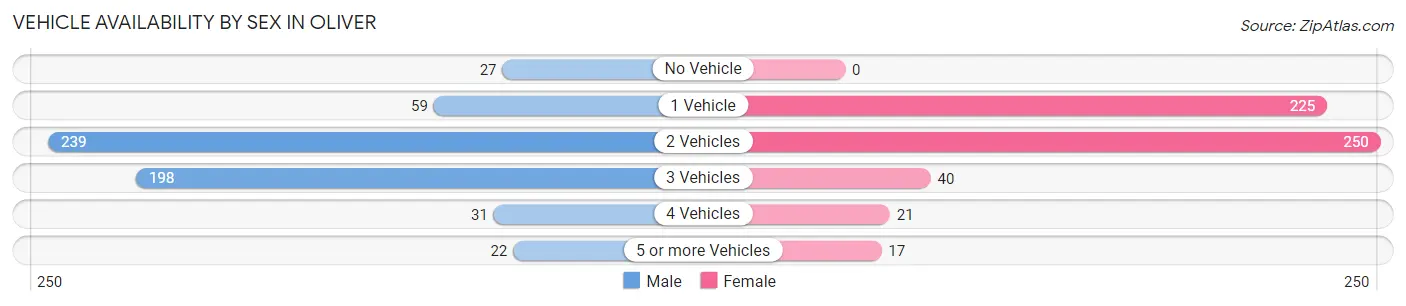
| Vehicles Available | Male | Female |
| No Vehicle | 27 (4.7%) | 0 (0.0%) |
| 1 Vehicle | 59 (10.2%) | 225 (40.7%) |
| 2 Vehicles | 239 (41.5%) | 250 (45.2%) |
| 3 Vehicles | 198 (34.4%) | 40 (7.2%) |
| 4 Vehicles | 31 (5.4%) | 21 (3.8%) |
| 5 or more Vehicles | 22 (3.8%) | 17 (3.1%) |
| Total | 576 (100.0%) | 553 (100.0%) |
Commute Time in Oliver
The most frequently occuring commute durations in Oliver are 5 to 9 minutes (359 commuters, 32.8%), 35 to 39 minutes (167 commuters, 15.2%), and 10 to 14 minutes (150 commuters, 13.7%).
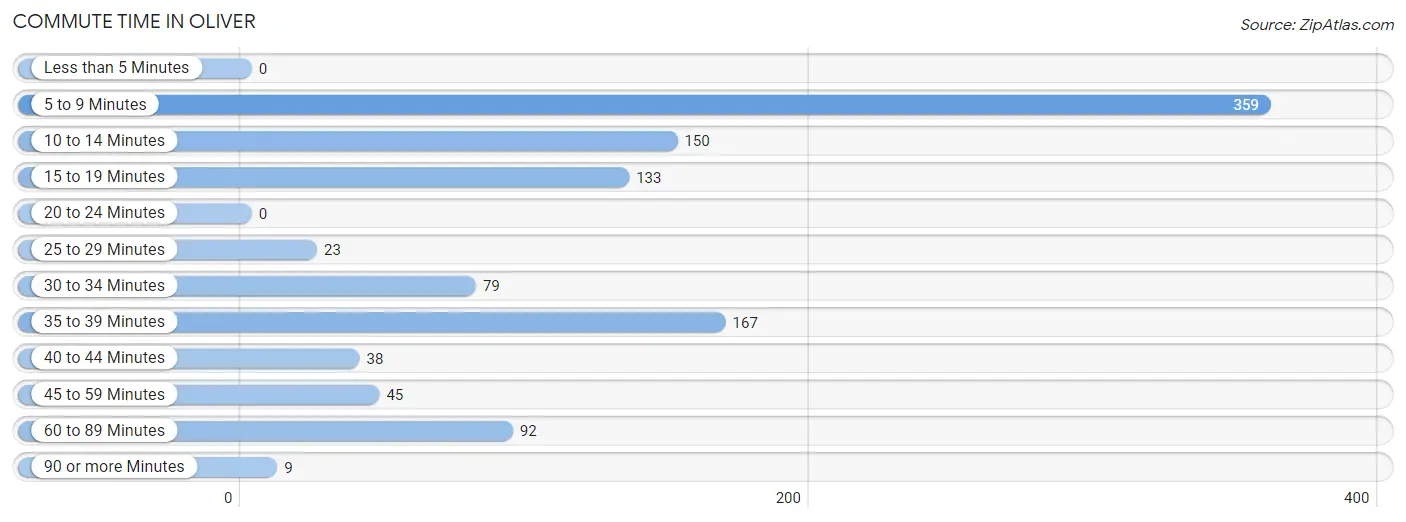
| Commute Time | # Commuters | % Commuters |
| Less than 5 Minutes | 0 | 0.0% |
| 5 to 9 Minutes | 359 | 32.8% |
| 10 to 14 Minutes | 150 | 13.7% |
| 15 to 19 Minutes | 133 | 12.1% |
| 20 to 24 Minutes | 0 | 0.0% |
| 25 to 29 Minutes | 23 | 2.1% |
| 30 to 34 Minutes | 79 | 7.2% |
| 35 to 39 Minutes | 167 | 15.2% |
| 40 to 44 Minutes | 38 | 3.5% |
| 45 to 59 Minutes | 45 | 4.1% |
| 60 to 89 Minutes | 92 | 8.4% |
| 90 or more Minutes | 9 | 0.8% |
Commute Time by Sex in Oliver
The most common commute times in Oliver are 5 to 9 minutes (179 commuters, 31.6%) for males and 5 to 9 minutes (180 commuters, 34.0%) for females.
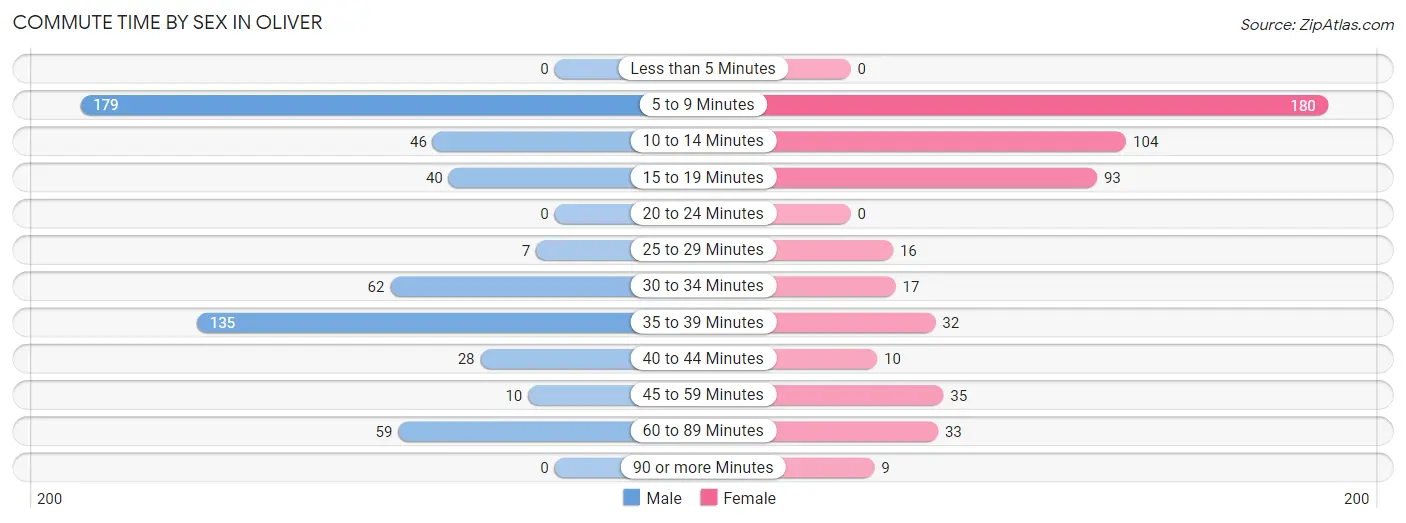
| Commute Time | Male | Female |
| Less than 5 Minutes | 0 (0.0%) | 0 (0.0%) |
| 5 to 9 Minutes | 179 (31.6%) | 180 (34.0%) |
| 10 to 14 Minutes | 46 (8.1%) | 104 (19.7%) |
| 15 to 19 Minutes | 40 (7.1%) | 93 (17.6%) |
| 20 to 24 Minutes | 0 (0.0%) | 0 (0.0%) |
| 25 to 29 Minutes | 7 (1.2%) | 16 (3.0%) |
| 30 to 34 Minutes | 62 (11.0%) | 17 (3.2%) |
| 35 to 39 Minutes | 135 (23.8%) | 32 (6.0%) |
| 40 to 44 Minutes | 28 (5.0%) | 10 (1.9%) |
| 45 to 59 Minutes | 10 (1.8%) | 35 (6.6%) |
| 60 to 89 Minutes | 59 (10.4%) | 33 (6.2%) |
| 90 or more Minutes | 0 (0.0%) | 9 (1.7%) |
Time of Departure to Work by Sex in Oliver
The most frequent times of departure to work in Oliver are 6:00 AM to 6:29 AM (180, 31.8%) for males and 7:30 AM to 7:59 AM (168, 31.8%) for females.
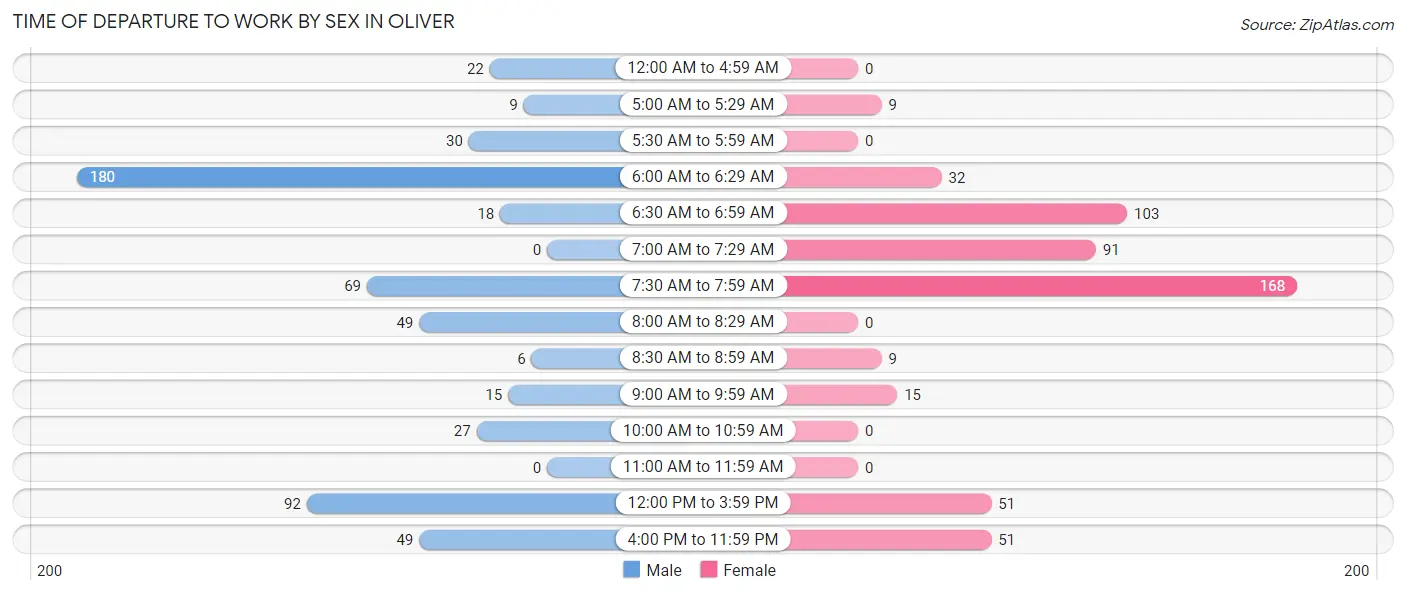
| Time of Departure | Male | Female |
| 12:00 AM to 4:59 AM | 22 (3.9%) | 0 (0.0%) |
| 5:00 AM to 5:29 AM | 9 (1.6%) | 9 (1.7%) |
| 5:30 AM to 5:59 AM | 30 (5.3%) | 0 (0.0%) |
| 6:00 AM to 6:29 AM | 180 (31.8%) | 32 (6.0%) |
| 6:30 AM to 6:59 AM | 18 (3.2%) | 103 (19.5%) |
| 7:00 AM to 7:29 AM | 0 (0.0%) | 91 (17.2%) |
| 7:30 AM to 7:59 AM | 69 (12.2%) | 168 (31.8%) |
| 8:00 AM to 8:29 AM | 49 (8.7%) | 0 (0.0%) |
| 8:30 AM to 8:59 AM | 6 (1.1%) | 9 (1.7%) |
| 9:00 AM to 9:59 AM | 15 (2.6%) | 15 (2.8%) |
| 10:00 AM to 10:59 AM | 27 (4.8%) | 0 (0.0%) |
| 11:00 AM to 11:59 AM | 0 (0.0%) | 0 (0.0%) |
| 12:00 PM to 3:59 PM | 92 (16.3%) | 51 (9.6%) |
| 4:00 PM to 11:59 PM | 49 (8.7%) | 51 (9.6%) |
| Total | 566 (100.0%) | 529 (100.0%) |
Housing Occupancy in Oliver
Occupancy by Ownership in Oliver
Of the total 1,201 dwellings in Oliver, owner-occupied units account for 720 (60.0%), while renter-occupied units make up 481 (40.1%).
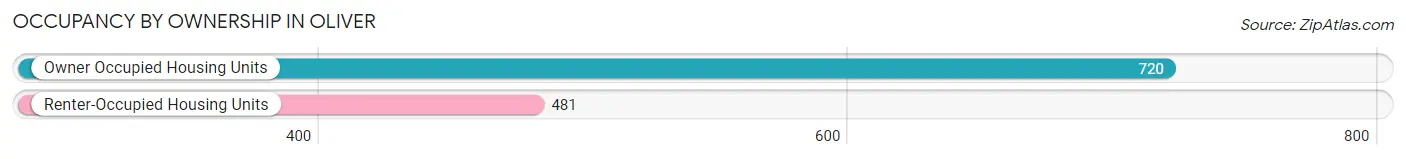
| Occupancy | # Housing Units | % Housing Units |
| Owner Occupied Housing Units | 720 | 60.0% |
| Renter-Occupied Housing Units | 481 | 40.1% |
| Total Occupied Housing Units | 1,201 | 100.0% |
Occupancy by Household Size in Oliver
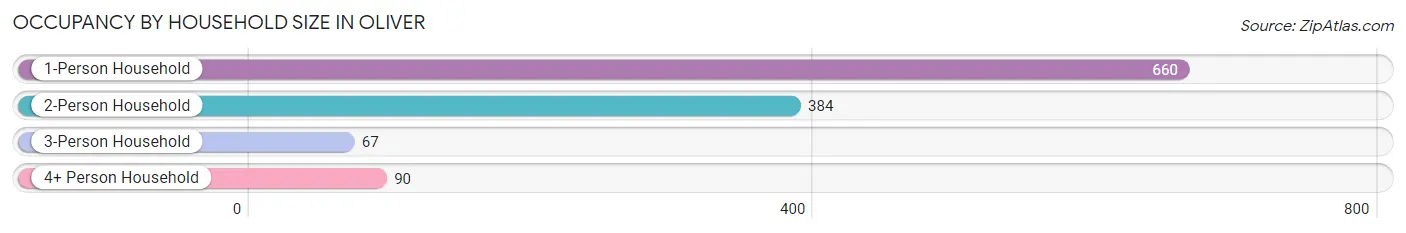
| Household Size | # Housing Units | % Housing Units |
| 1-Person Household | 660 | 54.9% |
| 2-Person Household | 384 | 32.0% |
| 3-Person Household | 67 | 5.6% |
| 4+ Person Household | 90 | 7.5% |
| Total Housing Units | 1,201 | 100.0% |
Occupancy by Ownership by Household Size in Oliver
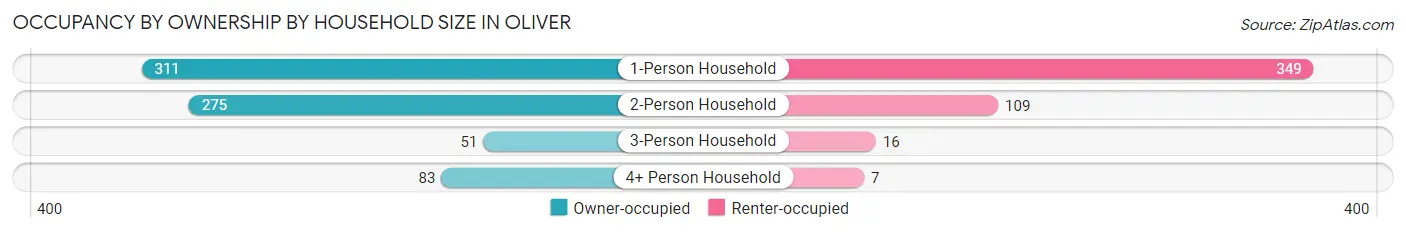
| Household Size | Owner-occupied | Renter-occupied |
| 1-Person Household | 311 (47.1%) | 349 (52.9%) |
| 2-Person Household | 275 (71.6%) | 109 (28.4%) |
| 3-Person Household | 51 (76.1%) | 16 (23.9%) |
| 4+ Person Household | 83 (92.2%) | 7 (7.8%) |
| Total Housing Units | 720 (60.0%) | 481 (40.1%) |
Occupancy by Educational Attainment in Oliver
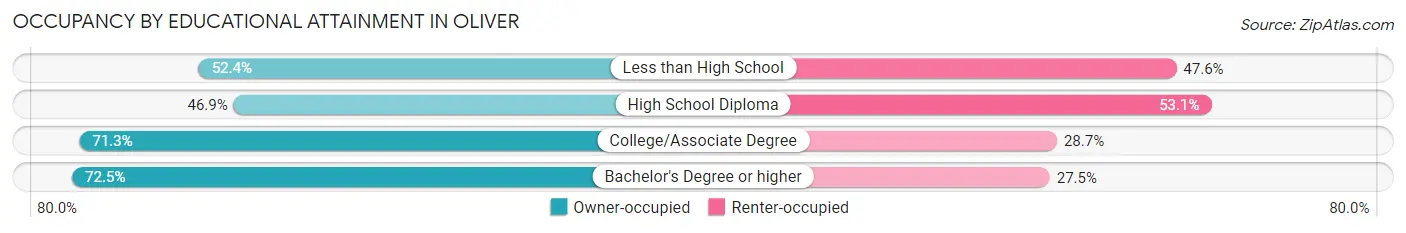
| Household Size | Owner-occupied | Renter-occupied |
| Less than High School | 22 (52.4%) | 20 (47.6%) |
| High School Diploma | 254 (46.9%) | 288 (53.1%) |
| College/Associate Degree | 194 (71.3%) | 78 (28.7%) |
| Bachelor's Degree or higher | 250 (72.5%) | 95 (27.5%) |
Occupancy by Age of Householder in Oliver
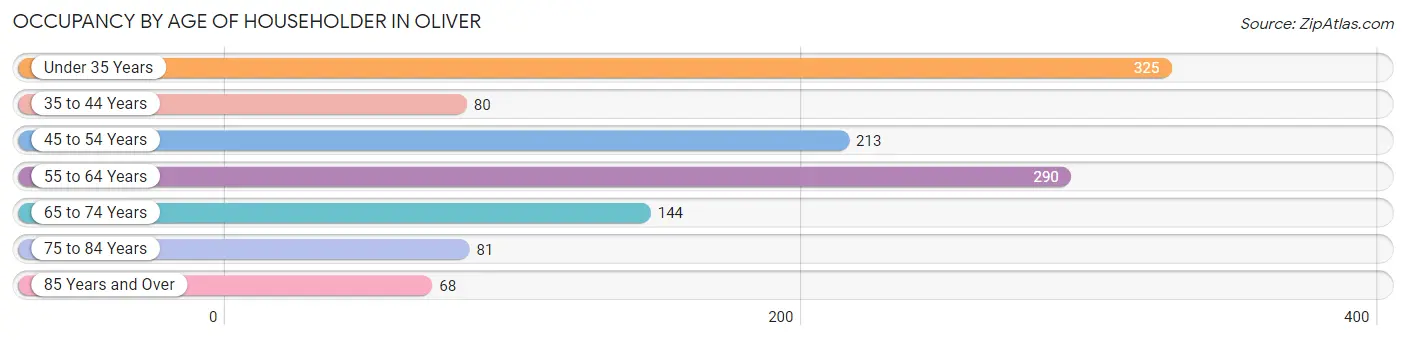
| Age Bracket | # Households | % Households |
| Under 35 Years | 325 | 27.1% |
| 35 to 44 Years | 80 | 6.7% |
| 45 to 54 Years | 213 | 17.7% |
| 55 to 64 Years | 290 | 24.1% |
| 65 to 74 Years | 144 | 12.0% |
| 75 to 84 Years | 81 | 6.7% |
| 85 Years and Over | 68 | 5.7% |
| Total | 1,201 | 100.0% |
Housing Finances in Oliver
Median Income by Occupancy in Oliver
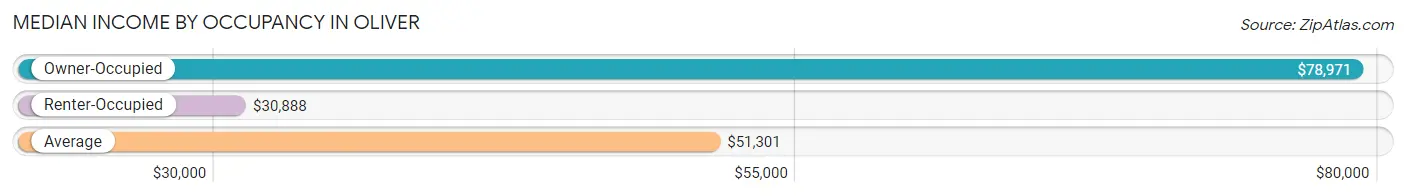
| Occupancy Type | # Households | Median Income |
| Owner-Occupied | 720 (60.0%) | $78,971 |
| Renter-Occupied | 481 (40.1%) | $30,888 |
| Average | 1,201 (100.0%) | $51,301 |
Occupancy by Householder Income Bracket in Oliver
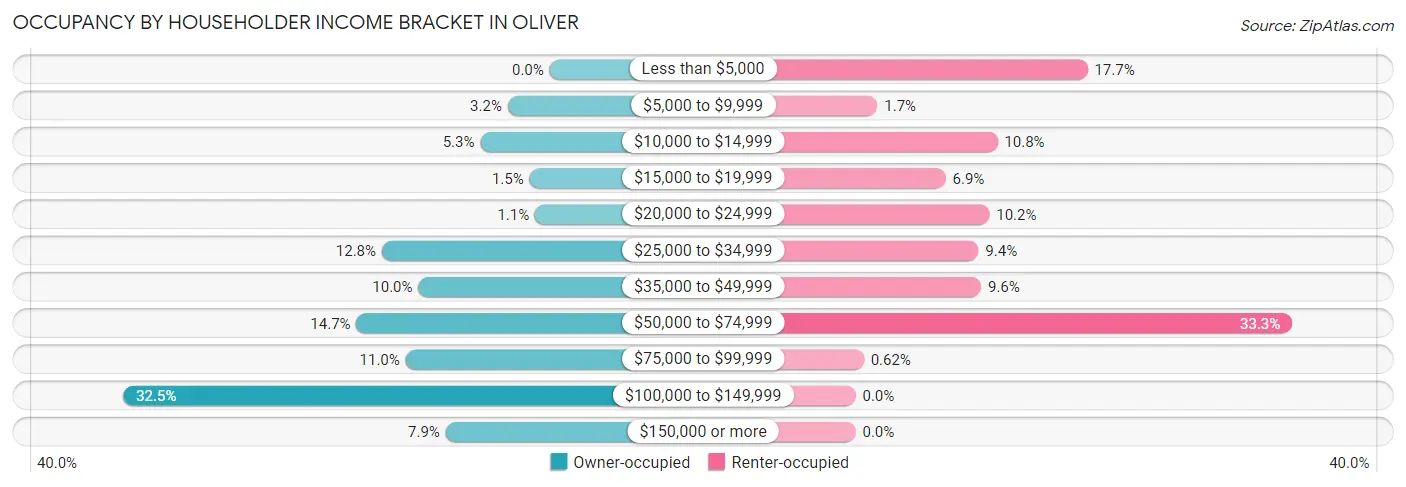
| Income Bracket | Owner-occupied | Renter-occupied |
| Less than $5,000 | 0 (0.0%) | 85 (17.7%) |
| $5,000 to $9,999 | 23 (3.2%) | 8 (1.7%) |
| $10,000 to $14,999 | 38 (5.3%) | 52 (10.8%) |
| $15,000 to $19,999 | 11 (1.5%) | 33 (6.9%) |
| $20,000 to $24,999 | 8 (1.1%) | 49 (10.2%) |
| $25,000 to $34,999 | 92 (12.8%) | 45 (9.4%) |
| $35,000 to $49,999 | 72 (10.0%) | 46 (9.6%) |
| $50,000 to $74,999 | 106 (14.7%) | 160 (33.3%) |
| $75,000 to $99,999 | 79 (11.0%) | 3 (0.6%) |
| $100,000 to $149,999 | 234 (32.5%) | 0 (0.0%) |
| $150,000 or more | 57 (7.9%) | 0 (0.0%) |
| Total | 720 (100.0%) | 481 (100.0%) |
Monthly Housing Cost Tiers in Oliver
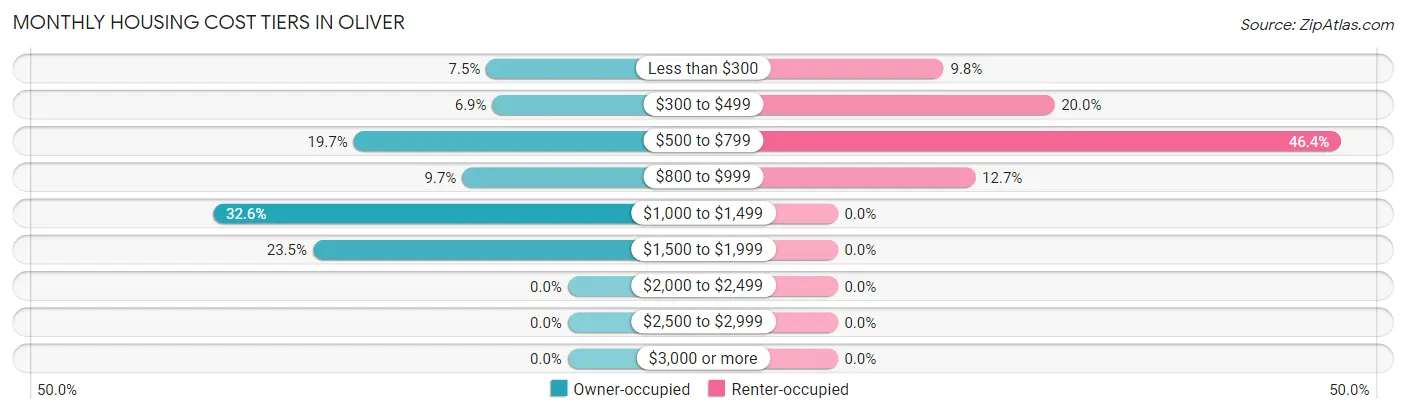
| Monthly Cost | Owner-occupied | Renter-occupied |
| Less than $300 | 54 (7.5%) | 47 (9.8%) |
| $300 to $499 | 50 (6.9%) | 96 (20.0%) |
| $500 to $799 | 142 (19.7%) | 223 (46.4%) |
| $800 to $999 | 70 (9.7%) | 61 (12.7%) |
| $1,000 to $1,499 | 235 (32.6%) | 0 (0.0%) |
| $1,500 to $1,999 | 169 (23.5%) | 0 (0.0%) |
| $2,000 to $2,499 | 0 (0.0%) | 0 (0.0%) |
| $2,500 to $2,999 | 0 (0.0%) | 0 (0.0%) |
| $3,000 or more | 0 (0.0%) | 0 (0.0%) |
| Total | 720 (100.0%) | 481 (100.0%) |
Physical Housing Characteristics in Oliver
Housing Structures in Oliver
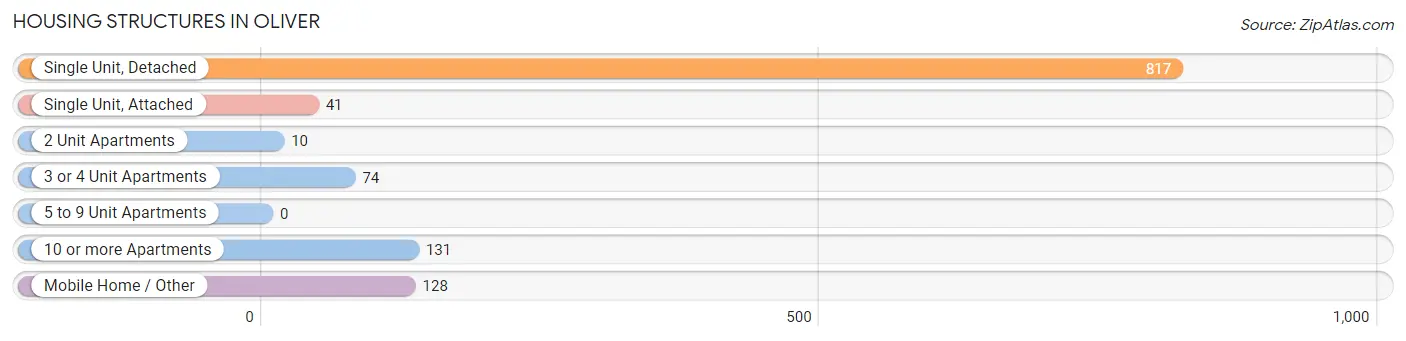
| Structure Type | # Housing Units | % Housing Units |
| Single Unit, Detached | 817 | 68.0% |
| Single Unit, Attached | 41 | 3.4% |
| 2 Unit Apartments | 10 | 0.8% |
| 3 or 4 Unit Apartments | 74 | 6.2% |
| 5 to 9 Unit Apartments | 0 | 0.0% |
| 10 or more Apartments | 131 | 10.9% |
| Mobile Home / Other | 128 | 10.7% |
| Total | 1,201 | 100.0% |
Housing Structures by Occupancy in Oliver
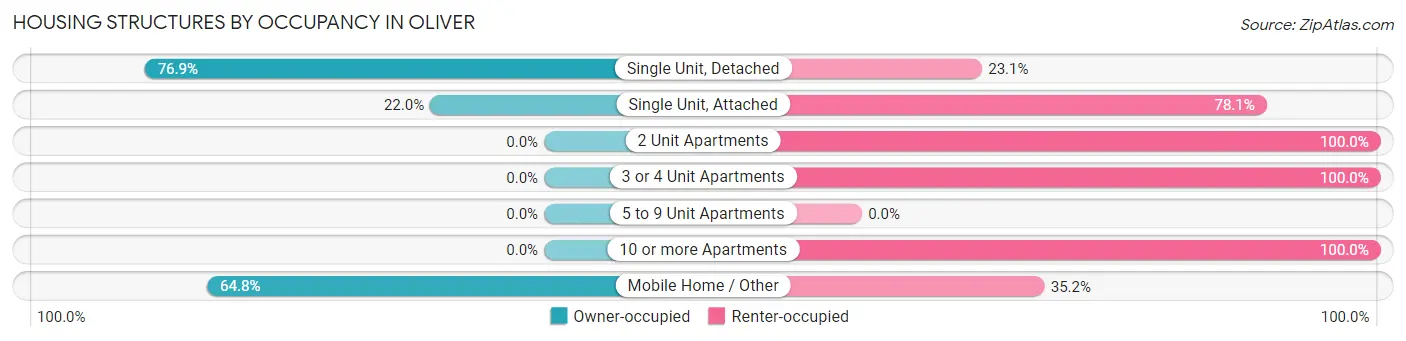
| Structure Type | Owner-occupied | Renter-occupied |
| Single Unit, Detached | 628 (76.9%) | 189 (23.1%) |
| Single Unit, Attached | 9 (22.0%) | 32 (78.0%) |
| 2 Unit Apartments | 0 (0.0%) | 10 (100.0%) |
| 3 or 4 Unit Apartments | 0 (0.0%) | 74 (100.0%) |
| 5 to 9 Unit Apartments | 0 (0.0%) | 0 (0.0%) |
| 10 or more Apartments | 0 (0.0%) | 131 (100.0%) |
| Mobile Home / Other | 83 (64.8%) | 45 (35.2%) |
| Total | 720 (60.0%) | 481 (40.1%) |
Housing Structures by Number of Rooms in Oliver
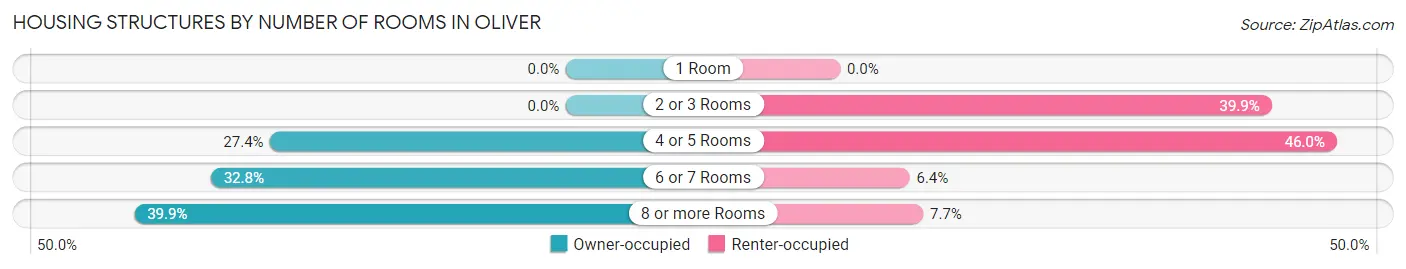
| Number of Rooms | Owner-occupied | Renter-occupied |
| 1 Room | 0 (0.0%) | 0 (0.0%) |
| 2 or 3 Rooms | 0 (0.0%) | 192 (39.9%) |
| 4 or 5 Rooms | 197 (27.4%) | 221 (46.0%) |
| 6 or 7 Rooms | 236 (32.8%) | 31 (6.4%) |
| 8 or more Rooms | 287 (39.9%) | 37 (7.7%) |
| Total | 720 (100.0%) | 481 (100.0%) |
Housing Structure by Heating Type in Oliver
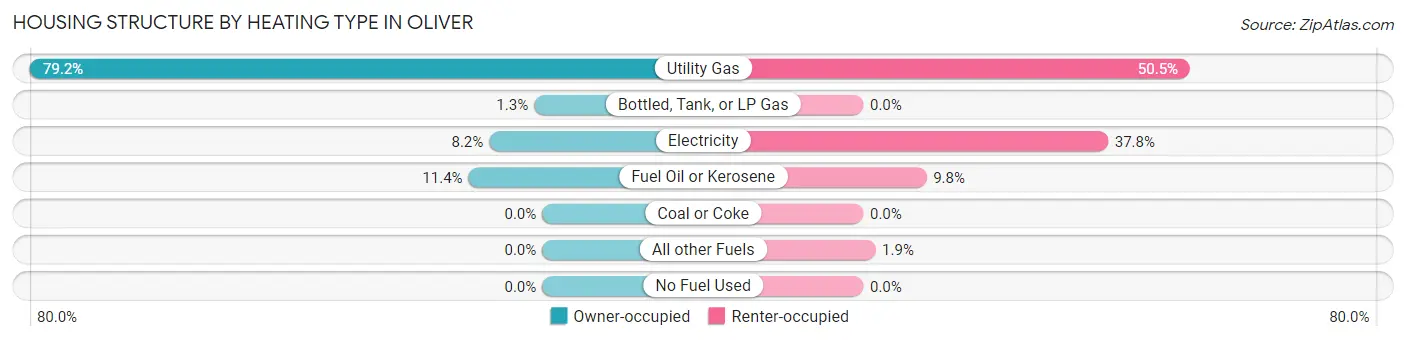
| Heating Type | Owner-occupied | Renter-occupied |
| Utility Gas | 570 (79.2%) | 243 (50.5%) |
| Bottled, Tank, or LP Gas | 9 (1.3%) | 0 (0.0%) |
| Electricity | 59 (8.2%) | 182 (37.8%) |
| Fuel Oil or Kerosene | 82 (11.4%) | 47 (9.8%) |
| Coal or Coke | 0 (0.0%) | 0 (0.0%) |
| All other Fuels | 0 (0.0%) | 9 (1.9%) |
| No Fuel Used | 0 (0.0%) | 0 (0.0%) |
| Total | 720 (100.0%) | 481 (100.0%) |
Household Vehicle Usage in Oliver
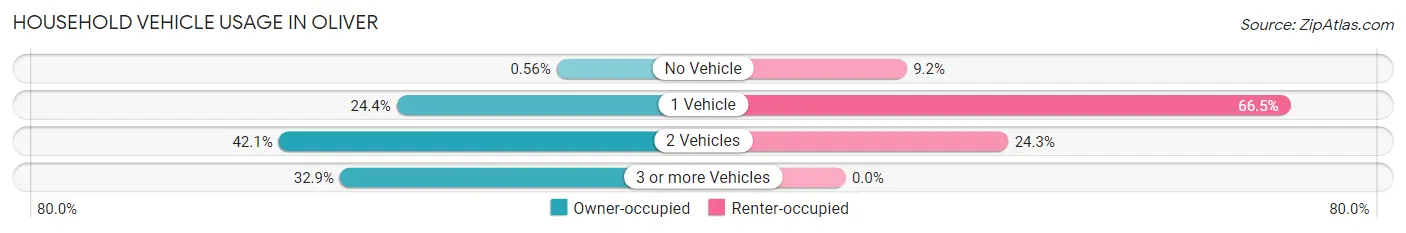
| Vehicles per Household | Owner-occupied | Renter-occupied |
| No Vehicle | 4 (0.6%) | 44 (9.1%) |
| 1 Vehicle | 176 (24.4%) | 320 (66.5%) |
| 2 Vehicles | 303 (42.1%) | 117 (24.3%) |
| 3 or more Vehicles | 237 (32.9%) | 0 (0.0%) |
| Total | 720 (100.0%) | 481 (100.0%) |
Real Estate & Mortgages in Oliver
Real Estate and Mortgage Overview in Oliver
| Characteristic | Without Mortgage | With Mortgage |
| Housing Units | 195 | 525 |
| Median Property Value | $106,900 | $148,000 |
| Median Household Income | $42,560 | $57 |
| Monthly Housing Costs | $493 | $0 |
| Real Estate Taxes | $1,083 | $0 |
Property Value by Mortgage Status in Oliver
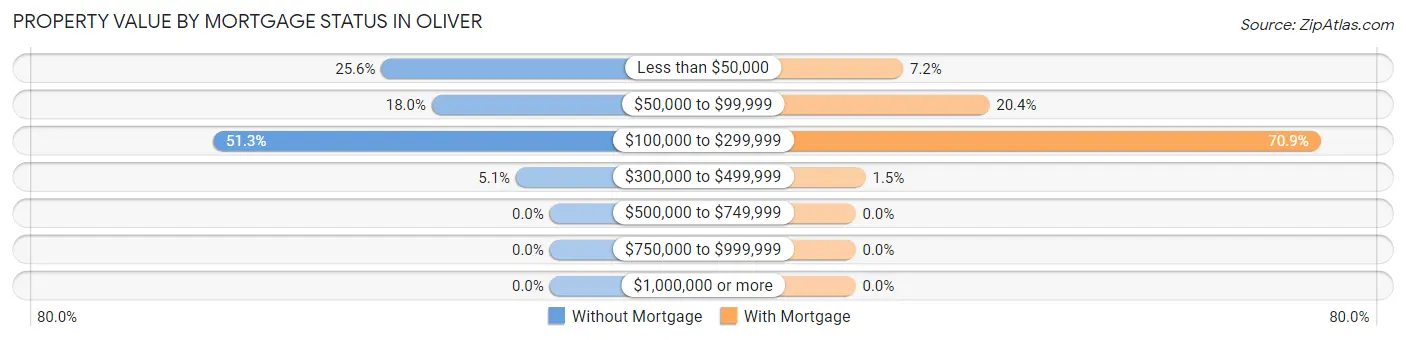
| Property Value | Without Mortgage | With Mortgage |
| Less than $50,000 | 50 (25.6%) | 38 (7.2%) |
| $50,000 to $99,999 | 35 (17.9%) | 107 (20.4%) |
| $100,000 to $299,999 | 100 (51.3%) | 372 (70.9%) |
| $300,000 to $499,999 | 10 (5.1%) | 8 (1.5%) |
| $500,000 to $749,999 | 0 (0.0%) | 0 (0.0%) |
| $750,000 to $999,999 | 0 (0.0%) | 0 (0.0%) |
| $1,000,000 or more | 0 (0.0%) | 0 (0.0%) |
| Total | 195 (100.0%) | 525 (100.0%) |
Household Income by Mortgage Status in Oliver
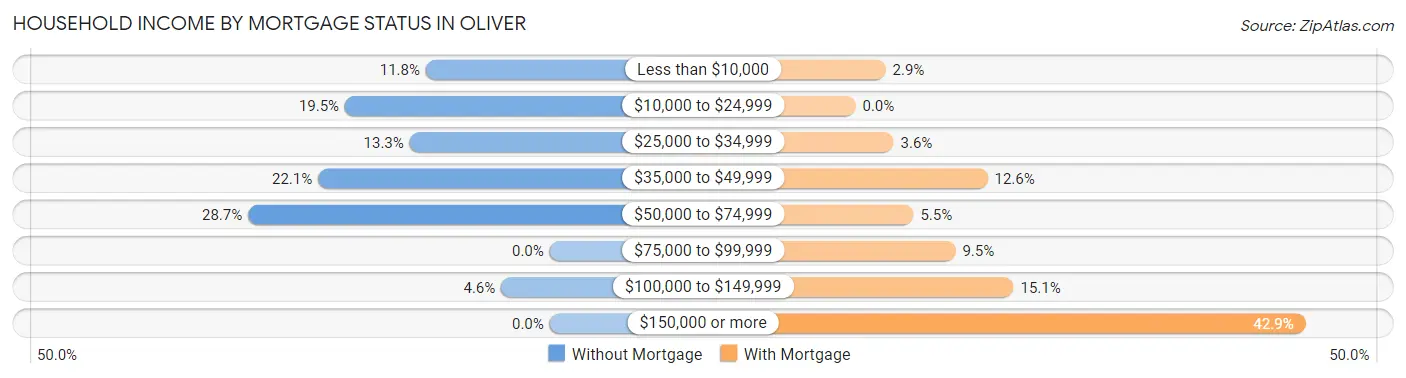
| Household Income | Without Mortgage | With Mortgage |
| Less than $10,000 | 23 (11.8%) | 15 (2.9%) |
| $10,000 to $24,999 | 38 (19.5%) | 0 (0.0%) |
| $25,000 to $34,999 | 26 (13.3%) | 19 (3.6%) |
| $35,000 to $49,999 | 43 (22.1%) | 66 (12.6%) |
| $50,000 to $74,999 | 56 (28.7%) | 29 (5.5%) |
| $75,000 to $99,999 | 0 (0.0%) | 50 (9.5%) |
| $100,000 to $149,999 | 9 (4.6%) | 79 (15.0%) |
| $150,000 or more | 0 (0.0%) | 225 (42.9%) |
| Total | 195 (100.0%) | 525 (100.0%) |
Property Value to Household Income Ratio in Oliver
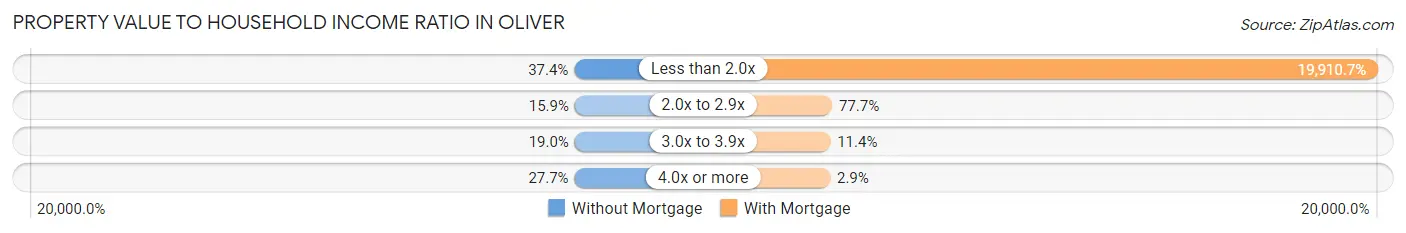
| Value-to-Income Ratio | Without Mortgage | With Mortgage |
| Less than 2.0x | 73 (37.4%) | 104,531 (19,910.7%) |
| 2.0x to 2.9x | 31 (15.9%) | 408 (77.7%) |
| 3.0x to 3.9x | 37 (19.0%) | 60 (11.4%) |
| 4.0x or more | 54 (27.7%) | 15 (2.9%) |
| Total | 195 (100.0%) | 525 (100.0%) |
Real Estate Taxes by Mortgage Status in Oliver
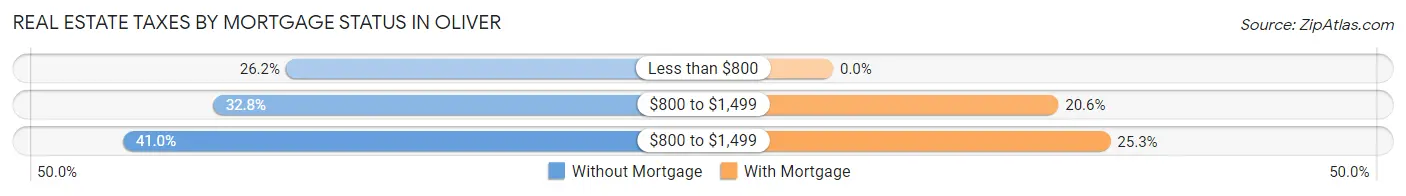
| Property Taxes | Without Mortgage | With Mortgage |
| Less than $800 | 51 (26.2%) | 0 (0.0%) |
| $800 to $1,499 | 64 (32.8%) | 108 (20.6%) |
| $800 to $1,499 | 80 (41.0%) | 133 (25.3%) |
| Total | 195 (100.0%) | 525 (100.0%) |
Health & Disability in Oliver
Health Insurance Coverage by Age in Oliver
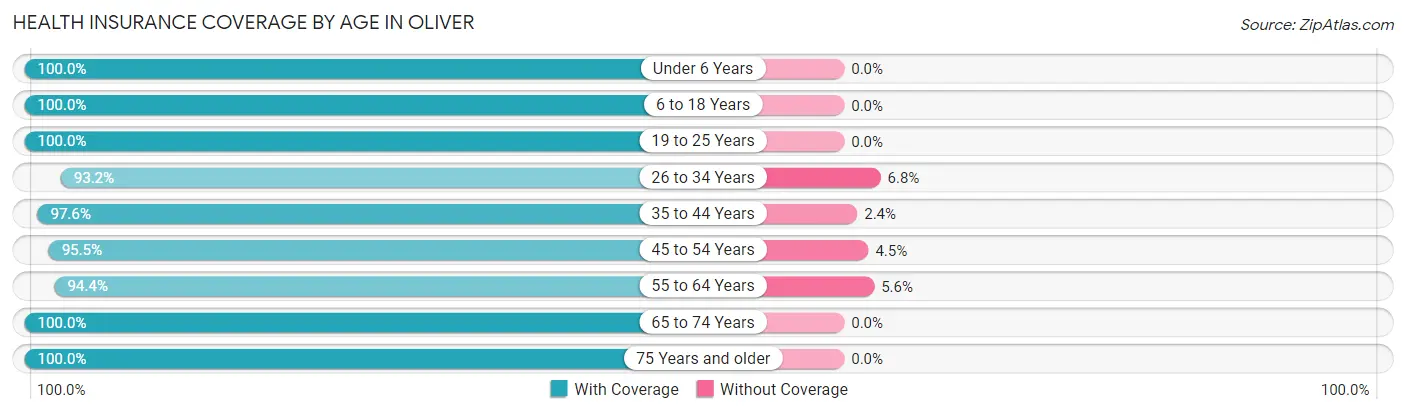
| Age Bracket | With Coverage | Without Coverage |
| Under 6 Years | 137 (100.0%) | 0 (0.0%) |
| 6 to 18 Years | 187 (100.0%) | 0 (0.0%) |
| 19 to 25 Years | 98 (100.0%) | 0 (0.0%) |
| 26 to 34 Years | 372 (93.2%) | 27 (6.8%) |
| 35 to 44 Years | 202 (97.6%) | 5 (2.4%) |
| 45 to 54 Years | 275 (95.5%) | 13 (4.5%) |
| 55 to 64 Years | 372 (94.4%) | 22 (5.6%) |
| 65 to 74 Years | 232 (100.0%) | 0 (0.0%) |
| 75 Years and older | 198 (100.0%) | 0 (0.0%) |
| Total | 2,073 (96.9%) | 67 (3.1%) |
Health Insurance Coverage by Citizenship Status in Oliver
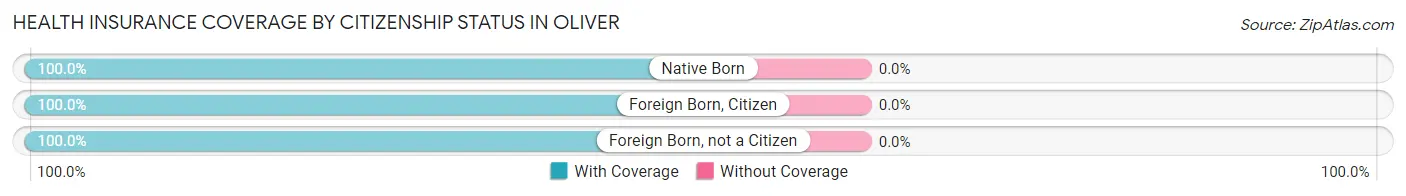
| Citizenship Status | With Coverage | Without Coverage |
| Native Born | 137 (100.0%) | 0 (0.0%) |
| Foreign Born, Citizen | 187 (100.0%) | 0 (0.0%) |
| Foreign Born, not a Citizen | 98 (100.0%) | 0 (0.0%) |
Health Insurance Coverage by Household Income in Oliver
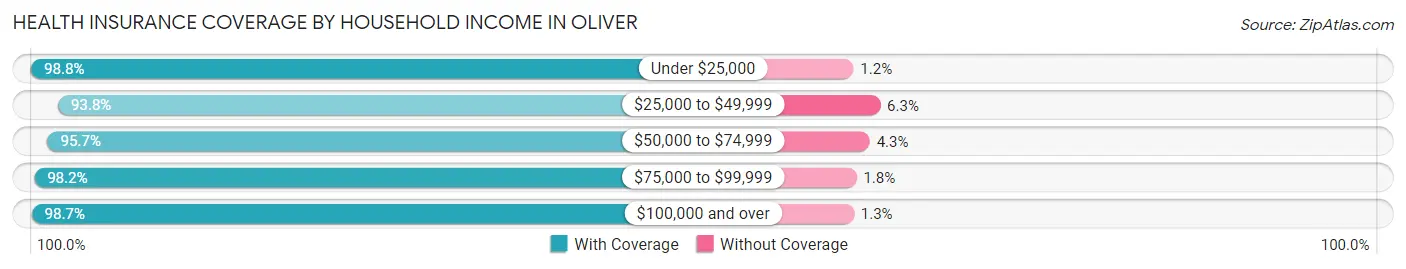
| Household Income | With Coverage | Without Coverage |
| Under $25,000 | 319 (98.8%) | 4 (1.2%) |
| $25,000 to $49,999 | 465 (93.8%) | 31 (6.2%) |
| $50,000 to $74,999 | 445 (95.7%) | 20 (4.3%) |
| $75,000 to $99,999 | 271 (98.2%) | 5 (1.8%) |
| $100,000 and over | 523 (98.7%) | 7 (1.3%) |
Public vs Private Health Insurance Coverage by Age in Oliver
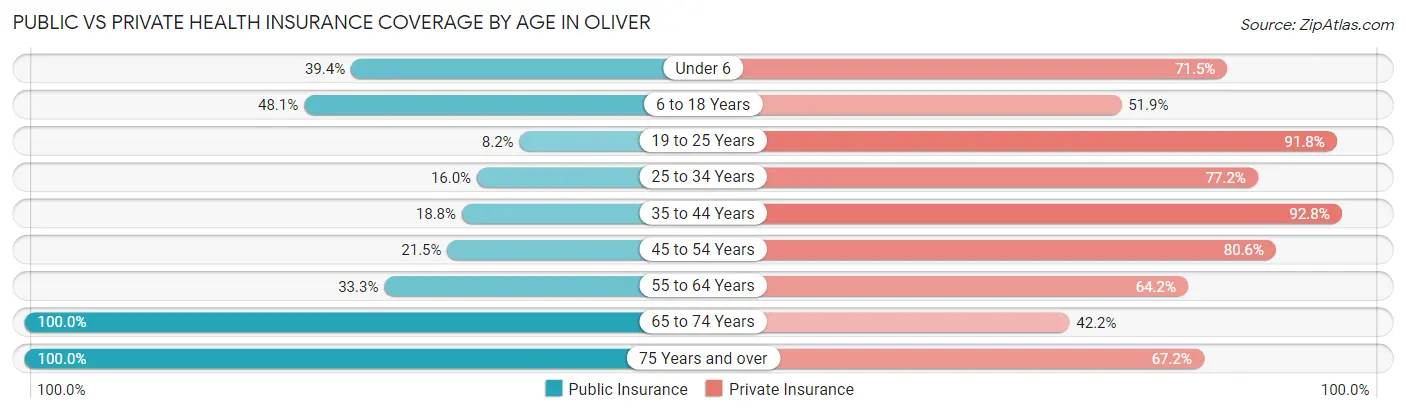
| Age Bracket | Public Insurance | Private Insurance |
| Under 6 | 54 (39.4%) | 98 (71.5%) |
| 6 to 18 Years | 90 (48.1%) | 97 (51.9%) |
| 19 to 25 Years | 8 (8.2%) | 90 (91.8%) |
| 25 to 34 Years | 64 (16.0%) | 308 (77.2%) |
| 35 to 44 Years | 39 (18.8%) | 192 (92.7%) |
| 45 to 54 Years | 62 (21.5%) | 232 (80.6%) |
| 55 to 64 Years | 131 (33.3%) | 253 (64.2%) |
| 65 to 74 Years | 232 (100.0%) | 98 (42.2%) |
| 75 Years and over | 198 (100.0%) | 133 (67.2%) |
| Total | 878 (41.0%) | 1,501 (70.1%) |
Disability Status by Sex by Age in Oliver
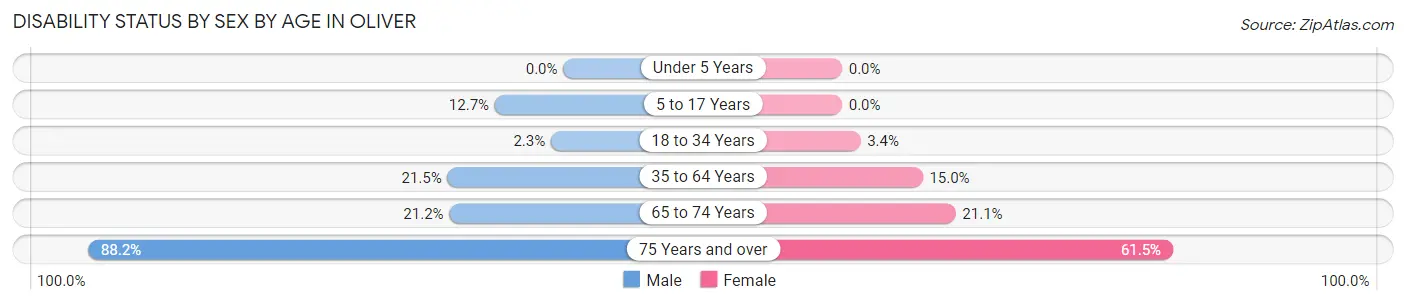
| Age Bracket | Male | Female |
| Under 5 Years | 0 (0.0%) | 0 (0.0%) |
| 5 to 17 Years | 16 (12.7%) | 0 (0.0%) |
| 18 to 34 Years | 6 (2.3%) | 8 (3.4%) |
| 35 to 64 Years | 92 (21.5%) | 69 (15.0%) |
| 65 to 74 Years | 22 (21.1%) | 27 (21.1%) |
| 75 Years and over | 90 (88.2%) | 59 (61.5%) |
Disability Class by Sex by Age in Oliver
Disability Class: Hearing Difficulty
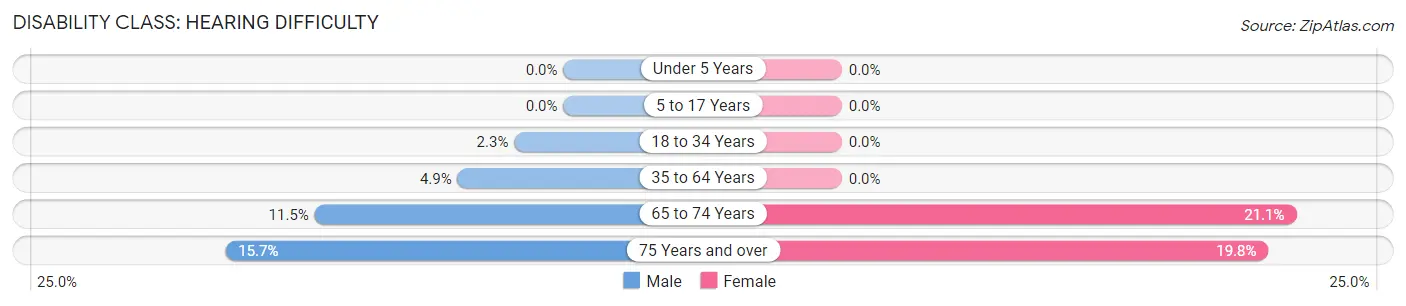
| Age Bracket | Male | Female |
| Under 5 Years | 0 (0.0%) | 0 (0.0%) |
| 5 to 17 Years | 0 (0.0%) | 0 (0.0%) |
| 18 to 34 Years | 6 (2.3%) | 0 (0.0%) |
| 35 to 64 Years | 21 (4.9%) | 0 (0.0%) |
| 65 to 74 Years | 12 (11.5%) | 27 (21.1%) |
| 75 Years and over | 16 (15.7%) | 19 (19.8%) |
Disability Class: Vision Difficulty
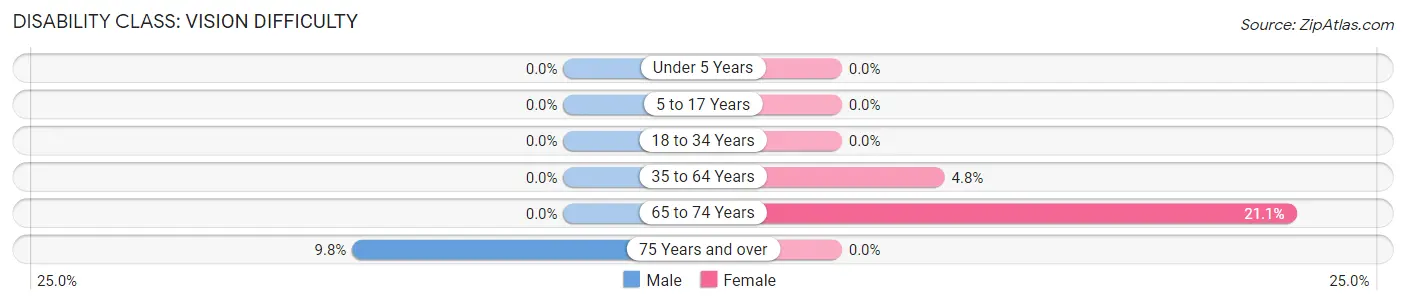
| Age Bracket | Male | Female |
| Under 5 Years | 0 (0.0%) | 0 (0.0%) |
| 5 to 17 Years | 0 (0.0%) | 0 (0.0%) |
| 18 to 34 Years | 0 (0.0%) | 0 (0.0%) |
| 35 to 64 Years | 0 (0.0%) | 22 (4.8%) |
| 65 to 74 Years | 0 (0.0%) | 27 (21.1%) |
| 75 Years and over | 10 (9.8%) | 0 (0.0%) |
Disability Class: Cognitive Difficulty
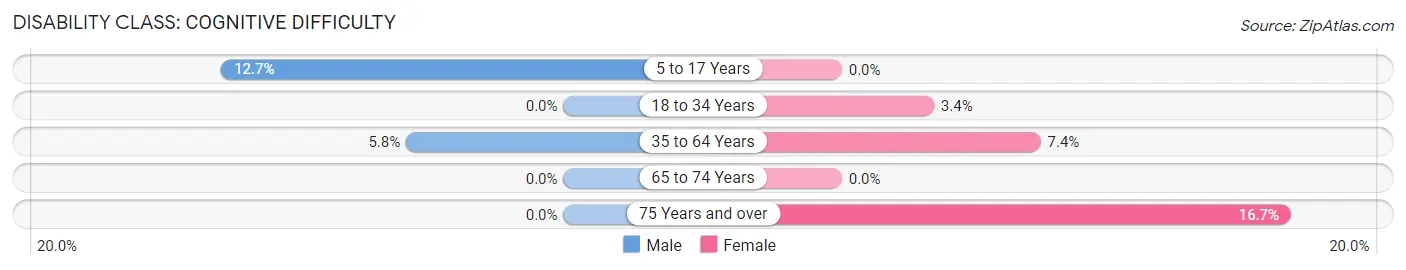
| Age Bracket | Male | Female |
| 5 to 17 Years | 16 (12.7%) | 0 (0.0%) |
| 18 to 34 Years | 0 (0.0%) | 8 (3.4%) |
| 35 to 64 Years | 25 (5.8%) | 34 (7.4%) |
| 65 to 74 Years | 0 (0.0%) | 0 (0.0%) |
| 75 Years and over | 0 (0.0%) | 16 (16.7%) |
Disability Class: Ambulatory Difficulty
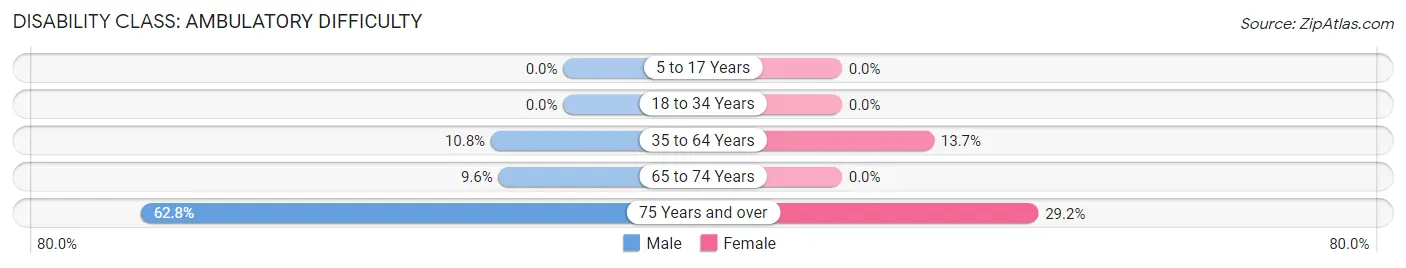
| Age Bracket | Male | Female |
| 5 to 17 Years | 0 (0.0%) | 0 (0.0%) |
| 18 to 34 Years | 0 (0.0%) | 0 (0.0%) |
| 35 to 64 Years | 46 (10.7%) | 63 (13.7%) |
| 65 to 74 Years | 10 (9.6%) | 0 (0.0%) |
| 75 Years and over | 64 (62.7%) | 28 (29.2%) |
Disability Class: Self-Care Difficulty
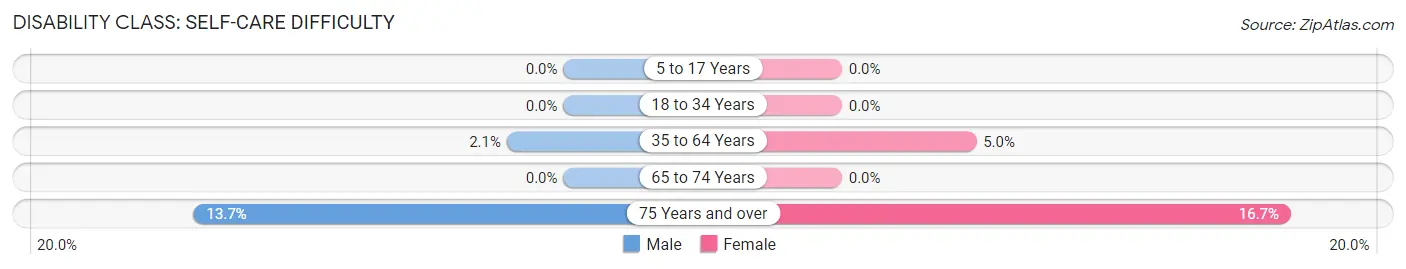
| Age Bracket | Male | Female |
| 5 to 17 Years | 0 (0.0%) | 0 (0.0%) |
| 18 to 34 Years | 0 (0.0%) | 0 (0.0%) |
| 35 to 64 Years | 9 (2.1%) | 23 (5.0%) |
| 65 to 74 Years | 0 (0.0%) | 0 (0.0%) |
| 75 Years and over | 14 (13.7%) | 16 (16.7%) |
Technology Access in Oliver
Computing Device Access in Oliver
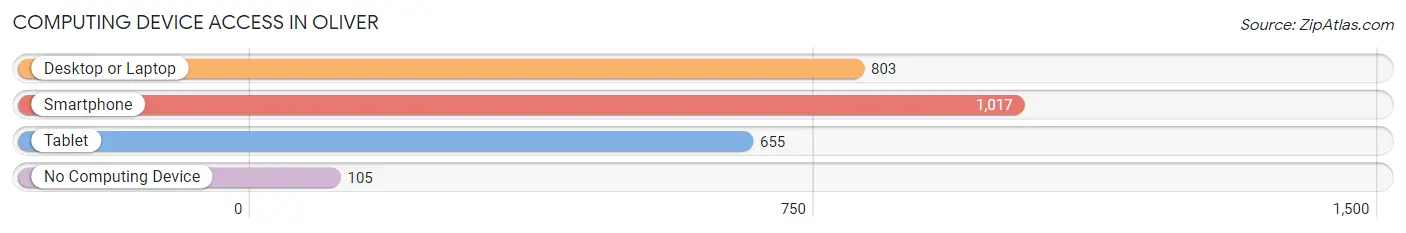
| Device Type | # Households | % Households |
| Desktop or Laptop | 803 | 66.9% |
| Smartphone | 1,017 | 84.7% |
| Tablet | 655 | 54.5% |
| No Computing Device | 105 | 8.7% |
| Total | 1,201 | 100.0% |
Internet Access in Oliver
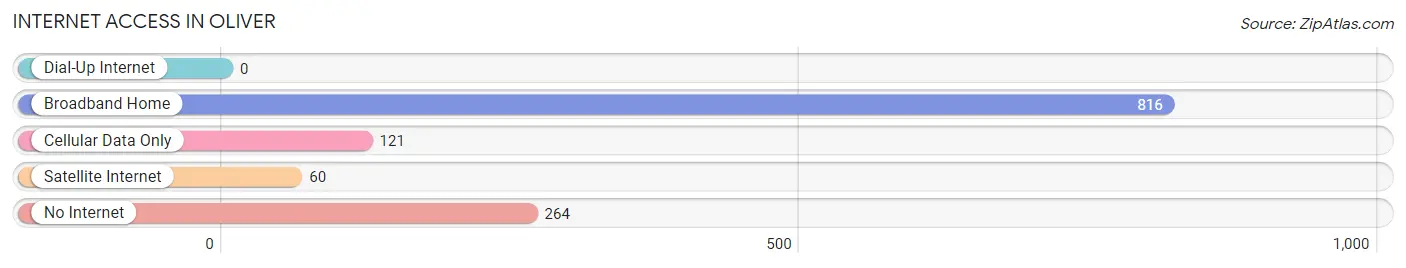
| Internet Type | # Households | % Households |
| Dial-Up Internet | 0 | 0.0% |
| Broadband Home | 816 | 67.9% |
| Cellular Data Only | 121 | 10.1% |
| Satellite Internet | 60 | 5.0% |
| No Internet | 264 | 22.0% |
| Total | 1,201 | 100.0% |
Oliver Summary
Oliver is a small borough located in Allegheny County, Pennsylvania. It is situated in the western part of the state, approximately 10 miles northwest of the city of Pittsburgh. The borough was founded in 1891 and is named after Oliver Hazard Perry, a naval hero of the War of 1812. As of the 2010 census, the population of Oliver was 1,845.
Geography
Oliver is located at 40°31'17" North, 79°59'45" West (40.5214, -79.9958). It is situated in the western part of Allegheny County, approximately 10 miles northwest of the city of Pittsburgh. The borough has a total area of 0.6 square miles, all of which is land.
The borough is bordered by the boroughs of Bellevue and Avalon to the east, Ross Township to the south, and Ohio Township to the west. The northern border of the borough is formed by the Ohio River.
Climate
Oliver has a humid continental climate, with cold, snowy winters and hot, humid summers. The average annual temperature is 48°F, with an average high of 62°F in July and an average low of 33°F in January. The average annual precipitation is 40 inches, with an average of 3.5 inches of snowfall per year.
Demographics
As of the 2010 census, there were 1,845 people, 745 households, and 486 families residing in the borough. The population density was 3,072.5 people per square mile. There were 809 housing units at an average density of 1,346.7 per square mile. The racial makeup of the borough was 94.2% White, 2.7% African American, 0.2% Native American, 0.7% Asian, 0.1% Pacific Islander, 0.7% from other races, and 1.4% from two or more races. Hispanic or Latino of any race were 1.7% of the population.
There were 745 households, out of which 24.7% had children under the age of 18 living with them, 44.2% were married couples living together, 13.2% had a female householder with no husband present, and 37.2% were non-families. 32.2% of all households were made up of individuals, and 14.2% had someone living alone who was 65 years of age or older. The average household size was 2.47 and the average family size was 3.14.
The median age in the borough was 41.2 years. 20.7% of residents were under the age of 18; 8.2% were between the ages of 18 and 24; 25.2% were from 25 to 44; 28.3% were from 45 to 64; and 17.6% were 65 years of age or older. The gender makeup of the borough was 48.2% male and 51.8% female.
Economy
The economy of Oliver is largely based on the service industry. The borough is home to a variety of restaurants, retail stores, and other businesses. The largest employer in the borough is the Allegheny Valley Hospital, which employs over 1,000 people. Other major employers include the Allegheny County Airport, the Allegheny County Courthouse, and the Allegheny County Jail.
The median household income in Oliver was $41,944 in 2018, and the median family income was $50,938. The per capita income was $22,945. About 11.2% of families and 14.2% of the population were below the poverty line, including 19.2% of those under age 18 and 8.2% of those age 65 or over.
Conclusion
Oliver is a small borough located in Allegheny County, Pennsylvania. It is situated in the western part of the state, approximately 10 miles northwest of the city of Pittsburgh. The borough was founded in 1891 and is named after Oliver Hazard Perry, a naval hero of the War of 1812. As of the 2010 census, the population of Oliver was 1,845. The borough has a humid continental climate, with cold, snowy winters and hot, humid summers. The economy of Oliver is largely based on the service industry, with the largest employer being the Allegheny Valley Hospital. The median household income in Oliver was $41,944 in 2018, and the median family income was $50,938. About 11.2% of families and 14.2% of the population were below the poverty line.
Common Questions
What is the Total Population of Oliver?
Total Population of Oliver is 2,283.
What is the Total Male Population of Oliver?
Total Male Population of Oliver is 1,117.
What is the Total Female Population of Oliver?
Total Female Population of Oliver is 1,166.
What is the Ratio of Males per 100 Females in Oliver?
There are 95.80 Males per 100 Females in Oliver.
What is the Ratio of Females per 100 Males in Oliver?
There are 104.39 Females per 100 Males in Oliver.
What is the Median Population Age in Oliver?
Median Population Age in Oliver is 49.7 Years.
What is the Average Family Size in Oliver
Average Family Size in Oliver is 2.6 People.
What is the Average Household Size in Oliver
Average Household Size in Oliver is 1.7 People.
What is Per Capita Income in Oliver?
Per Capita income in Oliver is $31,563.
What is the Median Family Income in Oliver?
Median Family Income in Oliver is $57,750.
What is the Median Household income in Oliver?
Median Household Income in Oliver is $51,301.
What is Income or Wage Gap in Oliver?
Income or Wage Gap in Oliver is 16.5%.
Women in Oliver earn 83.5 cents for every dollar earned by a man.
What is Inequality or Gini Index in Oliver?
Inequality or Gini Index in Oliver is 0.41.
How Large is the Labor Force in Oliver?
There are 1,205 People in the Labor Forcein in Oliver.
What is the Percentage of People in the Labor Force in Oliver?
61.2% of People are in the Labor Force in Oliver.
What is the Unemployment Rate in Oliver?
Unemployment Rate in Oliver is 6.4%.