Plymouth Meeting, PA
Plymouth Meeting Map
Plymouth Meeting Overview
6,756
TOTAL POPULATION
3,052
MALE POPULATION
3,704
FEMALE POPULATION
82.40
MALES / 100 FEMALES
121.36
FEMALES / 100 MALES
38.5
MEDIAN AGE
3.0
AVG FAMILY SIZE
2.3
AVG HOUSEHOLD SIZE
$59,497
PER CAPITA INCOME
$152,292
AVG FAMILY INCOME
$120,662
AVG HOUSEHOLD INCOME
24.4%
WAGE / INCOME GAP [ % ]
75.6¢/ $1
WAGE / INCOME GAP [ $ ]
$3,229
FAMILY INCOME DEFICIT
0.40
INEQUALITY / GINI INDEX
3,662
LABOR FORCE [ PEOPLE ]
68.0%
PERCENT IN LABOR FORCE
3.0%
UNEMPLOYMENT RATE
Plymouth Meeting Zip Codes
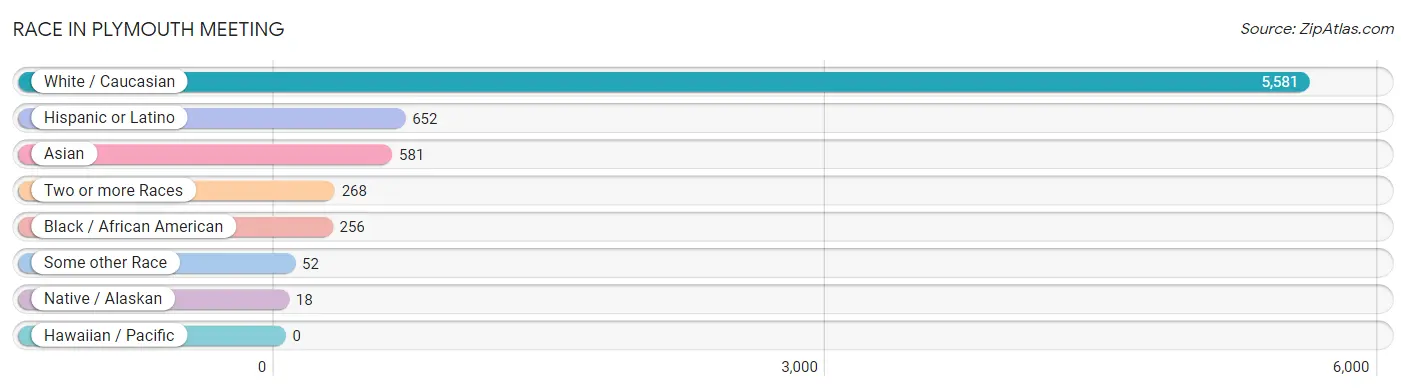
Race in Plymouth Meeting
The most populous races in Plymouth Meeting are White / Caucasian (5,581 | 82.6%), Hispanic or Latino (652 | 9.7%), and Asian (581 | 8.6%).
| Race | # Population | % Population |
| Asian | 581 | 8.6% |
| Black / African American | 256 | 3.8% |
| Hawaiian / Pacific | 0 | 0.0% |
| Hispanic or Latino | 652 | 9.7% |
| Native / Alaskan | 18 | 0.3% |
| White / Caucasian | 5,581 | 82.6% |
| Two or more Races | 268 | 4.0% |
| Some other Race | 52 | 0.8% |
| Total | 6,756 | 100.0% |
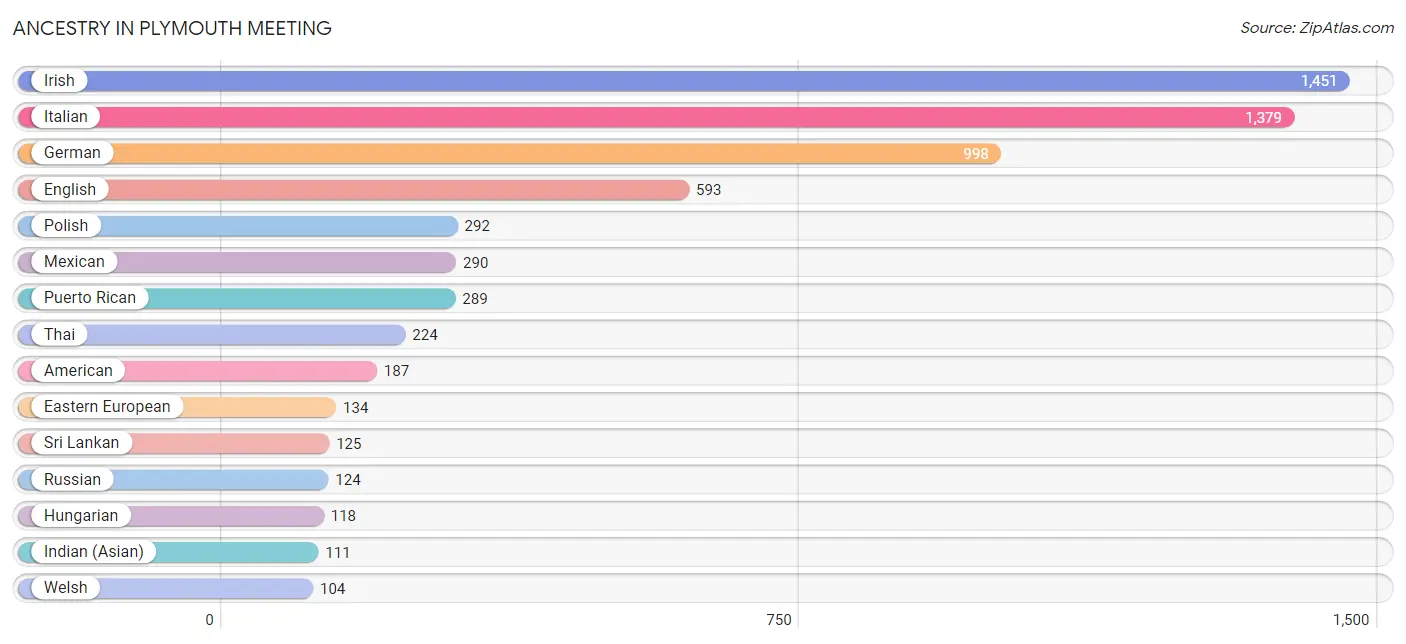
Ancestry in Plymouth Meeting
The most populous ancestries reported in Plymouth Meeting are Irish (1,451 | 21.5%), Italian (1,379 | 20.4%), German (998 | 14.8%), English (593 | 8.8%), and Polish (292 | 4.3%), together accounting for 69.8% of all Plymouth Meeting residents.
| Ancestry | # Population | % Population |
| American | 187 | 2.8% |
| Arab | 13 | 0.2% |
| Armenian | 34 | 0.5% |
| Austrian | 51 | 0.7% |
| Barbadian | 13 | 0.2% |
| Bhutanese | 8 | 0.1% |
| Brazilian | 13 | 0.2% |
| British | 38 | 0.6% |
| Burmese | 18 | 0.3% |
| Canadian | 27 | 0.4% |
| Central American | 3 | 0.0% |
| Cherokee | 38 | 0.6% |
| Colombian | 43 | 0.6% |
| Croatian | 8 | 0.1% |
| Czech | 9 | 0.1% |
| Czechoslovakian | 10 | 0.2% |
| Dominican | 7 | 0.1% |
| Dutch | 36 | 0.5% |
| Eastern European | 134 | 2.0% |
| Ecuadorian | 8 | 0.1% |
| English | 593 | 8.8% |
| European | 98 | 1.5% |
| French | 39 | 0.6% |
| German | 998 | 14.8% |
| Greek | 21 | 0.3% |
| Honduran | 3 | 0.0% |
| Hungarian | 118 | 1.8% |
| Indian (Asian) | 111 | 1.6% |
| Irish | 1,451 | 21.5% |
| Italian | 1,379 | 20.4% |
| Jamaican | 19 | 0.3% |
| Korean | 58 | 0.9% |
| Liberian | 47 | 0.7% |
| Macedonian | 7 | 0.1% |
| Malaysian | 10 | 0.2% |
| Mexican | 290 | 4.3% |
| Native Hawaiian | 51 | 0.7% |
| Northern European | 16 | 0.2% |
| Polish | 292 | 4.3% |
| Portuguese | 7 | 0.1% |
| Puerto Rican | 289 | 4.3% |
| Russian | 124 | 1.8% |
| Scotch-Irish | 68 | 1.0% |
| Scottish | 43 | 0.6% |
| Slovak | 34 | 0.5% |
| Slovene | 8 | 0.1% |
| South American | 51 | 0.7% |
| South American Indian | 10 | 0.2% |
| Spanish | 12 | 0.2% |
| Spanish American Indian | 18 | 0.3% |
| Sri Lankan | 125 | 1.8% |
| Subsaharan African | 51 | 0.7% |
| Thai | 224 | 3.3% |
| Ukrainian | 76 | 1.1% |
| Welsh | 104 | 1.5% | View All 55 Rows |
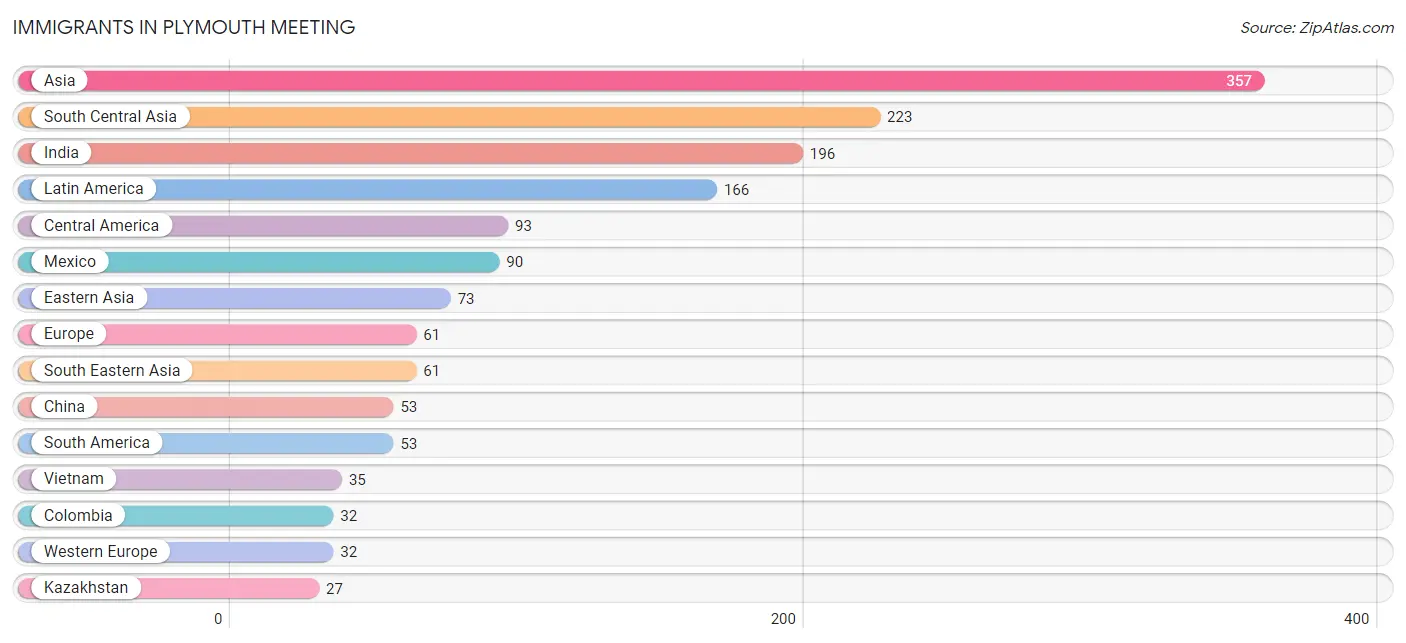
Immigrants in Plymouth Meeting
The most numerous immigrant groups reported in Plymouth Meeting came from Asia (357 | 5.3%), South Central Asia (223 | 3.3%), India (196 | 2.9%), Latin America (166 | 2.5%), and Central America (93 | 1.4%), together accounting for 15.3% of all Plymouth Meeting residents.
| Immigration Origin | # Population | % Population |
| Africa | 7 | 0.1% |
| Asia | 357 | 5.3% |
| Austria | 10 | 0.2% |
| Brazil | 13 | 0.2% |
| Canada | 23 | 0.3% |
| Caribbean | 20 | 0.3% |
| Central America | 93 | 1.4% |
| China | 53 | 0.8% |
| Colombia | 32 | 0.5% |
| Dominican Republic | 1 | 0.0% |
| Eastern Asia | 73 | 1.1% |
| Eastern Europe | 24 | 0.4% |
| Ecuador | 8 | 0.1% |
| Europe | 61 | 0.9% |
| Germany | 22 | 0.3% |
| Honduras | 3 | 0.0% |
| Hong Kong | 11 | 0.2% |
| Hungary | 12 | 0.2% |
| India | 196 | 2.9% |
| Jamaica | 19 | 0.3% |
| Japan | 2 | 0.0% |
| Kazakhstan | 27 | 0.4% |
| Korea | 18 | 0.3% |
| Laos | 6 | 0.1% |
| Latin America | 166 | 2.5% |
| Mexico | 90 | 1.3% |
| Nigeria | 7 | 0.1% |
| Northern Europe | 5 | 0.1% |
| Philippines | 20 | 0.3% |
| South America | 53 | 0.8% |
| South Central Asia | 223 | 3.3% |
| South Eastern Asia | 61 | 0.9% |
| Taiwan | 9 | 0.1% |
| Ukraine | 12 | 0.2% |
| Vietnam | 35 | 0.5% |
| Western Africa | 7 | 0.1% |
| Western Europe | 32 | 0.5% | View All 37 Rows |
Sex and Age in Plymouth Meeting
Sex and Age in Plymouth Meeting
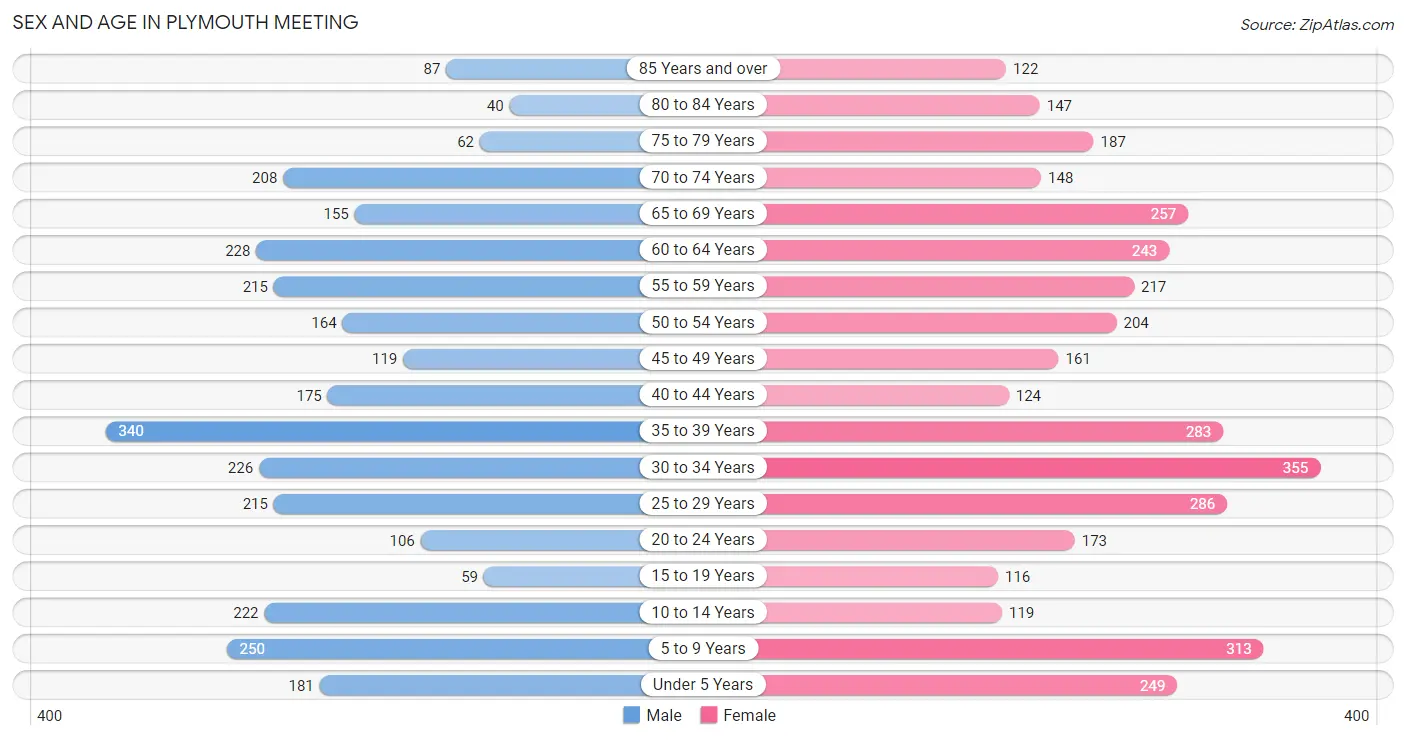
The most populous age groups in Plymouth Meeting are 35 to 39 Years (340 | 11.1%) for men and 30 to 34 Years (355 | 9.6%) for women.
| Age Bracket | Male | Female |
| Under 5 Years | 181 (5.9%) | 249 (6.7%) |
| 5 to 9 Years | 250 (8.2%) | 313 (8.5%) |
| 10 to 14 Years | 222 (7.3%) | 119 (3.2%) |
| 15 to 19 Years | 59 (1.9%) | 116 (3.1%) |
| 20 to 24 Years | 106 (3.5%) | 173 (4.7%) |
| 25 to 29 Years | 215 (7.0%) | 286 (7.7%) |
| 30 to 34 Years | 226 (7.4%) | 355 (9.6%) |
| 35 to 39 Years | 340 (11.1%) | 283 (7.6%) |
| 40 to 44 Years | 175 (5.7%) | 124 (3.4%) |
| 45 to 49 Years | 119 (3.9%) | 161 (4.3%) |
| 50 to 54 Years | 164 (5.4%) | 204 (5.5%) |
| 55 to 59 Years | 215 (7.0%) | 217 (5.9%) |
| 60 to 64 Years | 228 (7.5%) | 243 (6.6%) |
| 65 to 69 Years | 155 (5.1%) | 257 (6.9%) |
| 70 to 74 Years | 208 (6.8%) | 148 (4.0%) |
| 75 to 79 Years | 62 (2.0%) | 187 (5.1%) |
| 80 to 84 Years | 40 (1.3%) | 147 (4.0%) |
| 85 Years and over | 87 (2.9%) | 122 (3.3%) |
| Total | 3,052 (100.0%) | 3,704 (100.0%) |
Families and Households in Plymouth Meeting
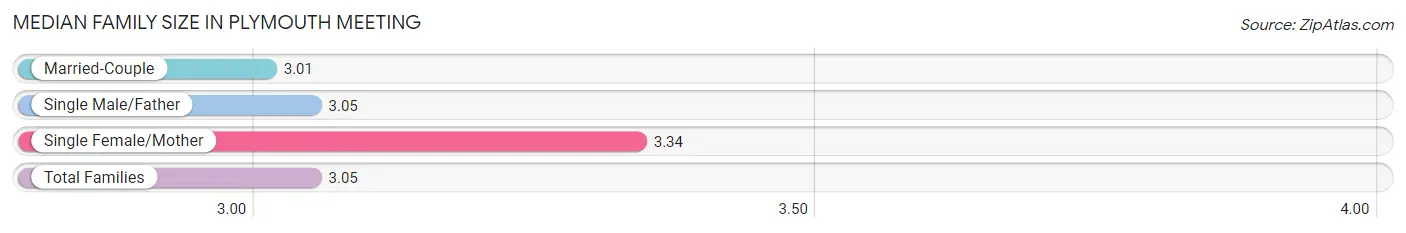
Median Family Size in Plymouth Meeting
The median family size in Plymouth Meeting is 3.05 persons per family, with single female/mother families (195 | 11.3%) accounting for the largest median family size of 3.34 persons per family. On the other hand, married-couple families (1,433 | 82.9%) represent the smallest median family size with 3.01 persons per family.
| Family Type | # Families | Family Size |
| Married-Couple | 1,433 (82.9%) | 3.01 |
| Single Male/Father | 101 (5.8%) | 3.05 |
| Single Female/Mother | 195 (11.3%) | 3.34 |
| Total Families | 1,729 (100.0%) | 3.05 |
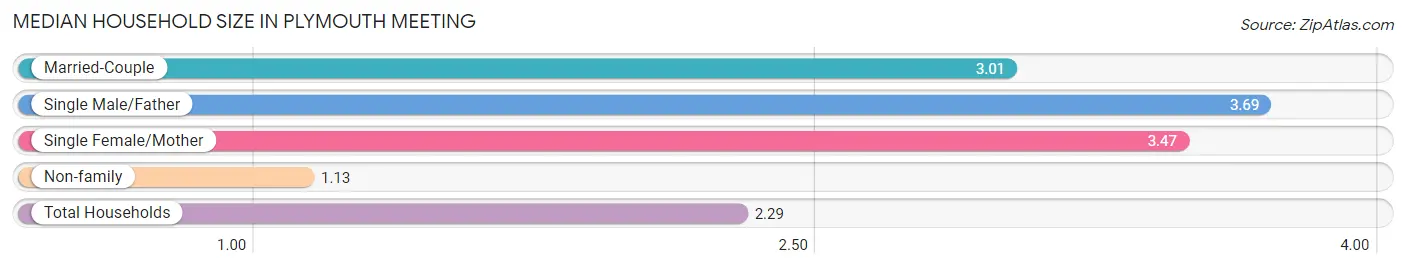
Median Household Size in Plymouth Meeting
The median household size in Plymouth Meeting is 2.29 persons per household, with single male/father households (101 | 3.4%) accounting for the largest median household size of 3.69 persons per household. non-family households (1,205 | 41.1%) represent the smallest median household size with 1.13 persons per household.
| Household Type | # Households | Household Size |
| Married-Couple | 1,433 (48.8%) | 3.01 |
| Single Male/Father | 101 (3.4%) | 3.69 |
| Single Female/Mother | 195 (6.7%) | 3.47 |
| Non-family | 1,205 (41.1%) | 1.13 |
| Total Households | 2,934 (100.0%) | 2.29 |
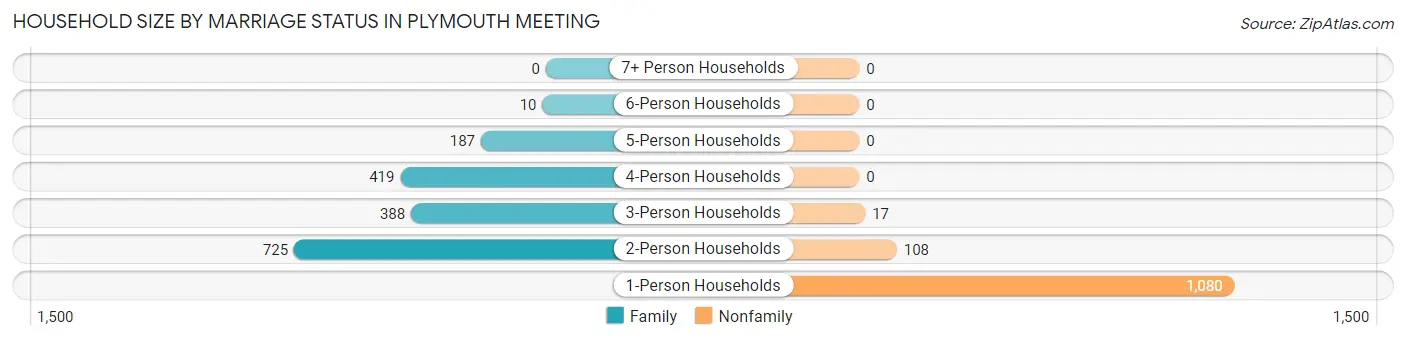
Household Size by Marriage Status in Plymouth Meeting
Out of a total of 2,934 households in Plymouth Meeting, 1,729 (58.9%) are family households, while 1,205 (41.1%) are nonfamily households. The most numerous type of family households are 2-person households, comprising 725, and the most common type of nonfamily households are 1-person households, comprising 1,080.
| Household Size | Family Households | Nonfamily Households |
| 1-Person Households | - | 1,080 (36.8%) |
| 2-Person Households | 725 (24.7%) | 108 (3.7%) |
| 3-Person Households | 388 (13.2%) | 17 (0.6%) |
| 4-Person Households | 419 (14.3%) | 0 (0.0%) |
| 5-Person Households | 187 (6.4%) | 0 (0.0%) |
| 6-Person Households | 10 (0.3%) | 0 (0.0%) |
| 7+ Person Households | 0 (0.0%) | 0 (0.0%) |
| Total | 1,729 (58.9%) | 1,205 (41.1%) |
Female Fertility in Plymouth Meeting
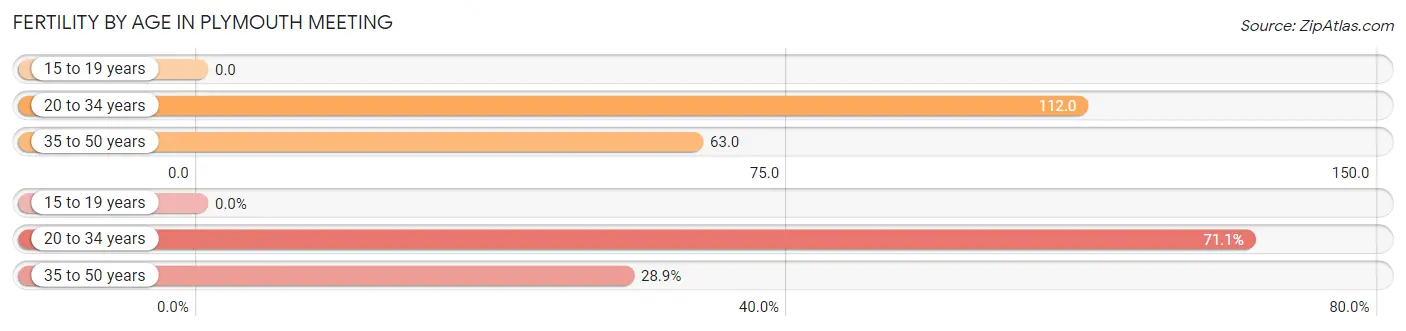
Fertility by Age in Plymouth Meeting
Average fertility rate in Plymouth Meeting is 84.0 births per 1,000 women. Women in the age bracket of 20 to 34 years have the highest fertility rate with 112.0 births per 1,000 women. Women in the age bracket of 20 to 34 years acount for 71.1% of all women with births.
| Age Bracket | Women with Births | Births / 1,000 Women |
| 15 to 19 years | 0 (0.0%) | 0.0 |
| 20 to 34 years | 91 (71.1%) | 112.0 |
| 35 to 50 years | 37 (28.9%) | 63.0 |
| Total | 128 (100.0%) | 84.0 |
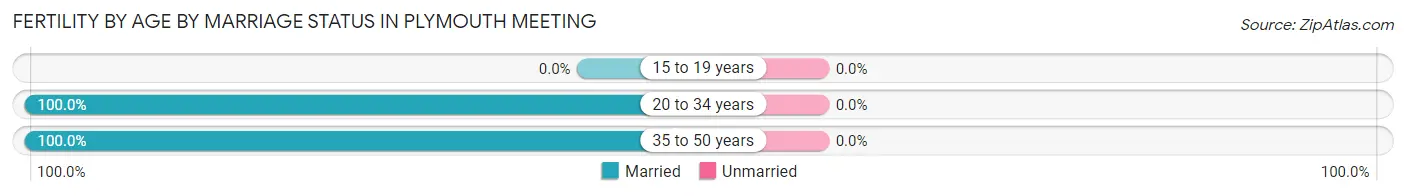
Fertility by Age by Marriage Status in Plymouth Meeting
| Age Bracket | Married | Unmarried |
| 15 to 19 years | 0 (0.0%) | 0 (0.0%) |
| 20 to 34 years | 91 (100.0%) | 0 (0.0%) |
| 35 to 50 years | 37 (100.0%) | 0 (0.0%) |
| Total | 128 (100.0%) | 0 (0.0%) |
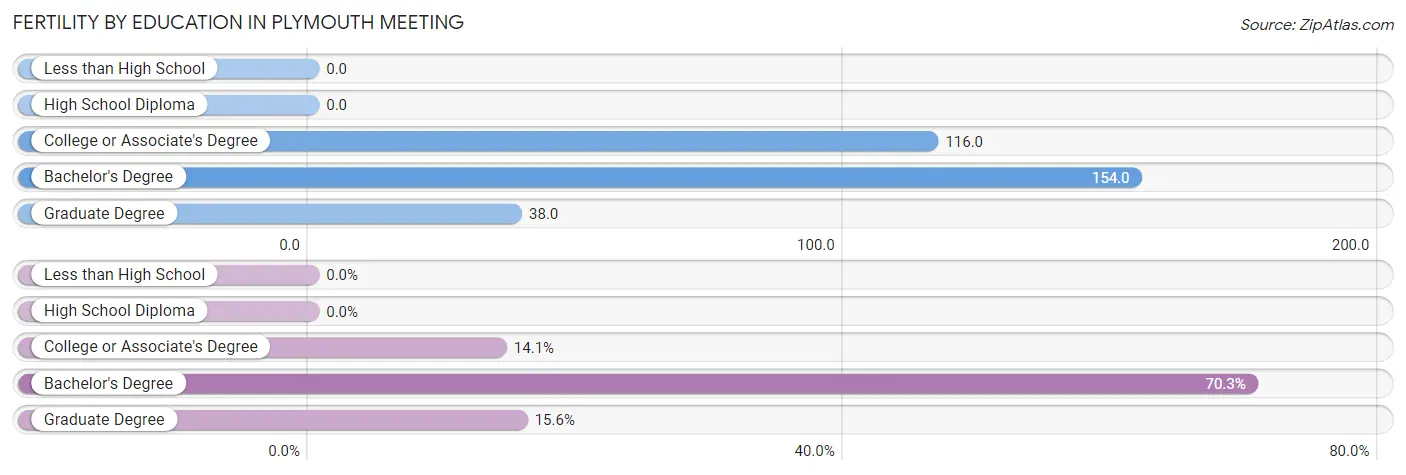
Fertility by Education in Plymouth Meeting
| Educational Attainment | Women with Births | Births / 1,000 Women |
| Less than High School | 0 (0.0%) | 0.0 |
| High School Diploma | 0 (0.0%) | 0.0 |
| College or Associate's Degree | 18 (14.1%) | 116.0 |
| Bachelor's Degree | 90 (70.3%) | 154.0 |
| Graduate Degree | 20 (15.6%) | 38.0 |
| Total | 128 (100.0%) | 84.0 |
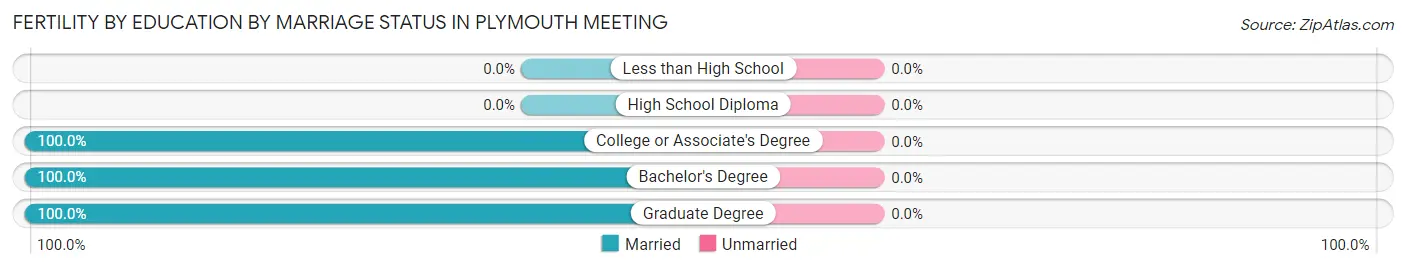
Fertility by Education by Marriage Status in Plymouth Meeting
| Educational Attainment | Married | Unmarried |
| Less than High School | 0 (0.0%) | 0 (0.0%) |
| High School Diploma | 0 (0.0%) | 0 (0.0%) |
| College or Associate's Degree | 18 (100.0%) | 0 (0.0%) |
| Bachelor's Degree | 90 (100.0%) | 0 (0.0%) |
| Graduate Degree | 20 (100.0%) | 0 (0.0%) |
| Total | 128 (100.0%) | 0 (0.0%) |
Income in Plymouth Meeting
Income Overview in Plymouth Meeting
Per Capita Income in Plymouth Meeting is $59,497, while median incomes of families and households are $152,292 and $120,662 respectively.
| Characteristic | Number | Measure |
| Per Capita Income | 6,756 | $59,497 |
| Median Family Income | 1,729 | $152,292 |
| Mean Family Income | 1,729 | $176,910 |
| Median Household Income | 2,934 | $120,662 |
| Mean Household Income | 2,934 | $135,714 |
| Income Deficit | 1,729 | $3,229 |
| Wage / Income Gap (%) | 6,756 | 24.40% |
| Wage / Income Gap ($) | 6,756 | 75.60¢ per $1 |
| Gini / Inequality Index | 6,756 | 0.40 |
Earnings by Sex in Plymouth Meeting
Average Earnings in Plymouth Meeting are $75,102, $85,852 for men and $64,907 for women, a difference of 24.4%.
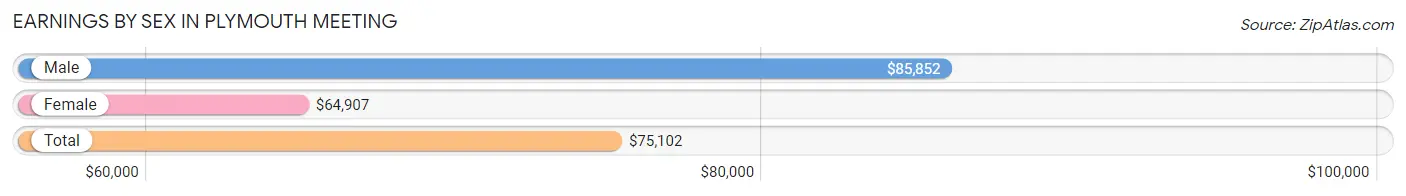
| Sex | Number | Average Earnings |
| Male | 1,827 (48.4%) | $85,852 |
| Female | 1,944 (51.5%) | $64,907 |
| Total | 3,771 (100.0%) | $75,102 |
Earnings by Sex by Income Bracket in Plymouth Meeting
The most common earnings brackets in Plymouth Meeting are $100,000+ for men (682 | 37.3%) and $100,000+ for women (453 | 23.3%).
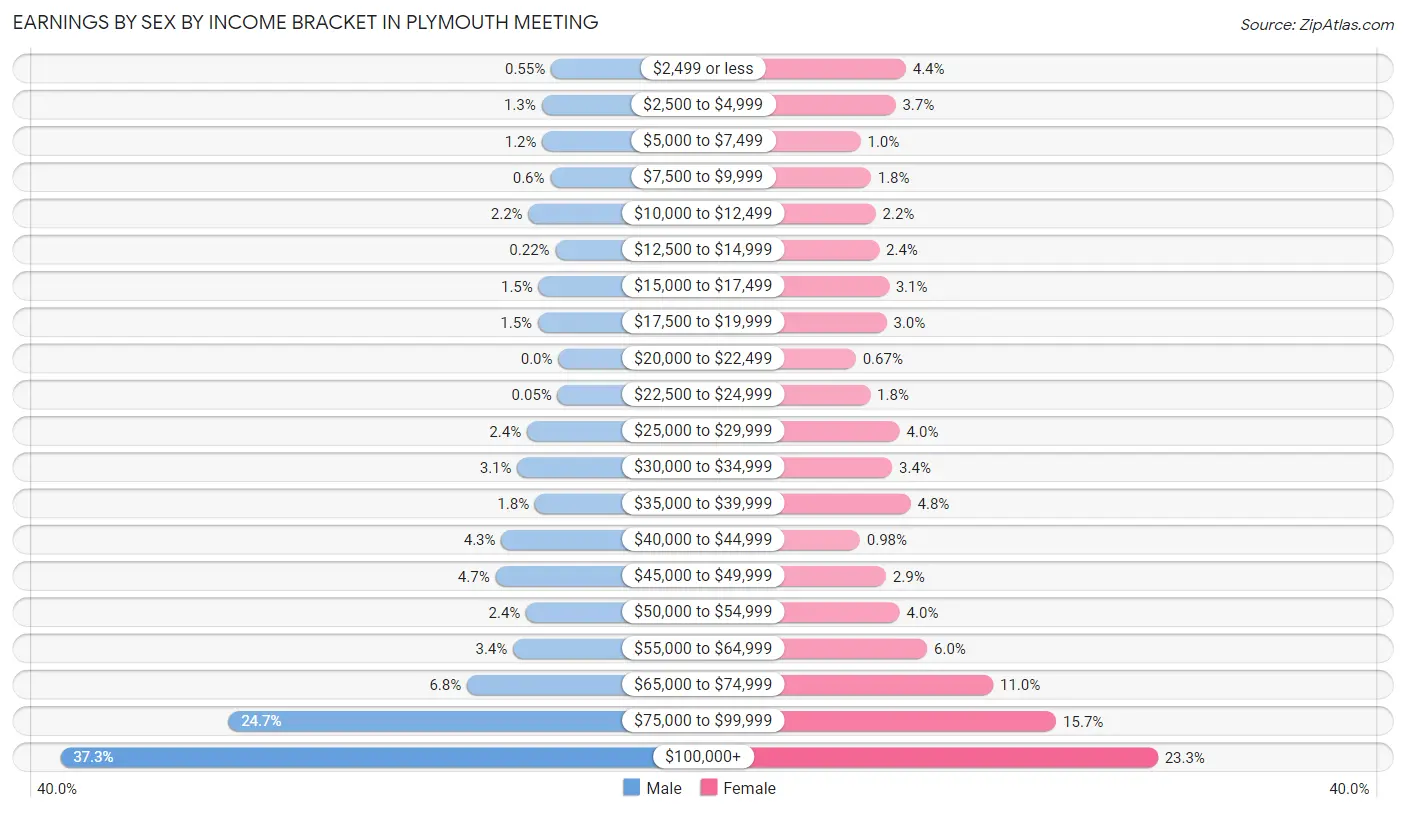
| Income | Male | Female |
| $2,499 or less | 10 (0.5%) | 86 (4.4%) |
| $2,500 to $4,999 | 23 (1.3%) | 71 (3.6%) |
| $5,000 to $7,499 | 22 (1.2%) | 20 (1.0%) |
| $7,500 to $9,999 | 11 (0.6%) | 35 (1.8%) |
| $10,000 to $12,499 | 41 (2.2%) | 42 (2.2%) |
| $12,500 to $14,999 | 4 (0.2%) | 47 (2.4%) |
| $15,000 to $17,499 | 27 (1.5%) | 61 (3.1%) |
| $17,500 to $19,999 | 28 (1.5%) | 58 (3.0%) |
| $20,000 to $22,499 | 0 (0.0%) | 13 (0.7%) |
| $22,500 to $24,999 | 1 (0.1%) | 34 (1.8%) |
| $25,000 to $29,999 | 43 (2.4%) | 77 (4.0%) |
| $30,000 to $34,999 | 56 (3.1%) | 66 (3.4%) |
| $35,000 to $39,999 | 32 (1.8%) | 93 (4.8%) |
| $40,000 to $44,999 | 78 (4.3%) | 19 (1.0%) |
| $45,000 to $49,999 | 86 (4.7%) | 57 (2.9%) |
| $50,000 to $54,999 | 44 (2.4%) | 77 (4.0%) |
| $55,000 to $64,999 | 62 (3.4%) | 117 (6.0%) |
| $65,000 to $74,999 | 125 (6.8%) | 213 (11.0%) |
| $75,000 to $99,999 | 452 (24.7%) | 305 (15.7%) |
| $100,000+ | 682 (37.3%) | 453 (23.3%) |
| Total | 1,827 (100.0%) | 1,944 (100.0%) |
Earnings by Sex by Educational Attainment in Plymouth Meeting
Average earnings in Plymouth Meeting are $89,762 for men and $68,454 for women, a difference of 23.7%. Men with an educational attainment of bachelor's degree enjoy the highest average annual earnings of $100,000, while those with college or associate's degree education earn the least with $63,214. Women with an educational attainment of graduate degree earn the most with the average annual earnings of $87,188, while those with high school diploma education have the smallest earnings of $30,938.
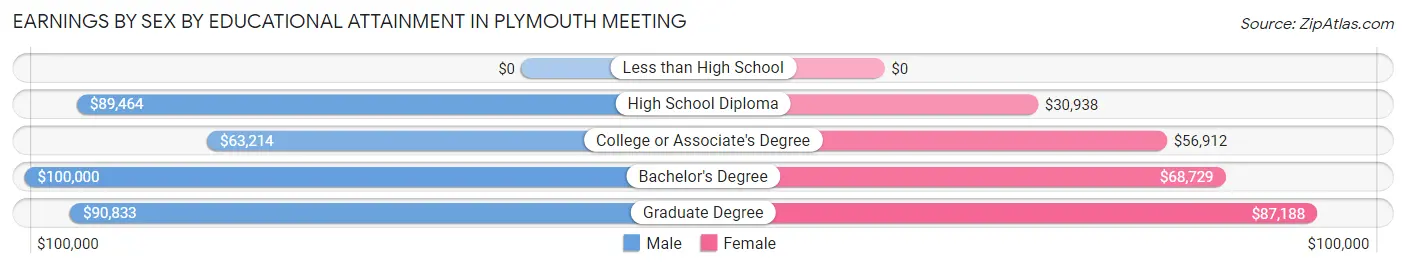
| Educational Attainment | Male Income | Female Income |
| Less than High School | - | - |
| High School Diploma | $89,464 | $30,938 |
| College or Associate's Degree | $63,214 | $56,912 |
| Bachelor's Degree | $100,000 | $68,729 |
| Graduate Degree | $90,833 | $87,188 |
| Total | $89,762 | $68,454 |
Family Income in Plymouth Meeting
Family Income Brackets in Plymouth Meeting
According to the Plymouth Meeting family income data, there are 597 families falling into the $200,000+ income range, which is the most common income bracket and makes up 34.5% of all families.
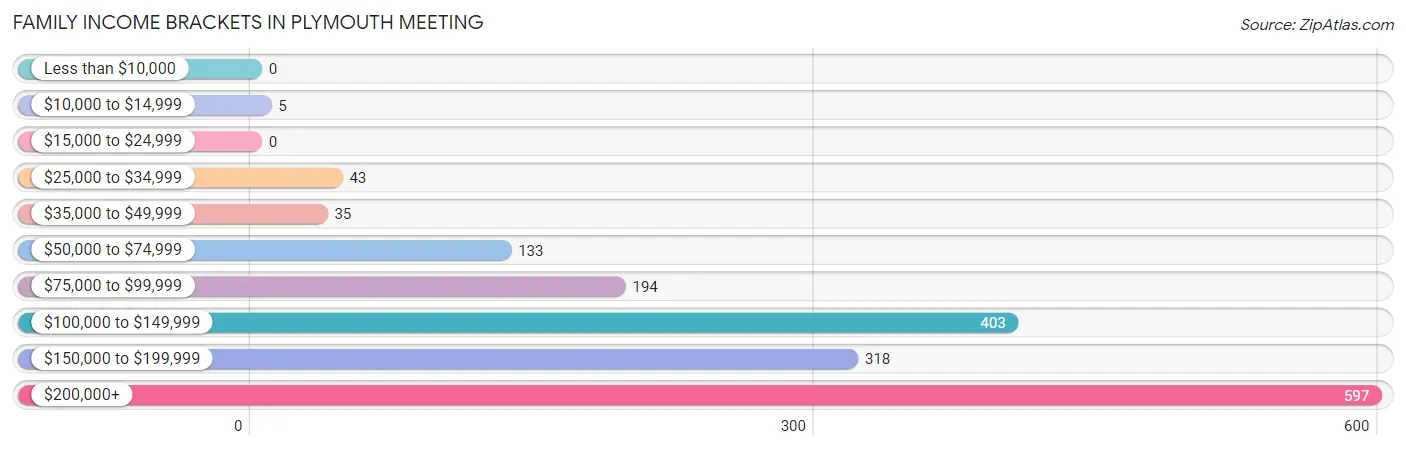
| Income Bracket | # Families | % Families |
| Less than $10,000 | 0 | 0.0% |
| $10,000 to $14,999 | 5 | 0.3% |
| $15,000 to $24,999 | 0 | 0.0% |
| $25,000 to $34,999 | 43 | 2.5% |
| $35,000 to $49,999 | 35 | 2.0% |
| $50,000 to $74,999 | 133 | 7.7% |
| $75,000 to $99,999 | 194 | 11.2% |
| $100,000 to $149,999 | 403 | 23.3% |
| $150,000 to $199,999 | 318 | 18.4% |
| $200,000+ | 597 | 34.5% |
Family Income by Famaliy Size in Plymouth Meeting
4-person families (413 | 23.9%) account for the highest median family income in Plymouth Meeting with $189,306 per family, while 2-person families (752 | 43.5%) have the highest median income of $65,529 per family member.
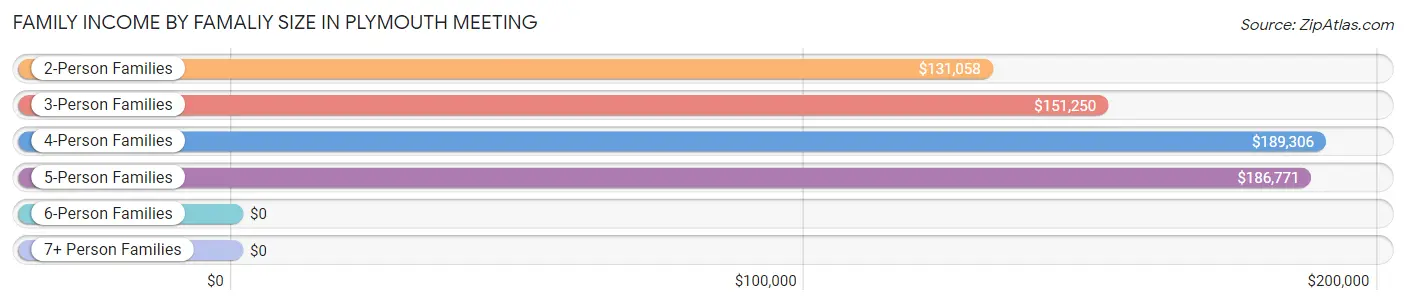
| Income Bracket | # Families | Median Income |
| 2-Person Families | 752 (43.5%) | $131,058 |
| 3-Person Families | 393 (22.7%) | $151,250 |
| 4-Person Families | 413 (23.9%) | $189,306 |
| 5-Person Families | 161 (9.3%) | $186,771 |
| 6-Person Families | 10 (0.6%) | $0 |
| 7+ Person Families | 0 (0.0%) | $0 |
| Total | 1,729 (100.0%) | $152,292 |
Family Income by Number of Earners in Plymouth Meeting
The median family income in Plymouth Meeting is $152,292, with families comprising 3+ earners (164) having the highest median family income of $241,250, while families with no earners (204) have the lowest median family income of $83,214, accounting for 9.5% and 11.8% of families, respectively.
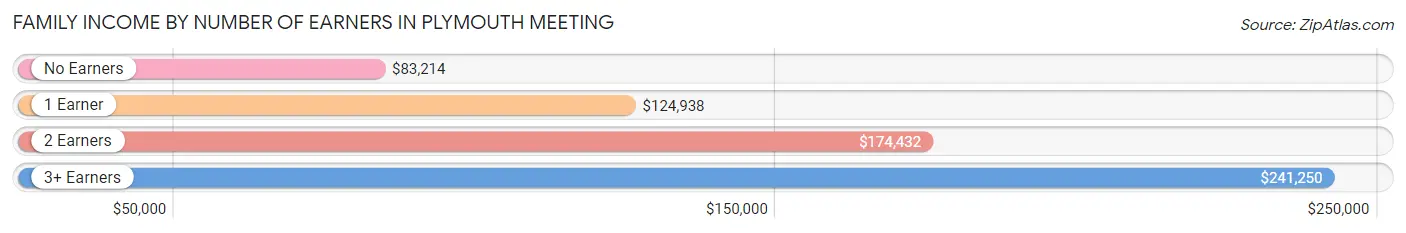
| Number of Earners | # Families | Median Income |
| No Earners | 204 (11.8%) | $83,214 |
| 1 Earner | 485 (28.1%) | $124,938 |
| 2 Earners | 876 (50.7%) | $174,432 |
| 3+ Earners | 164 (9.5%) | $241,250 |
| Total | 1,729 (100.0%) | $152,292 |
Household Income in Plymouth Meeting
Household Income Brackets in Plymouth Meeting
With 651 households falling in the category, the $200,000+ income range is the most frequent in Plymouth Meeting, accounting for 22.2% of all households. In contrast, only 29 households (1.0%) fall into the less than $10,000 income bracket, making it the least populous group.
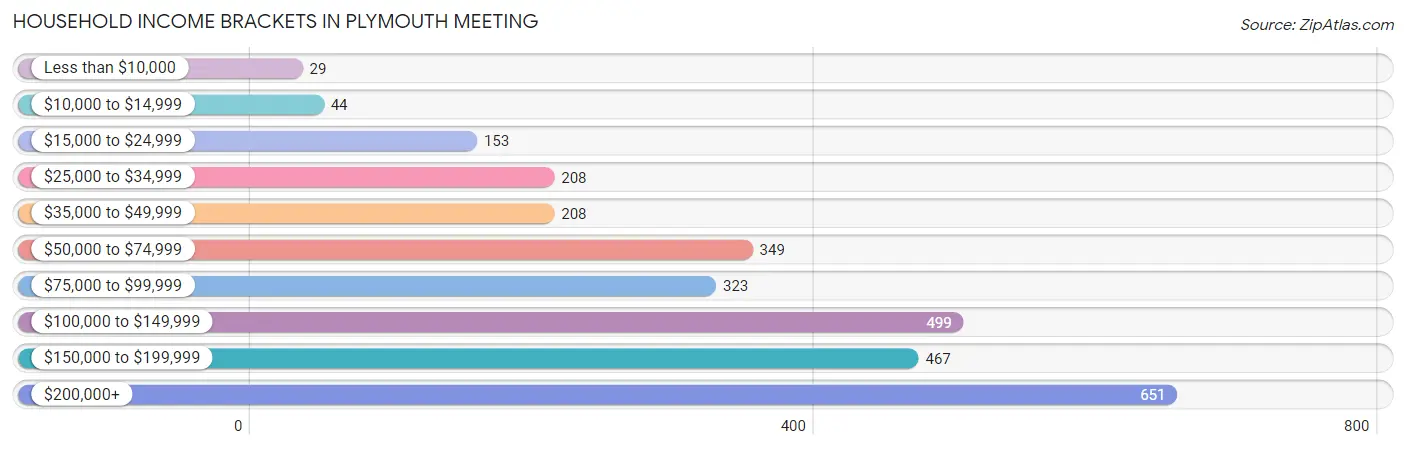
| Income Bracket | # Households | % Households |
| Less than $10,000 | 29 | 1.0% |
| $10,000 to $14,999 | 44 | 1.5% |
| $15,000 to $24,999 | 153 | 5.2% |
| $25,000 to $34,999 | 208 | 7.1% |
| $35,000 to $49,999 | 208 | 7.1% |
| $50,000 to $74,999 | 349 | 11.9% |
| $75,000 to $99,999 | 323 | 11.0% |
| $100,000 to $149,999 | 499 | 17.0% |
| $150,000 to $199,999 | 467 | 15.9% |
| $200,000+ | 651 | 22.2% |
Household Income by Householder Age in Plymouth Meeting
The median household income in Plymouth Meeting is $120,662, with the highest median household income of $150,231 found in the 25 to 44 years age bracket for the primary householder. A total of 1,019 households (34.7%) fall into this category. Meanwhile, the 15 to 24 years age bracket for the primary householder has the lowest median household income of $0, with 20 households (0.7%) in this group.
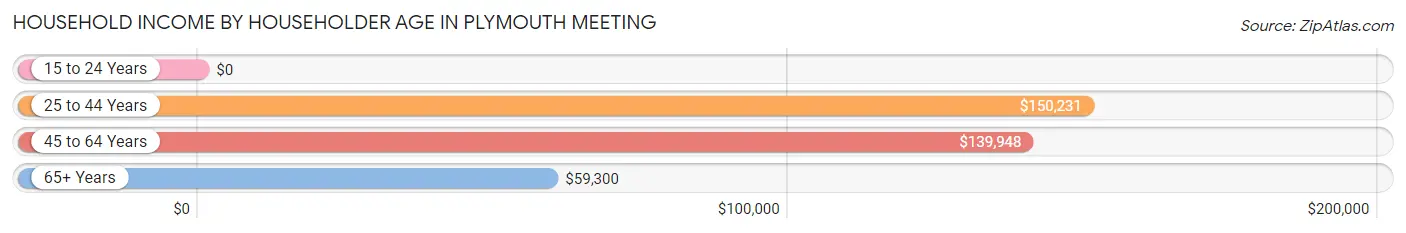
| Income Bracket | # Households | Median Income |
| 15 to 24 Years | 20 (0.7%) | $0 |
| 25 to 44 Years | 1,019 (34.7%) | $150,231 |
| 45 to 64 Years | 943 (32.1%) | $139,948 |
| 65+ Years | 952 (32.5%) | $59,300 |
| Total | 2,934 (100.0%) | $120,662 |
Poverty in Plymouth Meeting
Income Below Poverty by Sex and Age in Plymouth Meeting
With 2.3% poverty level for males and 2.1% for females among the residents of Plymouth Meeting, 65 to 74 year old males and 75 year old and over females are the most vulnerable to poverty, with 21 males (5.8%) and 24 females (5.3%) in their respective age groups living below the poverty level.
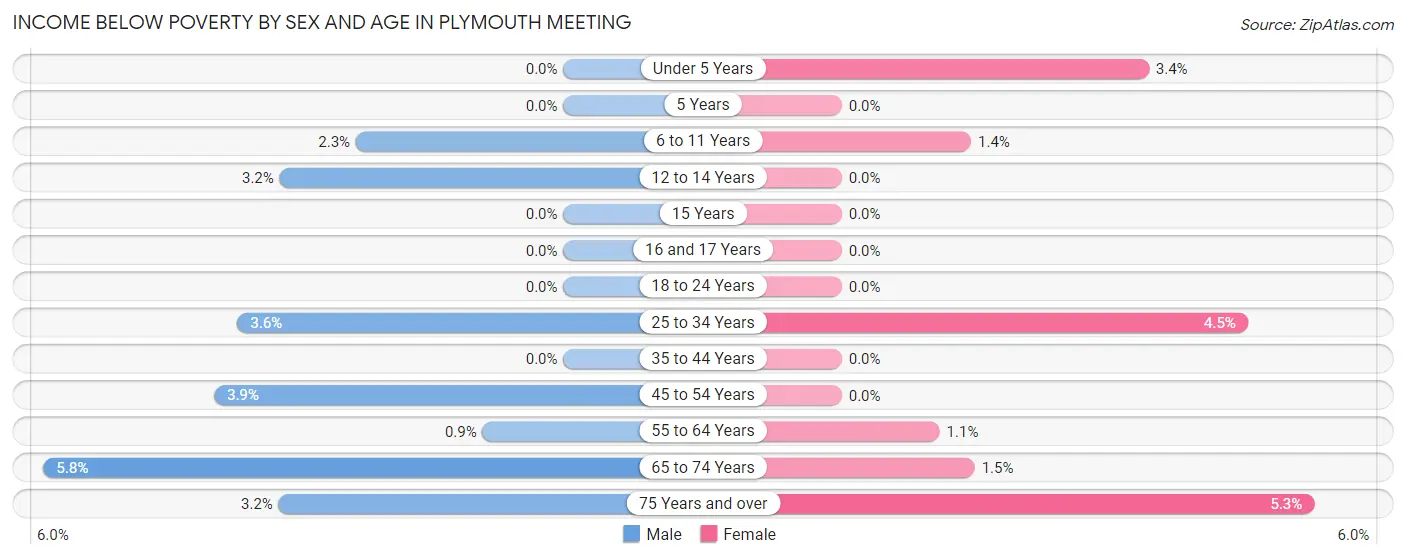
| Age Bracket | Male | Female |
| Under 5 Years | 0 (0.0%) | 8 (3.4%) |
| 5 Years | 0 (0.0%) | 0 (0.0%) |
| 6 to 11 Years | 8 (2.3%) | 3 (1.4%) |
| 12 to 14 Years | 3 (3.2%) | 0 (0.0%) |
| 15 Years | 0 (0.0%) | 0 (0.0%) |
| 16 and 17 Years | 0 (0.0%) | 0 (0.0%) |
| 18 to 24 Years | 0 (0.0%) | 0 (0.0%) |
| 25 to 34 Years | 16 (3.6%) | 29 (4.5%) |
| 35 to 44 Years | 0 (0.0%) | 0 (0.0%) |
| 45 to 54 Years | 11 (3.9%) | 0 (0.0%) |
| 55 to 64 Years | 4 (0.9%) | 5 (1.1%) |
| 65 to 74 Years | 21 (5.8%) | 6 (1.5%) |
| 75 Years and over | 6 (3.2%) | 24 (5.3%) |
| Total | 69 (2.3%) | 75 (2.1%) |
Income Above Poverty by Sex and Age in Plymouth Meeting
According to the poverty statistics in Plymouth Meeting, males aged under 5 years and females aged 5 years are the age groups that are most secure financially, with 100.0% of males and 100.0% of females in these age groups living above the poverty line.
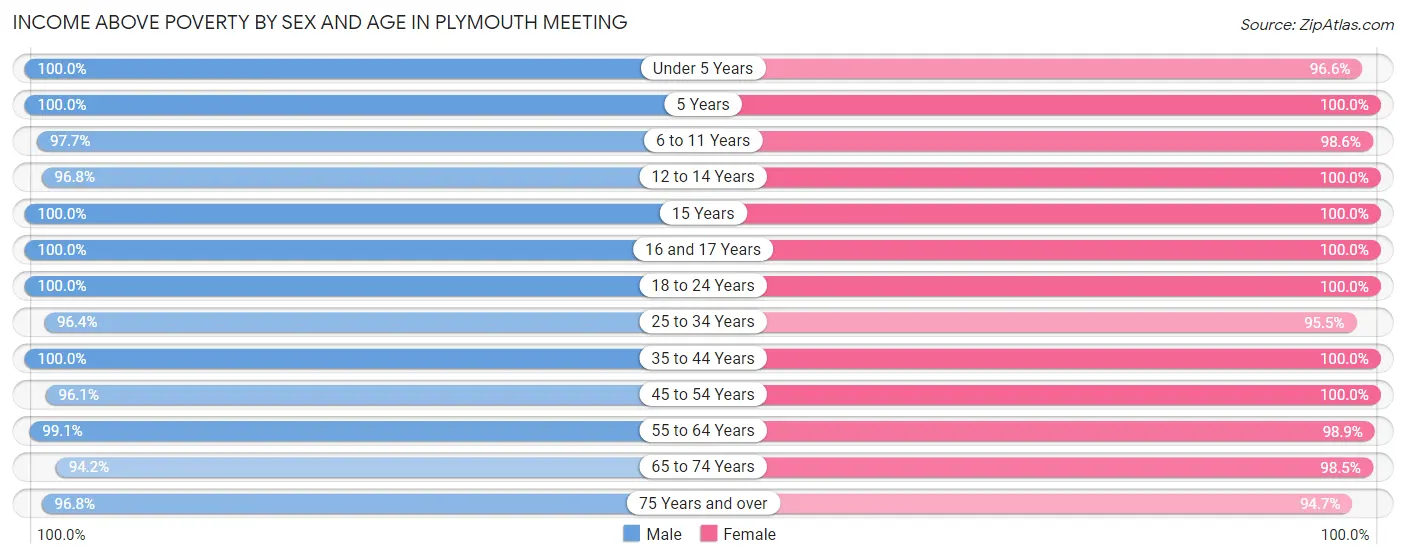
| Age Bracket | Male | Female |
| Under 5 Years | 181 (100.0%) | 226 (96.6%) |
| 5 Years | 12 (100.0%) | 114 (100.0%) |
| 6 to 11 Years | 339 (97.7%) | 205 (98.6%) |
| 12 to 14 Years | 92 (96.8%) | 87 (100.0%) |
| 15 Years | 7 (100.0%) | 27 (100.0%) |
| 16 and 17 Years | 17 (100.0%) | 73 (100.0%) |
| 18 to 24 Years | 136 (100.0%) | 187 (100.0%) |
| 25 to 34 Years | 425 (96.4%) | 612 (95.5%) |
| 35 to 44 Years | 515 (100.0%) | 407 (100.0%) |
| 45 to 54 Years | 272 (96.1%) | 365 (100.0%) |
| 55 to 64 Years | 439 (99.1%) | 455 (98.9%) |
| 65 to 74 Years | 342 (94.2%) | 399 (98.5%) |
| 75 Years and over | 183 (96.8%) | 432 (94.7%) |
| Total | 2,960 (97.7%) | 3,589 (98.0%) |
Income Below Poverty Among Married-Couple Families in Plymouth Meeting
The poverty statistics for married-couple families in Plymouth Meeting show that 1.2% or 17 of the total 1,433 families live below the poverty line. Families with 1 or 2 children have the highest poverty rate of 2.0%, comprising of 11 families. On the other hand, families with 3 or 4 children have the lowest poverty rate of 0.0%, which includes 0 families.
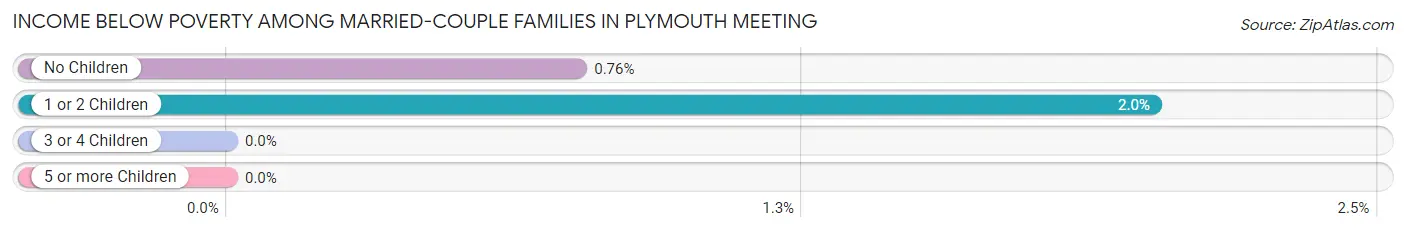
| Children | Above Poverty | Below Poverty |
| No Children | 783 (99.2%) | 6 (0.8%) |
| 1 or 2 Children | 536 (98.0%) | 11 (2.0%) |
| 3 or 4 Children | 97 (100.0%) | 0 (0.0%) |
| 5 or more Children | 0 (0.0%) | 0 (0.0%) |
| Total | 1,416 (98.8%) | 17 (1.2%) |
Income Below Poverty Among Single-Parent Households in Plymouth Meeting
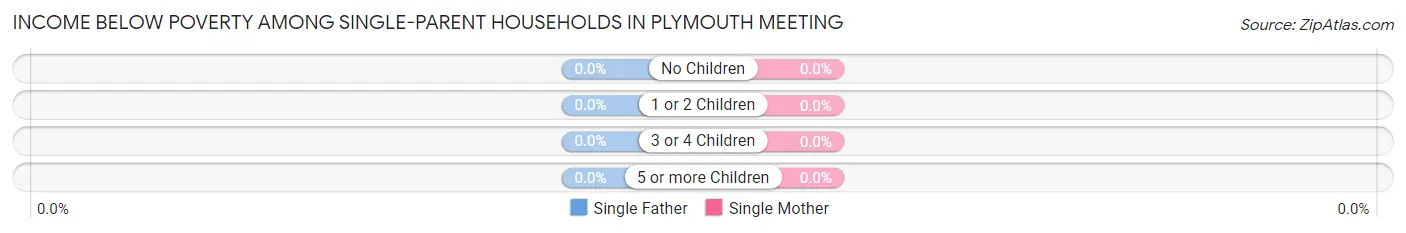
| Children | Single Father | Single Mother |
| No Children | 0 (0.0%) | 0 (0.0%) |
| 1 or 2 Children | 0 (0.0%) | 0 (0.0%) |
| 3 or 4 Children | 0 (0.0%) | 0 (0.0%) |
| 5 or more Children | 0 (0.0%) | 0 (0.0%) |
| Total | 0 (0.0%) | 0 (0.0%) |
Income Below Poverty Among Married-Couple vs Single-Parent Households in Plymouth Meeting
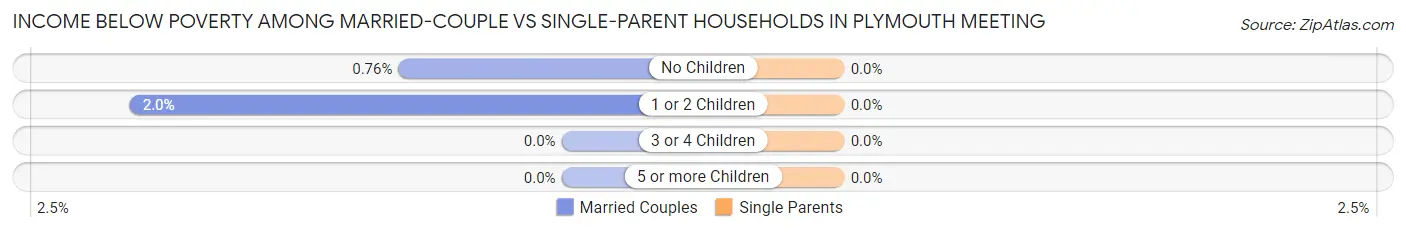
| Children | Married-Couple Families | Single-Parent Households |
| No Children | 6 (0.8%) | 0 (0.0%) |
| 1 or 2 Children | 11 (2.0%) | 0 (0.0%) |
| 3 or 4 Children | 0 (0.0%) | 0 (0.0%) |
| 5 or more Children | 0 (0.0%) | 0 (0.0%) |
| Total | 17 (1.2%) | 0 (0.0%) |
Employment Characteristics in Plymouth Meeting
Employment by Class of Employer in Plymouth Meeting
Among the 3,541 employed individuals in Plymouth Meeting, private company employees (2,385 | 67.3%), not-for-profit organizations (456 | 12.9%), and self-employed (incorporated) (272 | 7.7%) make up the most common classes of employment.
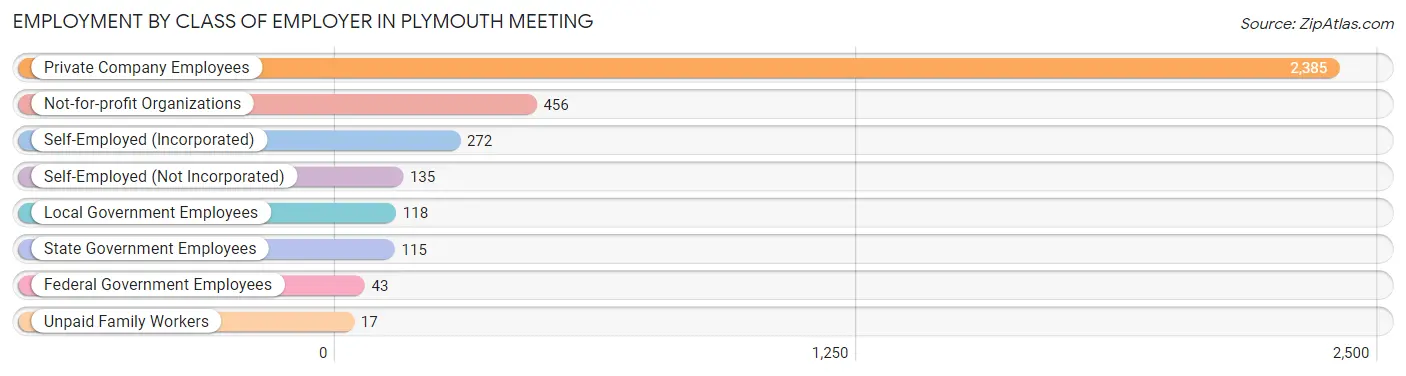
| Employer Class | # Employees | % Employees |
| Private Company Employees | 2,385 | 67.3% |
| Self-Employed (Incorporated) | 272 | 7.7% |
| Self-Employed (Not Incorporated) | 135 | 3.8% |
| Not-for-profit Organizations | 456 | 12.9% |
| Local Government Employees | 118 | 3.3% |
| State Government Employees | 115 | 3.3% |
| Federal Government Employees | 43 | 1.2% |
| Unpaid Family Workers | 17 | 0.5% |
| Total | 3,541 | 100.0% |
Employment Status by Age in Plymouth Meeting
According to the labor force statistics for Plymouth Meeting, out of the total population over 16 years of age (5,386), 68.0% or 3,662 individuals are in the labor force, with 3.0% or 110 of them unemployed. The age group with the highest labor force participation rate is 35 to 44 years, with 99.6% or 918 individuals in the labor force. Within the labor force, the 20 to 24 years age range has the highest percentage of unemployed individuals, with 6.7% or 15 of them being unemployed.
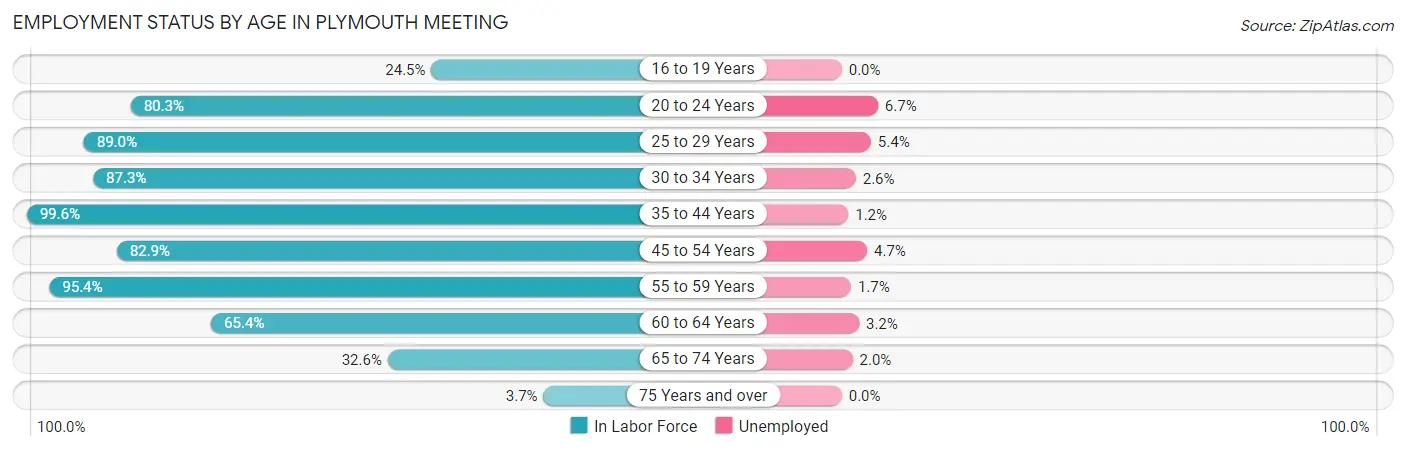
| Age Bracket | In Labor Force | Unemployed |
| 16 to 19 Years | 34 (24.5%) | 0 (0.0%) |
| 20 to 24 Years | 224 (80.3%) | 15 (6.7%) |
| 25 to 29 Years | 446 (89.0%) | 24 (5.4%) |
| 30 to 34 Years | 507 (87.3%) | 13 (2.6%) |
| 35 to 44 Years | 918 (99.6%) | 11 (1.2%) |
| 45 to 54 Years | 537 (82.9%) | 25 (4.7%) |
| 55 to 59 Years | 412 (95.4%) | 7 (1.7%) |
| 60 to 64 Years | 308 (65.4%) | 10 (3.2%) |
| 65 to 74 Years | 250 (32.6%) | 5 (2.0%) |
| 75 Years and over | 24 (3.7%) | 0 (0.0%) |
| Total | 3,662 (68.0%) | 110 (3.0%) |
Employment Status by Educational Attainment in Plymouth Meeting
According to labor force statistics for Plymouth Meeting, 88.0% of individuals (3,128) out of the total population between 25 and 64 years of age (3,555) are in the labor force, with 2.9% or 91 of them being unemployed. The group with the highest labor force participation rate are those with the educational attainment of bachelor's degree or higher, with 90.8% or 2,165 individuals in the labor force. Within the labor force, individuals with less than high school education have the highest percentage of unemployment, with 10.8% or 4 of them being unemployed.
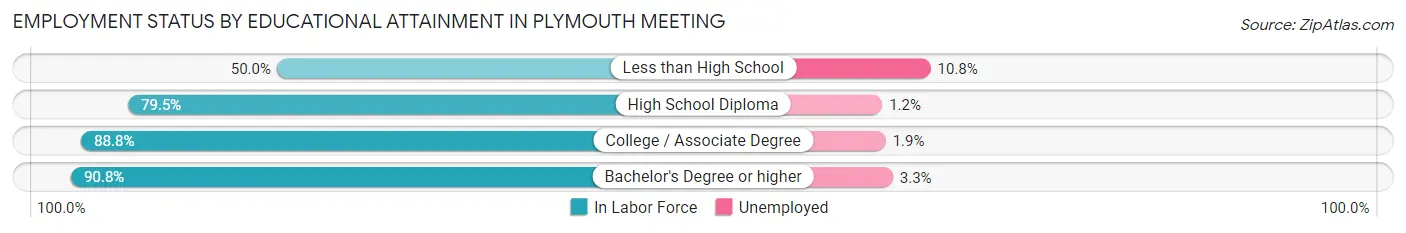
| Educational Attainment | In Labor Force | Unemployed |
| Less than High School | 37 (50.0%) | 8 (10.8%) |
| High School Diploma | 411 (79.5%) | 6 (1.2%) |
| College / Associate Degree | 515 (88.8%) | 11 (1.9%) |
| Bachelor's Degree or higher | 2,165 (90.8%) | 79 (3.3%) |
| Total | 3,128 (88.0%) | 103 (2.9%) |
Employment Occupations by Sex in Plymouth Meeting
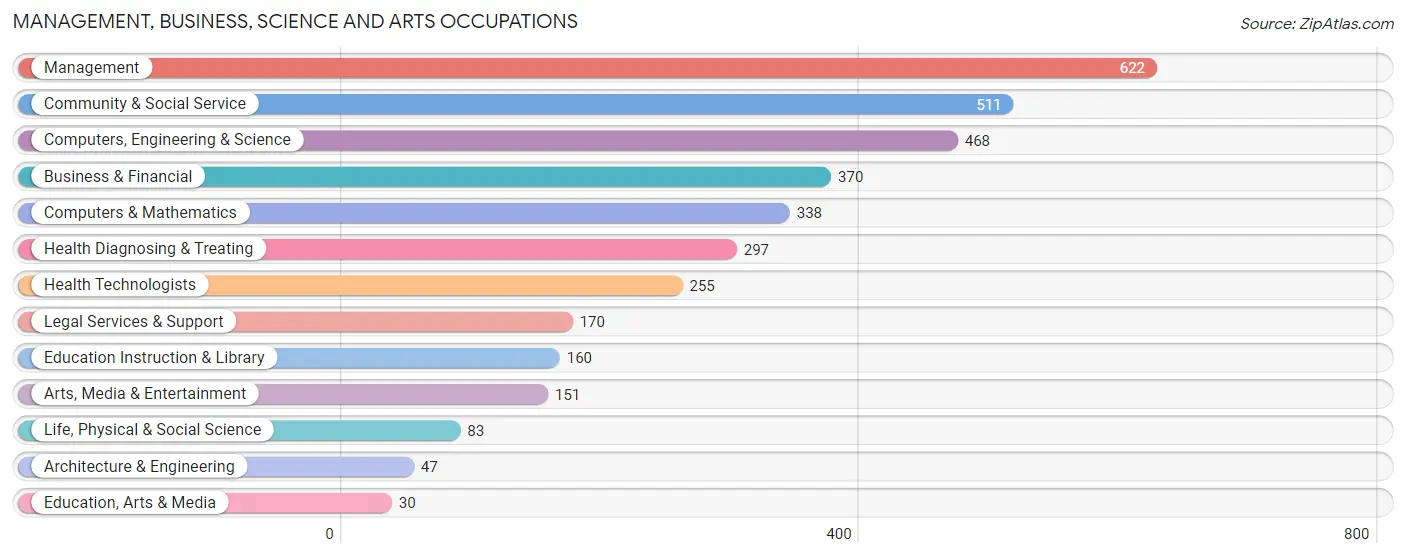
Management, Business, Science and Arts Occupations
The most common Management, Business, Science and Arts occupations in Plymouth Meeting are Management (622 | 17.5%), Community & Social Service (511 | 14.4%), Computers, Engineering & Science (468 | 13.2%), Business & Financial (370 | 10.4%), and Computers & Mathematics (338 | 9.5%).
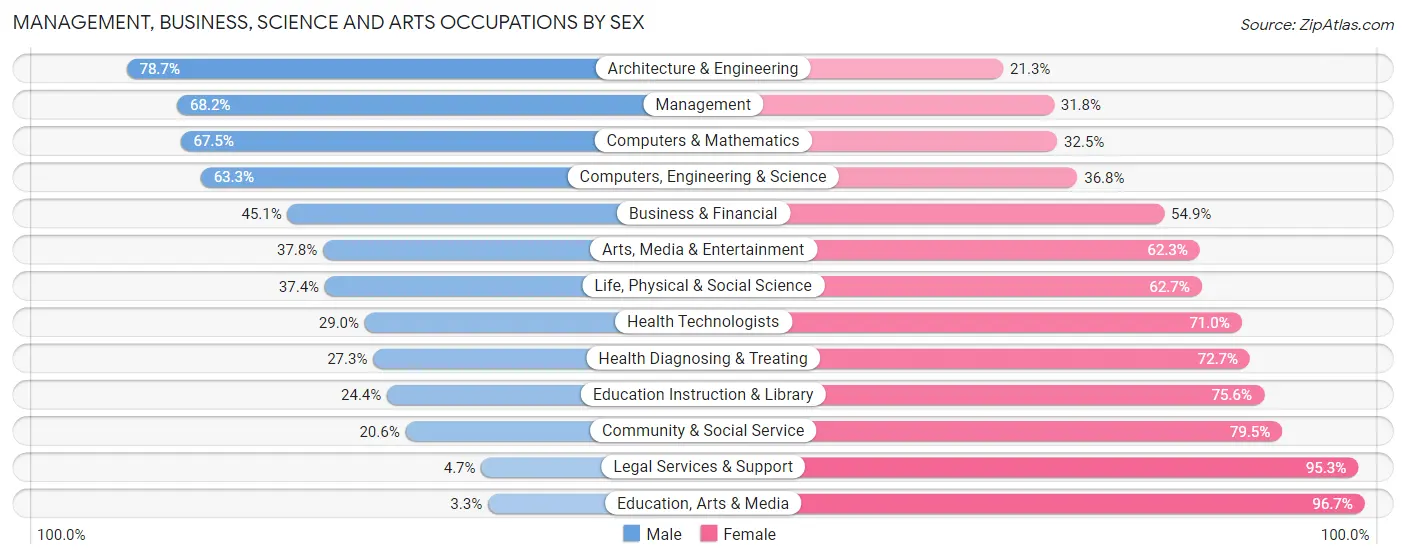
Management, Business, Science and Arts Occupations by Sex
Within the Management, Business, Science and Arts occupations in Plymouth Meeting, the most male-oriented occupations are Architecture & Engineering (78.7%), Management (68.2%), and Computers & Mathematics (67.5%), while the most female-oriented occupations are Education, Arts & Media (96.7%), Legal Services & Support (95.3%), and Community & Social Service (79.4%).
| Occupation | Male | Female |
| Management | 424 (68.2%) | 198 (31.8%) |
| Business & Financial | 167 (45.1%) | 203 (54.9%) |
| Computers, Engineering & Science | 296 (63.2%) | 172 (36.7%) |
| Computers & Mathematics | 228 (67.5%) | 110 (32.5%) |
| Architecture & Engineering | 37 (78.7%) | 10 (21.3%) |
| Life, Physical & Social Science | 31 (37.3%) | 52 (62.6%) |
| Community & Social Service | 105 (20.5%) | 406 (79.4%) |
| Education, Arts & Media | 1 (3.3%) | 29 (96.7%) |
| Legal Services & Support | 8 (4.7%) | 162 (95.3%) |
| Education Instruction & Library | 39 (24.4%) | 121 (75.6%) |
| Arts, Media & Entertainment | 57 (37.8%) | 94 (62.3%) |
| Health Diagnosing & Treating | 81 (27.3%) | 216 (72.7%) |
| Health Technologists | 74 (29.0%) | 181 (71.0%) |
| Total (Category) | 1,073 (47.3%) | 1,195 (52.7%) |
| Total (Overall) | 1,725 (48.6%) | 1,825 (51.4%) |
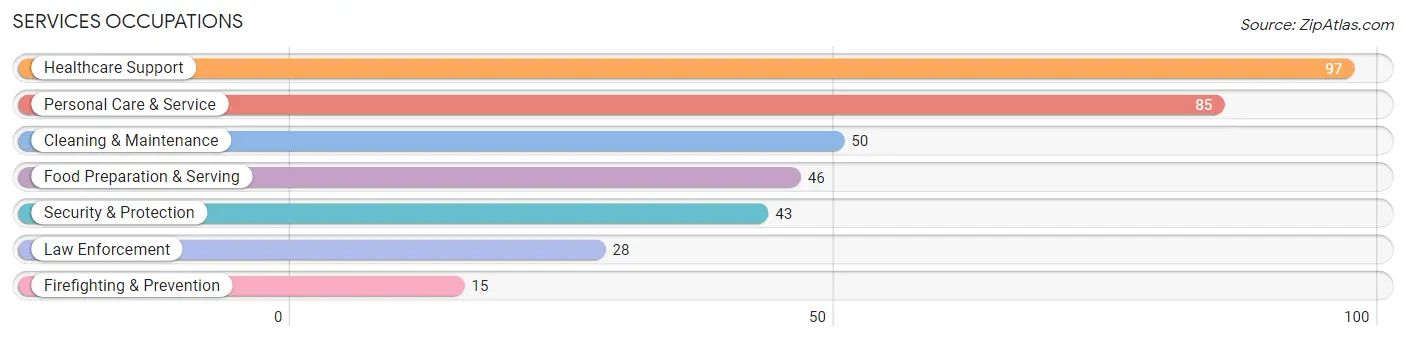
Services Occupations
The most common Services occupations in Plymouth Meeting are Healthcare Support (97 | 2.7%), Personal Care & Service (85 | 2.4%), Cleaning & Maintenance (50 | 1.4%), Food Preparation & Serving (46 | 1.3%), and Security & Protection (43 | 1.2%).
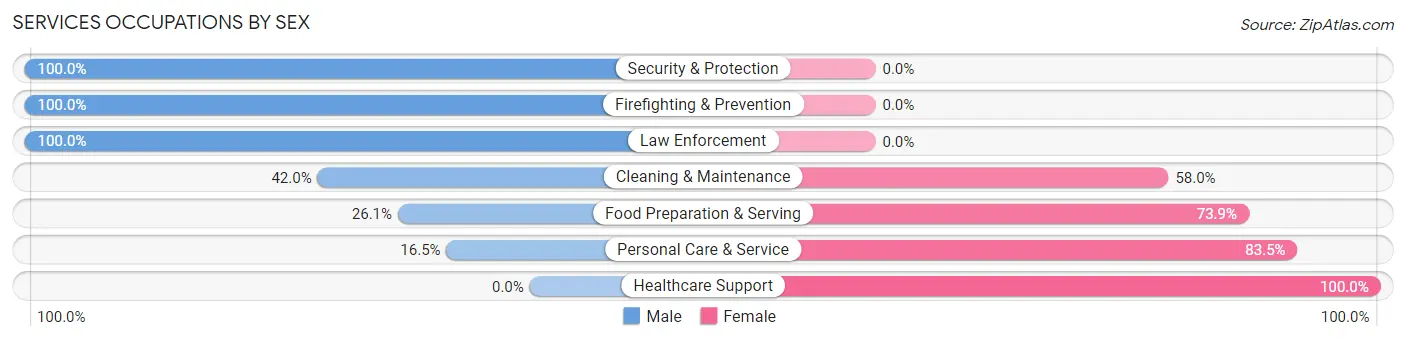
Services Occupations by Sex
Within the Services occupations in Plymouth Meeting, the most male-oriented occupations are Security & Protection (100.0%), Firefighting & Prevention (100.0%), and Law Enforcement (100.0%), while the most female-oriented occupations are Healthcare Support (100.0%), Personal Care & Service (83.5%), and Food Preparation & Serving (73.9%).
| Occupation | Male | Female |
| Healthcare Support | 0 (0.0%) | 97 (100.0%) |
| Security & Protection | 43 (100.0%) | 0 (0.0%) |
| Firefighting & Prevention | 15 (100.0%) | 0 (0.0%) |
| Law Enforcement | 28 (100.0%) | 0 (0.0%) |
| Food Preparation & Serving | 12 (26.1%) | 34 (73.9%) |
| Cleaning & Maintenance | 21 (42.0%) | 29 (58.0%) |
| Personal Care & Service | 14 (16.5%) | 71 (83.5%) |
| Total (Category) | 90 (28.0%) | 231 (72.0%) |
| Total (Overall) | 1,725 (48.6%) | 1,825 (51.4%) |
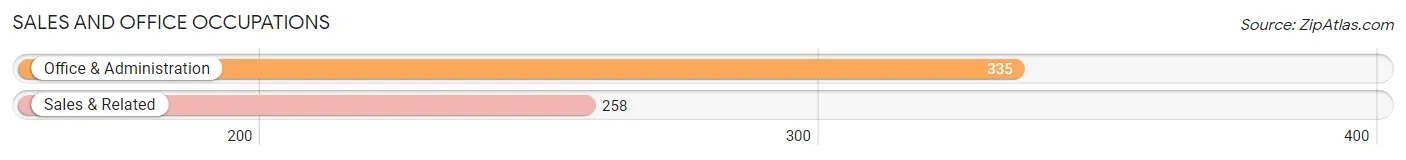
Sales and Office Occupations
The most common Sales and Office occupations in Plymouth Meeting are Office & Administration (335 | 9.4%), and Sales & Related (258 | 7.3%).
Sales and Office Occupations by Sex
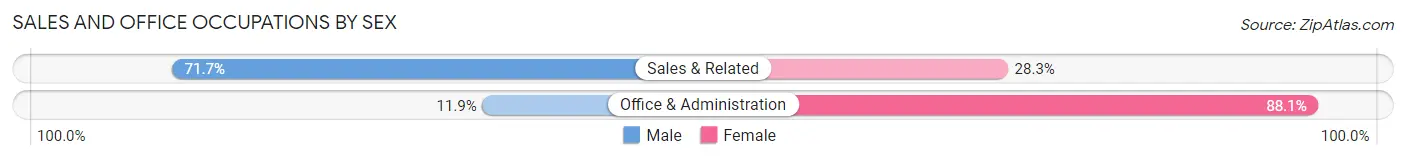
| Occupation | Male | Female |
| Sales & Related | 185 (71.7%) | 73 (28.3%) |
| Office & Administration | 40 (11.9%) | 295 (88.1%) |
| Total (Category) | 225 (37.9%) | 368 (62.1%) |
| Total (Overall) | 1,725 (48.6%) | 1,825 (51.4%) |
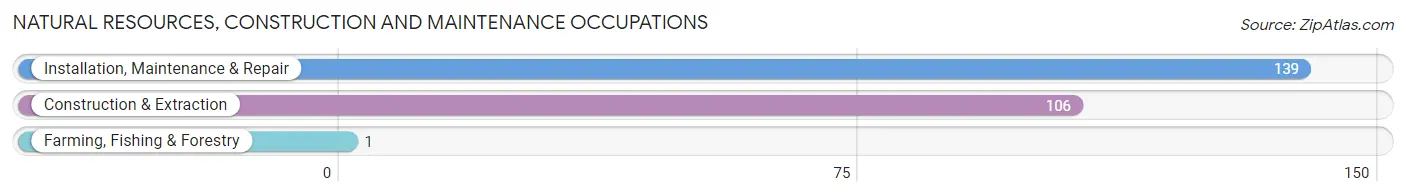
Natural Resources, Construction and Maintenance Occupations
The most common Natural Resources, Construction and Maintenance occupations in Plymouth Meeting are Installation, Maintenance & Repair (139 | 3.9%), Construction & Extraction (106 | 3.0%), and Farming, Fishing & Forestry (1 | 0.0%).
Natural Resources, Construction and Maintenance Occupations by Sex
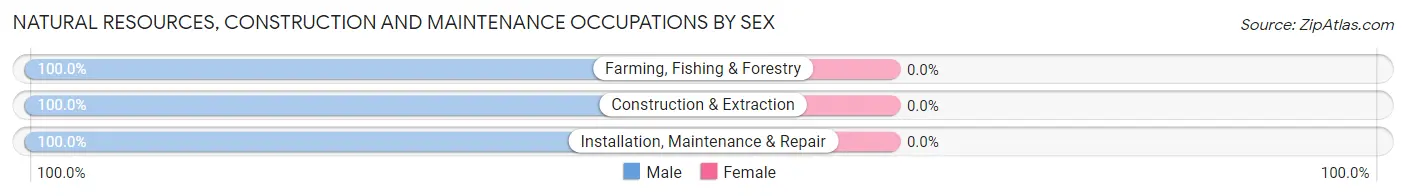
| Occupation | Male | Female |
| Farming, Fishing & Forestry | 1 (100.0%) | 0 (0.0%) |
| Construction & Extraction | 106 (100.0%) | 0 (0.0%) |
| Installation, Maintenance & Repair | 139 (100.0%) | 0 (0.0%) |
| Total (Category) | 246 (100.0%) | 0 (0.0%) |
| Total (Overall) | 1,725 (48.6%) | 1,825 (51.4%) |
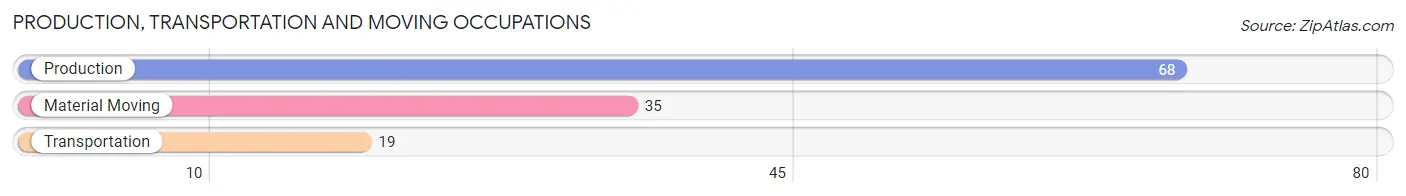
Production, Transportation and Moving Occupations
The most common Production, Transportation and Moving occupations in Plymouth Meeting are Production (68 | 1.9%), Material Moving (35 | 1.0%), and Transportation (19 | 0.5%).
Production, Transportation and Moving Occupations by Sex
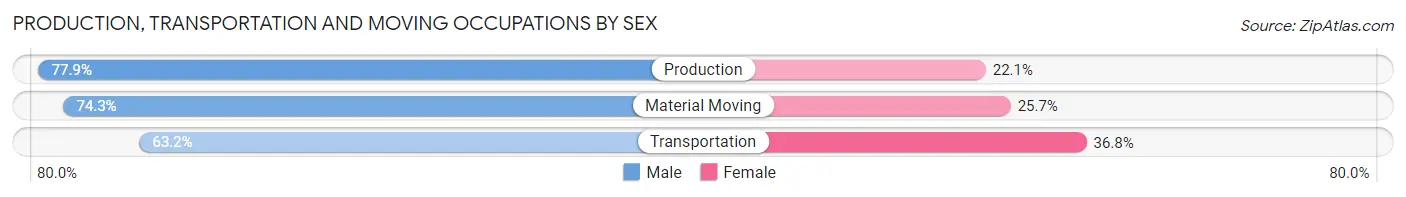
| Occupation | Male | Female |
| Production | 53 (77.9%) | 15 (22.1%) |
| Transportation | 12 (63.2%) | 7 (36.8%) |
| Material Moving | 26 (74.3%) | 9 (25.7%) |
| Total (Category) | 91 (74.6%) | 31 (25.4%) |
| Total (Overall) | 1,725 (48.6%) | 1,825 (51.4%) |
Employment Industries by Sex in Plymouth Meeting
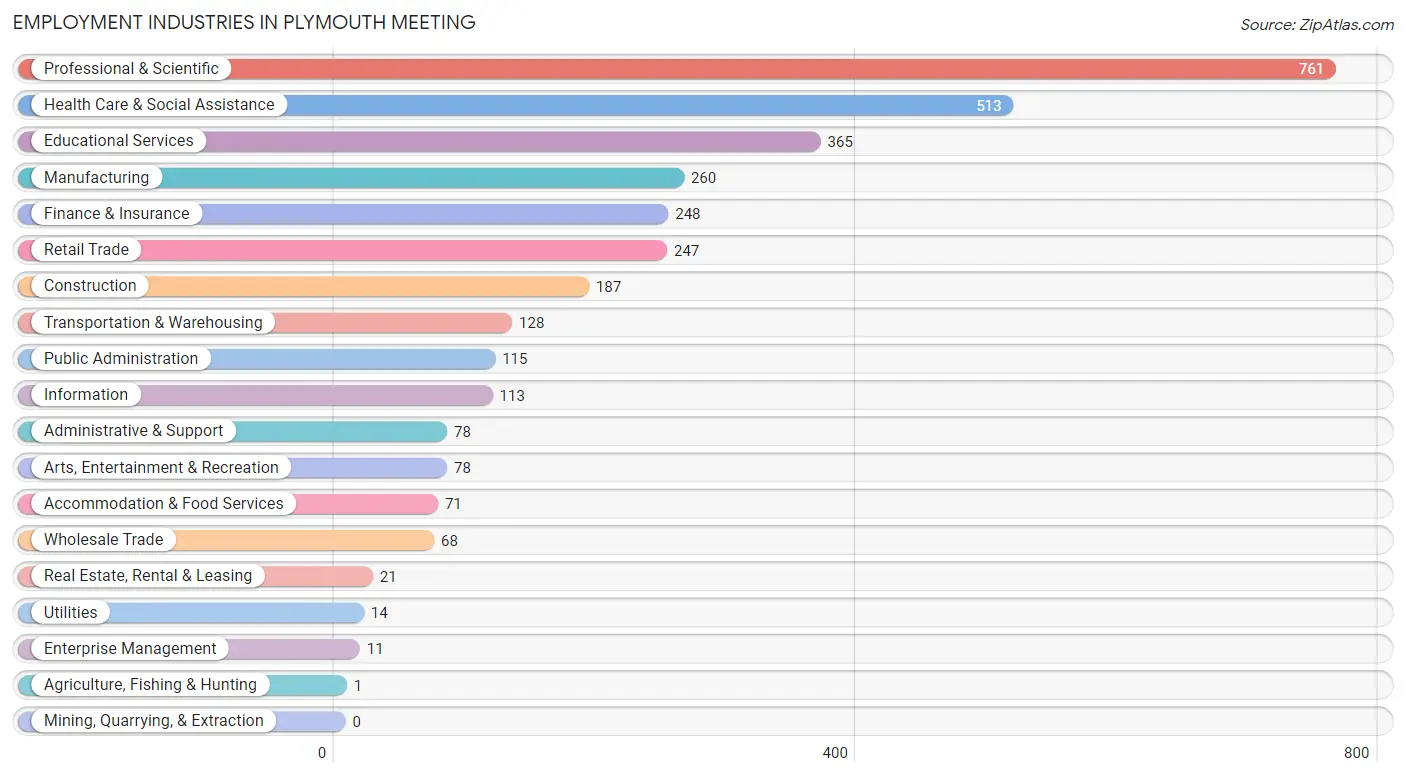
Employment Industries in Plymouth Meeting
The major employment industries in Plymouth Meeting include Professional & Scientific (761 | 21.4%), Health Care & Social Assistance (513 | 14.4%), Educational Services (365 | 10.3%), Manufacturing (260 | 7.3%), and Finance & Insurance (248 | 7.0%).
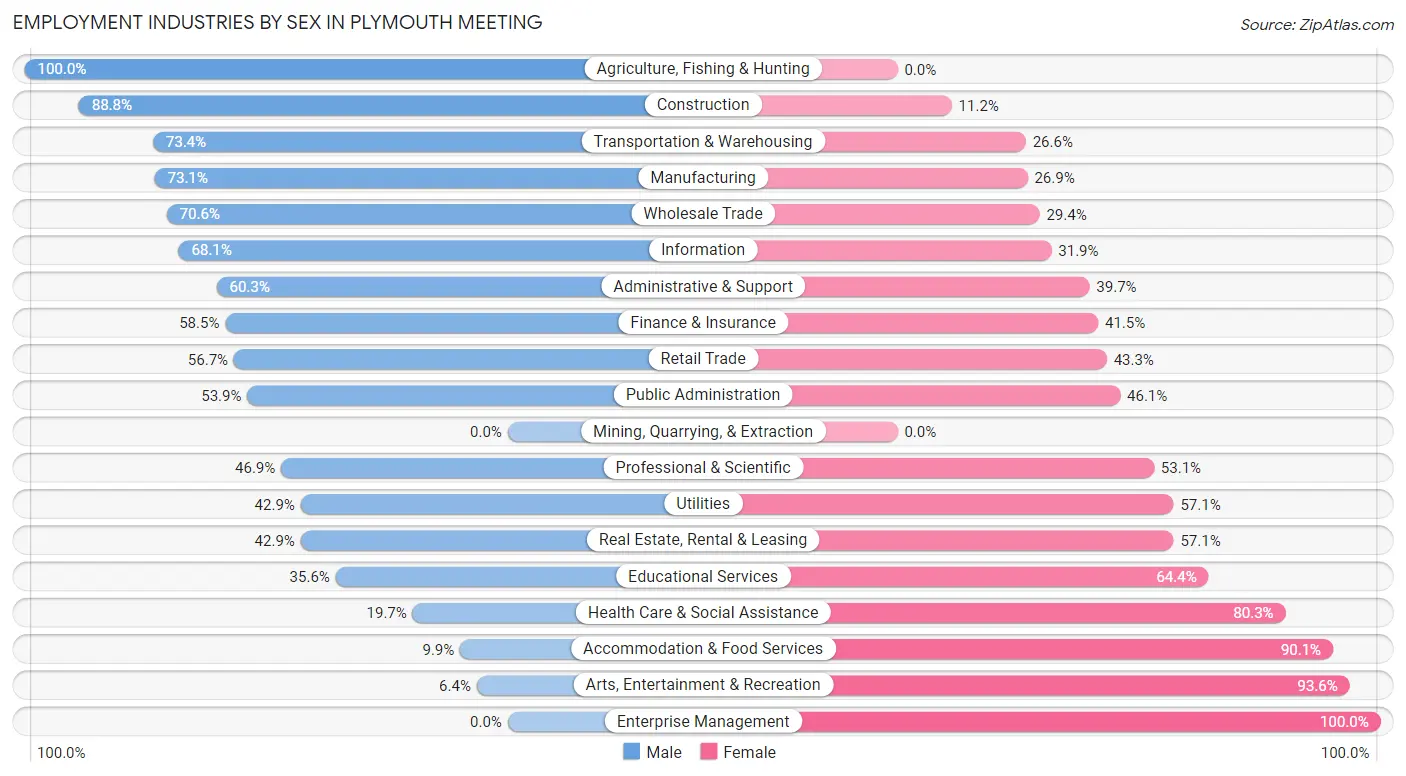
Employment Industries by Sex in Plymouth Meeting
The Plymouth Meeting industries that see more men than women are Agriculture, Fishing & Hunting (100.0%), Construction (88.8%), and Transportation & Warehousing (73.4%), whereas the industries that tend to have a higher number of women are Enterprise Management (100.0%), Arts, Entertainment & Recreation (93.6%), and Accommodation & Food Services (90.1%).
| Industry | Male | Female |
| Agriculture, Fishing & Hunting | 1 (100.0%) | 0 (0.0%) |
| Mining, Quarrying, & Extraction | 0 (0.0%) | 0 (0.0%) |
| Construction | 166 (88.8%) | 21 (11.2%) |
| Manufacturing | 190 (73.1%) | 70 (26.9%) |
| Wholesale Trade | 48 (70.6%) | 20 (29.4%) |
| Retail Trade | 140 (56.7%) | 107 (43.3%) |
| Transportation & Warehousing | 94 (73.4%) | 34 (26.6%) |
| Utilities | 6 (42.9%) | 8 (57.1%) |
| Information | 77 (68.1%) | 36 (31.9%) |
| Finance & Insurance | 145 (58.5%) | 103 (41.5%) |
| Real Estate, Rental & Leasing | 9 (42.9%) | 12 (57.1%) |
| Professional & Scientific | 357 (46.9%) | 404 (53.1%) |
| Enterprise Management | 0 (0.0%) | 11 (100.0%) |
| Administrative & Support | 47 (60.3%) | 31 (39.7%) |
| Educational Services | 130 (35.6%) | 235 (64.4%) |
| Health Care & Social Assistance | 101 (19.7%) | 412 (80.3%) |
| Arts, Entertainment & Recreation | 5 (6.4%) | 73 (93.6%) |
| Accommodation & Food Services | 7 (9.9%) | 64 (90.1%) |
| Public Administration | 62 (53.9%) | 53 (46.1%) |
| Total | 1,725 (48.6%) | 1,825 (51.4%) |
Education in Plymouth Meeting
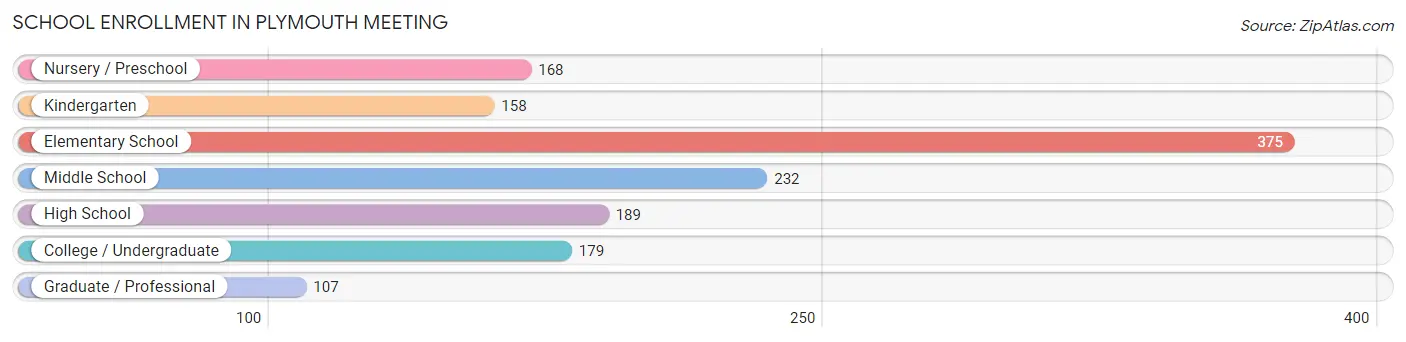
School Enrollment in Plymouth Meeting
The most common levels of schooling among the 1,408 students in Plymouth Meeting are elementary school (375 | 26.6%), middle school (232 | 16.5%), and high school (189 | 13.4%).
| School Level | # Students | % Students |
| Nursery / Preschool | 168 | 11.9% |
| Kindergarten | 158 | 11.2% |
| Elementary School | 375 | 26.6% |
| Middle School | 232 | 16.5% |
| High School | 189 | 13.4% |
| College / Undergraduate | 179 | 12.7% |
| Graduate / Professional | 107 | 7.6% |
| Total | 1,408 | 100.0% |
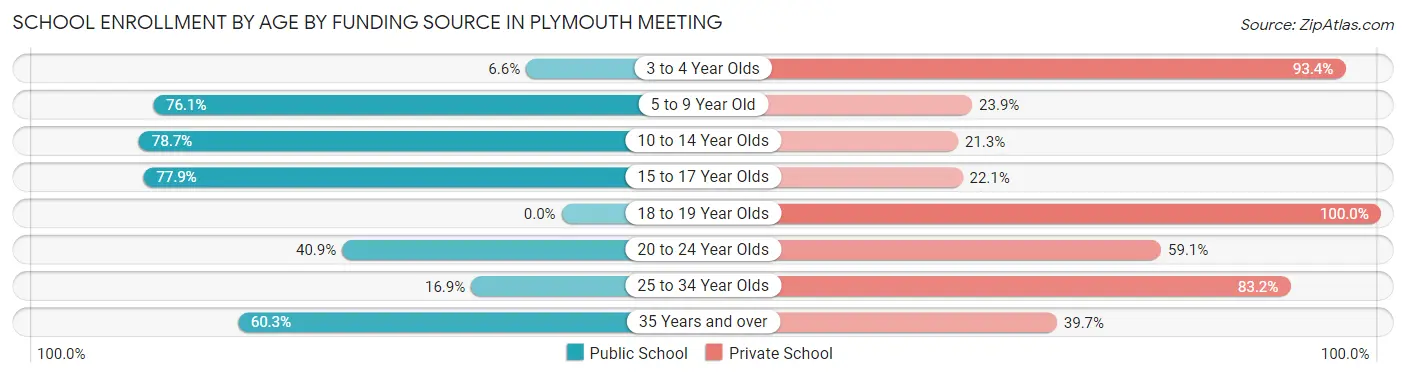
School Enrollment by Age by Funding Source in Plymouth Meeting
Out of a total of 1,408 students who are enrolled in schools in Plymouth Meeting, 534 (37.9%) attend a private institution, while the remaining 874 (62.1%) are enrolled in public schools. The age group of 18 to 19 year olds has the highest likelihood of being enrolled in private schools, with 25 (100.0% in the age bracket) enrolled. Conversely, the age group of 10 to 14 year olds has the lowest likelihood of being enrolled in a private school, with 255 (78.7% in the age bracket) attending a public institution.
| Age Bracket | Public School | Private School |
| 3 to 4 Year Olds | 8 (6.6%) | 113 (93.4%) |
| 5 to 9 Year Old | 407 (76.1%) | 128 (23.9%) |
| 10 to 14 Year Olds | 255 (78.7%) | 69 (21.3%) |
| 15 to 17 Year Olds | 102 (77.9%) | 29 (22.1%) |
| 18 to 19 Year Olds | 0 (0.0%) | 25 (100.0%) |
| 20 to 24 Year Olds | 47 (40.9%) | 68 (59.1%) |
| 25 to 34 Year Olds | 15 (16.9%) | 74 (83.2%) |
| 35 Years and over | 41 (60.3%) | 27 (39.7%) |
| Total | 874 (62.1%) | 534 (37.9%) |
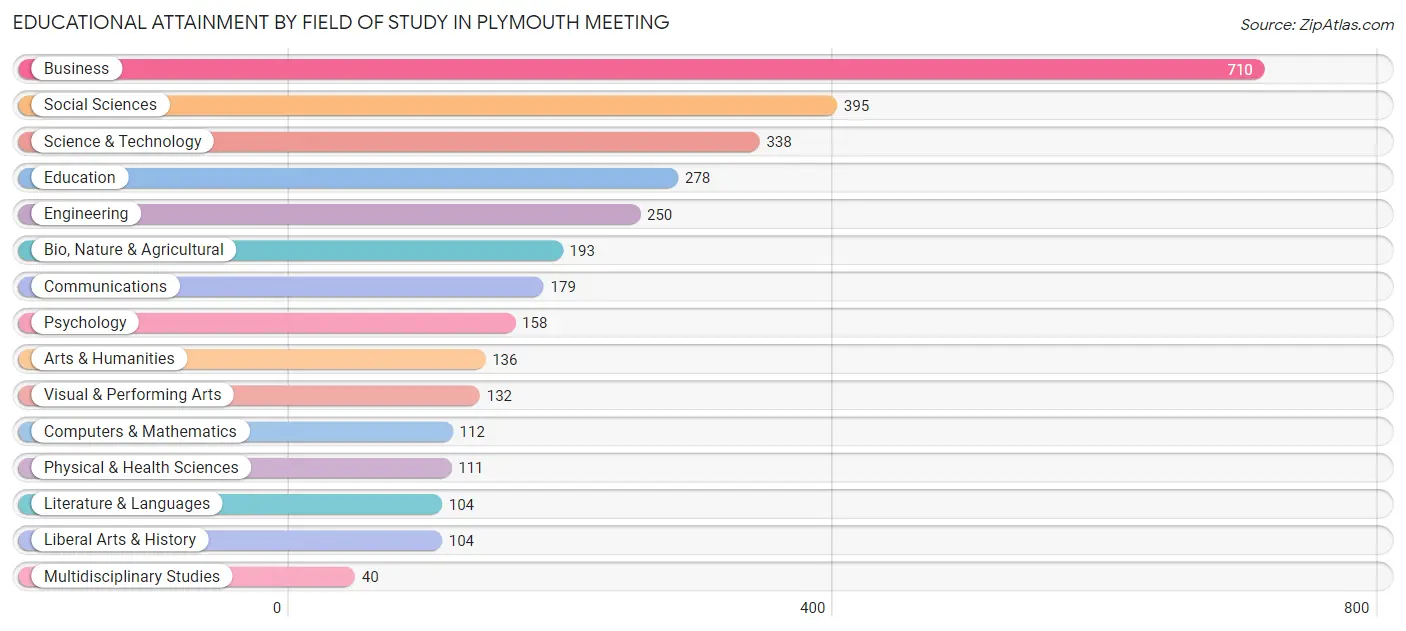
Educational Attainment by Field of Study in Plymouth Meeting
Business (710 | 21.9%), social sciences (395 | 12.2%), science & technology (338 | 10.4%), education (278 | 8.6%), and engineering (250 | 7.7%) are the most common fields of study among 3,240 individuals in Plymouth Meeting who have obtained a bachelor's degree or higher.
| Field of Study | # Graduates | % Graduates |
| Computers & Mathematics | 112 | 3.5% |
| Bio, Nature & Agricultural | 193 | 6.0% |
| Physical & Health Sciences | 111 | 3.4% |
| Psychology | 158 | 4.9% |
| Social Sciences | 395 | 12.2% |
| Engineering | 250 | 7.7% |
| Multidisciplinary Studies | 40 | 1.2% |
| Science & Technology | 338 | 10.4% |
| Business | 710 | 21.9% |
| Education | 278 | 8.6% |
| Literature & Languages | 104 | 3.2% |
| Liberal Arts & History | 104 | 3.2% |
| Visual & Performing Arts | 132 | 4.1% |
| Communications | 179 | 5.5% |
| Arts & Humanities | 136 | 4.2% |
| Total | 3,240 | 100.0% |
Transportation & Commute in Plymouth Meeting
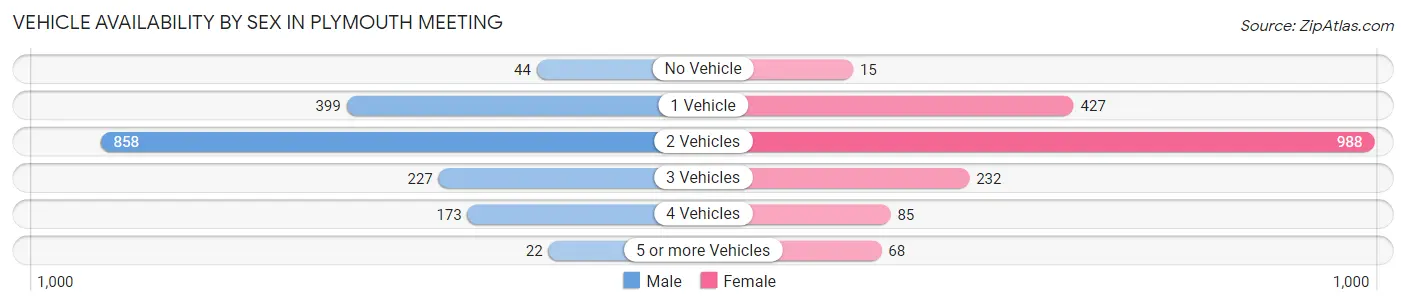
Vehicle Availability by Sex in Plymouth Meeting
The most prevalent vehicle ownership categories in Plymouth Meeting are males with 2 vehicles (858, accounting for 49.8%) and females with 2 vehicles (988, making up 47.3%).
| Vehicles Available | Male | Female |
| No Vehicle | 44 (2.5%) | 15 (0.8%) |
| 1 Vehicle | 399 (23.2%) | 427 (23.5%) |
| 2 Vehicles | 858 (49.8%) | 988 (54.4%) |
| 3 Vehicles | 227 (13.2%) | 232 (12.8%) |
| 4 Vehicles | 173 (10.0%) | 85 (4.7%) |
| 5 or more Vehicles | 22 (1.3%) | 68 (3.7%) |
| Total | 1,723 (100.0%) | 1,815 (100.0%) |
Commute Time in Plymouth Meeting
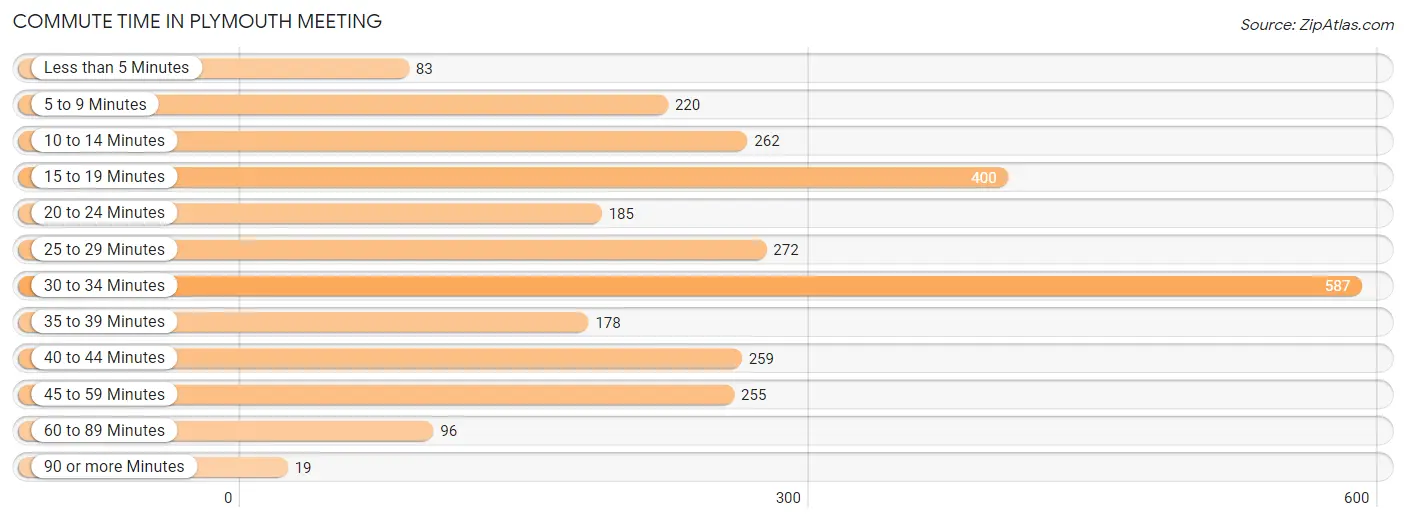
The most frequently occuring commute durations in Plymouth Meeting are 30 to 34 minutes (587 commuters, 20.8%), 15 to 19 minutes (400 commuters, 14.2%), and 25 to 29 minutes (272 commuters, 9.7%).
| Commute Time | # Commuters | % Commuters |
| Less than 5 Minutes | 83 | 2.9% |
| 5 to 9 Minutes | 220 | 7.8% |
| 10 to 14 Minutes | 262 | 9.3% |
| 15 to 19 Minutes | 400 | 14.2% |
| 20 to 24 Minutes | 185 | 6.6% |
| 25 to 29 Minutes | 272 | 9.7% |
| 30 to 34 Minutes | 587 | 20.8% |
| 35 to 39 Minutes | 178 | 6.3% |
| 40 to 44 Minutes | 259 | 9.2% |
| 45 to 59 Minutes | 255 | 9.1% |
| 60 to 89 Minutes | 96 | 3.4% |
| 90 or more Minutes | 19 | 0.7% |
Commute Time by Sex in Plymouth Meeting
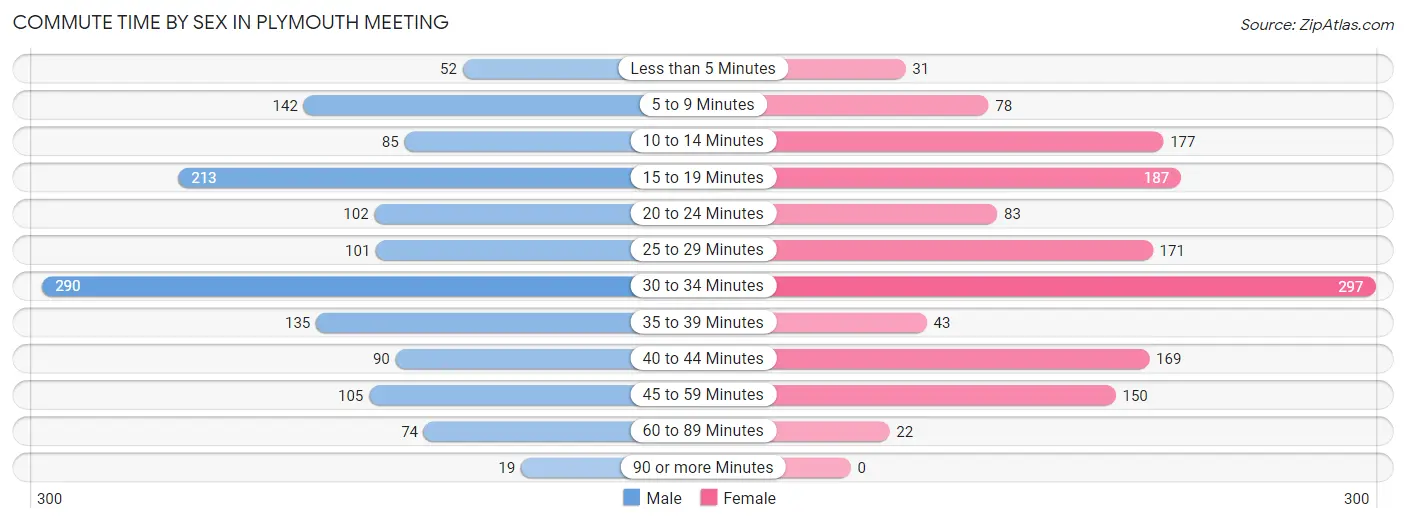
The most common commute times in Plymouth Meeting are 30 to 34 minutes (290 commuters, 20.6%) for males and 30 to 34 minutes (297 commuters, 21.1%) for females.
| Commute Time | Male | Female |
| Less than 5 Minutes | 52 (3.7%) | 31 (2.2%) |
| 5 to 9 Minutes | 142 (10.1%) | 78 (5.5%) |
| 10 to 14 Minutes | 85 (6.0%) | 177 (12.6%) |
| 15 to 19 Minutes | 213 (15.1%) | 187 (13.3%) |
| 20 to 24 Minutes | 102 (7.2%) | 83 (5.9%) |
| 25 to 29 Minutes | 101 (7.2%) | 171 (12.1%) |
| 30 to 34 Minutes | 290 (20.6%) | 297 (21.1%) |
| 35 to 39 Minutes | 135 (9.6%) | 43 (3.0%) |
| 40 to 44 Minutes | 90 (6.4%) | 169 (12.0%) |
| 45 to 59 Minutes | 105 (7.5%) | 150 (10.6%) |
| 60 to 89 Minutes | 74 (5.3%) | 22 (1.6%) |
| 90 or more Minutes | 19 (1.3%) | 0 (0.0%) |
Time of Departure to Work by Sex in Plymouth Meeting
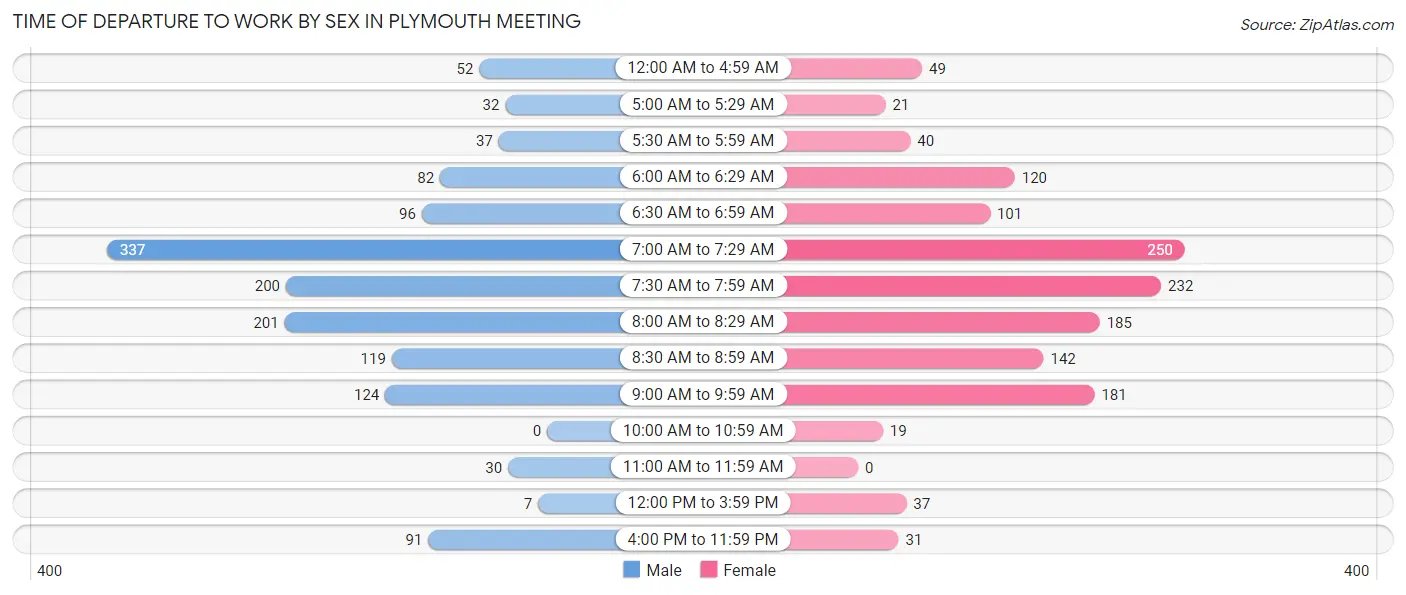
The most frequent times of departure to work in Plymouth Meeting are 7:00 AM to 7:29 AM (337, 23.9%) for males and 7:00 AM to 7:29 AM (250, 17.8%) for females.
| Time of Departure | Male | Female |
| 12:00 AM to 4:59 AM | 52 (3.7%) | 49 (3.5%) |
| 5:00 AM to 5:29 AM | 32 (2.3%) | 21 (1.5%) |
| 5:30 AM to 5:59 AM | 37 (2.6%) | 40 (2.8%) |
| 6:00 AM to 6:29 AM | 82 (5.8%) | 120 (8.5%) |
| 6:30 AM to 6:59 AM | 96 (6.8%) | 101 (7.2%) |
| 7:00 AM to 7:29 AM | 337 (23.9%) | 250 (17.8%) |
| 7:30 AM to 7:59 AM | 200 (14.2%) | 232 (16.5%) |
| 8:00 AM to 8:29 AM | 201 (14.3%) | 185 (13.1%) |
| 8:30 AM to 8:59 AM | 119 (8.5%) | 142 (10.1%) |
| 9:00 AM to 9:59 AM | 124 (8.8%) | 181 (12.9%) |
| 10:00 AM to 10:59 AM | 0 (0.0%) | 19 (1.3%) |
| 11:00 AM to 11:59 AM | 30 (2.1%) | 0 (0.0%) |
| 12:00 PM to 3:59 PM | 7 (0.5%) | 37 (2.6%) |
| 4:00 PM to 11:59 PM | 91 (6.5%) | 31 (2.2%) |
| Total | 1,408 (100.0%) | 1,408 (100.0%) |
Housing Occupancy in Plymouth Meeting
Occupancy by Ownership in Plymouth Meeting
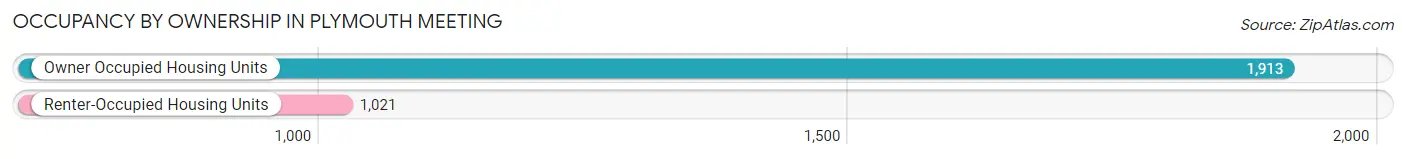
Of the total 2,934 dwellings in Plymouth Meeting, owner-occupied units account for 1,913 (65.2%), while renter-occupied units make up 1,021 (34.8%).
| Occupancy | # Housing Units | % Housing Units |
| Owner Occupied Housing Units | 1,913 | 65.2% |
| Renter-Occupied Housing Units | 1,021 | 34.8% |
| Total Occupied Housing Units | 2,934 | 100.0% |
Occupancy by Household Size in Plymouth Meeting
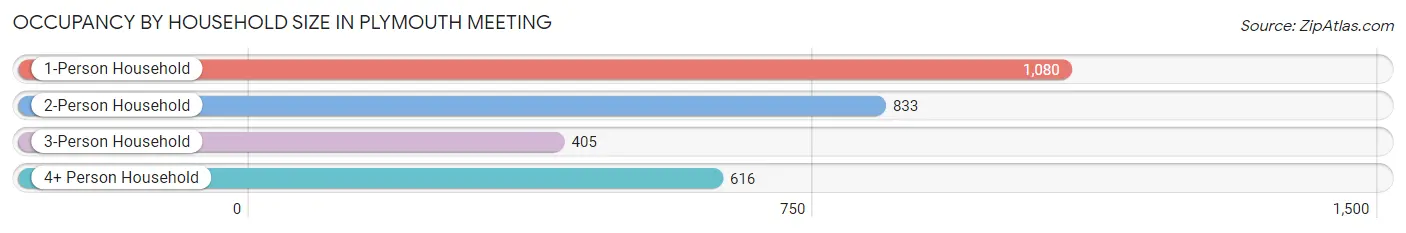
| Household Size | # Housing Units | % Housing Units |
| 1-Person Household | 1,080 | 36.8% |
| 2-Person Household | 833 | 28.4% |
| 3-Person Household | 405 | 13.8% |
| 4+ Person Household | 616 | 21.0% |
| Total Housing Units | 2,934 | 100.0% |
Occupancy by Ownership by Household Size in Plymouth Meeting
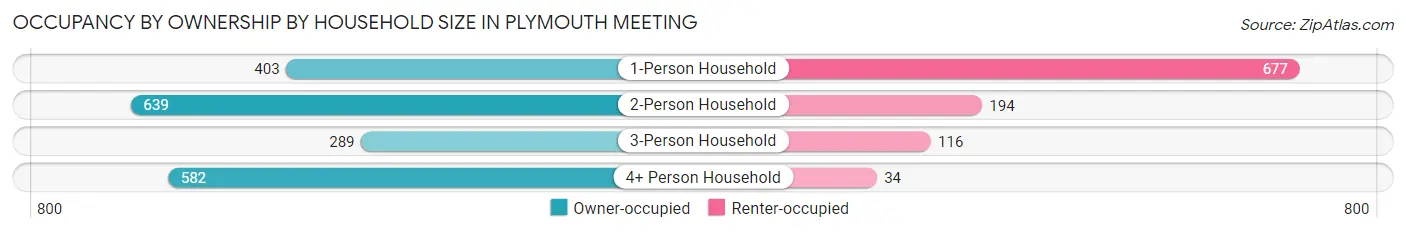
| Household Size | Owner-occupied | Renter-occupied |
| 1-Person Household | 403 (37.3%) | 677 (62.7%) |
| 2-Person Household | 639 (76.7%) | 194 (23.3%) |
| 3-Person Household | 289 (71.4%) | 116 (28.6%) |
| 4+ Person Household | 582 (94.5%) | 34 (5.5%) |
| Total Housing Units | 1,913 (65.2%) | 1,021 (34.8%) |
Occupancy by Educational Attainment in Plymouth Meeting
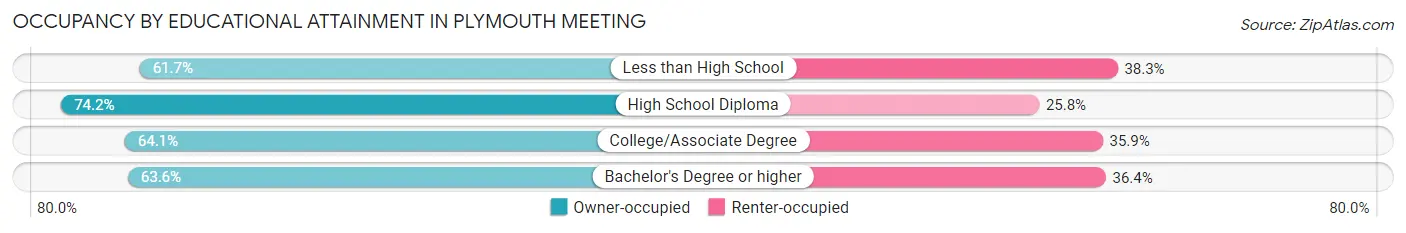
| Household Size | Owner-occupied | Renter-occupied |
| Less than High School | 50 (61.7%) | 31 (38.3%) |
| High School Diploma | 316 (74.2%) | 110 (25.8%) |
| College/Associate Degree | 407 (64.1%) | 228 (35.9%) |
| Bachelor's Degree or higher | 1,140 (63.6%) | 652 (36.4%) |
Occupancy by Age of Householder in Plymouth Meeting
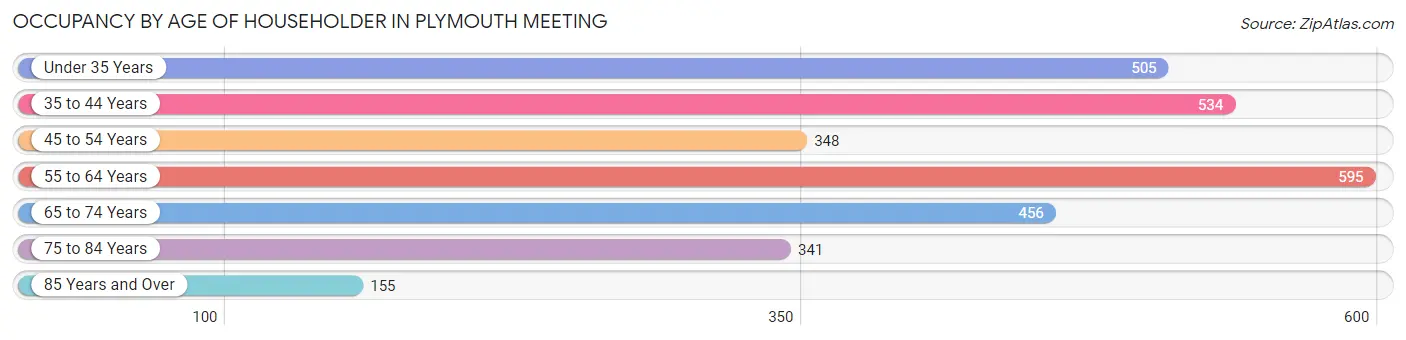
| Age Bracket | # Households | % Households |
| Under 35 Years | 505 | 17.2% |
| 35 to 44 Years | 534 | 18.2% |
| 45 to 54 Years | 348 | 11.9% |
| 55 to 64 Years | 595 | 20.3% |
| 65 to 74 Years | 456 | 15.5% |
| 75 to 84 Years | 341 | 11.6% |
| 85 Years and Over | 155 | 5.3% |
| Total | 2,934 | 100.0% |
Housing Finances in Plymouth Meeting
Median Income by Occupancy in Plymouth Meeting
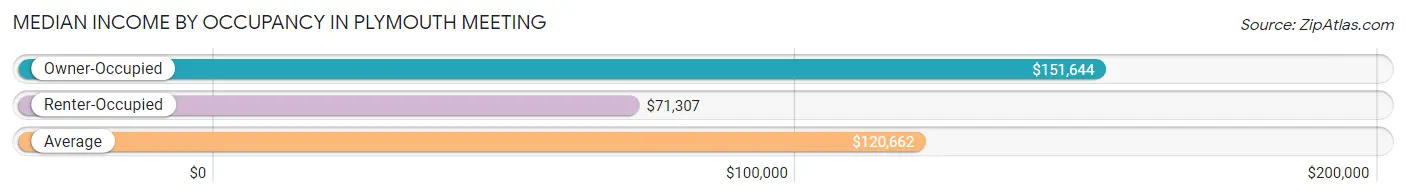
| Occupancy Type | # Households | Median Income |
| Owner-Occupied | 1,913 (65.2%) | $151,644 |
| Renter-Occupied | 1,021 (34.8%) | $71,307 |
| Average | 2,934 (100.0%) | $120,662 |
Occupancy by Householder Income Bracket in Plymouth Meeting
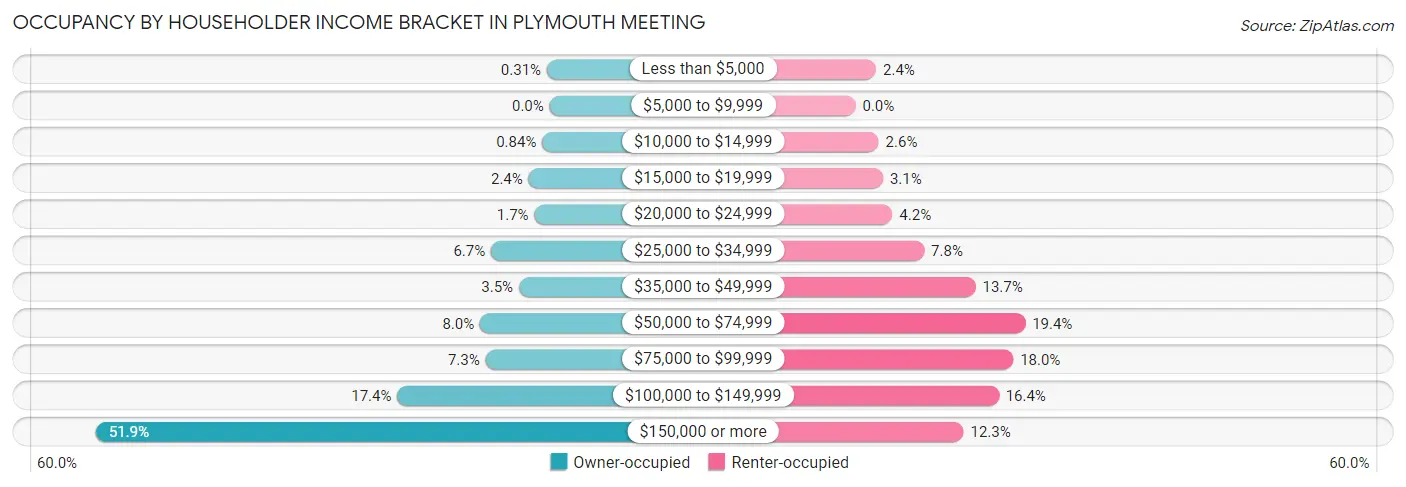
| Income Bracket | Owner-occupied | Renter-occupied |
| Less than $5,000 | 6 (0.3%) | 24 (2.4%) |
| $5,000 to $9,999 | 0 (0.0%) | 0 (0.0%) |
| $10,000 to $14,999 | 16 (0.8%) | 27 (2.6%) |
| $15,000 to $19,999 | 46 (2.4%) | 32 (3.1%) |
| $20,000 to $24,999 | 33 (1.7%) | 43 (4.2%) |
| $25,000 to $34,999 | 128 (6.7%) | 80 (7.8%) |
| $35,000 to $49,999 | 67 (3.5%) | 140 (13.7%) |
| $50,000 to $74,999 | 152 (8.0%) | 198 (19.4%) |
| $75,000 to $99,999 | 140 (7.3%) | 184 (18.0%) |
| $100,000 to $149,999 | 333 (17.4%) | 167 (16.4%) |
| $150,000 or more | 992 (51.9%) | 126 (12.3%) |
| Total | 1,913 (100.0%) | 1,021 (100.0%) |
Monthly Housing Cost Tiers in Plymouth Meeting
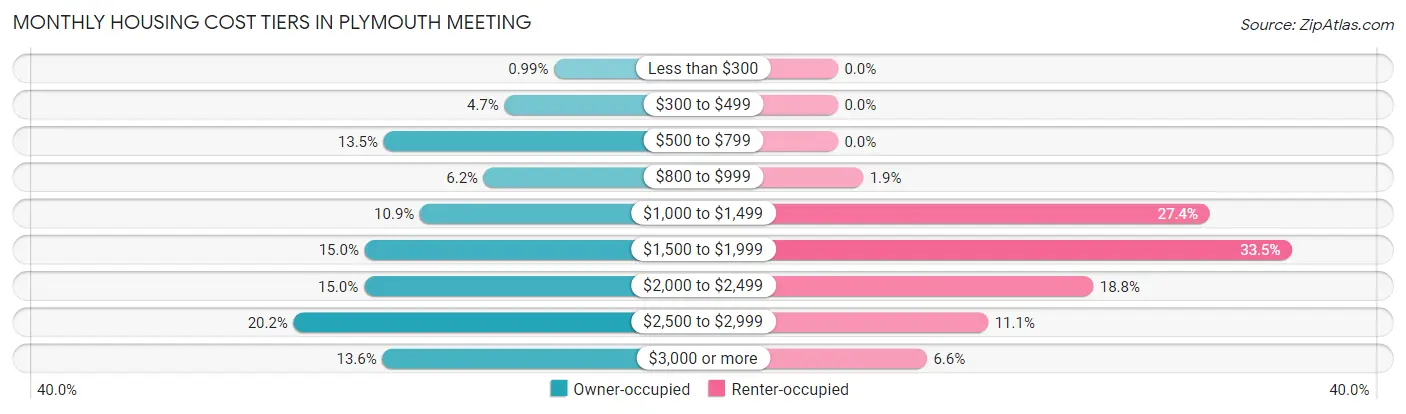
| Monthly Cost | Owner-occupied | Renter-occupied |
| Less than $300 | 19 (1.0%) | 0 (0.0%) |
| $300 to $499 | 89 (4.6%) | 0 (0.0%) |
| $500 to $799 | 259 (13.5%) | 0 (0.0%) |
| $800 to $999 | 118 (6.2%) | 19 (1.9%) |
| $1,000 to $1,499 | 208 (10.9%) | 280 (27.4%) |
| $1,500 to $1,999 | 286 (14.9%) | 342 (33.5%) |
| $2,000 to $2,499 | 287 (15.0%) | 192 (18.8%) |
| $2,500 to $2,999 | 386 (20.2%) | 113 (11.1%) |
| $3,000 or more | 261 (13.6%) | 67 (6.6%) |
| Total | 1,913 (100.0%) | 1,021 (100.0%) |
Physical Housing Characteristics in Plymouth Meeting
Housing Structures in Plymouth Meeting
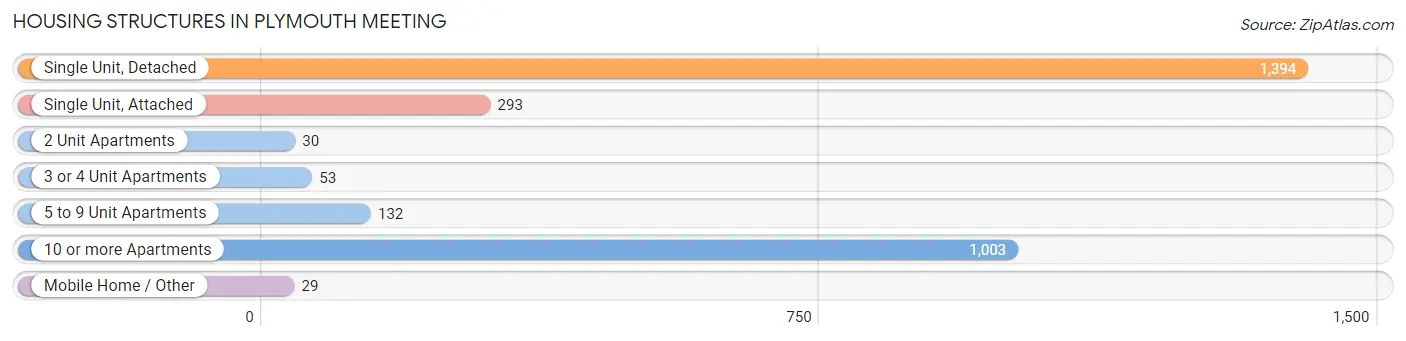
| Structure Type | # Housing Units | % Housing Units |
| Single Unit, Detached | 1,394 | 47.5% |
| Single Unit, Attached | 293 | 10.0% |
| 2 Unit Apartments | 30 | 1.0% |
| 3 or 4 Unit Apartments | 53 | 1.8% |
| 5 to 9 Unit Apartments | 132 | 4.5% |
| 10 or more Apartments | 1,003 | 34.2% |
| Mobile Home / Other | 29 | 1.0% |
| Total | 2,934 | 100.0% |
Housing Structures by Occupancy in Plymouth Meeting
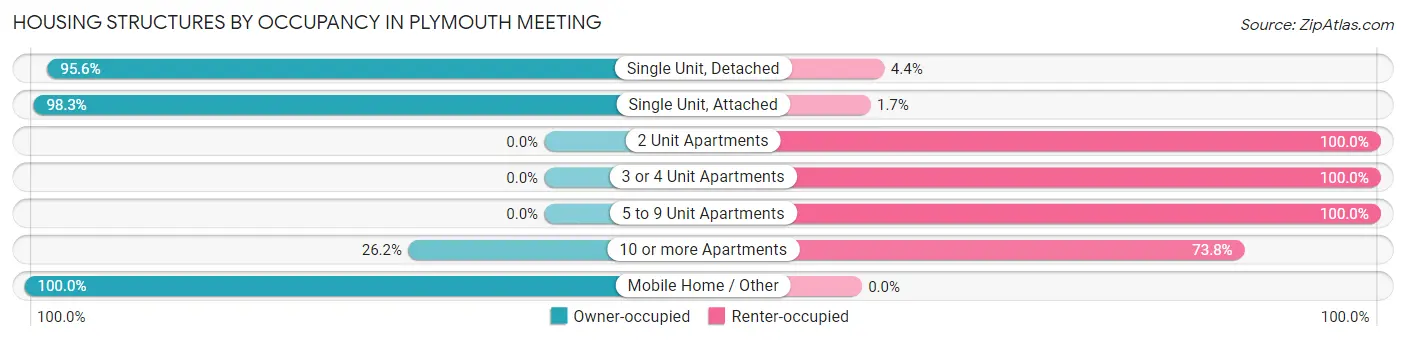
| Structure Type | Owner-occupied | Renter-occupied |
| Single Unit, Detached | 1,333 (95.6%) | 61 (4.4%) |
| Single Unit, Attached | 288 (98.3%) | 5 (1.7%) |
| 2 Unit Apartments | 0 (0.0%) | 30 (100.0%) |
| 3 or 4 Unit Apartments | 0 (0.0%) | 53 (100.0%) |
| 5 to 9 Unit Apartments | 0 (0.0%) | 132 (100.0%) |
| 10 or more Apartments | 263 (26.2%) | 740 (73.8%) |
| Mobile Home / Other | 29 (100.0%) | 0 (0.0%) |
| Total | 1,913 (65.2%) | 1,021 (34.8%) |
Housing Structures by Number of Rooms in Plymouth Meeting
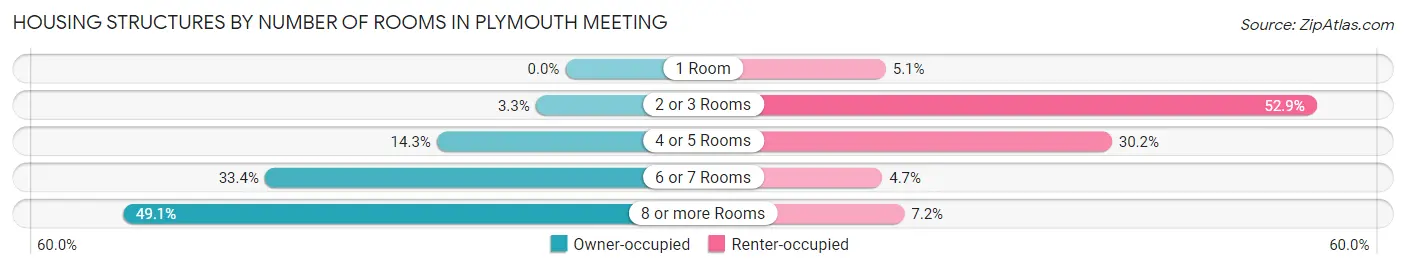
| Number of Rooms | Owner-occupied | Renter-occupied |
| 1 Room | 0 (0.0%) | 52 (5.1%) |
| 2 or 3 Rooms | 63 (3.3%) | 540 (52.9%) |
| 4 or 5 Rooms | 273 (14.3%) | 308 (30.2%) |
| 6 or 7 Rooms | 638 (33.4%) | 48 (4.7%) |
| 8 or more Rooms | 939 (49.1%) | 73 (7.1%) |
| Total | 1,913 (100.0%) | 1,021 (100.0%) |
Housing Structure by Heating Type in Plymouth Meeting
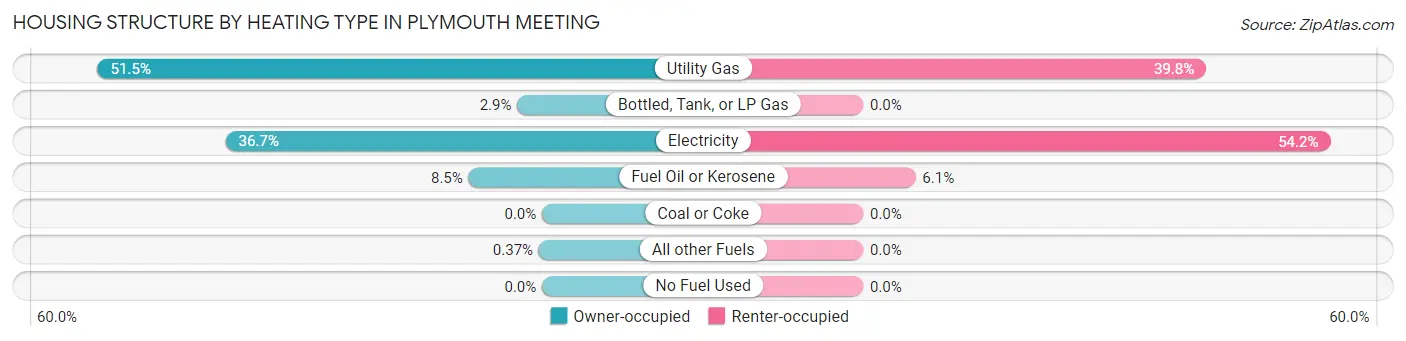
| Heating Type | Owner-occupied | Renter-occupied |
| Utility Gas | 986 (51.5%) | 406 (39.8%) |
| Bottled, Tank, or LP Gas | 55 (2.9%) | 0 (0.0%) |
| Electricity | 702 (36.7%) | 553 (54.2%) |
| Fuel Oil or Kerosene | 163 (8.5%) | 62 (6.1%) |
| Coal or Coke | 0 (0.0%) | 0 (0.0%) |
| All other Fuels | 7 (0.4%) | 0 (0.0%) |
| No Fuel Used | 0 (0.0%) | 0 (0.0%) |
| Total | 1,913 (100.0%) | 1,021 (100.0%) |
Household Vehicle Usage in Plymouth Meeting
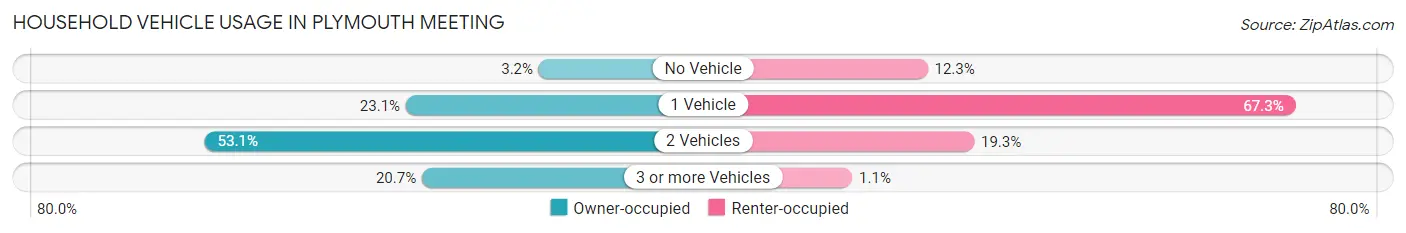
| Vehicles per Household | Owner-occupied | Renter-occupied |
| No Vehicle | 61 (3.2%) | 126 (12.3%) |
| 1 Vehicle | 441 (23.1%) | 687 (67.3%) |
| 2 Vehicles | 1,016 (53.1%) | 197 (19.3%) |
| 3 or more Vehicles | 395 (20.6%) | 11 (1.1%) |
| Total | 1,913 (100.0%) | 1,021 (100.0%) |
Real Estate & Mortgages in Plymouth Meeting
Real Estate and Mortgage Overview in Plymouth Meeting
| Characteristic | Without Mortgage | With Mortgage |
| Housing Units | 643 | 1,270 |
| Median Property Value | $371,800 | $463,400 |
| Median Household Income | $107,361 | $756 |
| Monthly Housing Costs | $692 | $261 |
| Real Estate Taxes | $3,384 | $0 |
Property Value by Mortgage Status in Plymouth Meeting
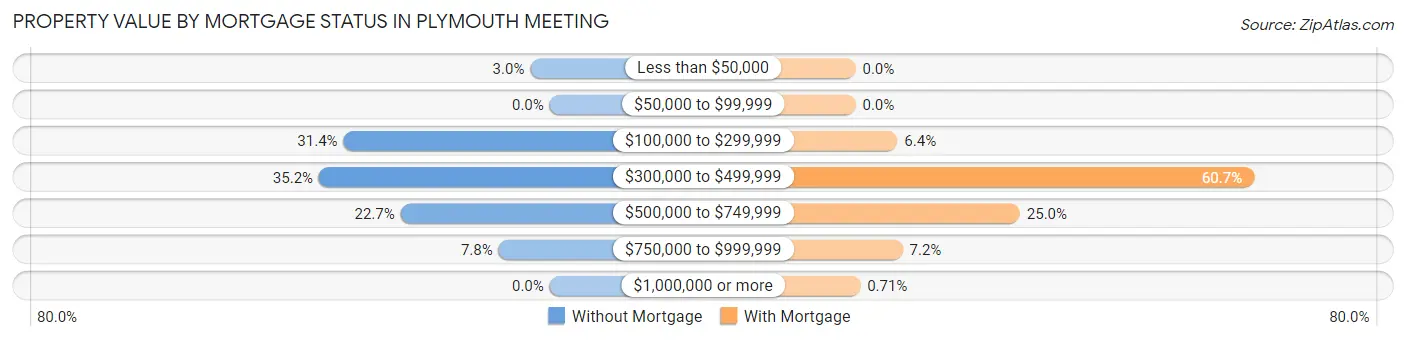
| Property Value | Without Mortgage | With Mortgage |
| Less than $50,000 | 19 (2.9%) | 0 (0.0%) |
| $50,000 to $99,999 | 0 (0.0%) | 0 (0.0%) |
| $100,000 to $299,999 | 202 (31.4%) | 81 (6.4%) |
| $300,000 to $499,999 | 226 (35.1%) | 771 (60.7%) |
| $500,000 to $749,999 | 146 (22.7%) | 318 (25.0%) |
| $750,000 to $999,999 | 50 (7.8%) | 91 (7.2%) |
| $1,000,000 or more | 0 (0.0%) | 9 (0.7%) |
| Total | 643 (100.0%) | 1,270 (100.0%) |
Household Income by Mortgage Status in Plymouth Meeting
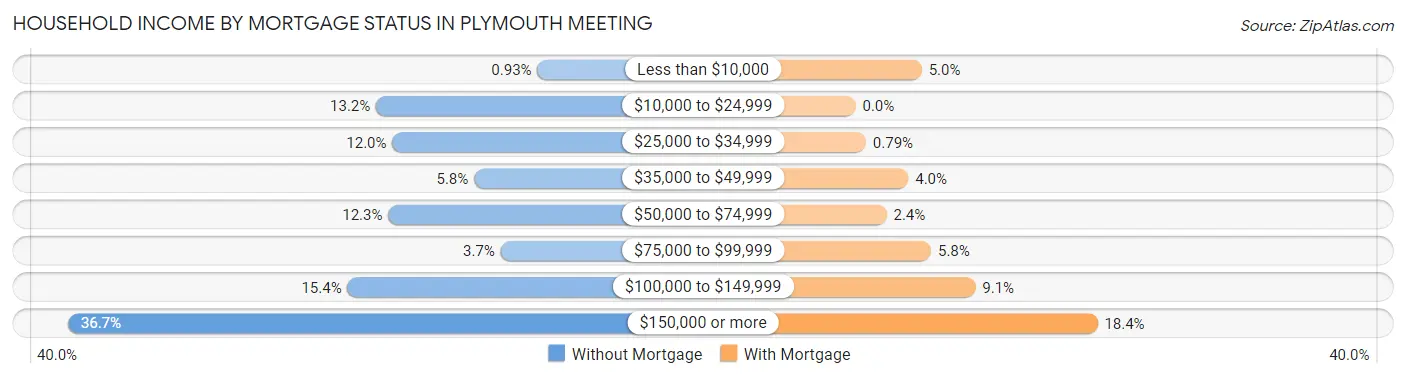
| Household Income | Without Mortgage | With Mortgage |
| Less than $10,000 | 6 (0.9%) | 64 (5.0%) |
| $10,000 to $24,999 | 85 (13.2%) | 0 (0.0%) |
| $25,000 to $34,999 | 77 (12.0%) | 10 (0.8%) |
| $35,000 to $49,999 | 37 (5.8%) | 51 (4.0%) |
| $50,000 to $74,999 | 79 (12.3%) | 30 (2.4%) |
| $75,000 to $99,999 | 24 (3.7%) | 73 (5.8%) |
| $100,000 to $149,999 | 99 (15.4%) | 116 (9.1%) |
| $150,000 or more | 236 (36.7%) | 234 (18.4%) |
| Total | 643 (100.0%) | 1,270 (100.0%) |
Property Value to Household Income Ratio in Plymouth Meeting
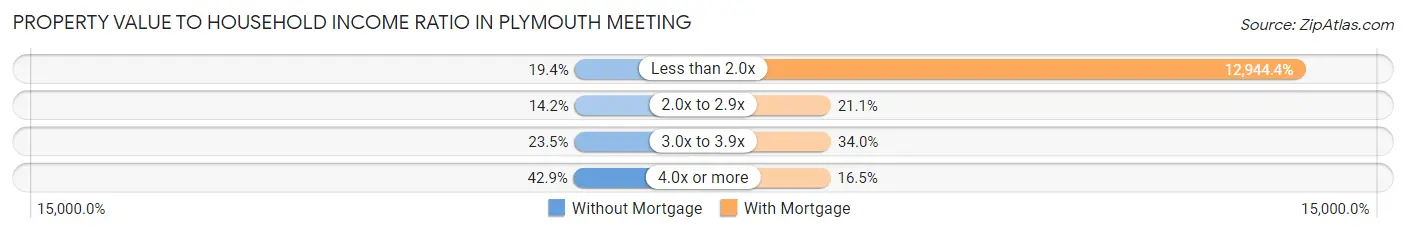
| Value-to-Income Ratio | Without Mortgage | With Mortgage |
| Less than 2.0x | 125 (19.4%) | 164,394 (12,944.4%) |
| 2.0x to 2.9x | 91 (14.1%) | 268 (21.1%) |
| 3.0x to 3.9x | 151 (23.5%) | 432 (34.0%) |
| 4.0x or more | 276 (42.9%) | 210 (16.5%) |
| Total | 643 (100.0%) | 1,270 (100.0%) |
Real Estate Taxes by Mortgage Status in Plymouth Meeting
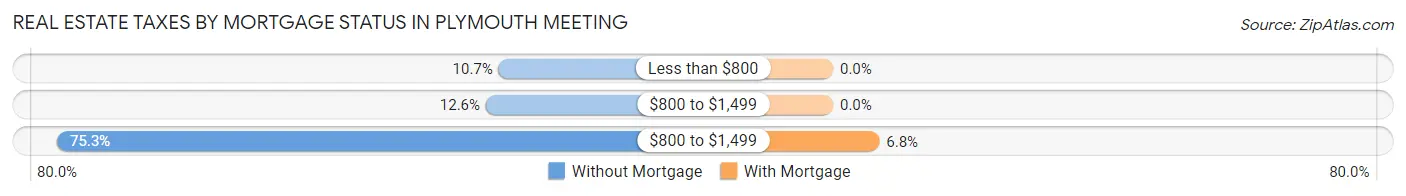
| Property Taxes | Without Mortgage | With Mortgage |
| Less than $800 | 69 (10.7%) | 0 (0.0%) |
| $800 to $1,499 | 81 (12.6%) | 0 (0.0%) |
| $800 to $1,499 | 484 (75.3%) | 86 (6.8%) |
| Total | 643 (100.0%) | 1,270 (100.0%) |
Health & Disability in Plymouth Meeting
Health Insurance Coverage by Age in Plymouth Meeting
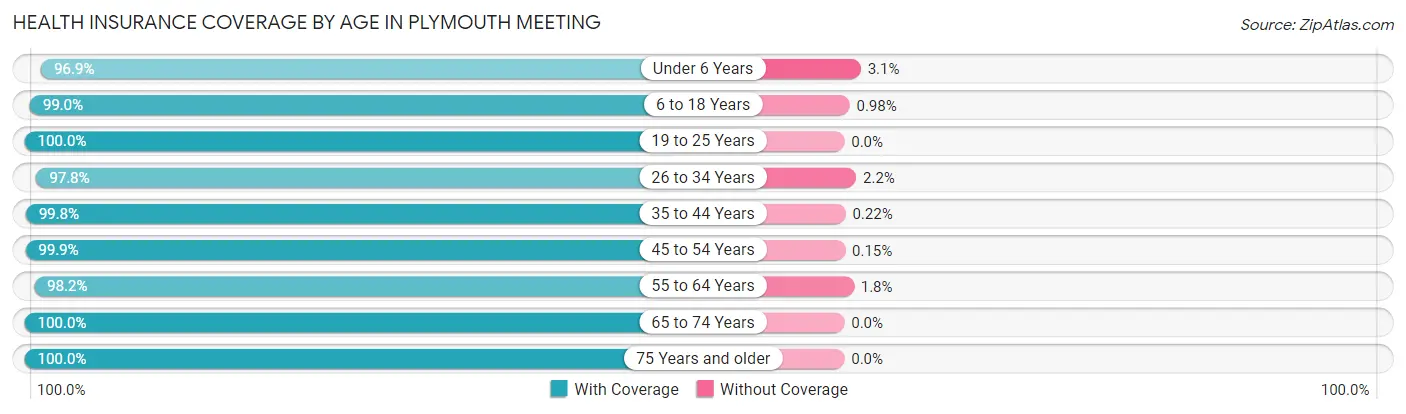
| Age Bracket | With Coverage | Without Coverage |
| Under 6 Years | 539 (96.9%) | 17 (3.1%) |
| 6 to 18 Years | 910 (99.0%) | 9 (1.0%) |
| 19 to 25 Years | 366 (100.0%) | 0 (0.0%) |
| 26 to 34 Years | 976 (97.8%) | 22 (2.2%) |
| 35 to 44 Years | 920 (99.8%) | 2 (0.2%) |
| 45 to 54 Years | 647 (99.9%) | 1 (0.2%) |
| 55 to 64 Years | 887 (98.2%) | 16 (1.8%) |
| 65 to 74 Years | 768 (100.0%) | 0 (0.0%) |
| 75 Years and older | 645 (100.0%) | 0 (0.0%) |
| Total | 6,658 (99.0%) | 67 (1.0%) |
Health Insurance Coverage by Citizenship Status in Plymouth Meeting
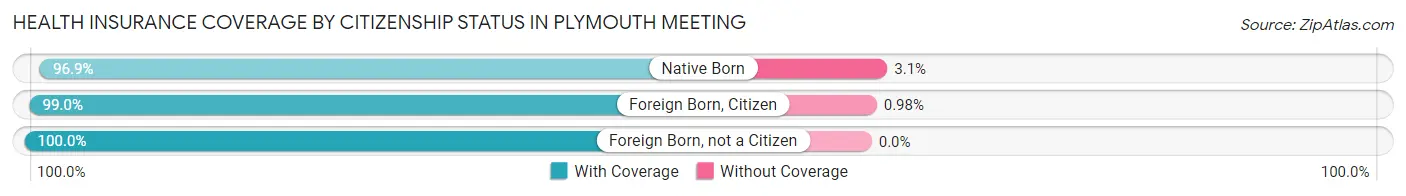
| Citizenship Status | With Coverage | Without Coverage |
| Native Born | 539 (96.9%) | 17 (3.1%) |
| Foreign Born, Citizen | 910 (99.0%) | 9 (1.0%) |
| Foreign Born, not a Citizen | 366 (100.0%) | 0 (0.0%) |
Health Insurance Coverage by Household Income in Plymouth Meeting
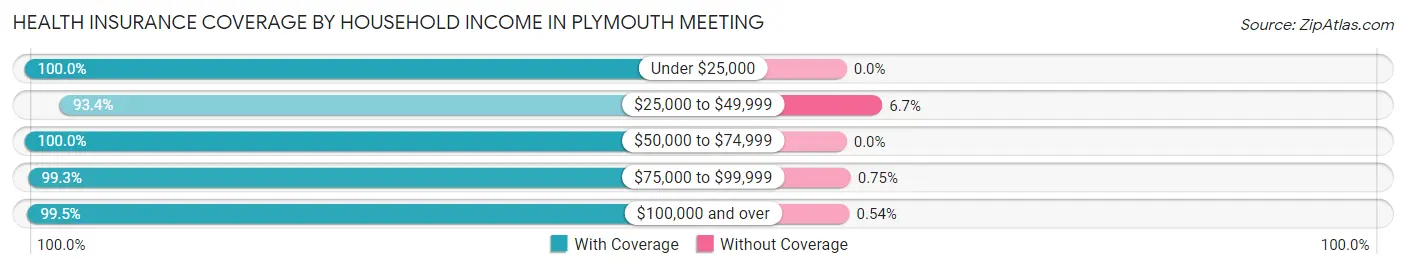
| Household Income | With Coverage | Without Coverage |
| Under $25,000 | 233 (100.0%) | 0 (0.0%) |
| $25,000 to $49,999 | 491 (93.3%) | 35 (6.7%) |
| $50,000 to $74,999 | 645 (100.0%) | 0 (0.0%) |
| $75,000 to $99,999 | 526 (99.3%) | 4 (0.7%) |
| $100,000 and over | 4,759 (99.5%) | 26 (0.5%) |
Public vs Private Health Insurance Coverage by Age in Plymouth Meeting
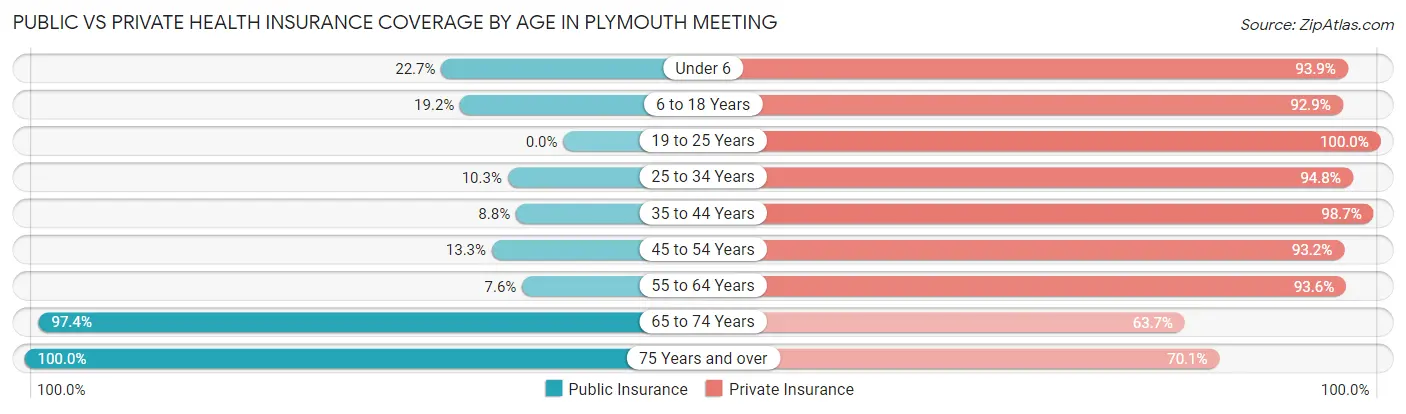
| Age Bracket | Public Insurance | Private Insurance |
| Under 6 | 126 (22.7%) | 522 (93.9%) |
| 6 to 18 Years | 176 (19.2%) | 854 (92.9%) |
| 19 to 25 Years | 0 (0.0%) | 366 (100.0%) |
| 25 to 34 Years | 103 (10.3%) | 946 (94.8%) |
| 35 to 44 Years | 81 (8.8%) | 910 (98.7%) |
| 45 to 54 Years | 86 (13.3%) | 604 (93.2%) |
| 55 to 64 Years | 69 (7.6%) | 845 (93.6%) |
| 65 to 74 Years | 748 (97.4%) | 489 (63.7%) |
| 75 Years and over | 645 (100.0%) | 452 (70.1%) |
| Total | 2,034 (30.2%) | 5,988 (89.0%) |
Disability Status by Sex by Age in Plymouth Meeting
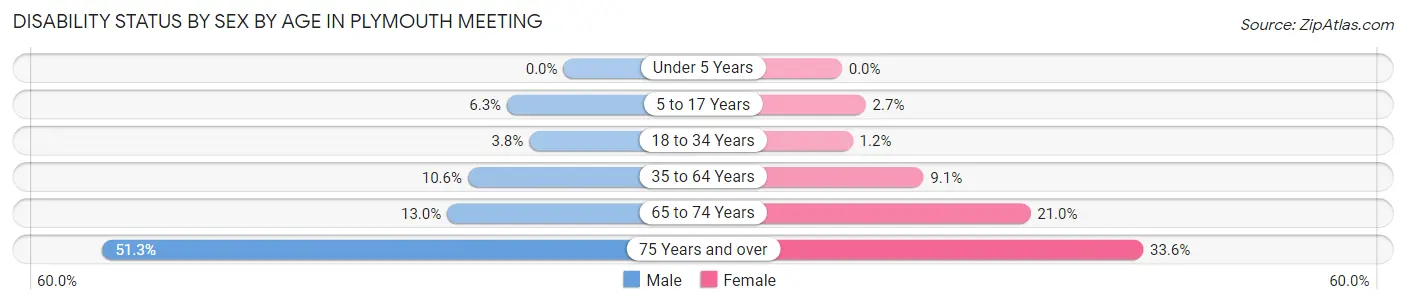
| Age Bracket | Male | Female |
| Under 5 Years | 0 (0.0%) | 0 (0.0%) |
| 5 to 17 Years | 30 (6.3%) | 14 (2.7%) |
| 18 to 34 Years | 22 (3.8%) | 10 (1.2%) |
| 35 to 64 Years | 132 (10.6%) | 112 (9.1%) |
| 65 to 74 Years | 47 (13.0%) | 85 (21.0%) |
| 75 Years and over | 97 (51.3%) | 153 (33.6%) |
Disability Class by Sex by Age in Plymouth Meeting
Disability Class: Hearing Difficulty
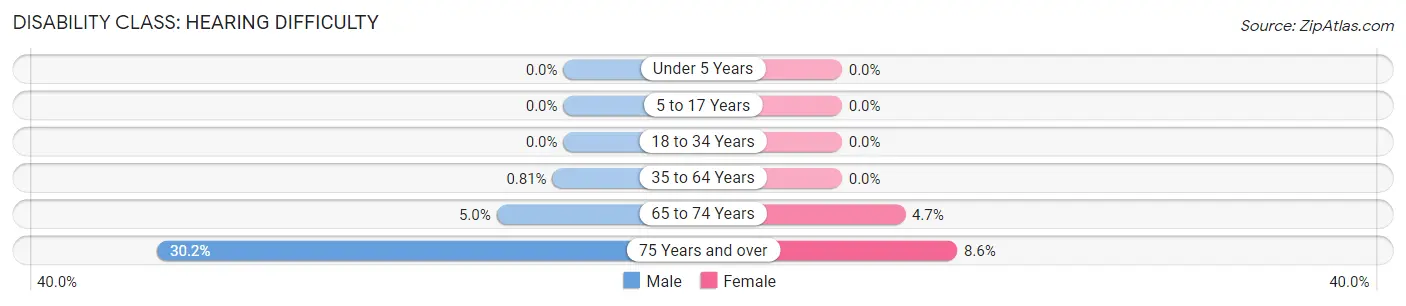
| Age Bracket | Male | Female |
| Under 5 Years | 0 (0.0%) | 0 (0.0%) |
| 5 to 17 Years | 0 (0.0%) | 0 (0.0%) |
| 18 to 34 Years | 0 (0.0%) | 0 (0.0%) |
| 35 to 64 Years | 10 (0.8%) | 0 (0.0%) |
| 65 to 74 Years | 18 (5.0%) | 19 (4.7%) |
| 75 Years and over | 57 (30.2%) | 39 (8.6%) |
Disability Class: Vision Difficulty
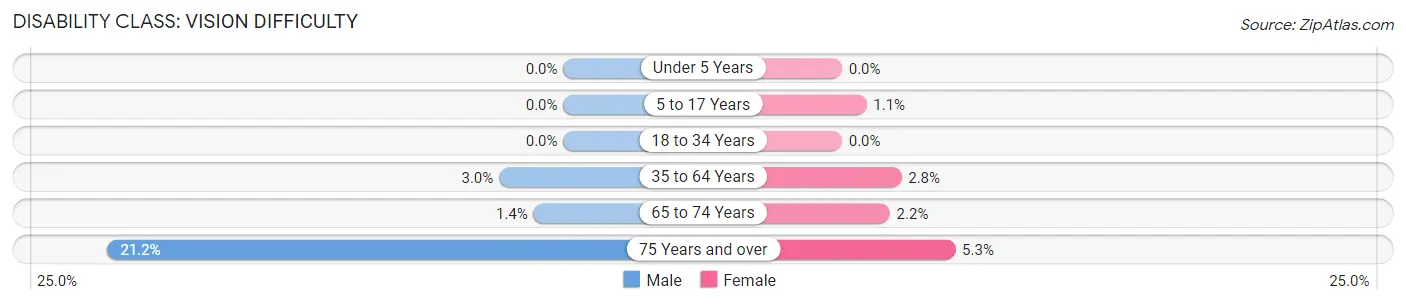
| Age Bracket | Male | Female |
| Under 5 Years | 0 (0.0%) | 0 (0.0%) |
| 5 to 17 Years | 0 (0.0%) | 6 (1.1%) |
| 18 to 34 Years | 0 (0.0%) | 0 (0.0%) |
| 35 to 64 Years | 37 (3.0%) | 34 (2.8%) |
| 65 to 74 Years | 5 (1.4%) | 9 (2.2%) |
| 75 Years and over | 40 (21.2%) | 24 (5.3%) |
Disability Class: Cognitive Difficulty
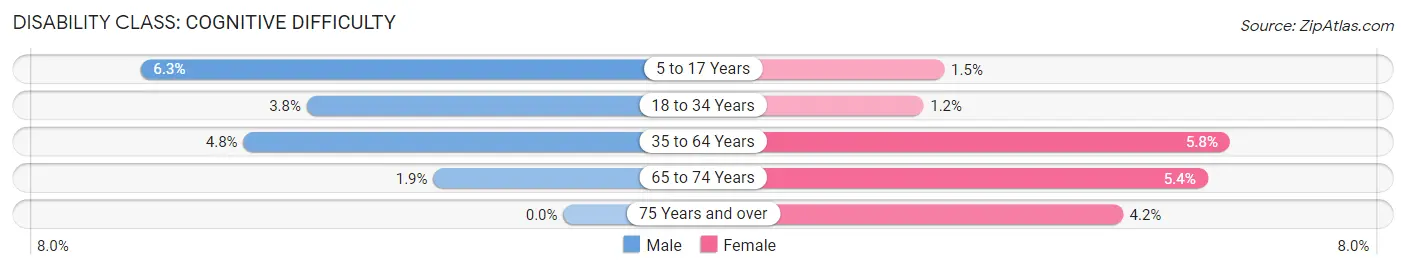
| Age Bracket | Male | Female |
| 5 to 17 Years | 30 (6.3%) | 8 (1.5%) |
| 18 to 34 Years | 22 (3.8%) | 10 (1.2%) |
| 35 to 64 Years | 59 (4.8%) | 71 (5.8%) |
| 65 to 74 Years | 7 (1.9%) | 22 (5.4%) |
| 75 Years and over | 0 (0.0%) | 19 (4.2%) |
Disability Class: Ambulatory Difficulty
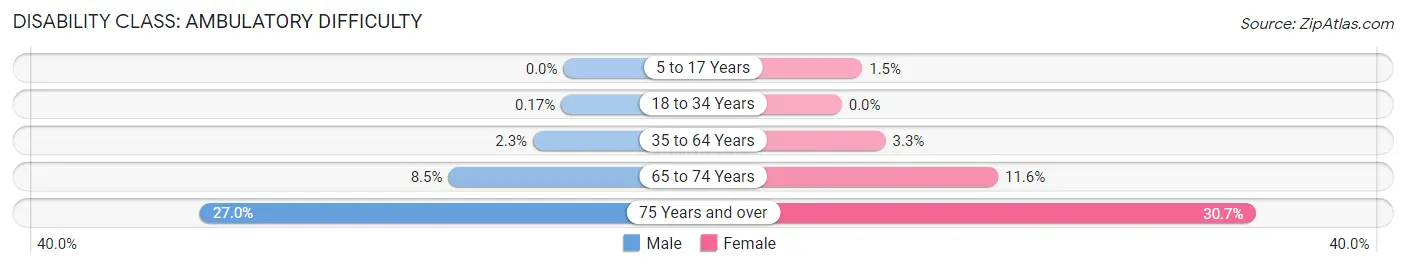
| Age Bracket | Male | Female |
| 5 to 17 Years | 0 (0.0%) | 8 (1.5%) |
| 18 to 34 Years | 1 (0.2%) | 0 (0.0%) |
| 35 to 64 Years | 28 (2.3%) | 40 (3.3%) |
| 65 to 74 Years | 31 (8.5%) | 47 (11.6%) |
| 75 Years and over | 51 (27.0%) | 140 (30.7%) |
Disability Class: Self-Care Difficulty
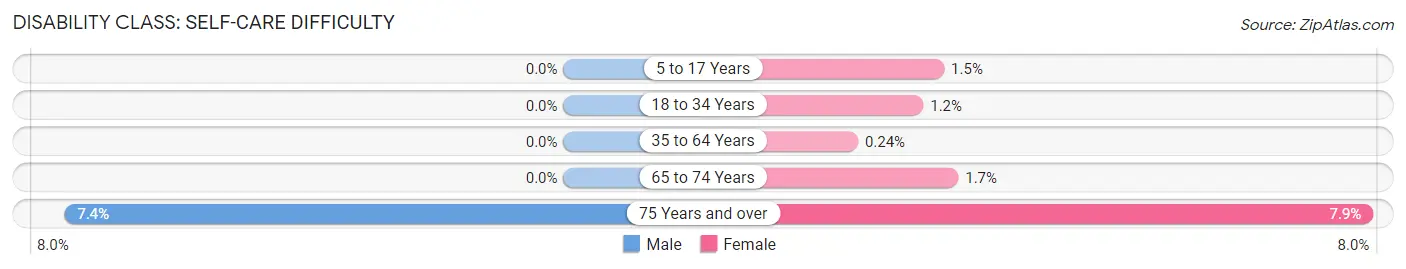
| Age Bracket | Male | Female |
| 5 to 17 Years | 0 (0.0%) | 8 (1.5%) |
| 18 to 34 Years | 0 (0.0%) | 10 (1.2%) |
| 35 to 64 Years | 0 (0.0%) | 3 (0.2%) |
| 65 to 74 Years | 0 (0.0%) | 7 (1.7%) |
| 75 Years and over | 14 (7.4%) | 36 (7.9%) |
Technology Access in Plymouth Meeting
Computing Device Access in Plymouth Meeting
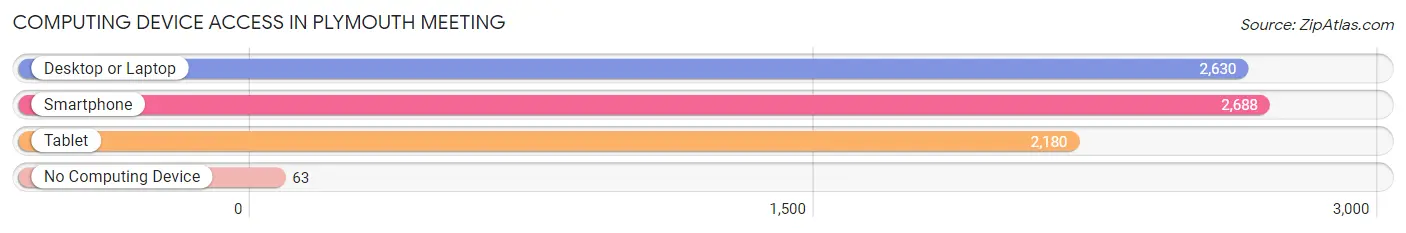
| Device Type | # Households | % Households |
| Desktop or Laptop | 2,630 | 89.6% |
| Smartphone | 2,688 | 91.6% |
| Tablet | 2,180 | 74.3% |
| No Computing Device | 63 | 2.1% |
| Total | 2,934 | 100.0% |
Internet Access in Plymouth Meeting
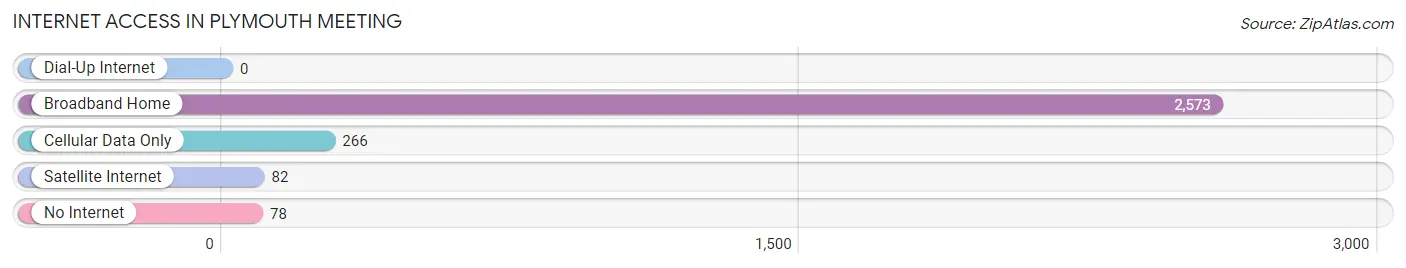
| Internet Type | # Households | % Households |
| Dial-Up Internet | 0 | 0.0% |
| Broadband Home | 2,573 | 87.7% |
| Cellular Data Only | 266 | 9.1% |
| Satellite Internet | 82 | 2.8% |
| No Internet | 78 | 2.7% |
| Total | 2,934 | 100.0% |
Plymouth Meeting Summary
Plymouth Meeting is a census-designated place (CDP) located in Montgomery County, Pennsylvania, United States. It is situated approximately 20 miles northwest of Philadelphia and is part of the larger Plymouth Township. As of the 2010 census, the population of Plymouth Meeting was 6,177.
History
Plymouth Meeting was first settled in 1686 by a group of Quakers from England. The area was originally known as Conshohocken, but was later renamed Plymouth Meeting in 1702. The name was derived from the fact that the area was a meeting place for the Plymouth Company, a group of Quakers who had purchased land in the area.
The area was primarily agricultural until the mid-19th century, when the Pennsylvania Railroad was built through the area. This led to the development of several industrial and commercial businesses in the area, including a paper mill, a flour mill, and a brickyard.
In the early 20th century, the area began to experience a population boom as more people moved to the area to take advantage of the new jobs and businesses. This growth continued until the 1950s, when the population began to decline due to suburbanization.
Geography
Plymouth Meeting is located at 40°7′17″N 75°19′45″W (40.1214, -75.3292). According to the United States Census Bureau, the CDP has a total area of 2.2 square miles (5.7 km2), all of it land.
Economy
Plymouth Meeting is home to a variety of businesses, including retail stores, restaurants, and professional services. The area is also home to several corporate offices, including those of the pharmaceutical company GlaxoSmithKline and the financial services company SEI Investments.
Demographics
As of the 2010 census, the population of Plymouth Meeting was 6,177. The racial makeup of the CDP was 87.3% White, 5.2% African American, 0.3% Native American, 4.2% Asian, 0.1% Pacific Islander, 1.2% from other races, and 1.9% from two or more races. Hispanic or Latino of any race were 3.7% of the population.
The median income for a household in the CDP was $76,944, and the median income for a family was $90,917. Males had a median income of $62,917 versus $45,000 for females. The per capita income for the CDP was $37,945. About 2.2% of families and 3.2% of the population were below the poverty line, including 3.7% of those under age 18 and 4.2% of those age 65 or over.
Common Questions
What is the Total Population of Plymouth Meeting?
Total Population of Plymouth Meeting is 6,756.
What is the Total Male Population of Plymouth Meeting?
Total Male Population of Plymouth Meeting is 3,052.
What is the Total Female Population of Plymouth Meeting?
Total Female Population of Plymouth Meeting is 3,704.
What is the Ratio of Males per 100 Females in Plymouth Meeting?
There are 82.40 Males per 100 Females in Plymouth Meeting.
What is the Ratio of Females per 100 Males in Plymouth Meeting?
There are 121.36 Females per 100 Males in Plymouth Meeting.
What is the Median Population Age in Plymouth Meeting?
Median Population Age in Plymouth Meeting is 38.5 Years.
What is the Average Family Size in Plymouth Meeting
Average Family Size in Plymouth Meeting is 3.0 People.
What is the Average Household Size in Plymouth Meeting
Average Household Size in Plymouth Meeting is 2.3 People.
What is Per Capita Income in Plymouth Meeting?
Per Capita income in Plymouth Meeting is $59,497.
What is the Median Family Income in Plymouth Meeting?
Median Family Income in Plymouth Meeting is $152,292.
What is the Median Household income in Plymouth Meeting?
Median Household Income in Plymouth Meeting is $120,662.
What is Income or Wage Gap in Plymouth Meeting?
Income or Wage Gap in Plymouth Meeting is 24.4%.
Women in Plymouth Meeting earn 75.6 cents for every dollar earned by a man.
What is Family Income Deficit in Plymouth Meeting?
Family Income Deficit in Plymouth Meeting is $3,229.
Families that are below poverty line in Plymouth Meeting earn $3,229 less on average than the poverty threshold level.
What is Inequality or Gini Index in Plymouth Meeting?
Inequality or Gini Index in Plymouth Meeting is 0.40.
How Large is the Labor Force in Plymouth Meeting?
There are 3,662 People in the Labor Forcein in Plymouth Meeting.
What is the Percentage of People in the Labor Force in Plymouth Meeting?
68.0% of People are in the Labor Force in Plymouth Meeting.
What is the Unemployment Rate in Plymouth Meeting?
Unemployment Rate in Plymouth Meeting is 3.0%.