New Oxford borough, PA
New Oxford borough Overview
1,720
TOTAL POPULATION
821
MALE POPULATION
899
FEMALE POPULATION
91.32
MALES / 100 FEMALES
109.50
FEMALES / 100 MALES
36.7
MEDIAN AGE
3.2
AVG FAMILY SIZE
2.5
AVG HOUSEHOLD SIZE
$27,050
PER CAPITA INCOME
$67,188
AVG FAMILY INCOME
$53,947
AVG HOUSEHOLD INCOME
38.0%
WAGE / INCOME GAP [ % ]
62.0¢/ $1
WAGE / INCOME GAP [ $ ]
0.43
INEQUALITY / GINI INDEX
833
LABOR FORCE [ PEOPLE ]
65.0%
PERCENT IN LABOR FORCE
5.3%
UNEMPLOYMENT RATE
Race in New Oxford borough
The most populous races in New Oxford borough are White / Caucasian (1,479 | 86.0%), Hispanic or Latino (346 | 20.1%), and Some other Race (158 | 9.2%).
| Race | # Population | % Population |
| Asian | 10 | 0.6% |
| Black / African American | 7 | 0.4% |
| Hawaiian / Pacific | 0 | 0.0% |
| Hispanic or Latino | 346 | 20.1% |
| Native / Alaskan | 1 | 0.1% |
| White / Caucasian | 1,479 | 86.0% |
| Two or more Races | 65 | 3.8% |
| Some other Race | 158 | 9.2% |
| Total | 1,720 | 100.0% |
Ancestry in New Oxford borough
The most populous ancestries reported in New Oxford borough are German (574 | 33.4%), Mexican (285 | 16.6%), American (177 | 10.3%), Irish (132 | 7.7%), and English (105 | 6.1%), together accounting for 74.0% of all New Oxford borough residents.
| Ancestry | # Population | % Population |
| American | 177 | 10.3% |
| British | 8 | 0.5% |
| Burmese | 2 | 0.1% |
| Cherokee | 4 | 0.2% |
| Dominican | 10 | 0.6% |
| English | 105 | 6.1% |
| European | 2 | 0.1% |
| Filipino | 5 | 0.3% |
| Finnish | 3 | 0.2% |
| French | 21 | 1.2% |
| German | 574 | 33.4% |
| Irish | 132 | 7.7% |
| Italian | 65 | 3.8% |
| Korean | 8 | 0.5% |
| Mexican | 285 | 16.6% |
| Norwegian | 11 | 0.6% |
| Polish | 46 | 2.7% |
| Puerto Rican | 51 | 3.0% |
| Scotch-Irish | 13 | 0.8% |
| Scottish | 34 | 2.0% |
| Swiss | 10 | 0.6% |
| Welsh | 13 | 0.8% |
| Yugoslavian | 3 | 0.2% | View All 23 Rows |
Immigrants in New Oxford borough
The most numerous immigrant groups reported in New Oxford borough came from Latin America (142 | 8.3%), Central America (132 | 7.7%), Mexico (132 | 7.7%), Caribbean (10 | 0.6%), and Dominican Republic (10 | 0.6%), together accounting for 24.8% of all New Oxford borough residents.
| Immigration Origin | # Population | % Population |
| Asia | 7 | 0.4% |
| Caribbean | 10 | 0.6% |
| Central America | 132 | 7.7% |
| China | 5 | 0.3% |
| Dominican Republic | 10 | 0.6% |
| Eastern Asia | 5 | 0.3% |
| Latin America | 142 | 8.3% |
| Mexico | 132 | 7.7% |
| Philippines | 2 | 0.1% |
| South Eastern Asia | 2 | 0.1% |
| Taiwan | 5 | 0.3% | View All 11 Rows |
Sex and Age in New Oxford borough
Sex and Age in New Oxford borough
The most populous age groups in New Oxford borough are 35 to 39 Years (89 | 10.8%) for men and 10 to 14 Years (83 | 9.2%) for women.
| Age Bracket | Male | Female |
| Under 5 Years | 39 (4.8%) | 65 (7.2%) |
| 5 to 9 Years | 83 (10.1%) | 49 (5.4%) |
| 10 to 14 Years | 57 (6.9%) | 83 (9.2%) |
| 15 to 19 Years | 68 (8.3%) | 72 (8.0%) |
| 20 to 24 Years | 54 (6.6%) | 73 (8.1%) |
| 25 to 29 Years | 22 (2.7%) | 42 (4.7%) |
| 30 to 34 Years | 40 (4.9%) | 68 (7.6%) |
| 35 to 39 Years | 89 (10.8%) | 40 (4.4%) |
| 40 to 44 Years | 41 (5.0%) | 51 (5.7%) |
| 45 to 49 Years | 36 (4.4%) | 38 (4.2%) |
| 50 to 54 Years | 76 (9.3%) | 41 (4.6%) |
| 55 to 59 Years | 22 (2.7%) | 53 (5.9%) |
| 60 to 64 Years | 38 (4.6%) | 37 (4.1%) |
| 65 to 69 Years | 54 (6.6%) | 45 (5.0%) |
| 70 to 74 Years | 53 (6.5%) | 64 (7.1%) |
| 75 to 79 Years | 28 (3.4%) | 19 (2.1%) |
| 80 to 84 Years | 2 (0.2%) | 39 (4.3%) |
| 85 Years and over | 19 (2.3%) | 20 (2.2%) |
| Total | 821 (100.0%) | 899 (100.0%) |
Families and Households in New Oxford borough
Median Family Size in New Oxford borough
The median family size in New Oxford borough is 3.17 persons per family, with single female/mother families (114 | 27.5%) accounting for the largest median family size of 3.68 persons per family. On the other hand, single male/father families (39 | 9.4%) represent the smallest median family size with 2.44 persons per family.
| Family Type | # Families | Family Size |
| Married-Couple | 261 (63.0%) | 3.07 |
| Single Male/Father | 39 (9.4%) | 2.44 |
| Single Female/Mother | 114 (27.5%) | 3.68 |
| Total Families | 414 (100.0%) | 3.17 |
Median Household Size in New Oxford borough
The median household size in New Oxford borough is 2.46 persons per household, with single female/mother households (114 | 16.3%) accounting for the largest median household size of 4.16 persons per household. non-family households (284 | 40.7%) represent the smallest median household size with 1.14 persons per household.
| Household Type | # Households | Household Size |
| Married-Couple | 261 (37.4%) | 3.13 |
| Single Male/Father | 39 (5.6%) | 2.67 |
| Single Female/Mother | 114 (16.3%) | 4.16 |
| Non-family | 284 (40.7%) | 1.14 |
| Total Households | 698 (100.0%) | 2.46 |
Household Size by Marriage Status in New Oxford borough
Out of a total of 698 households in New Oxford borough, 414 (59.3%) are family households, while 284 (40.7%) are nonfamily households. The most numerous type of family households are 2-person households, comprising 168, and the most common type of nonfamily households are 1-person households, comprising 257.
| Household Size | Family Households | Nonfamily Households |
| 1-Person Households | - | 257 (36.8%) |
| 2-Person Households | 168 (24.1%) | 15 (2.1%) |
| 3-Person Households | 89 (12.8%) | 12 (1.7%) |
| 4-Person Households | 101 (14.5%) | 0 (0.0%) |
| 5-Person Households | 43 (6.2%) | 0 (0.0%) |
| 6-Person Households | 9 (1.3%) | 0 (0.0%) |
| 7+ Person Households | 4 (0.6%) | 0 (0.0%) |
| Total | 414 (59.3%) | 284 (40.7%) |
Female Fertility in New Oxford borough
Fertility by Age in New Oxford borough
Average fertility rate in New Oxford borough is 56.0 births per 1,000 women. Women in the age bracket of 20 to 34 years have the highest fertility rate with 98.0 births per 1,000 women. Women in the age bracket of 20 to 34 years acount for 81.8% of all women with births.
| Age Bracket | Women with Births | Births / 1,000 Women |
| 15 to 19 years | 4 (18.2%) | 56.0 |
| 20 to 34 years | 18 (81.8%) | 98.0 |
| 35 to 50 years | 0 (0.0%) | 0.0 |
| Total | 22 (100.0%) | 56.0 |
Fertility by Age by Marriage Status in New Oxford borough
54.5% of women with births (22) in New Oxford borough are married. The highest percentage of unmarried women with births falls into 15 to 19 years age bracket with 100.0% of them unmarried at the time of birth, while the lowest percentage of unmarried women with births belong to 20 to 34 years age bracket with 33.3% of them unmarried.
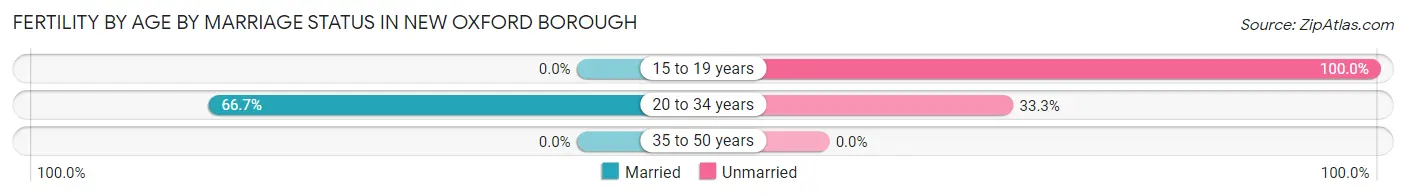
| Age Bracket | Married | Unmarried |
| 15 to 19 years | 0 (0.0%) | 4 (100.0%) |
| 20 to 34 years | 12 (66.7%) | 6 (33.3%) |
| 35 to 50 years | 0 (0.0%) | 0 (0.0%) |
| Total | 12 (54.5%) | 10 (45.5%) |
Fertility by Education in New Oxford borough
| Educational Attainment | Women with Births | Births / 1,000 Women |
| Less than High School | 6 (27.3%) | 58.0 |
| High School Diploma | 7 (31.8%) | 49.0 |
| College or Associate's Degree | 7 (31.8%) | 71.0 |
| Bachelor's Degree | 2 (9.1%) | 54.0 |
| Graduate Degree | 0 (0.0%) | 0.0 |
| Total | 22 (100.0%) | 56.0 |
Fertility by Education by Marriage Status in New Oxford borough
45.5% of women with births in New Oxford borough are unmarried. Women with the educational attainment of high school diploma are most likely to be married with 100.0% of them married at childbirth, while women with the educational attainment of less than high school are least likely to be married with 100.0% of them unmarried at childbirth.
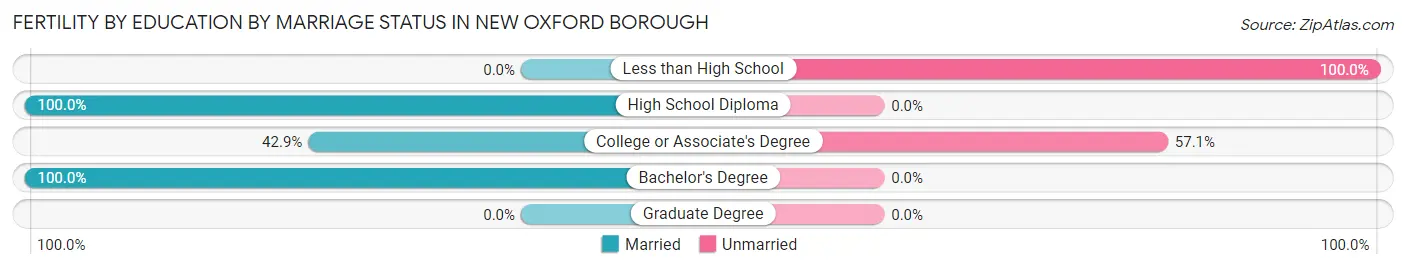
| Educational Attainment | Married | Unmarried |
| Less than High School | 0 (0.0%) | 6 (100.0%) |
| High School Diploma | 7 (100.0%) | 0 (0.0%) |
| College or Associate's Degree | 3 (42.9%) | 4 (57.1%) |
| Bachelor's Degree | 2 (100.0%) | 0 (0.0%) |
| Graduate Degree | 0 (0.0%) | 0 (0.0%) |
| Total | 12 (54.5%) | 10 (45.5%) |
Income in New Oxford borough
Income Overview in New Oxford borough
Per Capita Income in New Oxford borough is $27,050, while median incomes of families and households are $67,188 and $53,947 respectively.
| Characteristic | Number | Measure |
| Per Capita Income | 1,720 | $27,050 |
| Median Family Income | 414 | $67,188 |
| Mean Family Income | 414 | $71,905 |
| Median Household Income | 698 | $53,947 |
| Mean Household Income | 698 | $65,112 |
| Income Deficit | 414 | $0 |
| Wage / Income Gap (%) | 1,720 | 37.96% |
| Wage / Income Gap ($) | 1,720 | 62.04¢ per $1 |
| Gini / Inequality Index | 1,720 | 0.43 |
Earnings by Sex in New Oxford borough
Average Earnings in New Oxford borough are $31,500, $37,708 for men and $23,393 for women, a difference of 38.0%.
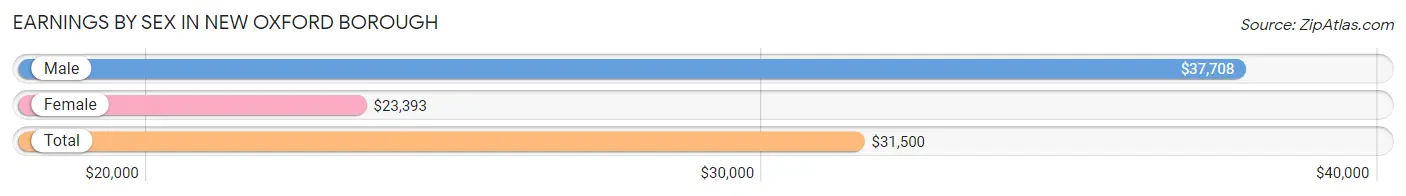
| Sex | Number | Average Earnings |
| Male | 453 (51.5%) | $37,708 |
| Female | 427 (48.5%) | $23,393 |
| Total | 880 (100.0%) | $31,500 |
Earnings by Sex by Income Bracket in New Oxford borough
The most common earnings brackets in New Oxford borough are $30,000 to $34,999 for men (62 | 13.7%) and $2,499 or less for women (56 | 13.1%).
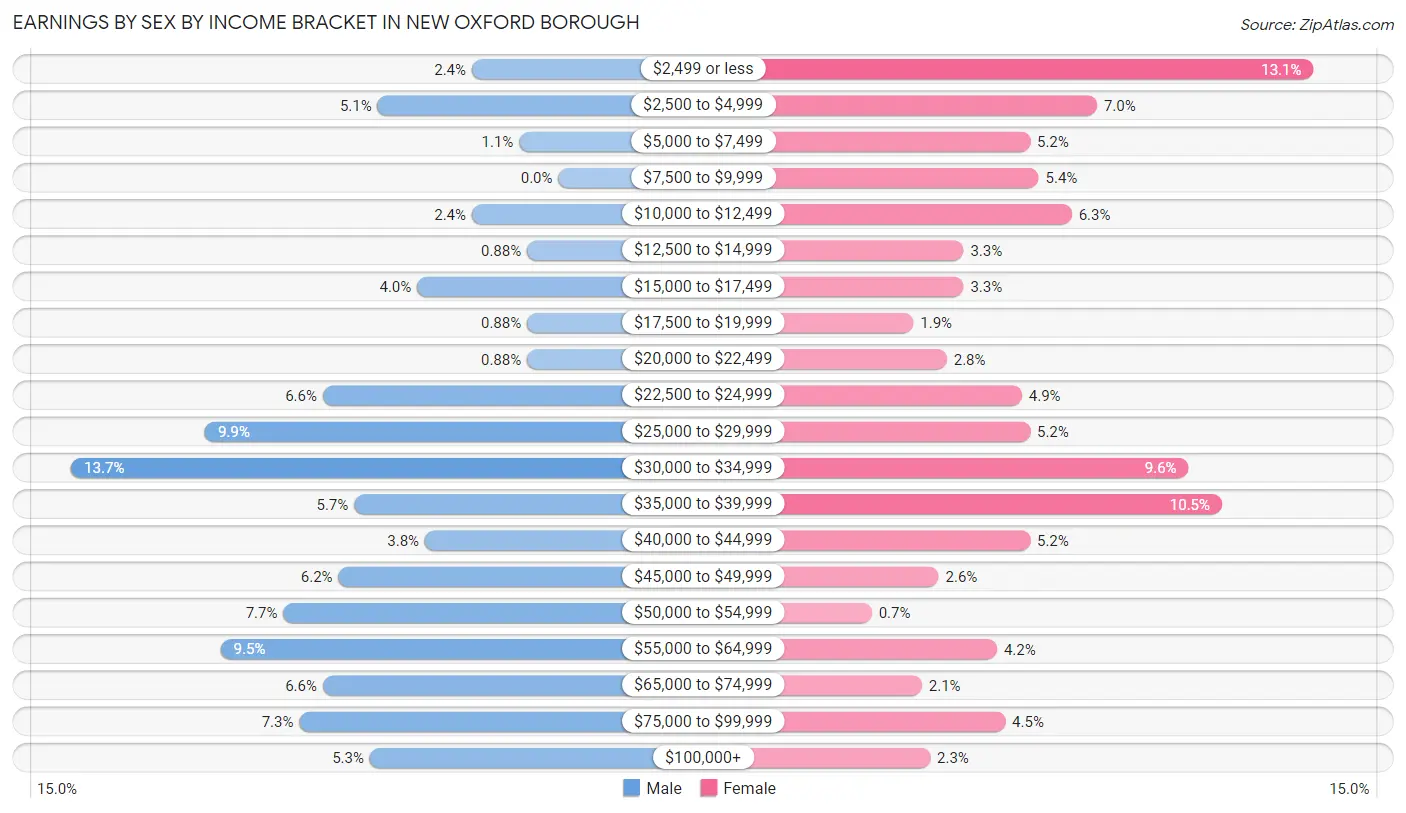
| Income | Male | Female |
| $2,499 or less | 11 (2.4%) | 56 (13.1%) |
| $2,500 to $4,999 | 23 (5.1%) | 30 (7.0%) |
| $5,000 to $7,499 | 5 (1.1%) | 22 (5.1%) |
| $7,500 to $9,999 | 0 (0.0%) | 23 (5.4%) |
| $10,000 to $12,499 | 11 (2.4%) | 27 (6.3%) |
| $12,500 to $14,999 | 4 (0.9%) | 14 (3.3%) |
| $15,000 to $17,499 | 18 (4.0%) | 14 (3.3%) |
| $17,500 to $19,999 | 4 (0.9%) | 8 (1.9%) |
| $20,000 to $22,499 | 4 (0.9%) | 12 (2.8%) |
| $22,500 to $24,999 | 30 (6.6%) | 21 (4.9%) |
| $25,000 to $29,999 | 45 (9.9%) | 22 (5.1%) |
| $30,000 to $34,999 | 62 (13.7%) | 41 (9.6%) |
| $35,000 to $39,999 | 26 (5.7%) | 45 (10.5%) |
| $40,000 to $44,999 | 17 (3.7%) | 22 (5.1%) |
| $45,000 to $49,999 | 28 (6.2%) | 11 (2.6%) |
| $50,000 to $54,999 | 35 (7.7%) | 3 (0.7%) |
| $55,000 to $64,999 | 43 (9.5%) | 18 (4.2%) |
| $65,000 to $74,999 | 30 (6.6%) | 9 (2.1%) |
| $75,000 to $99,999 | 33 (7.3%) | 19 (4.4%) |
| $100,000+ | 24 (5.3%) | 10 (2.3%) |
| Total | 453 (100.0%) | 427 (100.0%) |
Earnings by Sex by Educational Attainment in New Oxford borough
Average earnings in New Oxford borough are $38,819 for men and $29,688 for women, a difference of 23.5%. Men with an educational attainment of graduate degree enjoy the highest average annual earnings of $69,688, while those with bachelor's degree education earn the least with $26,691. Women with an educational attainment of graduate degree earn the most with the average annual earnings of $68,333, while those with less than high school education have the smallest earnings of $10,625.
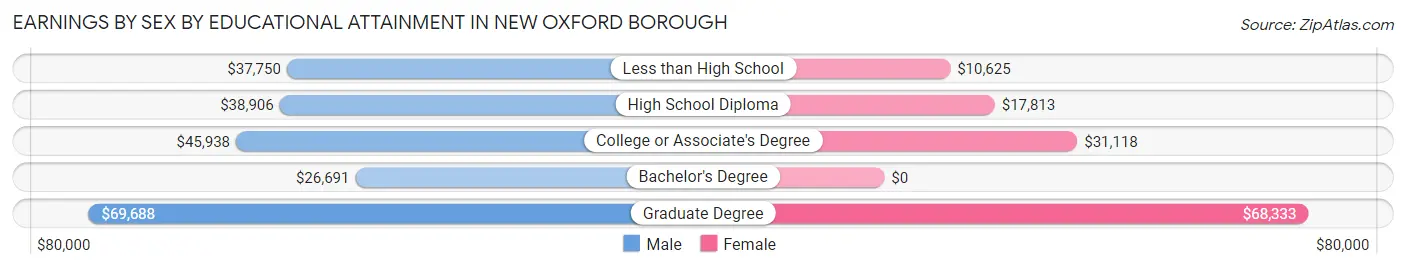
| Educational Attainment | Male Income | Female Income |
| Less than High School | $37,750 | $10,625 |
| High School Diploma | $38,906 | $17,813 |
| College or Associate's Degree | $45,938 | $31,118 |
| Bachelor's Degree | $26,691 | $0 |
| Graduate Degree | $69,688 | $68,333 |
| Total | $38,819 | $29,688 |
Family Income in New Oxford borough
Family Income Brackets in New Oxford borough
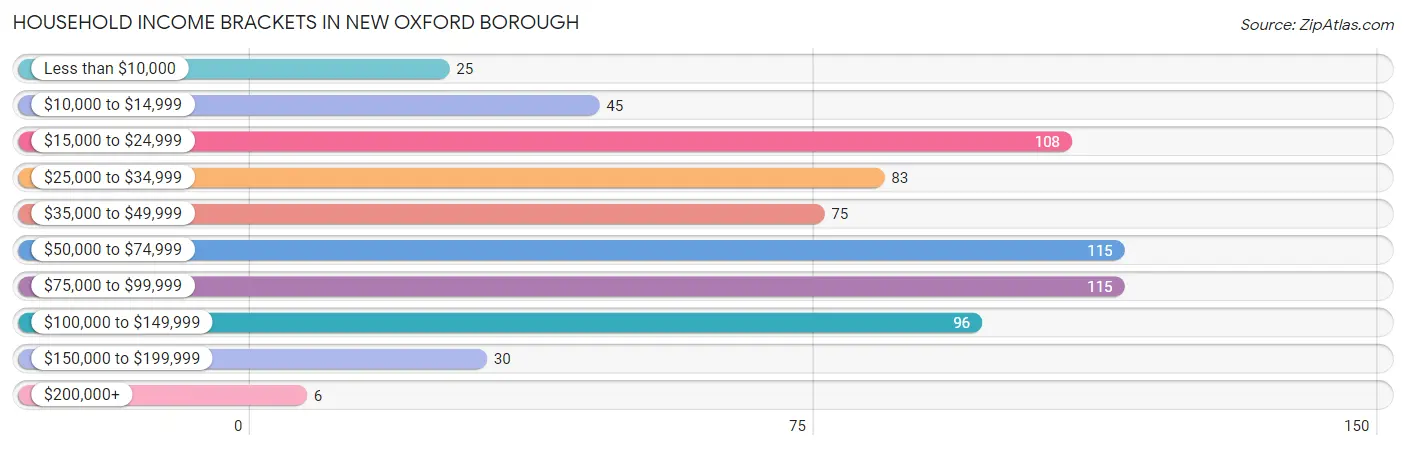
According to the New Oxford borough family income data, there are 108 families falling into the $50,000 to $74,999 income range, which is the most common income bracket and makes up 26.1% of all families. Conversely, the $200,000+ income bracket is the least frequent group with only 4 families (1.0%) belonging to this category.
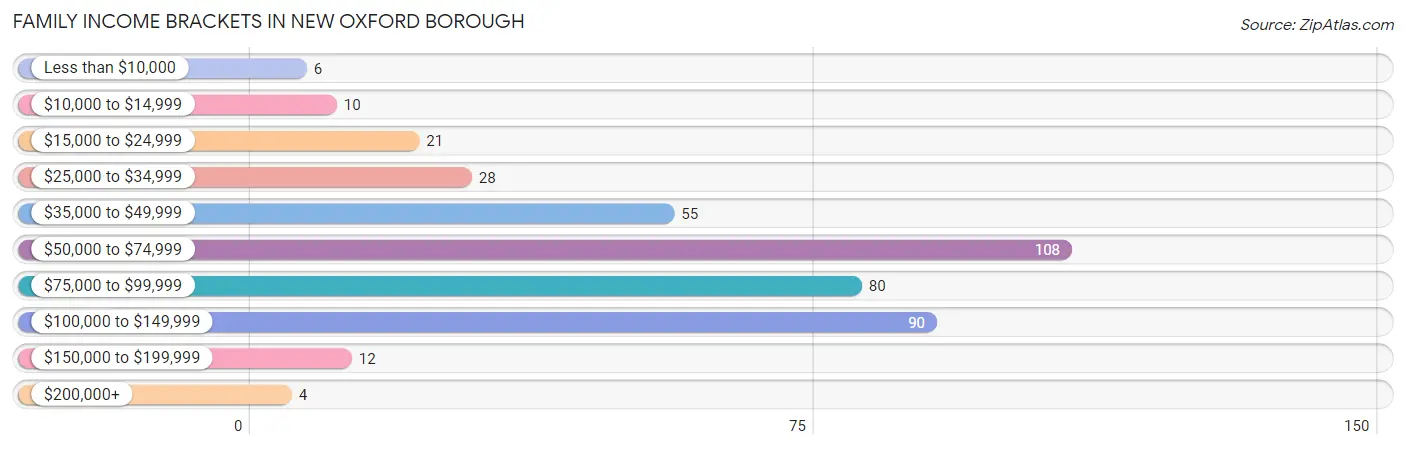
| Income Bracket | # Families | % Families |
| Less than $10,000 | 6 | 1.4% |
| $10,000 to $14,999 | 10 | 2.4% |
| $15,000 to $24,999 | 21 | 5.1% |
| $25,000 to $34,999 | 28 | 6.8% |
| $35,000 to $49,999 | 55 | 13.3% |
| $50,000 to $74,999 | 108 | 26.1% |
| $75,000 to $99,999 | 80 | 19.3% |
| $100,000 to $149,999 | 90 | 21.7% |
| $150,000 to $199,999 | 12 | 2.9% |
| $200,000+ | 4 | 1.0% |
Family Income by Famaliy Size in New Oxford borough
2-person families (199 | 48.1%) account for the highest median family income in New Oxford borough with $71,375 per family, while 2-person families (199 | 48.1%) have the highest median income of $35,688 per family member.
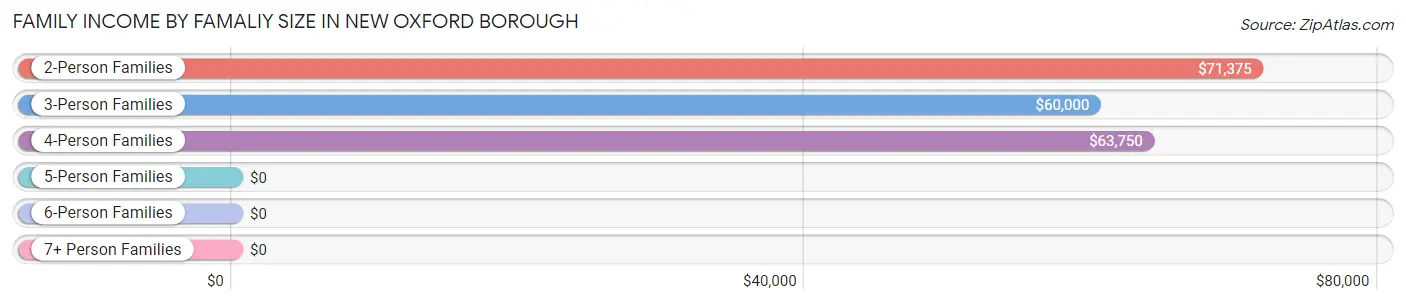
| Income Bracket | # Families | Median Income |
| 2-Person Families | 199 (48.1%) | $71,375 |
| 3-Person Families | 72 (17.4%) | $60,000 |
| 4-Person Families | 108 (26.1%) | $63,750 |
| 5-Person Families | 22 (5.3%) | $0 |
| 6-Person Families | 9 (2.2%) | $0 |
| 7+ Person Families | 4 (1.0%) | $0 |
| Total | 414 (100.0%) | $67,188 |
Family Income by Number of Earners in New Oxford borough
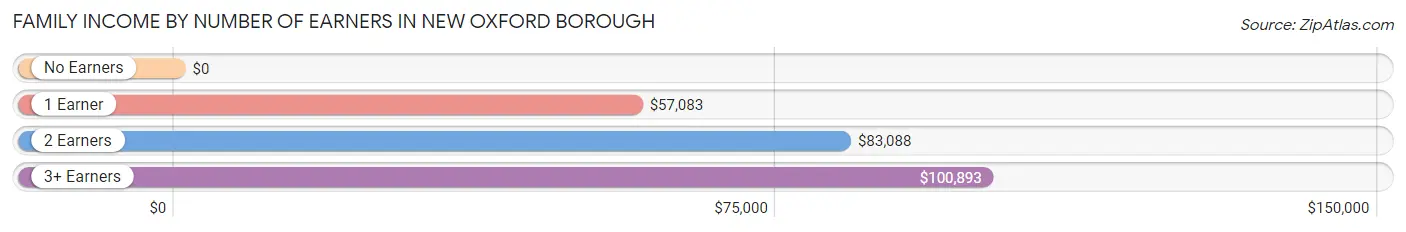
| Number of Earners | # Families | Median Income |
| No Earners | 47 (11.4%) | $0 |
| 1 Earner | 140 (33.8%) | $57,083 |
| 2 Earners | 186 (44.9%) | $83,088 |
| 3+ Earners | 41 (9.9%) | $100,893 |
| Total | 414 (100.0%) | $67,188 |
Household Income in New Oxford borough
Household Income Brackets in New Oxford borough
With 115 households falling in the category, the $50,000 to $74,999 income range is the most frequent in New Oxford borough, accounting for 16.5% of all households. In contrast, only 6 households (0.9%) fall into the $200,000+ income bracket, making it the least populous group.
| Income Bracket | # Households | % Households |
| Less than $10,000 | 25 | 3.6% |
| $10,000 to $14,999 | 45 | 6.4% |
| $15,000 to $24,999 | 108 | 15.5% |
| $25,000 to $34,999 | 83 | 11.9% |
| $35,000 to $49,999 | 75 | 10.7% |
| $50,000 to $74,999 | 115 | 16.5% |
| $75,000 to $99,999 | 115 | 16.5% |
| $100,000 to $149,999 | 96 | 13.8% |
| $150,000 to $199,999 | 30 | 4.3% |
| $200,000+ | 6 | 0.9% |
Household Income by Householder Age in New Oxford borough
The median household income in New Oxford borough is $53,947, with the highest median household income of $70,357 found in the 15 to 24 years age bracket for the primary householder. A total of 40 households (5.7%) fall into this category. Meanwhile, the 65+ years age bracket for the primary householder has the lowest median household income of $39,821, with 238 households (34.1%) in this group.
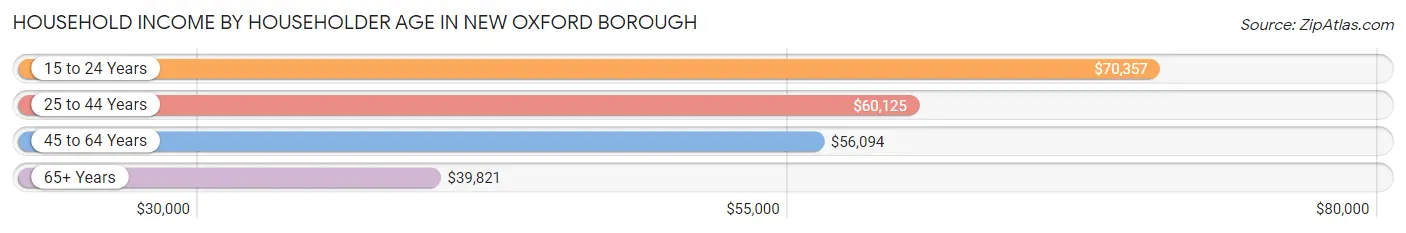
| Income Bracket | # Households | Median Income |
| 15 to 24 Years | 40 (5.7%) | $70,357 |
| 25 to 44 Years | 217 (31.1%) | $60,125 |
| 45 to 64 Years | 203 (29.1%) | $56,094 |
| 65+ Years | 238 (34.1%) | $39,821 |
| Total | 698 (100.0%) | $53,947 |
Poverty in New Oxford borough
Income Below Poverty by Sex and Age in New Oxford borough
With 14.4% poverty level for males and 17.3% for females among the residents of New Oxford borough, 6 to 11 year old males and 16 and 17 year old females are the most vulnerable to poverty, with 25 males (39.1%) and 7 females (50.0%) in their respective age groups living below the poverty level.
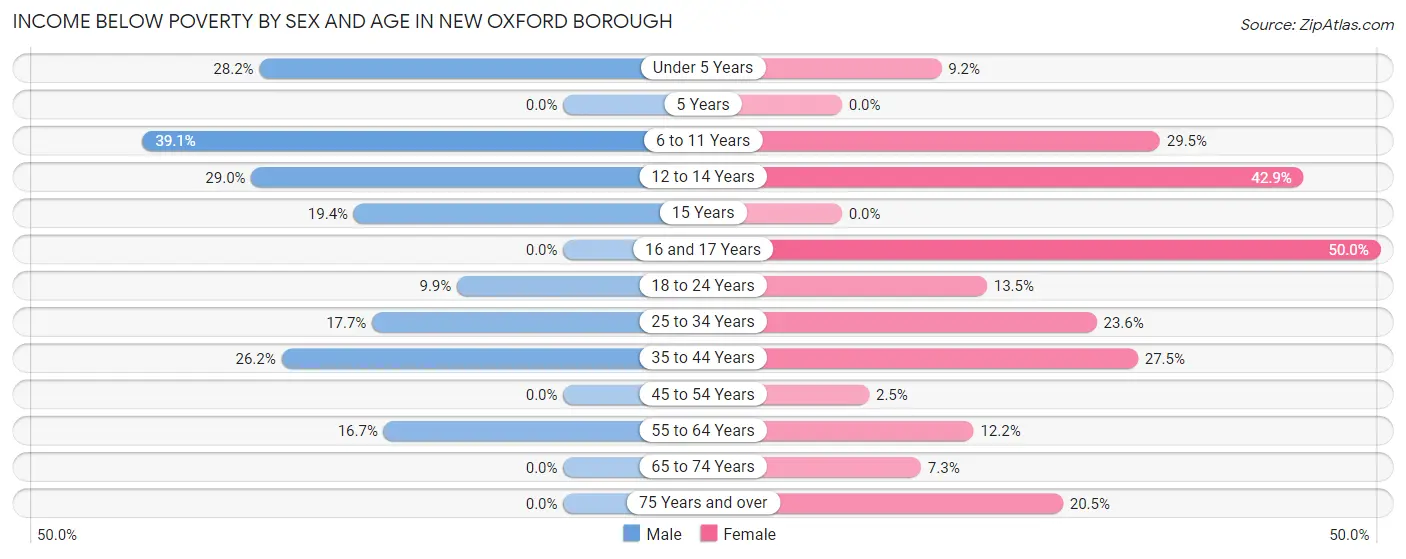
| Age Bracket | Male | Female |
| Under 5 Years | 11 (28.2%) | 6 (9.2%) |
| 5 Years | 0 (0.0%) | 0 (0.0%) |
| 6 to 11 Years | 25 (39.1%) | 31 (29.5%) |
| 12 to 14 Years | 11 (28.9%) | 9 (42.9%) |
| 15 Years | 7 (19.4%) | 0 (0.0%) |
| 16 and 17 Years | 0 (0.0%) | 7 (50.0%) |
| 18 to 24 Years | 7 (9.9%) | 14 (13.5%) |
| 25 to 34 Years | 11 (17.7%) | 26 (23.6%) |
| 35 to 44 Years | 34 (26.2%) | 25 (27.5%) |
| 45 to 54 Years | 0 (0.0%) | 2 (2.5%) |
| 55 to 64 Years | 10 (16.7%) | 11 (12.2%) |
| 65 to 74 Years | 0 (0.0%) | 8 (7.3%) |
| 75 Years and over | 0 (0.0%) | 16 (20.5%) |
| Total | 116 (14.4%) | 155 (17.3%) |
Income Above Poverty by Sex and Age in New Oxford borough
According to the poverty statistics in New Oxford borough, males aged 5 years and females aged 5 years are the age groups that are most secure financially, with 100.0% of males and 100.0% of females in these age groups living above the poverty line.
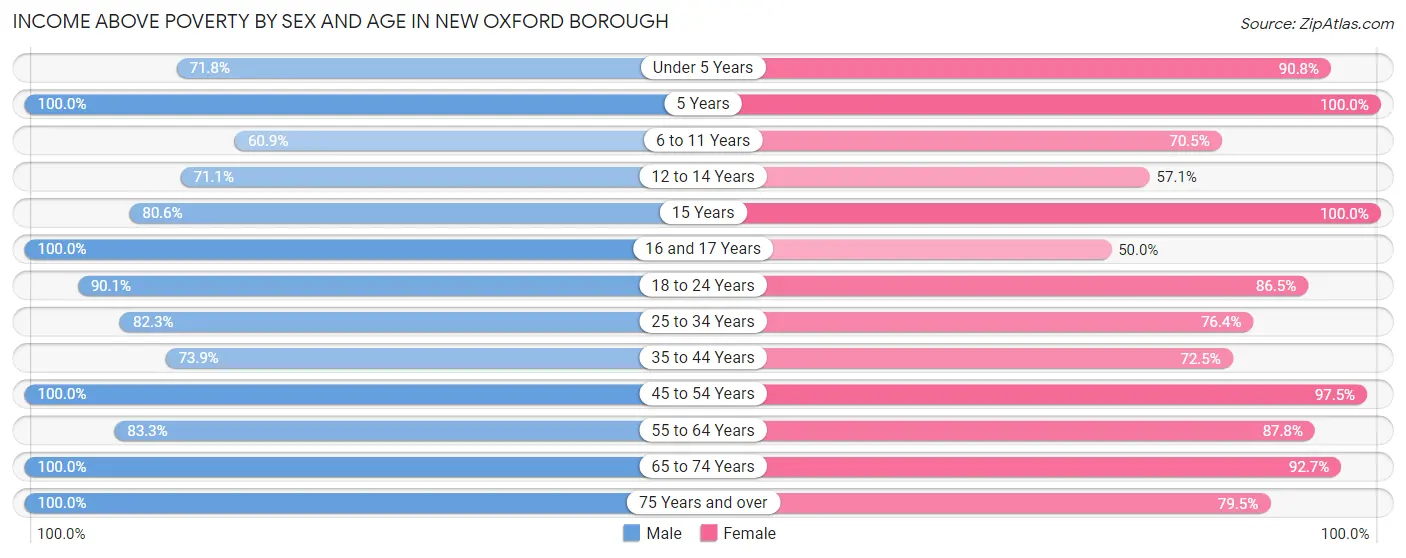
| Age Bracket | Male | Female |
| Under 5 Years | 28 (71.8%) | 59 (90.8%) |
| 5 Years | 24 (100.0%) | 4 (100.0%) |
| 6 to 11 Years | 39 (60.9%) | 74 (70.5%) |
| 12 to 14 Years | 27 (71.1%) | 12 (57.1%) |
| 15 Years | 29 (80.6%) | 27 (100.0%) |
| 16 and 17 Years | 15 (100.0%) | 7 (50.0%) |
| 18 to 24 Years | 64 (90.1%) | 90 (86.5%) |
| 25 to 34 Years | 51 (82.3%) | 84 (76.4%) |
| 35 to 44 Years | 96 (73.9%) | 66 (72.5%) |
| 45 to 54 Years | 112 (100.0%) | 77 (97.5%) |
| 55 to 64 Years | 50 (83.3%) | 79 (87.8%) |
| 65 to 74 Years | 107 (100.0%) | 101 (92.7%) |
| 75 Years and over | 49 (100.0%) | 62 (79.5%) |
| Total | 691 (85.6%) | 742 (82.7%) |
Income Below Poverty Among Married-Couple Families in New Oxford borough
The poverty statistics for married-couple families in New Oxford borough show that 6.5% or 17 of the total 261 families live below the poverty line. Families with 3 or 4 children have the highest poverty rate of 92.9%, comprising of 13 families. On the other hand, families with no children have the lowest poverty rate of 0.0%, which includes 0 families.
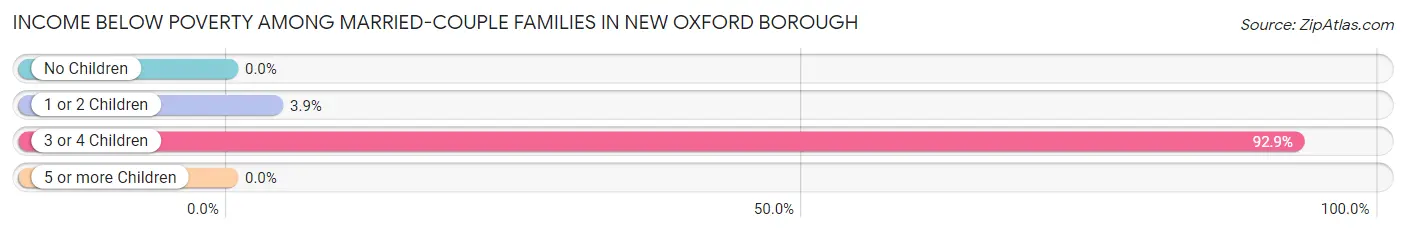
| Children | Above Poverty | Below Poverty |
| No Children | 145 (100.0%) | 0 (0.0%) |
| 1 or 2 Children | 98 (96.1%) | 4 (3.9%) |
| 3 or 4 Children | 1 (7.1%) | 13 (92.9%) |
| 5 or more Children | 0 (0.0%) | 0 (0.0%) |
| Total | 244 (93.5%) | 17 (6.5%) |
Income Below Poverty Among Single-Parent Households in New Oxford borough
According to the poverty data in New Oxford borough, 7.7% or 3 single-father households and 23.7% or 27 single-mother households are living below the poverty line. Among single-father households, those with no children have the highest poverty rate, with 3 households (15.0%) experiencing poverty. Likewise, among single-mother households, those with 3 or 4 children have the highest poverty rate, with 8 households (53.3%) falling below the poverty line.
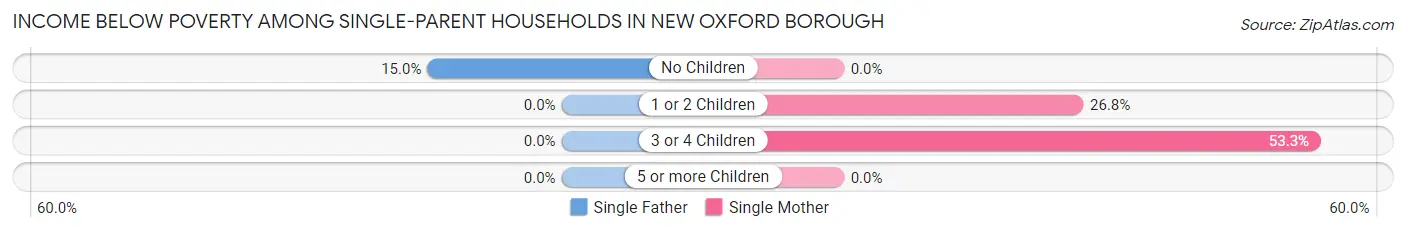
| Children | Single Father | Single Mother |
| No Children | 3 (15.0%) | 0 (0.0%) |
| 1 or 2 Children | 0 (0.0%) | 19 (26.8%) |
| 3 or 4 Children | 0 (0.0%) | 8 (53.3%) |
| 5 or more Children | 0 (0.0%) | 0 (0.0%) |
| Total | 3 (7.7%) | 27 (23.7%) |
Income Below Poverty Among Married-Couple vs Single-Parent Households in New Oxford borough
The poverty data for New Oxford borough shows that 17 of the married-couple family households (6.5%) and 30 of the single-parent households (19.6%) are living below the poverty level. Within the married-couple family households, those with 3 or 4 children have the highest poverty rate, with 13 households (92.9%) falling below the poverty line. Among the single-parent households, those with 3 or 4 children have the highest poverty rate, with 8 household (53.3%) living below poverty.
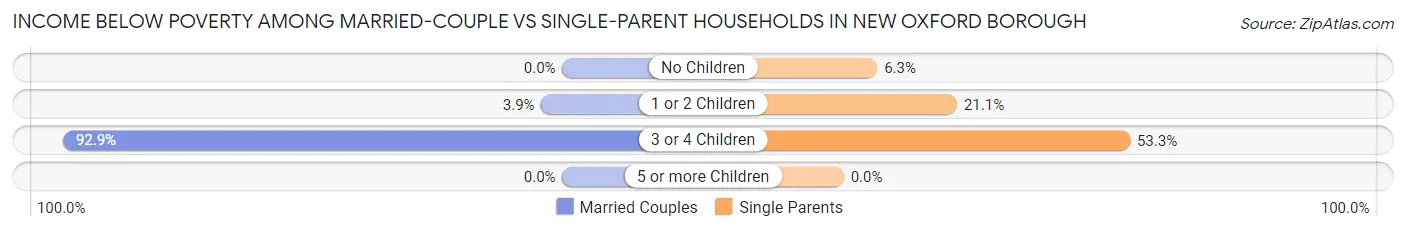
| Children | Married-Couple Families | Single-Parent Households |
| No Children | 0 (0.0%) | 3 (6.2%) |
| 1 or 2 Children | 4 (3.9%) | 19 (21.1%) |
| 3 or 4 Children | 13 (92.9%) | 8 (53.3%) |
| 5 or more Children | 0 (0.0%) | 0 (0.0%) |
| Total | 17 (6.5%) | 30 (19.6%) |
Employment Characteristics in New Oxford borough
Employment by Class of Employer in New Oxford borough
Among the 762 employed individuals in New Oxford borough, private company employees (592 | 77.7%), not-for-profit organizations (73 | 9.6%), and self-employed (incorporated) (37 | 4.9%) make up the most common classes of employment.
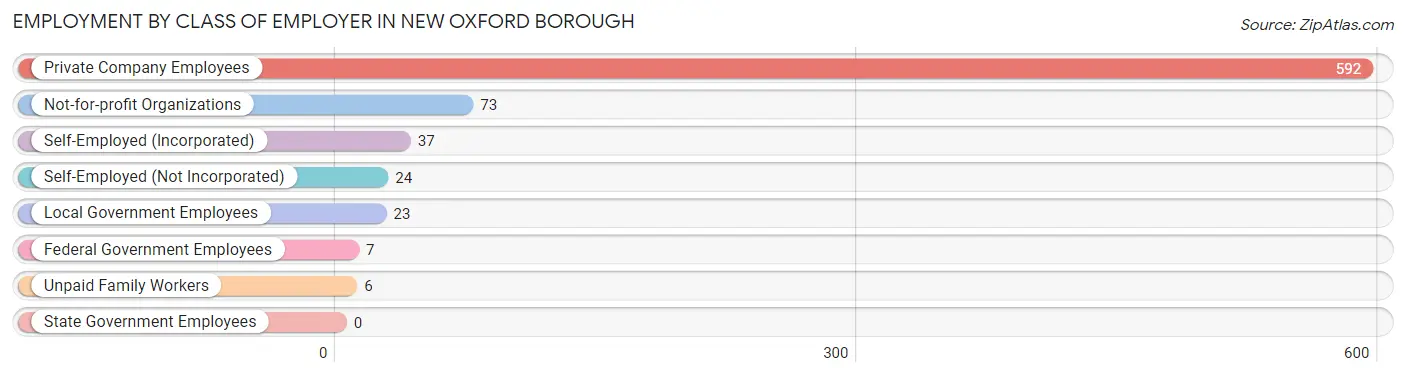
| Employer Class | # Employees | % Employees |
| Private Company Employees | 592 | 77.7% |
| Self-Employed (Incorporated) | 37 | 4.9% |
| Self-Employed (Not Incorporated) | 24 | 3.2% |
| Not-for-profit Organizations | 73 | 9.6% |
| Local Government Employees | 23 | 3.0% |
| State Government Employees | 0 | 0.0% |
| Federal Government Employees | 7 | 0.9% |
| Unpaid Family Workers | 6 | 0.8% |
| Total | 762 | 100.0% |
Employment Status by Age in New Oxford borough
According to the labor force statistics for New Oxford borough, out of the total population over 16 years of age (1,281), 65.0% or 833 individuals are in the labor force, with 5.3% or 44 of them unemployed. The age group with the highest labor force participation rate is 25 to 29 years, with 100.0% or 64 individuals in the labor force. Within the labor force, the 25 to 29 years age range has the highest percentage of unemployed individuals, with 15.6% or 10 of them being unemployed.
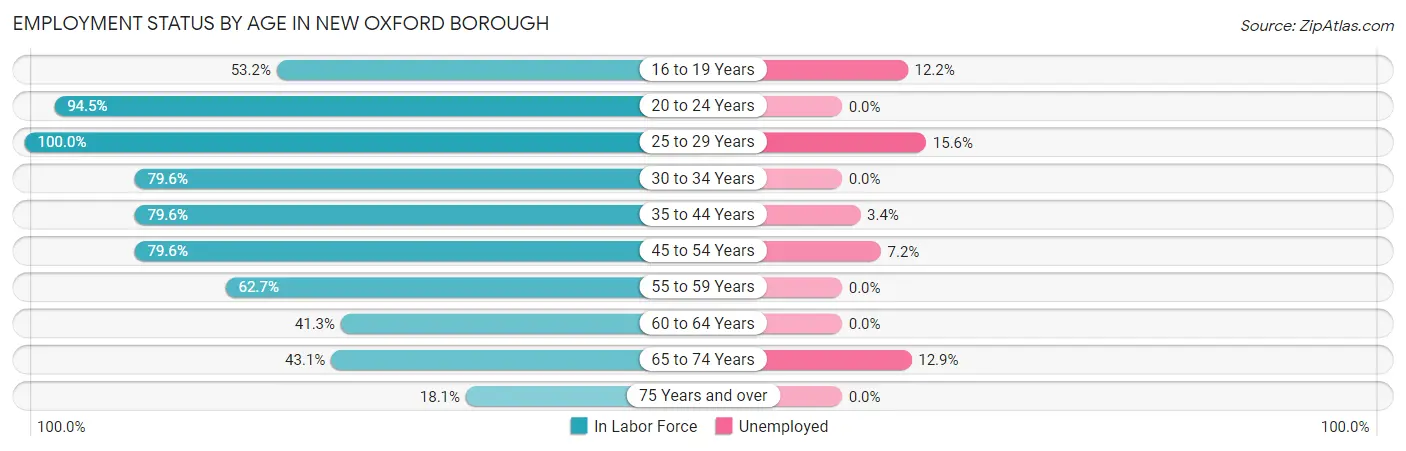
| Age Bracket | In Labor Force | Unemployed |
| 16 to 19 Years | 41 (53.2%) | 5 (12.2%) |
| 20 to 24 Years | 120 (94.5%) | 0 (0.0%) |
| 25 to 29 Years | 64 (100.0%) | 10 (15.6%) |
| 30 to 34 Years | 86 (79.6%) | 0 (0.0%) |
| 35 to 44 Years | 176 (79.6%) | 6 (3.4%) |
| 45 to 54 Years | 152 (79.6%) | 11 (7.2%) |
| 55 to 59 Years | 47 (62.7%) | 0 (0.0%) |
| 60 to 64 Years | 31 (41.3%) | 0 (0.0%) |
| 65 to 74 Years | 93 (43.1%) | 12 (12.9%) |
| 75 Years and over | 23 (18.1%) | 0 (0.0%) |
| Total | 833 (65.0%) | 44 (5.3%) |
Employment Status by Educational Attainment in New Oxford borough
According to labor force statistics for New Oxford borough, 75.7% of individuals (556) out of the total population between 25 and 64 years of age (734) are in the labor force, with 4.9% or 27 of them being unemployed. The group with the highest labor force participation rate are those with the educational attainment of bachelor's degree or higher, with 91.3% or 84 individuals in the labor force. Within the labor force, individuals with high school diploma education have the highest percentage of unemployment, with 8.2% or 18 of them being unemployed.
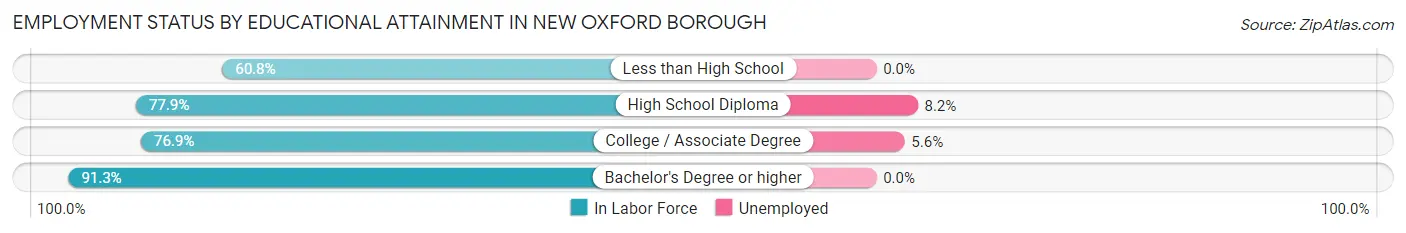
| Educational Attainment | In Labor Force | Unemployed |
| Less than High School | 93 (60.8%) | 0 (0.0%) |
| High School Diploma | 219 (77.9%) | 23 (8.2%) |
| College / Associate Degree | 160 (76.9%) | 12 (5.6%) |
| Bachelor's Degree or higher | 84 (91.3%) | 0 (0.0%) |
| Total | 556 (75.7%) | 36 (4.9%) |
Employment Occupations by Sex in New Oxford borough
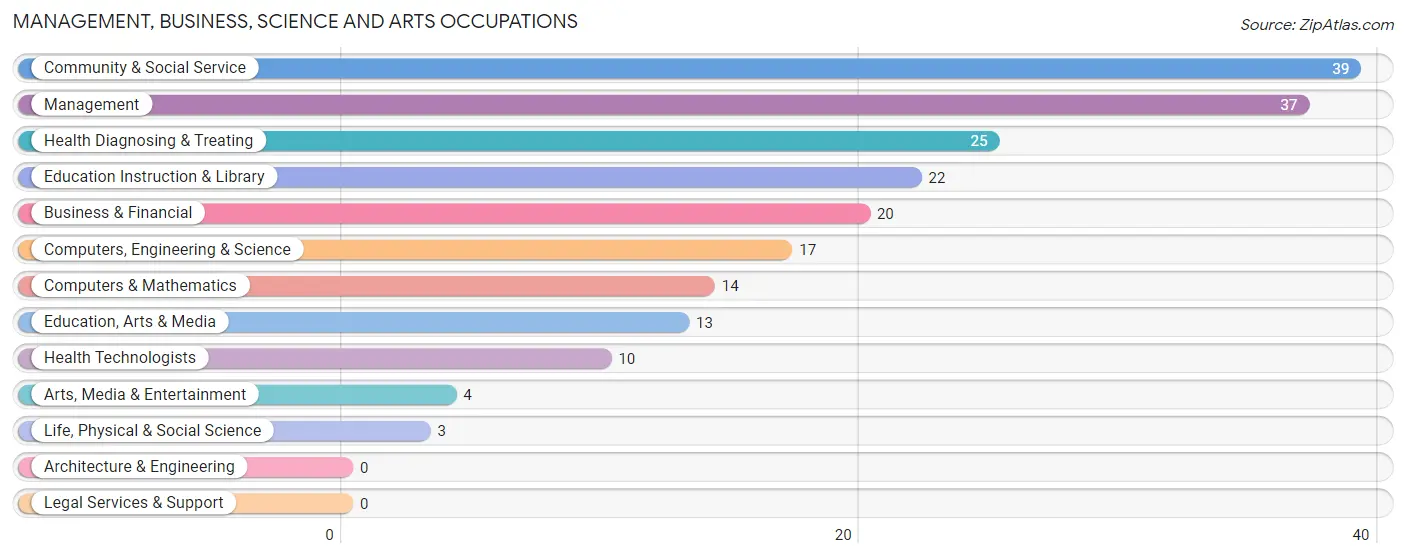
Management, Business, Science and Arts Occupations
The most common Management, Business, Science and Arts occupations in New Oxford borough are Community & Social Service (39 | 4.9%), Management (37 | 4.7%), Health Diagnosing & Treating (25 | 3.2%), Education Instruction & Library (22 | 2.8%), and Business & Financial (20 | 2.5%).
Management, Business, Science and Arts Occupations by Sex
Within the Management, Business, Science and Arts occupations in New Oxford borough, the most male-oriented occupations are Life, Physical & Social Science (100.0%), Management (64.9%), and Computers, Engineering & Science (52.9%), while the most female-oriented occupations are Arts, Media & Entertainment (100.0%), Business & Financial (80.0%), and Education, Arts & Media (76.9%).
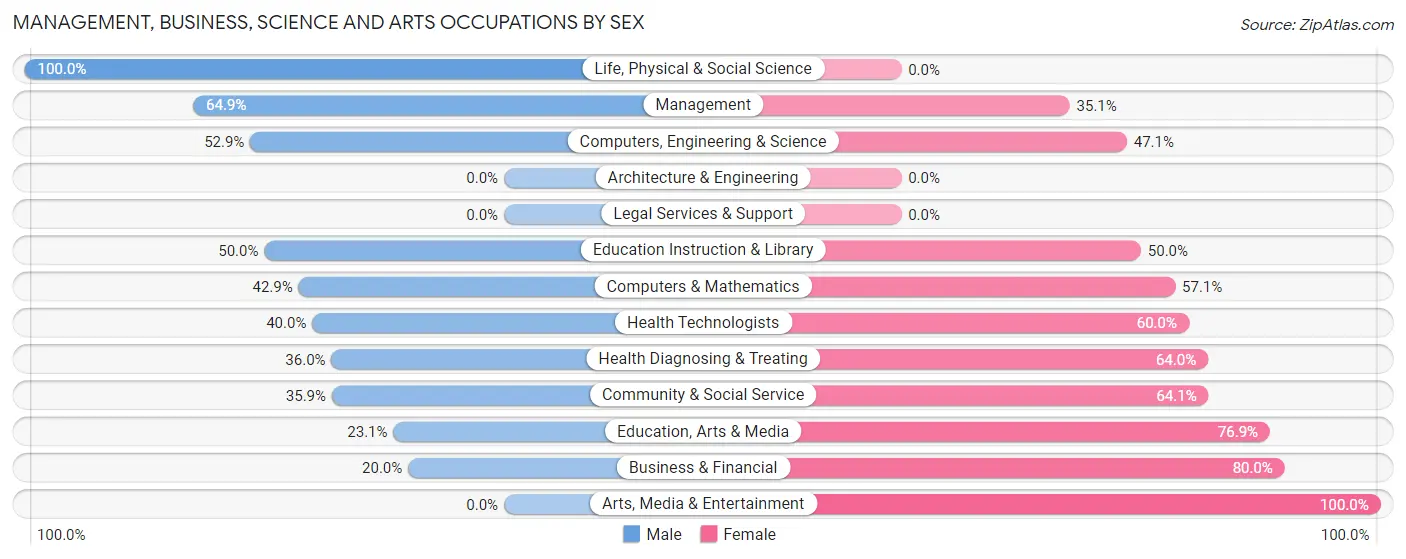
| Occupation | Male | Female |
| Management | 24 (64.9%) | 13 (35.1%) |
| Business & Financial | 4 (20.0%) | 16 (80.0%) |
| Computers, Engineering & Science | 9 (52.9%) | 8 (47.1%) |
| Computers & Mathematics | 6 (42.9%) | 8 (57.1%) |
| Architecture & Engineering | 0 (0.0%) | 0 (0.0%) |
| Life, Physical & Social Science | 3 (100.0%) | 0 (0.0%) |
| Community & Social Service | 14 (35.9%) | 25 (64.1%) |
| Education, Arts & Media | 3 (23.1%) | 10 (76.9%) |
| Legal Services & Support | 0 (0.0%) | 0 (0.0%) |
| Education Instruction & Library | 11 (50.0%) | 11 (50.0%) |
| Arts, Media & Entertainment | 0 (0.0%) | 4 (100.0%) |
| Health Diagnosing & Treating | 9 (36.0%) | 16 (64.0%) |
| Health Technologists | 4 (40.0%) | 6 (60.0%) |
| Total (Category) | 60 (43.5%) | 78 (56.5%) |
| Total (Overall) | 421 (53.4%) | 368 (46.6%) |
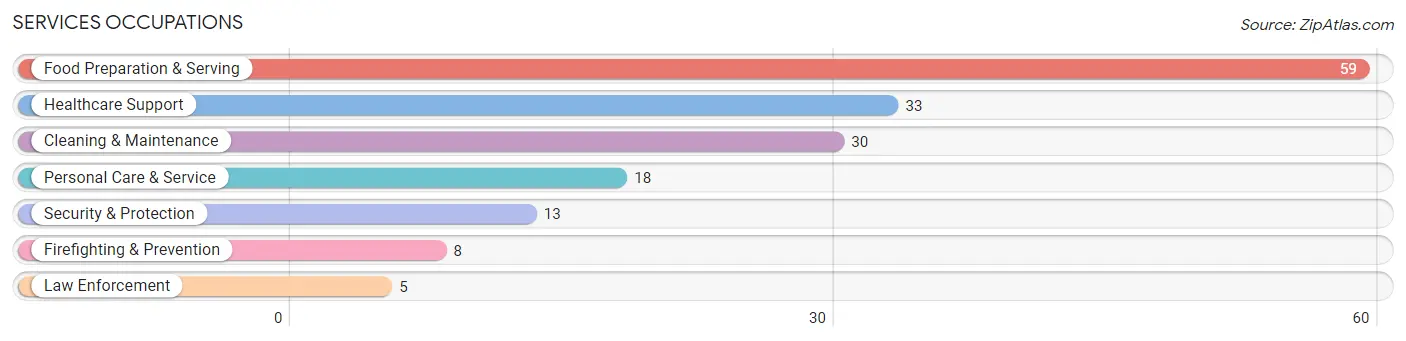
Services Occupations
The most common Services occupations in New Oxford borough are Food Preparation & Serving (59 | 7.5%), Healthcare Support (33 | 4.2%), Cleaning & Maintenance (30 | 3.8%), Personal Care & Service (18 | 2.3%), and Security & Protection (13 | 1.7%).
Services Occupations by Sex
Within the Services occupations in New Oxford borough, the most male-oriented occupations are Law Enforcement (100.0%), Security & Protection (84.6%), and Firefighting & Prevention (75.0%), while the most female-oriented occupations are Personal Care & Service (100.0%), Healthcare Support (63.6%), and Food Preparation & Serving (52.5%).
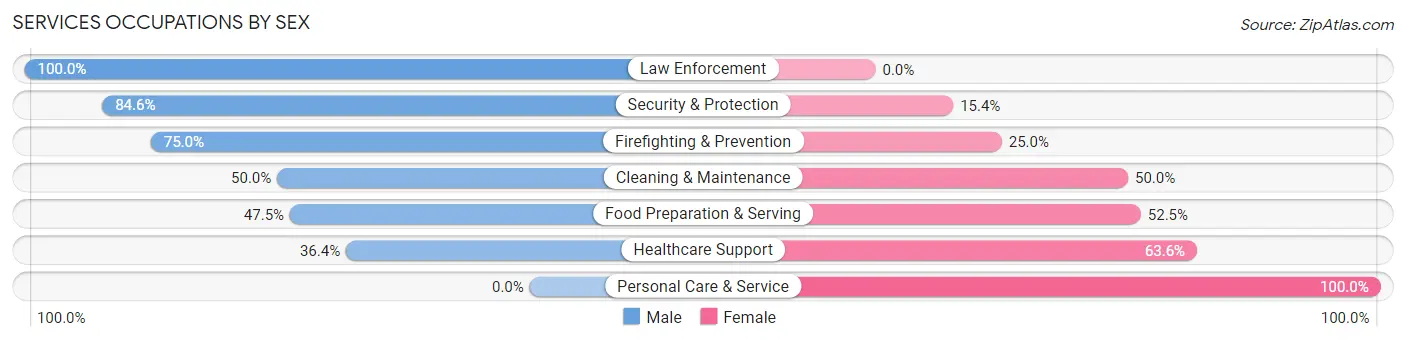
| Occupation | Male | Female |
| Healthcare Support | 12 (36.4%) | 21 (63.6%) |
| Security & Protection | 11 (84.6%) | 2 (15.4%) |
| Firefighting & Prevention | 6 (75.0%) | 2 (25.0%) |
| Law Enforcement | 5 (100.0%) | 0 (0.0%) |
| Food Preparation & Serving | 28 (47.5%) | 31 (52.5%) |
| Cleaning & Maintenance | 15 (50.0%) | 15 (50.0%) |
| Personal Care & Service | 0 (0.0%) | 18 (100.0%) |
| Total (Category) | 66 (43.1%) | 87 (56.9%) |
| Total (Overall) | 421 (53.4%) | 368 (46.6%) |
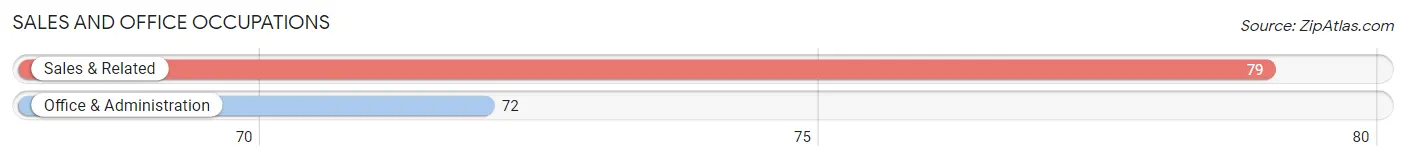
Sales and Office Occupations
The most common Sales and Office occupations in New Oxford borough are Sales & Related (79 | 10.0%), and Office & Administration (72 | 9.1%).
Sales and Office Occupations by Sex
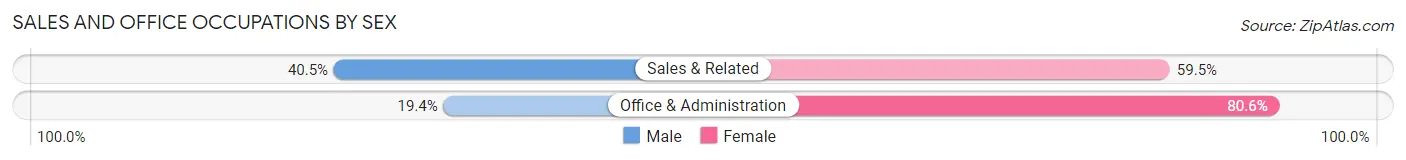
| Occupation | Male | Female |
| Sales & Related | 32 (40.5%) | 47 (59.5%) |
| Office & Administration | 14 (19.4%) | 58 (80.6%) |
| Total (Category) | 46 (30.5%) | 105 (69.5%) |
| Total (Overall) | 421 (53.4%) | 368 (46.6%) |
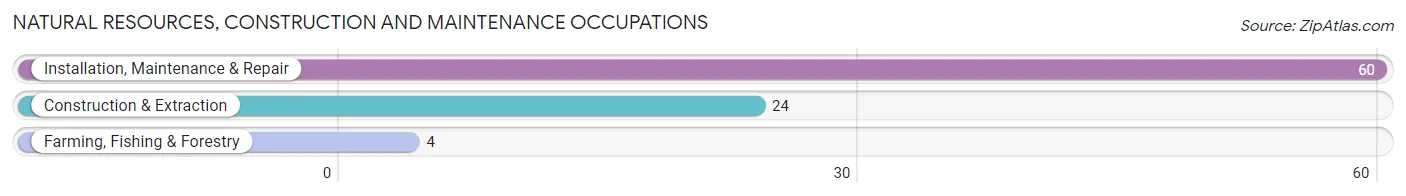
Natural Resources, Construction and Maintenance Occupations
The most common Natural Resources, Construction and Maintenance occupations in New Oxford borough are Installation, Maintenance & Repair (60 | 7.6%), Construction & Extraction (24 | 3.0%), and Farming, Fishing & Forestry (4 | 0.5%).
Natural Resources, Construction and Maintenance Occupations by Sex
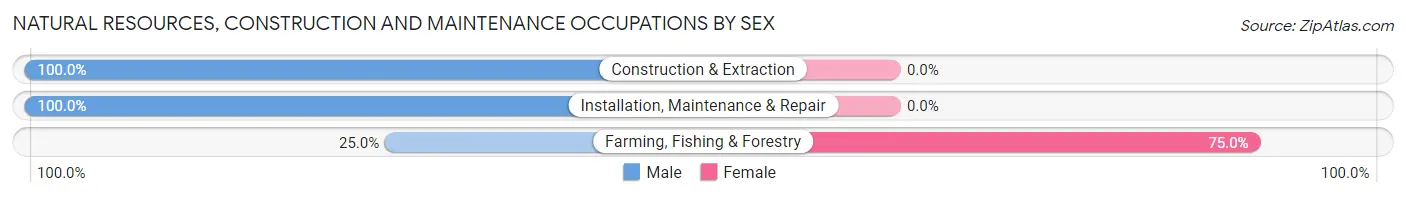
| Occupation | Male | Female |
| Farming, Fishing & Forestry | 1 (25.0%) | 3 (75.0%) |
| Construction & Extraction | 24 (100.0%) | 0 (0.0%) |
| Installation, Maintenance & Repair | 60 (100.0%) | 0 (0.0%) |
| Total (Category) | 85 (96.6%) | 3 (3.4%) |
| Total (Overall) | 421 (53.4%) | 368 (46.6%) |
Production, Transportation and Moving Occupations
The most common Production, Transportation and Moving occupations in New Oxford borough are Production (154 | 19.5%), Material Moving (60 | 7.6%), and Transportation (45 | 5.7%).
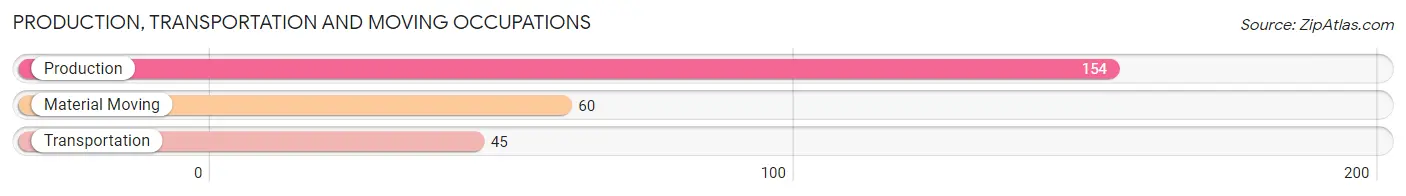
Production, Transportation and Moving Occupations by Sex
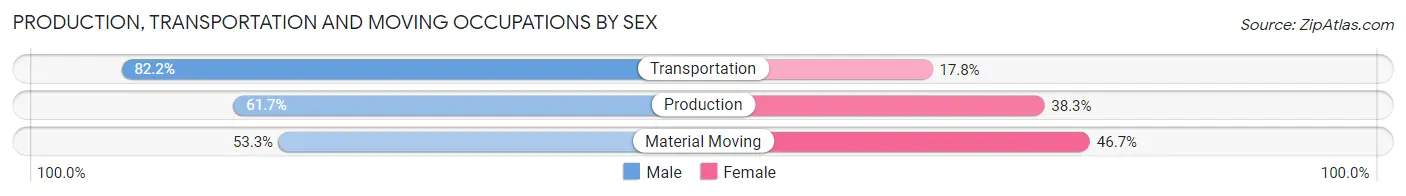
| Occupation | Male | Female |
| Production | 95 (61.7%) | 59 (38.3%) |
| Transportation | 37 (82.2%) | 8 (17.8%) |
| Material Moving | 32 (53.3%) | 28 (46.7%) |
| Total (Category) | 164 (63.3%) | 95 (36.7%) |
| Total (Overall) | 421 (53.4%) | 368 (46.6%) |
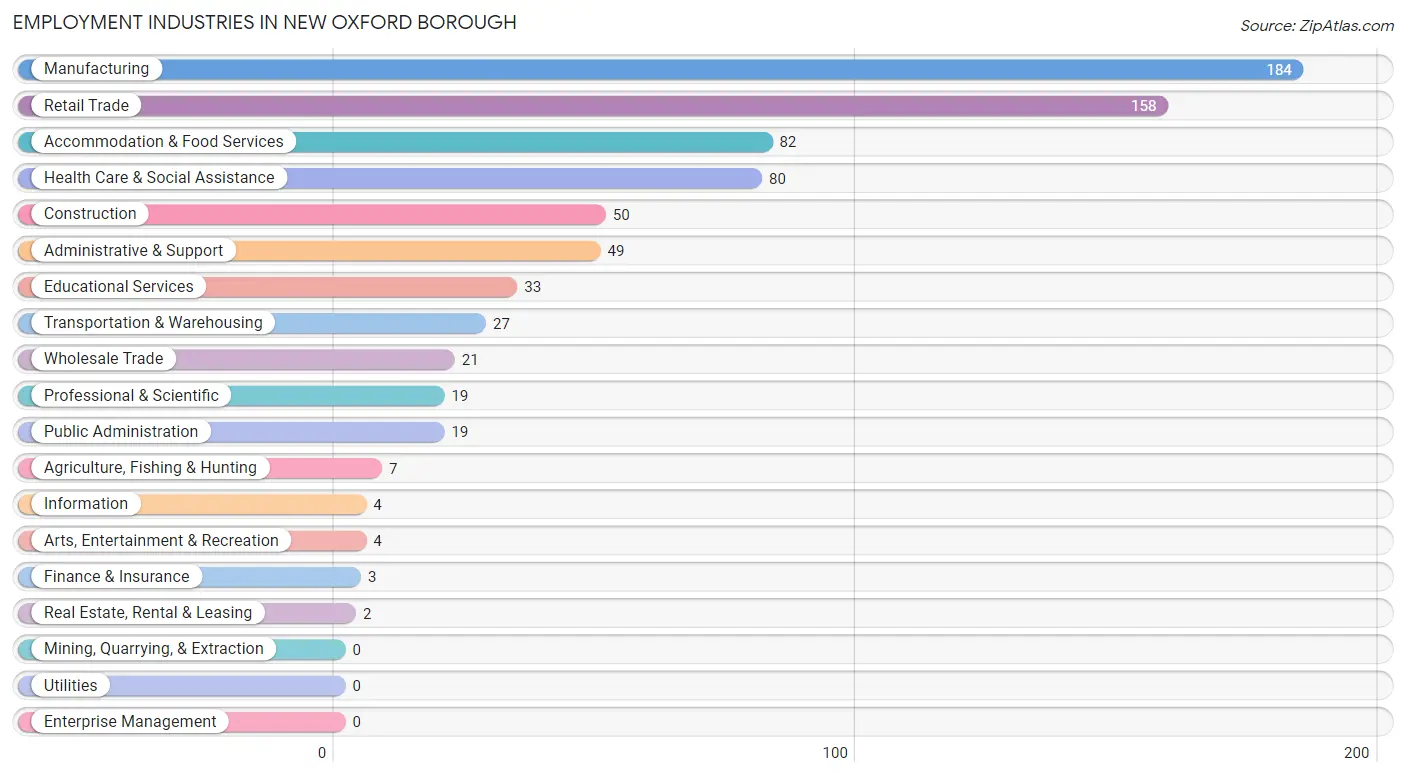
Employment Industries by Sex in New Oxford borough
Employment Industries in New Oxford borough
The major employment industries in New Oxford borough include Manufacturing (184 | 23.3%), Retail Trade (158 | 20.0%), Accommodation & Food Services (82 | 10.4%), Health Care & Social Assistance (80 | 10.1%), and Construction (50 | 6.3%).
Employment Industries by Sex in New Oxford borough
The New Oxford borough industries that see more men than women are Construction (100.0%), Public Administration (73.7%), and Manufacturing (64.1%), whereas the industries that tend to have a higher number of women are Information (100.0%), Finance & Insurance (100.0%), and Real Estate, Rental & Leasing (100.0%).
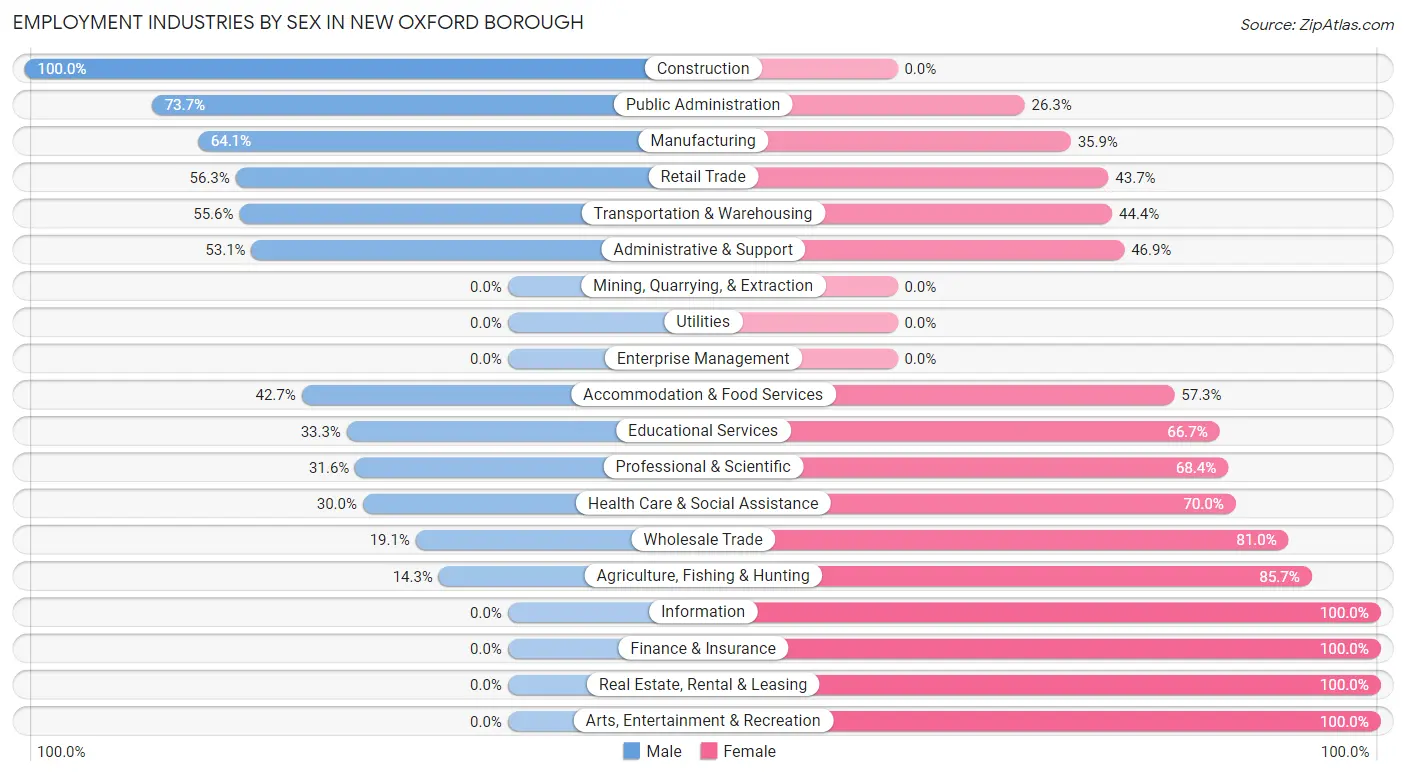
| Industry | Male | Female |
| Agriculture, Fishing & Hunting | 1 (14.3%) | 6 (85.7%) |
| Mining, Quarrying, & Extraction | 0 (0.0%) | 0 (0.0%) |
| Construction | 50 (100.0%) | 0 (0.0%) |
| Manufacturing | 118 (64.1%) | 66 (35.9%) |
| Wholesale Trade | 4 (19.1%) | 17 (80.9%) |
| Retail Trade | 89 (56.3%) | 69 (43.7%) |
| Transportation & Warehousing | 15 (55.6%) | 12 (44.4%) |
| Utilities | 0 (0.0%) | 0 (0.0%) |
| Information | 0 (0.0%) | 4 (100.0%) |
| Finance & Insurance | 0 (0.0%) | 3 (100.0%) |
| Real Estate, Rental & Leasing | 0 (0.0%) | 2 (100.0%) |
| Professional & Scientific | 6 (31.6%) | 13 (68.4%) |
| Enterprise Management | 0 (0.0%) | 0 (0.0%) |
| Administrative & Support | 26 (53.1%) | 23 (46.9%) |
| Educational Services | 11 (33.3%) | 22 (66.7%) |
| Health Care & Social Assistance | 24 (30.0%) | 56 (70.0%) |
| Arts, Entertainment & Recreation | 0 (0.0%) | 4 (100.0%) |
| Accommodation & Food Services | 35 (42.7%) | 47 (57.3%) |
| Public Administration | 14 (73.7%) | 5 (26.3%) |
| Total | 421 (53.4%) | 368 (46.6%) |
Education in New Oxford borough
School Enrollment in New Oxford borough
The most common levels of schooling among the 434 students in New Oxford borough are elementary school (126 | 29.0%), high school (113 | 26.0%), and middle school (105 | 24.2%).
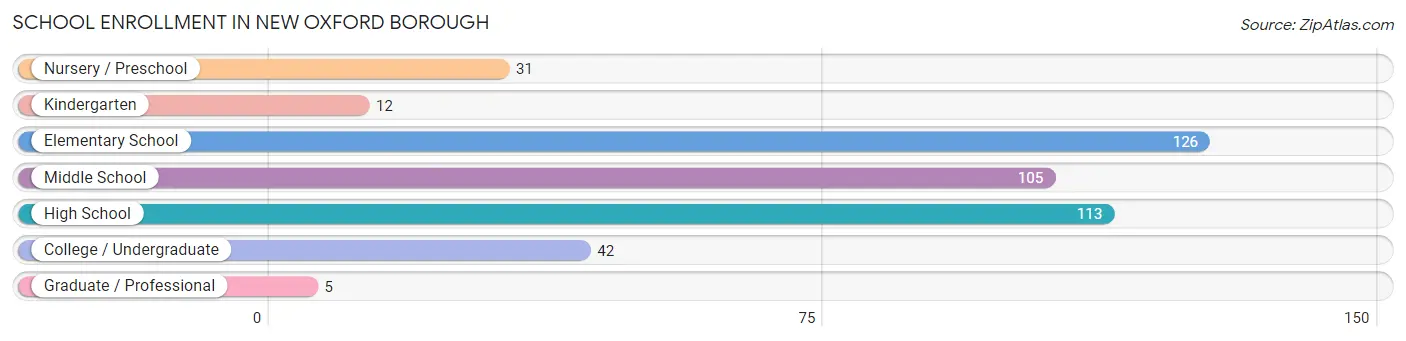
| School Level | # Students | % Students |
| Nursery / Preschool | 31 | 7.1% |
| Kindergarten | 12 | 2.8% |
| Elementary School | 126 | 29.0% |
| Middle School | 105 | 24.2% |
| High School | 113 | 26.0% |
| College / Undergraduate | 42 | 9.7% |
| Graduate / Professional | 5 | 1.1% |
| Total | 434 | 100.0% |
School Enrollment by Age by Funding Source in New Oxford borough
Out of a total of 434 students who are enrolled in schools in New Oxford borough, 41 (9.4%) attend a private institution, while the remaining 393 (90.6%) are enrolled in public schools. The age group of 35 years and over has the highest likelihood of being enrolled in private schools, with 5 (62.5% in the age bracket) enrolled. Conversely, the age group of 5 to 9 year old has the lowest likelihood of being enrolled in a private school, with 115 (100.0% in the age bracket) attending a public institution.
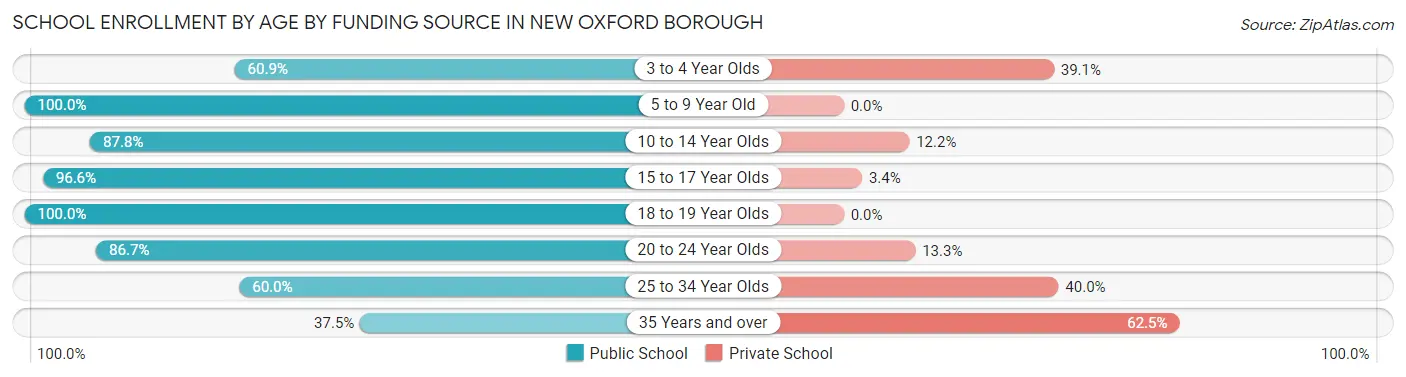
| Age Bracket | Public School | Private School |
| 3 to 4 Year Olds | 14 (60.9%) | 9 (39.1%) |
| 5 to 9 Year Old | 115 (100.0%) | 0 (0.0%) |
| 10 to 14 Year Olds | 115 (87.8%) | 16 (12.2%) |
| 15 to 17 Year Olds | 85 (96.6%) | 3 (3.4%) |
| 18 to 19 Year Olds | 29 (100.0%) | 0 (0.0%) |
| 20 to 24 Year Olds | 26 (86.7%) | 4 (13.3%) |
| 25 to 34 Year Olds | 6 (60.0%) | 4 (40.0%) |
| 35 Years and over | 3 (37.5%) | 5 (62.5%) |
| Total | 393 (90.6%) | 41 (9.4%) |
Educational Attainment by Field of Study in New Oxford borough
Business (29 | 20.0%), visual & performing arts (24 | 16.6%), liberal arts & history (19 | 13.1%), education (17 | 11.7%), and physical & health sciences (12 | 8.3%) are the most common fields of study among 145 individuals in New Oxford borough who have obtained a bachelor's degree or higher.
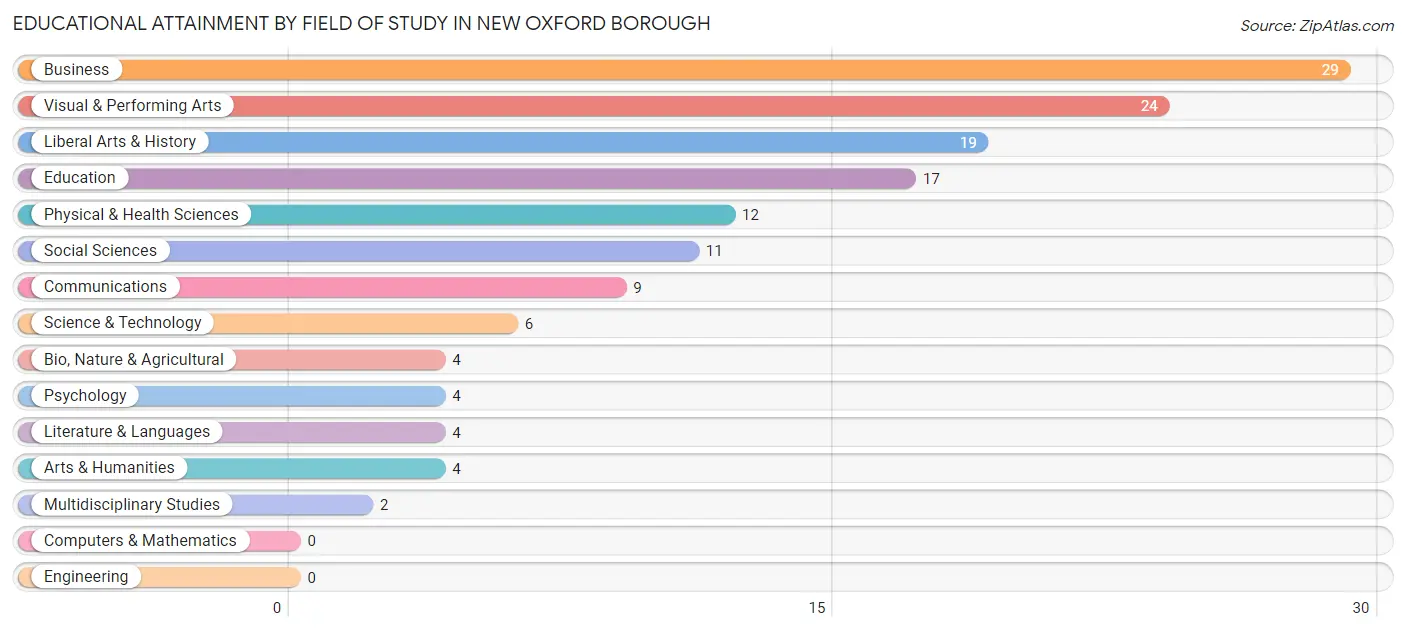
| Field of Study | # Graduates | % Graduates |
| Computers & Mathematics | 0 | 0.0% |
| Bio, Nature & Agricultural | 4 | 2.8% |
| Physical & Health Sciences | 12 | 8.3% |
| Psychology | 4 | 2.8% |
| Social Sciences | 11 | 7.6% |
| Engineering | 0 | 0.0% |
| Multidisciplinary Studies | 2 | 1.4% |
| Science & Technology | 6 | 4.1% |
| Business | 29 | 20.0% |
| Education | 17 | 11.7% |
| Literature & Languages | 4 | 2.8% |
| Liberal Arts & History | 19 | 13.1% |
| Visual & Performing Arts | 24 | 16.6% |
| Communications | 9 | 6.2% |
| Arts & Humanities | 4 | 2.8% |
| Total | 145 | 100.0% |
Transportation & Commute in New Oxford borough
Vehicle Availability by Sex in New Oxford borough
The most prevalent vehicle ownership categories in New Oxford borough are males with 2 vehicles (163, accounting for 39.2%) and females with 2 vehicles (102, making up 47.1%).
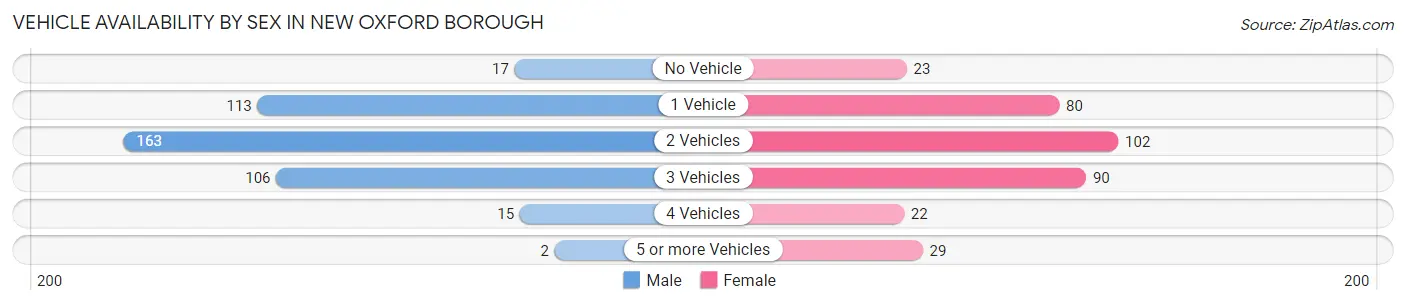
| Vehicles Available | Male | Female |
| No Vehicle | 17 (4.1%) | 23 (6.7%) |
| 1 Vehicle | 113 (27.2%) | 80 (23.1%) |
| 2 Vehicles | 163 (39.2%) | 102 (29.5%) |
| 3 Vehicles | 106 (25.5%) | 90 (26.0%) |
| 4 Vehicles | 15 (3.6%) | 22 (6.4%) |
| 5 or more Vehicles | 2 (0.5%) | 29 (8.4%) |
| Total | 416 (100.0%) | 346 (100.0%) |
Commute Time in New Oxford borough
The most frequently occuring commute durations in New Oxford borough are 15 to 19 minutes (135 commuters, 18.3%), 10 to 14 minutes (105 commuters, 14.2%), and 20 to 24 minutes (100 commuters, 13.6%).
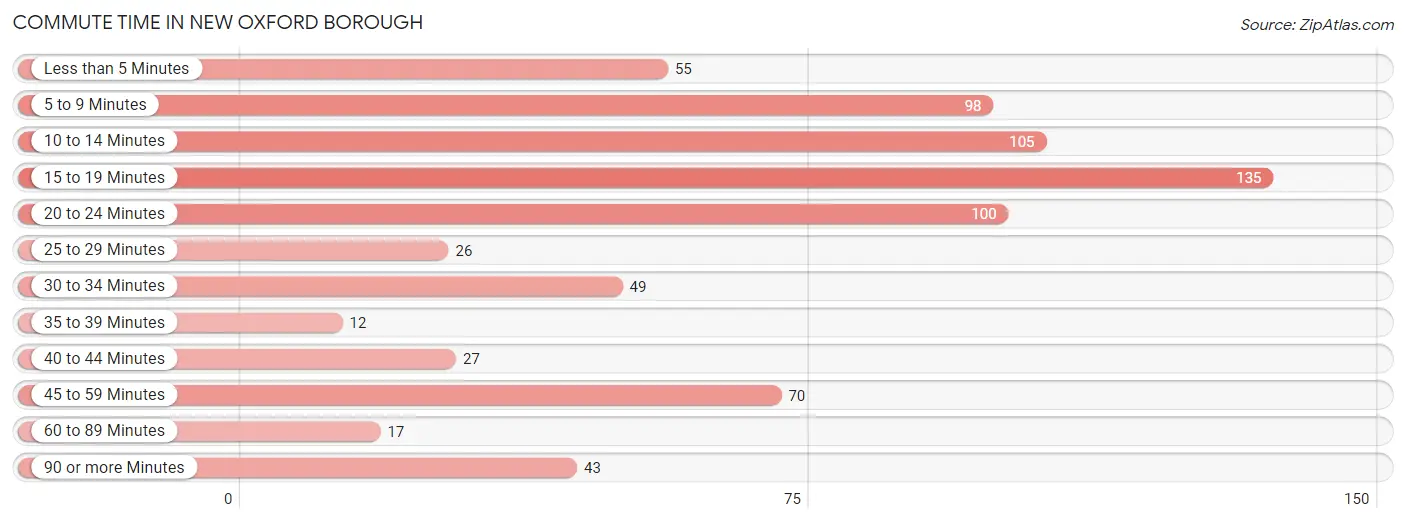
| Commute Time | # Commuters | % Commuters |
| Less than 5 Minutes | 55 | 7.5% |
| 5 to 9 Minutes | 98 | 13.3% |
| 10 to 14 Minutes | 105 | 14.2% |
| 15 to 19 Minutes | 135 | 18.3% |
| 20 to 24 Minutes | 100 | 13.6% |
| 25 to 29 Minutes | 26 | 3.5% |
| 30 to 34 Minutes | 49 | 6.7% |
| 35 to 39 Minutes | 12 | 1.6% |
| 40 to 44 Minutes | 27 | 3.7% |
| 45 to 59 Minutes | 70 | 9.5% |
| 60 to 89 Minutes | 17 | 2.3% |
| 90 or more Minutes | 43 | 5.8% |
Commute Time by Sex in New Oxford borough
The most common commute times in New Oxford borough are 15 to 19 minutes (63 commuters, 15.5%) for males and 15 to 19 minutes (72 commuters, 21.8%) for females.
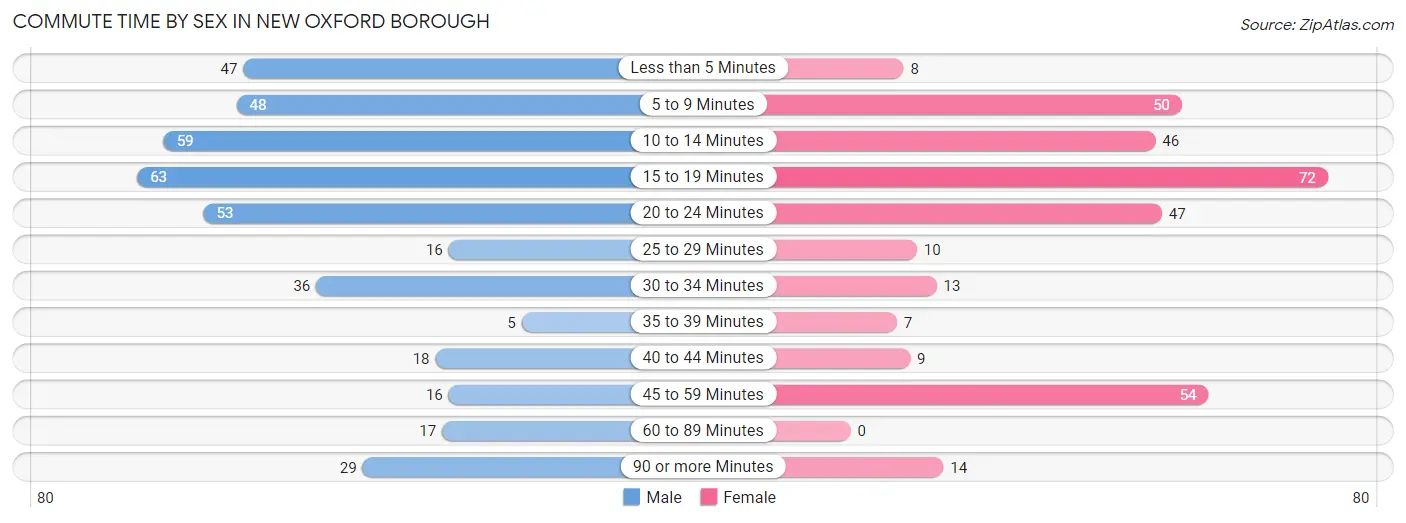
| Commute Time | Male | Female |
| Less than 5 Minutes | 47 (11.6%) | 8 (2.4%) |
| 5 to 9 Minutes | 48 (11.8%) | 50 (15.1%) |
| 10 to 14 Minutes | 59 (14.5%) | 46 (13.9%) |
| 15 to 19 Minutes | 63 (15.5%) | 72 (21.8%) |
| 20 to 24 Minutes | 53 (13.0%) | 47 (14.2%) |
| 25 to 29 Minutes | 16 (3.9%) | 10 (3.0%) |
| 30 to 34 Minutes | 36 (8.8%) | 13 (3.9%) |
| 35 to 39 Minutes | 5 (1.2%) | 7 (2.1%) |
| 40 to 44 Minutes | 18 (4.4%) | 9 (2.7%) |
| 45 to 59 Minutes | 16 (3.9%) | 54 (16.4%) |
| 60 to 89 Minutes | 17 (4.2%) | 0 (0.0%) |
| 90 or more Minutes | 29 (7.1%) | 14 (4.2%) |
Time of Departure to Work by Sex in New Oxford borough
The most frequent times of departure to work in New Oxford borough are 12:00 AM to 4:59 AM (76, 18.7%) for males and 4:00 PM to 11:59 PM (45, 13.6%) for females.
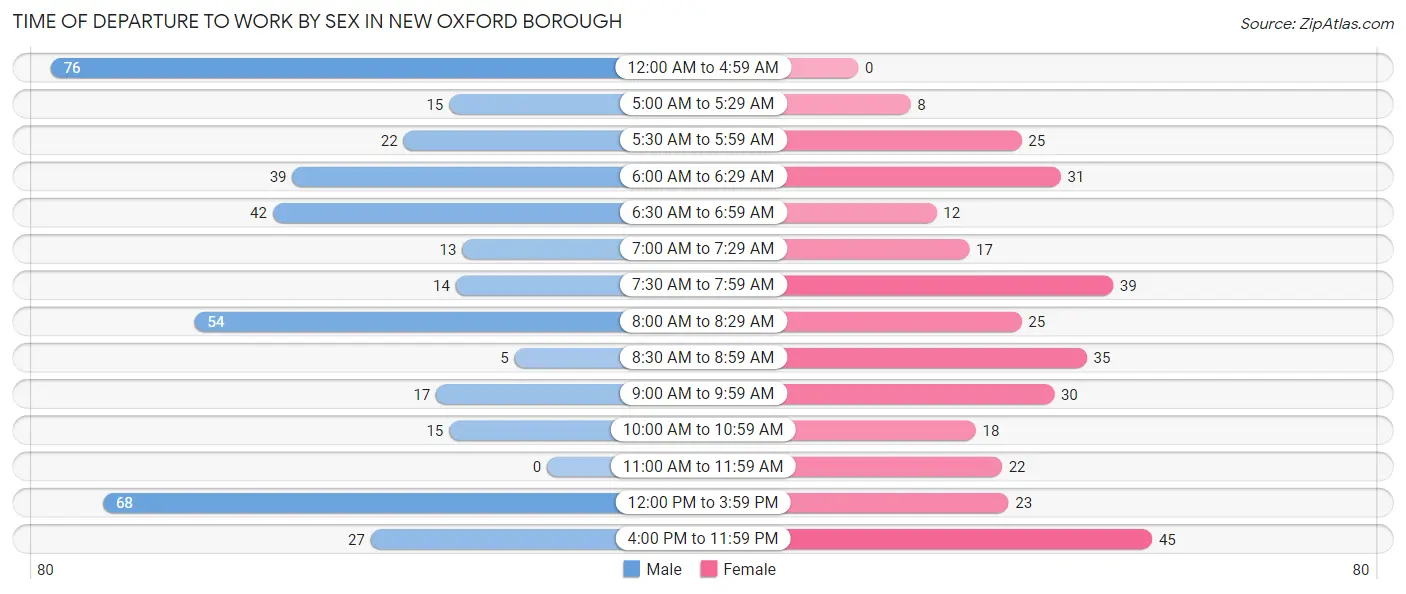
| Time of Departure | Male | Female |
| 12:00 AM to 4:59 AM | 76 (18.7%) | 0 (0.0%) |
| 5:00 AM to 5:29 AM | 15 (3.7%) | 8 (2.4%) |
| 5:30 AM to 5:59 AM | 22 (5.4%) | 25 (7.6%) |
| 6:00 AM to 6:29 AM | 39 (9.6%) | 31 (9.4%) |
| 6:30 AM to 6:59 AM | 42 (10.3%) | 12 (3.6%) |
| 7:00 AM to 7:29 AM | 13 (3.2%) | 17 (5.1%) |
| 7:30 AM to 7:59 AM | 14 (3.4%) | 39 (11.8%) |
| 8:00 AM to 8:29 AM | 54 (13.3%) | 25 (7.6%) |
| 8:30 AM to 8:59 AM | 5 (1.2%) | 35 (10.6%) |
| 9:00 AM to 9:59 AM | 17 (4.2%) | 30 (9.1%) |
| 10:00 AM to 10:59 AM | 15 (3.7%) | 18 (5.4%) |
| 11:00 AM to 11:59 AM | 0 (0.0%) | 22 (6.7%) |
| 12:00 PM to 3:59 PM | 68 (16.7%) | 23 (7.0%) |
| 4:00 PM to 11:59 PM | 27 (6.6%) | 45 (13.6%) |
| Total | 407 (100.0%) | 330 (100.0%) |
Housing Occupancy in New Oxford borough
Occupancy by Ownership in New Oxford borough
Of the total 698 dwellings in New Oxford borough, owner-occupied units account for 347 (49.7%), while renter-occupied units make up 351 (50.3%).
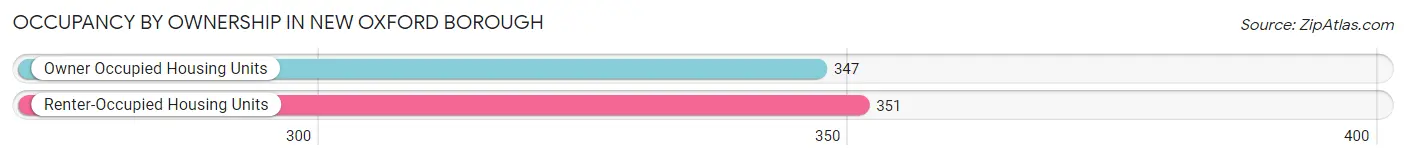
| Occupancy | # Housing Units | % Housing Units |
| Owner Occupied Housing Units | 347 | 49.7% |
| Renter-Occupied Housing Units | 351 | 50.3% |
| Total Occupied Housing Units | 698 | 100.0% |
Occupancy by Household Size in New Oxford borough
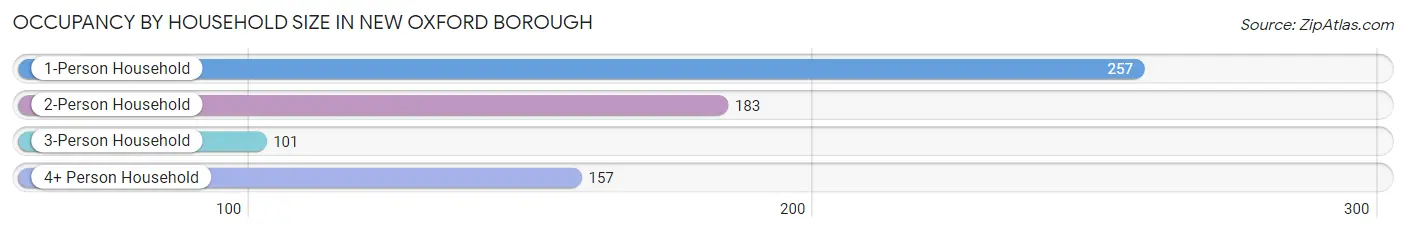
| Household Size | # Housing Units | % Housing Units |
| 1-Person Household | 257 | 36.8% |
| 2-Person Household | 183 | 26.2% |
| 3-Person Household | 101 | 14.5% |
| 4+ Person Household | 157 | 22.5% |
| Total Housing Units | 698 | 100.0% |
Occupancy by Ownership by Household Size in New Oxford borough
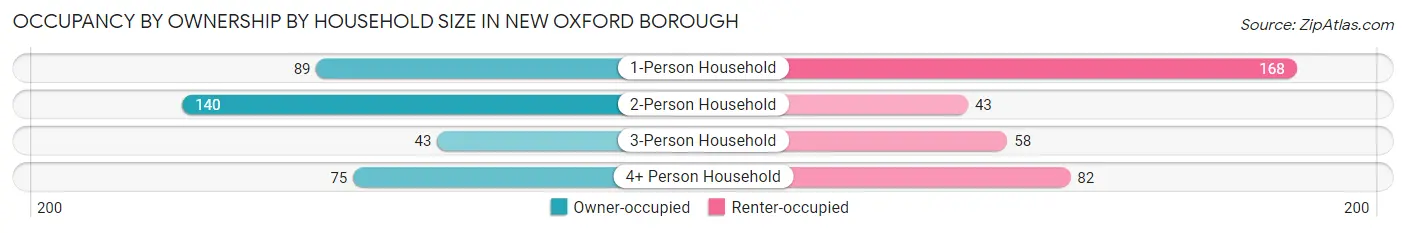
| Household Size | Owner-occupied | Renter-occupied |
| 1-Person Household | 89 (34.6%) | 168 (65.4%) |
| 2-Person Household | 140 (76.5%) | 43 (23.5%) |
| 3-Person Household | 43 (42.6%) | 58 (57.4%) |
| 4+ Person Household | 75 (47.8%) | 82 (52.2%) |
| Total Housing Units | 347 (49.7%) | 351 (50.3%) |
Occupancy by Educational Attainment in New Oxford borough
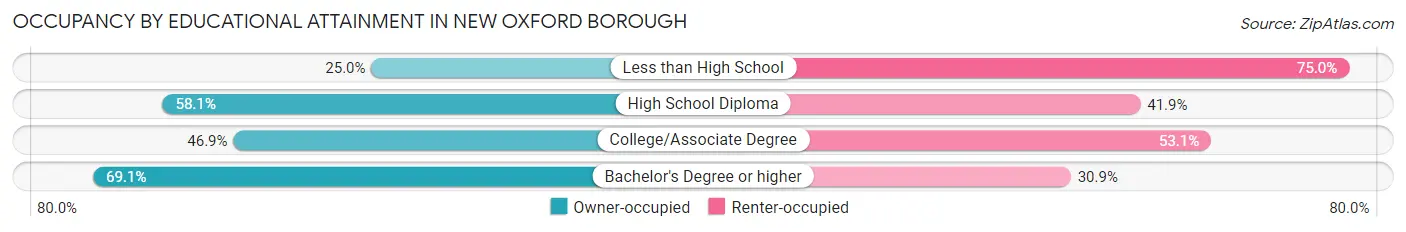
| Household Size | Owner-occupied | Renter-occupied |
| Less than High School | 36 (25.0%) | 108 (75.0%) |
| High School Diploma | 172 (58.1%) | 124 (41.9%) |
| College/Associate Degree | 83 (46.9%) | 94 (53.1%) |
| Bachelor's Degree or higher | 56 (69.1%) | 25 (30.9%) |
Occupancy by Age of Householder in New Oxford borough
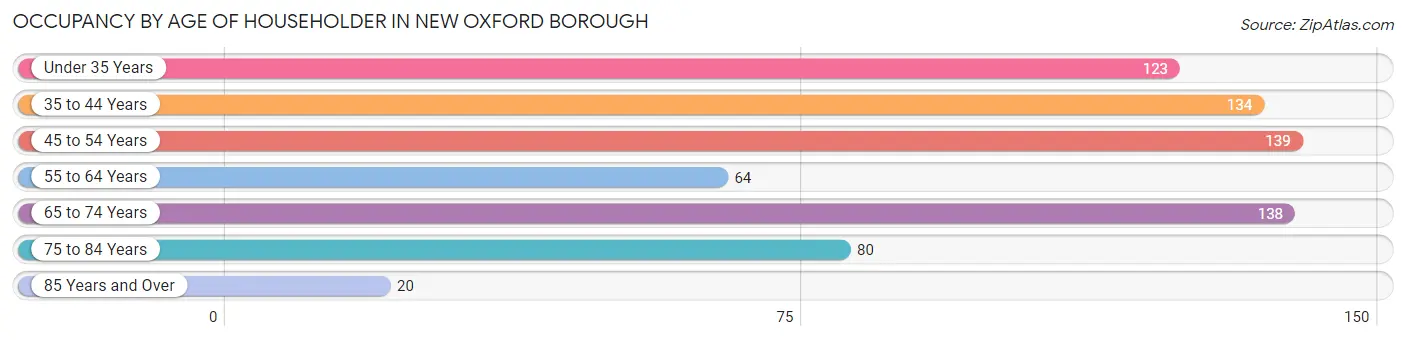
| Age Bracket | # Households | % Households |
| Under 35 Years | 123 | 17.6% |
| 35 to 44 Years | 134 | 19.2% |
| 45 to 54 Years | 139 | 19.9% |
| 55 to 64 Years | 64 | 9.2% |
| 65 to 74 Years | 138 | 19.8% |
| 75 to 84 Years | 80 | 11.5% |
| 85 Years and Over | 20 | 2.9% |
| Total | 698 | 100.0% |
Housing Finances in New Oxford borough
Median Income by Occupancy in New Oxford borough
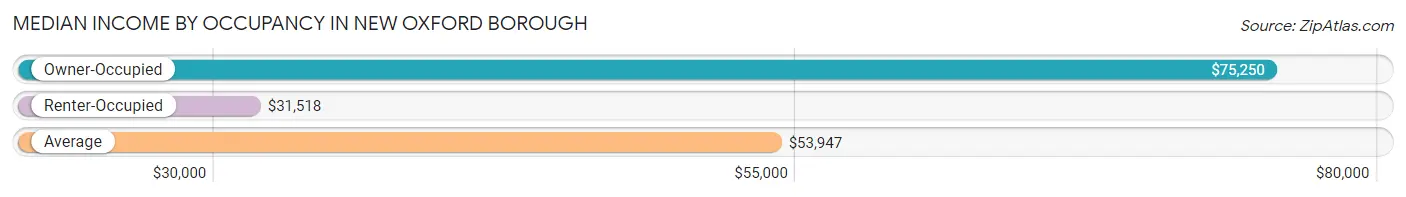
| Occupancy Type | # Households | Median Income |
| Owner-Occupied | 347 (49.7%) | $75,250 |
| Renter-Occupied | 351 (50.3%) | $31,518 |
| Average | 698 (100.0%) | $53,947 |
Occupancy by Householder Income Bracket in New Oxford borough
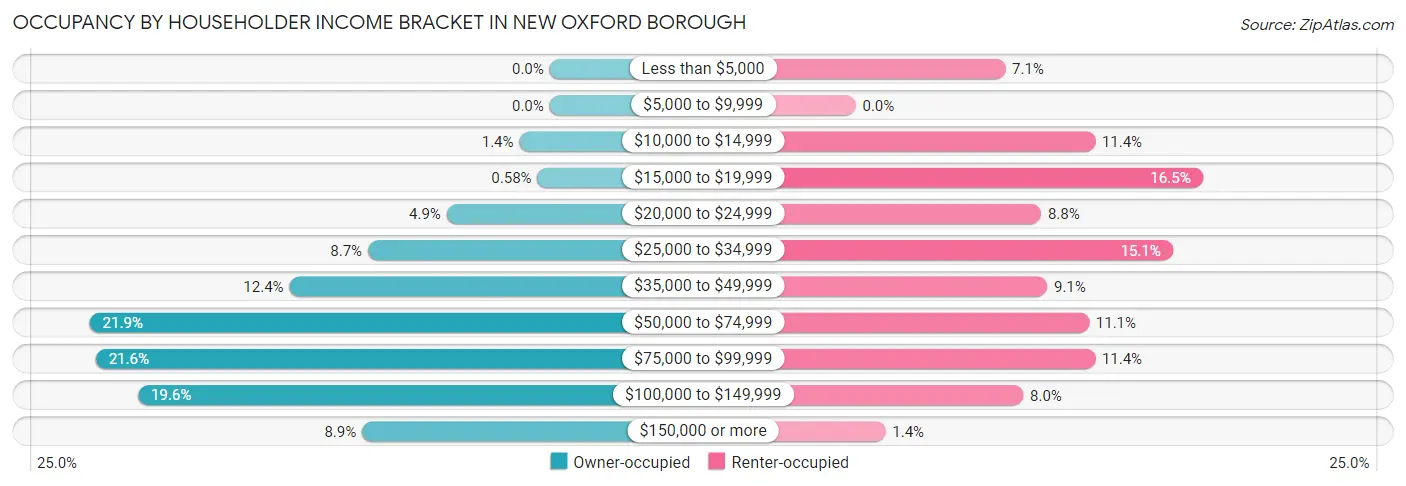
| Income Bracket | Owner-occupied | Renter-occupied |
| Less than $5,000 | 0 (0.0%) | 25 (7.1%) |
| $5,000 to $9,999 | 0 (0.0%) | 0 (0.0%) |
| $10,000 to $14,999 | 5 (1.4%) | 40 (11.4%) |
| $15,000 to $19,999 | 2 (0.6%) | 58 (16.5%) |
| $20,000 to $24,999 | 17 (4.9%) | 31 (8.8%) |
| $25,000 to $34,999 | 30 (8.6%) | 53 (15.1%) |
| $35,000 to $49,999 | 43 (12.4%) | 32 (9.1%) |
| $50,000 to $74,999 | 76 (21.9%) | 39 (11.1%) |
| $75,000 to $99,999 | 75 (21.6%) | 40 (11.4%) |
| $100,000 to $149,999 | 68 (19.6%) | 28 (8.0%) |
| $150,000 or more | 31 (8.9%) | 5 (1.4%) |
| Total | 347 (100.0%) | 351 (100.0%) |
Monthly Housing Cost Tiers in New Oxford borough
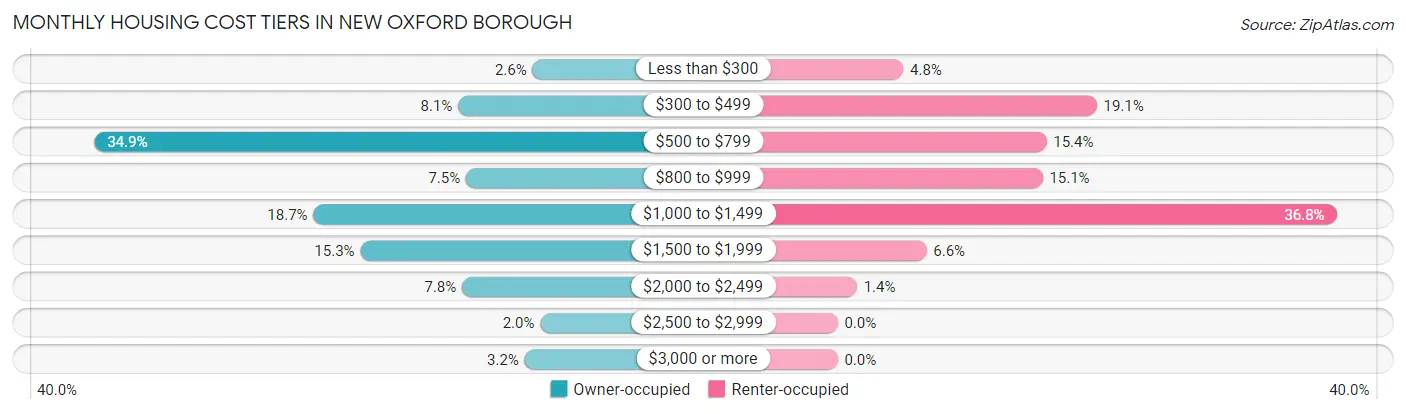
| Monthly Cost | Owner-occupied | Renter-occupied |
| Less than $300 | 9 (2.6%) | 17 (4.8%) |
| $300 to $499 | 28 (8.1%) | 67 (19.1%) |
| $500 to $799 | 121 (34.9%) | 54 (15.4%) |
| $800 to $999 | 26 (7.5%) | 53 (15.1%) |
| $1,000 to $1,499 | 65 (18.7%) | 129 (36.7%) |
| $1,500 to $1,999 | 53 (15.3%) | 23 (6.6%) |
| $2,000 to $2,499 | 27 (7.8%) | 5 (1.4%) |
| $2,500 to $2,999 | 7 (2.0%) | 0 (0.0%) |
| $3,000 or more | 11 (3.2%) | 0 (0.0%) |
| Total | 347 (100.0%) | 351 (100.0%) |
Physical Housing Characteristics in New Oxford borough
Housing Structures in New Oxford borough
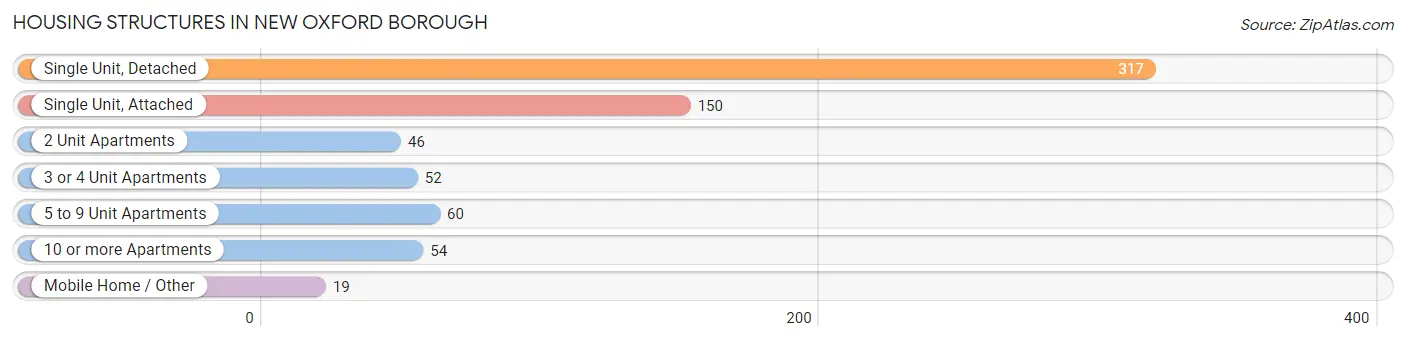
| Structure Type | # Housing Units | % Housing Units |
| Single Unit, Detached | 317 | 45.4% |
| Single Unit, Attached | 150 | 21.5% |
| 2 Unit Apartments | 46 | 6.6% |
| 3 or 4 Unit Apartments | 52 | 7.4% |
| 5 to 9 Unit Apartments | 60 | 8.6% |
| 10 or more Apartments | 54 | 7.7% |
| Mobile Home / Other | 19 | 2.7% |
| Total | 698 | 100.0% |
Housing Structures by Occupancy in New Oxford borough
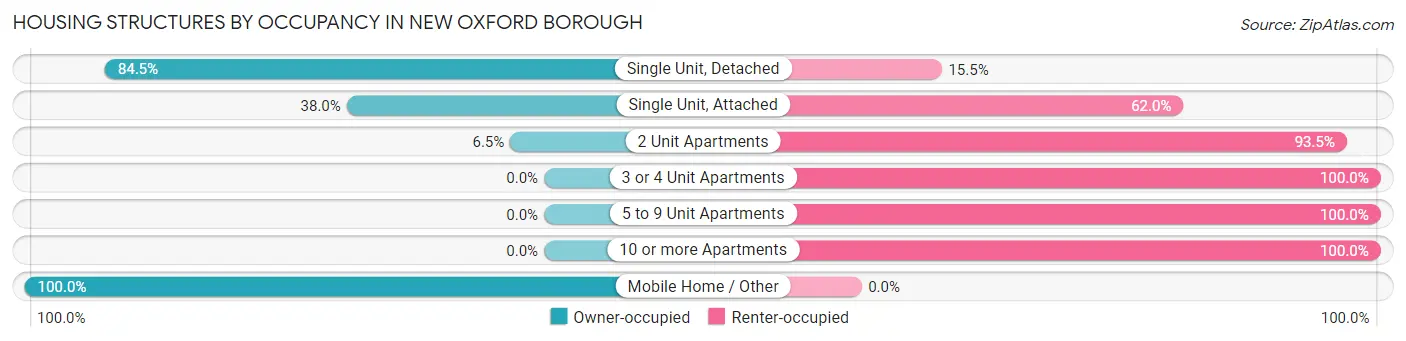
| Structure Type | Owner-occupied | Renter-occupied |
| Single Unit, Detached | 268 (84.5%) | 49 (15.5%) |
| Single Unit, Attached | 57 (38.0%) | 93 (62.0%) |
| 2 Unit Apartments | 3 (6.5%) | 43 (93.5%) |
| 3 or 4 Unit Apartments | 0 (0.0%) | 52 (100.0%) |
| 5 to 9 Unit Apartments | 0 (0.0%) | 60 (100.0%) |
| 10 or more Apartments | 0 (0.0%) | 54 (100.0%) |
| Mobile Home / Other | 19 (100.0%) | 0 (0.0%) |
| Total | 347 (49.7%) | 351 (50.3%) |
Housing Structures by Number of Rooms in New Oxford borough
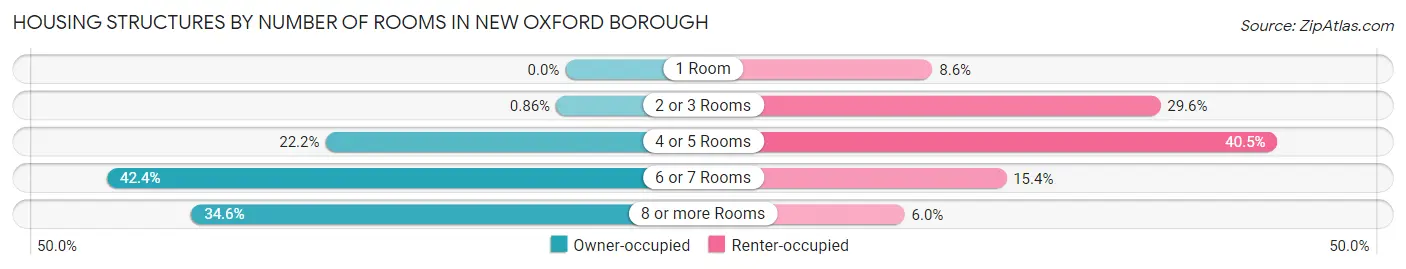
| Number of Rooms | Owner-occupied | Renter-occupied |
| 1 Room | 0 (0.0%) | 30 (8.6%) |
| 2 or 3 Rooms | 3 (0.9%) | 104 (29.6%) |
| 4 or 5 Rooms | 77 (22.2%) | 142 (40.5%) |
| 6 or 7 Rooms | 147 (42.4%) | 54 (15.4%) |
| 8 or more Rooms | 120 (34.6%) | 21 (6.0%) |
| Total | 347 (100.0%) | 351 (100.0%) |
Housing Structure by Heating Type in New Oxford borough
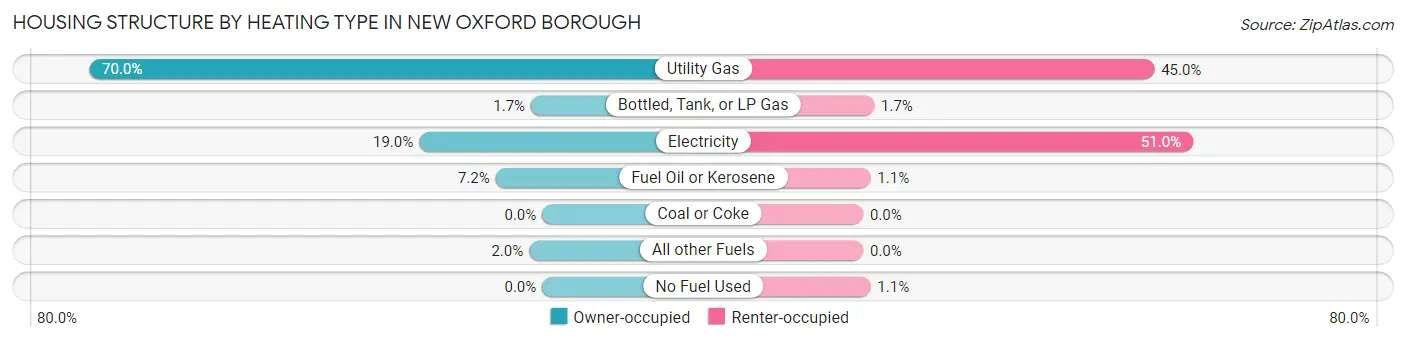
| Heating Type | Owner-occupied | Renter-occupied |
| Utility Gas | 243 (70.0%) | 158 (45.0%) |
| Bottled, Tank, or LP Gas | 6 (1.7%) | 6 (1.7%) |
| Electricity | 66 (19.0%) | 179 (51.0%) |
| Fuel Oil or Kerosene | 25 (7.2%) | 4 (1.1%) |
| Coal or Coke | 0 (0.0%) | 0 (0.0%) |
| All other Fuels | 7 (2.0%) | 0 (0.0%) |
| No Fuel Used | 0 (0.0%) | 4 (1.1%) |
| Total | 347 (100.0%) | 351 (100.0%) |
Household Vehicle Usage in New Oxford borough
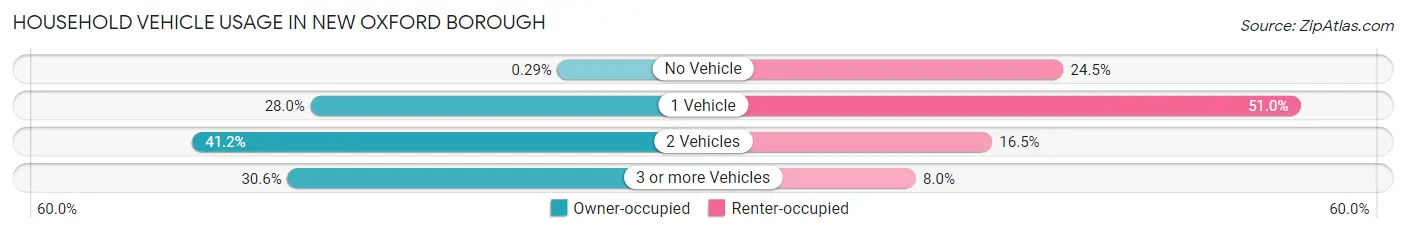
| Vehicles per Household | Owner-occupied | Renter-occupied |
| No Vehicle | 1 (0.3%) | 86 (24.5%) |
| 1 Vehicle | 97 (28.0%) | 179 (51.0%) |
| 2 Vehicles | 143 (41.2%) | 58 (16.5%) |
| 3 or more Vehicles | 106 (30.5%) | 28 (8.0%) |
| Total | 347 (100.0%) | 351 (100.0%) |
Real Estate & Mortgages in New Oxford borough
Real Estate and Mortgage Overview in New Oxford borough
| Characteristic | Without Mortgage | With Mortgage |
| Housing Units | 145 | 202 |
| Median Property Value | $219,400 | $189,100 |
| Median Household Income | $59,904 | $25 |
| Monthly Housing Costs | $620 | $11 |
| Real Estate Taxes | $3,308 | $11 |
Property Value by Mortgage Status in New Oxford borough
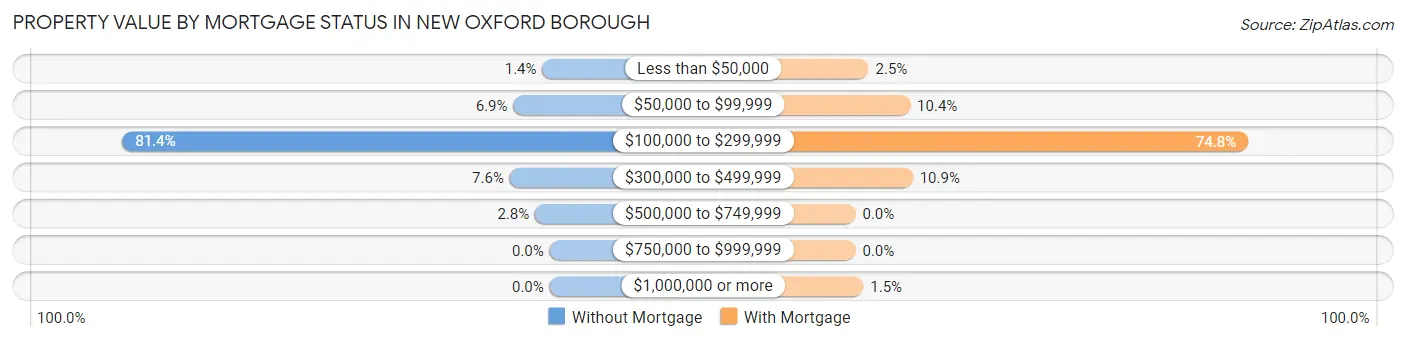
| Property Value | Without Mortgage | With Mortgage |
| Less than $50,000 | 2 (1.4%) | 5 (2.5%) |
| $50,000 to $99,999 | 10 (6.9%) | 21 (10.4%) |
| $100,000 to $299,999 | 118 (81.4%) | 151 (74.8%) |
| $300,000 to $499,999 | 11 (7.6%) | 22 (10.9%) |
| $500,000 to $749,999 | 4 (2.8%) | 0 (0.0%) |
| $750,000 to $999,999 | 0 (0.0%) | 0 (0.0%) |
| $1,000,000 or more | 0 (0.0%) | 3 (1.5%) |
| Total | 145 (100.0%) | 202 (100.0%) |
Household Income by Mortgage Status in New Oxford borough
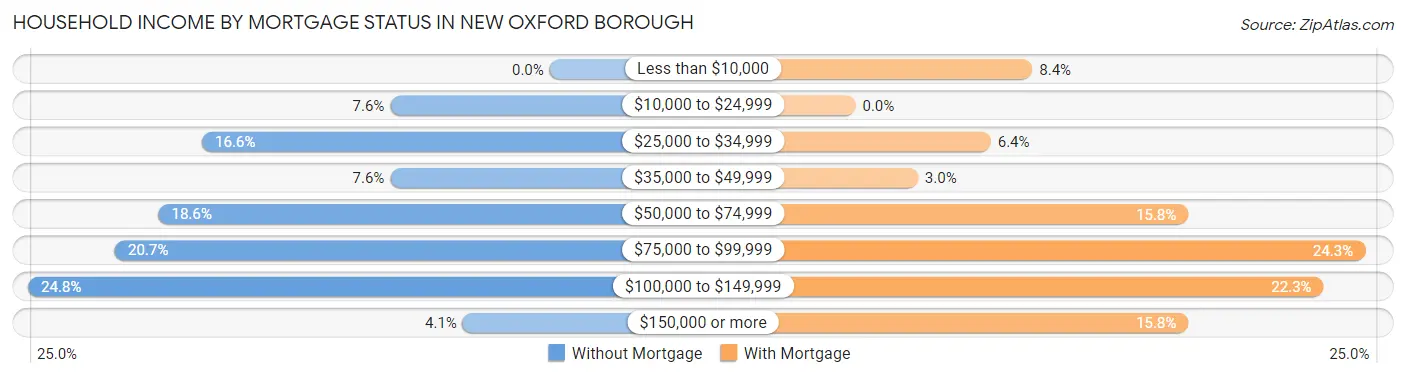
| Household Income | Without Mortgage | With Mortgage |
| Less than $10,000 | 0 (0.0%) | 17 (8.4%) |
| $10,000 to $24,999 | 11 (7.6%) | 0 (0.0%) |
| $25,000 to $34,999 | 24 (16.6%) | 13 (6.4%) |
| $35,000 to $49,999 | 11 (7.6%) | 6 (3.0%) |
| $50,000 to $74,999 | 27 (18.6%) | 32 (15.8%) |
| $75,000 to $99,999 | 30 (20.7%) | 49 (24.3%) |
| $100,000 to $149,999 | 36 (24.8%) | 45 (22.3%) |
| $150,000 or more | 6 (4.1%) | 32 (15.8%) |
| Total | 145 (100.0%) | 202 (100.0%) |
Property Value to Household Income Ratio in New Oxford borough
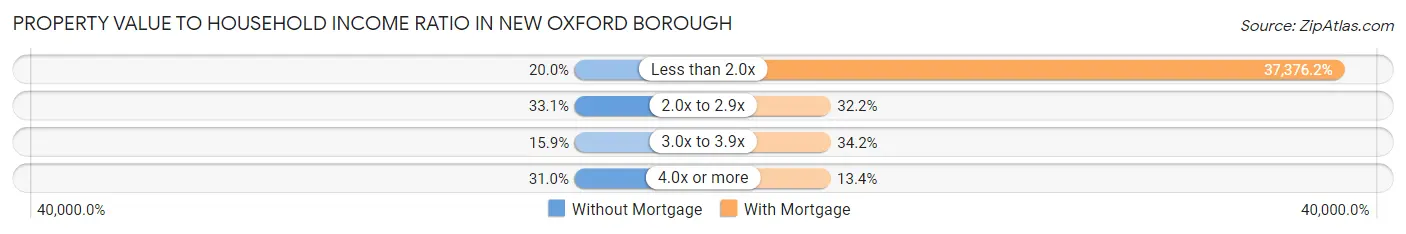
| Value-to-Income Ratio | Without Mortgage | With Mortgage |
| Less than 2.0x | 29 (20.0%) | 75,500 (37,376.2%) |
| 2.0x to 2.9x | 48 (33.1%) | 65 (32.2%) |
| 3.0x to 3.9x | 23 (15.9%) | 69 (34.2%) |
| 4.0x or more | 45 (31.0%) | 27 (13.4%) |
| Total | 145 (100.0%) | 202 (100.0%) |
Real Estate Taxes by Mortgage Status in New Oxford borough
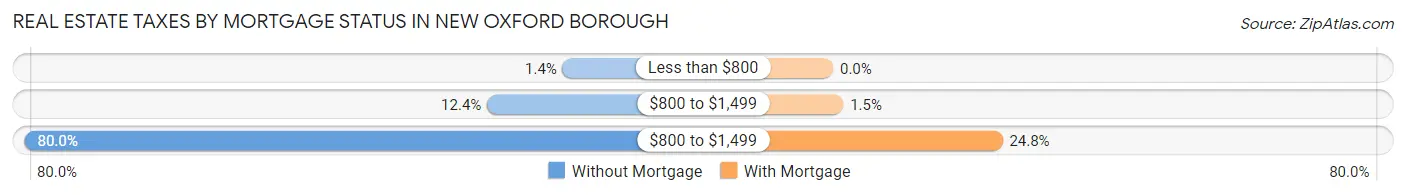
| Property Taxes | Without Mortgage | With Mortgage |
| Less than $800 | 2 (1.4%) | 0 (0.0%) |
| $800 to $1,499 | 18 (12.4%) | 3 (1.5%) |
| $800 to $1,499 | 116 (80.0%) | 50 (24.7%) |
| Total | 145 (100.0%) | 202 (100.0%) |
Health & Disability in New Oxford borough
Health Insurance Coverage by Age in New Oxford borough
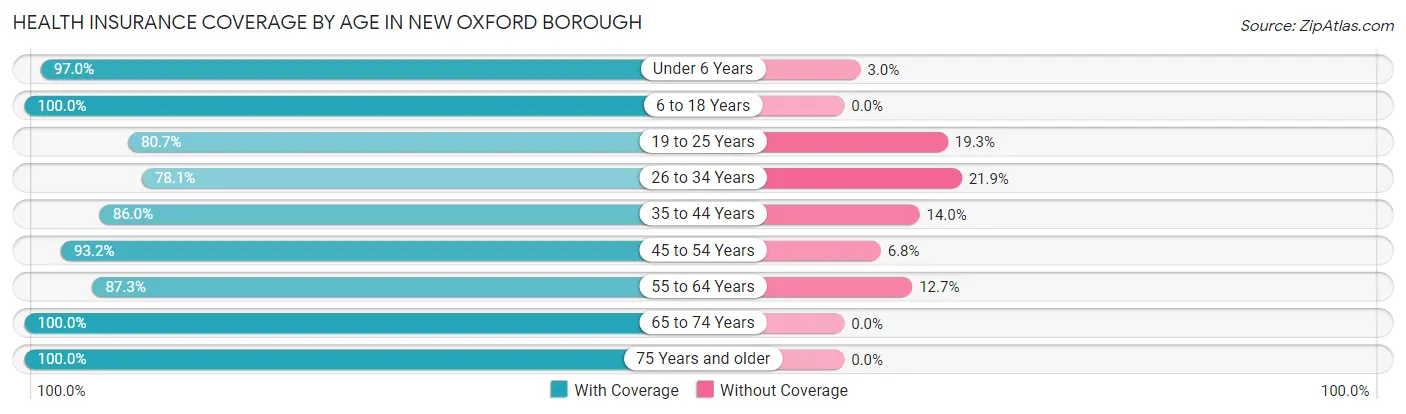
| Age Bracket | With Coverage | Without Coverage |
| Under 6 Years | 128 (97.0%) | 4 (3.0%) |
| 6 to 18 Years | 369 (100.0%) | 0 (0.0%) |
| 19 to 25 Years | 117 (80.7%) | 28 (19.3%) |
| 26 to 34 Years | 132 (78.1%) | 37 (21.9%) |
| 35 to 44 Years | 190 (86.0%) | 31 (14.0%) |
| 45 to 54 Years | 178 (93.2%) | 13 (6.8%) |
| 55 to 64 Years | 131 (87.3%) | 19 (12.7%) |
| 65 to 74 Years | 216 (100.0%) | 0 (0.0%) |
| 75 Years and older | 127 (100.0%) | 0 (0.0%) |
| Total | 1,588 (92.3%) | 132 (7.7%) |
Health Insurance Coverage by Citizenship Status in New Oxford borough
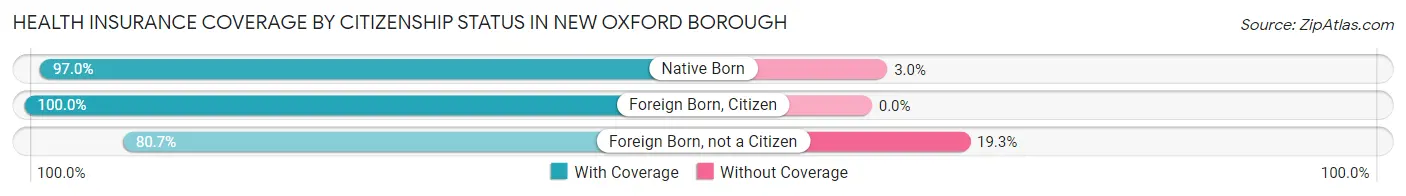
| Citizenship Status | With Coverage | Without Coverage |
| Native Born | 128 (97.0%) | 4 (3.0%) |
| Foreign Born, Citizen | 369 (100.0%) | 0 (0.0%) |
| Foreign Born, not a Citizen | 117 (80.7%) | 28 (19.3%) |
Health Insurance Coverage by Household Income in New Oxford borough
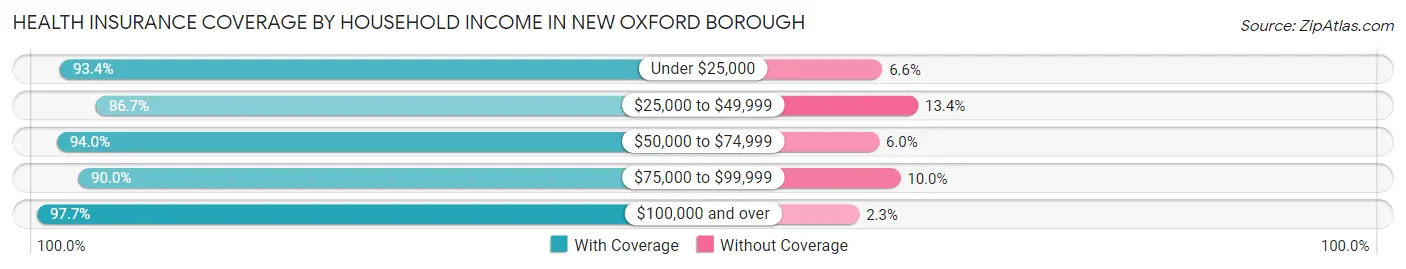
| Household Income | With Coverage | Without Coverage |
| Under $25,000 | 239 (93.4%) | 17 (6.6%) |
| $25,000 to $49,999 | 331 (86.7%) | 51 (13.4%) |
| $50,000 to $74,999 | 343 (94.0%) | 22 (6.0%) |
| $75,000 to $99,999 | 296 (90.0%) | 33 (10.0%) |
| $100,000 and over | 379 (97.7%) | 9 (2.3%) |
Public vs Private Health Insurance Coverage by Age in New Oxford borough
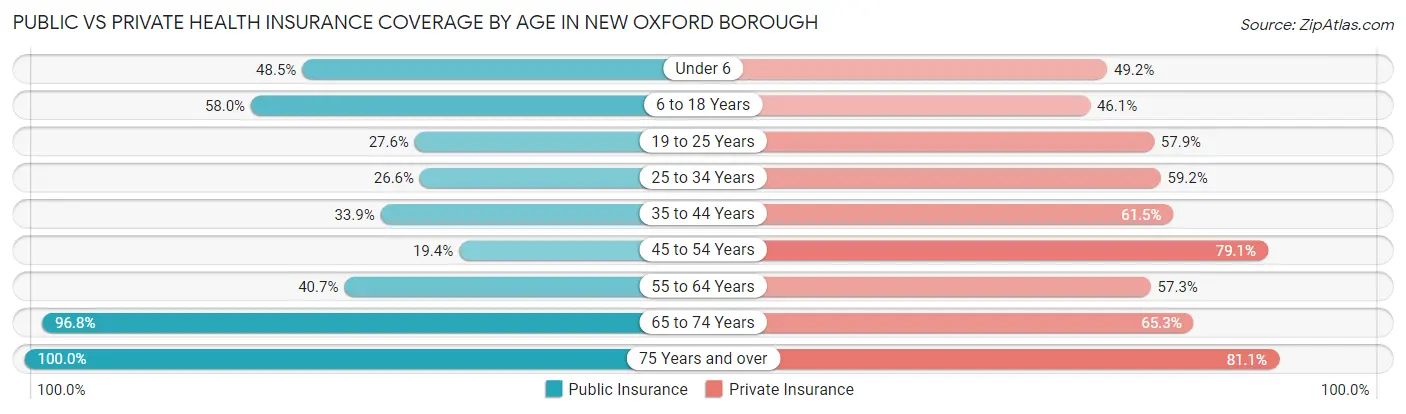
| Age Bracket | Public Insurance | Private Insurance |
| Under 6 | 64 (48.5%) | 65 (49.2%) |
| 6 to 18 Years | 214 (58.0%) | 170 (46.1%) |
| 19 to 25 Years | 40 (27.6%) | 84 (57.9%) |
| 25 to 34 Years | 45 (26.6%) | 100 (59.2%) |
| 35 to 44 Years | 75 (33.9%) | 136 (61.5%) |
| 45 to 54 Years | 37 (19.4%) | 151 (79.1%) |
| 55 to 64 Years | 61 (40.7%) | 86 (57.3%) |
| 65 to 74 Years | 209 (96.8%) | 141 (65.3%) |
| 75 Years and over | 127 (100.0%) | 103 (81.1%) |
| Total | 872 (50.7%) | 1,036 (60.2%) |
Disability Status by Sex by Age in New Oxford borough
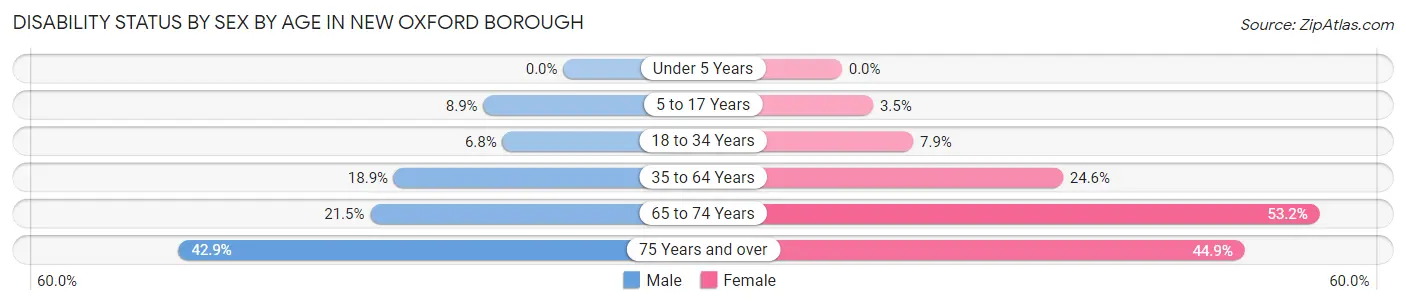
| Age Bracket | Male | Female |
| Under 5 Years | 0 (0.0%) | 0 (0.0%) |
| 5 to 17 Years | 17 (8.9%) | 6 (3.5%) |
| 18 to 34 Years | 9 (6.8%) | 17 (7.9%) |
| 35 to 64 Years | 57 (18.9%) | 64 (24.6%) |
| 65 to 74 Years | 23 (21.5%) | 58 (53.2%) |
| 75 Years and over | 21 (42.9%) | 35 (44.9%) |
Disability Class by Sex by Age in New Oxford borough
Disability Class: Hearing Difficulty
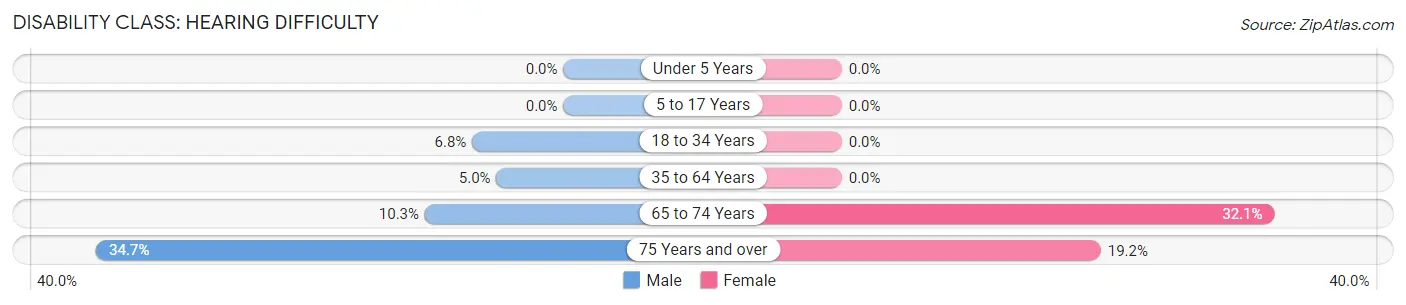
| Age Bracket | Male | Female |
| Under 5 Years | 0 (0.0%) | 0 (0.0%) |
| 5 to 17 Years | 0 (0.0%) | 0 (0.0%) |
| 18 to 34 Years | 9 (6.8%) | 0 (0.0%) |
| 35 to 64 Years | 15 (5.0%) | 0 (0.0%) |
| 65 to 74 Years | 11 (10.3%) | 35 (32.1%) |
| 75 Years and over | 17 (34.7%) | 15 (19.2%) |
Disability Class: Vision Difficulty
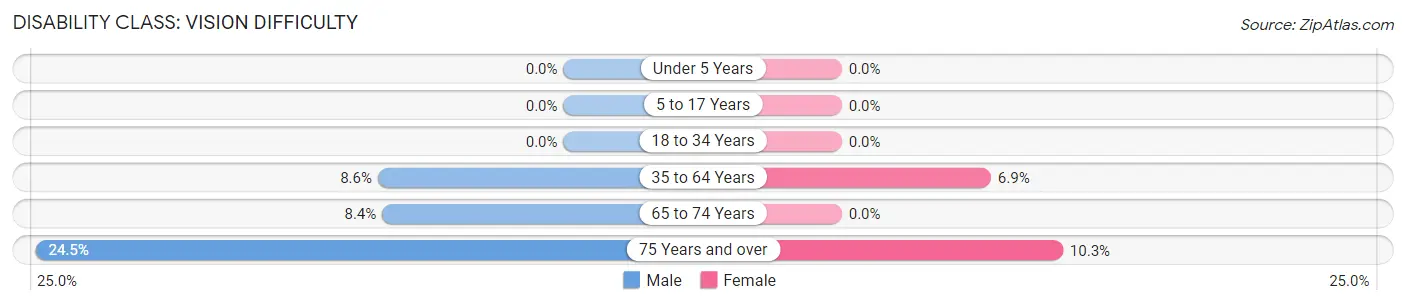
| Age Bracket | Male | Female |
| Under 5 Years | 0 (0.0%) | 0 (0.0%) |
| 5 to 17 Years | 0 (0.0%) | 0 (0.0%) |
| 18 to 34 Years | 0 (0.0%) | 0 (0.0%) |
| 35 to 64 Years | 26 (8.6%) | 18 (6.9%) |
| 65 to 74 Years | 9 (8.4%) | 0 (0.0%) |
| 75 Years and over | 12 (24.5%) | 8 (10.3%) |
Disability Class: Cognitive Difficulty
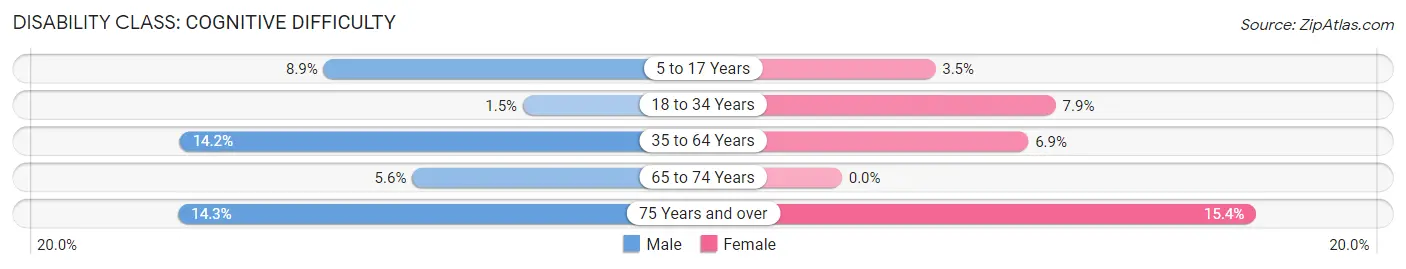
| Age Bracket | Male | Female |
| 5 to 17 Years | 17 (8.9%) | 6 (3.5%) |
| 18 to 34 Years | 2 (1.5%) | 17 (7.9%) |
| 35 to 64 Years | 43 (14.2%) | 18 (6.9%) |
| 65 to 74 Years | 6 (5.6%) | 0 (0.0%) |
| 75 Years and over | 7 (14.3%) | 12 (15.4%) |
Disability Class: Ambulatory Difficulty
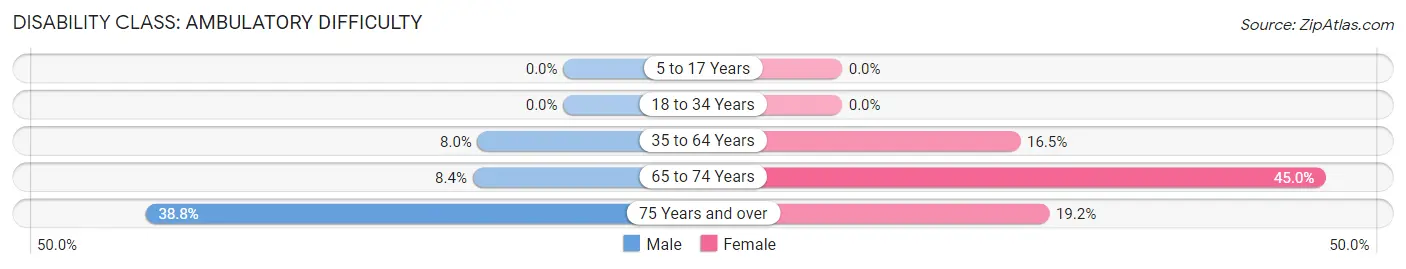
| Age Bracket | Male | Female |
| 5 to 17 Years | 0 (0.0%) | 0 (0.0%) |
| 18 to 34 Years | 0 (0.0%) | 0 (0.0%) |
| 35 to 64 Years | 24 (8.0%) | 43 (16.5%) |
| 65 to 74 Years | 9 (8.4%) | 49 (45.0%) |
| 75 Years and over | 19 (38.8%) | 15 (19.2%) |
Disability Class: Self-Care Difficulty
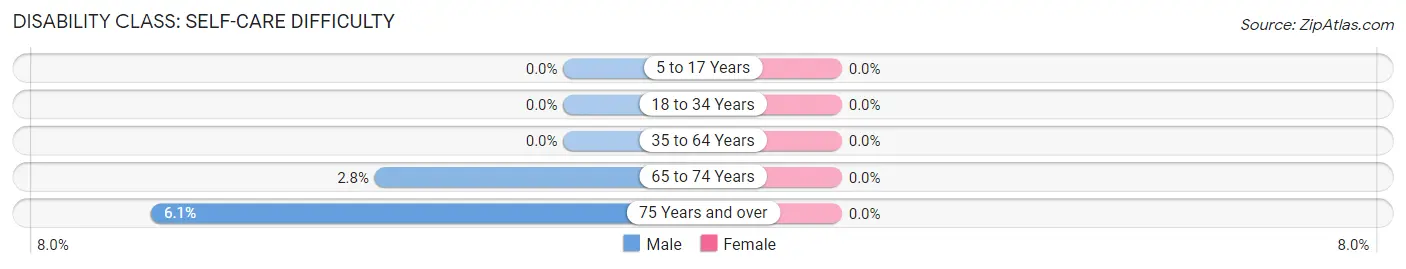
| Age Bracket | Male | Female |
| 5 to 17 Years | 0 (0.0%) | 0 (0.0%) |
| 18 to 34 Years | 0 (0.0%) | 0 (0.0%) |
| 35 to 64 Years | 0 (0.0%) | 0 (0.0%) |
| 65 to 74 Years | 3 (2.8%) | 0 (0.0%) |
| 75 Years and over | 3 (6.1%) | 0 (0.0%) |
Technology Access in New Oxford borough
Computing Device Access in New Oxford borough
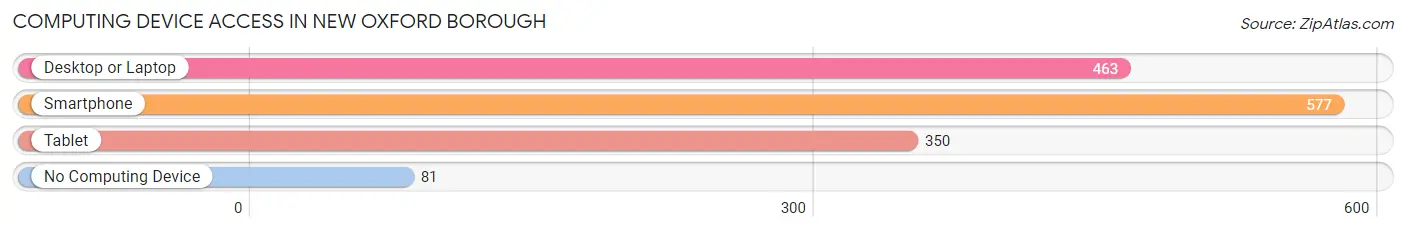
| Device Type | # Households | % Households |
| Desktop or Laptop | 463 | 66.3% |
| Smartphone | 577 | 82.7% |
| Tablet | 350 | 50.1% |
| No Computing Device | 81 | 11.6% |
| Total | 698 | 100.0% |
Internet Access in New Oxford borough
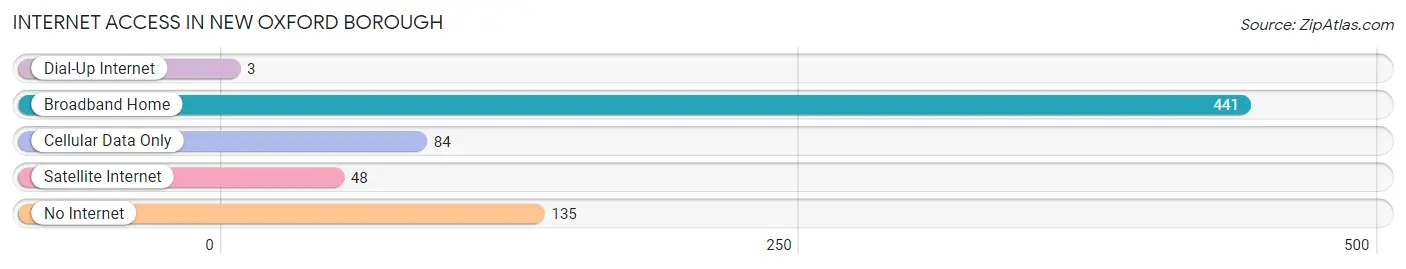
| Internet Type | # Households | % Households |
| Dial-Up Internet | 3 | 0.4% |
| Broadband Home | 441 | 63.2% |
| Cellular Data Only | 84 | 12.0% |
| Satellite Internet | 48 | 6.9% |
| No Internet | 135 | 19.3% |
| Total | 698 | 100.0% |
New Oxford borough Summary
New Oxford Borough is a small borough located in Adams County, Pennsylvania. It is situated in the south-central part of the state, approximately 20 miles east of the state capital of Harrisburg. The borough is home to a population of approximately 2,500 people, and is part of the larger metropolitan area of Gettysburg.
History
New Oxford Borough was founded in 1814 by a group of settlers from Oxford, England. The town was originally known as Oxford, but the name was changed to New Oxford in 1817 to avoid confusion with the nearby town of Oxford. The town was officially incorporated in 1864.
The town was an important stop on the Underground Railroad, with many of the town's residents helping to provide shelter and assistance to escaped slaves. During the Civil War, the town was the site of a major battle between Union and Confederate forces.
Geography
New Oxford Borough is located in south-central Pennsylvania, approximately 20 miles east of the state capital of Harrisburg. The borough is situated in the Cumberland Valley, which is part of the larger Appalachian Mountains region. The borough is bordered by the towns of Gettysburg to the north, East Berlin to the east, and Littlestown to the south.
The borough is located in a rural area, with much of the land being used for agricultural purposes. The borough is home to several small parks, including the New Oxford Community Park, which features a playground, picnic area, and walking trails.
Economy
The economy of New Oxford Borough is largely based on agriculture and tourism. The borough is home to several small farms, which produce a variety of crops, including corn, soybeans, and wheat. The borough is also home to several small businesses, including restaurants, retail stores, and service providers.
The borough is also a popular tourist destination, due to its proximity to Gettysburg and other nearby attractions. The borough is home to several historic sites, including the New Oxford Historic District, which is listed on the National Register of Historic Places. The borough also hosts several annual events, including the New Oxford Festival, which is held each summer.
Demographics
As of the 2010 census, the population of New Oxford Borough was 2,521. The racial makeup of the borough was 95.3% White, 1.2% African American, 0.3% Native American, 0.7% Asian, 0.1% Pacific Islander, 0.7% from other races, and 1.9% from two or more races. Hispanic or Latino of any race were 2.2% of the population.
The median household income in the borough was $45,938, and the median family income was $54,844. The per capita income for the borough was $21,945. About 8.3% of families and 10.2% of the population were below the poverty line, including 14.2% of those under age 18 and 6.2% of those age 65 or over.
Common Questions
What is the Total Population of New Oxford borough?
Total Population of New Oxford borough is 1,720.
What is the Total Male Population of New Oxford borough?
Total Male Population of New Oxford borough is 821.
What is the Total Female Population of New Oxford borough?
Total Female Population of New Oxford borough is 899.
What is the Ratio of Males per 100 Females in New Oxford borough?
There are 91.32 Males per 100 Females in New Oxford borough.
What is the Ratio of Females per 100 Males in New Oxford borough?
There are 109.50 Females per 100 Males in New Oxford borough.
What is the Median Population Age in New Oxford borough?
Median Population Age in New Oxford borough is 36.7 Years.
What is the Average Family Size in New Oxford borough
Average Family Size in New Oxford borough is 3.2 People.
What is the Average Household Size in New Oxford borough
Average Household Size in New Oxford borough is 2.5 People.
What is Per Capita Income in New Oxford borough?
Per Capita income in New Oxford borough is $27,050.
What is the Median Family Income in New Oxford borough?
Median Family Income in New Oxford borough is $67,188.
What is the Median Household income in New Oxford borough?
Median Household Income in New Oxford borough is $53,947.
What is Income or Wage Gap in New Oxford borough?
Income or Wage Gap in New Oxford borough is 38.0%.
Women in New Oxford borough earn 62.0 cents for every dollar earned by a man.
What is Inequality or Gini Index in New Oxford borough?
Inequality or Gini Index in New Oxford borough is 0.43.
How Large is the Labor Force in New Oxford borough?
There are 833 People in the Labor Forcein in New Oxford borough.
What is the Percentage of People in the Labor Force in New Oxford borough?
65.0% of People are in the Labor Force in New Oxford borough.
What is the Unemployment Rate in New Oxford borough?
Unemployment Rate in New Oxford borough is 5.3%.