Willard, OH
Willard Map
Willard Overview
6,189
TOTAL POPULATION
2,836
MALE POPULATION
3,353
FEMALE POPULATION
84.58
MALES / 100 FEMALES
118.23
FEMALES / 100 MALES
35.7
MEDIAN AGE
3.3
AVG FAMILY SIZE
2.5
AVG HOUSEHOLD SIZE
$24,974
PER CAPITA INCOME
$60,859
AVG FAMILY INCOME
$51,846
AVG HOUSEHOLD INCOME
27.3%
WAGE / INCOME GAP [ % ]
72.7¢/ $1
WAGE / INCOME GAP [ $ ]
$6,292
FAMILY INCOME DEFICIT
0.38
INEQUALITY / GINI INDEX
2,706
LABOR FORCE [ PEOPLE ]
58.3%
PERCENT IN LABOR FORCE
4.1%
UNEMPLOYMENT RATE
Willard Zip Codes
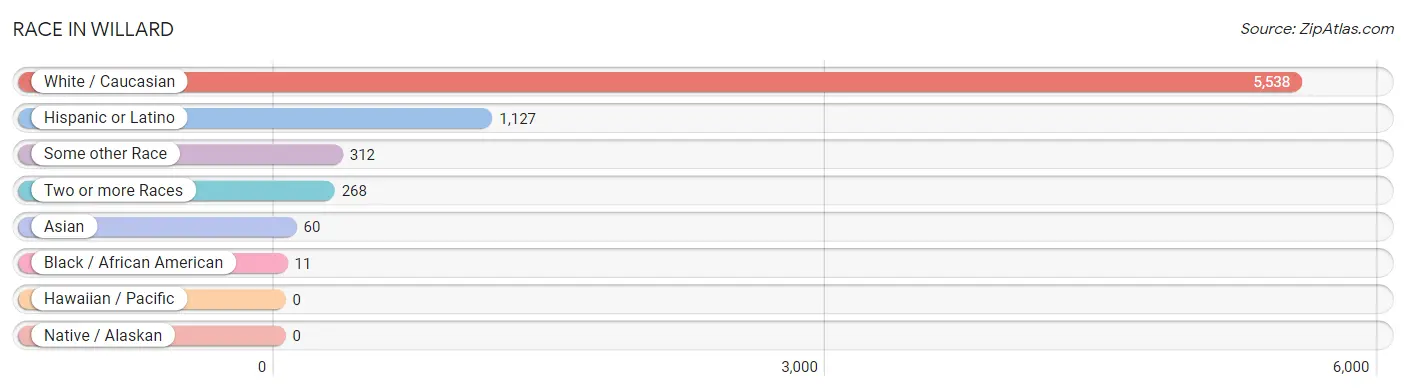
Race in Willard
The most populous races in Willard are White / Caucasian (5,538 | 89.5%), Hispanic or Latino (1,127 | 18.2%), and Some other Race (312 | 5.0%).
| Race | # Population | % Population |
| Asian | 60 | 1.0% |
| Black / African American | 11 | 0.2% |
| Hawaiian / Pacific | 0 | 0.0% |
| Hispanic or Latino | 1,127 | 18.2% |
| Native / Alaskan | 0 | 0.0% |
| White / Caucasian | 5,538 | 89.5% |
| Two or more Races | 268 | 4.3% |
| Some other Race | 312 | 5.0% |
| Total | 6,189 | 100.0% |
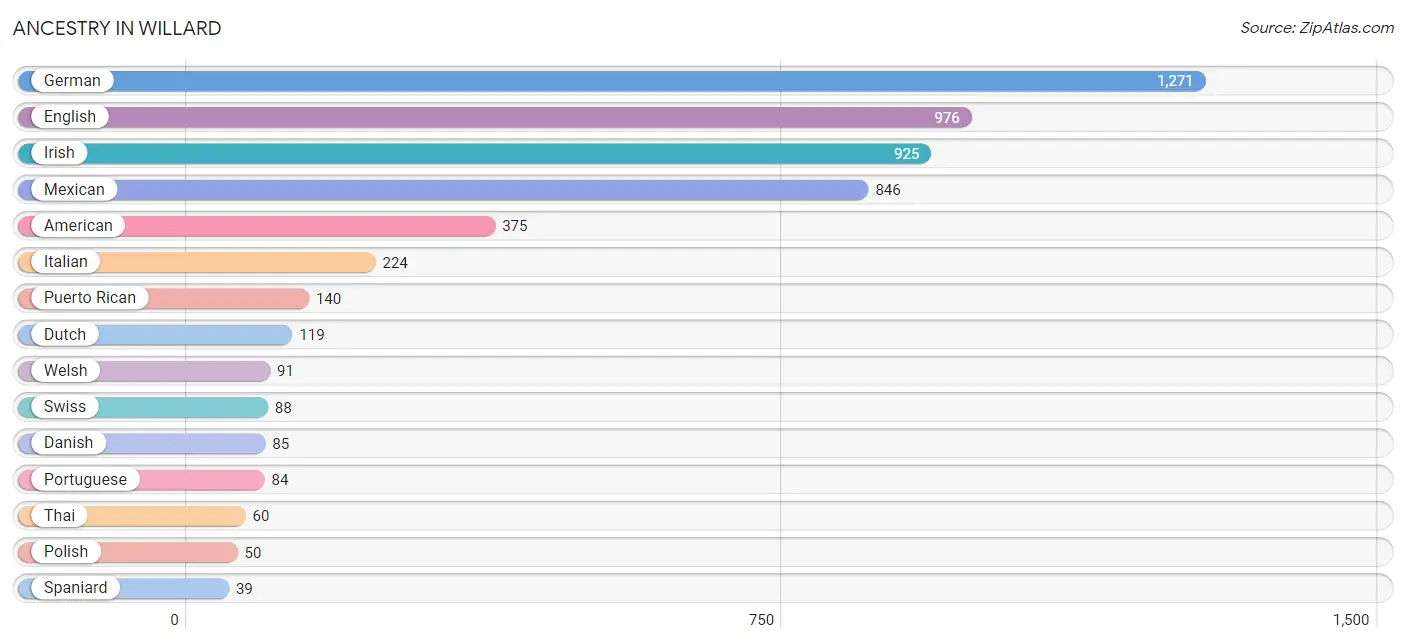
Ancestry in Willard
The most populous ancestries reported in Willard are German (1,271 | 20.5%), English (976 | 15.8%), Irish (925 | 14.9%), Mexican (846 | 13.7%), and American (375 | 6.1%), together accounting for 71.0% of all Willard residents.
| Ancestry | # Population | % Population |
| American | 375 | 6.1% |
| Austrian | 5 | 0.1% |
| British | 13 | 0.2% |
| Central American | 15 | 0.2% |
| Cherokee | 18 | 0.3% |
| Danish | 85 | 1.4% |
| Dutch | 119 | 1.9% |
| English | 976 | 15.8% |
| European | 32 | 0.5% |
| French | 33 | 0.5% |
| German | 1,271 | 20.5% |
| Hungarian | 11 | 0.2% |
| Irish | 925 | 14.9% |
| Italian | 224 | 3.6% |
| Mexican | 846 | 13.7% |
| Nicaraguan | 15 | 0.2% |
| Pennsylvania German | 14 | 0.2% |
| Polish | 50 | 0.8% |
| Portuguese | 84 | 1.4% |
| Puerto Rican | 140 | 2.3% |
| Romanian | 37 | 0.6% |
| Scotch-Irish | 22 | 0.4% |
| Scottish | 23 | 0.4% |
| Slavic | 14 | 0.2% |
| Slovak | 11 | 0.2% |
| Spaniard | 39 | 0.6% |
| Swiss | 88 | 1.4% |
| Thai | 60 | 1.0% |
| Welsh | 91 | 1.5% | View All 29 Rows |
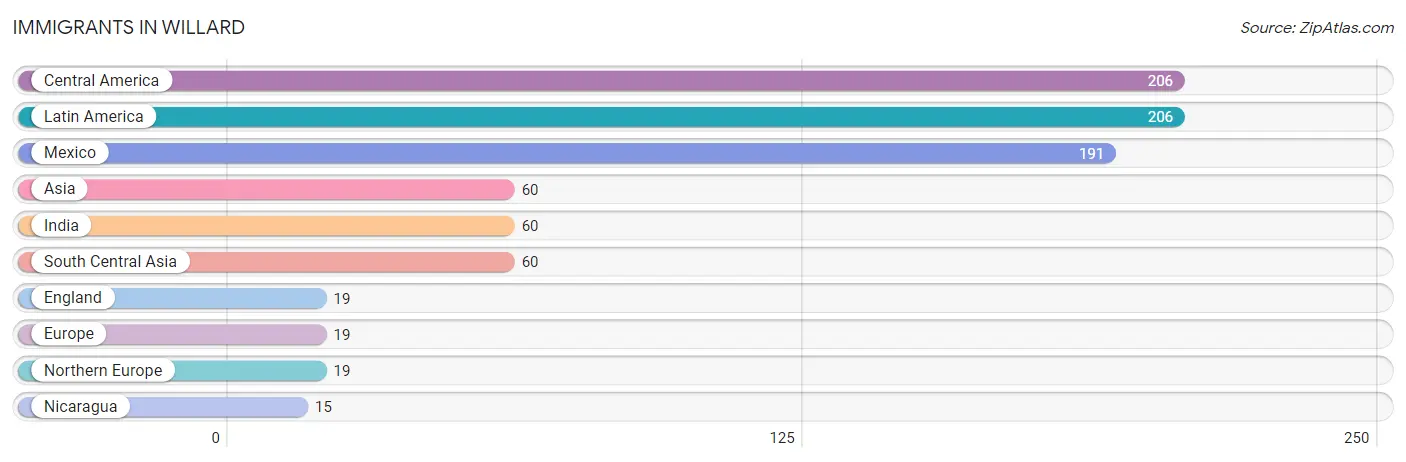
Immigrants in Willard
The most numerous immigrant groups reported in Willard came from Central America (206 | 3.3%), Latin America (206 | 3.3%), Mexico (191 | 3.1%), Asia (60 | 1.0%), and India (60 | 1.0%), together accounting for 11.7% of all Willard residents.
| Immigration Origin | # Population | % Population |
| Asia | 60 | 1.0% |
| Central America | 206 | 3.3% |
| England | 19 | 0.3% |
| Europe | 19 | 0.3% |
| India | 60 | 1.0% |
| Latin America | 206 | 3.3% |
| Mexico | 191 | 3.1% |
| Nicaragua | 15 | 0.2% |
| Northern Europe | 19 | 0.3% |
| South Central Asia | 60 | 1.0% | View All 10 Rows |
Sex and Age in Willard
Sex and Age in Willard
The most populous age groups in Willard are 15 to 19 Years (280 | 9.9%) for men and Under 5 Years (336 | 10.0%) for women.
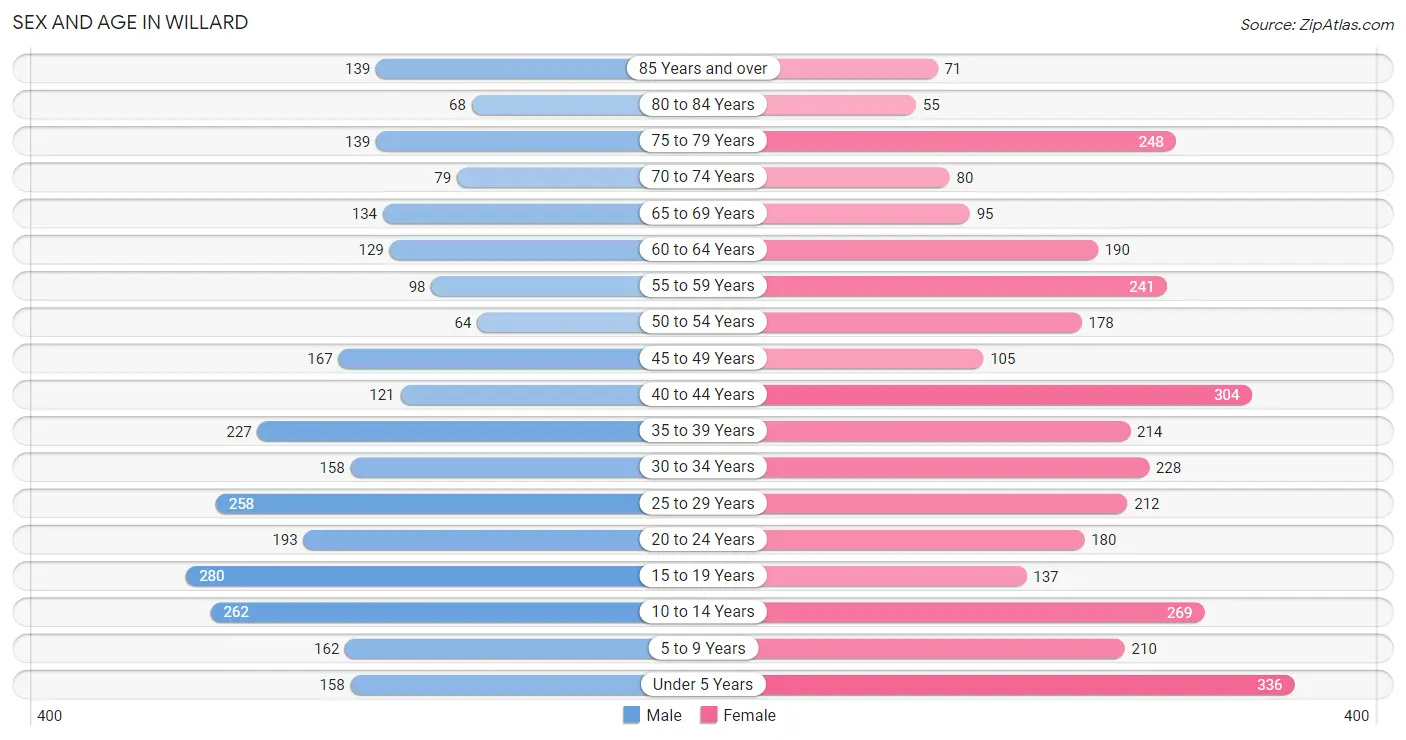
| Age Bracket | Male | Female |
| Under 5 Years | 158 (5.6%) | 336 (10.0%) |
| 5 to 9 Years | 162 (5.7%) | 210 (6.3%) |
| 10 to 14 Years | 262 (9.2%) | 269 (8.0%) |
| 15 to 19 Years | 280 (9.9%) | 137 (4.1%) |
| 20 to 24 Years | 193 (6.8%) | 180 (5.4%) |
| 25 to 29 Years | 258 (9.1%) | 212 (6.3%) |
| 30 to 34 Years | 158 (5.6%) | 228 (6.8%) |
| 35 to 39 Years | 227 (8.0%) | 214 (6.4%) |
| 40 to 44 Years | 121 (4.3%) | 304 (9.1%) |
| 45 to 49 Years | 167 (5.9%) | 105 (3.1%) |
| 50 to 54 Years | 64 (2.3%) | 178 (5.3%) |
| 55 to 59 Years | 98 (3.5%) | 241 (7.2%) |
| 60 to 64 Years | 129 (4.5%) | 190 (5.7%) |
| 65 to 69 Years | 134 (4.7%) | 95 (2.8%) |
| 70 to 74 Years | 79 (2.8%) | 80 (2.4%) |
| 75 to 79 Years | 139 (4.9%) | 248 (7.4%) |
| 80 to 84 Years | 68 (2.4%) | 55 (1.6%) |
| 85 Years and over | 139 (4.9%) | 71 (2.1%) |
| Total | 2,836 (100.0%) | 3,353 (100.0%) |
Families and Households in Willard
Median Family Size in Willard
The median family size in Willard is 3.31 persons per family, with married-couple families (886 | 62.3%) accounting for the largest median family size of 3.57 persons per family. On the other hand, single male/father families (114 | 8.0%) represent the smallest median family size with 1.83 persons per family.
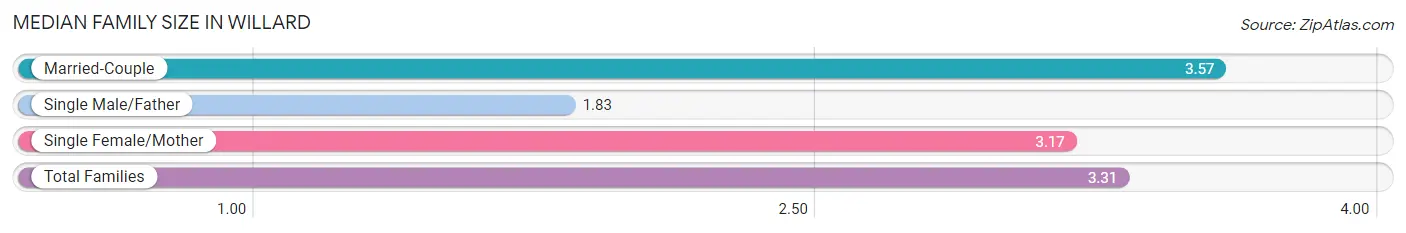
| Family Type | # Families | Family Size |
| Married-Couple | 886 (62.3%) | 3.57 |
| Single Male/Father | 114 (8.0%) | 1.83 |
| Single Female/Mother | 423 (29.7%) | 3.17 |
| Total Families | 1,423 (100.0%) | 3.31 |
Median Household Size in Willard
The median household size in Willard is 2.51 persons per household, with single female/mother households (423 | 17.4%) accounting for the largest median household size of 3.66 persons per household. non-family households (1,002 | 41.3%) represent the smallest median household size with 1.09 persons per household.
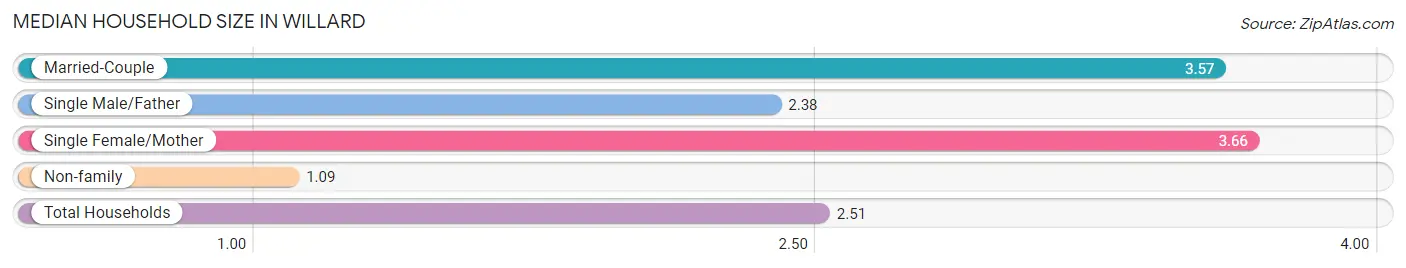
| Household Type | # Households | Household Size |
| Married-Couple | 886 (36.5%) | 3.57 |
| Single Male/Father | 114 (4.7%) | 2.38 |
| Single Female/Mother | 423 (17.4%) | 3.66 |
| Non-family | 1,002 (41.3%) | 1.09 |
| Total Households | 2,425 (100.0%) | 2.51 |
Household Size by Marriage Status in Willard
Out of a total of 2,425 households in Willard, 1,423 (58.7%) are family households, while 1,002 (41.3%) are nonfamily households. The most numerous type of family households are 3-person households, comprising 518, and the most common type of nonfamily households are 1-person households, comprising 931.
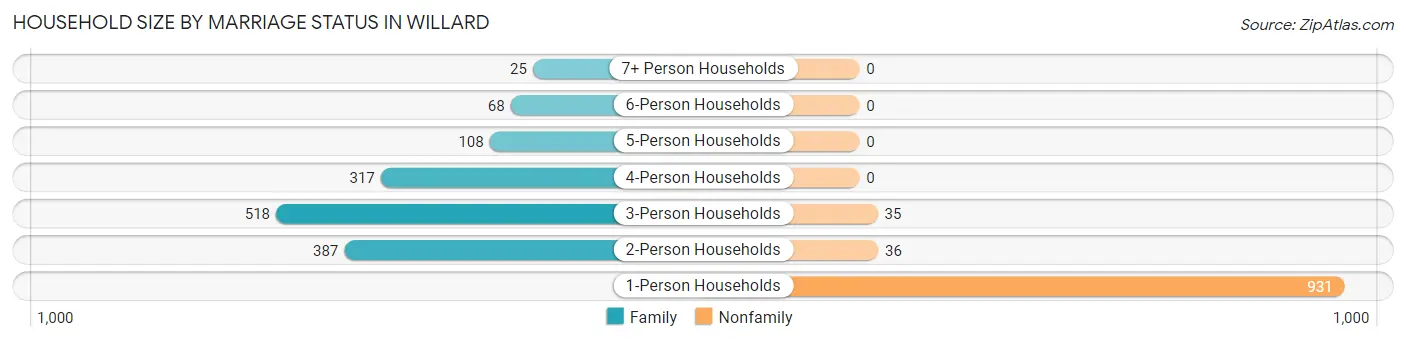
| Household Size | Family Households | Nonfamily Households |
| 1-Person Households | - | 931 (38.4%) |
| 2-Person Households | 387 (16.0%) | 36 (1.5%) |
| 3-Person Households | 518 (21.4%) | 35 (1.4%) |
| 4-Person Households | 317 (13.1%) | 0 (0.0%) |
| 5-Person Households | 108 (4.4%) | 0 (0.0%) |
| 6-Person Households | 68 (2.8%) | 0 (0.0%) |
| 7+ Person Households | 25 (1.0%) | 0 (0.0%) |
| Total | 1,423 (58.7%) | 1,002 (41.3%) |
Female Fertility in Willard
Fertility by Age in Willard
Average fertility rate in Willard is 94.0 births per 1,000 women. Women in the age bracket of 35 to 50 years have the highest fertility rate with 133.0 births per 1,000 women. Women in the age bracket of 35 to 50 years acount for 65.4% of all women with births.
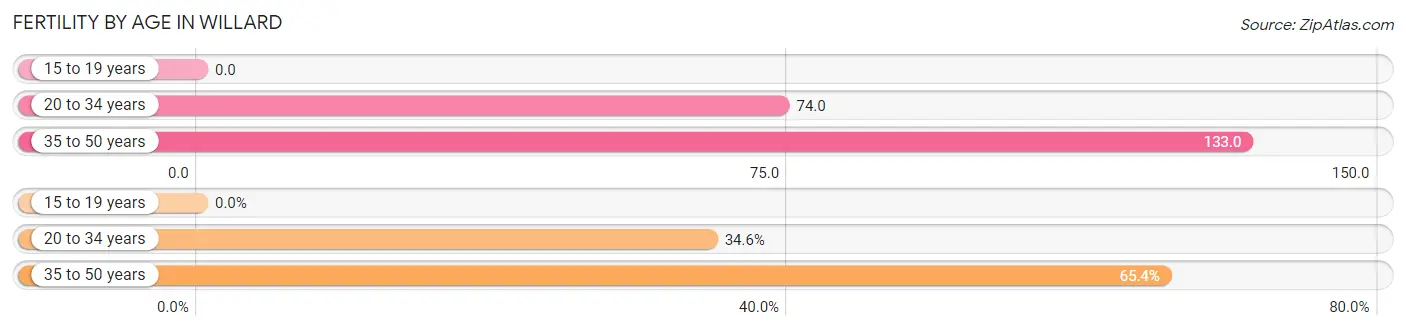
| Age Bracket | Women with Births | Births / 1,000 Women |
| 15 to 19 years | 0 (0.0%) | 0.0 |
| 20 to 34 years | 46 (34.6%) | 74.0 |
| 35 to 50 years | 87 (65.4%) | 133.0 |
| Total | 133 (100.0%) | 94.0 |
Fertility by Age by Marriage Status in Willard
28.6% of women with births (133) in Willard are married. The highest percentage of unmarried women with births falls into 35 to 50 years age bracket with 91.9% of them unmarried at the time of birth, while the lowest percentage of unmarried women with births belong to 20 to 34 years age bracket with 32.6% of them unmarried.
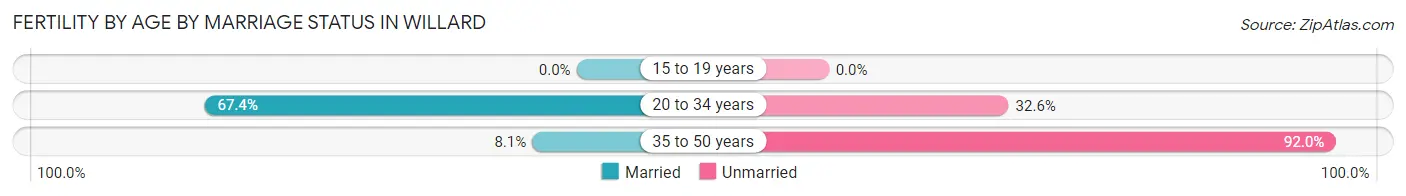
| Age Bracket | Married | Unmarried |
| 15 to 19 years | 0 (0.0%) | 0 (0.0%) |
| 20 to 34 years | 31 (67.4%) | 15 (32.6%) |
| 35 to 50 years | 7 (8.1%) | 80 (91.9%) |
| Total | 38 (28.6%) | 95 (71.4%) |
Fertility by Education in Willard
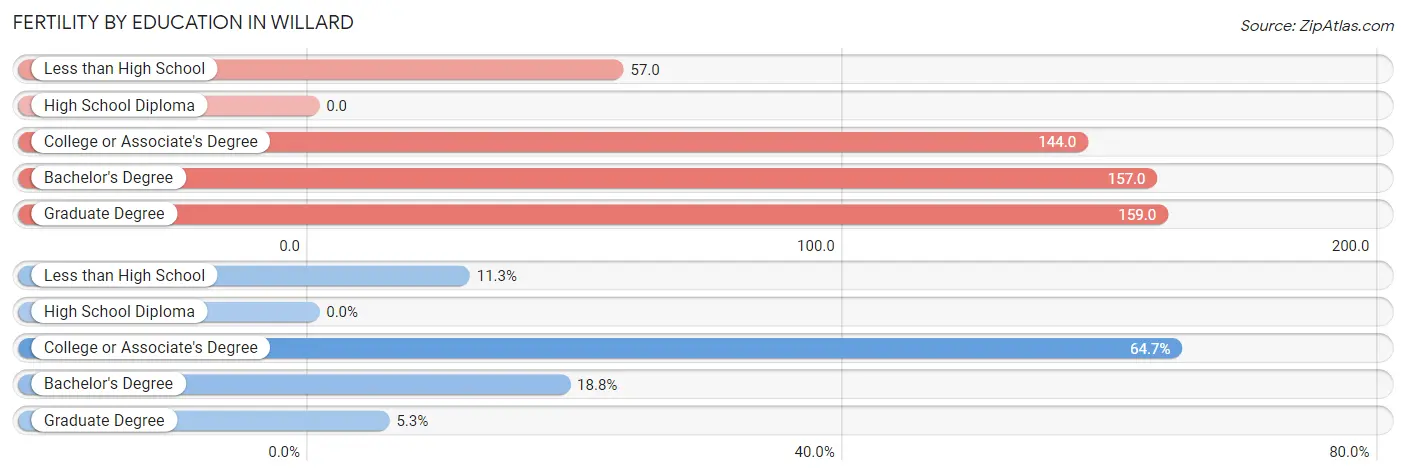
| Educational Attainment | Women with Births | Births / 1,000 Women |
| Less than High School | 15 (11.3%) | 57.0 |
| High School Diploma | 0 (0.0%) | 0.0 |
| College or Associate's Degree | 86 (64.7%) | 144.0 |
| Bachelor's Degree | 25 (18.8%) | 157.0 |
| Graduate Degree | 7 (5.3%) | 159.0 |
| Total | 133 (100.0%) | 94.0 |
Fertility by Education by Marriage Status in Willard
71.4% of women with births in Willard are unmarried. Women with the educational attainment of bachelor's degree are most likely to be married with 100.0% of them married at childbirth, while women with the educational attainment of less than high school are least likely to be married with 100.0% of them unmarried at childbirth.
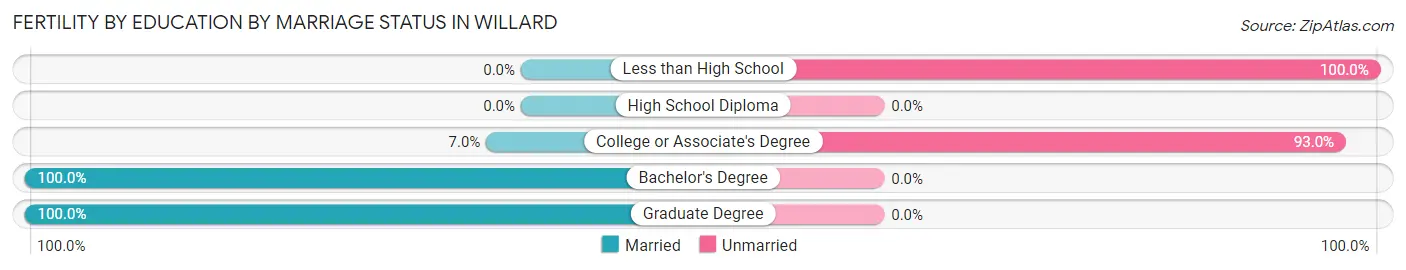
| Educational Attainment | Married | Unmarried |
| Less than High School | 0 (0.0%) | 15 (100.0%) |
| High School Diploma | 0 (0.0%) | 0 (0.0%) |
| College or Associate's Degree | 6 (7.0%) | 80 (93.0%) |
| Bachelor's Degree | 25 (100.0%) | 0 (0.0%) |
| Graduate Degree | 7 (100.0%) | 0 (0.0%) |
| Total | 38 (28.6%) | 95 (71.4%) |
Income in Willard
Income Overview in Willard
Per Capita Income in Willard is $24,974, while median incomes of families and households are $60,859 and $51,846 respectively.
| Characteristic | Number | Measure |
| Per Capita Income | 6,189 | $24,974 |
| Median Family Income | 1,423 | $60,859 |
| Mean Family Income | 1,423 | $71,473 |
| Median Household Income | 2,425 | $51,846 |
| Mean Household Income | 2,425 | $61,306 |
| Income Deficit | 1,423 | $6,292 |
| Wage / Income Gap (%) | 6,189 | 27.27% |
| Wage / Income Gap ($) | 6,189 | 72.73¢ per $1 |
| Gini / Inequality Index | 6,189 | 0.38 |
Earnings by Sex in Willard
Average Earnings in Willard are $31,865, $38,028 for men and $27,658 for women, a difference of 27.3%.
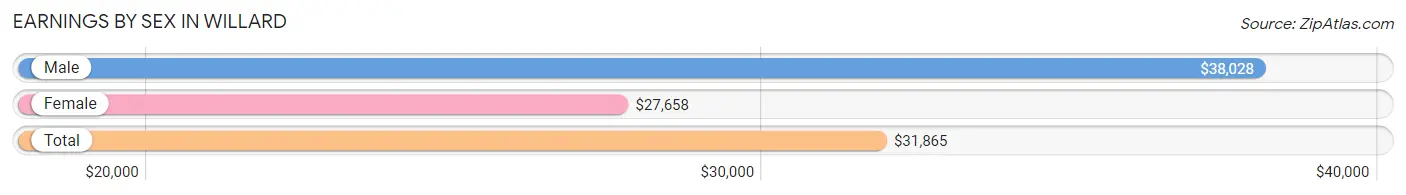
| Sex | Number | Average Earnings |
| Male | 1,442 (48.6%) | $38,028 |
| Female | 1,524 (51.4%) | $27,658 |
| Total | 2,966 (100.0%) | $31,865 |
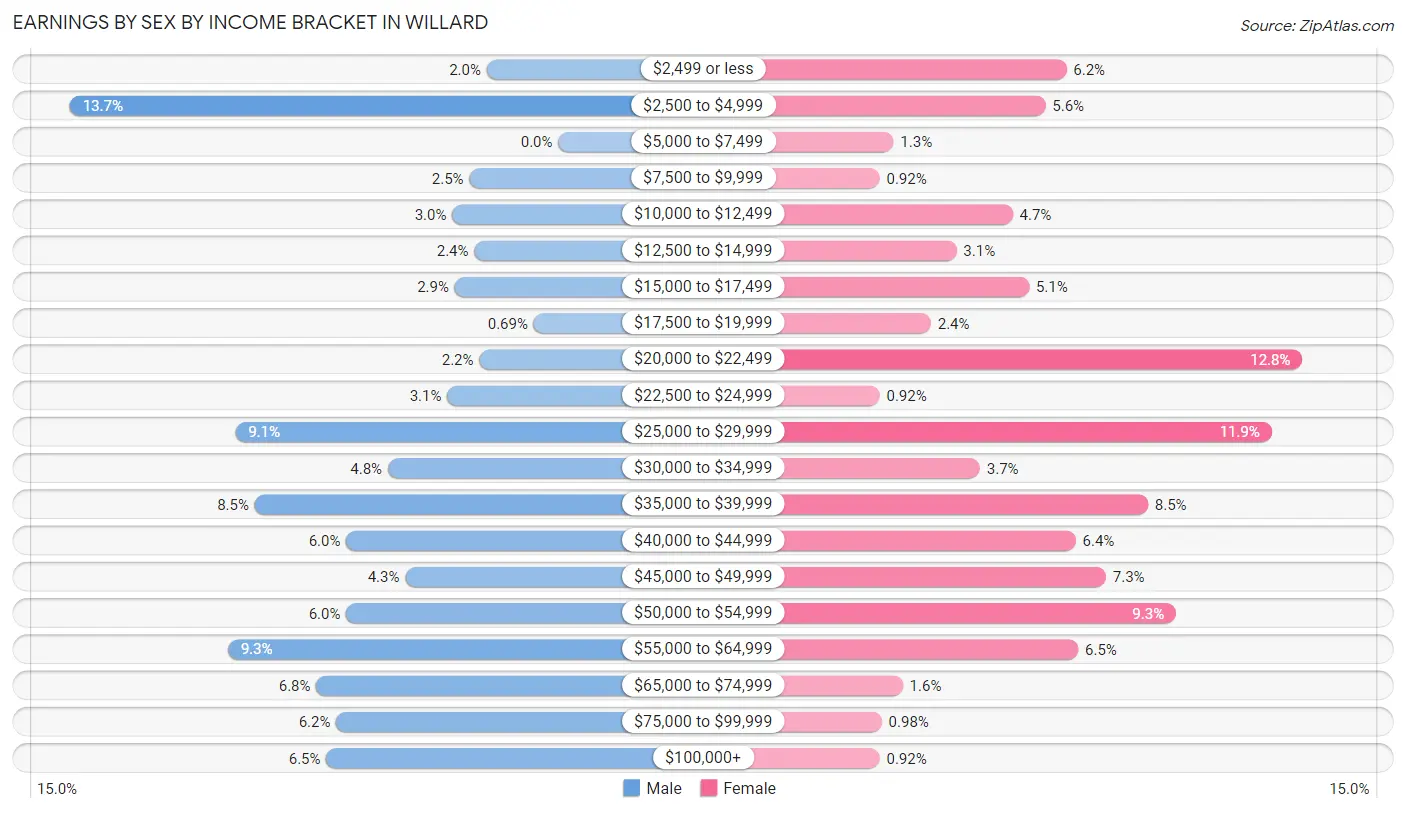
Earnings by Sex by Income Bracket in Willard
The most common earnings brackets in Willard are $2,500 to $4,999 for men (198 | 13.7%) and $20,000 to $22,499 for women (195 | 12.8%).
| Income | Male | Female |
| $2,499 or less | 29 (2.0%) | 94 (6.2%) |
| $2,500 to $4,999 | 198 (13.7%) | 85 (5.6%) |
| $5,000 to $7,499 | 0 (0.0%) | 20 (1.3%) |
| $7,500 to $9,999 | 36 (2.5%) | 14 (0.9%) |
| $10,000 to $12,499 | 43 (3.0%) | 71 (4.7%) |
| $12,500 to $14,999 | 34 (2.4%) | 47 (3.1%) |
| $15,000 to $17,499 | 42 (2.9%) | 78 (5.1%) |
| $17,500 to $19,999 | 10 (0.7%) | 36 (2.4%) |
| $20,000 to $22,499 | 32 (2.2%) | 195 (12.8%) |
| $22,500 to $24,999 | 45 (3.1%) | 14 (0.9%) |
| $25,000 to $29,999 | 131 (9.1%) | 182 (11.9%) |
| $30,000 to $34,999 | 69 (4.8%) | 57 (3.7%) |
| $35,000 to $39,999 | 123 (8.5%) | 129 (8.5%) |
| $40,000 to $44,999 | 86 (6.0%) | 98 (6.4%) |
| $45,000 to $49,999 | 62 (4.3%) | 111 (7.3%) |
| $50,000 to $54,999 | 86 (6.0%) | 141 (9.2%) |
| $55,000 to $64,999 | 134 (9.3%) | 99 (6.5%) |
| $65,000 to $74,999 | 98 (6.8%) | 24 (1.6%) |
| $75,000 to $99,999 | 90 (6.2%) | 15 (1.0%) |
| $100,000+ | 94 (6.5%) | 14 (0.9%) |
| Total | 1,442 (100.0%) | 1,524 (100.0%) |
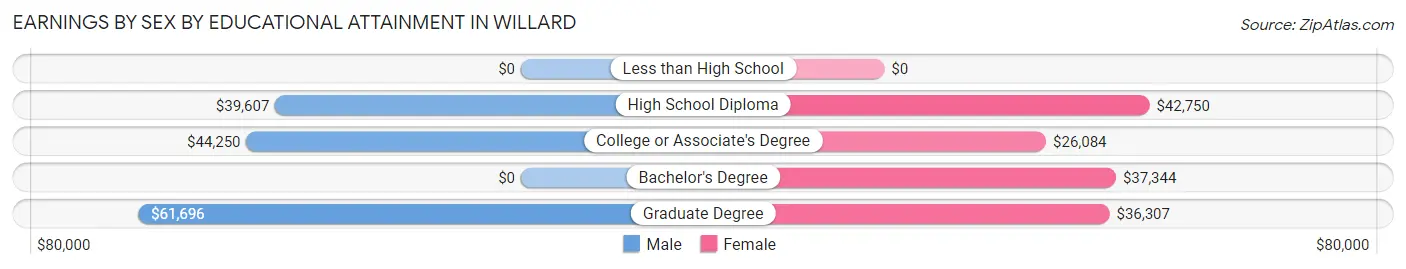
Earnings by Sex by Educational Attainment in Willard
Average earnings in Willard are $44,401 for men and $31,541 for women, a difference of 29.0%. Men with an educational attainment of graduate degree enjoy the highest average annual earnings of $61,696, while those with high school diploma education earn the least with $39,607. Women with an educational attainment of high school diploma earn the most with the average annual earnings of $42,750, while those with college or associate's degree education have the smallest earnings of $26,084.
| Educational Attainment | Male Income | Female Income |
| Less than High School | - | - |
| High School Diploma | $39,607 | $42,750 |
| College or Associate's Degree | $44,250 | $26,084 |
| Bachelor's Degree | - | - |
| Graduate Degree | $61,696 | $36,307 |
| Total | $44,401 | $31,541 |
Family Income in Willard
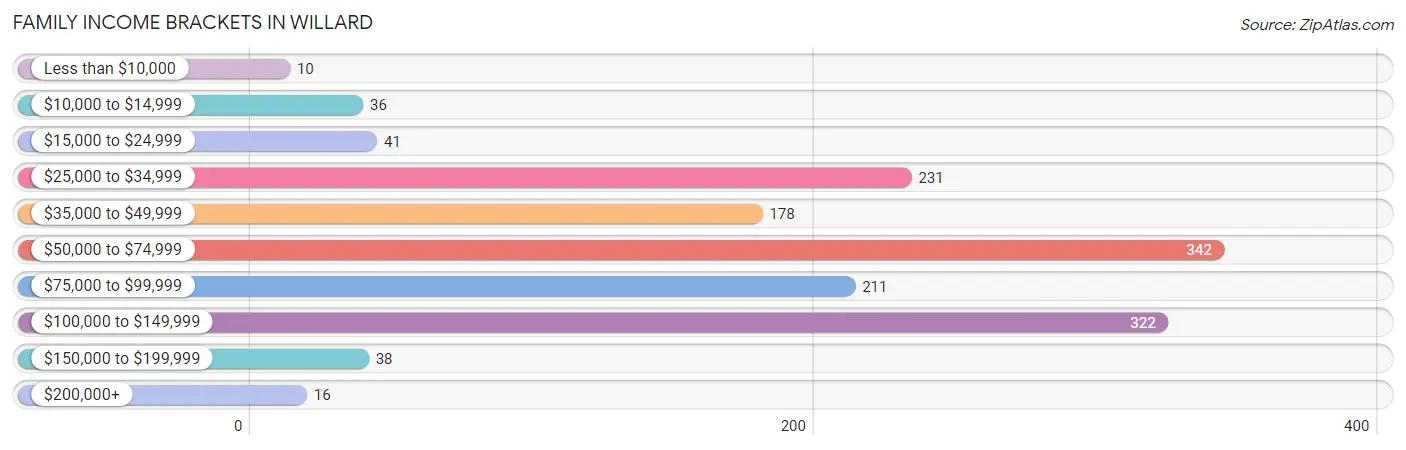
Family Income Brackets in Willard
According to the Willard family income data, there are 342 families falling into the $50,000 to $74,999 income range, which is the most common income bracket and makes up 24.0% of all families. Conversely, the less than $10,000 income bracket is the least frequent group with only 10 families (0.7%) belonging to this category.
| Income Bracket | # Families | % Families |
| Less than $10,000 | 10 | 0.7% |
| $10,000 to $14,999 | 36 | 2.5% |
| $15,000 to $24,999 | 41 | 2.9% |
| $25,000 to $34,999 | 231 | 16.2% |
| $35,000 to $49,999 | 178 | 12.5% |
| $50,000 to $74,999 | 342 | 24.0% |
| $75,000 to $99,999 | 211 | 14.8% |
| $100,000 to $149,999 | 322 | 22.6% |
| $150,000 to $199,999 | 38 | 2.7% |
| $200,000+ | 16 | 1.1% |
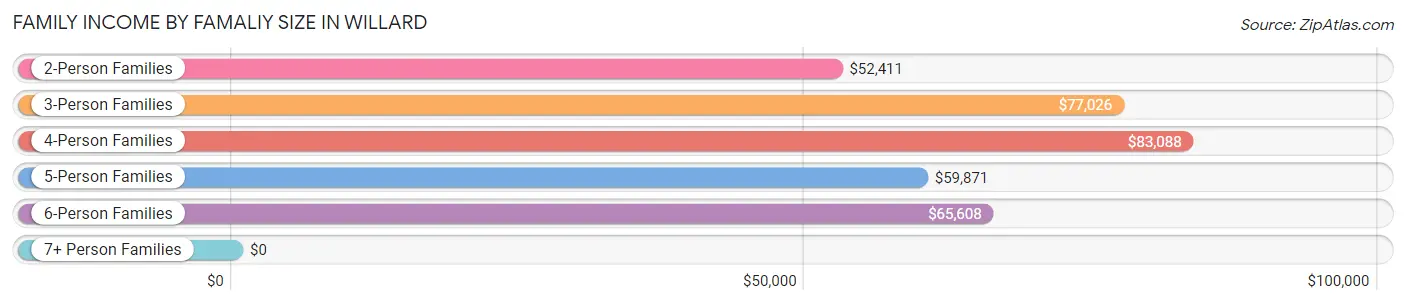
Family Income by Famaliy Size in Willard
4-person families (306 | 21.5%) account for the highest median family income in Willard with $83,088 per family, while 2-person families (562 | 39.5%) have the highest median income of $26,206 per family member.
| Income Bracket | # Families | Median Income |
| 2-Person Families | 562 (39.5%) | $52,411 |
| 3-Person Families | 369 (25.9%) | $77,026 |
| 4-Person Families | 306 (21.5%) | $83,088 |
| 5-Person Families | 93 (6.5%) | $59,871 |
| 6-Person Families | 68 (4.8%) | $65,608 |
| 7+ Person Families | 25 (1.8%) | $0 |
| Total | 1,423 (100.0%) | $60,859 |
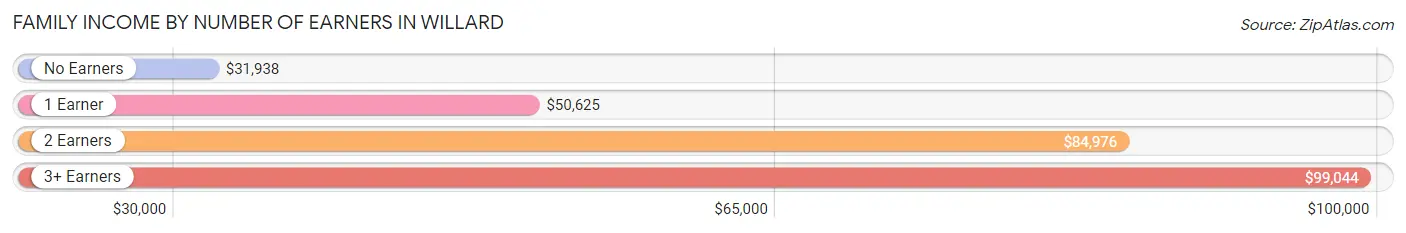
Family Income by Number of Earners in Willard
The median family income in Willard is $60,859, with families comprising 3+ earners (87) having the highest median family income of $99,044, while families with no earners (151) have the lowest median family income of $31,938, accounting for 6.1% and 10.6% of families, respectively.
| Number of Earners | # Families | Median Income |
| No Earners | 151 (10.6%) | $31,938 |
| 1 Earner | 708 (49.7%) | $50,625 |
| 2 Earners | 477 (33.5%) | $84,976 |
| 3+ Earners | 87 (6.1%) | $99,044 |
| Total | 1,423 (100.0%) | $60,859 |
Household Income in Willard
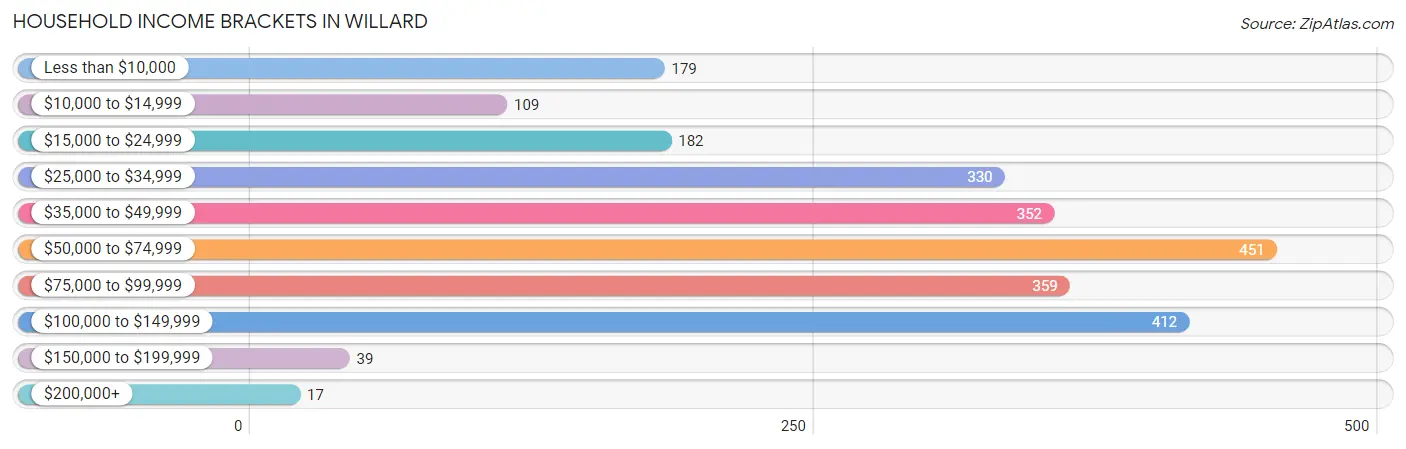
Household Income Brackets in Willard
With 451 households falling in the category, the $50,000 to $74,999 income range is the most frequent in Willard, accounting for 18.6% of all households. In contrast, only 17 households (0.7%) fall into the $200,000+ income bracket, making it the least populous group.
| Income Bracket | # Households | % Households |
| Less than $10,000 | 179 | 7.4% |
| $10,000 to $14,999 | 109 | 4.5% |
| $15,000 to $24,999 | 182 | 7.5% |
| $25,000 to $34,999 | 330 | 13.6% |
| $35,000 to $49,999 | 352 | 14.5% |
| $50,000 to $74,999 | 451 | 18.6% |
| $75,000 to $99,999 | 359 | 14.8% |
| $100,000 to $149,999 | 412 | 17.0% |
| $150,000 to $199,999 | 39 | 1.6% |
| $200,000+ | 17 | 0.7% |
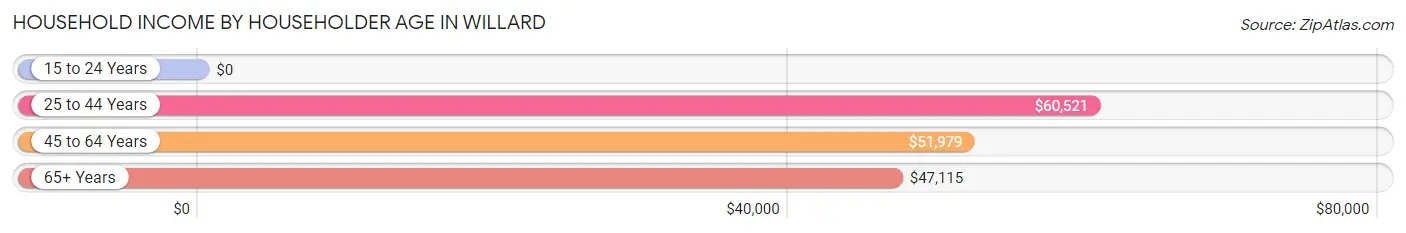
Household Income by Householder Age in Willard
The median household income in Willard is $51,846, with the highest median household income of $60,521 found in the 25 to 44 years age bracket for the primary householder. A total of 823 households (33.9%) fall into this category. Meanwhile, the 15 to 24 years age bracket for the primary householder has the lowest median household income of $0, with 92 households (3.8%) in this group.
| Income Bracket | # Households | Median Income |
| 15 to 24 Years | 92 (3.8%) | $0 |
| 25 to 44 Years | 823 (33.9%) | $60,521 |
| 45 to 64 Years | 770 (31.8%) | $51,979 |
| 65+ Years | 740 (30.5%) | $47,115 |
| Total | 2,425 (100.0%) | $51,846 |
Poverty in Willard
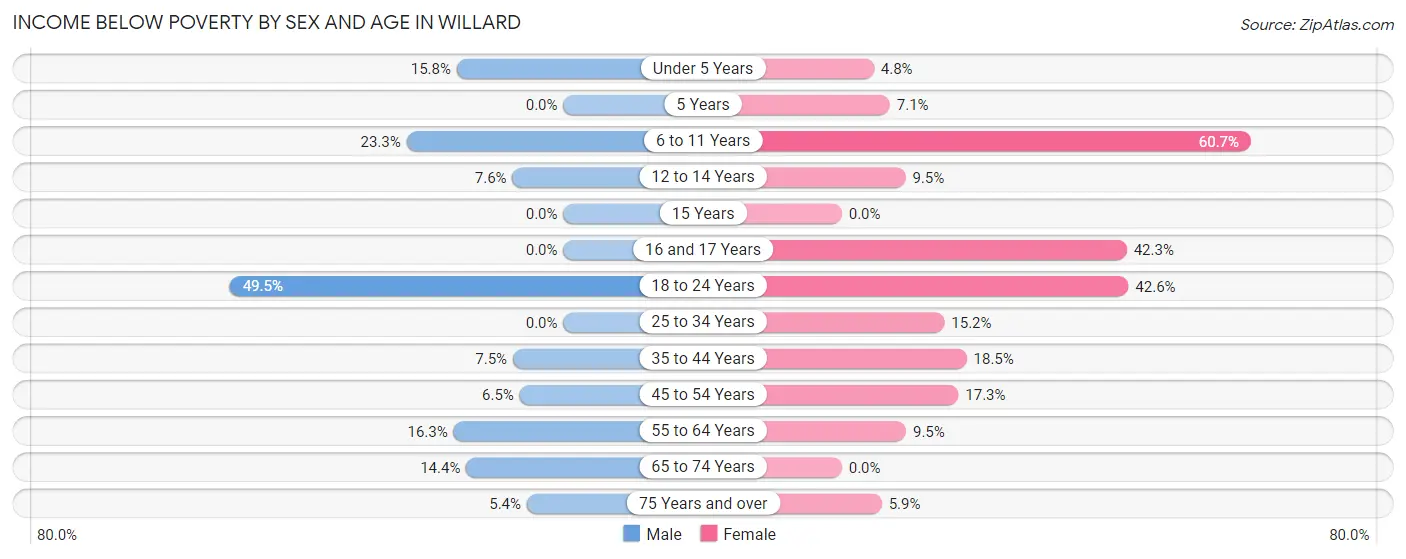
Income Below Poverty by Sex and Age in Willard
With 13.9% poverty level for males and 19.5% for females among the residents of Willard, 18 to 24 year old males and 6 to 11 year old females are the most vulnerable to poverty, with 160 males (49.5%) and 229 females (60.7%) in their respective age groups living below the poverty level.
| Age Bracket | Male | Female |
| Under 5 Years | 25 (15.8%) | 16 (4.8%) |
| 5 Years | 0 (0.0%) | 2 (7.1%) |
| 6 to 11 Years | 71 (23.3%) | 229 (60.7%) |
| 12 to 14 Years | 9 (7.6%) | 7 (9.5%) |
| 15 Years | 0 (0.0%) | 0 (0.0%) |
| 16 and 17 Years | 0 (0.0%) | 11 (42.3%) |
| 18 to 24 Years | 160 (49.5%) | 103 (42.6%) |
| 25 to 34 Years | 0 (0.0%) | 67 (15.2%) |
| 35 to 44 Years | 25 (7.5%) | 96 (18.5%) |
| 45 to 54 Years | 15 (6.5%) | 49 (17.3%) |
| 55 to 64 Years | 37 (16.3%) | 37 (9.5%) |
| 65 to 74 Years | 30 (14.4%) | 0 (0.0%) |
| 75 Years and over | 18 (5.4%) | 20 (5.9%) |
| Total | 390 (13.9%) | 637 (19.5%) |
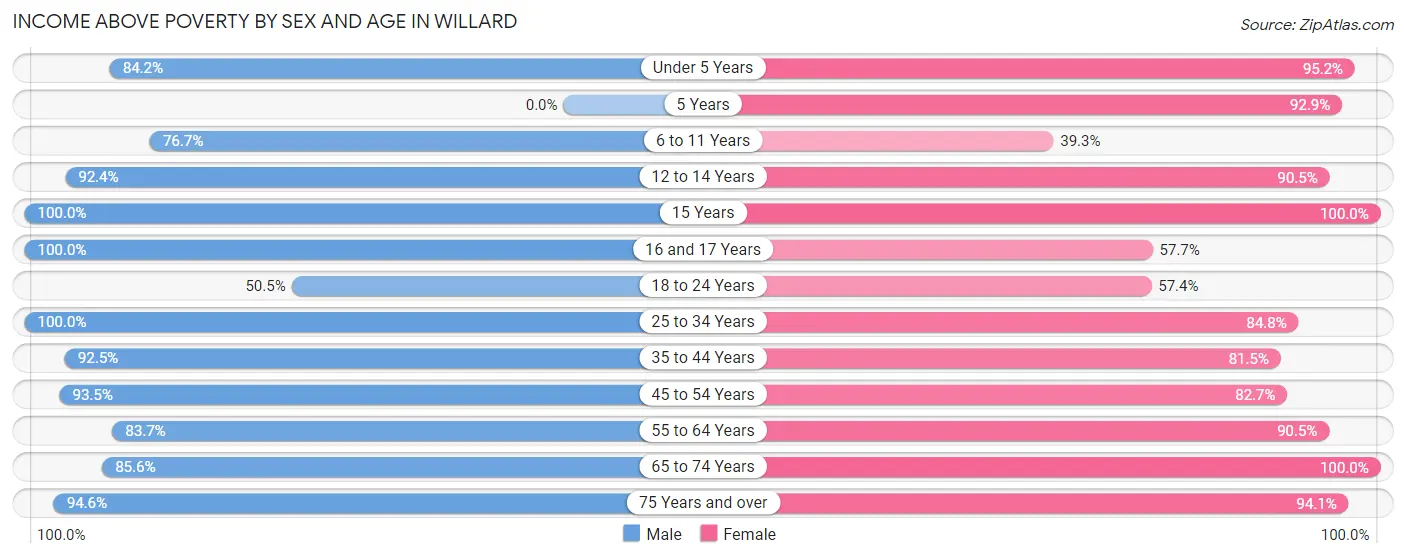
Income Above Poverty by Sex and Age in Willard
According to the poverty statistics in Willard, males aged 15 years and females aged 15 years are the age groups that are most secure financially, with 100.0% of males and 100.0% of females in these age groups living above the poverty line.
| Age Bracket | Male | Female |
| Under 5 Years | 133 (84.2%) | 320 (95.2%) |
| 5 Years | 0 (0.0%) | 26 (92.9%) |
| 6 to 11 Years | 234 (76.7%) | 148 (39.3%) |
| 12 to 14 Years | 110 (92.4%) | 67 (90.5%) |
| 15 Years | 102 (100.0%) | 49 (100.0%) |
| 16 and 17 Years | 48 (100.0%) | 15 (57.7%) |
| 18 to 24 Years | 163 (50.5%) | 139 (57.4%) |
| 25 to 34 Years | 416 (100.0%) | 373 (84.8%) |
| 35 to 44 Years | 309 (92.5%) | 422 (81.5%) |
| 45 to 54 Years | 216 (93.5%) | 234 (82.7%) |
| 55 to 64 Years | 190 (83.7%) | 351 (90.5%) |
| 65 to 74 Years | 178 (85.6%) | 175 (100.0%) |
| 75 Years and over | 314 (94.6%) | 317 (94.1%) |
| Total | 2,413 (86.1%) | 2,636 (80.5%) |
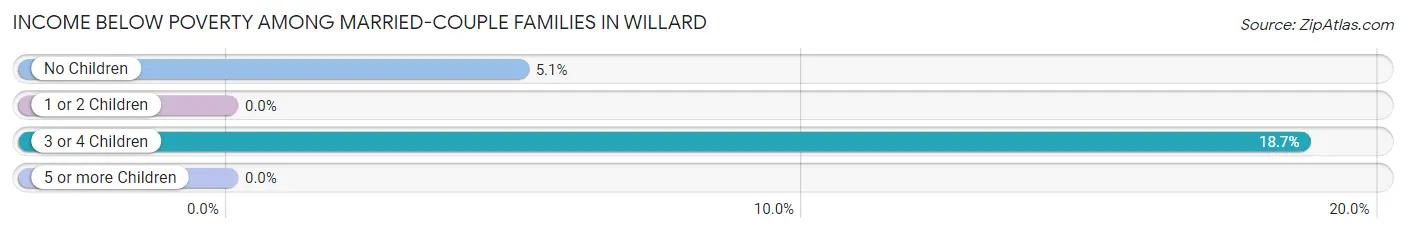
Income Below Poverty Among Married-Couple Families in Willard
The poverty statistics for married-couple families in Willard show that 4.2% or 37 of the total 886 families live below the poverty line. Families with 3 or 4 children have the highest poverty rate of 18.7%, comprising of 17 families. On the other hand, families with 1 or 2 children have the lowest poverty rate of 0.0%, which includes 0 families.
| Children | Above Poverty | Below Poverty |
| No Children | 375 (94.9%) | 20 (5.1%) |
| 1 or 2 Children | 400 (100.0%) | 0 (0.0%) |
| 3 or 4 Children | 74 (81.3%) | 17 (18.7%) |
| 5 or more Children | 0 (0.0%) | 0 (0.0%) |
| Total | 849 (95.8%) | 37 (4.2%) |
Income Below Poverty Among Single-Parent Households in Willard
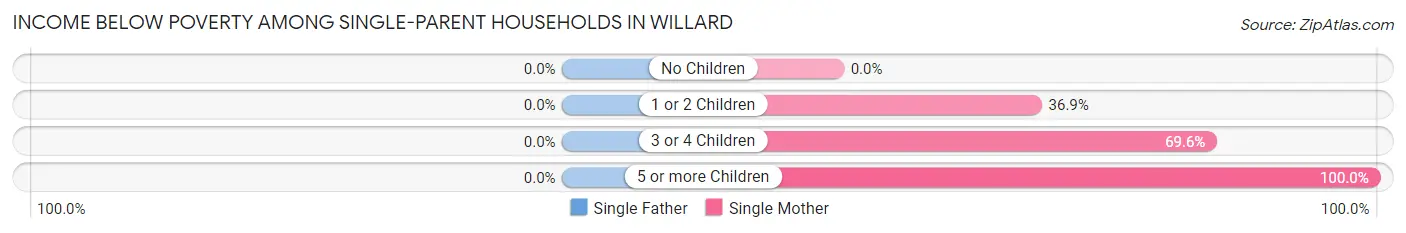
| Children | Single Father | Single Mother |
| No Children | 0 (0.0%) | 0 (0.0%) |
| 1 or 2 Children | 0 (0.0%) | 66 (36.9%) |
| 3 or 4 Children | 0 (0.0%) | 80 (69.6%) |
| 5 or more Children | 0 (0.0%) | 10 (100.0%) |
| Total | 0 (0.0%) | 156 (36.9%) |
Income Below Poverty Among Married-Couple vs Single-Parent Households in Willard
The poverty data for Willard shows that 37 of the married-couple family households (4.2%) and 156 of the single-parent households (29.0%) are living below the poverty level. Within the married-couple family households, those with 3 or 4 children have the highest poverty rate, with 17 households (18.7%) falling below the poverty line. Among the single-parent households, those with 5 or more children have the highest poverty rate, with 10 household (100.0%) living below poverty.
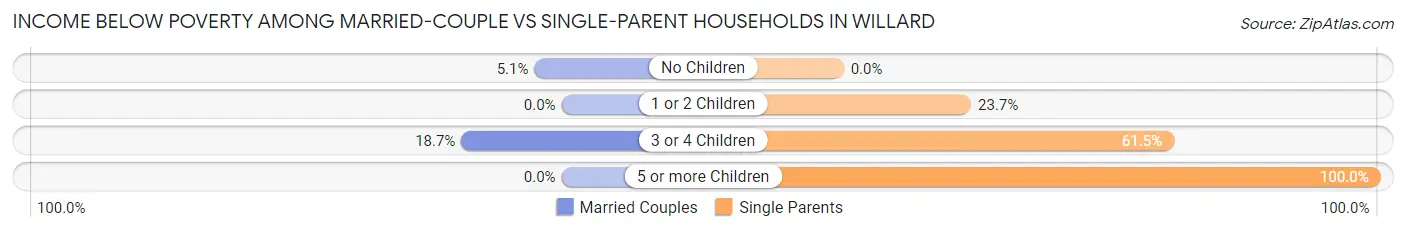
| Children | Married-Couple Families | Single-Parent Households |
| No Children | 20 (5.1%) | 0 (0.0%) |
| 1 or 2 Children | 0 (0.0%) | 66 (23.7%) |
| 3 or 4 Children | 17 (18.7%) | 80 (61.5%) |
| 5 or more Children | 0 (0.0%) | 10 (100.0%) |
| Total | 37 (4.2%) | 156 (29.0%) |
Employment Characteristics in Willard
Employment by Class of Employer in Willard
Among the 2,548 employed individuals in Willard, private company employees (1,883 | 73.9%), not-for-profit organizations (270 | 10.6%), and local government employees (219 | 8.6%) make up the most common classes of employment.
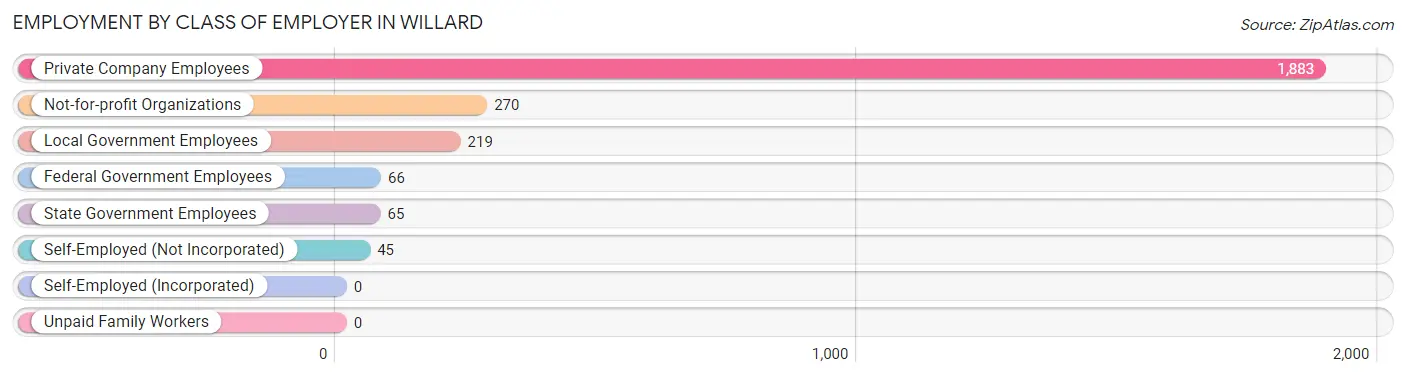
| Employer Class | # Employees | % Employees |
| Private Company Employees | 1,883 | 73.9% |
| Self-Employed (Incorporated) | 0 | 0.0% |
| Self-Employed (Not Incorporated) | 45 | 1.8% |
| Not-for-profit Organizations | 270 | 10.6% |
| Local Government Employees | 219 | 8.6% |
| State Government Employees | 65 | 2.5% |
| Federal Government Employees | 66 | 2.6% |
| Unpaid Family Workers | 0 | 0.0% |
| Total | 2,548 | 100.0% |
Employment Status by Age in Willard
According to the labor force statistics for Willard, out of the total population over 16 years of age (4,641), 58.3% or 2,706 individuals are in the labor force, with 4.1% or 111 of them unemployed. The age group with the highest labor force participation rate is 35 to 44 years, with 91.9% or 796 individuals in the labor force. Within the labor force, the 60 to 64 years age range has the highest percentage of unemployed individuals, with 16.8% or 28 of them being unemployed.
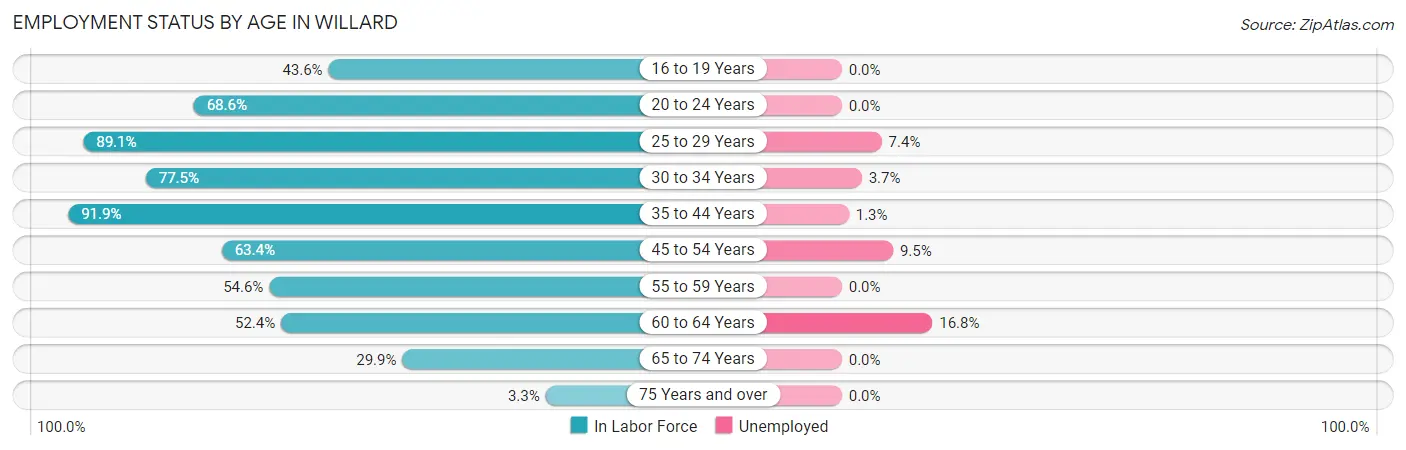
| Age Bracket | In Labor Force | Unemployed |
| 16 to 19 Years | 116 (43.6%) | 0 (0.0%) |
| 20 to 24 Years | 256 (68.6%) | 0 (0.0%) |
| 25 to 29 Years | 419 (89.1%) | 31 (7.4%) |
| 30 to 34 Years | 299 (77.5%) | 11 (3.7%) |
| 35 to 44 Years | 796 (91.9%) | 10 (1.3%) |
| 45 to 54 Years | 326 (63.4%) | 31 (9.5%) |
| 55 to 59 Years | 185 (54.6%) | 0 (0.0%) |
| 60 to 64 Years | 167 (52.4%) | 28 (16.8%) |
| 65 to 74 Years | 116 (29.9%) | 0 (0.0%) |
| 75 Years and over | 24 (3.3%) | 0 (0.0%) |
| Total | 2,706 (58.3%) | 111 (4.1%) |
Employment Status by Educational Attainment in Willard
According to labor force statistics for Willard, 75.7% of individuals (2,191) out of the total population between 25 and 64 years of age (2,894) are in the labor force, with 5.1% or 112 of them being unemployed. The group with the highest labor force participation rate are those with the educational attainment of bachelor's degree or higher, with 97.5% or 358 individuals in the labor force. Within the labor force, individuals with less than high school education have the highest percentage of unemployment, with 13.7% or 37 of them being unemployed.
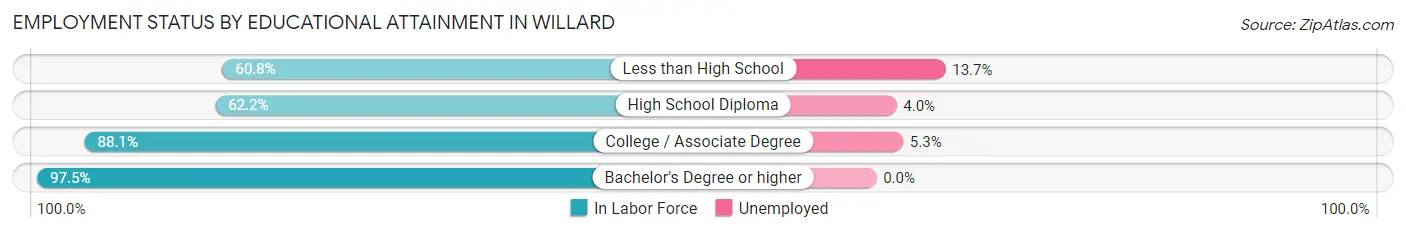
| Educational Attainment | In Labor Force | Unemployed |
| Less than High School | 270 (60.8%) | 61 (13.7%) |
| High School Diploma | 652 (62.2%) | 42 (4.0%) |
| College / Associate Degree | 911 (88.1%) | 55 (5.3%) |
| Bachelor's Degree or higher | 358 (97.5%) | 0 (0.0%) |
| Total | 2,191 (75.7%) | 148 (5.1%) |
Employment Occupations by Sex in Willard
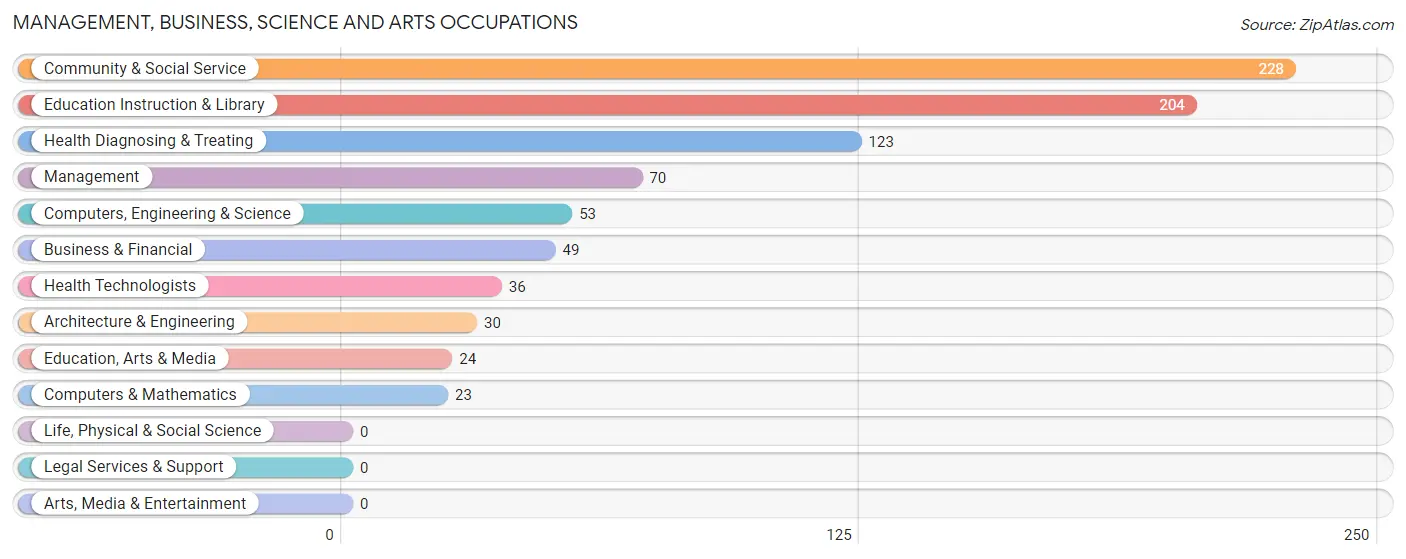
Management, Business, Science and Arts Occupations
The most common Management, Business, Science and Arts occupations in Willard are Community & Social Service (228 | 8.8%), Education Instruction & Library (204 | 7.9%), Health Diagnosing & Treating (123 | 4.7%), Management (70 | 2.7%), and Computers, Engineering & Science (53 | 2.0%).
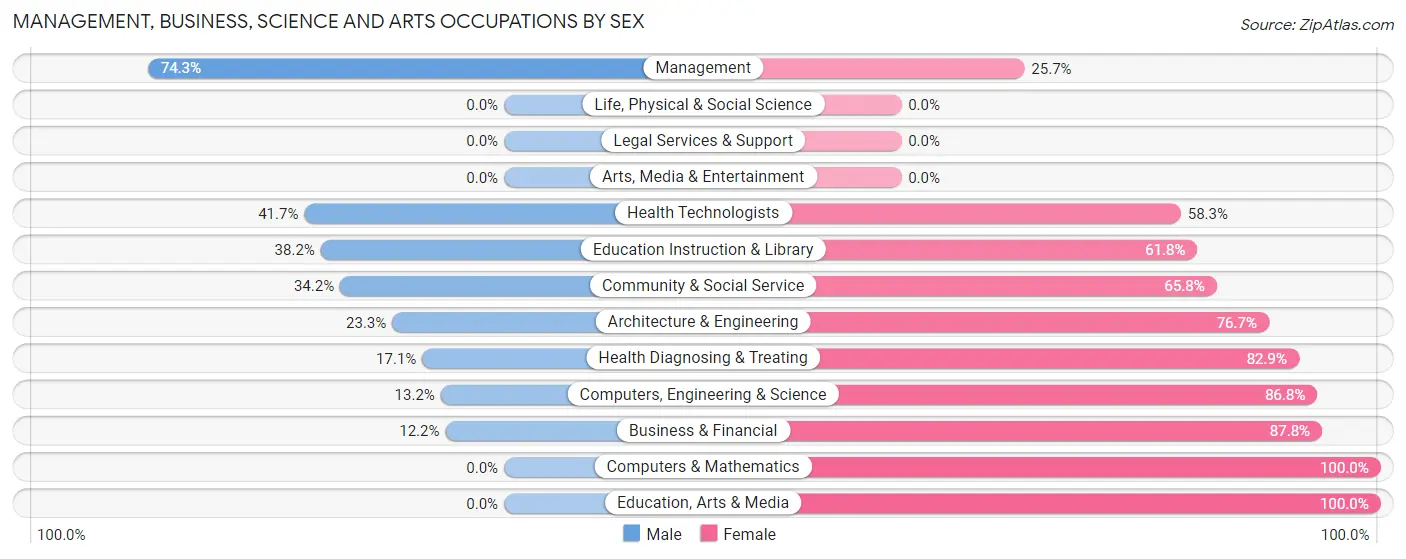
Management, Business, Science and Arts Occupations by Sex
Within the Management, Business, Science and Arts occupations in Willard, the most male-oriented occupations are Management (74.3%), Health Technologists (41.7%), and Education Instruction & Library (38.2%), while the most female-oriented occupations are Computers & Mathematics (100.0%), Education, Arts & Media (100.0%), and Business & Financial (87.8%).
| Occupation | Male | Female |
| Management | 52 (74.3%) | 18 (25.7%) |
| Business & Financial | 6 (12.2%) | 43 (87.8%) |
| Computers, Engineering & Science | 7 (13.2%) | 46 (86.8%) |
| Computers & Mathematics | 0 (0.0%) | 23 (100.0%) |
| Architecture & Engineering | 7 (23.3%) | 23 (76.7%) |
| Life, Physical & Social Science | 0 (0.0%) | 0 (0.0%) |
| Community & Social Service | 78 (34.2%) | 150 (65.8%) |
| Education, Arts & Media | 0 (0.0%) | 24 (100.0%) |
| Legal Services & Support | 0 (0.0%) | 0 (0.0%) |
| Education Instruction & Library | 78 (38.2%) | 126 (61.8%) |
| Arts, Media & Entertainment | 0 (0.0%) | 0 (0.0%) |
| Health Diagnosing & Treating | 21 (17.1%) | 102 (82.9%) |
| Health Technologists | 15 (41.7%) | 21 (58.3%) |
| Total (Category) | 164 (31.4%) | 359 (68.6%) |
| Total (Overall) | 1,242 (47.9%) | 1,351 (52.1%) |
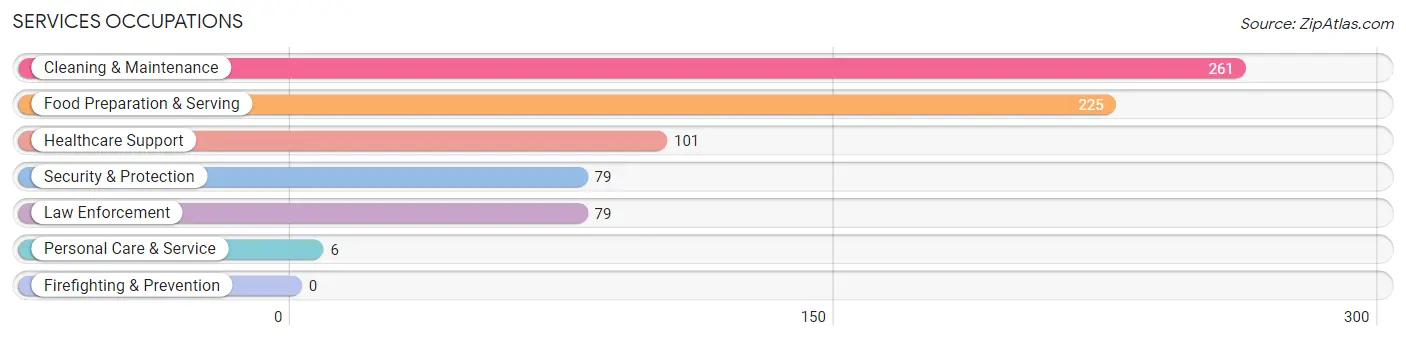
Services Occupations
The most common Services occupations in Willard are Cleaning & Maintenance (261 | 10.1%), Food Preparation & Serving (225 | 8.7%), Healthcare Support (101 | 3.9%), Security & Protection (79 | 3.0%), and Law Enforcement (79 | 3.0%).
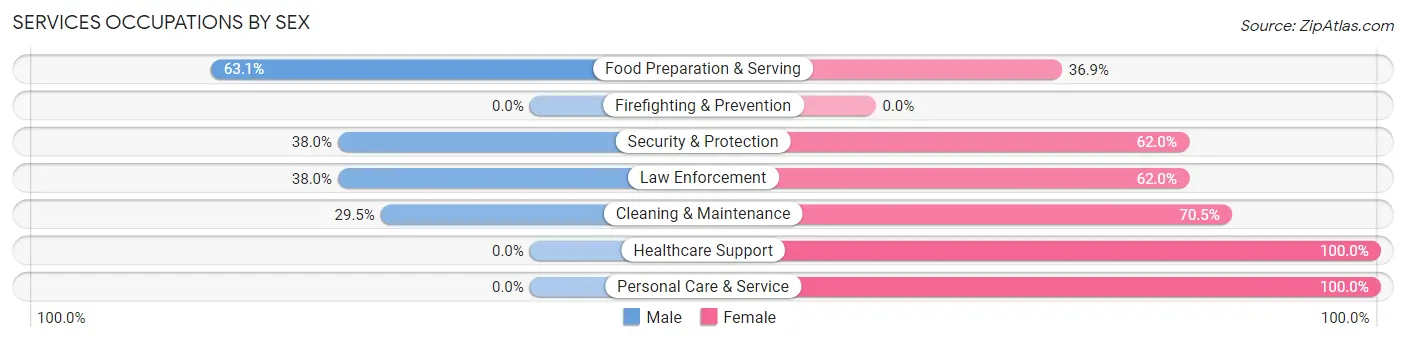
Services Occupations by Sex
Within the Services occupations in Willard, the most male-oriented occupations are Food Preparation & Serving (63.1%), Security & Protection (38.0%), and Law Enforcement (38.0%), while the most female-oriented occupations are Healthcare Support (100.0%), Personal Care & Service (100.0%), and Cleaning & Maintenance (70.5%).
| Occupation | Male | Female |
| Healthcare Support | 0 (0.0%) | 101 (100.0%) |
| Security & Protection | 30 (38.0%) | 49 (62.0%) |
| Firefighting & Prevention | 0 (0.0%) | 0 (0.0%) |
| Law Enforcement | 30 (38.0%) | 49 (62.0%) |
| Food Preparation & Serving | 142 (63.1%) | 83 (36.9%) |
| Cleaning & Maintenance | 77 (29.5%) | 184 (70.5%) |
| Personal Care & Service | 0 (0.0%) | 6 (100.0%) |
| Total (Category) | 249 (37.0%) | 423 (62.9%) |
| Total (Overall) | 1,242 (47.9%) | 1,351 (52.1%) |
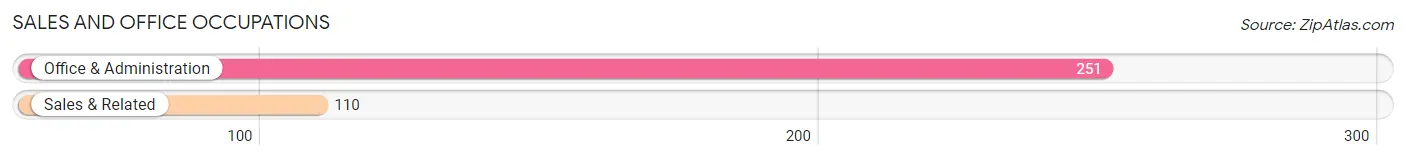
Sales and Office Occupations
The most common Sales and Office occupations in Willard are Office & Administration (251 | 9.7%), and Sales & Related (110 | 4.2%).
Sales and Office Occupations by Sex
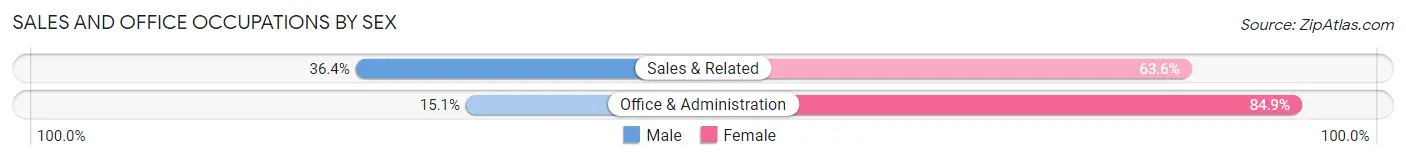
| Occupation | Male | Female |
| Sales & Related | 40 (36.4%) | 70 (63.6%) |
| Office & Administration | 38 (15.1%) | 213 (84.9%) |
| Total (Category) | 78 (21.6%) | 283 (78.4%) |
| Total (Overall) | 1,242 (47.9%) | 1,351 (52.1%) |
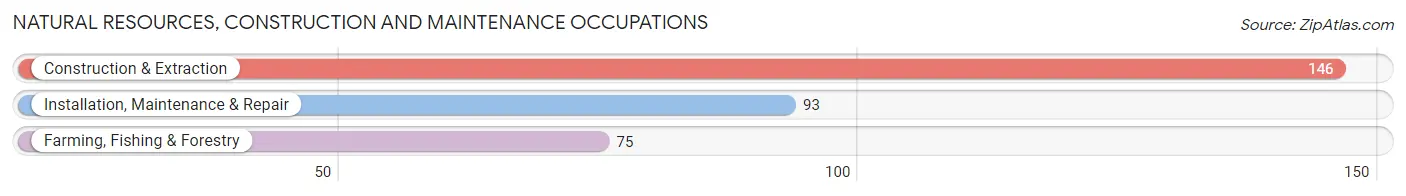
Natural Resources, Construction and Maintenance Occupations
The most common Natural Resources, Construction and Maintenance occupations in Willard are Construction & Extraction (146 | 5.6%), Installation, Maintenance & Repair (93 | 3.6%), and Farming, Fishing & Forestry (75 | 2.9%).
Natural Resources, Construction and Maintenance Occupations by Sex
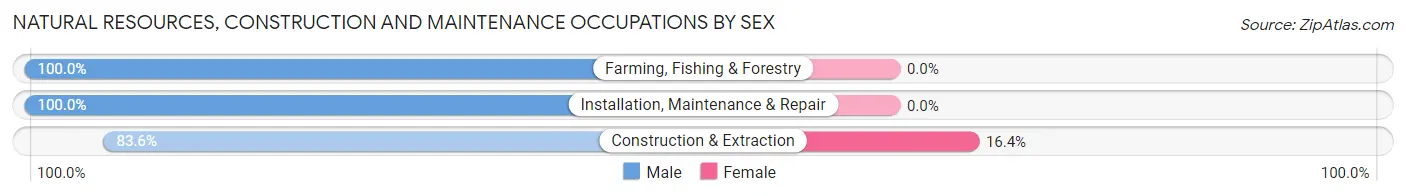
| Occupation | Male | Female |
| Farming, Fishing & Forestry | 75 (100.0%) | 0 (0.0%) |
| Construction & Extraction | 122 (83.6%) | 24 (16.4%) |
| Installation, Maintenance & Repair | 93 (100.0%) | 0 (0.0%) |
| Total (Category) | 290 (92.4%) | 24 (7.6%) |
| Total (Overall) | 1,242 (47.9%) | 1,351 (52.1%) |
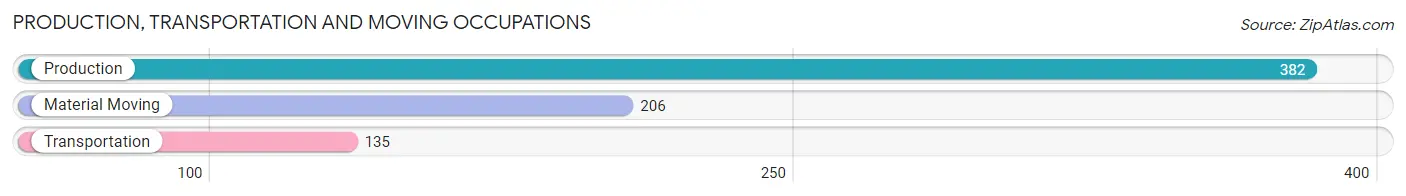
Production, Transportation and Moving Occupations
The most common Production, Transportation and Moving occupations in Willard are Production (382 | 14.7%), Material Moving (206 | 7.9%), and Transportation (135 | 5.2%).
Production, Transportation and Moving Occupations by Sex
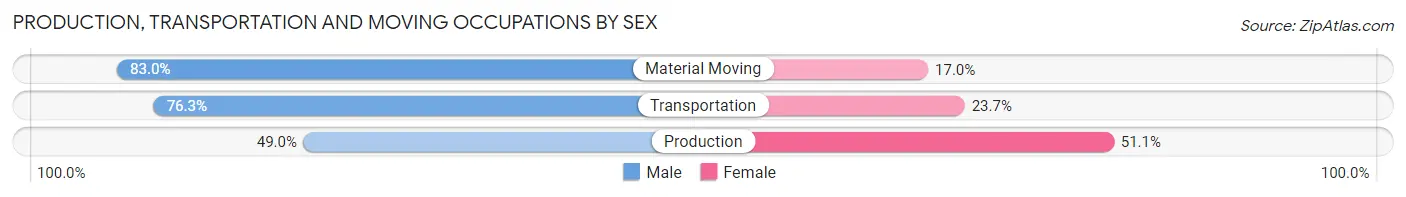
| Occupation | Male | Female |
| Production | 187 (48.9%) | 195 (51.0%) |
| Transportation | 103 (76.3%) | 32 (23.7%) |
| Material Moving | 171 (83.0%) | 35 (17.0%) |
| Total (Category) | 461 (63.8%) | 262 (36.2%) |
| Total (Overall) | 1,242 (47.9%) | 1,351 (52.1%) |
Employment Industries by Sex in Willard
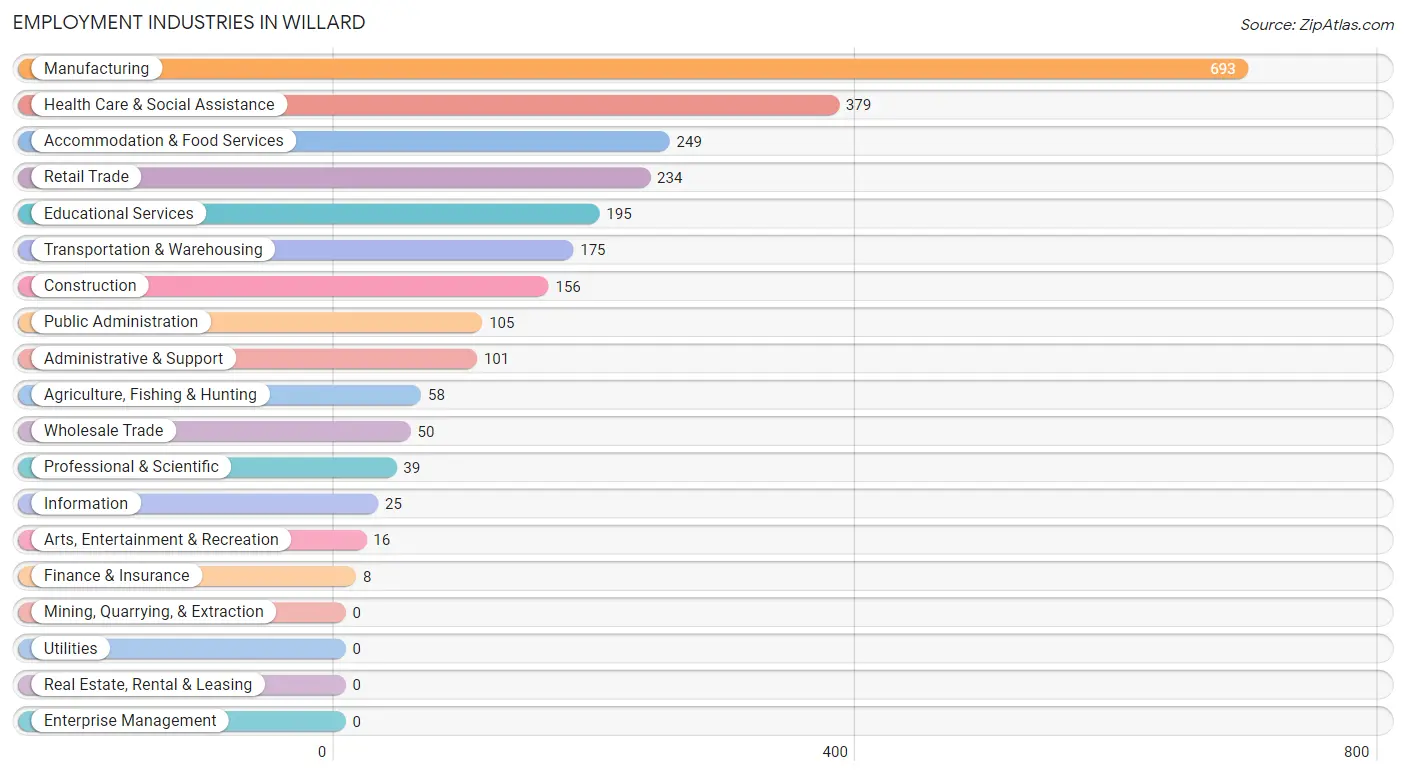
Employment Industries in Willard
The major employment industries in Willard include Manufacturing (693 | 26.7%), Health Care & Social Assistance (379 | 14.6%), Accommodation & Food Services (249 | 9.6%), Retail Trade (234 | 9.0%), and Educational Services (195 | 7.5%).
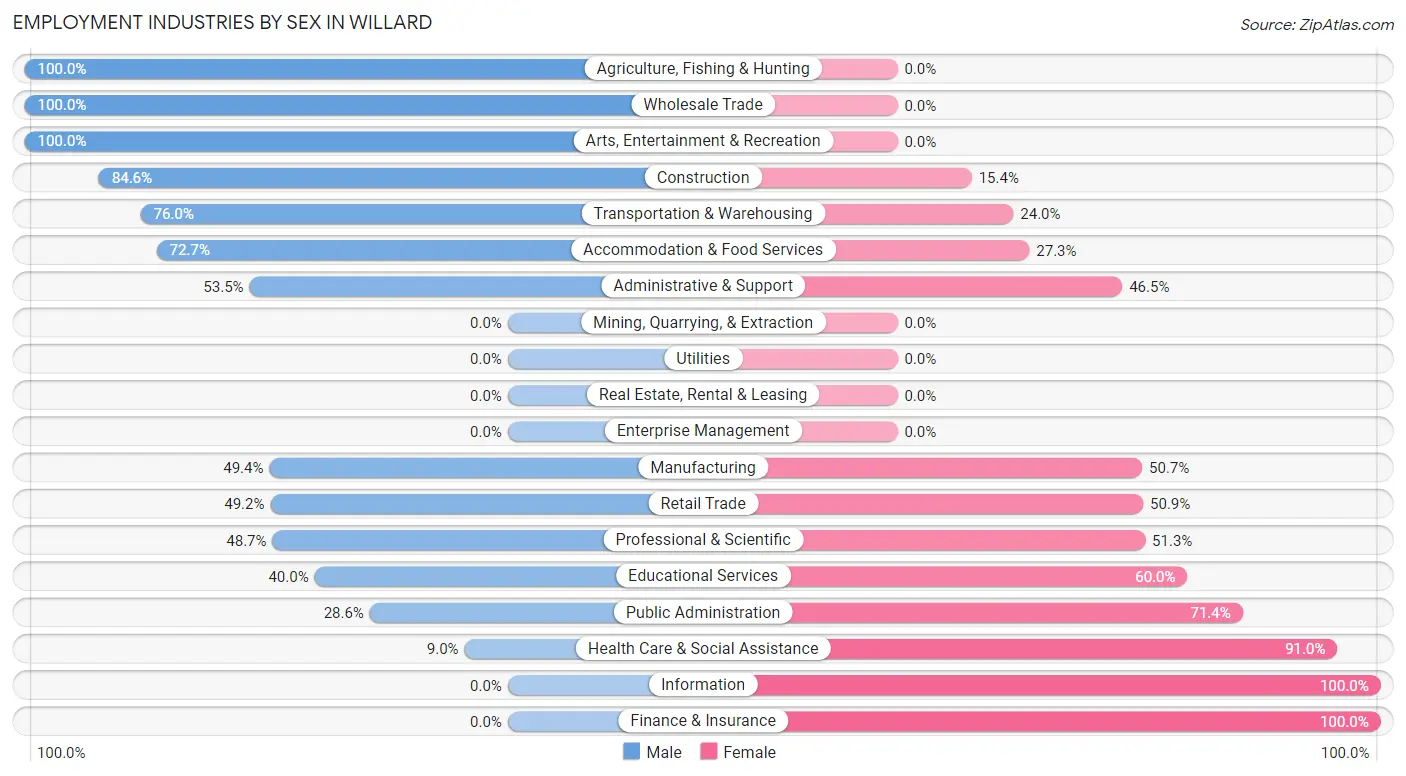
Employment Industries by Sex in Willard
The Willard industries that see more men than women are Agriculture, Fishing & Hunting (100.0%), Wholesale Trade (100.0%), and Arts, Entertainment & Recreation (100.0%), whereas the industries that tend to have a higher number of women are Information (100.0%), Finance & Insurance (100.0%), and Health Care & Social Assistance (91.0%).
| Industry | Male | Female |
| Agriculture, Fishing & Hunting | 58 (100.0%) | 0 (0.0%) |
| Mining, Quarrying, & Extraction | 0 (0.0%) | 0 (0.0%) |
| Construction | 132 (84.6%) | 24 (15.4%) |
| Manufacturing | 342 (49.3%) | 351 (50.6%) |
| Wholesale Trade | 50 (100.0%) | 0 (0.0%) |
| Retail Trade | 115 (49.1%) | 119 (50.8%) |
| Transportation & Warehousing | 133 (76.0%) | 42 (24.0%) |
| Utilities | 0 (0.0%) | 0 (0.0%) |
| Information | 0 (0.0%) | 25 (100.0%) |
| Finance & Insurance | 0 (0.0%) | 8 (100.0%) |
| Real Estate, Rental & Leasing | 0 (0.0%) | 0 (0.0%) |
| Professional & Scientific | 19 (48.7%) | 20 (51.3%) |
| Enterprise Management | 0 (0.0%) | 0 (0.0%) |
| Administrative & Support | 54 (53.5%) | 47 (46.5%) |
| Educational Services | 78 (40.0%) | 117 (60.0%) |
| Health Care & Social Assistance | 34 (9.0%) | 345 (91.0%) |
| Arts, Entertainment & Recreation | 16 (100.0%) | 0 (0.0%) |
| Accommodation & Food Services | 181 (72.7%) | 68 (27.3%) |
| Public Administration | 30 (28.6%) | 75 (71.4%) |
| Total | 1,242 (47.9%) | 1,351 (52.1%) |
Education in Willard
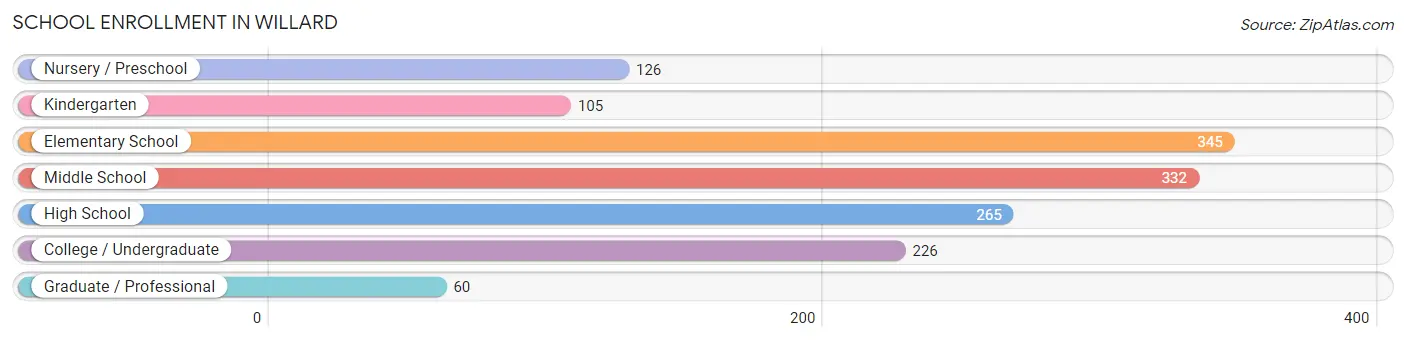
School Enrollment in Willard
The most common levels of schooling among the 1,459 students in Willard are elementary school (345 | 23.6%), middle school (332 | 22.8%), and high school (265 | 18.2%).
| School Level | # Students | % Students |
| Nursery / Preschool | 126 | 8.6% |
| Kindergarten | 105 | 7.2% |
| Elementary School | 345 | 23.6% |
| Middle School | 332 | 22.8% |
| High School | 265 | 18.2% |
| College / Undergraduate | 226 | 15.5% |
| Graduate / Professional | 60 | 4.1% |
| Total | 1,459 | 100.0% |
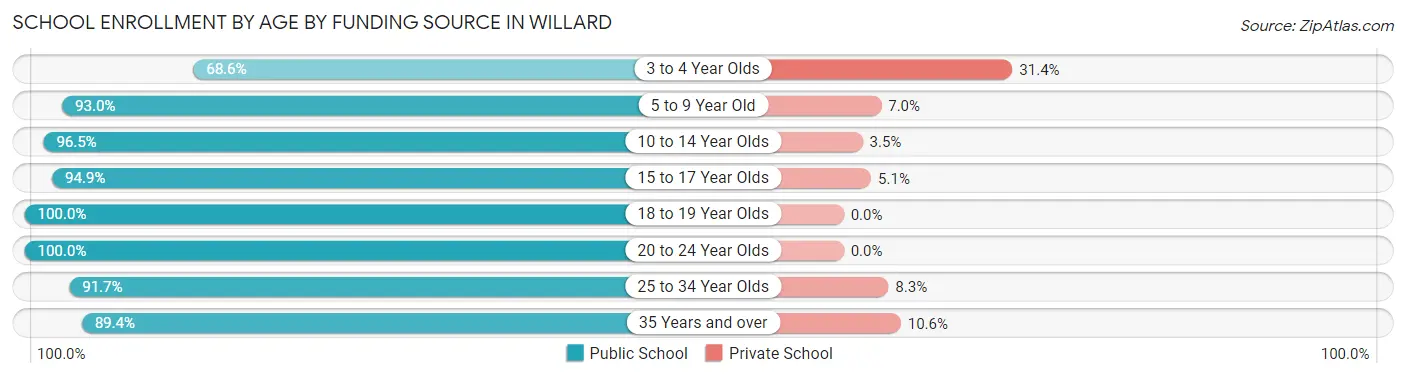
School Enrollment by Age by Funding Source in Willard
Out of a total of 1,459 students who are enrolled in schools in Willard, 105 (7.2%) attend a private institution, while the remaining 1,354 (92.8%) are enrolled in public schools. The age group of 3 to 4 year olds has the highest likelihood of being enrolled in private schools, with 44 (31.4% in the age bracket) enrolled. Conversely, the age group of 18 to 19 year olds has the lowest likelihood of being enrolled in a private school, with 94 (100.0% in the age bracket) attending a public institution.
| Age Bracket | Public School | Private School |
| 3 to 4 Year Olds | 96 (68.6%) | 44 (31.4%) |
| 5 to 9 Year Old | 279 (93.0%) | 21 (7.0%) |
| 10 to 14 Year Olds | 411 (96.5%) | 15 (3.5%) |
| 15 to 17 Year Olds | 204 (94.9%) | 11 (5.1%) |
| 18 to 19 Year Olds | 94 (100.0%) | 0 (0.0%) |
| 20 to 24 Year Olds | 129 (100.0%) | 0 (0.0%) |
| 25 to 34 Year Olds | 99 (91.7%) | 9 (8.3%) |
| 35 Years and over | 42 (89.4%) | 5 (10.6%) |
| Total | 1,354 (92.8%) | 105 (7.2%) |
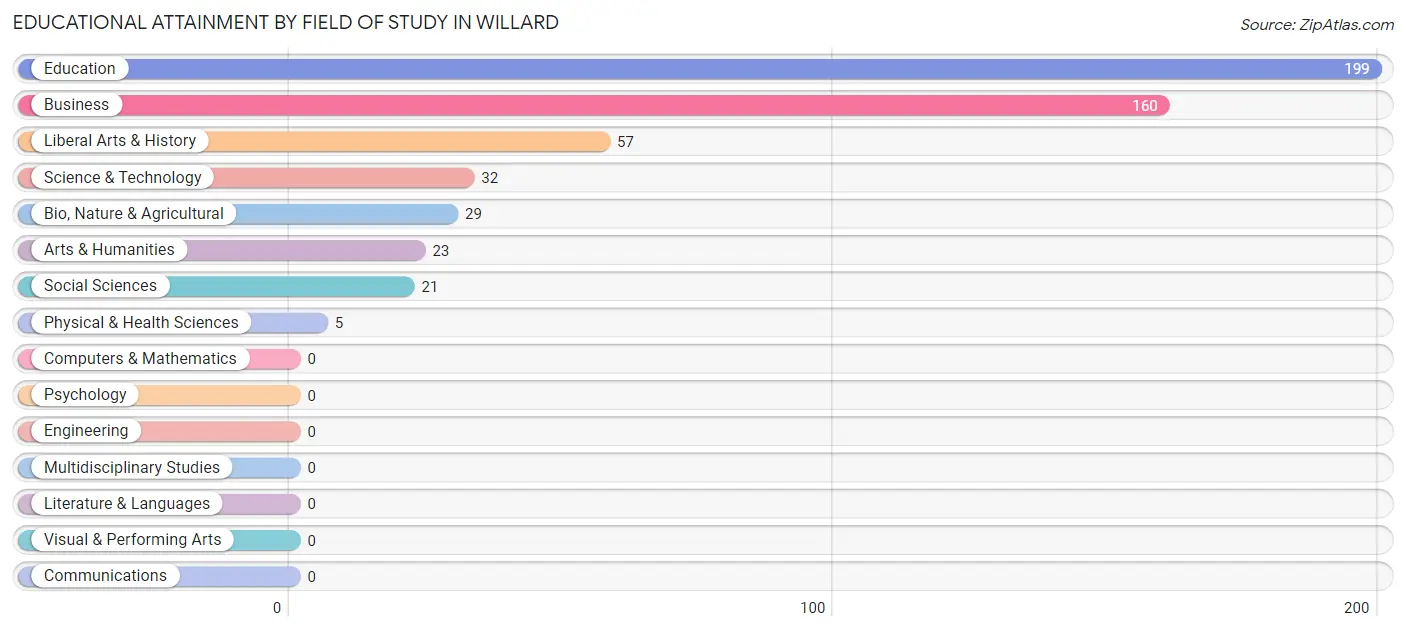
Educational Attainment by Field of Study in Willard
Education (199 | 37.8%), business (160 | 30.4%), liberal arts & history (57 | 10.8%), science & technology (32 | 6.1%), and bio, nature & agricultural (29 | 5.5%) are the most common fields of study among 526 individuals in Willard who have obtained a bachelor's degree or higher.
| Field of Study | # Graduates | % Graduates |
| Computers & Mathematics | 0 | 0.0% |
| Bio, Nature & Agricultural | 29 | 5.5% |
| Physical & Health Sciences | 5 | 0.9% |
| Psychology | 0 | 0.0% |
| Social Sciences | 21 | 4.0% |
| Engineering | 0 | 0.0% |
| Multidisciplinary Studies | 0 | 0.0% |
| Science & Technology | 32 | 6.1% |
| Business | 160 | 30.4% |
| Education | 199 | 37.8% |
| Literature & Languages | 0 | 0.0% |
| Liberal Arts & History | 57 | 10.8% |
| Visual & Performing Arts | 0 | 0.0% |
| Communications | 0 | 0.0% |
| Arts & Humanities | 23 | 4.4% |
| Total | 526 | 100.0% |
Transportation & Commute in Willard
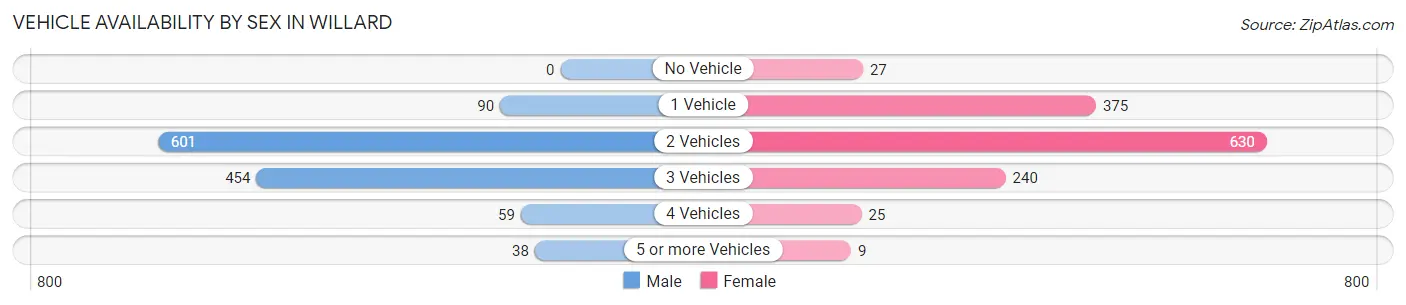
Vehicle Availability by Sex in Willard
The most prevalent vehicle ownership categories in Willard are males with 2 vehicles (601, accounting for 48.4%) and females with 2 vehicles (630, making up 46.0%).
| Vehicles Available | Male | Female |
| No Vehicle | 0 (0.0%) | 27 (2.1%) |
| 1 Vehicle | 90 (7.2%) | 375 (28.7%) |
| 2 Vehicles | 601 (48.4%) | 630 (48.2%) |
| 3 Vehicles | 454 (36.5%) | 240 (18.4%) |
| 4 Vehicles | 59 (4.8%) | 25 (1.9%) |
| 5 or more Vehicles | 38 (3.1%) | 9 (0.7%) |
| Total | 1,242 (100.0%) | 1,306 (100.0%) |
Commute Time in Willard
The most frequently occuring commute durations in Willard are 5 to 9 minutes (731 commuters, 28.7%), 10 to 14 minutes (341 commuters, 13.4%), and 30 to 34 minutes (315 commuters, 12.4%).
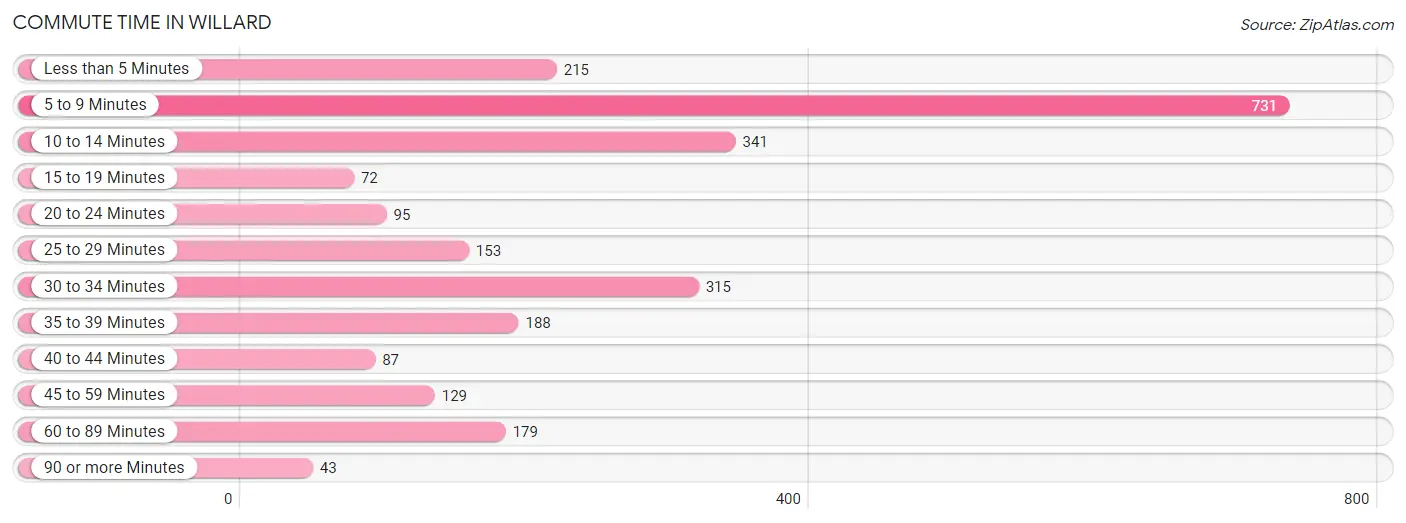
| Commute Time | # Commuters | % Commuters |
| Less than 5 Minutes | 215 | 8.4% |
| 5 to 9 Minutes | 731 | 28.7% |
| 10 to 14 Minutes | 341 | 13.4% |
| 15 to 19 Minutes | 72 | 2.8% |
| 20 to 24 Minutes | 95 | 3.7% |
| 25 to 29 Minutes | 153 | 6.0% |
| 30 to 34 Minutes | 315 | 12.4% |
| 35 to 39 Minutes | 188 | 7.4% |
| 40 to 44 Minutes | 87 | 3.4% |
| 45 to 59 Minutes | 129 | 5.1% |
| 60 to 89 Minutes | 179 | 7.0% |
| 90 or more Minutes | 43 | 1.7% |
Commute Time by Sex in Willard
The most common commute times in Willard are 5 to 9 minutes (333 commuters, 26.8%) for males and 5 to 9 minutes (398 commuters, 30.5%) for females.
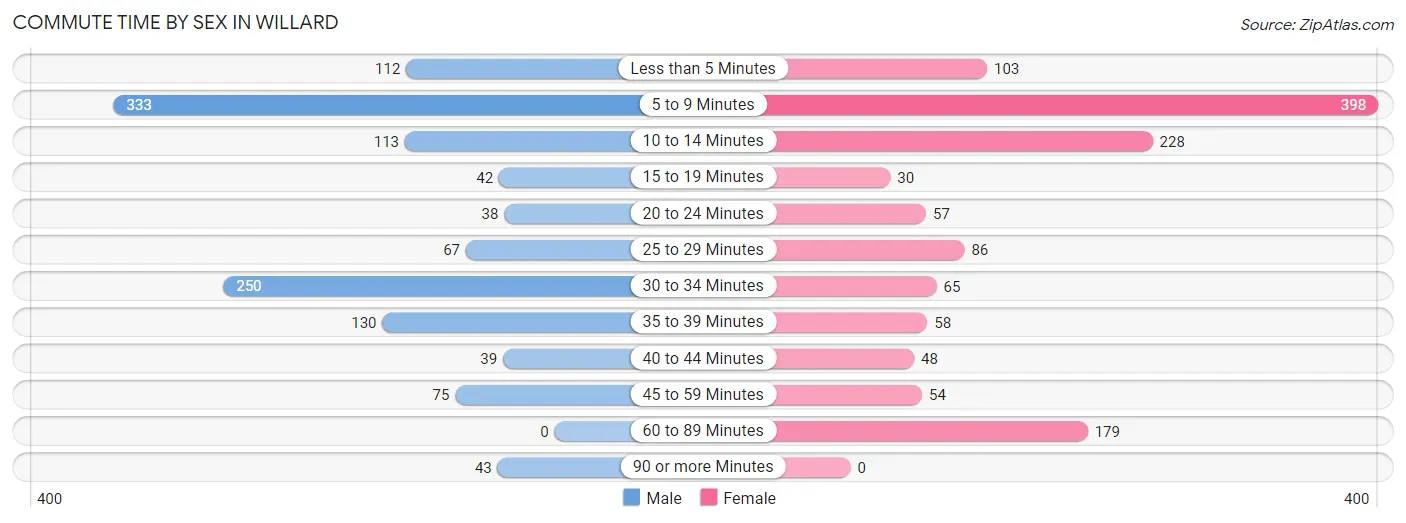
| Commute Time | Male | Female |
| Less than 5 Minutes | 112 (9.0%) | 103 (7.9%) |
| 5 to 9 Minutes | 333 (26.8%) | 398 (30.5%) |
| 10 to 14 Minutes | 113 (9.1%) | 228 (17.5%) |
| 15 to 19 Minutes | 42 (3.4%) | 30 (2.3%) |
| 20 to 24 Minutes | 38 (3.1%) | 57 (4.4%) |
| 25 to 29 Minutes | 67 (5.4%) | 86 (6.6%) |
| 30 to 34 Minutes | 250 (20.1%) | 65 (5.0%) |
| 35 to 39 Minutes | 130 (10.5%) | 58 (4.4%) |
| 40 to 44 Minutes | 39 (3.1%) | 48 (3.7%) |
| 45 to 59 Minutes | 75 (6.0%) | 54 (4.1%) |
| 60 to 89 Minutes | 0 (0.0%) | 179 (13.7%) |
| 90 or more Minutes | 43 (3.5%) | 0 (0.0%) |
Time of Departure to Work by Sex in Willard
The most frequent times of departure to work in Willard are 4:00 PM to 11:59 PM (250, 20.1%) for males and 6:30 AM to 6:59 AM (340, 26.0%) for females.
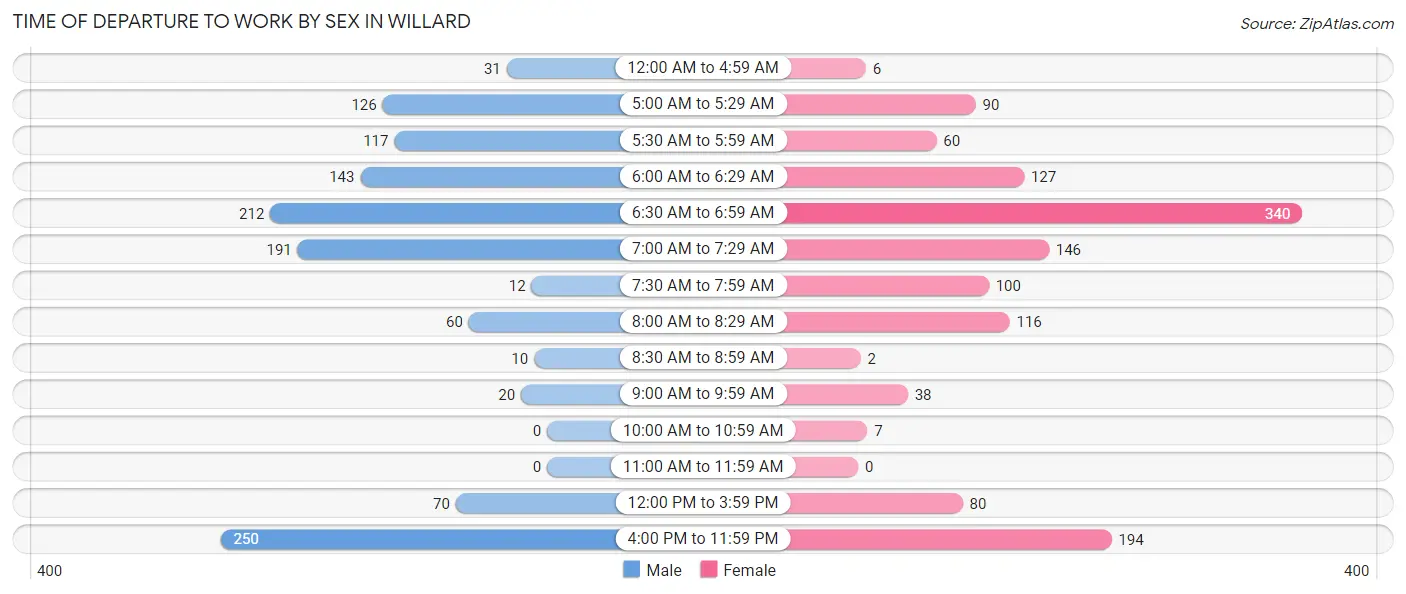
| Time of Departure | Male | Female |
| 12:00 AM to 4:59 AM | 31 (2.5%) | 6 (0.5%) |
| 5:00 AM to 5:29 AM | 126 (10.1%) | 90 (6.9%) |
| 5:30 AM to 5:59 AM | 117 (9.4%) | 60 (4.6%) |
| 6:00 AM to 6:29 AM | 143 (11.5%) | 127 (9.7%) |
| 6:30 AM to 6:59 AM | 212 (17.1%) | 340 (26.0%) |
| 7:00 AM to 7:29 AM | 191 (15.4%) | 146 (11.2%) |
| 7:30 AM to 7:59 AM | 12 (1.0%) | 100 (7.7%) |
| 8:00 AM to 8:29 AM | 60 (4.8%) | 116 (8.9%) |
| 8:30 AM to 8:59 AM | 10 (0.8%) | 2 (0.2%) |
| 9:00 AM to 9:59 AM | 20 (1.6%) | 38 (2.9%) |
| 10:00 AM to 10:59 AM | 0 (0.0%) | 7 (0.5%) |
| 11:00 AM to 11:59 AM | 0 (0.0%) | 0 (0.0%) |
| 12:00 PM to 3:59 PM | 70 (5.6%) | 80 (6.1%) |
| 4:00 PM to 11:59 PM | 250 (20.1%) | 194 (14.8%) |
| Total | 1,242 (100.0%) | 1,306 (100.0%) |
Housing Occupancy in Willard
Occupancy by Ownership in Willard
Of the total 2,425 dwellings in Willard, owner-occupied units account for 1,554 (64.1%), while renter-occupied units make up 871 (35.9%).
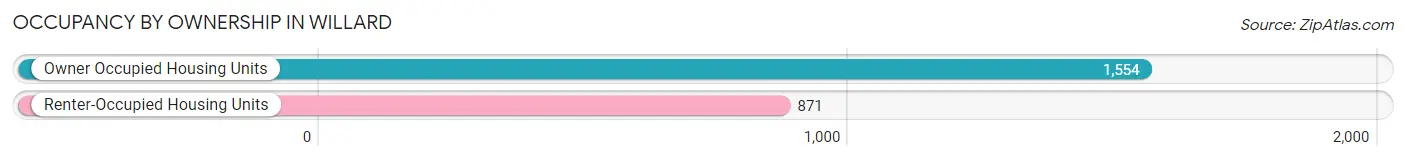
| Occupancy | # Housing Units | % Housing Units |
| Owner Occupied Housing Units | 1,554 | 64.1% |
| Renter-Occupied Housing Units | 871 | 35.9% |
| Total Occupied Housing Units | 2,425 | 100.0% |
Occupancy by Household Size in Willard
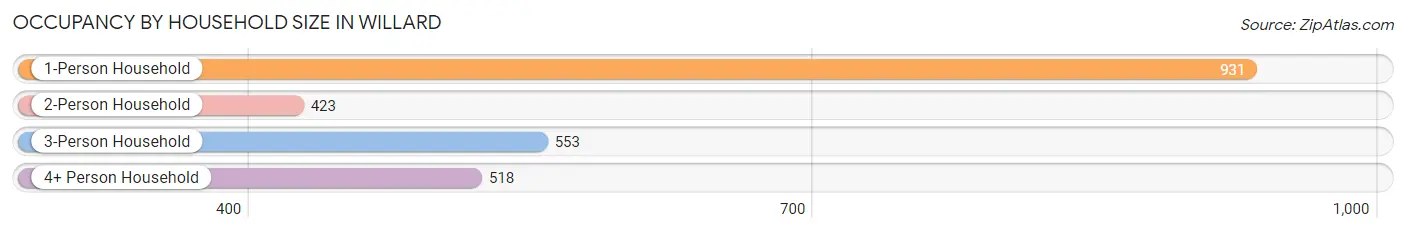
| Household Size | # Housing Units | % Housing Units |
| 1-Person Household | 931 | 38.4% |
| 2-Person Household | 423 | 17.4% |
| 3-Person Household | 553 | 22.8% |
| 4+ Person Household | 518 | 21.4% |
| Total Housing Units | 2,425 | 100.0% |
Occupancy by Ownership by Household Size in Willard
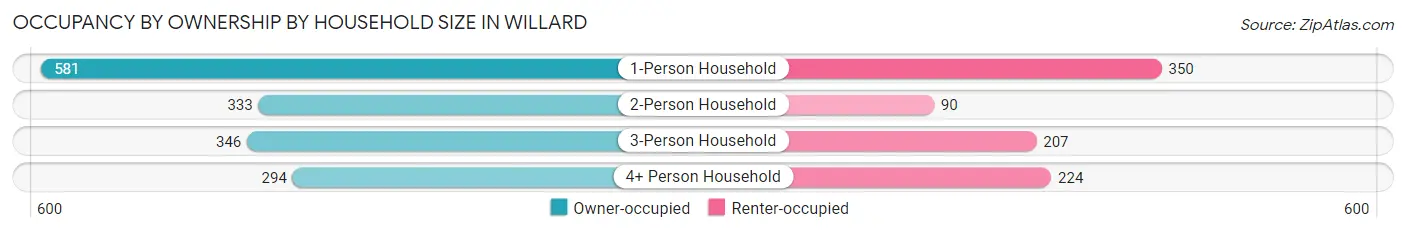
| Household Size | Owner-occupied | Renter-occupied |
| 1-Person Household | 581 (62.4%) | 350 (37.6%) |
| 2-Person Household | 333 (78.7%) | 90 (21.3%) |
| 3-Person Household | 346 (62.6%) | 207 (37.4%) |
| 4+ Person Household | 294 (56.8%) | 224 (43.2%) |
| Total Housing Units | 1,554 (64.1%) | 871 (35.9%) |
Occupancy by Educational Attainment in Willard
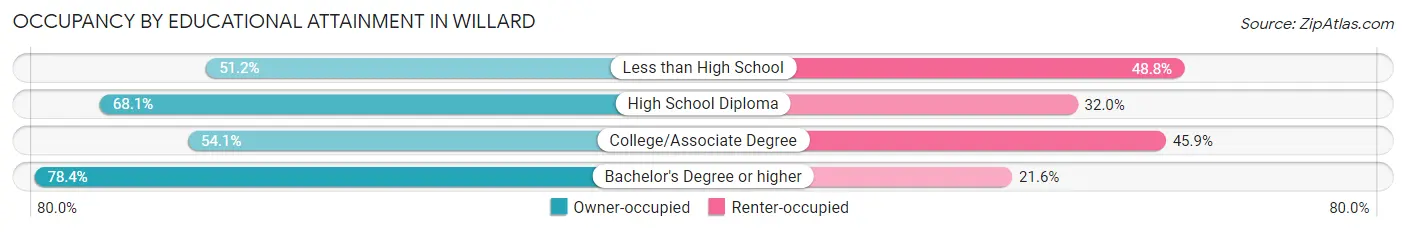
| Household Size | Owner-occupied | Renter-occupied |
| Less than High School | 150 (51.2%) | 143 (48.8%) |
| High School Diploma | 756 (68.0%) | 355 (32.0%) |
| College/Associate Degree | 339 (54.1%) | 288 (45.9%) |
| Bachelor's Degree or higher | 309 (78.4%) | 85 (21.6%) |
Occupancy by Age of Householder in Willard
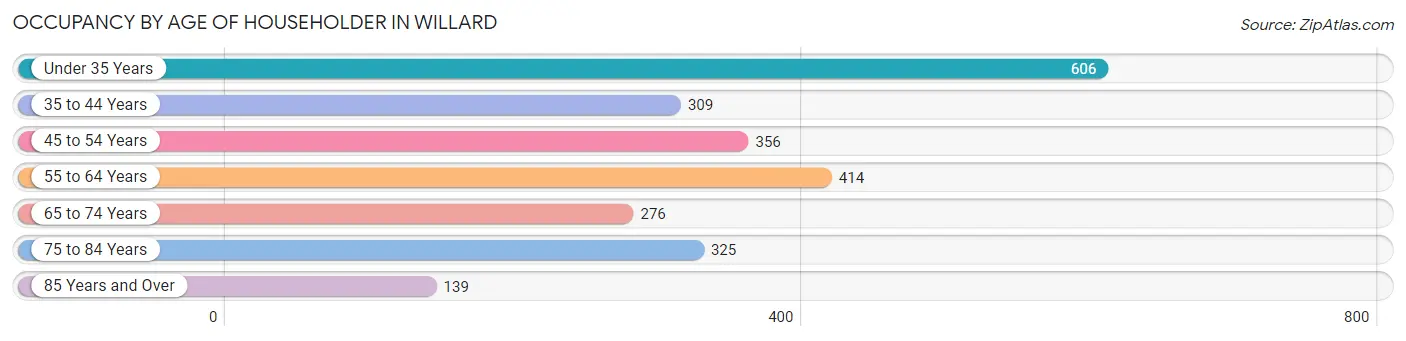
| Age Bracket | # Households | % Households |
| Under 35 Years | 606 | 25.0% |
| 35 to 44 Years | 309 | 12.7% |
| 45 to 54 Years | 356 | 14.7% |
| 55 to 64 Years | 414 | 17.1% |
| 65 to 74 Years | 276 | 11.4% |
| 75 to 84 Years | 325 | 13.4% |
| 85 Years and Over | 139 | 5.7% |
| Total | 2,425 | 100.0% |
Housing Finances in Willard
Median Income by Occupancy in Willard
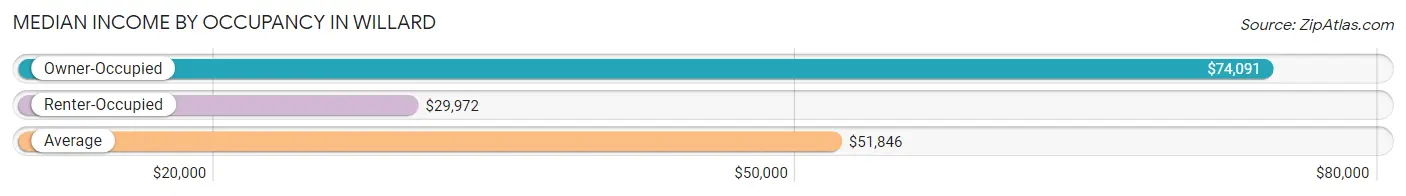
| Occupancy Type | # Households | Median Income |
| Owner-Occupied | 1,554 (64.1%) | $74,091 |
| Renter-Occupied | 871 (35.9%) | $29,972 |
| Average | 2,425 (100.0%) | $51,846 |
Occupancy by Householder Income Bracket in Willard
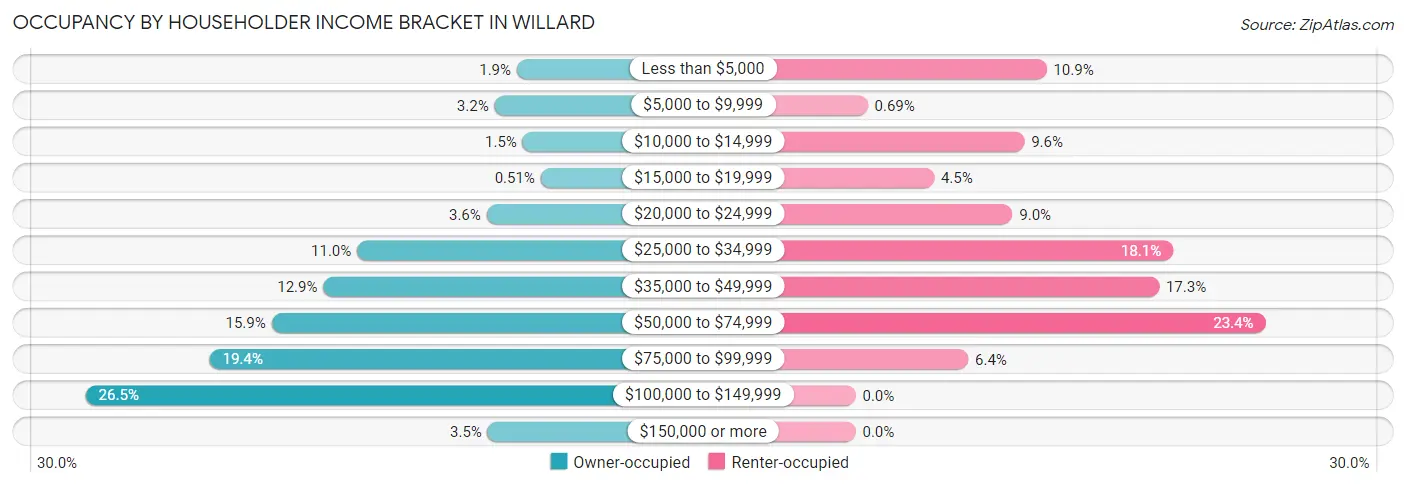
| Income Bracket | Owner-occupied | Renter-occupied |
| Less than $5,000 | 29 (1.9%) | 95 (10.9%) |
| $5,000 to $9,999 | 49 (3.2%) | 6 (0.7%) |
| $10,000 to $14,999 | 24 (1.5%) | 84 (9.6%) |
| $15,000 to $19,999 | 8 (0.5%) | 39 (4.5%) |
| $20,000 to $24,999 | 56 (3.6%) | 78 (9.0%) |
| $25,000 to $34,999 | 171 (11.0%) | 158 (18.1%) |
| $35,000 to $49,999 | 201 (12.9%) | 151 (17.3%) |
| $50,000 to $74,999 | 247 (15.9%) | 204 (23.4%) |
| $75,000 to $99,999 | 302 (19.4%) | 56 (6.4%) |
| $100,000 to $149,999 | 412 (26.5%) | 0 (0.0%) |
| $150,000 or more | 55 (3.5%) | 0 (0.0%) |
| Total | 1,554 (100.0%) | 871 (100.0%) |
Monthly Housing Cost Tiers in Willard
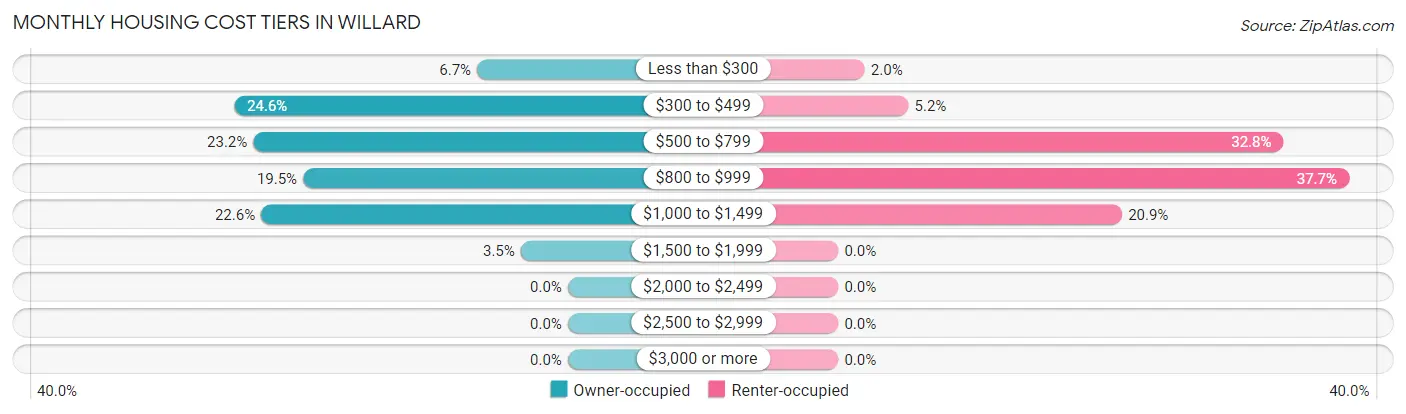
| Monthly Cost | Owner-occupied | Renter-occupied |
| Less than $300 | 104 (6.7%) | 17 (1.9%) |
| $300 to $499 | 382 (24.6%) | 45 (5.2%) |
| $500 to $799 | 360 (23.2%) | 286 (32.8%) |
| $800 to $999 | 303 (19.5%) | 328 (37.7%) |
| $1,000 to $1,499 | 351 (22.6%) | 182 (20.9%) |
| $1,500 to $1,999 | 54 (3.5%) | 0 (0.0%) |
| $2,000 to $2,499 | 0 (0.0%) | 0 (0.0%) |
| $2,500 to $2,999 | 0 (0.0%) | 0 (0.0%) |
| $3,000 or more | 0 (0.0%) | 0 (0.0%) |
| Total | 1,554 (100.0%) | 871 (100.0%) |
Physical Housing Characteristics in Willard
Housing Structures in Willard
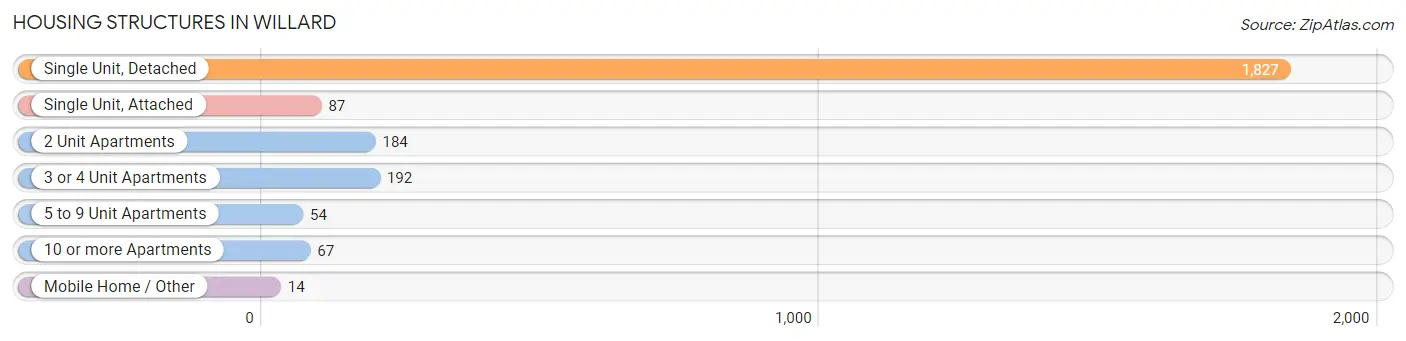
| Structure Type | # Housing Units | % Housing Units |
| Single Unit, Detached | 1,827 | 75.3% |
| Single Unit, Attached | 87 | 3.6% |
| 2 Unit Apartments | 184 | 7.6% |
| 3 or 4 Unit Apartments | 192 | 7.9% |
| 5 to 9 Unit Apartments | 54 | 2.2% |
| 10 or more Apartments | 67 | 2.8% |
| Mobile Home / Other | 14 | 0.6% |
| Total | 2,425 | 100.0% |
Housing Structures by Occupancy in Willard
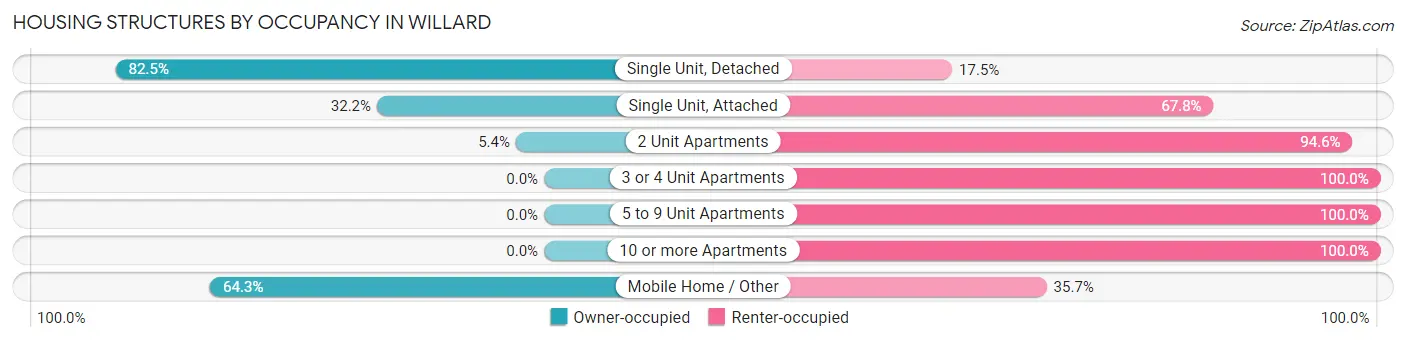
| Structure Type | Owner-occupied | Renter-occupied |
| Single Unit, Detached | 1,507 (82.5%) | 320 (17.5%) |
| Single Unit, Attached | 28 (32.2%) | 59 (67.8%) |
| 2 Unit Apartments | 10 (5.4%) | 174 (94.6%) |
| 3 or 4 Unit Apartments | 0 (0.0%) | 192 (100.0%) |
| 5 to 9 Unit Apartments | 0 (0.0%) | 54 (100.0%) |
| 10 or more Apartments | 0 (0.0%) | 67 (100.0%) |
| Mobile Home / Other | 9 (64.3%) | 5 (35.7%) |
| Total | 1,554 (64.1%) | 871 (35.9%) |
Housing Structures by Number of Rooms in Willard
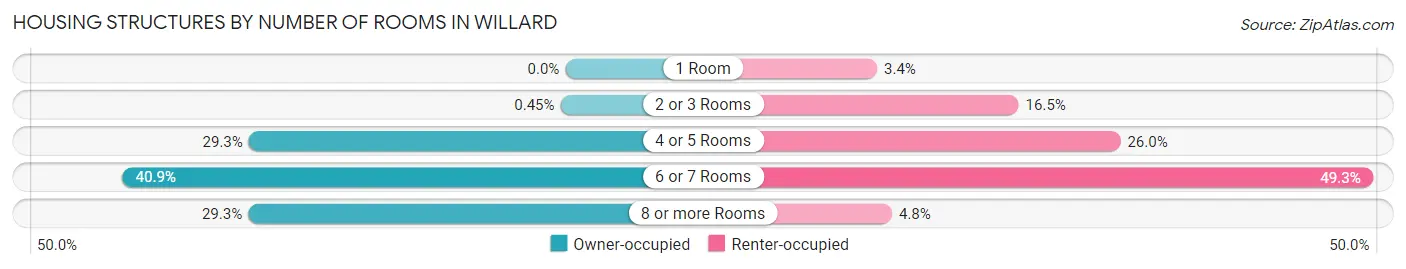
| Number of Rooms | Owner-occupied | Renter-occupied |
| 1 Room | 0 (0.0%) | 30 (3.4%) |
| 2 or 3 Rooms | 7 (0.4%) | 144 (16.5%) |
| 4 or 5 Rooms | 455 (29.3%) | 226 (26.0%) |
| 6 or 7 Rooms | 636 (40.9%) | 429 (49.2%) |
| 8 or more Rooms | 456 (29.3%) | 42 (4.8%) |
| Total | 1,554 (100.0%) | 871 (100.0%) |
Housing Structure by Heating Type in Willard
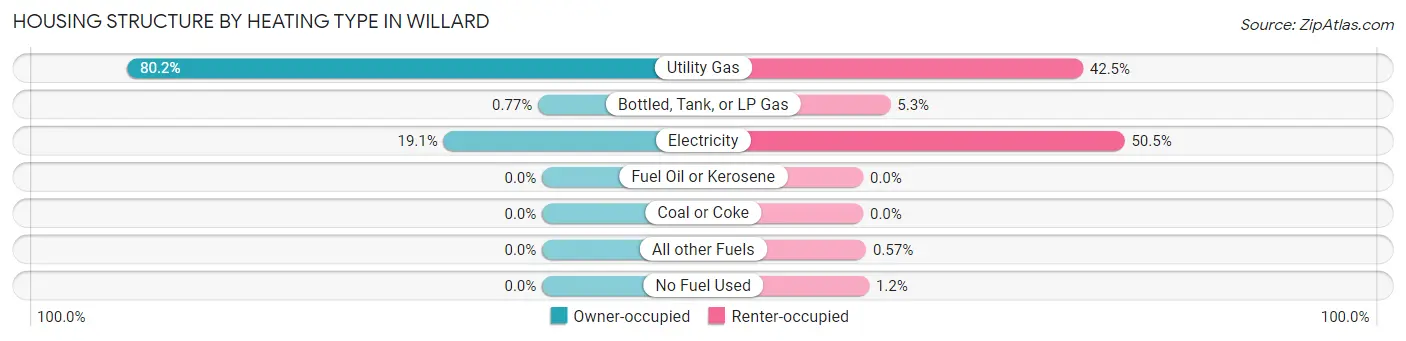
| Heating Type | Owner-occupied | Renter-occupied |
| Utility Gas | 1,246 (80.2%) | 370 (42.5%) |
| Bottled, Tank, or LP Gas | 12 (0.8%) | 46 (5.3%) |
| Electricity | 296 (19.1%) | 440 (50.5%) |
| Fuel Oil or Kerosene | 0 (0.0%) | 0 (0.0%) |
| Coal or Coke | 0 (0.0%) | 0 (0.0%) |
| All other Fuels | 0 (0.0%) | 5 (0.6%) |
| No Fuel Used | 0 (0.0%) | 10 (1.1%) |
| Total | 1,554 (100.0%) | 871 (100.0%) |
Household Vehicle Usage in Willard
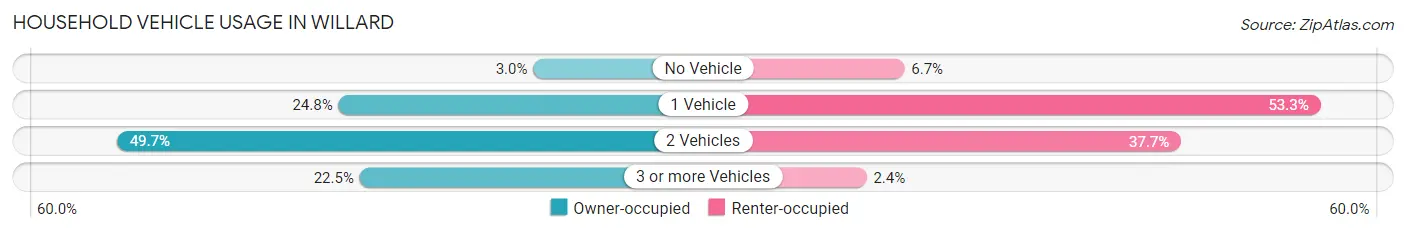
| Vehicles per Household | Owner-occupied | Renter-occupied |
| No Vehicle | 47 (3.0%) | 58 (6.7%) |
| 1 Vehicle | 386 (24.8%) | 464 (53.3%) |
| 2 Vehicles | 772 (49.7%) | 328 (37.7%) |
| 3 or more Vehicles | 349 (22.5%) | 21 (2.4%) |
| Total | 1,554 (100.0%) | 871 (100.0%) |
Real Estate & Mortgages in Willard
Real Estate and Mortgage Overview in Willard
| Characteristic | Without Mortgage | With Mortgage |
| Housing Units | 611 | 943 |
| Median Property Value | $89,900 | $118,200 |
| Median Household Income | $73,194 | $40 |
| Monthly Housing Costs | $408 | $0 |
| Real Estate Taxes | $951 | $21 |
Property Value by Mortgage Status in Willard
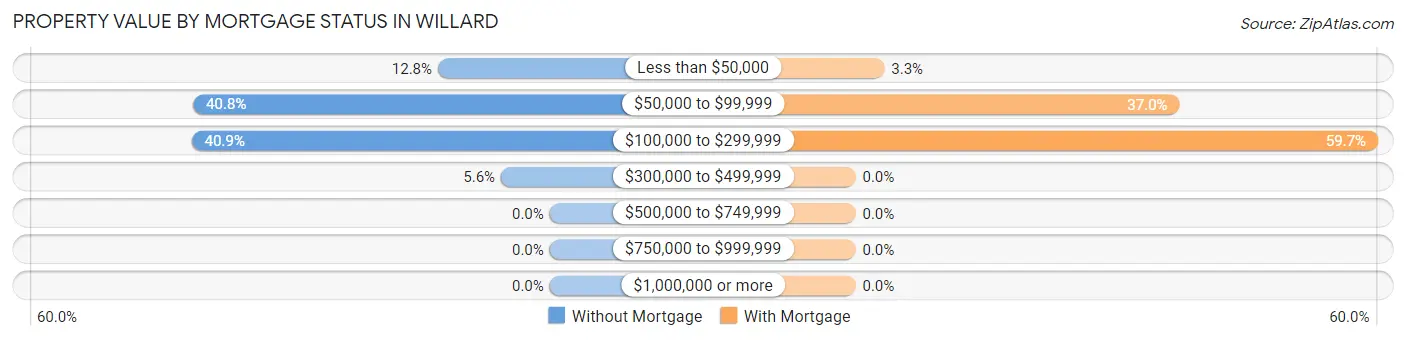
| Property Value | Without Mortgage | With Mortgage |
| Less than $50,000 | 78 (12.8%) | 31 (3.3%) |
| $50,000 to $99,999 | 249 (40.7%) | 349 (37.0%) |
| $100,000 to $299,999 | 250 (40.9%) | 563 (59.7%) |
| $300,000 to $499,999 | 34 (5.6%) | 0 (0.0%) |
| $500,000 to $749,999 | 0 (0.0%) | 0 (0.0%) |
| $750,000 to $999,999 | 0 (0.0%) | 0 (0.0%) |
| $1,000,000 or more | 0 (0.0%) | 0 (0.0%) |
| Total | 611 (100.0%) | 943 (100.0%) |
Household Income by Mortgage Status in Willard
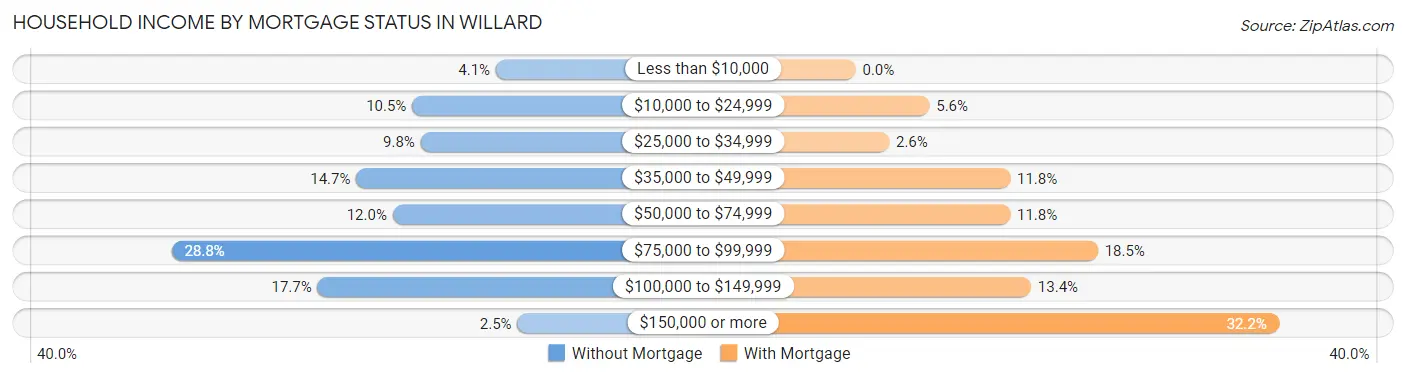
| Household Income | Without Mortgage | With Mortgage |
| Less than $10,000 | 25 (4.1%) | 0 (0.0%) |
| $10,000 to $24,999 | 64 (10.5%) | 53 (5.6%) |
| $25,000 to $34,999 | 60 (9.8%) | 24 (2.5%) |
| $35,000 to $49,999 | 90 (14.7%) | 111 (11.8%) |
| $50,000 to $74,999 | 73 (11.9%) | 111 (11.8%) |
| $75,000 to $99,999 | 176 (28.8%) | 174 (18.4%) |
| $100,000 to $149,999 | 108 (17.7%) | 126 (13.4%) |
| $150,000 or more | 15 (2.5%) | 304 (32.2%) |
| Total | 611 (100.0%) | 943 (100.0%) |
Property Value to Household Income Ratio in Willard
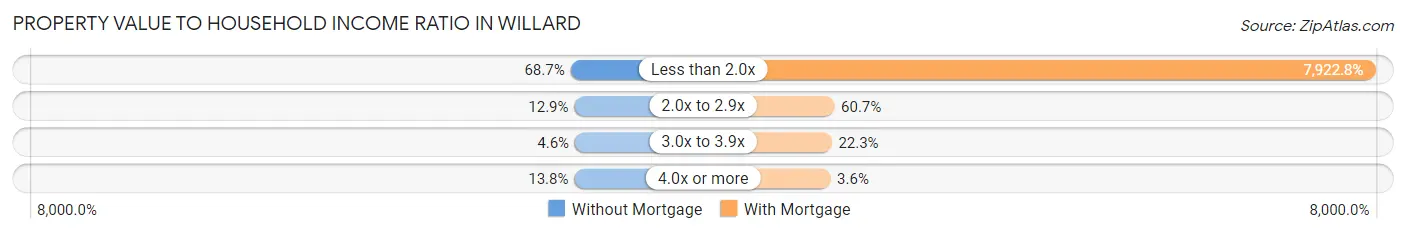
| Value-to-Income Ratio | Without Mortgage | With Mortgage |
| Less than 2.0x | 420 (68.7%) | 74,712 (7,922.8%) |
| 2.0x to 2.9x | 79 (12.9%) | 572 (60.7%) |
| 3.0x to 3.9x | 28 (4.6%) | 210 (22.3%) |
| 4.0x or more | 84 (13.8%) | 34 (3.6%) |
| Total | 611 (100.0%) | 943 (100.0%) |
Real Estate Taxes by Mortgage Status in Willard
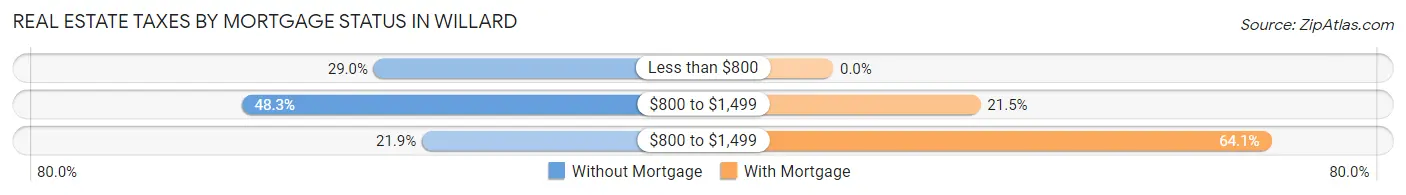
| Property Taxes | Without Mortgage | With Mortgage |
| Less than $800 | 177 (29.0%) | 0 (0.0%) |
| $800 to $1,499 | 295 (48.3%) | 203 (21.5%) |
| $800 to $1,499 | 134 (21.9%) | 604 (64.0%) |
| Total | 611 (100.0%) | 943 (100.0%) |
Health & Disability in Willard
Health Insurance Coverage by Age in Willard
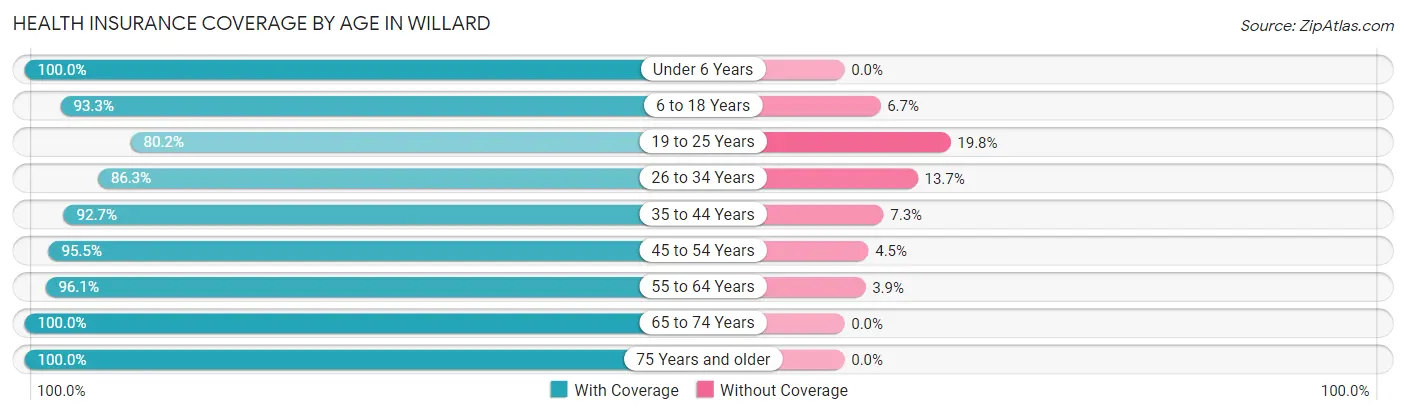
| Age Bracket | With Coverage | Without Coverage |
| Under 6 Years | 522 (100.0%) | 0 (0.0%) |
| 6 to 18 Years | 1,156 (93.3%) | 83 (6.7%) |
| 19 to 25 Years | 365 (80.2%) | 90 (19.8%) |
| 26 to 34 Years | 714 (86.3%) | 113 (13.7%) |
| 35 to 44 Years | 790 (92.7%) | 62 (7.3%) |
| 45 to 54 Years | 491 (95.5%) | 23 (4.5%) |
| 55 to 64 Years | 591 (96.1%) | 24 (3.9%) |
| 65 to 74 Years | 383 (100.0%) | 0 (0.0%) |
| 75 Years and older | 669 (100.0%) | 0 (0.0%) |
| Total | 5,681 (93.5%) | 395 (6.5%) |
Health Insurance Coverage by Citizenship Status in Willard
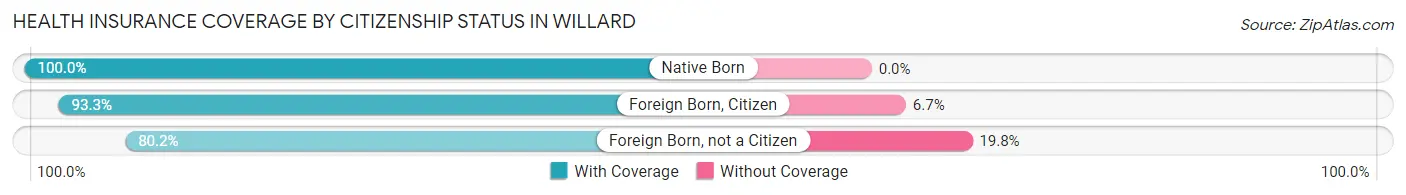
| Citizenship Status | With Coverage | Without Coverage |
| Native Born | 522 (100.0%) | 0 (0.0%) |
| Foreign Born, Citizen | 1,156 (93.3%) | 83 (6.7%) |
| Foreign Born, not a Citizen | 365 (80.2%) | 90 (19.8%) |
Health Insurance Coverage by Household Income in Willard
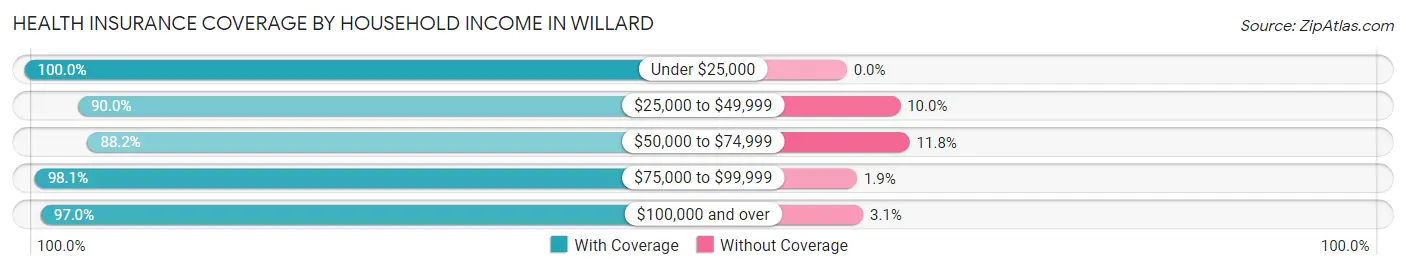
| Household Income | With Coverage | Without Coverage |
| Under $25,000 | 627 (100.0%) | 0 (0.0%) |
| $25,000 to $49,999 | 1,268 (90.0%) | 141 (10.0%) |
| $50,000 to $74,999 | 1,460 (88.2%) | 195 (11.8%) |
| $75,000 to $99,999 | 1,182 (98.1%) | 23 (1.9%) |
| $100,000 and over | 1,144 (97.0%) | 36 (3.0%) |
Public vs Private Health Insurance Coverage by Age in Willard
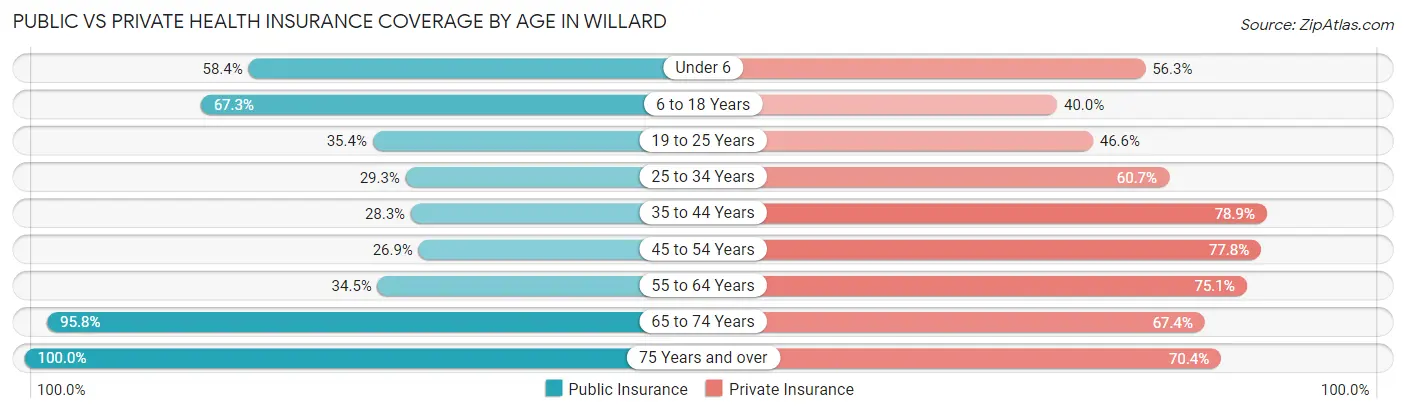
| Age Bracket | Public Insurance | Private Insurance |
| Under 6 | 305 (58.4%) | 294 (56.3%) |
| 6 to 18 Years | 834 (67.3%) | 495 (40.0%) |
| 19 to 25 Years | 161 (35.4%) | 212 (46.6%) |
| 25 to 34 Years | 242 (29.3%) | 502 (60.7%) |
| 35 to 44 Years | 241 (28.3%) | 672 (78.9%) |
| 45 to 54 Years | 138 (26.9%) | 400 (77.8%) |
| 55 to 64 Years | 212 (34.5%) | 462 (75.1%) |
| 65 to 74 Years | 367 (95.8%) | 258 (67.4%) |
| 75 Years and over | 669 (100.0%) | 471 (70.4%) |
| Total | 3,169 (52.2%) | 3,766 (62.0%) |
Disability Status by Sex by Age in Willard
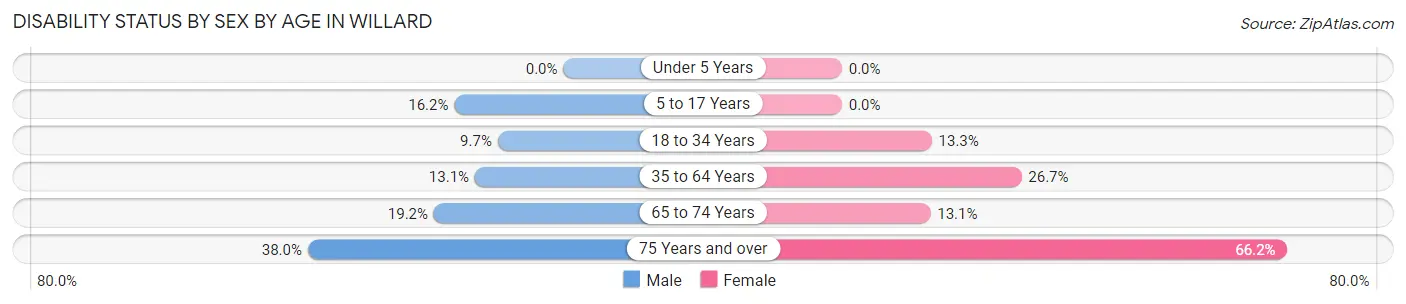
| Age Bracket | Male | Female |
| Under 5 Years | 0 (0.0%) | 0 (0.0%) |
| 5 to 17 Years | 93 (16.2%) | 0 (0.0%) |
| 18 to 34 Years | 72 (9.7%) | 91 (13.3%) |
| 35 to 64 Years | 104 (13.1%) | 317 (26.7%) |
| 65 to 74 Years | 40 (19.2%) | 23 (13.1%) |
| 75 Years and over | 126 (38.0%) | 223 (66.2%) |
Disability Class by Sex by Age in Willard
Disability Class: Hearing Difficulty
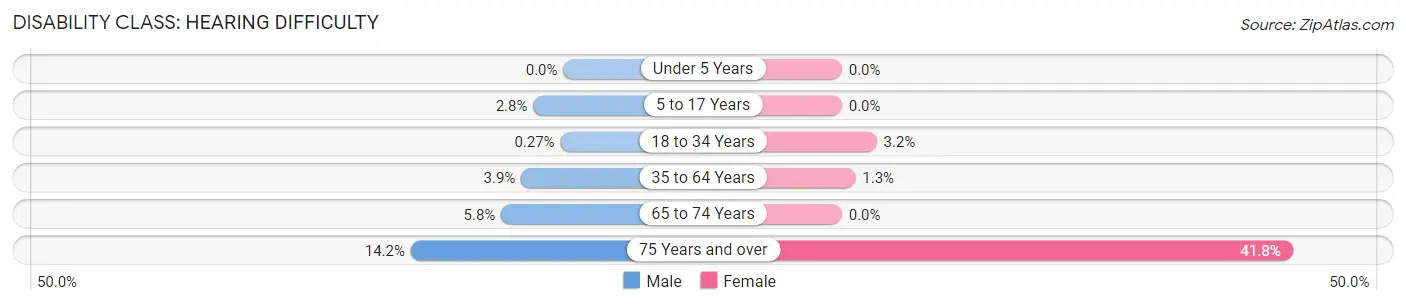
| Age Bracket | Male | Female |
| Under 5 Years | 0 (0.0%) | 0 (0.0%) |
| 5 to 17 Years | 16 (2.8%) | 0 (0.0%) |
| 18 to 34 Years | 2 (0.3%) | 22 (3.2%) |
| 35 to 64 Years | 31 (3.9%) | 15 (1.3%) |
| 65 to 74 Years | 12 (5.8%) | 0 (0.0%) |
| 75 Years and over | 47 (14.2%) | 141 (41.8%) |
Disability Class: Vision Difficulty
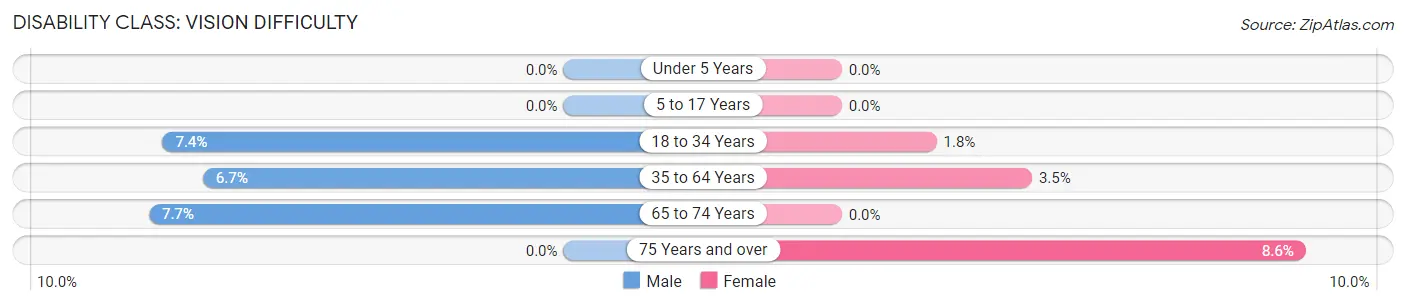
| Age Bracket | Male | Female |
| Under 5 Years | 0 (0.0%) | 0 (0.0%) |
| 5 to 17 Years | 0 (0.0%) | 0 (0.0%) |
| 18 to 34 Years | 55 (7.4%) | 12 (1.8%) |
| 35 to 64 Years | 53 (6.7%) | 42 (3.5%) |
| 65 to 74 Years | 16 (7.7%) | 0 (0.0%) |
| 75 Years and over | 0 (0.0%) | 29 (8.6%) |
Disability Class: Cognitive Difficulty
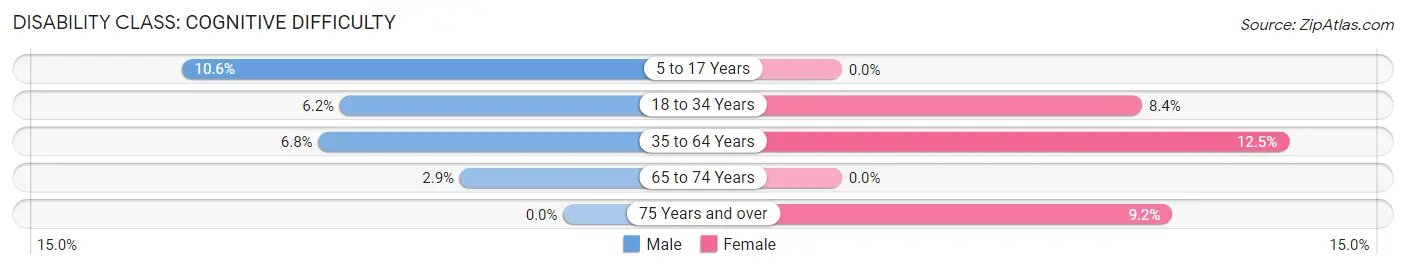
| Age Bracket | Male | Female |
| 5 to 17 Years | 61 (10.6%) | 0 (0.0%) |
| 18 to 34 Years | 46 (6.2%) | 57 (8.4%) |
| 35 to 64 Years | 54 (6.8%) | 148 (12.4%) |
| 65 to 74 Years | 6 (2.9%) | 0 (0.0%) |
| 75 Years and over | 0 (0.0%) | 31 (9.2%) |
Disability Class: Ambulatory Difficulty
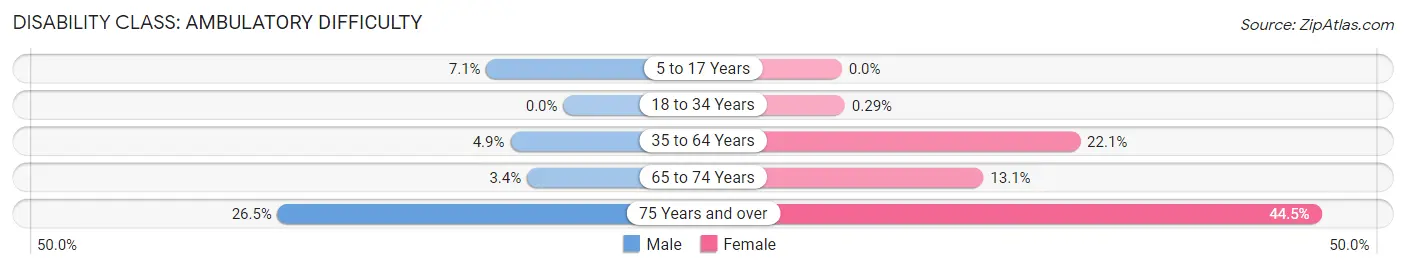
| Age Bracket | Male | Female |
| 5 to 17 Years | 41 (7.1%) | 0 (0.0%) |
| 18 to 34 Years | 0 (0.0%) | 2 (0.3%) |
| 35 to 64 Years | 39 (4.9%) | 263 (22.1%) |
| 65 to 74 Years | 7 (3.4%) | 23 (13.1%) |
| 75 Years and over | 88 (26.5%) | 150 (44.5%) |
Disability Class: Self-Care Difficulty
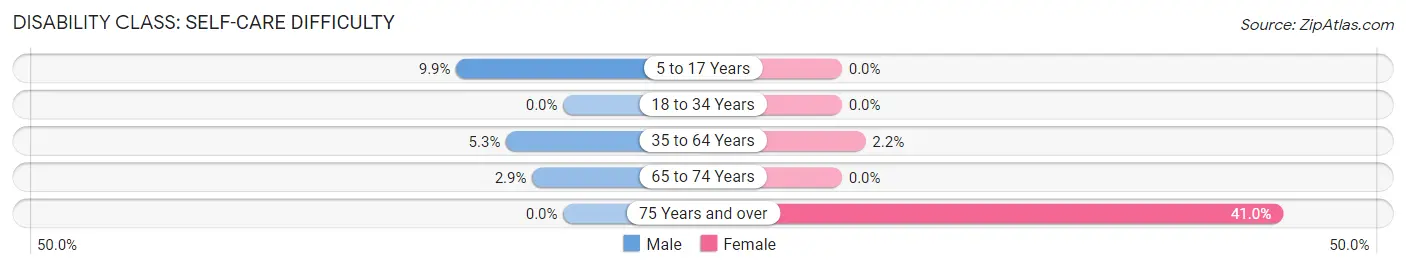
| Age Bracket | Male | Female |
| 5 to 17 Years | 57 (9.9%) | 0 (0.0%) |
| 18 to 34 Years | 0 (0.0%) | 0 (0.0%) |
| 35 to 64 Years | 42 (5.3%) | 26 (2.2%) |
| 65 to 74 Years | 6 (2.9%) | 0 (0.0%) |
| 75 Years and over | 0 (0.0%) | 138 (40.9%) |
Technology Access in Willard
Computing Device Access in Willard
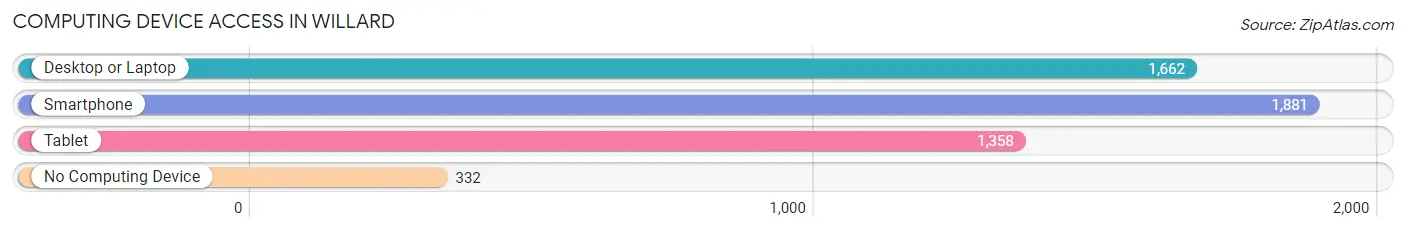
| Device Type | # Households | % Households |
| Desktop or Laptop | 1,662 | 68.5% |
| Smartphone | 1,881 | 77.6% |
| Tablet | 1,358 | 56.0% |
| No Computing Device | 332 | 13.7% |
| Total | 2,425 | 100.0% |
Internet Access in Willard
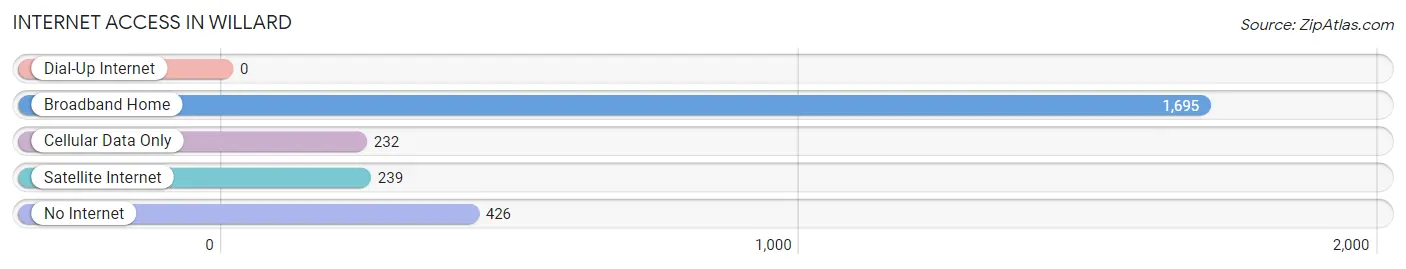
| Internet Type | # Households | % Households |
| Dial-Up Internet | 0 | 0.0% |
| Broadband Home | 1,695 | 69.9% |
| Cellular Data Only | 232 | 9.6% |
| Satellite Internet | 239 | 9.9% |
| No Internet | 426 | 17.6% |
| Total | 2,425 | 100.0% |
Willard Summary
Willard, Ohio is a small city located in Huron County in the north-central part of the state. It is situated on the banks of the Huron River, about 25 miles east of Sandusky and about 50 miles west of Cleveland. The city has a population of 6,717 as of the 2010 census, making it the largest city in Huron County.
Willard was founded in 1817 by a group of settlers from Connecticut. The city was named after the Willard family, who were among the first settlers. The city was incorporated in 1867 and has since grown to become the largest city in Huron County.
Willard is located in the heart of the agricultural region of Ohio. The city is surrounded by fertile farmland and is home to many farms and agricultural businesses. The city is also home to several manufacturing companies, including a large paper mill and a plastics plant.
Willard has a humid continental climate, with hot summers and cold winters. The average annual temperature is around 50 degrees Fahrenheit. The city receives an average of 37 inches of precipitation per year, with most of it falling in the spring and summer months.
Willard has a diverse economy, with a mix of manufacturing, agriculture, and service industries. The city is home to several large employers, including the Willard Paper Mill, the Willard Plastics Plant, and the Willard Manufacturing Company. The city also has a number of small businesses, including restaurants, retail stores, and professional services.
Willard has a population of 6,717 as of the 2010 census. The population is spread out, with about 25% of the population under the age of 18 and about 10% over the age of 65. The median household income is $41,945, and the median home value is $90,000. The city is predominantly white, with about 90% of the population identifying as white.
Willard is served by the Willard City School District, which includes two elementary schools, one middle school, and one high school. The city also has a number of private schools, including a Catholic school and a Christian school.
Willard is home to a number of parks and recreational facilities, including a public pool, a skate park, and several sports fields. The city also has a number of cultural attractions, including the Willard Historical Museum and the Willard Arts Center.
Willard is a small city with a rich history and a diverse economy. The city is home to a number of large employers and a variety of small businesses. The city is served by a strong school system and has a number of parks and recreational facilities. Willard is a great place to live, work, and raise a family.
Common Questions
What is the Total Population of Willard?
Total Population of Willard is 6,189.
What is the Total Male Population of Willard?
Total Male Population of Willard is 2,836.
What is the Total Female Population of Willard?
Total Female Population of Willard is 3,353.
What is the Ratio of Males per 100 Females in Willard?
There are 84.58 Males per 100 Females in Willard.
What is the Ratio of Females per 100 Males in Willard?
There are 118.23 Females per 100 Males in Willard.
What is the Median Population Age in Willard?
Median Population Age in Willard is 35.7 Years.
What is the Average Family Size in Willard
Average Family Size in Willard is 3.3 People.
What is the Average Household Size in Willard
Average Household Size in Willard is 2.5 People.
What is Per Capita Income in Willard?
Per Capita income in Willard is $24,974.
What is the Median Family Income in Willard?
Median Family Income in Willard is $60,859.
What is the Median Household income in Willard?
Median Household Income in Willard is $51,846.
What is Income or Wage Gap in Willard?
Income or Wage Gap in Willard is 27.3%.
Women in Willard earn 72.7 cents for every dollar earned by a man.
What is Family Income Deficit in Willard?
Family Income Deficit in Willard is $6,292.
Families that are below poverty line in Willard earn $6,292 less on average than the poverty threshold level.
What is Inequality or Gini Index in Willard?
Inequality or Gini Index in Willard is 0.38.
How Large is the Labor Force in Willard?
There are 2,706 People in the Labor Forcein in Willard.
What is the Percentage of People in the Labor Force in Willard?
58.3% of People are in the Labor Force in Willard.
What is the Unemployment Rate in Willard?
Unemployment Rate in Willard is 4.1%.