Lake Seneca, OH
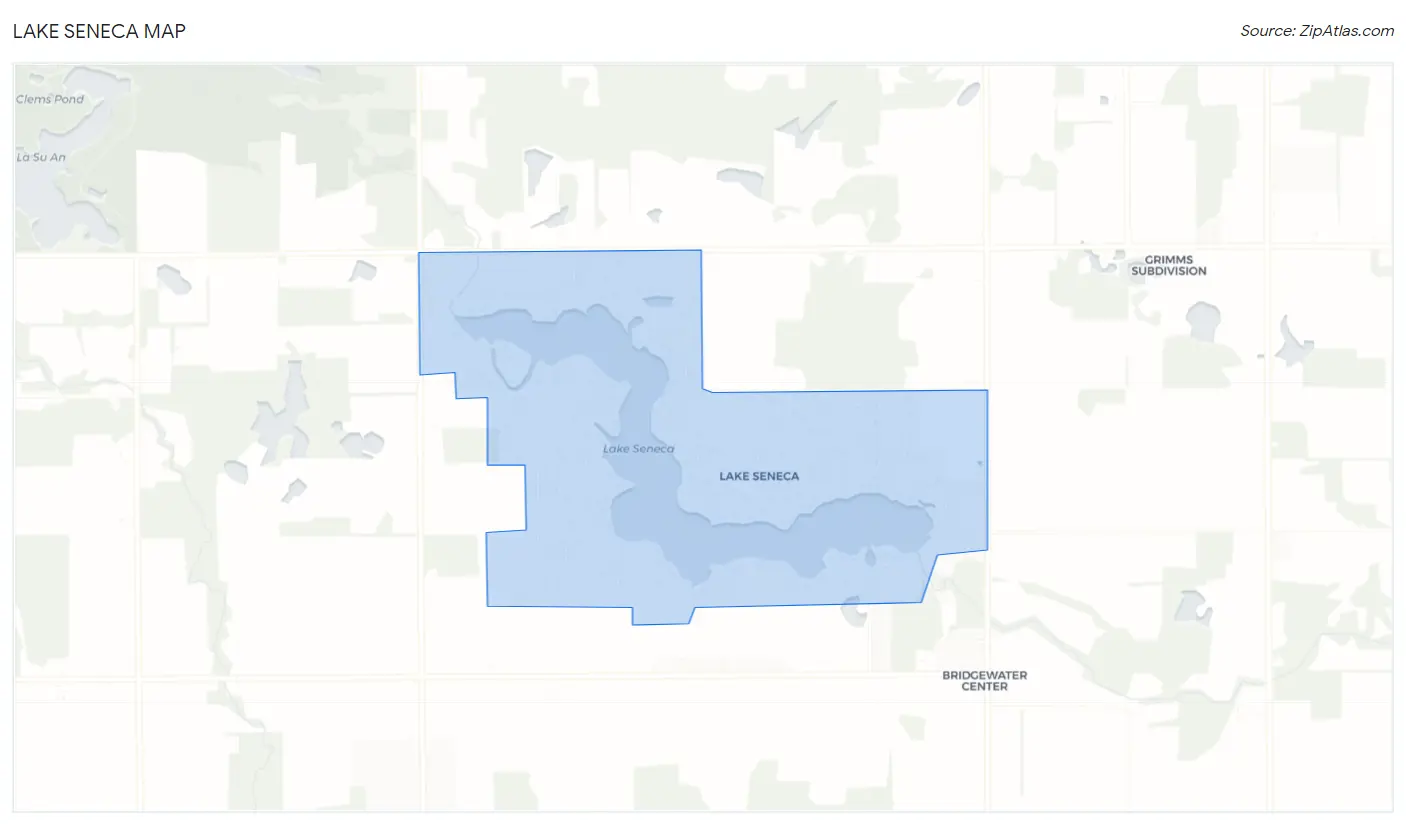
Lake Seneca Map
Lake Seneca Overview
633
TOTAL POPULATION
289
MALE POPULATION
344
FEMALE POPULATION
84.01
MALES / 100 FEMALES
119.03
FEMALES / 100 MALES
53.7
MEDIAN AGE
2.7
AVG FAMILY SIZE
2.4
AVG HOUSEHOLD SIZE
$39,539
PER CAPITA INCOME
$83,333
AVG FAMILY INCOME
$81,200
AVG HOUSEHOLD INCOME
4.7%
WAGE / INCOME GAP [ % ]
95.3¢/ $1
WAGE / INCOME GAP [ $ ]
0.32
INEQUALITY / GINI INDEX
306
LABOR FORCE [ PEOPLE ]
57.0%
PERCENT IN LABOR FORCE
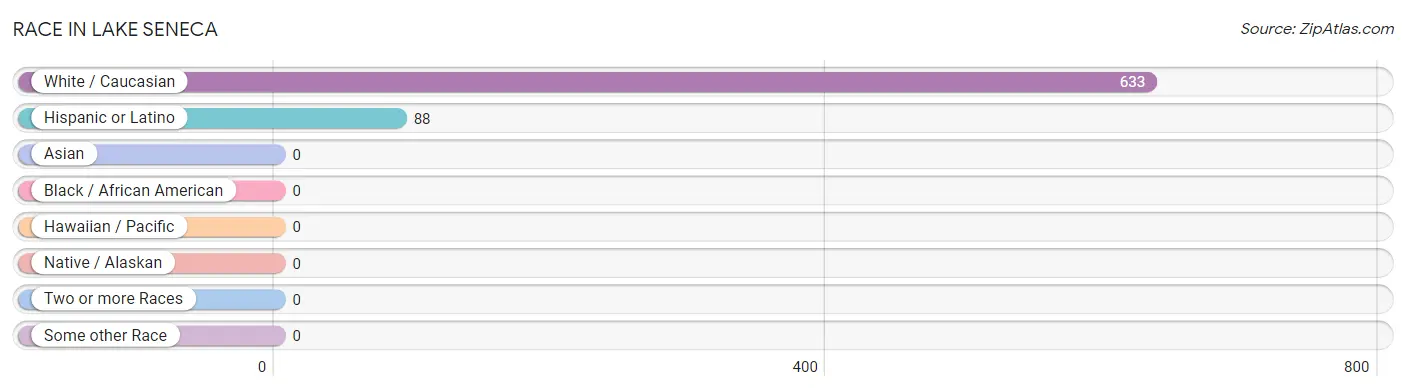
Race in Lake Seneca
The most populous races in Lake Seneca are White / Caucasian (633 | 100.0%), and Hispanic or Latino (88 | 13.9%).
| Race | # Population | % Population |
| Asian | 0 | 0.0% |
| Black / African American | 0 | 0.0% |
| Hawaiian / Pacific | 0 | 0.0% |
| Hispanic or Latino | 88 | 13.9% |
| Native / Alaskan | 0 | 0.0% |
| White / Caucasian | 633 | 100.0% |
| Two or more Races | 0 | 0.0% |
| Some other Race | 0 | 0.0% |
| Total | 633 | 100.0% |
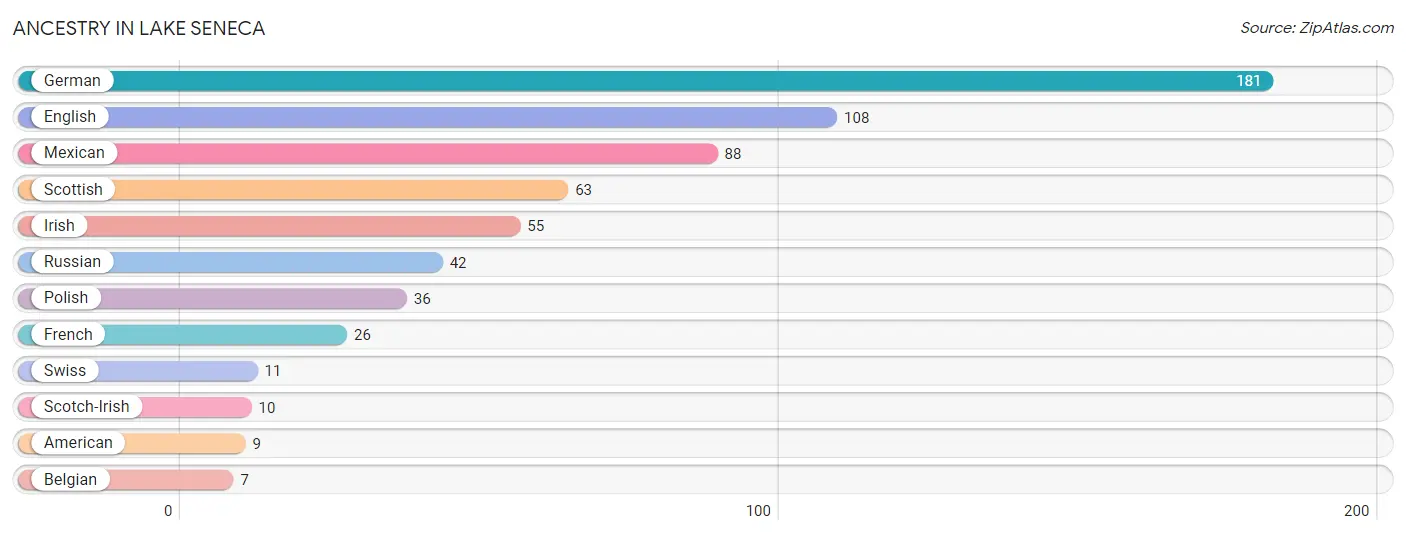
Ancestry in Lake Seneca
The most populous ancestries reported in Lake Seneca are German (181 | 28.6%), English (108 | 17.1%), Mexican (88 | 13.9%), Scottish (63 | 10.0%), and Irish (55 | 8.7%), together accounting for 78.2% of all Lake Seneca residents.
| Ancestry | # Population | % Population |
| American | 9 | 1.4% |
| Belgian | 7 | 1.1% |
| English | 108 | 17.1% |
| French | 26 | 4.1% |
| German | 181 | 28.6% |
| Irish | 55 | 8.7% |
| Mexican | 88 | 13.9% |
| Polish | 36 | 5.7% |
| Russian | 42 | 6.6% |
| Scotch-Irish | 10 | 1.6% |
| Scottish | 63 | 10.0% |
| Swiss | 11 | 1.7% | View All 12 Rows |
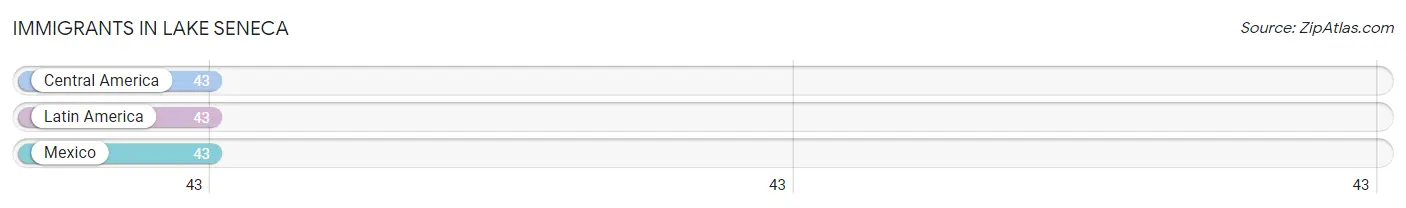
Immigrants in Lake Seneca
The most numerous immigrant groups reported in Lake Seneca came from Central America (43 | 6.8%), Latin America (43 | 6.8%), and Mexico (43 | 6.8%), together accounting for 20.4% of all Lake Seneca residents.
| Immigration Origin | # Population | % Population |
| Central America | 43 | 6.8% |
| Latin America | 43 | 6.8% |
| Mexico | 43 | 6.8% | View All 3 Rows |
Sex and Age in Lake Seneca
Sex and Age in Lake Seneca
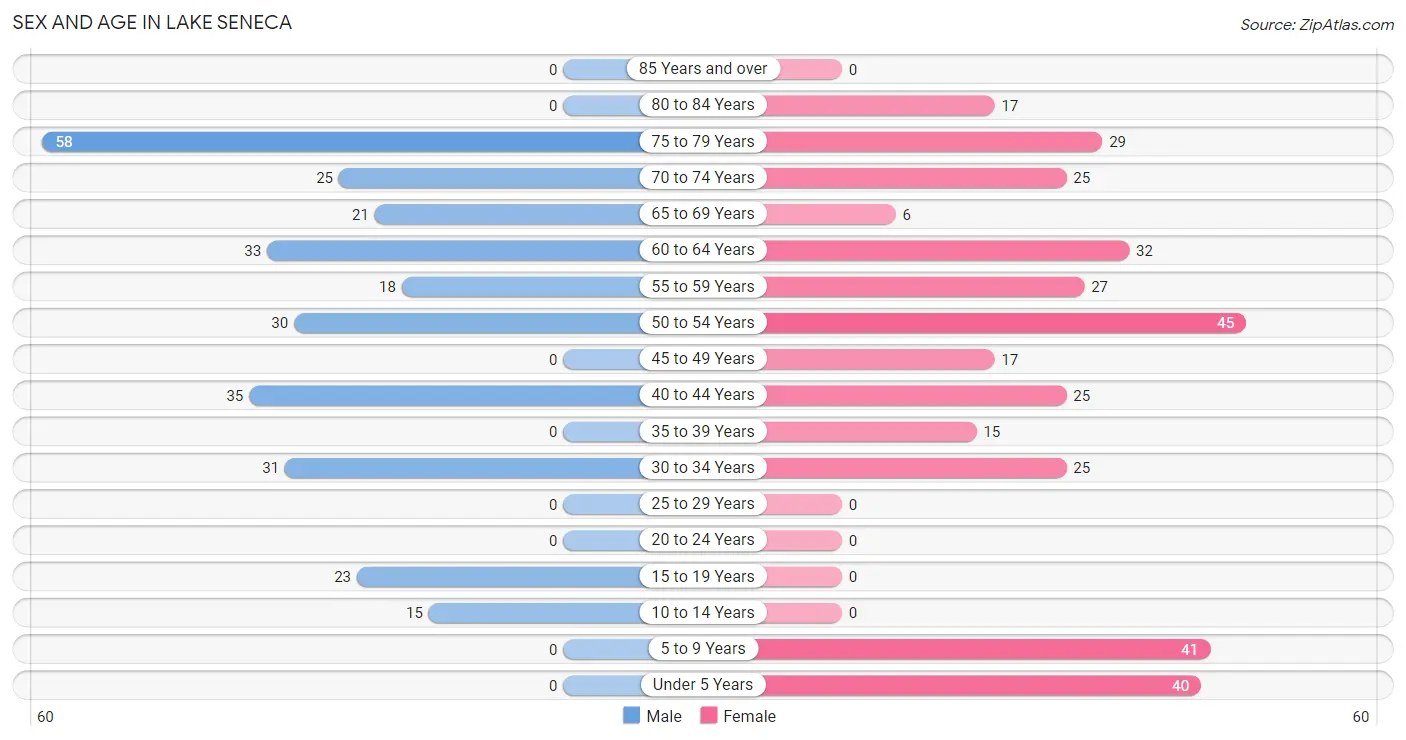
The most populous age groups in Lake Seneca are 75 to 79 Years (58 | 20.1%) for men and 50 to 54 Years (45 | 13.1%) for women.
| Age Bracket | Male | Female |
| Under 5 Years | 0 (0.0%) | 40 (11.6%) |
| 5 to 9 Years | 0 (0.0%) | 41 (11.9%) |
| 10 to 14 Years | 15 (5.2%) | 0 (0.0%) |
| 15 to 19 Years | 23 (8.0%) | 0 (0.0%) |
| 20 to 24 Years | 0 (0.0%) | 0 (0.0%) |
| 25 to 29 Years | 0 (0.0%) | 0 (0.0%) |
| 30 to 34 Years | 31 (10.7%) | 25 (7.3%) |
| 35 to 39 Years | 0 (0.0%) | 15 (4.4%) |
| 40 to 44 Years | 35 (12.1%) | 25 (7.3%) |
| 45 to 49 Years | 0 (0.0%) | 17 (4.9%) |
| 50 to 54 Years | 30 (10.4%) | 45 (13.1%) |
| 55 to 59 Years | 18 (6.2%) | 27 (7.9%) |
| 60 to 64 Years | 33 (11.4%) | 32 (9.3%) |
| 65 to 69 Years | 21 (7.3%) | 6 (1.7%) |
| 70 to 74 Years | 25 (8.6%) | 25 (7.3%) |
| 75 to 79 Years | 58 (20.1%) | 29 (8.4%) |
| 80 to 84 Years | 0 (0.0%) | 17 (4.9%) |
| 85 Years and over | 0 (0.0%) | 0 (0.0%) |
| Total | 289 (100.0%) | 344 (100.0%) |
Families and Households in Lake Seneca
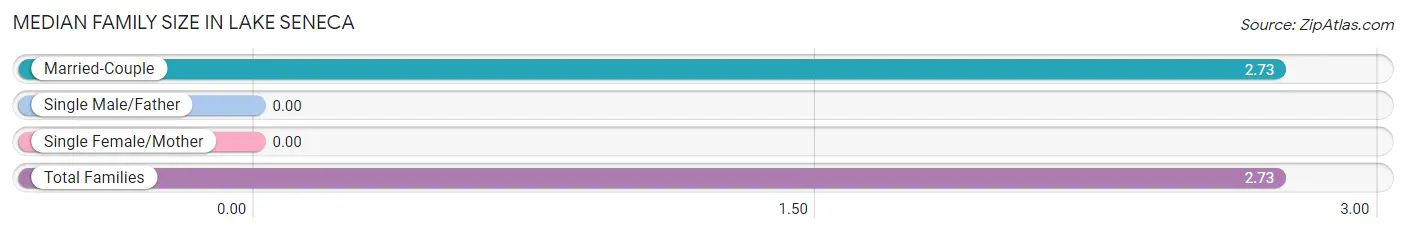
Median Family Size in Lake Seneca
| Family Type | # Families | Family Size |
| Married-Couple | 194 (100.0%) | 2.73 |
| Single Male/Father | 0 (0.0%) | - |
| Single Female/Mother | 0 (0.0%) | - |
| Total Families | 194 (100.0%) | 2.73 |
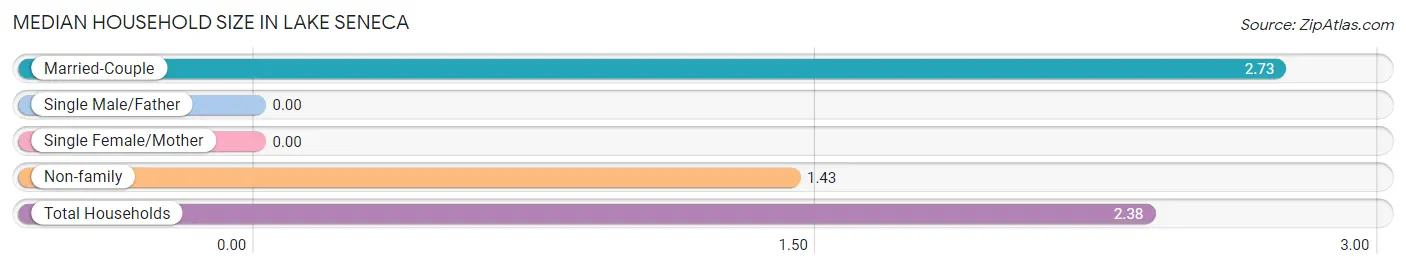
Median Household Size in Lake Seneca
| Household Type | # Households | Household Size |
| Married-Couple | 194 (72.9%) | 2.73 |
| Single Male/Father | 0 (0.0%) | - |
| Single Female/Mother | 0 (0.0%) | - |
| Non-family | 72 (27.1%) | 1.43 |
| Total Households | 266 (100.0%) | 2.38 |
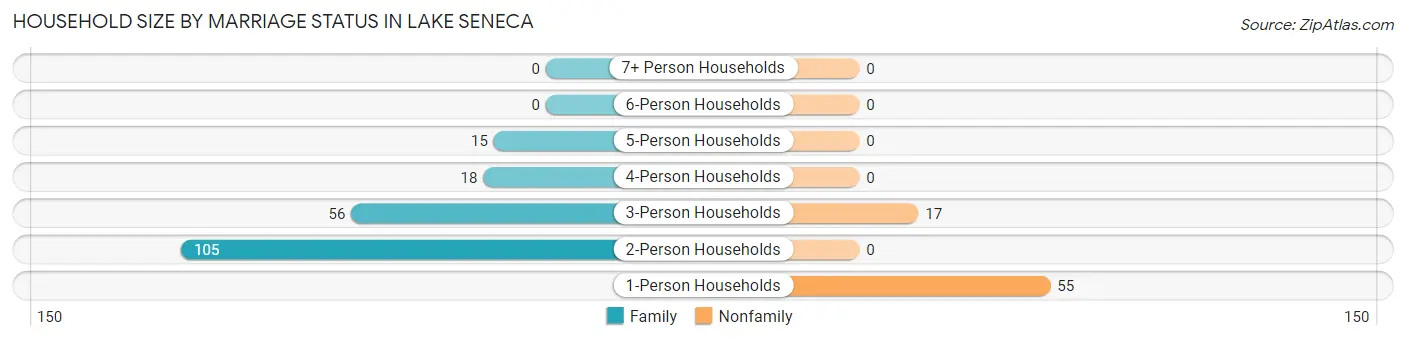
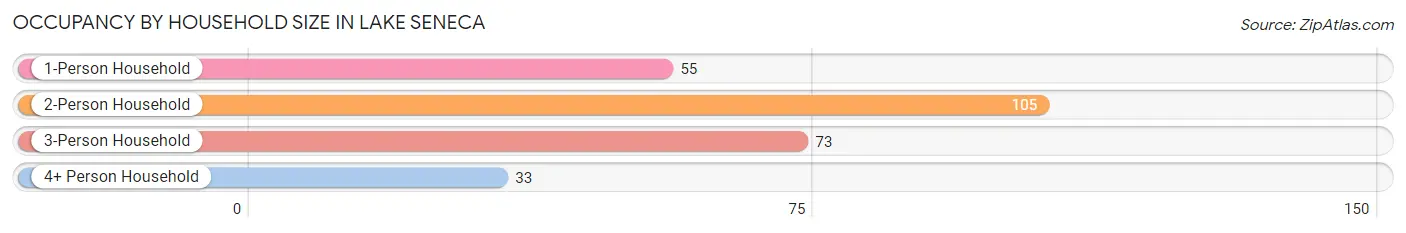
Household Size by Marriage Status in Lake Seneca
Out of a total of 266 households in Lake Seneca, 194 (72.9%) are family households, while 72 (27.1%) are nonfamily households. The most numerous type of family households are 2-person households, comprising 105, and the most common type of nonfamily households are 1-person households, comprising 55.
| Household Size | Family Households | Nonfamily Households |
| 1-Person Households | - | 55 (20.7%) |
| 2-Person Households | 105 (39.5%) | 0 (0.0%) |
| 3-Person Households | 56 (21.0%) | 17 (6.4%) |
| 4-Person Households | 18 (6.8%) | 0 (0.0%) |
| 5-Person Households | 15 (5.6%) | 0 (0.0%) |
| 6-Person Households | 0 (0.0%) | 0 (0.0%) |
| 7+ Person Households | 0 (0.0%) | 0 (0.0%) |
| Total | 194 (72.9%) | 72 (27.1%) |
Female Fertility in Lake Seneca
Fertility by Age in Lake Seneca
Average fertility rate in Lake Seneca is 183.0 births per 1,000 women. Women in the age bracket of 35 to 50 years have the highest fertility rate with 263.0 births per 1,000 women. Women in the age bracket of 35 to 50 years acount for 100.0% of all women with births.
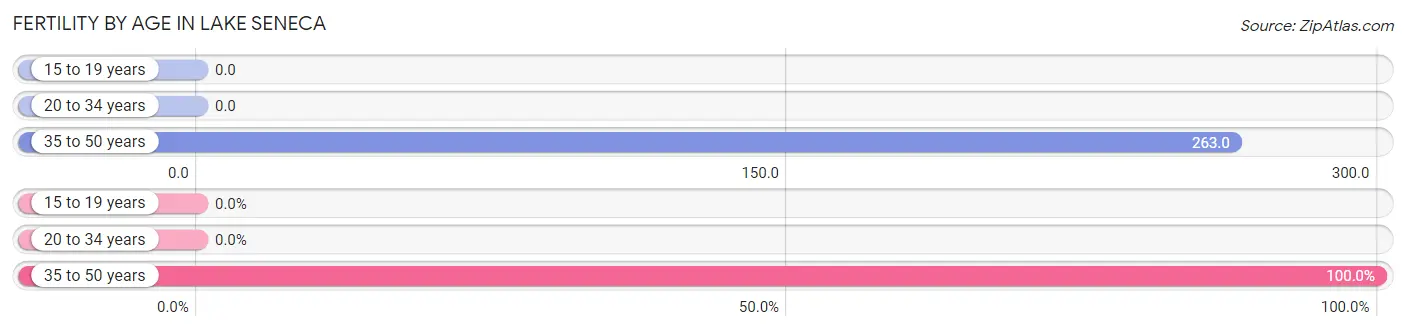
| Age Bracket | Women with Births | Births / 1,000 Women |
| 15 to 19 years | 0 (0.0%) | 0.0 |
| 20 to 34 years | 0 (0.0%) | 0.0 |
| 35 to 50 years | 15 (100.0%) | 263.0 |
| Total | 15 (100.0%) | 183.0 |
Fertility by Age by Marriage Status in Lake Seneca
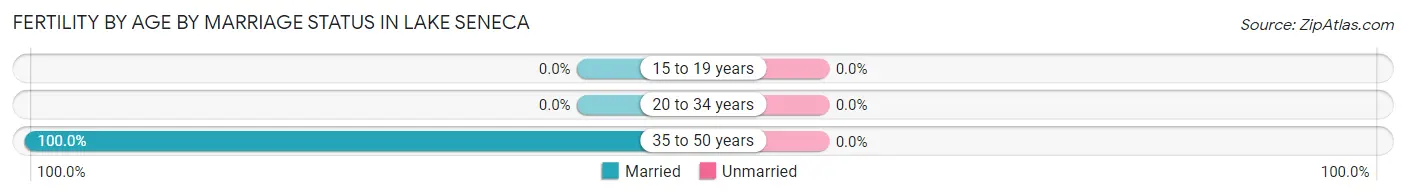
| Age Bracket | Married | Unmarried |
| 15 to 19 years | 0 (0.0%) | 0 (0.0%) |
| 20 to 34 years | 0 (0.0%) | 0 (0.0%) |
| 35 to 50 years | 15 (100.0%) | 0 (0.0%) |
| Total | 15 (100.0%) | 0 (0.0%) |
Fertility by Education in Lake Seneca
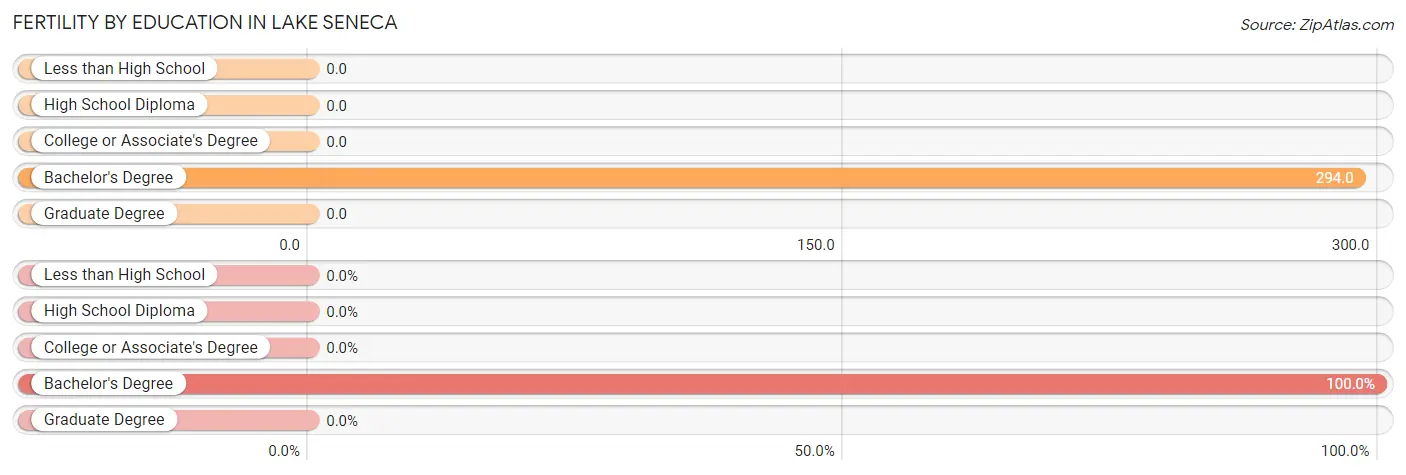
| Educational Attainment | Women with Births | Births / 1,000 Women |
| Less than High School | 0 (0.0%) | 0.0 |
| High School Diploma | 0 (0.0%) | 0.0 |
| College or Associate's Degree | 0 (0.0%) | 0.0 |
| Bachelor's Degree | 15 (100.0%) | 294.0 |
| Graduate Degree | 0 (0.0%) | 0.0 |
| Total | 15 (100.0%) | 183.0 |
Fertility by Education by Marriage Status in Lake Seneca
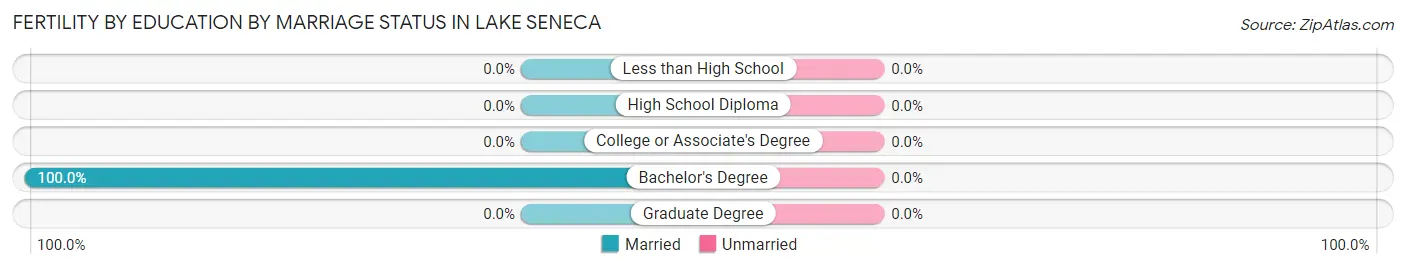
| Educational Attainment | Married | Unmarried |
| Less than High School | 0 (0.0%) | 0 (0.0%) |
| High School Diploma | 0 (0.0%) | 0 (0.0%) |
| College or Associate's Degree | 0 (0.0%) | 0 (0.0%) |
| Bachelor's Degree | 15 (100.0%) | 0 (0.0%) |
| Graduate Degree | 0 (0.0%) | 0 (0.0%) |
| Total | 15 (100.0%) | 0 (0.0%) |
Income in Lake Seneca
Income Overview in Lake Seneca
Per Capita Income in Lake Seneca is $39,539, while median incomes of families and households are $83,333 and $81,200 respectively.
| Characteristic | Number | Measure |
| Per Capita Income | 633 | $39,539 |
| Median Family Income | 194 | $83,333 |
| Mean Family Income | 194 | $114,466 |
| Median Household Income | 266 | $81,200 |
| Mean Household Income | 266 | $99,973 |
| Income Deficit | 194 | $0 |
| Wage / Income Gap (%) | 633 | 4.67% |
| Wage / Income Gap ($) | 633 | 95.33¢ per $1 |
| Gini / Inequality Index | 633 | 0.32 |
Earnings by Sex in Lake Seneca
Average Earnings in Lake Seneca are $44,628, $46,161 for men and $44,007 for women, a difference of 4.7%.
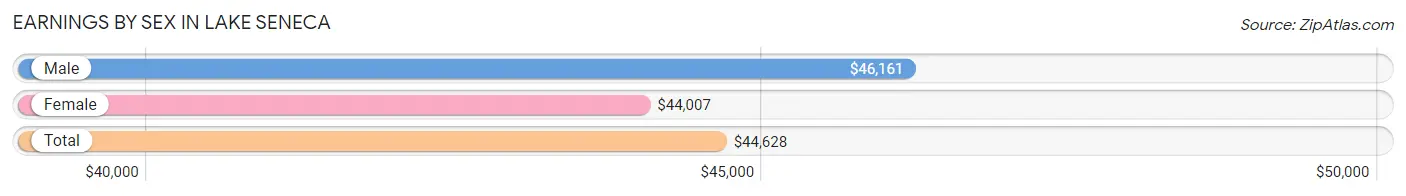
| Sex | Number | Average Earnings |
| Male | 161 (51.6%) | $46,161 |
| Female | 151 (48.4%) | $44,007 |
| Total | 312 (100.0%) | $44,628 |
Earnings by Sex by Income Bracket in Lake Seneca
The most common earnings brackets in Lake Seneca are $75,000 to $99,999 for men (36 | 22.4%) and $40,000 to $44,999 for women (34 | 22.5%).
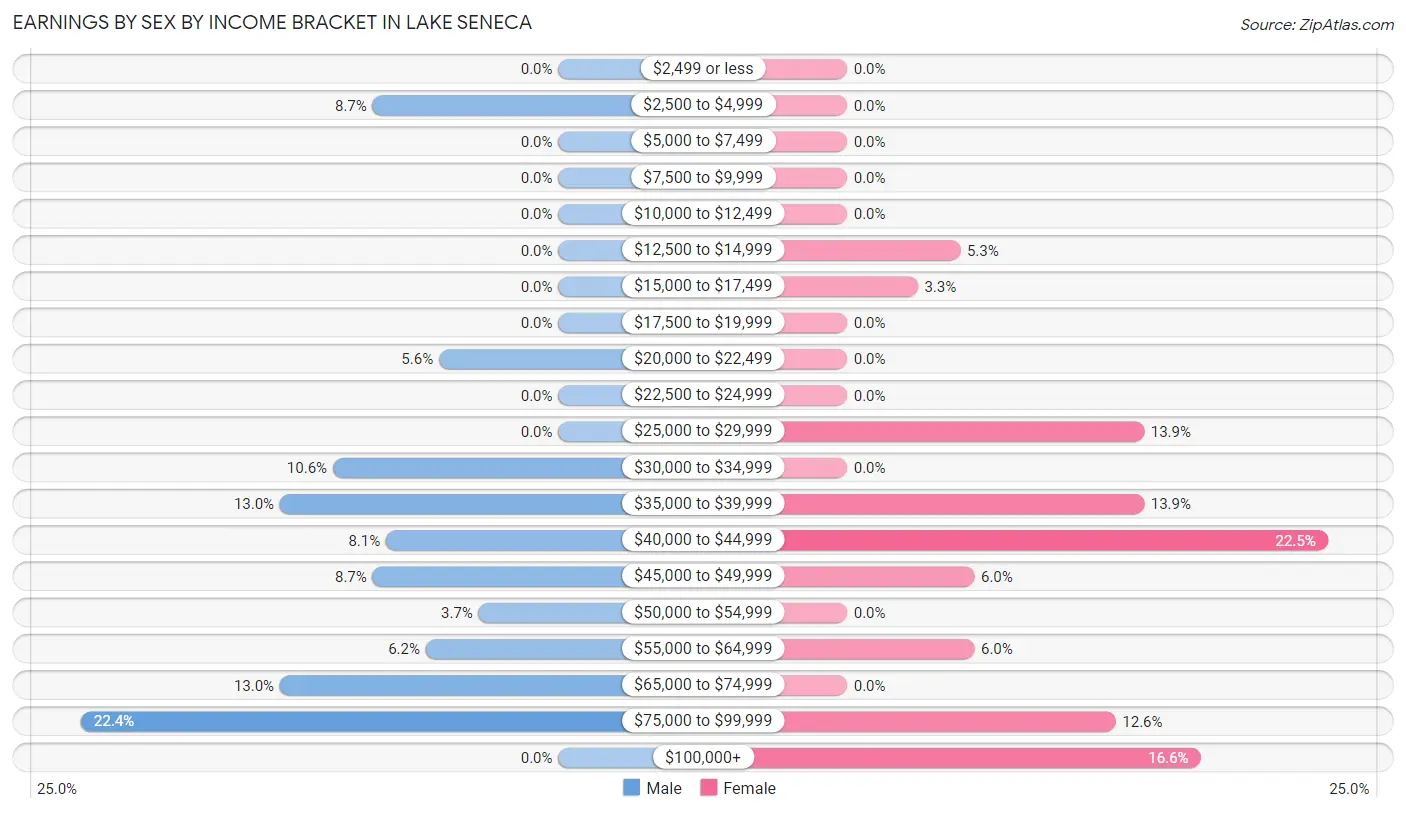
| Income | Male | Female |
| $2,499 or less | 0 (0.0%) | 0 (0.0%) |
| $2,500 to $4,999 | 14 (8.7%) | 0 (0.0%) |
| $5,000 to $7,499 | 0 (0.0%) | 0 (0.0%) |
| $7,500 to $9,999 | 0 (0.0%) | 0 (0.0%) |
| $10,000 to $12,499 | 0 (0.0%) | 0 (0.0%) |
| $12,500 to $14,999 | 0 (0.0%) | 8 (5.3%) |
| $15,000 to $17,499 | 0 (0.0%) | 5 (3.3%) |
| $17,500 to $19,999 | 0 (0.0%) | 0 (0.0%) |
| $20,000 to $22,499 | 9 (5.6%) | 0 (0.0%) |
| $22,500 to $24,999 | 0 (0.0%) | 0 (0.0%) |
| $25,000 to $29,999 | 0 (0.0%) | 21 (13.9%) |
| $30,000 to $34,999 | 17 (10.6%) | 0 (0.0%) |
| $35,000 to $39,999 | 21 (13.0%) | 21 (13.9%) |
| $40,000 to $44,999 | 13 (8.1%) | 34 (22.5%) |
| $45,000 to $49,999 | 14 (8.7%) | 9 (6.0%) |
| $50,000 to $54,999 | 6 (3.7%) | 0 (0.0%) |
| $55,000 to $64,999 | 10 (6.2%) | 9 (6.0%) |
| $65,000 to $74,999 | 21 (13.0%) | 0 (0.0%) |
| $75,000 to $99,999 | 36 (22.4%) | 19 (12.6%) |
| $100,000+ | 0 (0.0%) | 25 (16.6%) |
| Total | 161 (100.0%) | 151 (100.0%) |
Earnings by Sex by Educational Attainment in Lake Seneca
Average earnings in Lake Seneca are $54,167 for men and $44,007 for women, a difference of 18.8%. Men with an educational attainment of high school diploma enjoy the highest average annual earnings of $58,500, while those with high school diploma education earn the least with $58,500. Women with an educational attainment of college or associate's degree earn the most with the average annual earnings of $47,222, while those with high school diploma education have the smallest earnings of $43,162.
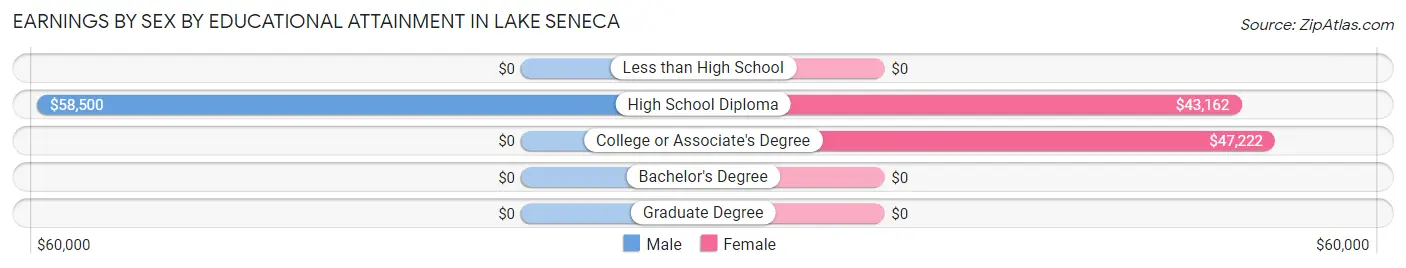
| Educational Attainment | Male Income | Female Income |
| Less than High School | - | - |
| High School Diploma | $58,500 | $43,162 |
| College or Associate's Degree | - | - |
| Bachelor's Degree | - | - |
| Graduate Degree | - | - |
| Total | $54,167 | $44,007 |
Family Income in Lake Seneca
Family Income Brackets in Lake Seneca
According to the Lake Seneca family income data, there are 65 families falling into the $75,000 to $99,999 income range, which is the most common income bracket and makes up 33.5% of all families.
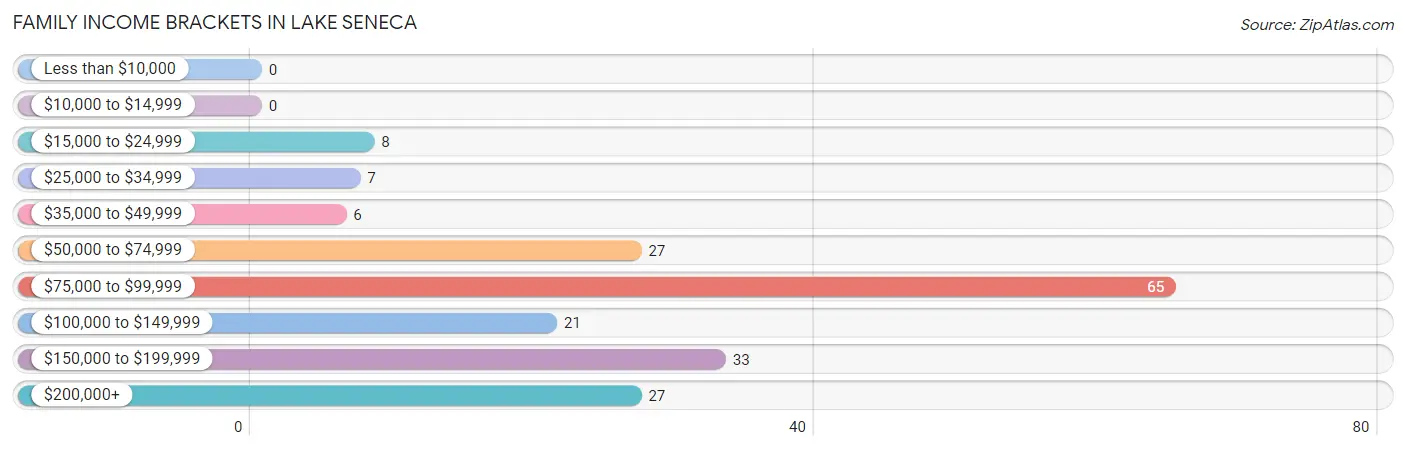
| Income Bracket | # Families | % Families |
| Less than $10,000 | 0 | 0.0% |
| $10,000 to $14,999 | 0 | 0.0% |
| $15,000 to $24,999 | 8 | 4.1% |
| $25,000 to $34,999 | 7 | 3.6% |
| $35,000 to $49,999 | 6 | 3.1% |
| $50,000 to $74,999 | 27 | 13.9% |
| $75,000 to $99,999 | 65 | 33.5% |
| $100,000 to $149,999 | 21 | 10.8% |
| $150,000 to $199,999 | 33 | 17.0% |
| $200,000+ | 27 | 13.9% |
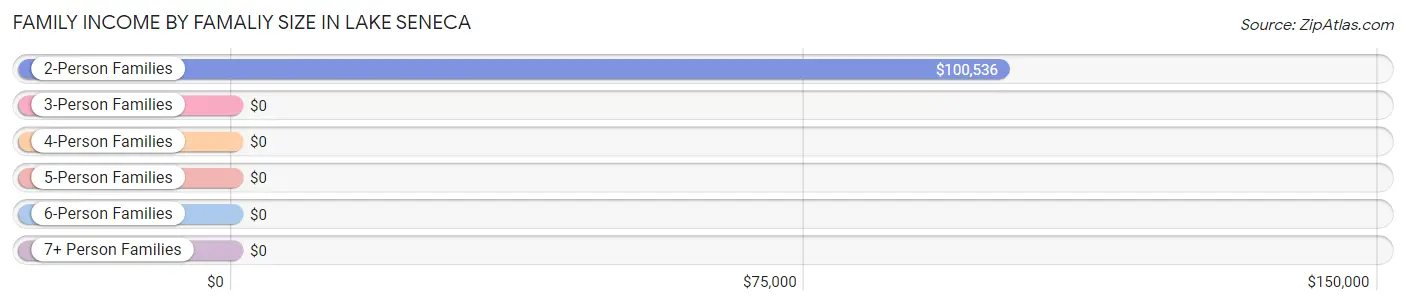
Family Income by Famaliy Size in Lake Seneca
2-person families (105 | 54.1%) account for the highest median family income in Lake Seneca with $100,536 per family, while 2-person families (105 | 54.1%) have the highest median income of $50,268 per family member.
| Income Bracket | # Families | Median Income |
| 2-Person Families | 105 (54.1%) | $100,536 |
| 3-Person Families | 56 (28.9%) | $0 |
| 4-Person Families | 18 (9.3%) | $0 |
| 5-Person Families | 15 (7.7%) | $0 |
| 6-Person Families | 0 (0.0%) | $0 |
| 7+ Person Families | 0 (0.0%) | $0 |
| Total | 194 (100.0%) | $83,333 |
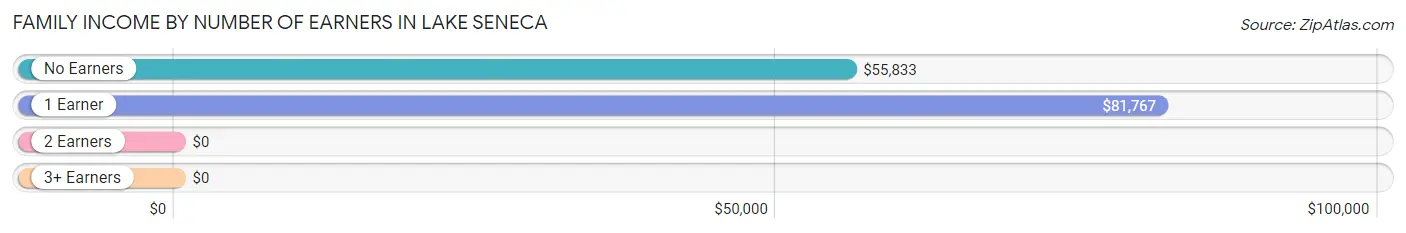
Family Income by Number of Earners in Lake Seneca
| Number of Earners | # Families | Median Income |
| No Earners | 46 (23.7%) | $55,833 |
| 1 Earner | 53 (27.3%) | $81,767 |
| 2 Earners | 68 (35.0%) | $0 |
| 3+ Earners | 27 (13.9%) | $0 |
| Total | 194 (100.0%) | $83,333 |
Household Income in Lake Seneca
Household Income Brackets in Lake Seneca
With 74 households falling in the category, the $75,000 to $99,999 income range is the most frequent in Lake Seneca, accounting for 27.8% of all households.
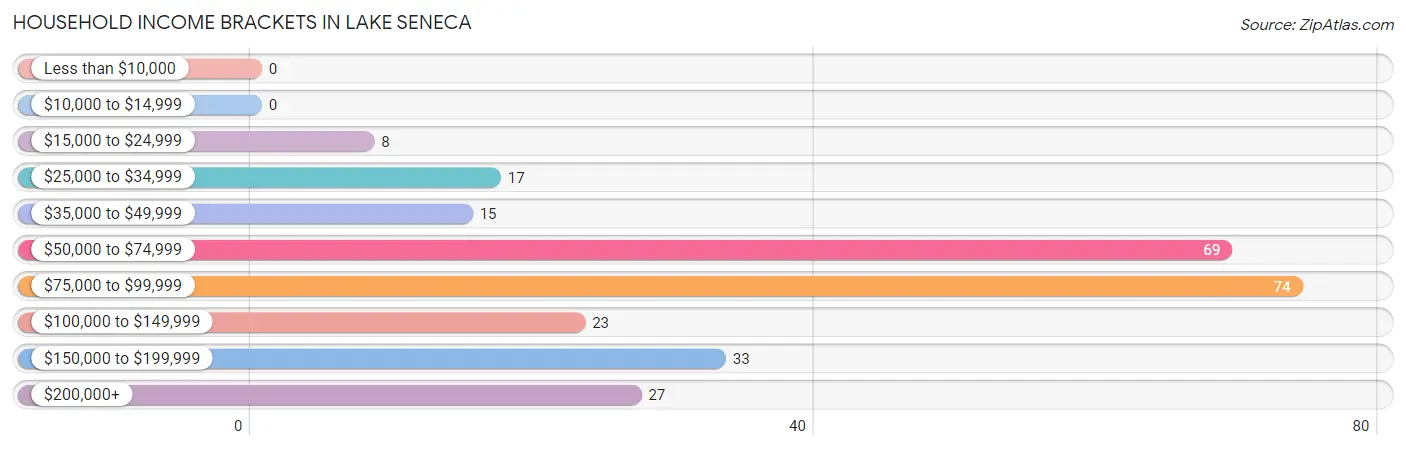
| Income Bracket | # Households | % Households |
| Less than $10,000 | 0 | 0.0% |
| $10,000 to $14,999 | 0 | 0.0% |
| $15,000 to $24,999 | 8 | 3.0% |
| $25,000 to $34,999 | 17 | 6.4% |
| $35,000 to $49,999 | 15 | 5.6% |
| $50,000 to $74,999 | 69 | 25.9% |
| $75,000 to $99,999 | 74 | 27.8% |
| $100,000 to $149,999 | 23 | 8.6% |
| $150,000 to $199,999 | 33 | 12.4% |
| $200,000+ | 27 | 10.2% |
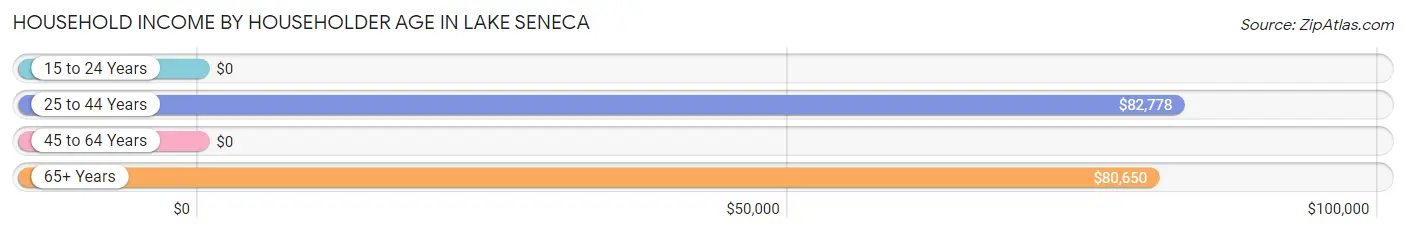
Household Income by Householder Age in Lake Seneca
The median household income in Lake Seneca is $81,200, with the highest median household income of $82,778 found in the 25 to 44 years age bracket for the primary householder. A total of 68 households (25.6%) fall into this category.
| Income Bracket | # Households | Median Income |
| 15 to 24 Years | 0 (0.0%) | $0 |
| 25 to 44 Years | 68 (25.6%) | $82,778 |
| 45 to 64 Years | 96 (36.1%) | $0 |
| 65+ Years | 102 (38.4%) | $80,650 |
| Total | 266 (100.0%) | $81,200 |
Poverty in Lake Seneca
Income Below Poverty by Sex and Age in Lake Seneca
| Age Bracket | Male | Female |
| Under 5 Years | 0 (0.0%) | 0 (0.0%) |
| 5 Years | 0 (0.0%) | 0 (0.0%) |
| 6 to 11 Years | 0 (0.0%) | 0 (0.0%) |
| 12 to 14 Years | 0 (0.0%) | 0 (0.0%) |
| 15 Years | 0 (0.0%) | 0 (0.0%) |
| 16 and 17 Years | 0 (0.0%) | 0 (0.0%) |
| 18 to 24 Years | 0 (0.0%) | 0 (0.0%) |
| 25 to 34 Years | 0 (0.0%) | 0 (0.0%) |
| 35 to 44 Years | 0 (0.0%) | 0 (0.0%) |
| 45 to 54 Years | 0 (0.0%) | 0 (0.0%) |
| 55 to 64 Years | 0 (0.0%) | 0 (0.0%) |
| 65 to 74 Years | 0 (0.0%) | 0 (0.0%) |
| 75 Years and over | 0 (0.0%) | 0 (0.0%) |
| Total | 0 (0.0%) | 0 (0.0%) |
Income Above Poverty by Sex and Age in Lake Seneca
According to the poverty statistics in Lake Seneca, males aged 16 and 17 years and females aged under 5 years are the age groups that are most secure financially, with 100.0% of males and 100.0% of females in these age groups living above the poverty line.
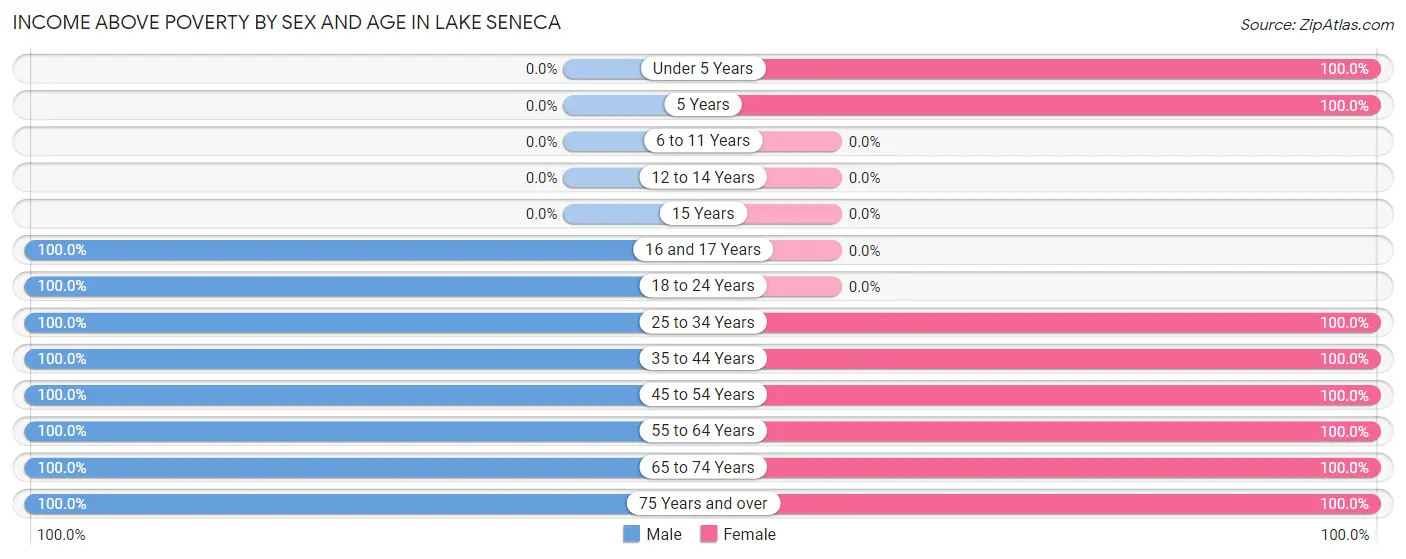
| Age Bracket | Male | Female |
| Under 5 Years | 0 (0.0%) | 40 (100.0%) |
| 5 Years | 0 (0.0%) | 41 (100.0%) |
| 6 to 11 Years | 0 (0.0%) | 0 (0.0%) |
| 12 to 14 Years | 0 (0.0%) | 0 (0.0%) |
| 15 Years | 0 (0.0%) | 0 (0.0%) |
| 16 and 17 Years | 14 (100.0%) | 0 (0.0%) |
| 18 to 24 Years | 9 (100.0%) | 0 (0.0%) |
| 25 to 34 Years | 31 (100.0%) | 25 (100.0%) |
| 35 to 44 Years | 35 (100.0%) | 40 (100.0%) |
| 45 to 54 Years | 30 (100.0%) | 62 (100.0%) |
| 55 to 64 Years | 51 (100.0%) | 59 (100.0%) |
| 65 to 74 Years | 46 (100.0%) | 31 (100.0%) |
| 75 Years and over | 58 (100.0%) | 46 (100.0%) |
| Total | 274 (100.0%) | 344 (100.0%) |
Income Below Poverty Among Married-Couple Families in Lake Seneca
| Children | Above Poverty | Below Poverty |
| No Children | 143 (100.0%) | 0 (0.0%) |
| 1 or 2 Children | 36 (100.0%) | 0 (0.0%) |
| 3 or 4 Children | 15 (100.0%) | 0 (0.0%) |
| 5 or more Children | 0 (0.0%) | 0 (0.0%) |
| Total | 194 (100.0%) | 0 (0.0%) |
Income Below Poverty Among Single-Parent Households in Lake Seneca
| Children | Single Father | Single Mother |
| No Children | 0 (0.0%) | 0 (0.0%) |
| 1 or 2 Children | 0 (0.0%) | 0 (0.0%) |
| 3 or 4 Children | 0 (0.0%) | 0 (0.0%) |
| 5 or more Children | 0 (0.0%) | 0 (0.0%) |
| Total | 0 (0.0%) | 0 (0.0%) |
Income Below Poverty Among Married-Couple vs Single-Parent Households in Lake Seneca
| Children | Married-Couple Families | Single-Parent Households |
| No Children | 0 (0.0%) | 0 (0.0%) |
| 1 or 2 Children | 0 (0.0%) | 0 (0.0%) |
| 3 or 4 Children | 0 (0.0%) | 0 (0.0%) |
| 5 or more Children | 0 (0.0%) | 0 (0.0%) |
| Total | 0 (0.0%) | 0 (0.0%) |
Employment Characteristics in Lake Seneca
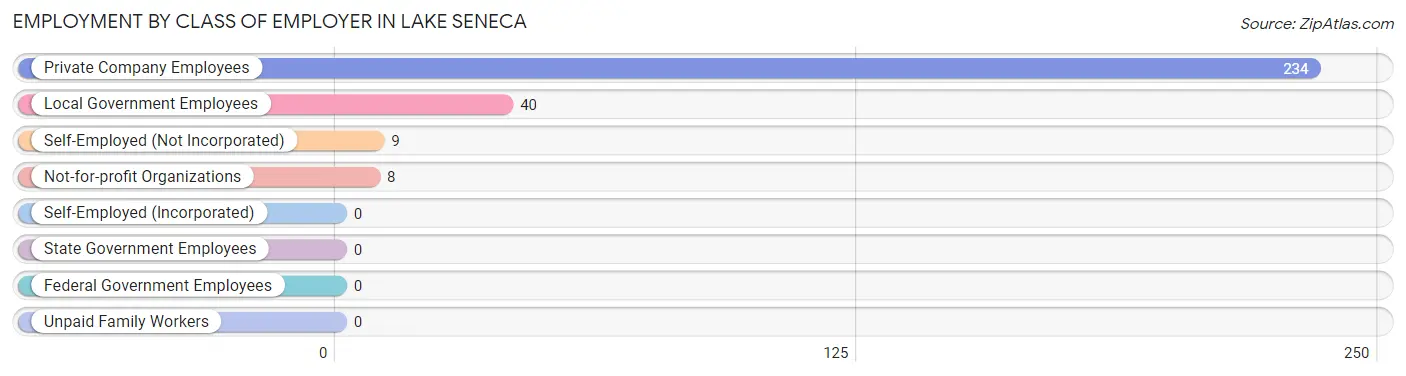
Employment by Class of Employer in Lake Seneca
Among the 291 employed individuals in Lake Seneca, private company employees (234 | 80.4%), local government employees (40 | 13.8%), and self-employed (not incorporated) (9 | 3.1%) make up the most common classes of employment.
| Employer Class | # Employees | % Employees |
| Private Company Employees | 234 | 80.4% |
| Self-Employed (Incorporated) | 0 | 0.0% |
| Self-Employed (Not Incorporated) | 9 | 3.1% |
| Not-for-profit Organizations | 8 | 2.8% |
| Local Government Employees | 40 | 13.8% |
| State Government Employees | 0 | 0.0% |
| Federal Government Employees | 0 | 0.0% |
| Unpaid Family Workers | 0 | 0.0% |
| Total | 291 | 100.0% |
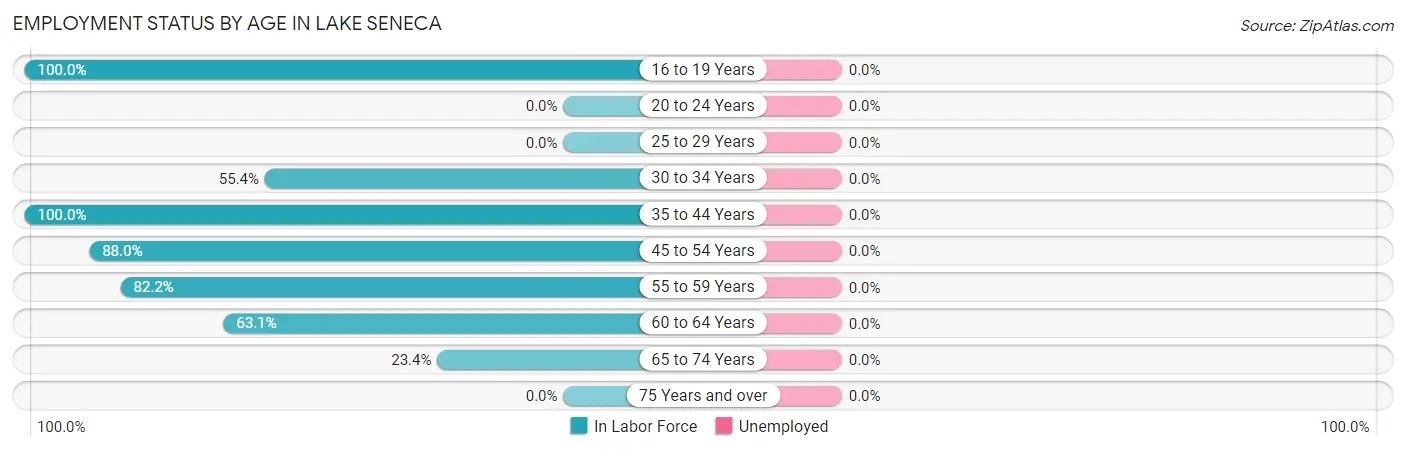
Employment Status by Age in Lake Seneca
| Age Bracket | In Labor Force | Unemployed |
| 16 to 19 Years | 23 (100.0%) | 0 (0.0%) |
| 20 to 24 Years | 0 (0.0%) | 0 (0.0%) |
| 25 to 29 Years | 0 (0.0%) | 0 (0.0%) |
| 30 to 34 Years | 31 (55.4%) | 0 (0.0%) |
| 35 to 44 Years | 75 (100.0%) | 0 (0.0%) |
| 45 to 54 Years | 81 (88.0%) | 0 (0.0%) |
| 55 to 59 Years | 37 (82.2%) | 0 (0.0%) |
| 60 to 64 Years | 41 (63.1%) | 0 (0.0%) |
| 65 to 74 Years | 18 (23.4%) | 0 (0.0%) |
| 75 Years and over | 0 (0.0%) | 0 (0.0%) |
| Total | 306 (57.0%) | 0 (0.0%) |
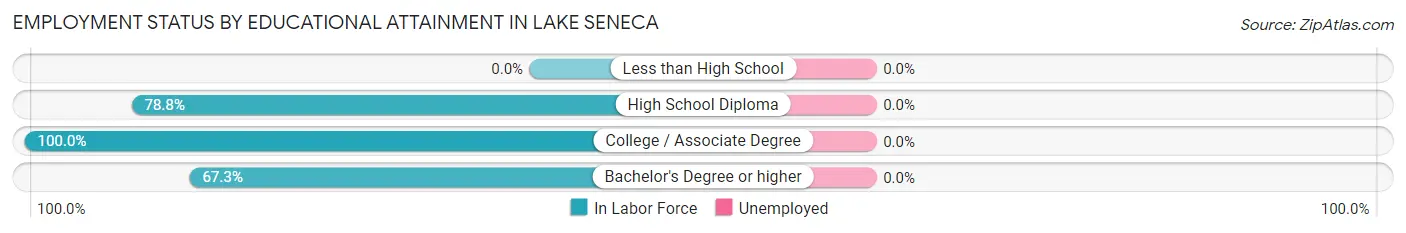
Employment Status by Educational Attainment in Lake Seneca
| Educational Attainment | In Labor Force | Unemployed |
| Less than High School | 0 (0.0%) | 0 (0.0%) |
| High School Diploma | 93 (78.8%) | 0 (0.0%) |
| College / Associate Degree | 96 (100.0%) | 0 (0.0%) |
| Bachelor's Degree or higher | 76 (67.3%) | 0 (0.0%) |
| Total | 265 (79.6%) | 0 (0.0%) |
Employment Occupations by Sex in Lake Seneca
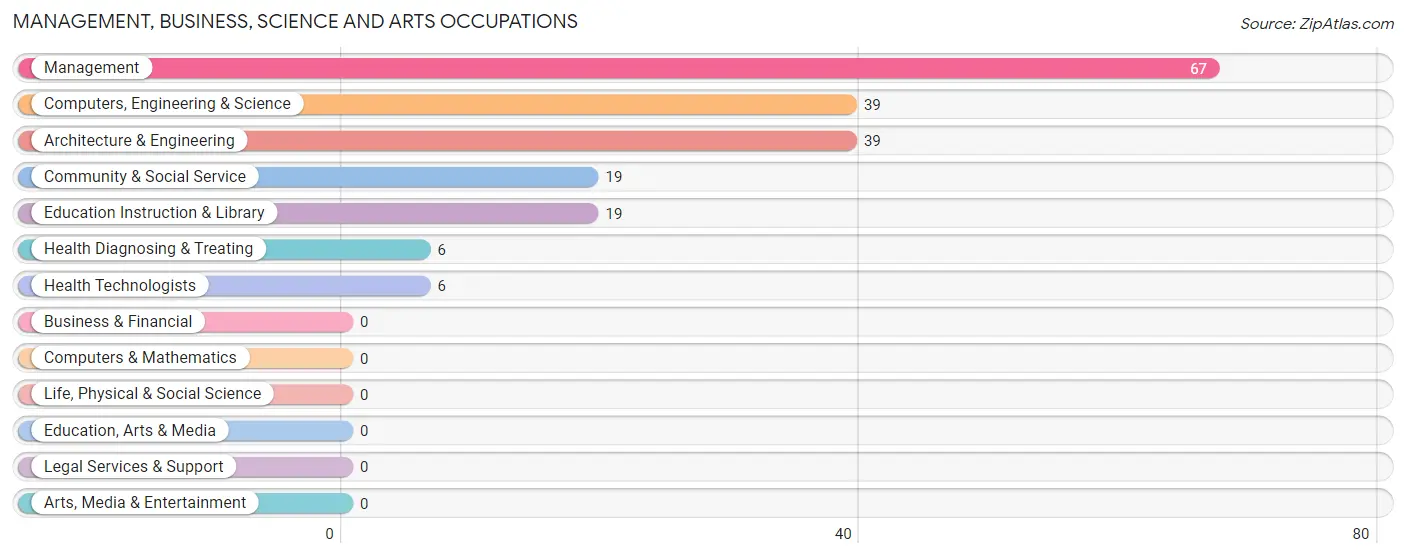
Management, Business, Science and Arts Occupations
The most common Management, Business, Science and Arts occupations in Lake Seneca are Management (67 | 21.9%), Computers, Engineering & Science (39 | 12.8%), Architecture & Engineering (39 | 12.8%), Community & Social Service (19 | 6.2%), and Education Instruction & Library (19 | 6.2%).
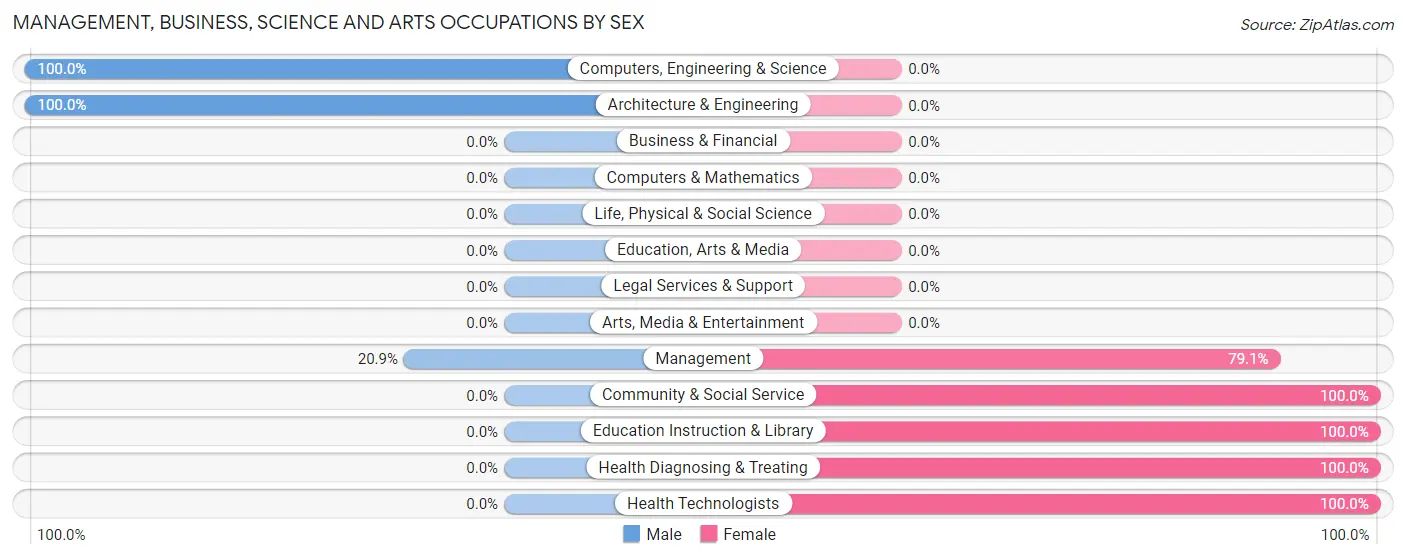
Management, Business, Science and Arts Occupations by Sex
Within the Management, Business, Science and Arts occupations in Lake Seneca, the most male-oriented occupations are Computers, Engineering & Science (100.0%), Architecture & Engineering (100.0%), and Management (20.9%), while the most female-oriented occupations are Community & Social Service (100.0%), Education Instruction & Library (100.0%), and Health Diagnosing & Treating (100.0%).
| Occupation | Male | Female |
| Management | 14 (20.9%) | 53 (79.1%) |
| Business & Financial | 0 (0.0%) | 0 (0.0%) |
| Computers, Engineering & Science | 39 (100.0%) | 0 (0.0%) |
| Computers & Mathematics | 0 (0.0%) | 0 (0.0%) |
| Architecture & Engineering | 39 (100.0%) | 0 (0.0%) |
| Life, Physical & Social Science | 0 (0.0%) | 0 (0.0%) |
| Community & Social Service | 0 (0.0%) | 19 (100.0%) |
| Education, Arts & Media | 0 (0.0%) | 0 (0.0%) |
| Legal Services & Support | 0 (0.0%) | 0 (0.0%) |
| Education Instruction & Library | 0 (0.0%) | 19 (100.0%) |
| Arts, Media & Entertainment | 0 (0.0%) | 0 (0.0%) |
| Health Diagnosing & Treating | 0 (0.0%) | 6 (100.0%) |
| Health Technologists | 0 (0.0%) | 6 (100.0%) |
| Total (Category) | 53 (40.5%) | 78 (59.5%) |
| Total (Overall) | 161 (52.6%) | 145 (47.4%) |
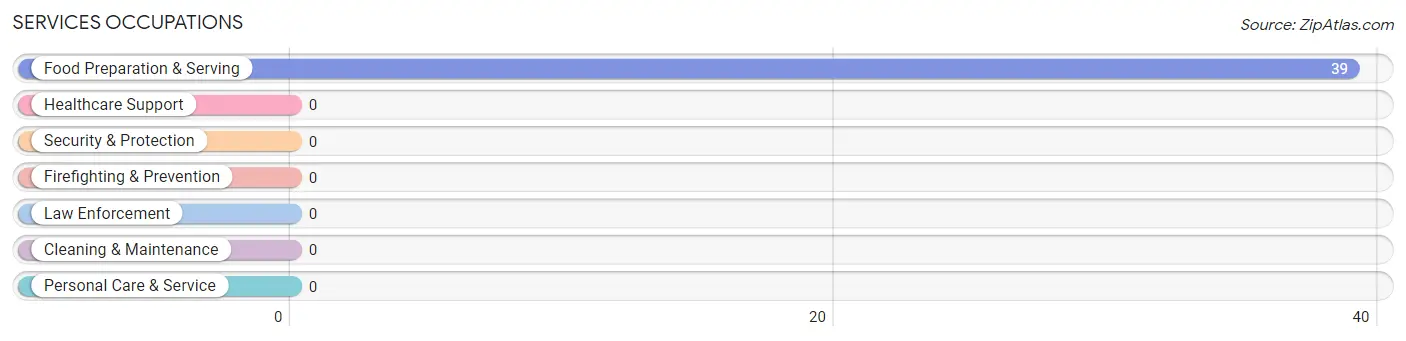
Services Occupations
The most common Services occupations in Lake Seneca are , and Food Preparation & Serving (39 | 12.8%).
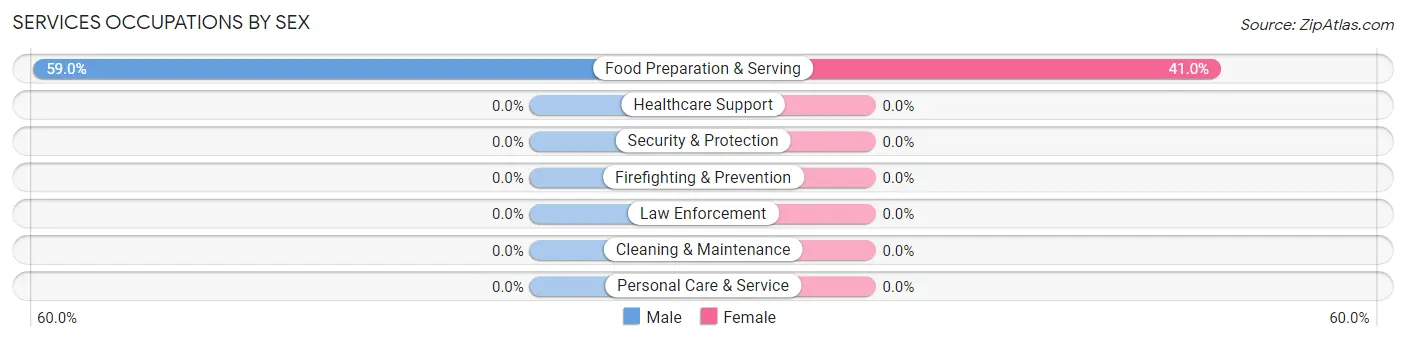
Services Occupations by Sex
| Occupation | Male | Female |
| Healthcare Support | 0 (0.0%) | 0 (0.0%) |
| Security & Protection | 0 (0.0%) | 0 (0.0%) |
| Firefighting & Prevention | 0 (0.0%) | 0 (0.0%) |
| Law Enforcement | 0 (0.0%) | 0 (0.0%) |
| Food Preparation & Serving | 23 (59.0%) | 16 (41.0%) |
| Cleaning & Maintenance | 0 (0.0%) | 0 (0.0%) |
| Personal Care & Service | 0 (0.0%) | 0 (0.0%) |
| Total (Category) | 23 (59.0%) | 16 (41.0%) |
| Total (Overall) | 161 (52.6%) | 145 (47.4%) |
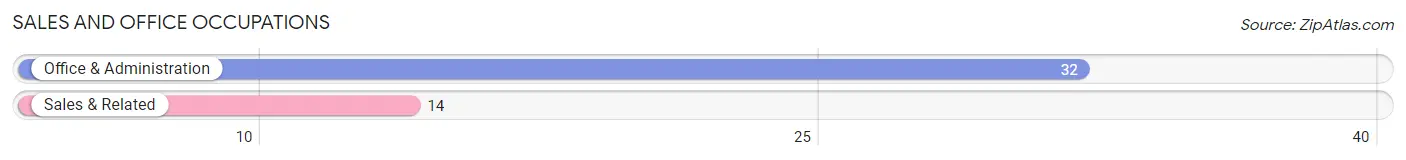
Sales and Office Occupations
The most common Sales and Office occupations in Lake Seneca are Office & Administration (32 | 10.5%), and Sales & Related (14 | 4.6%).
Sales and Office Occupations by Sex
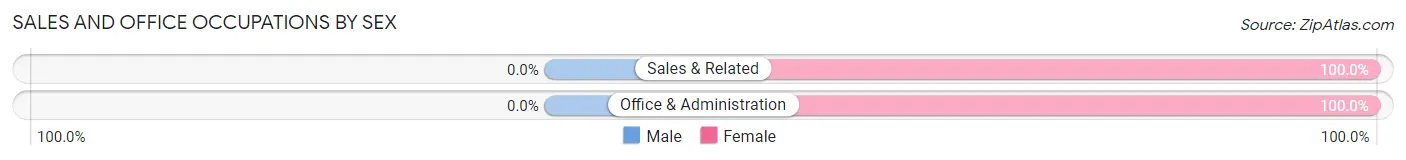
| Occupation | Male | Female |
| Sales & Related | 0 (0.0%) | 14 (100.0%) |
| Office & Administration | 0 (0.0%) | 32 (100.0%) |
| Total (Category) | 0 (0.0%) | 46 (100.0%) |
| Total (Overall) | 161 (52.6%) | 145 (47.4%) |
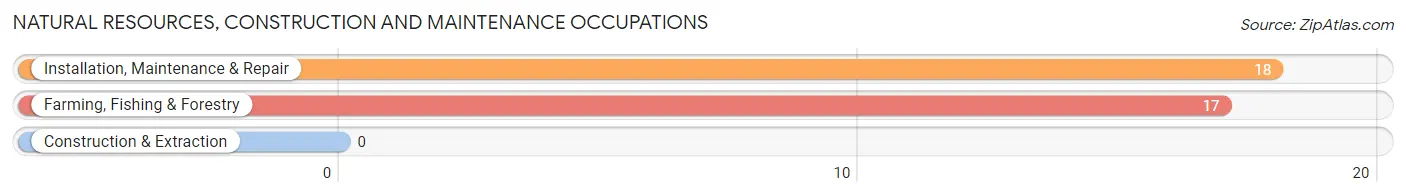
Natural Resources, Construction and Maintenance Occupations
The most common Natural Resources, Construction and Maintenance occupations in Lake Seneca are Installation, Maintenance & Repair (18 | 5.9%), and Farming, Fishing & Forestry (17 | 5.6%).
Natural Resources, Construction and Maintenance Occupations by Sex
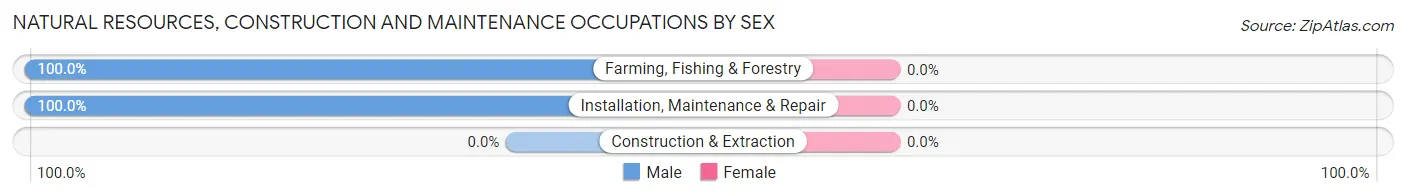
| Occupation | Male | Female |
| Farming, Fishing & Forestry | 17 (100.0%) | 0 (0.0%) |
| Construction & Extraction | 0 (0.0%) | 0 (0.0%) |
| Installation, Maintenance & Repair | 18 (100.0%) | 0 (0.0%) |
| Total (Category) | 35 (100.0%) | 0 (0.0%) |
| Total (Overall) | 161 (52.6%) | 145 (47.4%) |
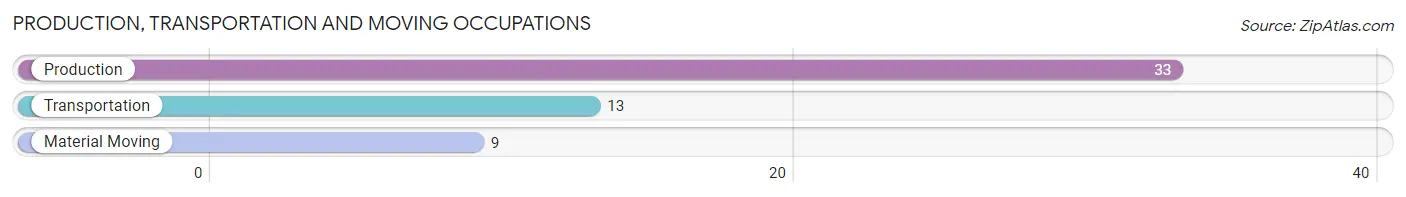
Production, Transportation and Moving Occupations
The most common Production, Transportation and Moving occupations in Lake Seneca are Production (33 | 10.8%), Transportation (13 | 4.3%), and Material Moving (9 | 2.9%).
Production, Transportation and Moving Occupations by Sex
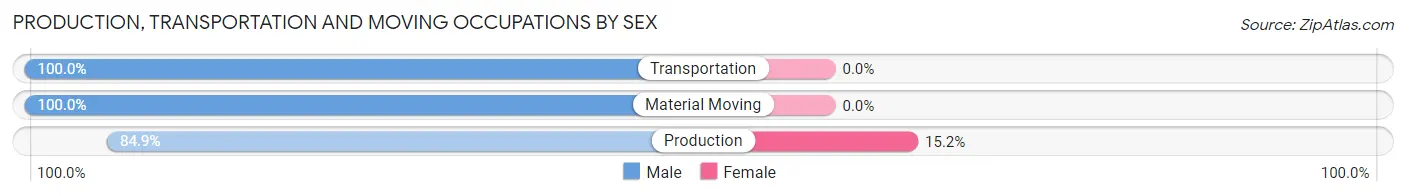
| Occupation | Male | Female |
| Production | 28 (84.9%) | 5 (15.1%) |
| Transportation | 13 (100.0%) | 0 (0.0%) |
| Material Moving | 9 (100.0%) | 0 (0.0%) |
| Total (Category) | 50 (90.9%) | 5 (9.1%) |
| Total (Overall) | 161 (52.6%) | 145 (47.4%) |
Employment Industries by Sex in Lake Seneca
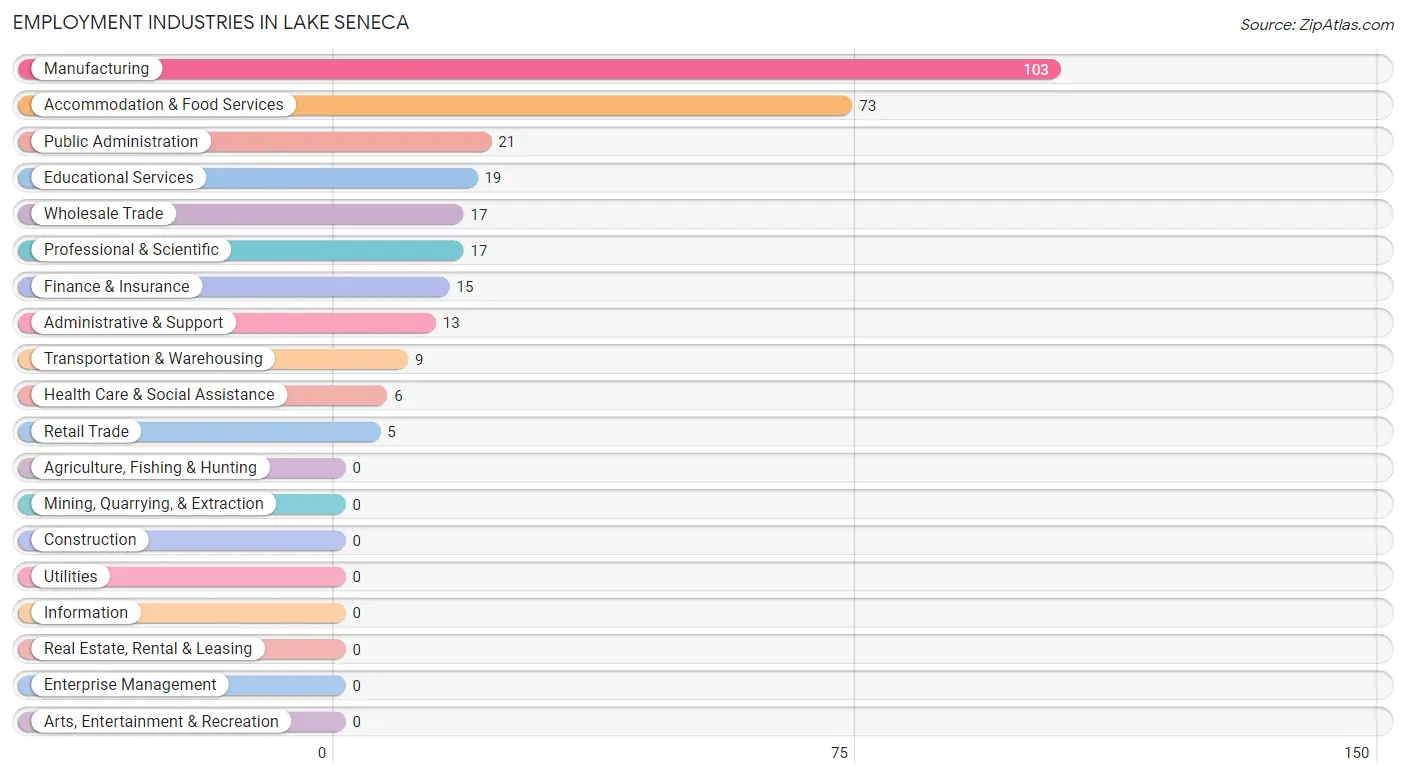
Employment Industries in Lake Seneca
The major employment industries in Lake Seneca include Manufacturing (103 | 33.7%), Accommodation & Food Services (73 | 23.9%), Public Administration (21 | 6.9%), Educational Services (19 | 6.2%), and Wholesale Trade (17 | 5.6%).
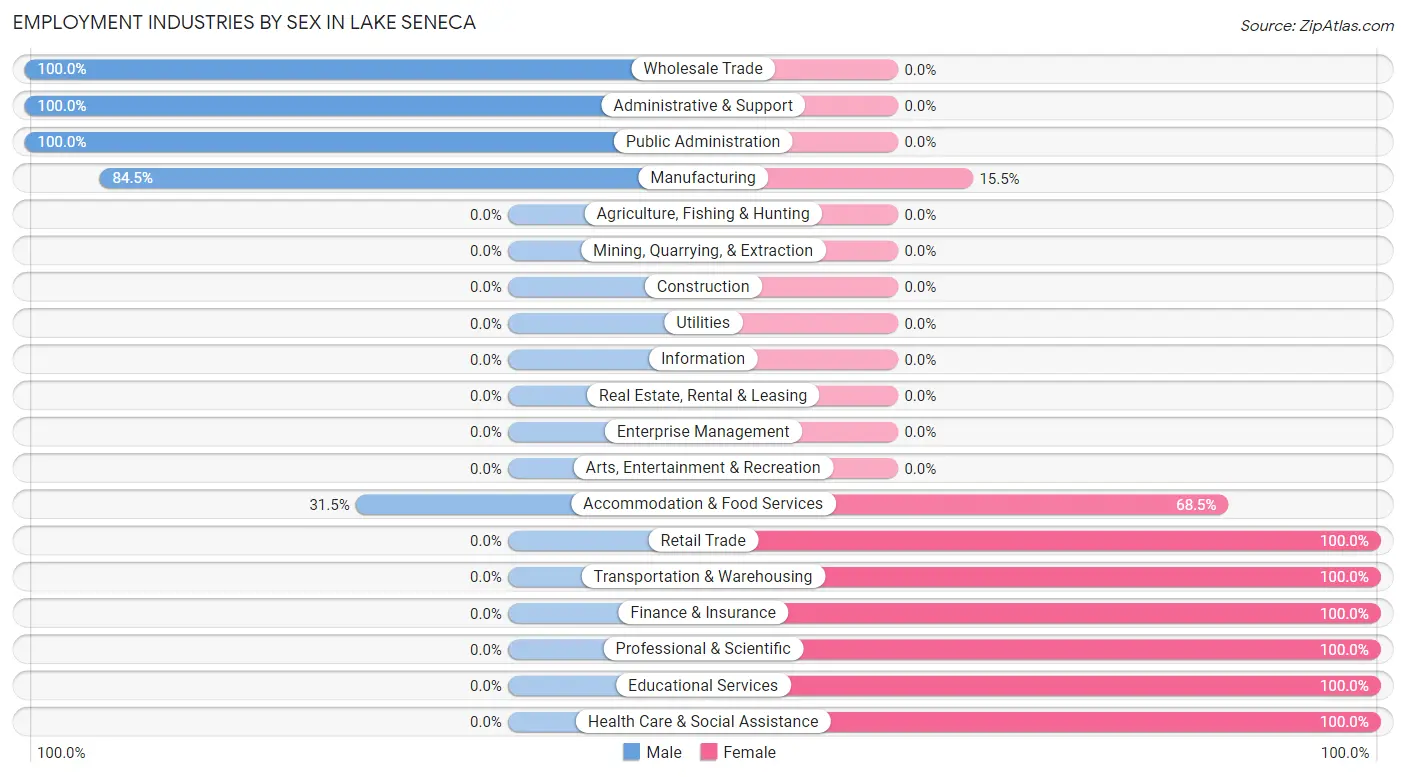
Employment Industries by Sex in Lake Seneca
The Lake Seneca industries that see more men than women are Wholesale Trade (100.0%), Administrative & Support (100.0%), and Public Administration (100.0%), whereas the industries that tend to have a higher number of women are Retail Trade (100.0%), Transportation & Warehousing (100.0%), and Finance & Insurance (100.0%).
| Industry | Male | Female |
| Agriculture, Fishing & Hunting | 0 (0.0%) | 0 (0.0%) |
| Mining, Quarrying, & Extraction | 0 (0.0%) | 0 (0.0%) |
| Construction | 0 (0.0%) | 0 (0.0%) |
| Manufacturing | 87 (84.5%) | 16 (15.5%) |
| Wholesale Trade | 17 (100.0%) | 0 (0.0%) |
| Retail Trade | 0 (0.0%) | 5 (100.0%) |
| Transportation & Warehousing | 0 (0.0%) | 9 (100.0%) |
| Utilities | 0 (0.0%) | 0 (0.0%) |
| Information | 0 (0.0%) | 0 (0.0%) |
| Finance & Insurance | 0 (0.0%) | 15 (100.0%) |
| Real Estate, Rental & Leasing | 0 (0.0%) | 0 (0.0%) |
| Professional & Scientific | 0 (0.0%) | 17 (100.0%) |
| Enterprise Management | 0 (0.0%) | 0 (0.0%) |
| Administrative & Support | 13 (100.0%) | 0 (0.0%) |
| Educational Services | 0 (0.0%) | 19 (100.0%) |
| Health Care & Social Assistance | 0 (0.0%) | 6 (100.0%) |
| Arts, Entertainment & Recreation | 0 (0.0%) | 0 (0.0%) |
| Accommodation & Food Services | 23 (31.5%) | 50 (68.5%) |
| Public Administration | 21 (100.0%) | 0 (0.0%) |
| Total | 161 (52.6%) | 145 (47.4%) |
Education in Lake Seneca
School Enrollment in Lake Seneca
The most common levels of schooling among the 80 students in Lake Seneca are nursery / preschool (51 | 63.7%), elementary school (15 | 18.8%), and high school (14 | 17.5%).
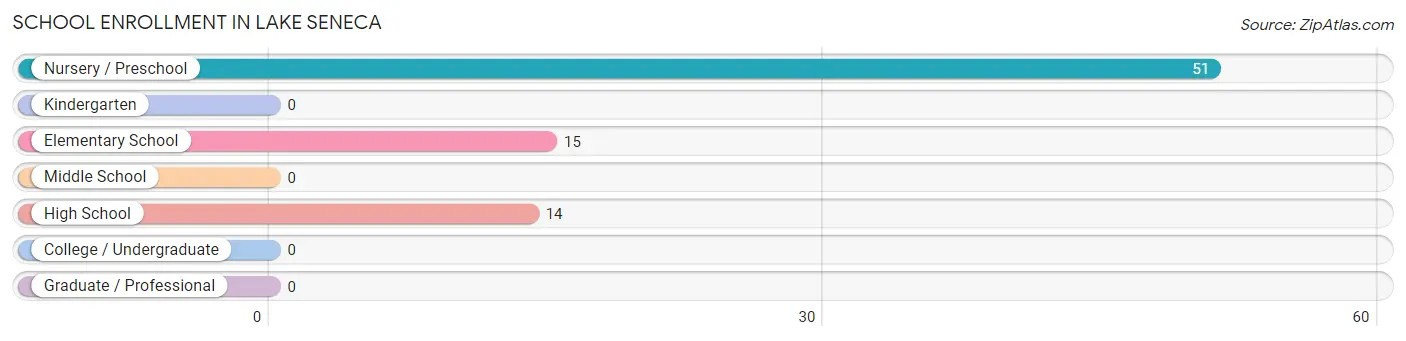
| School Level | # Students | % Students |
| Nursery / Preschool | 51 | 63.7% |
| Kindergarten | 0 | 0.0% |
| Elementary School | 15 | 18.8% |
| Middle School | 0 | 0.0% |
| High School | 14 | 17.5% |
| College / Undergraduate | 0 | 0.0% |
| Graduate / Professional | 0 | 0.0% |
| Total | 80 | 100.0% |
School Enrollment by Age by Funding Source in Lake Seneca
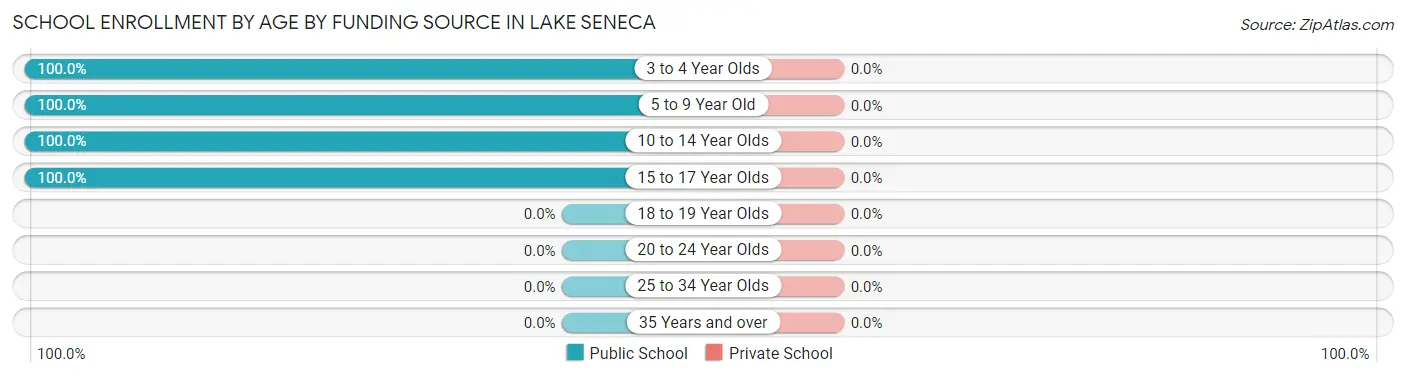
| Age Bracket | Public School | Private School |
| 3 to 4 Year Olds | 10 (100.0%) | 0 (0.0%) |
| 5 to 9 Year Old | 41 (100.0%) | 0 (0.0%) |
| 10 to 14 Year Olds | 15 (100.0%) | 0 (0.0%) |
| 15 to 17 Year Olds | 14 (100.0%) | 0 (0.0%) |
| 18 to 19 Year Olds | 0 (0.0%) | 0 (0.0%) |
| 20 to 24 Year Olds | 0 (0.0%) | 0 (0.0%) |
| 25 to 34 Year Olds | 0 (0.0%) | 0 (0.0%) |
| 35 Years and over | 0 (0.0%) | 0 (0.0%) |
| Total | 80 (100.0%) | 0 (0.0%) |
Educational Attainment by Field of Study in Lake Seneca
Education (71 | 35.5%), business (32 | 16.0%), arts & humanities (21 | 10.5%), engineering (18 | 9.0%), and bio, nature & agricultural (15 | 7.5%) are the most common fields of study among 200 individuals in Lake Seneca who have obtained a bachelor's degree or higher.
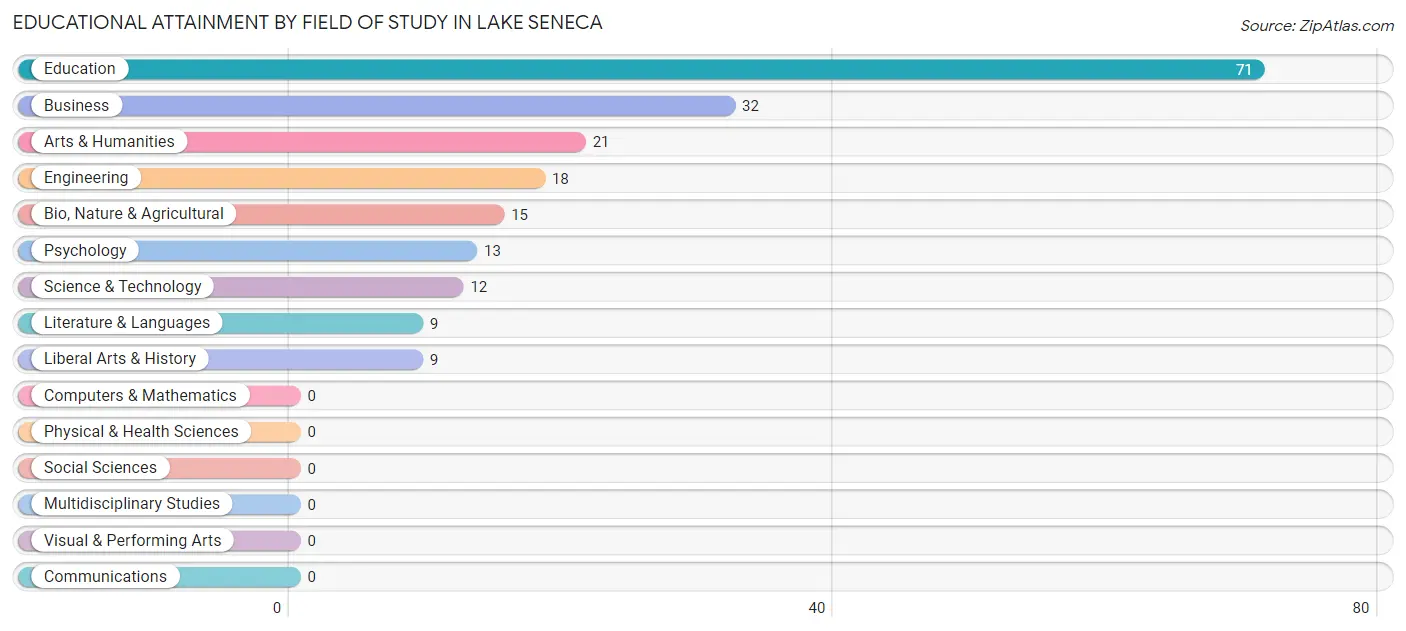
| Field of Study | # Graduates | % Graduates |
| Computers & Mathematics | 0 | 0.0% |
| Bio, Nature & Agricultural | 15 | 7.5% |
| Physical & Health Sciences | 0 | 0.0% |
| Psychology | 13 | 6.5% |
| Social Sciences | 0 | 0.0% |
| Engineering | 18 | 9.0% |
| Multidisciplinary Studies | 0 | 0.0% |
| Science & Technology | 12 | 6.0% |
| Business | 32 | 16.0% |
| Education | 71 | 35.5% |
| Literature & Languages | 9 | 4.5% |
| Liberal Arts & History | 9 | 4.5% |
| Visual & Performing Arts | 0 | 0.0% |
| Communications | 0 | 0.0% |
| Arts & Humanities | 21 | 10.5% |
| Total | 200 | 100.0% |
Transportation & Commute in Lake Seneca
Vehicle Availability by Sex in Lake Seneca
The most prevalent vehicle ownership categories in Lake Seneca are males with 3 vehicles (71, accounting for 44.1%) and females with 3 vehicles (68, making up 54.6%).
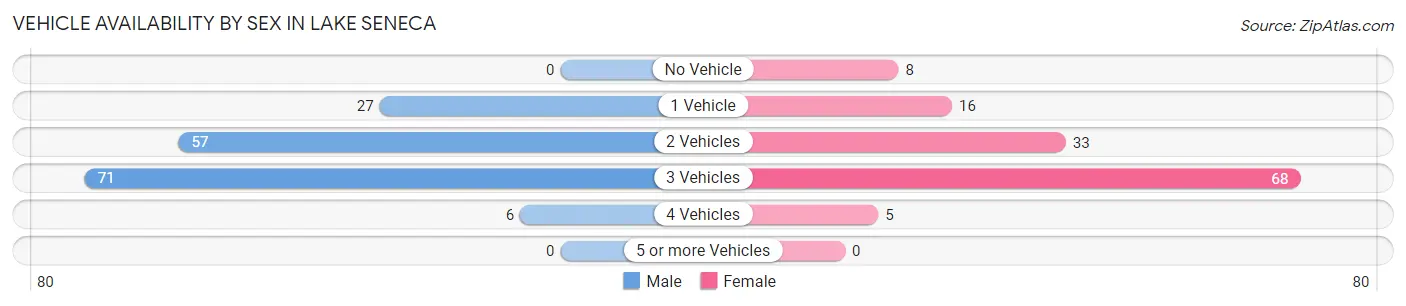
| Vehicles Available | Male | Female |
| No Vehicle | 0 (0.0%) | 8 (6.1%) |
| 1 Vehicle | 27 (16.8%) | 16 (12.3%) |
| 2 Vehicles | 57 (35.4%) | 33 (25.4%) |
| 3 Vehicles | 71 (44.1%) | 68 (52.3%) |
| 4 Vehicles | 6 (3.7%) | 5 (3.8%) |
| 5 or more Vehicles | 0 (0.0%) | 0 (0.0%) |
| Total | 161 (100.0%) | 130 (100.0%) |
Commute Time in Lake Seneca
The most frequently occuring commute durations in Lake Seneca are 30 to 34 minutes (62 commuters, 22.6%), 15 to 19 minutes (49 commuters, 17.9%), and 20 to 24 minutes (49 commuters, 17.9%).
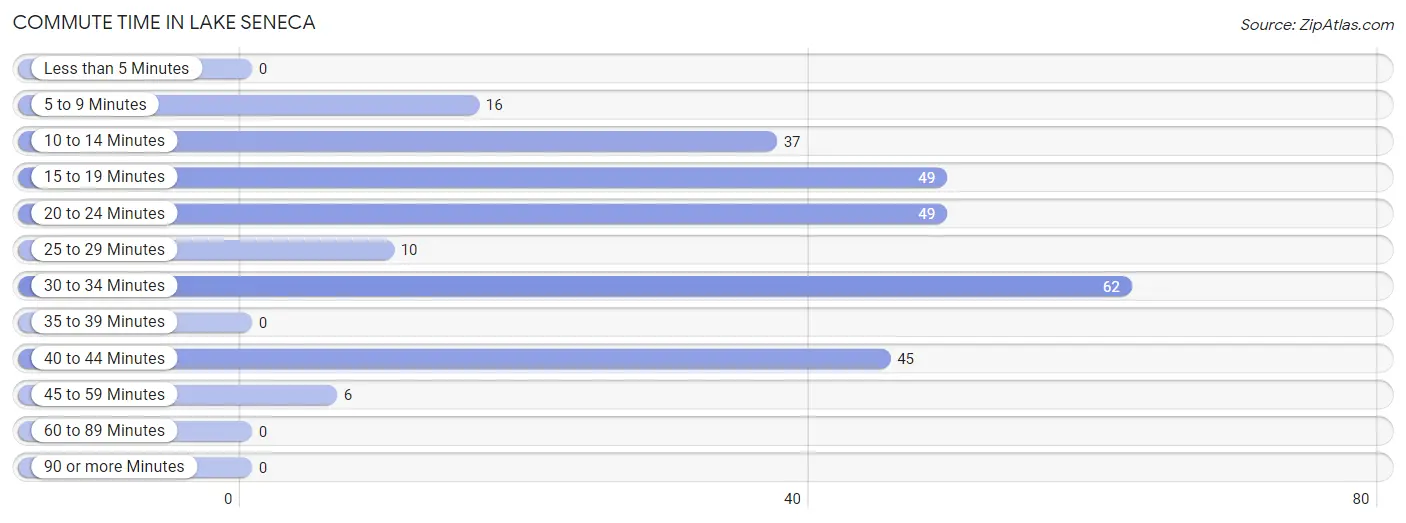
| Commute Time | # Commuters | % Commuters |
| Less than 5 Minutes | 0 | 0.0% |
| 5 to 9 Minutes | 16 | 5.8% |
| 10 to 14 Minutes | 37 | 13.5% |
| 15 to 19 Minutes | 49 | 17.9% |
| 20 to 24 Minutes | 49 | 17.9% |
| 25 to 29 Minutes | 10 | 3.6% |
| 30 to 34 Minutes | 62 | 22.6% |
| 35 to 39 Minutes | 0 | 0.0% |
| 40 to 44 Minutes | 45 | 16.4% |
| 45 to 59 Minutes | 6 | 2.2% |
| 60 to 89 Minutes | 0 | 0.0% |
| 90 or more Minutes | 0 | 0.0% |
Commute Time by Sex in Lake Seneca
The most common commute times in Lake Seneca are 30 to 34 minutes (57 commuters, 35.4%) for males and 40 to 44 minutes (45 commuters, 39.8%) for females.
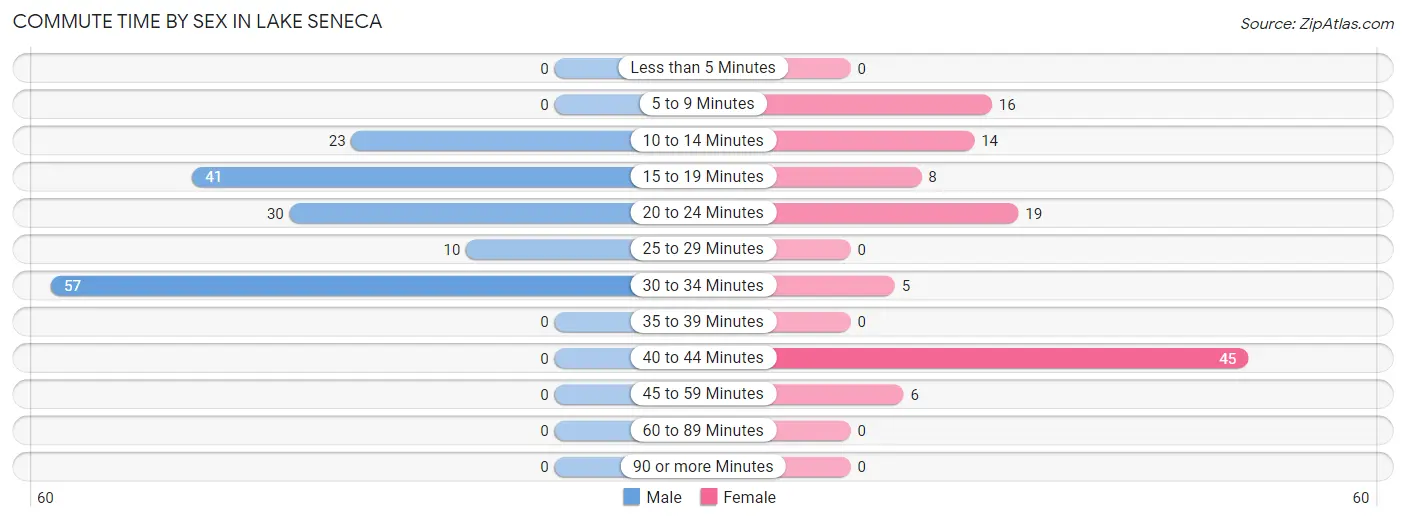
| Commute Time | Male | Female |
| Less than 5 Minutes | 0 (0.0%) | 0 (0.0%) |
| 5 to 9 Minutes | 0 (0.0%) | 16 (14.2%) |
| 10 to 14 Minutes | 23 (14.3%) | 14 (12.4%) |
| 15 to 19 Minutes | 41 (25.5%) | 8 (7.1%) |
| 20 to 24 Minutes | 30 (18.6%) | 19 (16.8%) |
| 25 to 29 Minutes | 10 (6.2%) | 0 (0.0%) |
| 30 to 34 Minutes | 57 (35.4%) | 5 (4.4%) |
| 35 to 39 Minutes | 0 (0.0%) | 0 (0.0%) |
| 40 to 44 Minutes | 0 (0.0%) | 45 (39.8%) |
| 45 to 59 Minutes | 0 (0.0%) | 6 (5.3%) |
| 60 to 89 Minutes | 0 (0.0%) | 0 (0.0%) |
| 90 or more Minutes | 0 (0.0%) | 0 (0.0%) |
Time of Departure to Work by Sex in Lake Seneca
The most frequent times of departure to work in Lake Seneca are 7:00 AM to 7:29 AM (44, 27.3%) for males and 6:30 AM to 6:59 AM (43, 38.1%) for females.
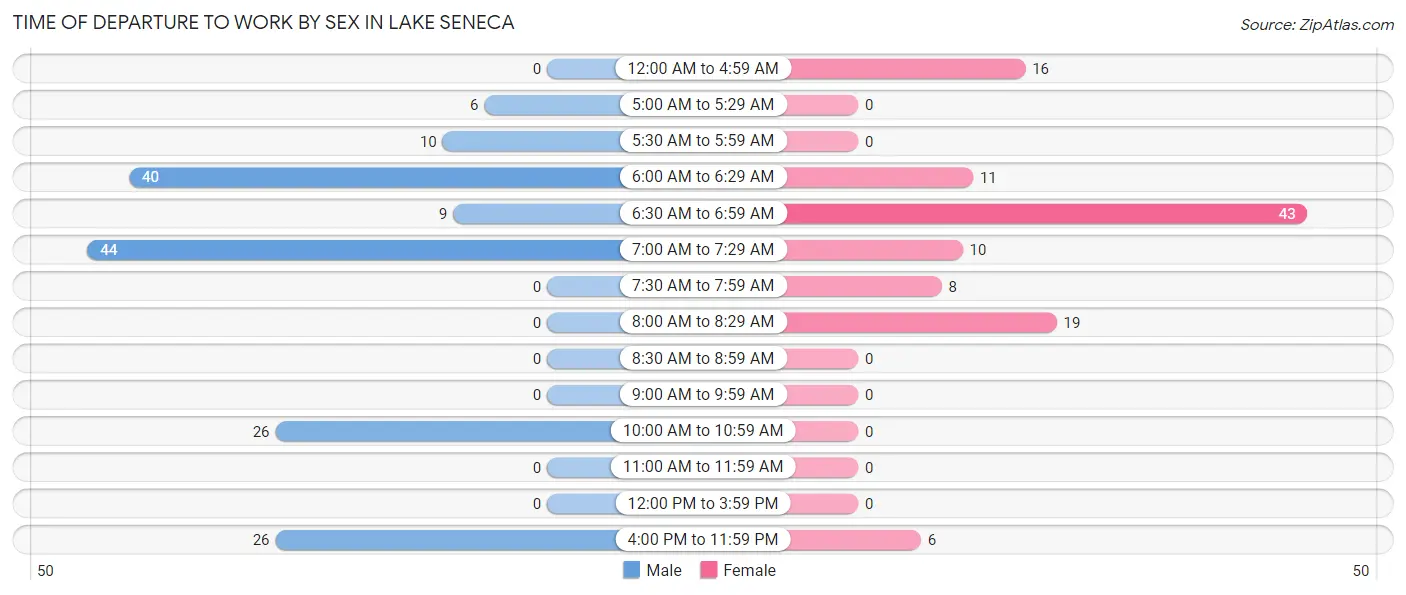
| Time of Departure | Male | Female |
| 12:00 AM to 4:59 AM | 0 (0.0%) | 16 (14.2%) |
| 5:00 AM to 5:29 AM | 6 (3.7%) | 0 (0.0%) |
| 5:30 AM to 5:59 AM | 10 (6.2%) | 0 (0.0%) |
| 6:00 AM to 6:29 AM | 40 (24.8%) | 11 (9.7%) |
| 6:30 AM to 6:59 AM | 9 (5.6%) | 43 (38.1%) |
| 7:00 AM to 7:29 AM | 44 (27.3%) | 10 (8.8%) |
| 7:30 AM to 7:59 AM | 0 (0.0%) | 8 (7.1%) |
| 8:00 AM to 8:29 AM | 0 (0.0%) | 19 (16.8%) |
| 8:30 AM to 8:59 AM | 0 (0.0%) | 0 (0.0%) |
| 9:00 AM to 9:59 AM | 0 (0.0%) | 0 (0.0%) |
| 10:00 AM to 10:59 AM | 26 (16.2%) | 0 (0.0%) |
| 11:00 AM to 11:59 AM | 0 (0.0%) | 0 (0.0%) |
| 12:00 PM to 3:59 PM | 0 (0.0%) | 0 (0.0%) |
| 4:00 PM to 11:59 PM | 26 (16.2%) | 6 (5.3%) |
| Total | 161 (100.0%) | 113 (100.0%) |
Housing Occupancy in Lake Seneca
Occupancy by Ownership in Lake Seneca
Of the total 266 dwellings in Lake Seneca, owner-occupied units account for 260 (97.7%), while renter-occupied units make up 6 (2.3%).
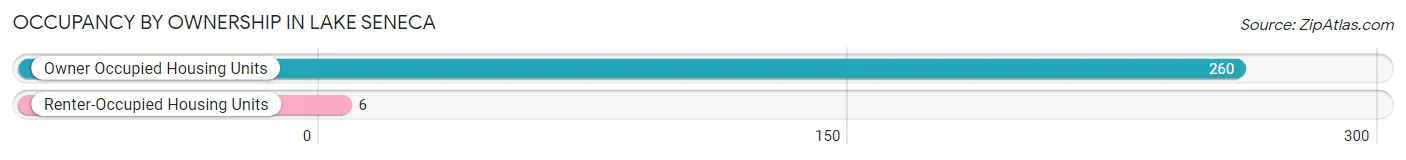
| Occupancy | # Housing Units | % Housing Units |
| Owner Occupied Housing Units | 260 | 97.7% |
| Renter-Occupied Housing Units | 6 | 2.3% |
| Total Occupied Housing Units | 266 | 100.0% |
Occupancy by Household Size in Lake Seneca
| Household Size | # Housing Units | % Housing Units |
| 1-Person Household | 55 | 20.7% |
| 2-Person Household | 105 | 39.5% |
| 3-Person Household | 73 | 27.4% |
| 4+ Person Household | 33 | 12.4% |
| Total Housing Units | 266 | 100.0% |
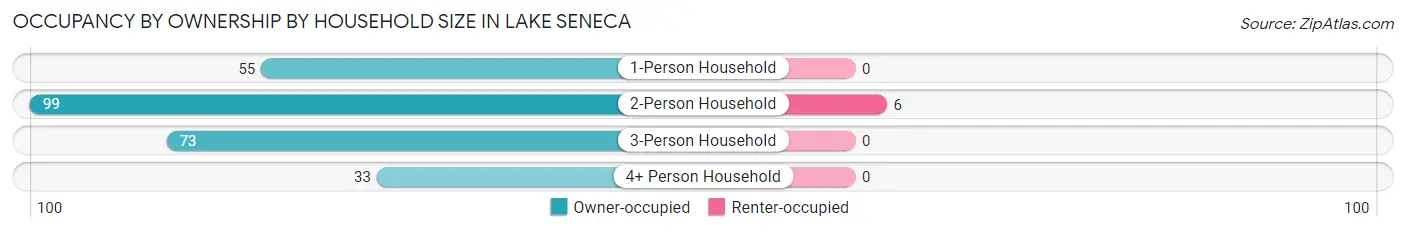
Occupancy by Ownership by Household Size in Lake Seneca
| Household Size | Owner-occupied | Renter-occupied |
| 1-Person Household | 55 (100.0%) | 0 (0.0%) |
| 2-Person Household | 99 (94.3%) | 6 (5.7%) |
| 3-Person Household | 73 (100.0%) | 0 (0.0%) |
| 4+ Person Household | 33 (100.0%) | 0 (0.0%) |
| Total Housing Units | 260 (97.7%) | 6 (2.3%) |
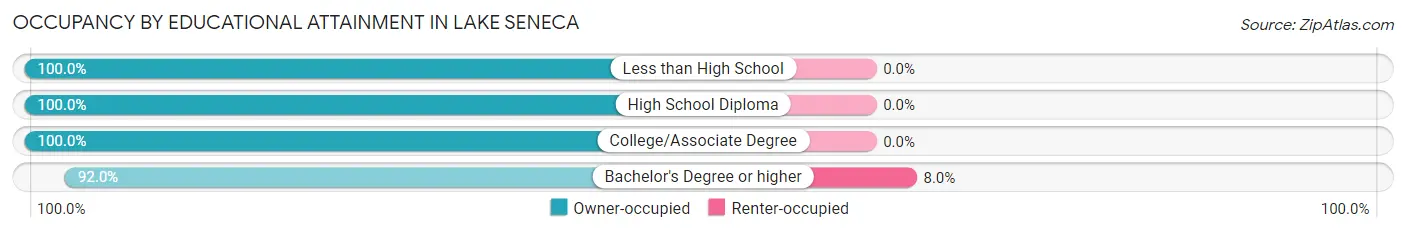
Occupancy by Educational Attainment in Lake Seneca
| Household Size | Owner-occupied | Renter-occupied |
| Less than High School | 6 (100.0%) | 0 (0.0%) |
| High School Diploma | 106 (100.0%) | 0 (0.0%) |
| College/Associate Degree | 79 (100.0%) | 0 (0.0%) |
| Bachelor's Degree or higher | 69 (92.0%) | 6 (8.0%) |
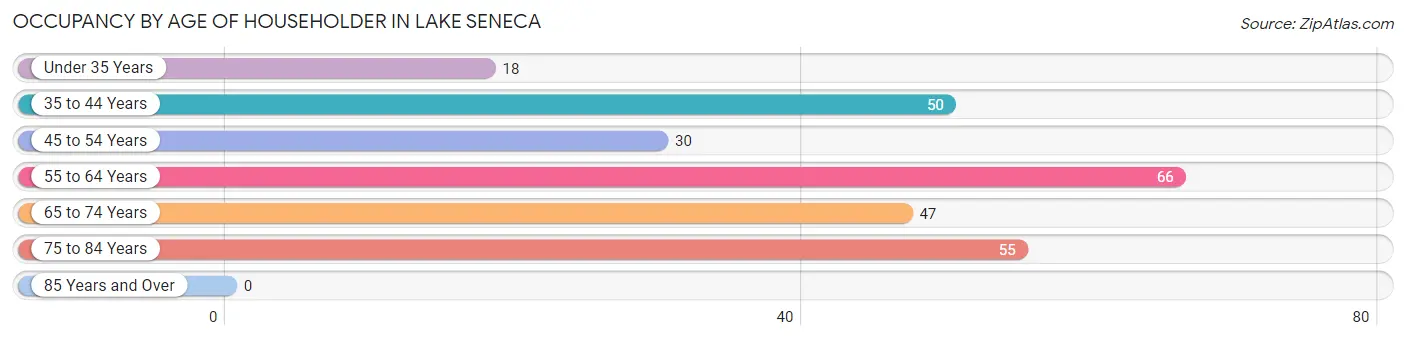
Occupancy by Age of Householder in Lake Seneca
| Age Bracket | # Households | % Households |
| Under 35 Years | 18 | 6.8% |
| 35 to 44 Years | 50 | 18.8% |
| 45 to 54 Years | 30 | 11.3% |
| 55 to 64 Years | 66 | 24.8% |
| 65 to 74 Years | 47 | 17.7% |
| 75 to 84 Years | 55 | 20.7% |
| 85 Years and Over | 0 | 0.0% |
| Total | 266 | 100.0% |
Housing Finances in Lake Seneca
Median Income by Occupancy in Lake Seneca
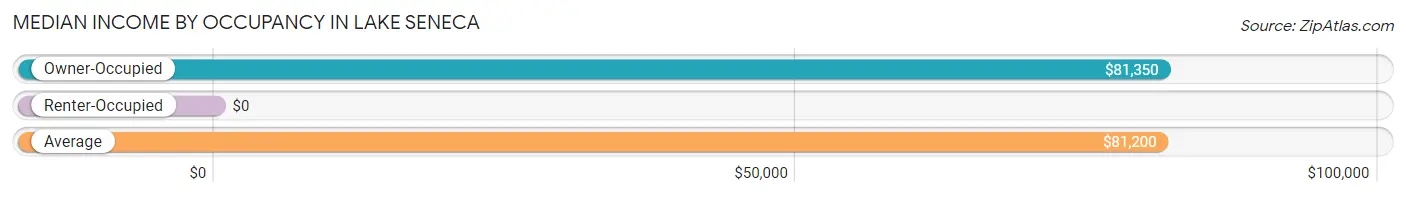
| Occupancy Type | # Households | Median Income |
| Owner-Occupied | 260 (97.7%) | $81,350 |
| Renter-Occupied | 6 (2.3%) | $0 |
| Average | 266 (100.0%) | $81,200 |
Occupancy by Householder Income Bracket in Lake Seneca
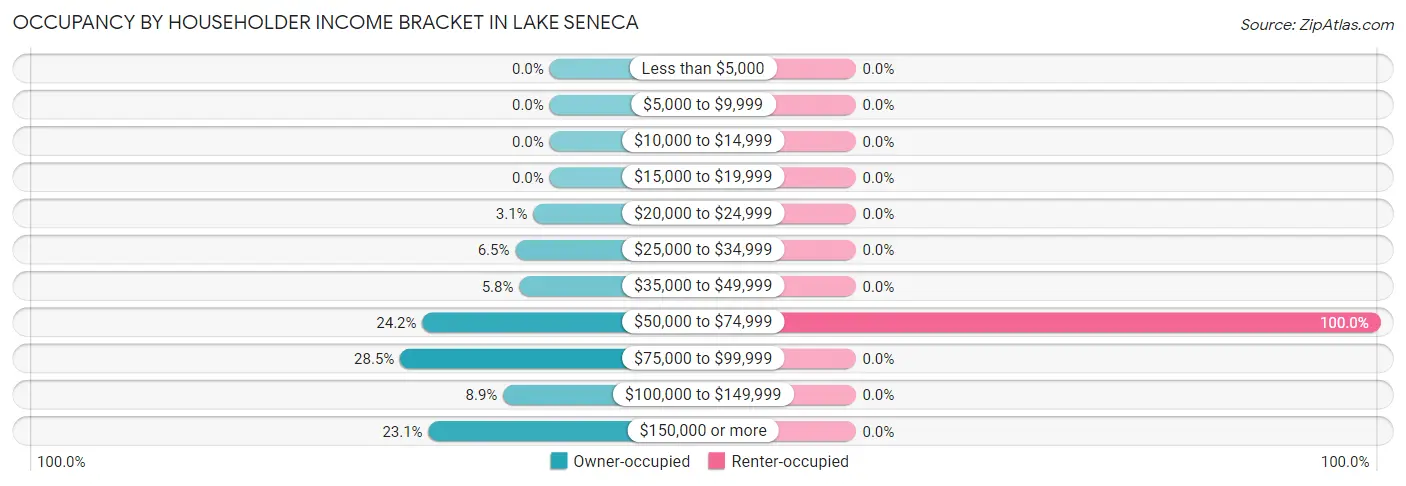
| Income Bracket | Owner-occupied | Renter-occupied |
| Less than $5,000 | 0 (0.0%) | 0 (0.0%) |
| $5,000 to $9,999 | 0 (0.0%) | 0 (0.0%) |
| $10,000 to $14,999 | 0 (0.0%) | 0 (0.0%) |
| $15,000 to $19,999 | 0 (0.0%) | 0 (0.0%) |
| $20,000 to $24,999 | 8 (3.1%) | 0 (0.0%) |
| $25,000 to $34,999 | 17 (6.5%) | 0 (0.0%) |
| $35,000 to $49,999 | 15 (5.8%) | 0 (0.0%) |
| $50,000 to $74,999 | 63 (24.2%) | 6 (100.0%) |
| $75,000 to $99,999 | 74 (28.5%) | 0 (0.0%) |
| $100,000 to $149,999 | 23 (8.8%) | 0 (0.0%) |
| $150,000 or more | 60 (23.1%) | 0 (0.0%) |
| Total | 260 (100.0%) | 6 (100.0%) |
Monthly Housing Cost Tiers in Lake Seneca
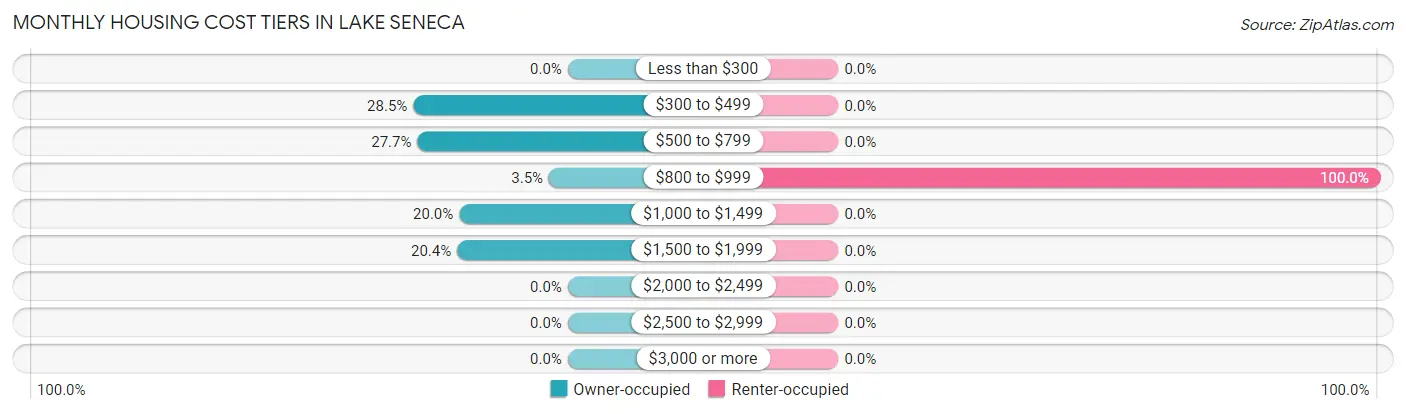
| Monthly Cost | Owner-occupied | Renter-occupied |
| Less than $300 | 0 (0.0%) | 0 (0.0%) |
| $300 to $499 | 74 (28.5%) | 0 (0.0%) |
| $500 to $799 | 72 (27.7%) | 0 (0.0%) |
| $800 to $999 | 9 (3.5%) | 6 (100.0%) |
| $1,000 to $1,499 | 52 (20.0%) | 0 (0.0%) |
| $1,500 to $1,999 | 53 (20.4%) | 0 (0.0%) |
| $2,000 to $2,499 | 0 (0.0%) | 0 (0.0%) |
| $2,500 to $2,999 | 0 (0.0%) | 0 (0.0%) |
| $3,000 or more | 0 (0.0%) | 0 (0.0%) |
| Total | 260 (100.0%) | 6 (100.0%) |
Physical Housing Characteristics in Lake Seneca
Housing Structures in Lake Seneca
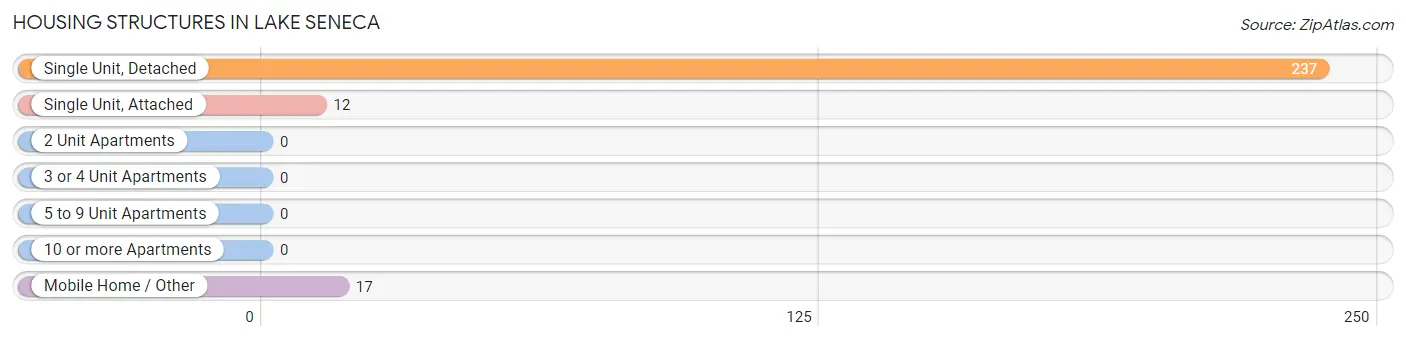
| Structure Type | # Housing Units | % Housing Units |
| Single Unit, Detached | 237 | 89.1% |
| Single Unit, Attached | 12 | 4.5% |
| 2 Unit Apartments | 0 | 0.0% |
| 3 or 4 Unit Apartments | 0 | 0.0% |
| 5 to 9 Unit Apartments | 0 | 0.0% |
| 10 or more Apartments | 0 | 0.0% |
| Mobile Home / Other | 17 | 6.4% |
| Total | 266 | 100.0% |
Housing Structures by Occupancy in Lake Seneca
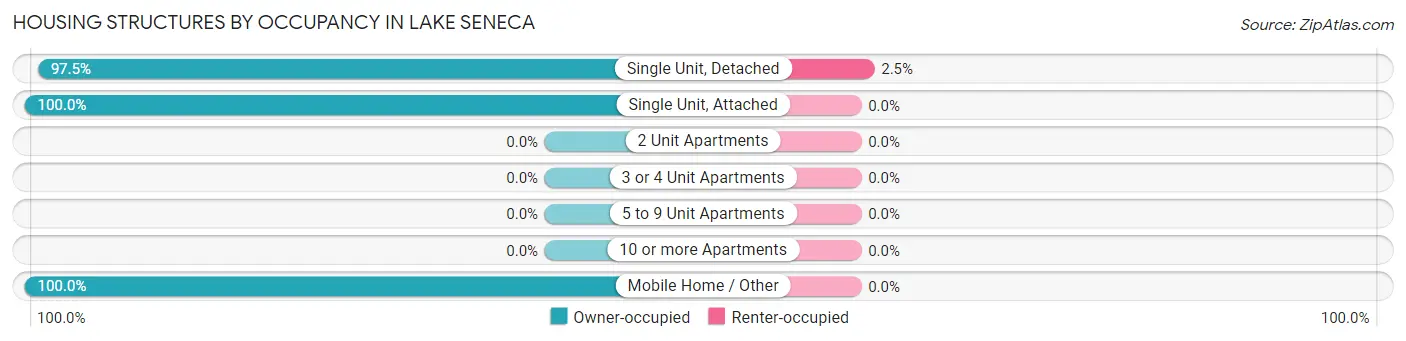
| Structure Type | Owner-occupied | Renter-occupied |
| Single Unit, Detached | 231 (97.5%) | 6 (2.5%) |
| Single Unit, Attached | 12 (100.0%) | 0 (0.0%) |
| 2 Unit Apartments | 0 (0.0%) | 0 (0.0%) |
| 3 or 4 Unit Apartments | 0 (0.0%) | 0 (0.0%) |
| 5 to 9 Unit Apartments | 0 (0.0%) | 0 (0.0%) |
| 10 or more Apartments | 0 (0.0%) | 0 (0.0%) |
| Mobile Home / Other | 17 (100.0%) | 0 (0.0%) |
| Total | 260 (97.7%) | 6 (2.3%) |
Housing Structures by Number of Rooms in Lake Seneca
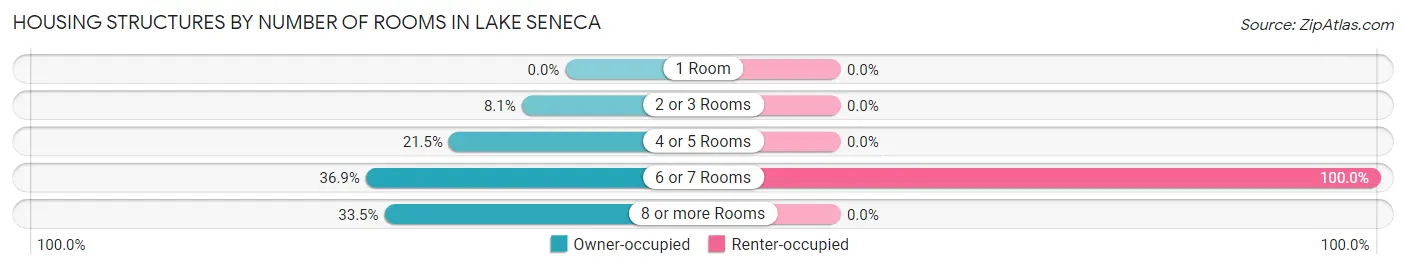
| Number of Rooms | Owner-occupied | Renter-occupied |
| 1 Room | 0 (0.0%) | 0 (0.0%) |
| 2 or 3 Rooms | 21 (8.1%) | 0 (0.0%) |
| 4 or 5 Rooms | 56 (21.5%) | 0 (0.0%) |
| 6 or 7 Rooms | 96 (36.9%) | 6 (100.0%) |
| 8 or more Rooms | 87 (33.5%) | 0 (0.0%) |
| Total | 260 (100.0%) | 6 (100.0%) |
Housing Structure by Heating Type in Lake Seneca
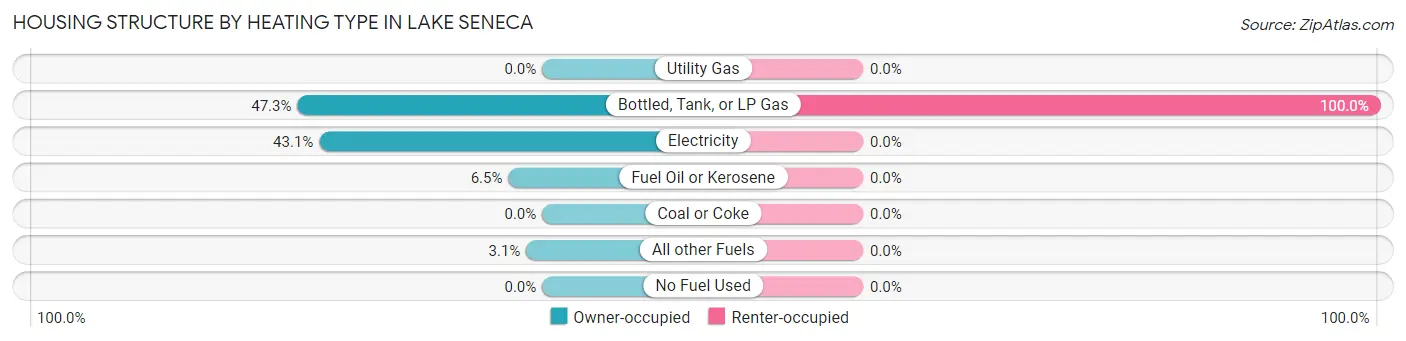
| Heating Type | Owner-occupied | Renter-occupied |
| Utility Gas | 0 (0.0%) | 0 (0.0%) |
| Bottled, Tank, or LP Gas | 123 (47.3%) | 6 (100.0%) |
| Electricity | 112 (43.1%) | 0 (0.0%) |
| Fuel Oil or Kerosene | 17 (6.5%) | 0 (0.0%) |
| Coal or Coke | 0 (0.0%) | 0 (0.0%) |
| All other Fuels | 8 (3.1%) | 0 (0.0%) |
| No Fuel Used | 0 (0.0%) | 0 (0.0%) |
| Total | 260 (100.0%) | 6 (100.0%) |
Household Vehicle Usage in Lake Seneca
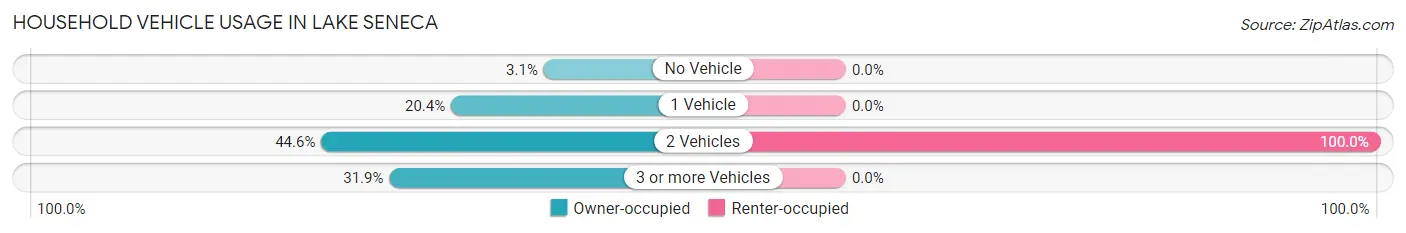
| Vehicles per Household | Owner-occupied | Renter-occupied |
| No Vehicle | 8 (3.1%) | 0 (0.0%) |
| 1 Vehicle | 53 (20.4%) | 0 (0.0%) |
| 2 Vehicles | 116 (44.6%) | 6 (100.0%) |
| 3 or more Vehicles | 83 (31.9%) | 0 (0.0%) |
| Total | 260 (100.0%) | 6 (100.0%) |
Real Estate & Mortgages in Lake Seneca
Real Estate and Mortgage Overview in Lake Seneca
| Characteristic | Without Mortgage | With Mortgage |
| Housing Units | 116 | 144 |
| Median Property Value | $120,700 | $158,900 |
| Median Household Income | $81,350 | $48 |
| Monthly Housing Costs | $452 | $0 |
| Real Estate Taxes | - | - |
Property Value by Mortgage Status in Lake Seneca
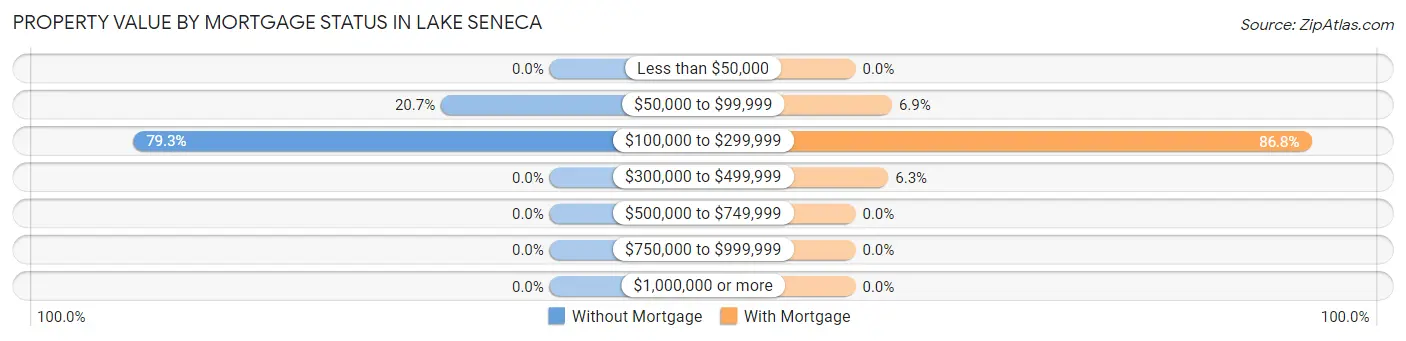
| Property Value | Without Mortgage | With Mortgage |
| Less than $50,000 | 0 (0.0%) | 0 (0.0%) |
| $50,000 to $99,999 | 24 (20.7%) | 10 (6.9%) |
| $100,000 to $299,999 | 92 (79.3%) | 125 (86.8%) |
| $300,000 to $499,999 | 0 (0.0%) | 9 (6.2%) |
| $500,000 to $749,999 | 0 (0.0%) | 0 (0.0%) |
| $750,000 to $999,999 | 0 (0.0%) | 0 (0.0%) |
| $1,000,000 or more | 0 (0.0%) | 0 (0.0%) |
| Total | 116 (100.0%) | 144 (100.0%) |
Household Income by Mortgage Status in Lake Seneca
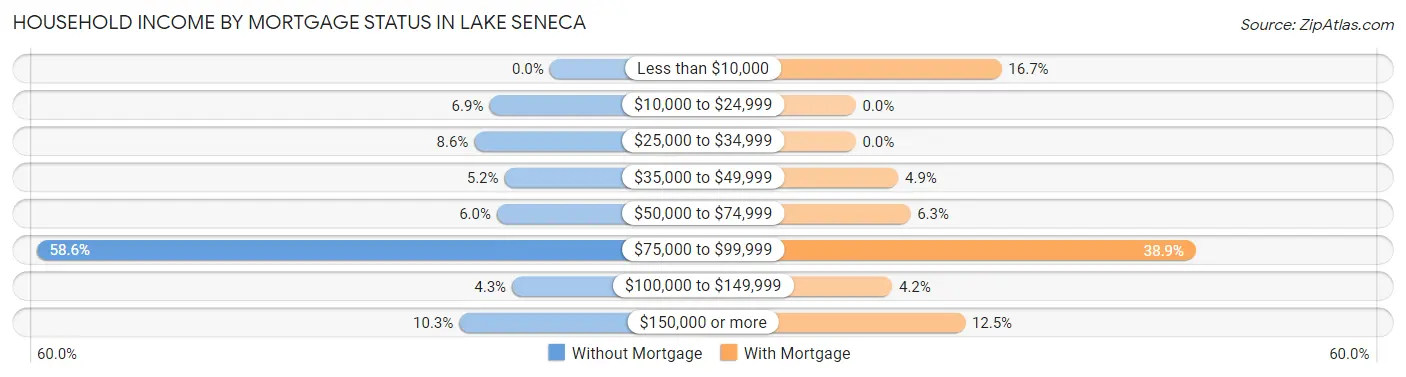
| Household Income | Without Mortgage | With Mortgage |
| Less than $10,000 | 0 (0.0%) | 24 (16.7%) |
| $10,000 to $24,999 | 8 (6.9%) | 0 (0.0%) |
| $25,000 to $34,999 | 10 (8.6%) | 0 (0.0%) |
| $35,000 to $49,999 | 6 (5.2%) | 7 (4.9%) |
| $50,000 to $74,999 | 7 (6.0%) | 9 (6.2%) |
| $75,000 to $99,999 | 68 (58.6%) | 56 (38.9%) |
| $100,000 to $149,999 | 5 (4.3%) | 6 (4.2%) |
| $150,000 or more | 12 (10.3%) | 18 (12.5%) |
| Total | 116 (100.0%) | 144 (100.0%) |
Property Value to Household Income Ratio in Lake Seneca
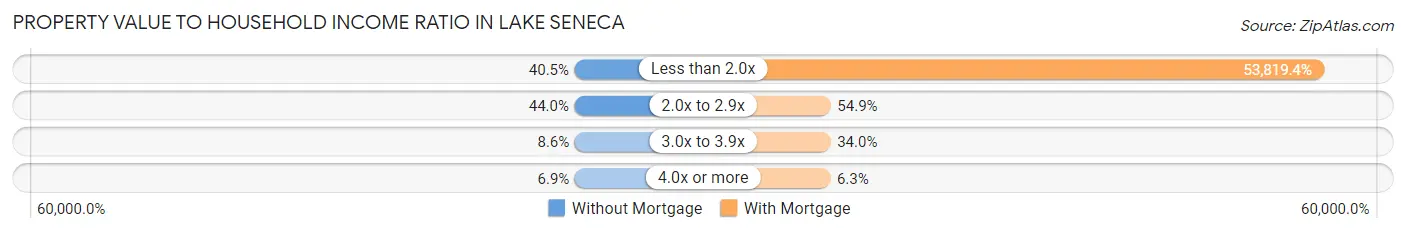
| Value-to-Income Ratio | Without Mortgage | With Mortgage |
| Less than 2.0x | 47 (40.5%) | 77,500 (53,819.4%) |
| 2.0x to 2.9x | 51 (44.0%) | 79 (54.9%) |
| 3.0x to 3.9x | 10 (8.6%) | 49 (34.0%) |
| 4.0x or more | 8 (6.9%) | 9 (6.2%) |
| Total | 116 (100.0%) | 144 (100.0%) |
Real Estate Taxes by Mortgage Status in Lake Seneca
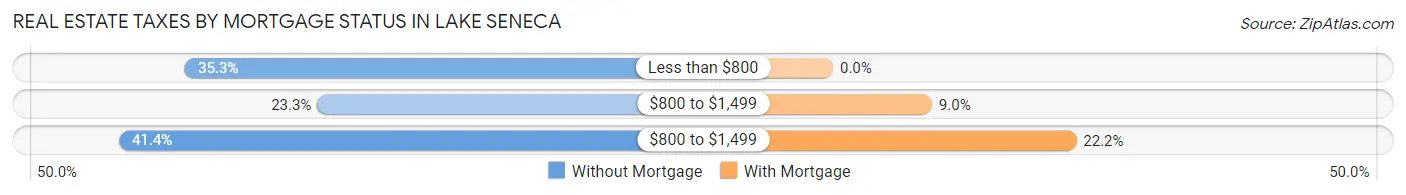
| Property Taxes | Without Mortgage | With Mortgage |
| Less than $800 | 41 (35.3%) | 0 (0.0%) |
| $800 to $1,499 | 27 (23.3%) | 13 (9.0%) |
| $800 to $1,499 | 48 (41.4%) | 32 (22.2%) |
| Total | 116 (100.0%) | 144 (100.0%) |
Health & Disability in Lake Seneca
Health Insurance Coverage by Age in Lake Seneca
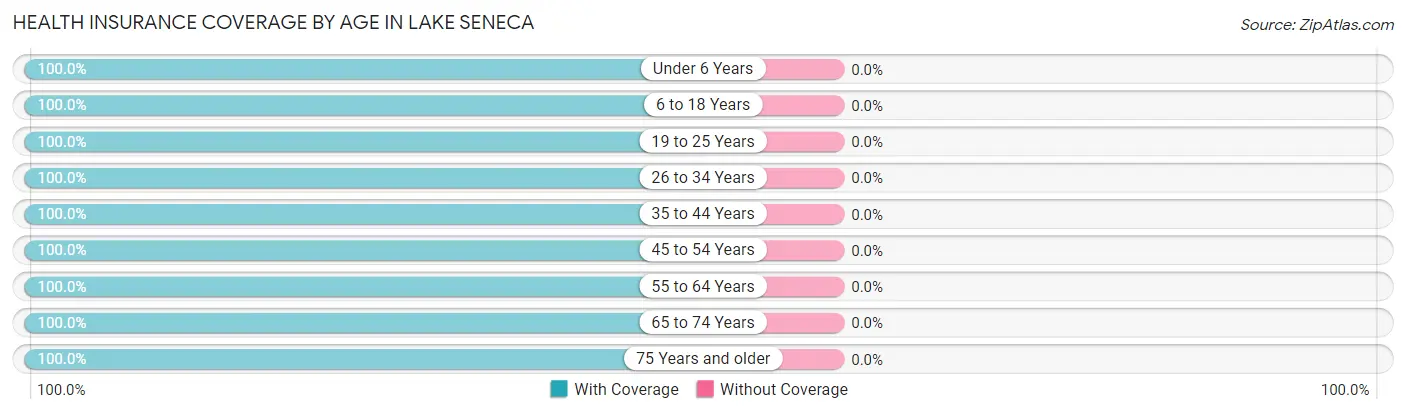
| Age Bracket | With Coverage | Without Coverage |
| Under 6 Years | 81 (100.0%) | 0 (0.0%) |
| 6 to 18 Years | 29 (100.0%) | 0 (0.0%) |
| 19 to 25 Years | 9 (100.0%) | 0 (0.0%) |
| 26 to 34 Years | 56 (100.0%) | 0 (0.0%) |
| 35 to 44 Years | 75 (100.0%) | 0 (0.0%) |
| 45 to 54 Years | 92 (100.0%) | 0 (0.0%) |
| 55 to 64 Years | 110 (100.0%) | 0 (0.0%) |
| 65 to 74 Years | 77 (100.0%) | 0 (0.0%) |
| 75 Years and older | 104 (100.0%) | 0 (0.0%) |
| Total | 633 (100.0%) | 0 (0.0%) |
Health Insurance Coverage by Citizenship Status in Lake Seneca
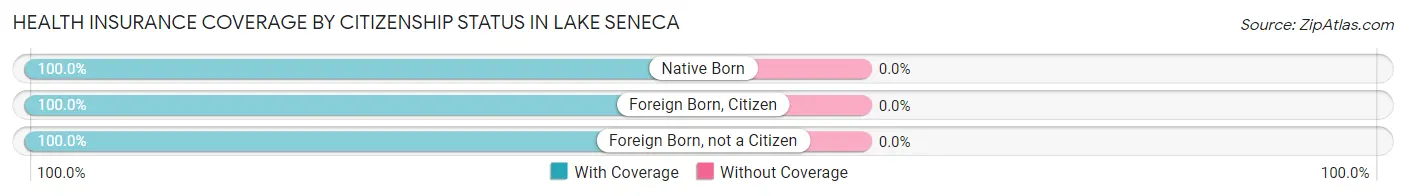
| Citizenship Status | With Coverage | Without Coverage |
| Native Born | 81 (100.0%) | 0 (0.0%) |
| Foreign Born, Citizen | 29 (100.0%) | 0 (0.0%) |
| Foreign Born, not a Citizen | 9 (100.0%) | 0 (0.0%) |
Health Insurance Coverage by Household Income in Lake Seneca
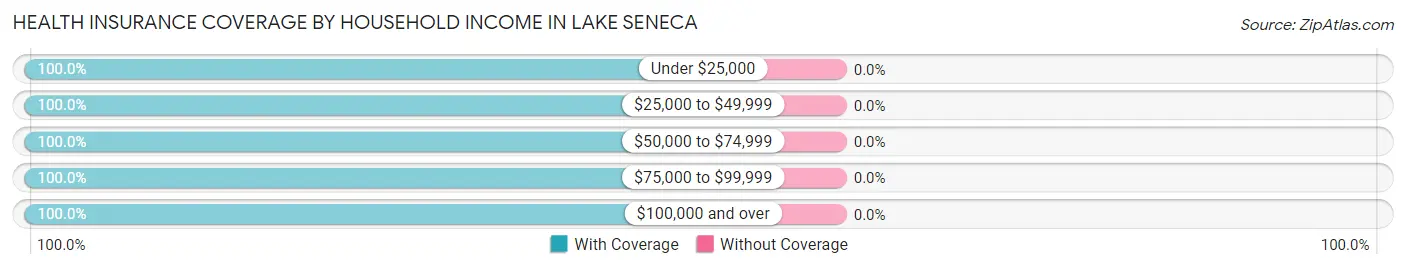
| Household Income | With Coverage | Without Coverage |
| Under $25,000 | 19 (100.0%) | 0 (0.0%) |
| $25,000 to $49,999 | 45 (100.0%) | 0 (0.0%) |
| $50,000 to $74,999 | 162 (100.0%) | 0 (0.0%) |
| $75,000 to $99,999 | 237 (100.0%) | 0 (0.0%) |
| $100,000 and over | 170 (100.0%) | 0 (0.0%) |
Public vs Private Health Insurance Coverage by Age in Lake Seneca
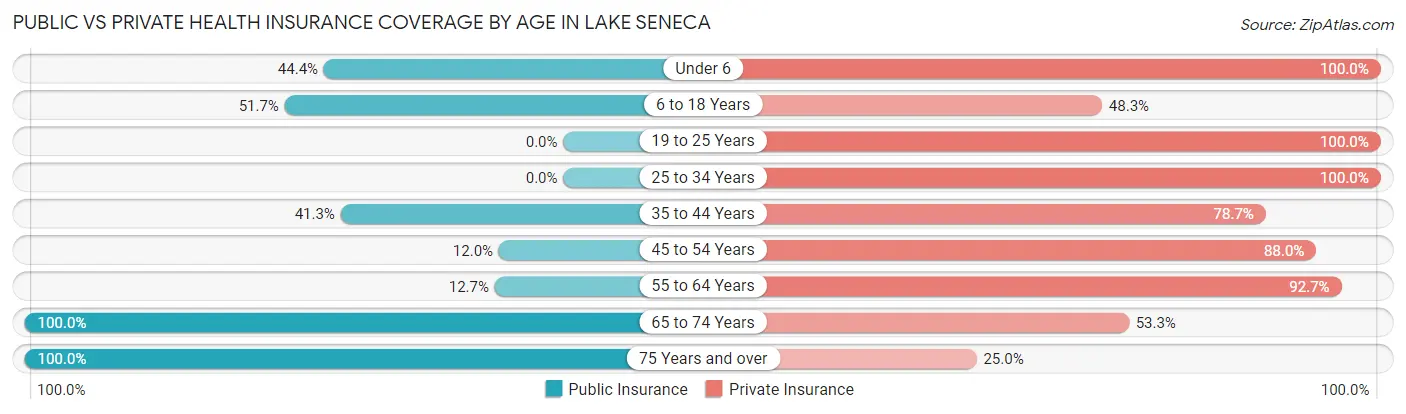
| Age Bracket | Public Insurance | Private Insurance |
| Under 6 | 36 (44.4%) | 81 (100.0%) |
| 6 to 18 Years | 15 (51.7%) | 14 (48.3%) |
| 19 to 25 Years | 0 (0.0%) | 9 (100.0%) |
| 25 to 34 Years | 0 (0.0%) | 56 (100.0%) |
| 35 to 44 Years | 31 (41.3%) | 59 (78.7%) |
| 45 to 54 Years | 11 (12.0%) | 81 (88.0%) |
| 55 to 64 Years | 14 (12.7%) | 102 (92.7%) |
| 65 to 74 Years | 77 (100.0%) | 41 (53.2%) |
| 75 Years and over | 104 (100.0%) | 26 (25.0%) |
| Total | 288 (45.5%) | 469 (74.1%) |
Disability Status by Sex by Age in Lake Seneca
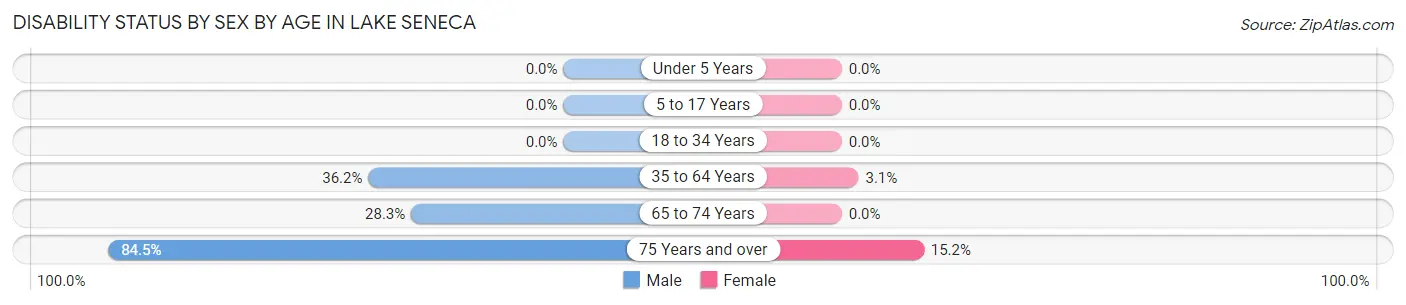
| Age Bracket | Male | Female |
| Under 5 Years | 0 (0.0%) | 0 (0.0%) |
| 5 to 17 Years | 0 (0.0%) | 0 (0.0%) |
| 18 to 34 Years | 0 (0.0%) | 0 (0.0%) |
| 35 to 64 Years | 42 (36.2%) | 5 (3.1%) |
| 65 to 74 Years | 13 (28.3%) | 0 (0.0%) |
| 75 Years and over | 49 (84.5%) | 7 (15.2%) |
Disability Class by Sex by Age in Lake Seneca
Disability Class: Hearing Difficulty
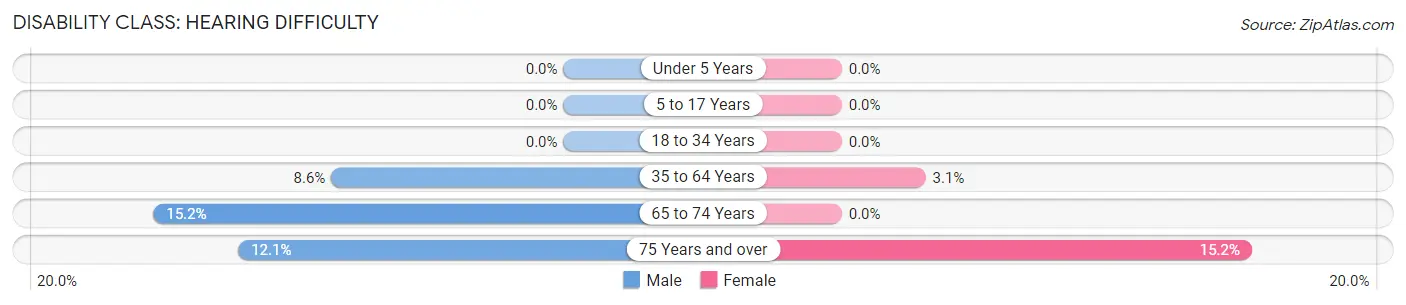
| Age Bracket | Male | Female |
| Under 5 Years | 0 (0.0%) | 0 (0.0%) |
| 5 to 17 Years | 0 (0.0%) | 0 (0.0%) |
| 18 to 34 Years | 0 (0.0%) | 0 (0.0%) |
| 35 to 64 Years | 10 (8.6%) | 5 (3.1%) |
| 65 to 74 Years | 7 (15.2%) | 0 (0.0%) |
| 75 Years and over | 7 (12.1%) | 7 (15.2%) |
Disability Class: Vision Difficulty
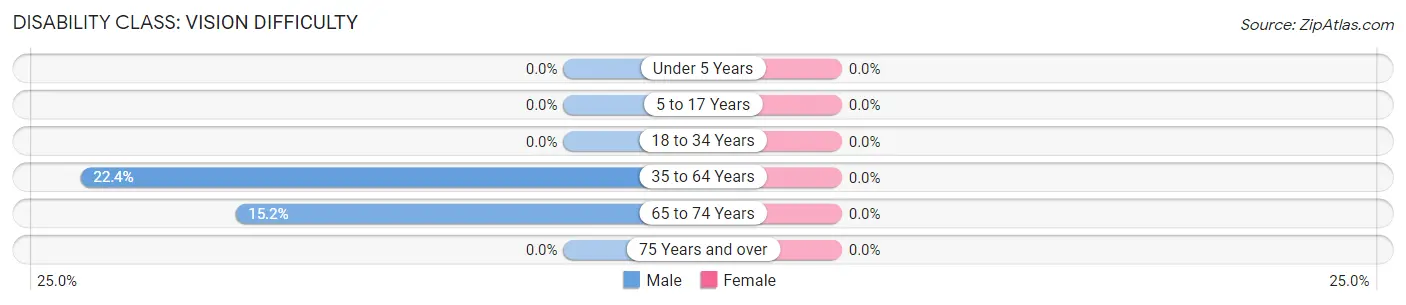
| Age Bracket | Male | Female |
| Under 5 Years | 0 (0.0%) | 0 (0.0%) |
| 5 to 17 Years | 0 (0.0%) | 0 (0.0%) |
| 18 to 34 Years | 0 (0.0%) | 0 (0.0%) |
| 35 to 64 Years | 26 (22.4%) | 0 (0.0%) |
| 65 to 74 Years | 7 (15.2%) | 0 (0.0%) |
| 75 Years and over | 0 (0.0%) | 0 (0.0%) |
Disability Class: Cognitive Difficulty
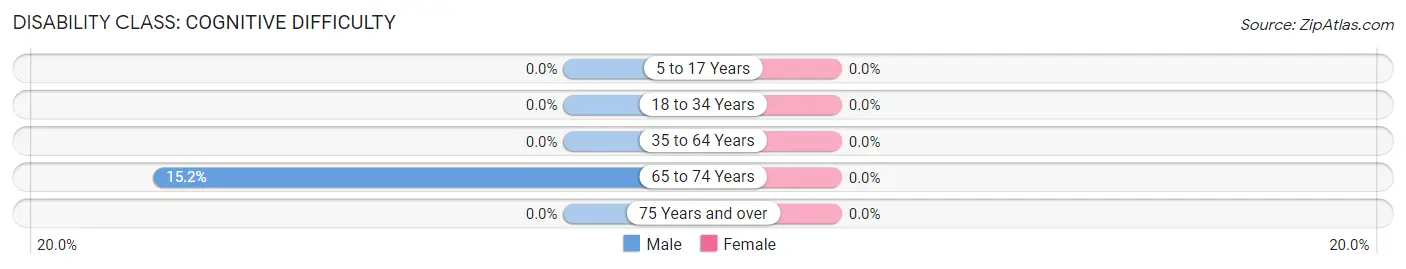
| Age Bracket | Male | Female |
| 5 to 17 Years | 0 (0.0%) | 0 (0.0%) |
| 18 to 34 Years | 0 (0.0%) | 0 (0.0%) |
| 35 to 64 Years | 0 (0.0%) | 0 (0.0%) |
| 65 to 74 Years | 7 (15.2%) | 0 (0.0%) |
| 75 Years and over | 0 (0.0%) | 0 (0.0%) |
Disability Class: Ambulatory Difficulty
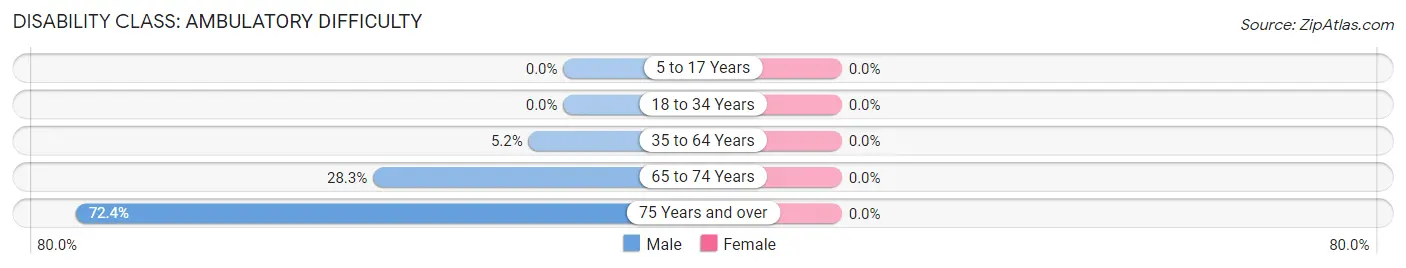
| Age Bracket | Male | Female |
| 5 to 17 Years | 0 (0.0%) | 0 (0.0%) |
| 18 to 34 Years | 0 (0.0%) | 0 (0.0%) |
| 35 to 64 Years | 6 (5.2%) | 0 (0.0%) |
| 65 to 74 Years | 13 (28.3%) | 0 (0.0%) |
| 75 Years and over | 42 (72.4%) | 0 (0.0%) |
Disability Class: Self-Care Difficulty
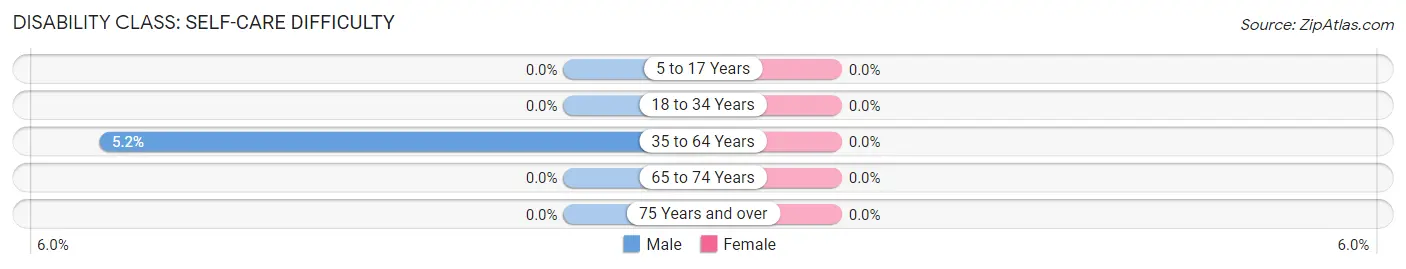
| Age Bracket | Male | Female |
| 5 to 17 Years | 0 (0.0%) | 0 (0.0%) |
| 18 to 34 Years | 0 (0.0%) | 0 (0.0%) |
| 35 to 64 Years | 6 (5.2%) | 0 (0.0%) |
| 65 to 74 Years | 0 (0.0%) | 0 (0.0%) |
| 75 Years and over | 0 (0.0%) | 0 (0.0%) |
Technology Access in Lake Seneca
Computing Device Access in Lake Seneca
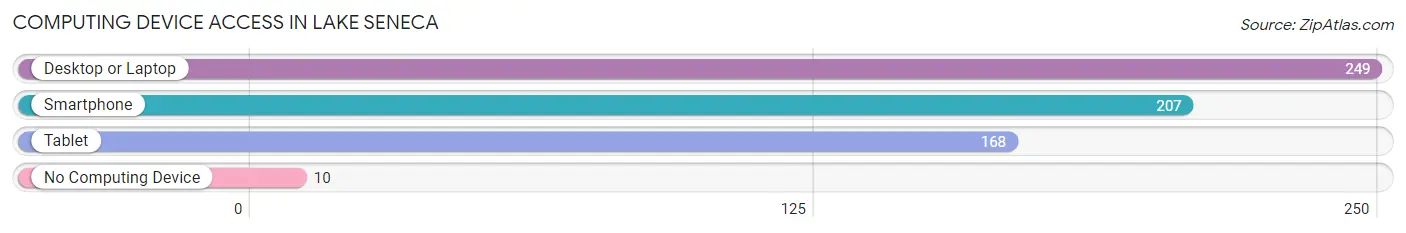
| Device Type | # Households | % Households |
| Desktop or Laptop | 249 | 93.6% |
| Smartphone | 207 | 77.8% |
| Tablet | 168 | 63.2% |
| No Computing Device | 10 | 3.8% |
| Total | 266 | 100.0% |
Internet Access in Lake Seneca
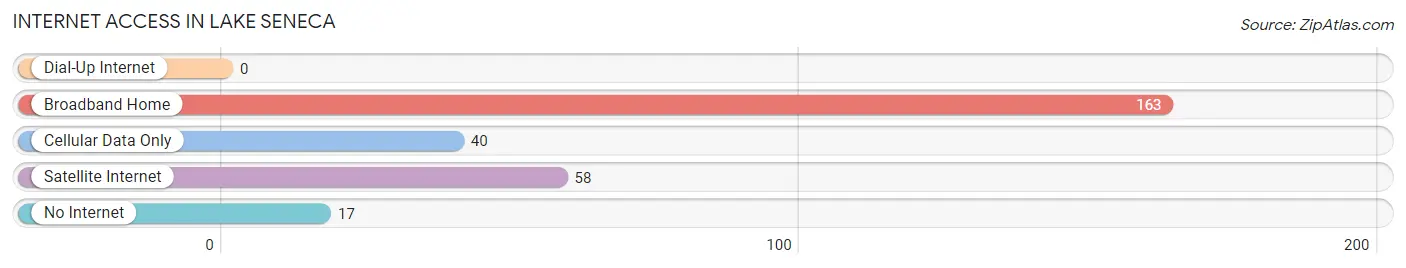
| Internet Type | # Households | % Households |
| Dial-Up Internet | 0 | 0.0% |
| Broadband Home | 163 | 61.3% |
| Cellular Data Only | 40 | 15.0% |
| Satellite Internet | 58 | 21.8% |
| No Internet | 17 | 6.4% |
| Total | 266 | 100.0% |
Lake Seneca Summary
Lake Seneca is a small village located in Seneca County, Ohio. It is situated on the south shore of Seneca Lake, which is the largest natural lake in Ohio. The village is located approximately 25 miles southeast of Toledo and is part of the Fostoria Metropolitan Statistical Area. The population of Lake Seneca was 1,093 at the 2010 census.
History
The area around Lake Seneca was first settled in the early 1800s by settlers from Pennsylvania and New York. The village was originally known as Seneca Lake Station, and was a stop on the Toledo, Norwalk and Cleveland Railroad. The village was officially incorporated in 1891.
In the early 1900s, the village was a popular summer resort destination. The lake was a popular spot for fishing and boating, and the village had several hotels and resorts. The village also had a trolley line that connected it to nearby towns.
In the 1950s, the village began to decline as the popularity of summer resorts declined. The trolley line was discontinued in the 1960s, and the village began to become a bedroom community for nearby cities.
Geography
Lake Seneca is located at 41°14'17" North, 83°14'17" West (41.238, -83.238). According to the United States Census Bureau, the village has a total area of 0.7 square miles (1.8 km2), all of it land.
The village is located on the south shore of Seneca Lake, which is the largest natural lake in Ohio. The lake is approximately 4,000 acres in size and is a popular spot for fishing and boating.
Economy
The economy of Lake Seneca is largely based on agriculture and tourism. The village is home to several farms, and the surrounding area is known for its production of corn, soybeans, and wheat.
The village is also a popular destination for tourists. The lake is a popular spot for fishing and boating, and the village has several restaurants and shops. The village also hosts several festivals throughout the year, including the Seneca Lake Festival in August and the Seneca Lake Wine Festival in October.
Demographics
As of the census of 2010, there were 1,093 people, 441 households, and 294 families residing in the village. The population density was 1,541.4 people per square mile (595.3/km2). There were 471 housing units at an average density of 667.9 per square mile (258.3/km2). The racial makeup of the village was 97.2% White, 0.2% African American, 0.2% Native American, 0.2% Asian, 0.2% from other races, and 1.9% from two or more races. Hispanic or Latino of any race were 1.3% of the population.
There were 441 households, out of which 30.2% had children under the age of 18 living with them, 48.9% were married couples living together, 11.3% had a female householder with no husband present, and 34.2% were non-families. 29.2% of all households were made up of individuals, and 11.3% had someone living alone who was 65 years of age or older. The average household size was 2.48 and the average family size was 3.05.
In the village, the population was spread out, with 25.2% under the age of 18, 8.2% from 18 to 24, 28.2% from 25 to 44, 24.2% from 45 to 64, and 14.2% who were 65 years of age or older. The median age was 37 years. For every 100 females, there were 97.2 males. For every 100 females age 18 and over, there were 94.2 males.
The median income for a household in the village was $41,250, and the median income for a family was $48,750. Males had a median income of $35,000 versus $25,000 for females. The per capita income for the village was $19,845. About 5.2% of families and 7.2% of the population were below the poverty line, including 8.2% of those under age 18 and 5.2% of those age 65 or over.
Common Questions
What is the Total Population of Lake Seneca?
Total Population of Lake Seneca is 633.
What is the Total Male Population of Lake Seneca?
Total Male Population of Lake Seneca is 289.
What is the Total Female Population of Lake Seneca?
Total Female Population of Lake Seneca is 344.
What is the Ratio of Males per 100 Females in Lake Seneca?
There are 84.01 Males per 100 Females in Lake Seneca.
What is the Ratio of Females per 100 Males in Lake Seneca?
There are 119.03 Females per 100 Males in Lake Seneca.
What is the Median Population Age in Lake Seneca?
Median Population Age in Lake Seneca is 53.7 Years.
What is the Average Family Size in Lake Seneca
Average Family Size in Lake Seneca is 2.7 People.
What is the Average Household Size in Lake Seneca
Average Household Size in Lake Seneca is 2.4 People.
What is Per Capita Income in Lake Seneca?
Per Capita income in Lake Seneca is $39,539.
What is the Median Family Income in Lake Seneca?
Median Family Income in Lake Seneca is $83,333.
What is the Median Household income in Lake Seneca?
Median Household Income in Lake Seneca is $81,200.
What is Income or Wage Gap in Lake Seneca?
Income or Wage Gap in Lake Seneca is 4.7%.
Women in Lake Seneca earn 95.3 cents for every dollar earned by a man.
What is Inequality or Gini Index in Lake Seneca?
Inequality or Gini Index in Lake Seneca is 0.32.
How Large is the Labor Force in Lake Seneca?
There are 306 People in the Labor Forcein in Lake Seneca.
What is the Percentage of People in the Labor Force in Lake Seneca?
57.0% of People are in the Labor Force in Lake Seneca.