Ballville, OH
Ballville Map
Ballville Overview
3,635
TOTAL POPULATION
1,832
MALE POPULATION
1,803
FEMALE POPULATION
101.61
MALES / 100 FEMALES
98.42
FEMALES / 100 MALES
51.5
MEDIAN AGE
2.8
AVG FAMILY SIZE
2.3
AVG HOUSEHOLD SIZE
$38,847
PER CAPITA INCOME
$85,878
AVG FAMILY INCOME
$80,766
AVG HOUSEHOLD INCOME
30.8%
WAGE / INCOME GAP [ % ]
69.2¢/ $1
WAGE / INCOME GAP [ $ ]
$3,948
FAMILY INCOME DEFICIT
0.32
INEQUALITY / GINI INDEX
1,830
LABOR FORCE [ PEOPLE ]
61.2%
PERCENT IN LABOR FORCE
5.2%
UNEMPLOYMENT RATE
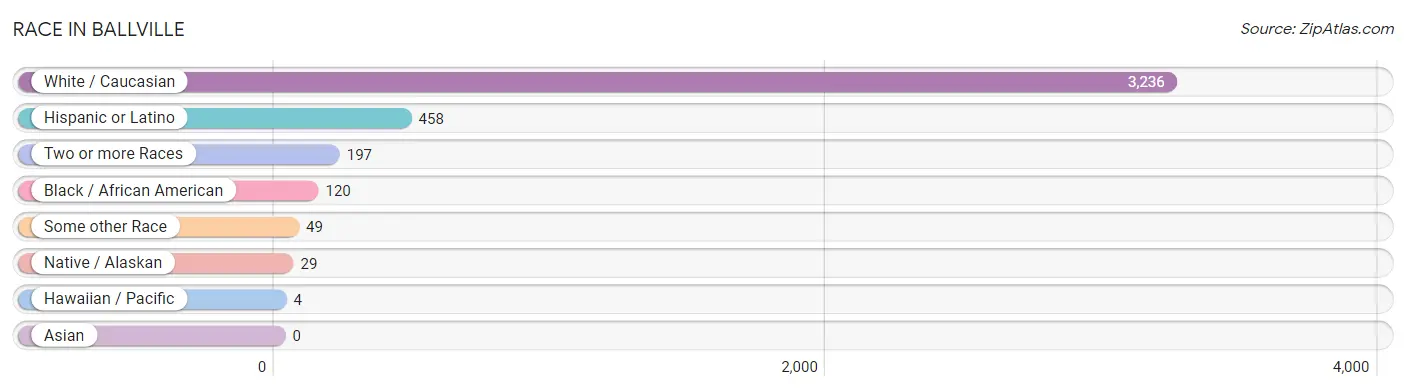
Race in Ballville
The most populous races in Ballville are White / Caucasian (3,236 | 89.0%), Hispanic or Latino (458 | 12.6%), and Two or more Races (197 | 5.4%).
| Race | # Population | % Population |
| Asian | 0 | 0.0% |
| Black / African American | 120 | 3.3% |
| Hawaiian / Pacific | 4 | 0.1% |
| Hispanic or Latino | 458 | 12.6% |
| Native / Alaskan | 29 | 0.8% |
| White / Caucasian | 3,236 | 89.0% |
| Two or more Races | 197 | 5.4% |
| Some other Race | 49 | 1.3% |
| Total | 3,635 | 100.0% |
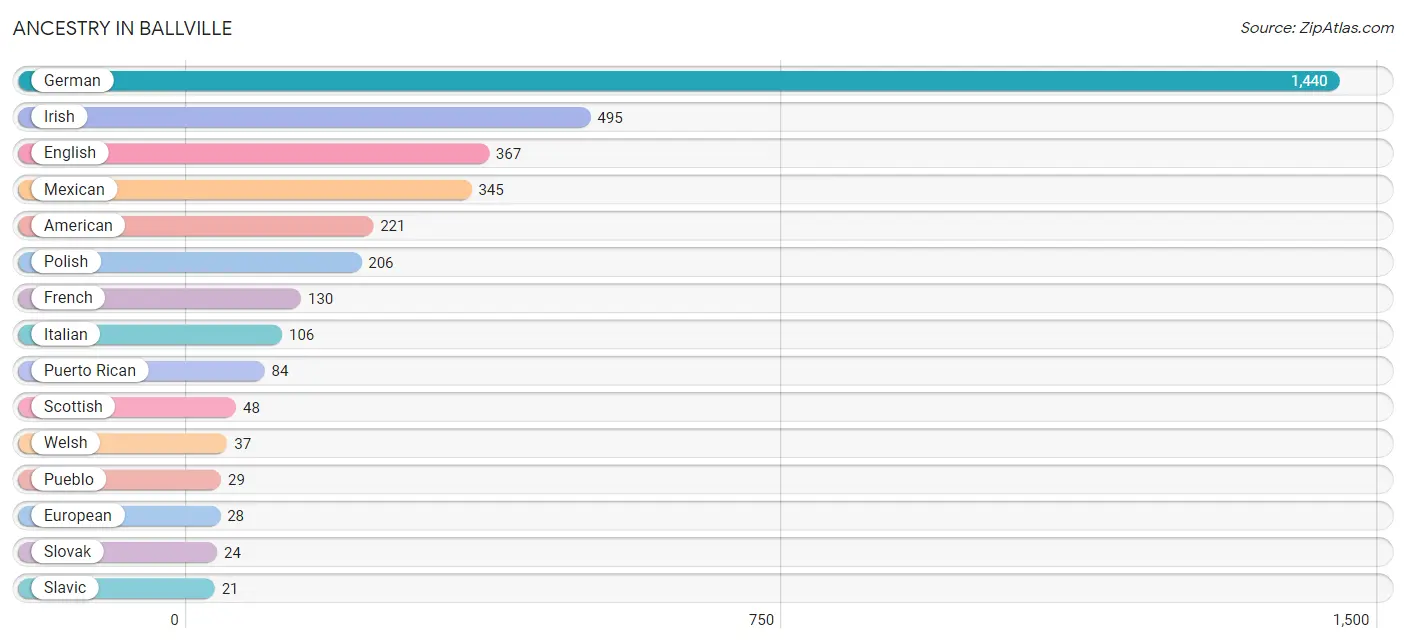
Ancestry in Ballville
The most populous ancestries reported in Ballville are German (1,440 | 39.6%), Irish (495 | 13.6%), English (367 | 10.1%), Mexican (345 | 9.5%), and American (221 | 6.1%), together accounting for 78.9% of all Ballville residents.
| Ancestry | # Population | % Population |
| African | 19 | 0.5% |
| American | 221 | 6.1% |
| Apache | 14 | 0.4% |
| Austrian | 14 | 0.4% |
| Danish | 17 | 0.5% |
| Dutch | 13 | 0.4% |
| Eastern European | 6 | 0.2% |
| English | 367 | 10.1% |
| European | 28 | 0.8% |
| French | 130 | 3.6% |
| French Canadian | 7 | 0.2% |
| German | 1,440 | 39.6% |
| Hungarian | 14 | 0.4% |
| Irish | 495 | 13.6% |
| Italian | 106 | 2.9% |
| Mexican | 345 | 9.5% |
| Native Hawaiian | 4 | 0.1% |
| Norwegian | 6 | 0.2% |
| Polish | 206 | 5.7% |
| Portuguese | 6 | 0.2% |
| Pueblo | 29 | 0.8% |
| Puerto Rican | 84 | 2.3% |
| Russian | 20 | 0.5% |
| Scotch-Irish | 16 | 0.4% |
| Scottish | 48 | 1.3% |
| Slavic | 21 | 0.6% |
| Slovak | 24 | 0.7% |
| Subsaharan African | 19 | 0.5% |
| Swedish | 8 | 0.2% |
| Swiss | 5 | 0.1% |
| Welsh | 37 | 1.0% | View All 31 Rows |
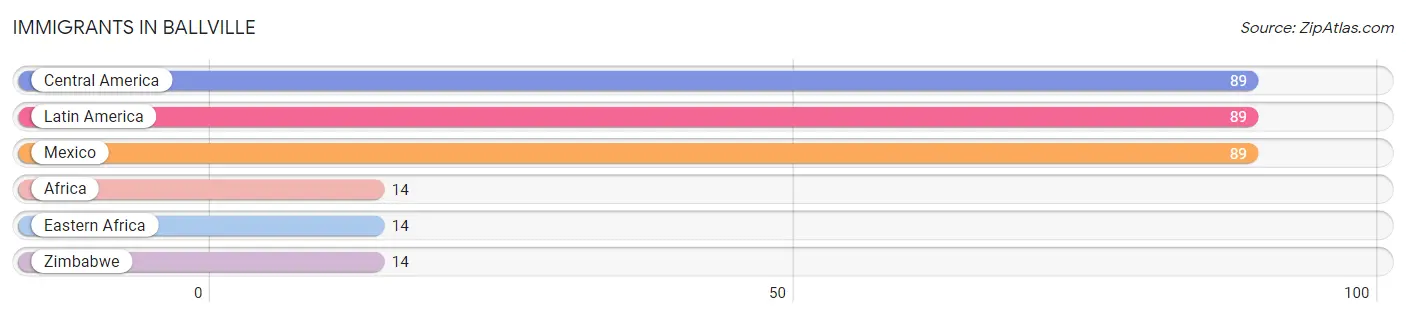
Immigrants in Ballville
The most numerous immigrant groups reported in Ballville came from Central America (89 | 2.5%), Latin America (89 | 2.5%), Mexico (89 | 2.5%), Africa (14 | 0.4%), and Eastern Africa (14 | 0.4%), together accounting for 8.1% of all Ballville residents.
| Immigration Origin | # Population | % Population |
| Africa | 14 | 0.4% |
| Central America | 89 | 2.5% |
| Eastern Africa | 14 | 0.4% |
| Latin America | 89 | 2.5% |
| Mexico | 89 | 2.5% |
| Zimbabwe | 14 | 0.4% | View All 6 Rows |
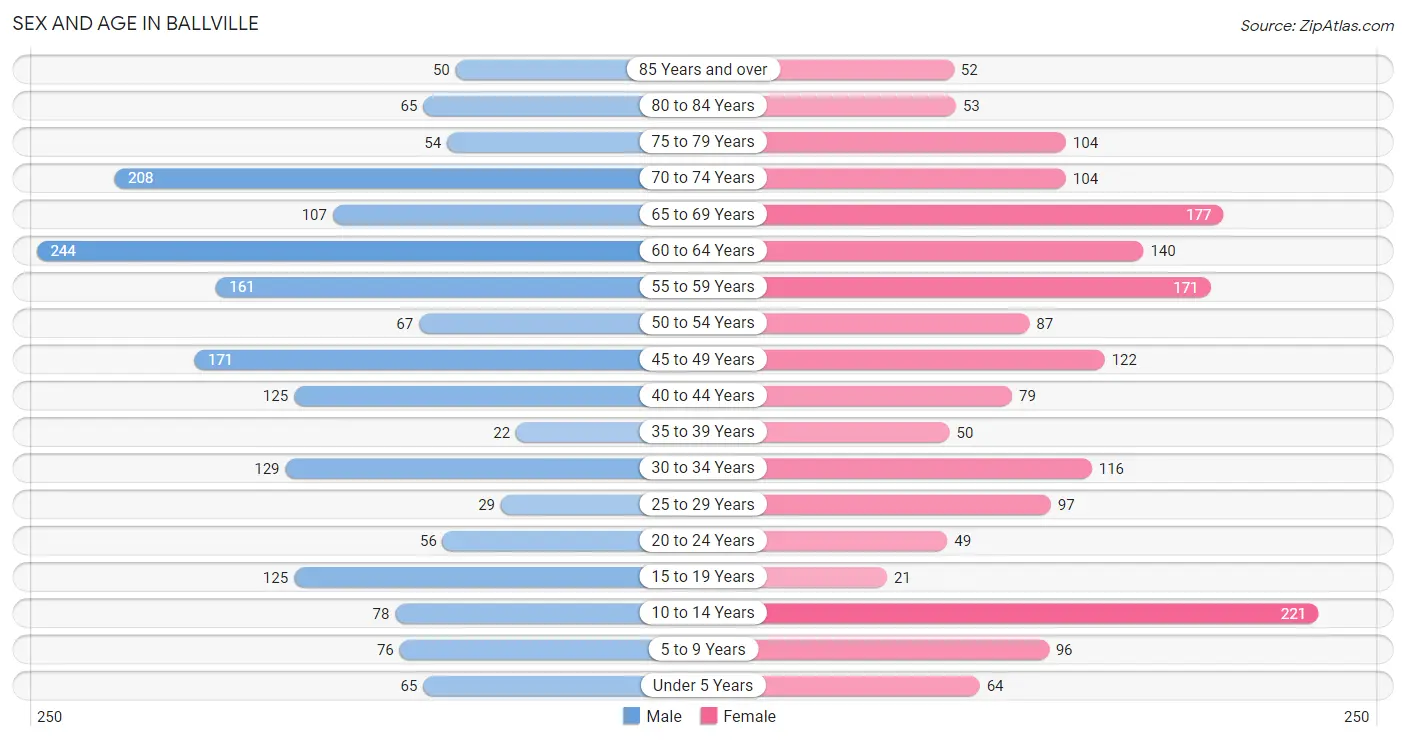
Sex and Age in Ballville
Sex and Age in Ballville
The most populous age groups in Ballville are 60 to 64 Years (244 | 13.3%) for men and 10 to 14 Years (221 | 12.3%) for women.
| Age Bracket | Male | Female |
| Under 5 Years | 65 (3.5%) | 64 (3.5%) |
| 5 to 9 Years | 76 (4.2%) | 96 (5.3%) |
| 10 to 14 Years | 78 (4.3%) | 221 (12.3%) |
| 15 to 19 Years | 125 (6.8%) | 21 (1.2%) |
| 20 to 24 Years | 56 (3.1%) | 49 (2.7%) |
| 25 to 29 Years | 29 (1.6%) | 97 (5.4%) |
| 30 to 34 Years | 129 (7.0%) | 116 (6.4%) |
| 35 to 39 Years | 22 (1.2%) | 50 (2.8%) |
| 40 to 44 Years | 125 (6.8%) | 79 (4.4%) |
| 45 to 49 Years | 171 (9.3%) | 122 (6.8%) |
| 50 to 54 Years | 67 (3.7%) | 87 (4.8%) |
| 55 to 59 Years | 161 (8.8%) | 171 (9.5%) |
| 60 to 64 Years | 244 (13.3%) | 140 (7.8%) |
| 65 to 69 Years | 107 (5.8%) | 177 (9.8%) |
| 70 to 74 Years | 208 (11.4%) | 104 (5.8%) |
| 75 to 79 Years | 54 (2.9%) | 104 (5.8%) |
| 80 to 84 Years | 65 (3.5%) | 53 (2.9%) |
| 85 Years and over | 50 (2.7%) | 52 (2.9%) |
| Total | 1,832 (100.0%) | 1,803 (100.0%) |
Families and Households in Ballville
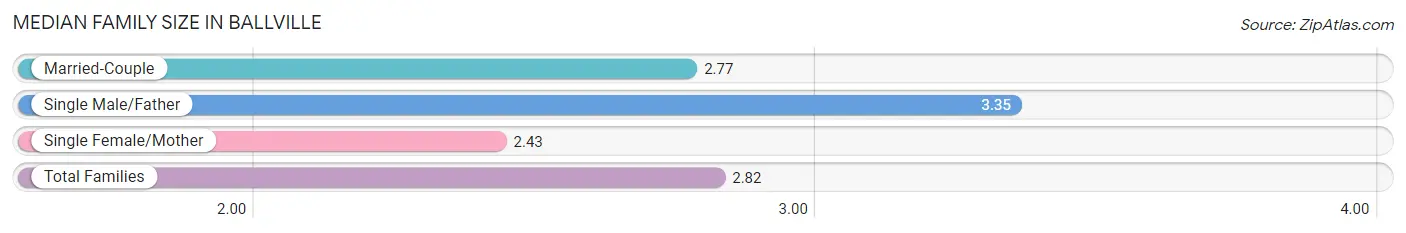
Median Family Size in Ballville
The median family size in Ballville is 2.82 persons per family, with single male/father families (127 | 11.8%) accounting for the largest median family size of 3.35 persons per family. On the other hand, single female/mother families (53 | 4.9%) represent the smallest median family size with 2.43 persons per family.
| Family Type | # Families | Family Size |
| Married-Couple | 896 (83.3%) | 2.77 |
| Single Male/Father | 127 (11.8%) | 3.35 |
| Single Female/Mother | 53 (4.9%) | 2.43 |
| Total Families | 1,076 (100.0%) | 2.82 |
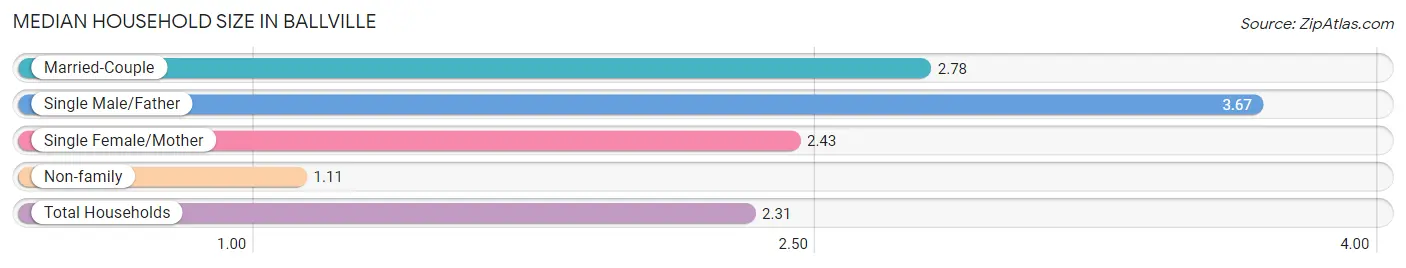
Median Household Size in Ballville
The median household size in Ballville is 2.31 persons per household, with single male/father households (127 | 8.1%) accounting for the largest median household size of 3.67 persons per household. non-family households (496 | 31.6%) represent the smallest median household size with 1.11 persons per household.
| Household Type | # Households | Household Size |
| Married-Couple | 896 (57.0%) | 2.78 |
| Single Male/Father | 127 (8.1%) | 3.67 |
| Single Female/Mother | 53 (3.4%) | 2.43 |
| Non-family | 496 (31.6%) | 1.11 |
| Total Households | 1,572 (100.0%) | 2.31 |
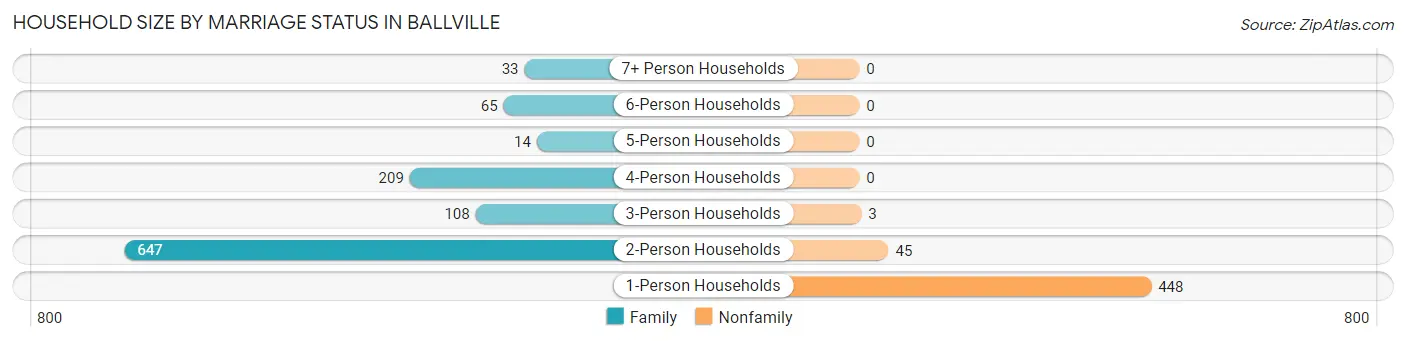
Household Size by Marriage Status in Ballville
Out of a total of 1,572 households in Ballville, 1,076 (68.4%) are family households, while 496 (31.6%) are nonfamily households. The most numerous type of family households are 2-person households, comprising 647, and the most common type of nonfamily households are 1-person households, comprising 448.
| Household Size | Family Households | Nonfamily Households |
| 1-Person Households | - | 448 (28.5%) |
| 2-Person Households | 647 (41.2%) | 45 (2.9%) |
| 3-Person Households | 108 (6.9%) | 3 (0.2%) |
| 4-Person Households | 209 (13.3%) | 0 (0.0%) |
| 5-Person Households | 14 (0.9%) | 0 (0.0%) |
| 6-Person Households | 65 (4.1%) | 0 (0.0%) |
| 7+ Person Households | 33 (2.1%) | 0 (0.0%) |
| Total | 1,076 (68.4%) | 496 (31.6%) |
Female Fertility in Ballville
Fertility by Age in Ballville
| Age Bracket | Women with Births | Births / 1,000 Women |
| 15 to 19 years | 0 (0.0%) | 0.0 |
| 20 to 34 years | 0 (0.0%) | 0.0 |
| 35 to 50 years | 0 (0.0%) | 0.0 |
| Total | 0 (0.0%) | 0.0 |
Fertility by Age by Marriage Status in Ballville
| Age Bracket | Married | Unmarried |
| 15 to 19 years | 0 (0.0%) | 0 (0.0%) |
| 20 to 34 years | 0 (0.0%) | 0 (0.0%) |
| 35 to 50 years | 0 (0.0%) | 0 (0.0%) |
| Total | 0 (0.0%) | 0 (0.0%) |
Fertility by Education in Ballville
| Educational Attainment | Women with Births | Births / 1,000 Women |
| Less than High School | 0 (0.0%) | 0.0 |
| High School Diploma | 0 (0.0%) | 0.0 |
| College or Associate's Degree | 0 (0.0%) | 0.0 |
| Bachelor's Degree | 0 (0.0%) | 0.0 |
| Graduate Degree | 0 (0.0%) | 0.0 |
| Total | 0 (0.0%) | 0.0 |
Fertility by Education by Marriage Status in Ballville
| Educational Attainment | Married | Unmarried |
| Less than High School | 0 (0.0%) | 0 (0.0%) |
| High School Diploma | 0 (0.0%) | 0 (0.0%) |
| College or Associate's Degree | 0 (0.0%) | 0 (0.0%) |
| Bachelor's Degree | 0 (0.0%) | 0 (0.0%) |
| Graduate Degree | 0 (0.0%) | 0 (0.0%) |
| Total | 0 (0.0%) | 0 (0.0%) |
Income in Ballville
Income Overview in Ballville
Per Capita Income in Ballville is $38,847, while median incomes of families and households are $85,878 and $80,766 respectively.
| Characteristic | Number | Measure |
| Per Capita Income | 3,635 | $38,847 |
| Median Family Income | 1,076 | $85,878 |
| Mean Family Income | 1,076 | $99,957 |
| Median Household Income | 1,572 | $80,766 |
| Mean Household Income | 1,572 | $89,691 |
| Income Deficit | 1,076 | $3,948 |
| Wage / Income Gap (%) | 3,635 | 30.82% |
| Wage / Income Gap ($) | 3,635 | 69.18¢ per $1 |
| Gini / Inequality Index | 3,635 | 0.32 |
Earnings by Sex in Ballville
Average Earnings in Ballville are $40,974, $46,681 for men and $32,294 for women, a difference of 30.8%.
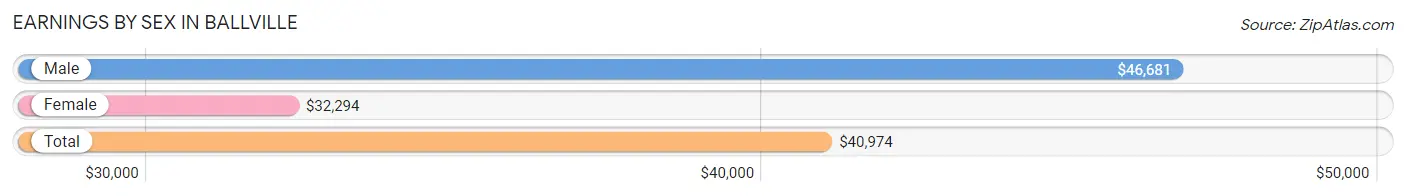
| Sex | Number | Average Earnings |
| Male | 1,085 (55.9%) | $46,681 |
| Female | 857 (44.1%) | $32,294 |
| Total | 1,942 (100.0%) | $40,974 |
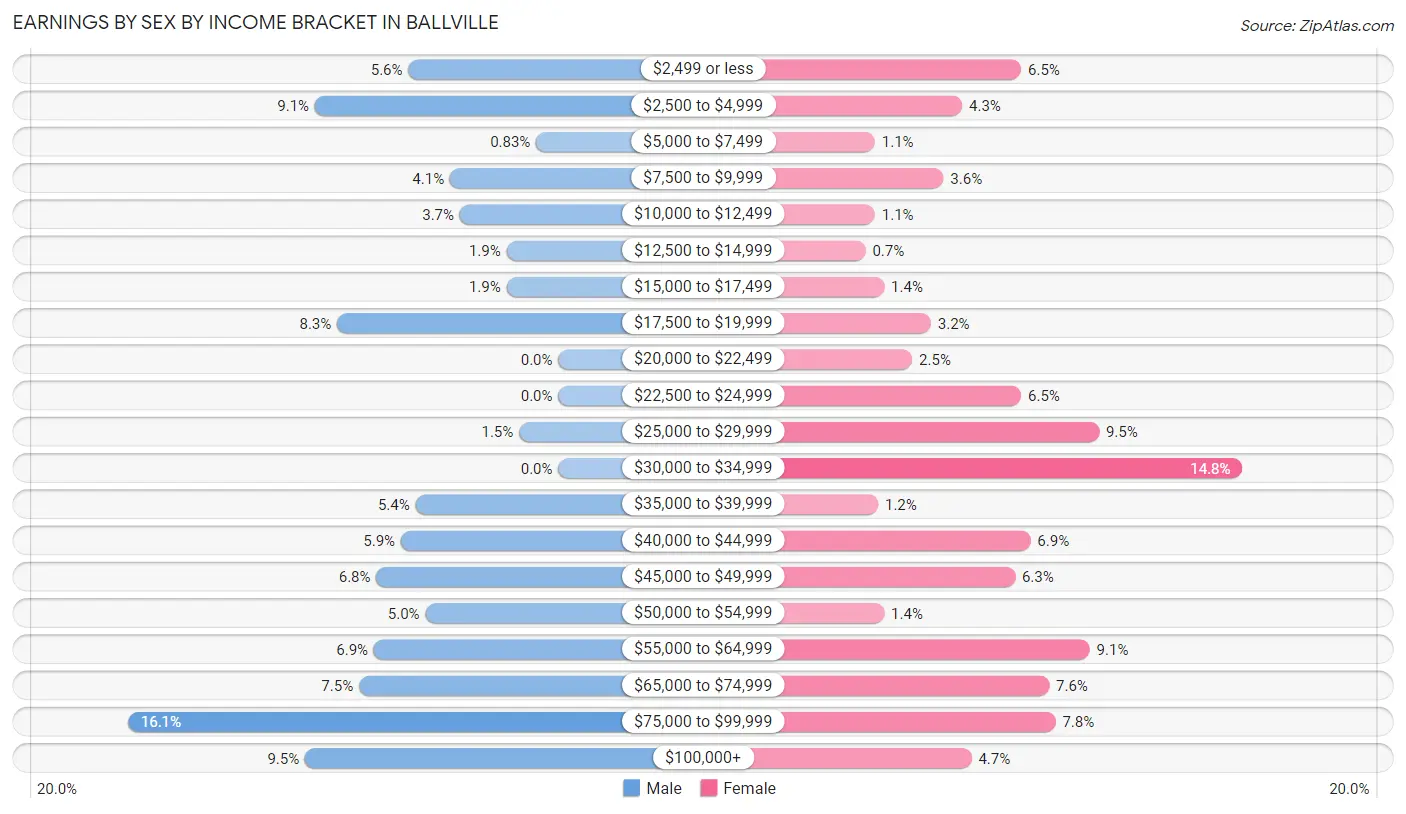
Earnings by Sex by Income Bracket in Ballville
The most common earnings brackets in Ballville are $75,000 to $99,999 for men (175 | 16.1%) and $30,000 to $34,999 for women (127 | 14.8%).
| Income | Male | Female |
| $2,499 or less | 61 (5.6%) | 56 (6.5%) |
| $2,500 to $4,999 | 99 (9.1%) | 37 (4.3%) |
| $5,000 to $7,499 | 9 (0.8%) | 9 (1.1%) |
| $7,500 to $9,999 | 44 (4.1%) | 31 (3.6%) |
| $10,000 to $12,499 | 40 (3.7%) | 9 (1.1%) |
| $12,500 to $14,999 | 21 (1.9%) | 6 (0.7%) |
| $15,000 to $17,499 | 21 (1.9%) | 12 (1.4%) |
| $17,500 to $19,999 | 90 (8.3%) | 27 (3.2%) |
| $20,000 to $22,499 | 0 (0.0%) | 21 (2.5%) |
| $22,500 to $24,999 | 0 (0.0%) | 56 (6.5%) |
| $25,000 to $29,999 | 16 (1.5%) | 81 (9.5%) |
| $30,000 to $34,999 | 0 (0.0%) | 127 (14.8%) |
| $35,000 to $39,999 | 58 (5.3%) | 10 (1.2%) |
| $40,000 to $44,999 | 64 (5.9%) | 59 (6.9%) |
| $45,000 to $49,999 | 74 (6.8%) | 54 (6.3%) |
| $50,000 to $54,999 | 54 (5.0%) | 12 (1.4%) |
| $55,000 to $64,999 | 75 (6.9%) | 78 (9.1%) |
| $65,000 to $74,999 | 81 (7.5%) | 65 (7.6%) |
| $75,000 to $99,999 | 175 (16.1%) | 67 (7.8%) |
| $100,000+ | 103 (9.5%) | 40 (4.7%) |
| Total | 1,085 (100.0%) | 857 (100.0%) |
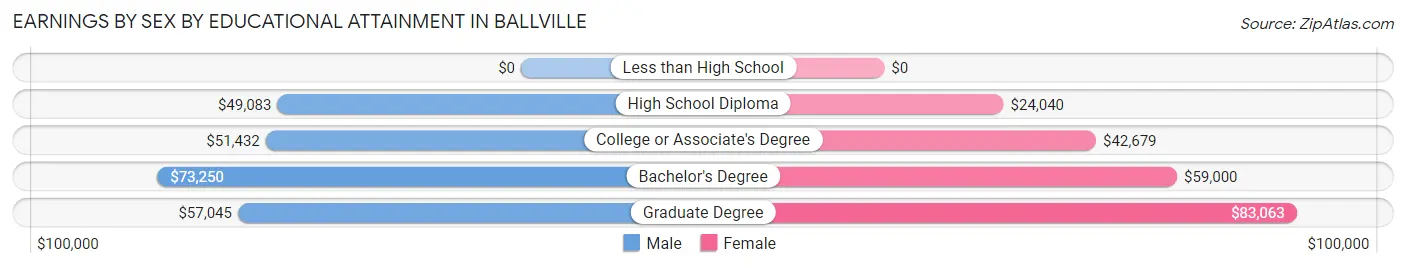
Earnings by Sex by Educational Attainment in Ballville
Average earnings in Ballville are $50,532 for men and $33,889 for women, a difference of 32.9%. Men with an educational attainment of bachelor's degree enjoy the highest average annual earnings of $73,250, while those with high school diploma education earn the least with $49,083. Women with an educational attainment of graduate degree earn the most with the average annual earnings of $83,063, while those with high school diploma education have the smallest earnings of $24,040.
| Educational Attainment | Male Income | Female Income |
| Less than High School | - | - |
| High School Diploma | $49,083 | $24,040 |
| College or Associate's Degree | $51,432 | $42,679 |
| Bachelor's Degree | $73,250 | $59,000 |
| Graduate Degree | $57,045 | $83,063 |
| Total | $50,532 | $33,889 |
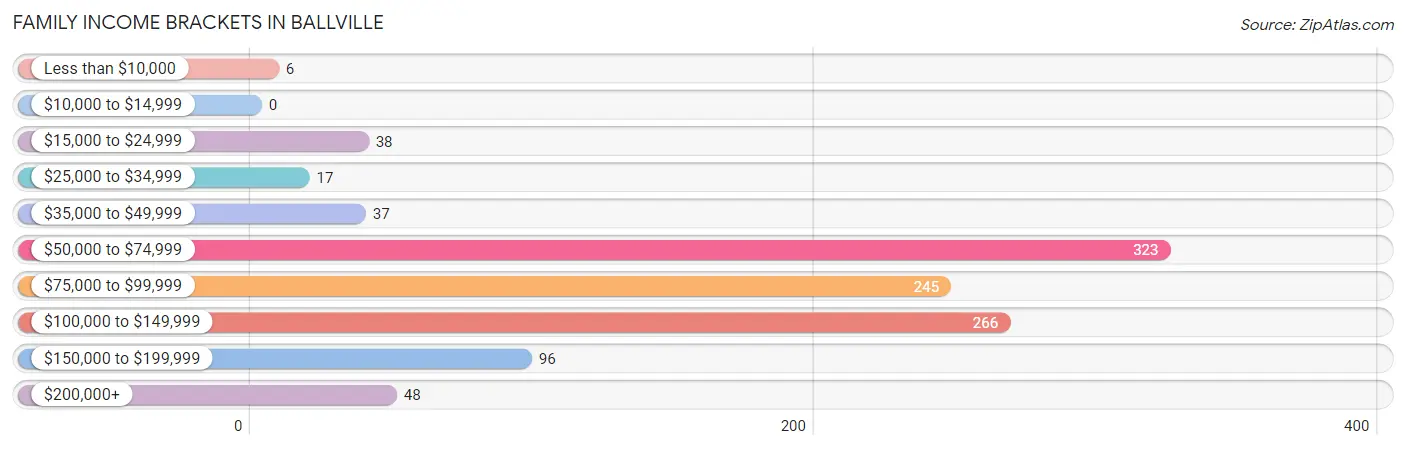
Family Income in Ballville
Family Income Brackets in Ballville
According to the Ballville family income data, there are 323 families falling into the $50,000 to $74,999 income range, which is the most common income bracket and makes up 30.0% of all families.
| Income Bracket | # Families | % Families |
| Less than $10,000 | 6 | 0.6% |
| $10,000 to $14,999 | 0 | 0.0% |
| $15,000 to $24,999 | 38 | 3.5% |
| $25,000 to $34,999 | 17 | 1.6% |
| $35,000 to $49,999 | 37 | 3.4% |
| $50,000 to $74,999 | 323 | 30.0% |
| $75,000 to $99,999 | 245 | 22.8% |
| $100,000 to $149,999 | 266 | 24.7% |
| $150,000 to $199,999 | 96 | 8.9% |
| $200,000+ | 48 | 4.5% |
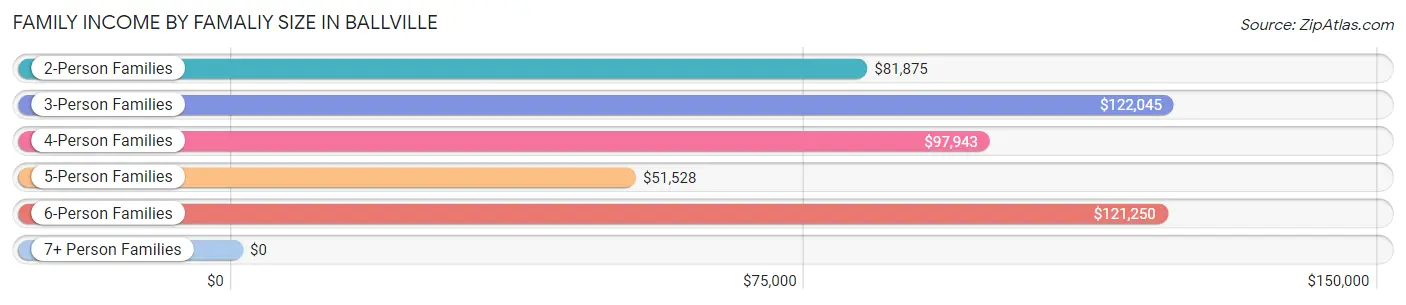
Family Income by Famaliy Size in Ballville
3-person families (112 | 10.4%) account for the highest median family income in Ballville with $122,045 per family, while 2-person families (657 | 61.1%) have the highest median income of $40,938 per family member.
| Income Bracket | # Families | Median Income |
| 2-Person Families | 657 (61.1%) | $81,875 |
| 3-Person Families | 112 (10.4%) | $122,045 |
| 4-Person Families | 199 (18.5%) | $97,943 |
| 5-Person Families | 55 (5.1%) | $51,528 |
| 6-Person Families | 20 (1.9%) | $121,250 |
| 7+ Person Families | 33 (3.1%) | $0 |
| Total | 1,076 (100.0%) | $85,878 |
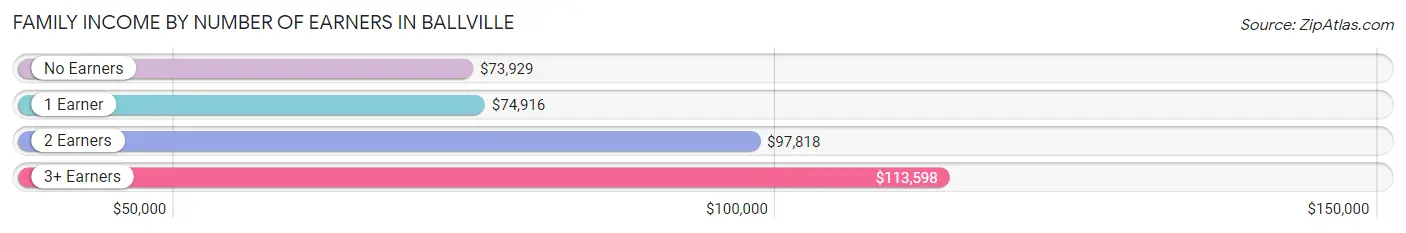
Family Income by Number of Earners in Ballville
The median family income in Ballville is $85,878, with families comprising 3+ earners (77) having the highest median family income of $113,598, while families with no earners (226) have the lowest median family income of $73,929, accounting for 7.2% and 21.0% of families, respectively.
| Number of Earners | # Families | Median Income |
| No Earners | 226 (21.0%) | $73,929 |
| 1 Earner | 247 (23.0%) | $74,916 |
| 2 Earners | 526 (48.9%) | $97,818 |
| 3+ Earners | 77 (7.2%) | $113,598 |
| Total | 1,076 (100.0%) | $85,878 |
Household Income in Ballville
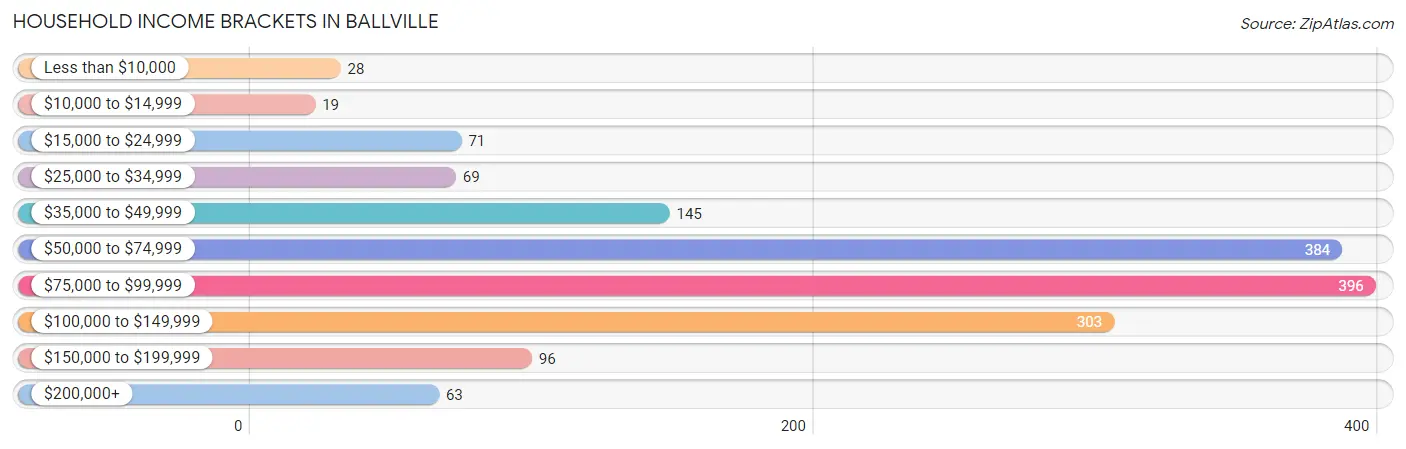
Household Income Brackets in Ballville
With 396 households falling in the category, the $75,000 to $99,999 income range is the most frequent in Ballville, accounting for 25.2% of all households. In contrast, only 19 households (1.2%) fall into the $10,000 to $14,999 income bracket, making it the least populous group.
| Income Bracket | # Households | % Households |
| Less than $10,000 | 28 | 1.8% |
| $10,000 to $14,999 | 19 | 1.2% |
| $15,000 to $24,999 | 71 | 4.5% |
| $25,000 to $34,999 | 69 | 4.4% |
| $35,000 to $49,999 | 145 | 9.2% |
| $50,000 to $74,999 | 384 | 24.4% |
| $75,000 to $99,999 | 396 | 25.2% |
| $100,000 to $149,999 | 303 | 19.3% |
| $150,000 to $199,999 | 96 | 6.1% |
| $200,000+ | 63 | 4.0% |
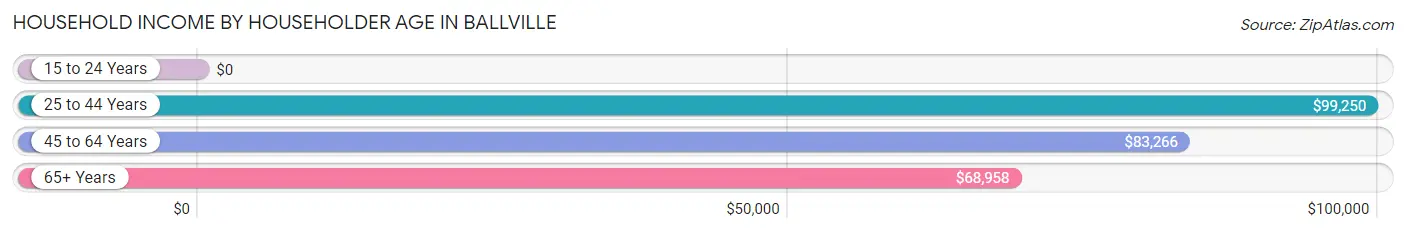
Household Income by Householder Age in Ballville
The median household income in Ballville is $80,766, with the highest median household income of $99,250 found in the 25 to 44 years age bracket for the primary householder. A total of 252 households (16.0%) fall into this category.
| Income Bracket | # Households | Median Income |
| 15 to 24 Years | 0 (0.0%) | $0 |
| 25 to 44 Years | 252 (16.0%) | $99,250 |
| 45 to 64 Years | 691 (44.0%) | $83,266 |
| 65+ Years | 629 (40.0%) | $68,958 |
| Total | 1,572 (100.0%) | $80,766 |
Poverty in Ballville
Income Below Poverty by Sex and Age in Ballville
With 1.5% poverty level for males and 3.7% for females among the residents of Ballville, 75 year old and over males and 75 year old and over females are the most vulnerable to poverty, with 14 males (8.3%) and 33 females (15.8%) in their respective age groups living below the poverty level.
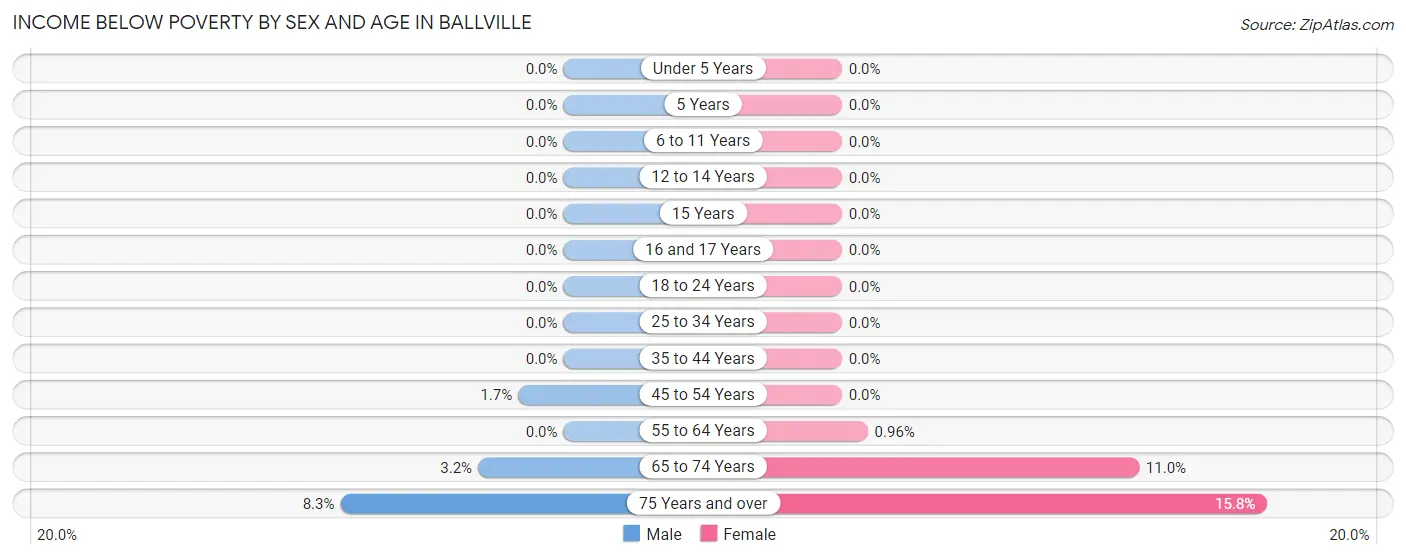
| Age Bracket | Male | Female |
| Under 5 Years | 0 (0.0%) | 0 (0.0%) |
| 5 Years | 0 (0.0%) | 0 (0.0%) |
| 6 to 11 Years | 0 (0.0%) | 0 (0.0%) |
| 12 to 14 Years | 0 (0.0%) | 0 (0.0%) |
| 15 Years | 0 (0.0%) | 0 (0.0%) |
| 16 and 17 Years | 0 (0.0%) | 0 (0.0%) |
| 18 to 24 Years | 0 (0.0%) | 0 (0.0%) |
| 25 to 34 Years | 0 (0.0%) | 0 (0.0%) |
| 35 to 44 Years | 0 (0.0%) | 0 (0.0%) |
| 45 to 54 Years | 4 (1.7%) | 0 (0.0%) |
| 55 to 64 Years | 0 (0.0%) | 3 (1.0%) |
| 65 to 74 Years | 10 (3.2%) | 31 (11.0%) |
| 75 Years and over | 14 (8.3%) | 33 (15.8%) |
| Total | 28 (1.5%) | 67 (3.7%) |
Income Above Poverty by Sex and Age in Ballville
According to the poverty statistics in Ballville, males aged under 5 years and females aged under 5 years are the age groups that are most secure financially, with 100.0% of males and 100.0% of females in these age groups living above the poverty line.
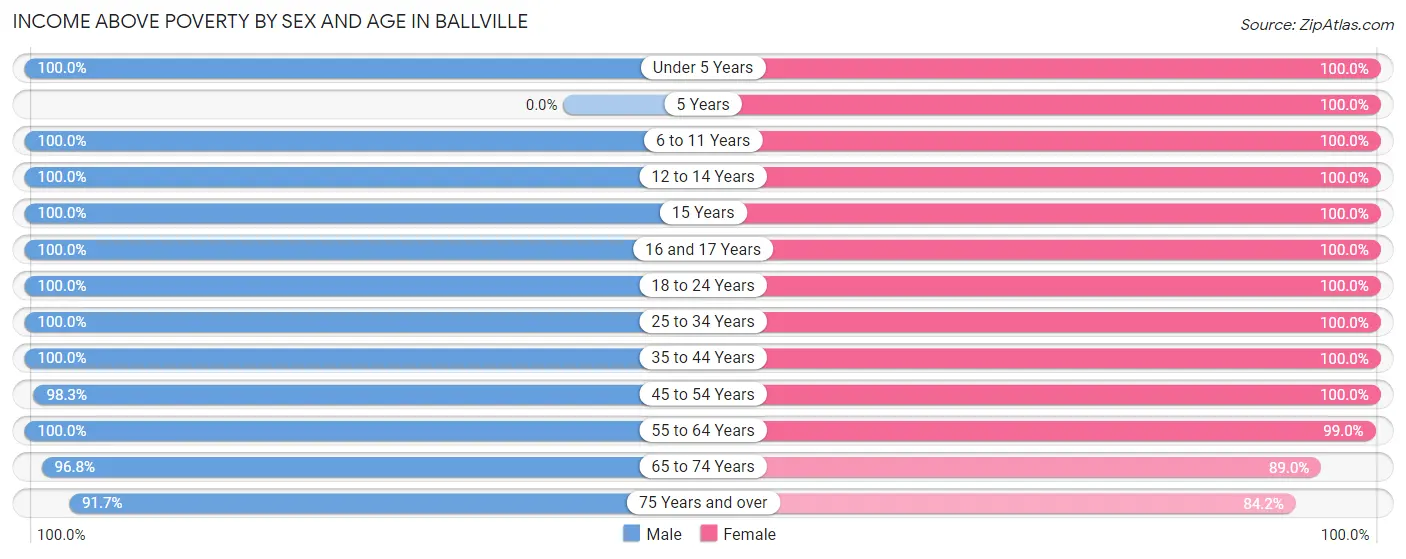
| Age Bracket | Male | Female |
| Under 5 Years | 65 (100.0%) | 56 (100.0%) |
| 5 Years | 0 (0.0%) | 67 (100.0%) |
| 6 to 11 Years | 102 (100.0%) | 87 (100.0%) |
| 12 to 14 Years | 52 (100.0%) | 163 (100.0%) |
| 15 Years | 35 (100.0%) | 9 (100.0%) |
| 16 and 17 Years | 38 (100.0%) | 12 (100.0%) |
| 18 to 24 Years | 108 (100.0%) | 49 (100.0%) |
| 25 to 34 Years | 158 (100.0%) | 213 (100.0%) |
| 35 to 44 Years | 147 (100.0%) | 129 (100.0%) |
| 45 to 54 Years | 234 (98.3%) | 209 (100.0%) |
| 55 to 64 Years | 405 (100.0%) | 308 (99.0%) |
| 65 to 74 Years | 305 (96.8%) | 250 (89.0%) |
| 75 Years and over | 155 (91.7%) | 176 (84.2%) |
| Total | 1,804 (98.5%) | 1,728 (96.3%) |
Income Below Poverty Among Married-Couple Families in Ballville
The poverty statistics for married-couple families in Ballville show that 2.8% or 25 of the total 896 families live below the poverty line. Families with no children have the highest poverty rate of 4.1%, comprising of 25 families. On the other hand, families with 1 or 2 children have the lowest poverty rate of 0.0%, which includes 0 families.
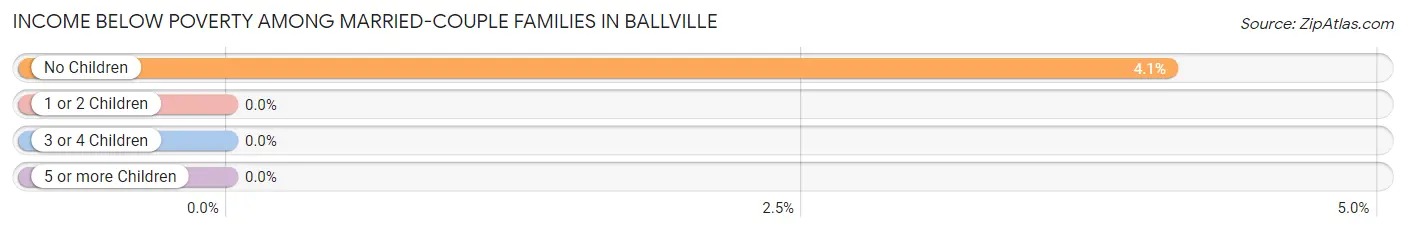
| Children | Above Poverty | Below Poverty |
| No Children | 586 (95.9%) | 25 (4.1%) |
| 1 or 2 Children | 266 (100.0%) | 0 (0.0%) |
| 3 or 4 Children | 19 (100.0%) | 0 (0.0%) |
| 5 or more Children | 0 (0.0%) | 0 (0.0%) |
| Total | 871 (97.2%) | 25 (2.8%) |
Income Below Poverty Among Single-Parent Households in Ballville
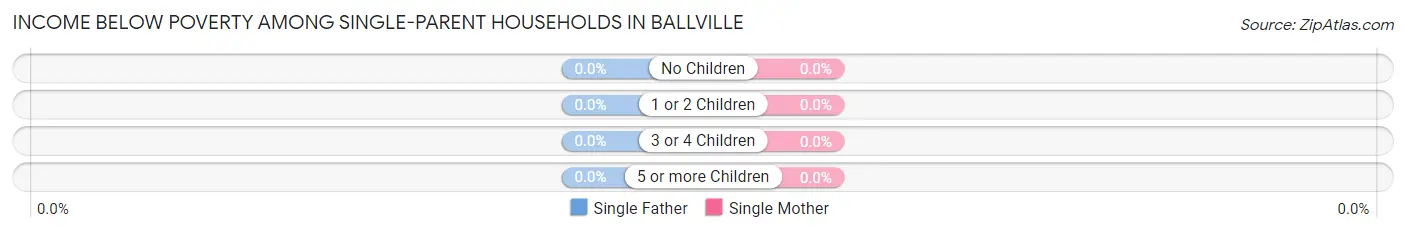
| Children | Single Father | Single Mother |
| No Children | 0 (0.0%) | 0 (0.0%) |
| 1 or 2 Children | 0 (0.0%) | 0 (0.0%) |
| 3 or 4 Children | 0 (0.0%) | 0 (0.0%) |
| 5 or more Children | 0 (0.0%) | 0 (0.0%) |
| Total | 0 (0.0%) | 0 (0.0%) |
Income Below Poverty Among Married-Couple vs Single-Parent Households in Ballville
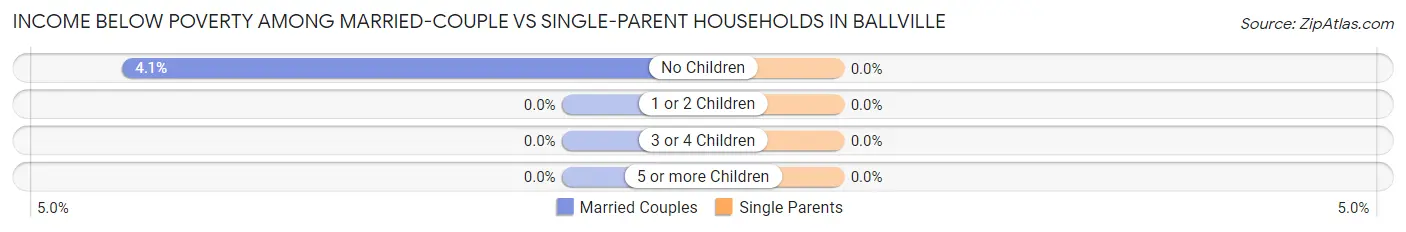
| Children | Married-Couple Families | Single-Parent Households |
| No Children | 25 (4.1%) | 0 (0.0%) |
| 1 or 2 Children | 0 (0.0%) | 0 (0.0%) |
| 3 or 4 Children | 0 (0.0%) | 0 (0.0%) |
| 5 or more Children | 0 (0.0%) | 0 (0.0%) |
| Total | 25 (2.8%) | 0 (0.0%) |
Employment Characteristics in Ballville
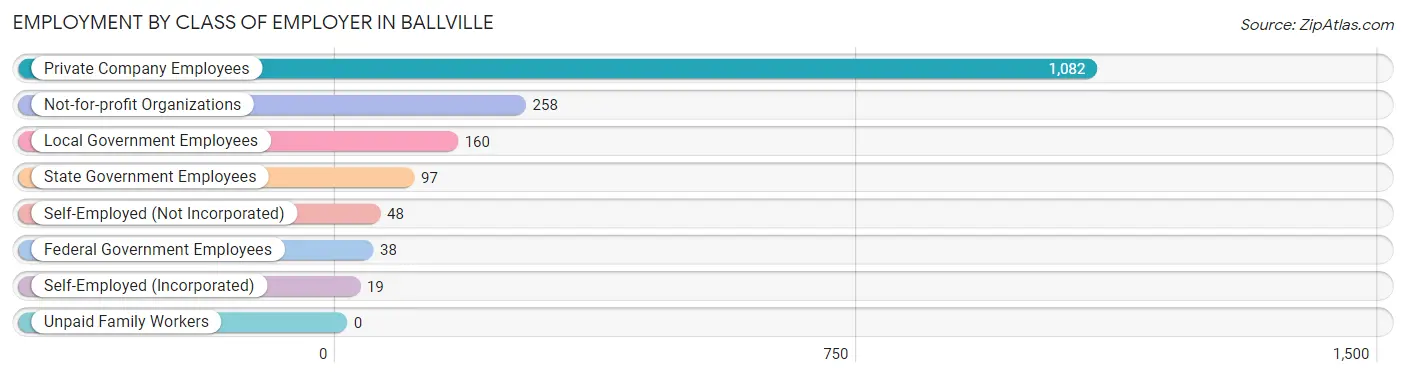
Employment by Class of Employer in Ballville
Among the 1,702 employed individuals in Ballville, private company employees (1,082 | 63.6%), not-for-profit organizations (258 | 15.2%), and local government employees (160 | 9.4%) make up the most common classes of employment.
| Employer Class | # Employees | % Employees |
| Private Company Employees | 1,082 | 63.6% |
| Self-Employed (Incorporated) | 19 | 1.1% |
| Self-Employed (Not Incorporated) | 48 | 2.8% |
| Not-for-profit Organizations | 258 | 15.2% |
| Local Government Employees | 160 | 9.4% |
| State Government Employees | 97 | 5.7% |
| Federal Government Employees | 38 | 2.2% |
| Unpaid Family Workers | 0 | 0.0% |
| Total | 1,702 | 100.0% |
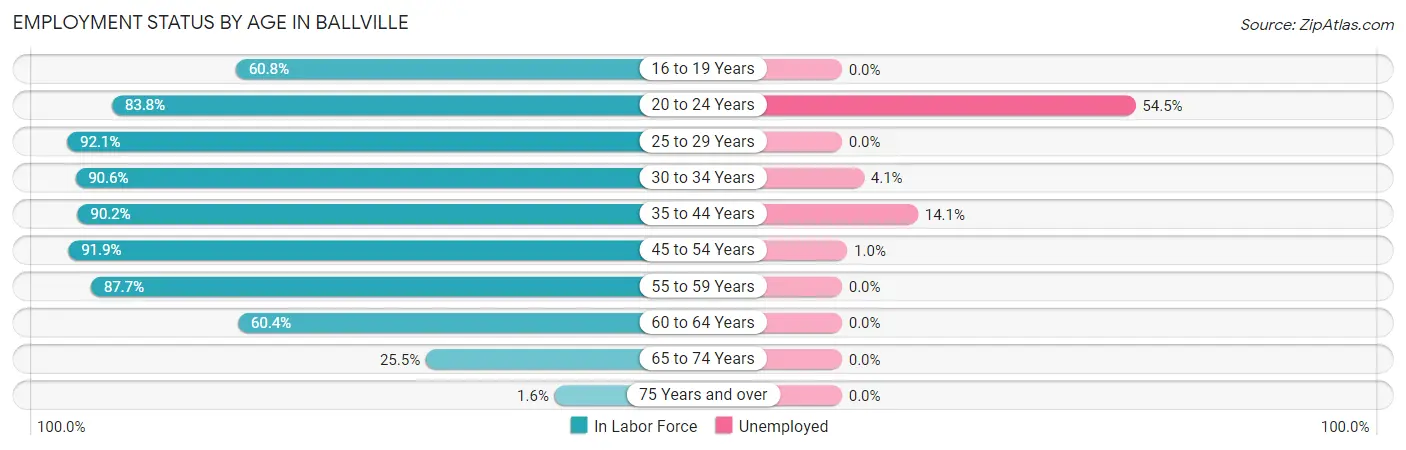
Employment Status by Age in Ballville
According to the labor force statistics for Ballville, out of the total population over 16 years of age (2,991), 61.2% or 1,830 individuals are in the labor force, with 5.2% or 95 of them unemployed. The age group with the highest labor force participation rate is 25 to 29 years, with 92.1% or 116 individuals in the labor force. Within the labor force, the 20 to 24 years age range has the highest percentage of unemployed individuals, with 54.5% or 48 of them being unemployed.
| Age Bracket | In Labor Force | Unemployed |
| 16 to 19 Years | 62 (60.8%) | 0 (0.0%) |
| 20 to 24 Years | 88 (83.8%) | 48 (54.5%) |
| 25 to 29 Years | 116 (92.1%) | 0 (0.0%) |
| 30 to 34 Years | 222 (90.6%) | 9 (4.1%) |
| 35 to 44 Years | 249 (90.2%) | 35 (14.1%) |
| 45 to 54 Years | 411 (91.9%) | 4 (1.0%) |
| 55 to 59 Years | 291 (87.7%) | 0 (0.0%) |
| 60 to 64 Years | 232 (60.4%) | 0 (0.0%) |
| 65 to 74 Years | 152 (25.5%) | 0 (0.0%) |
| 75 Years and over | 6 (1.6%) | 0 (0.0%) |
| Total | 1,830 (61.2%) | 95 (5.2%) |
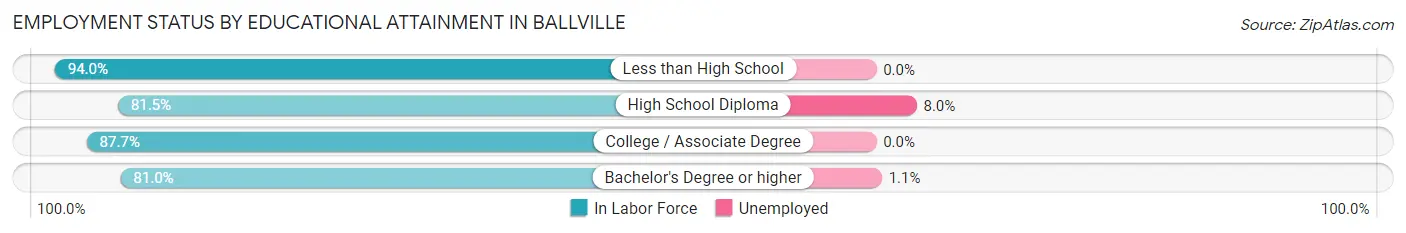
Employment Status by Educational Attainment in Ballville
According to labor force statistics for Ballville, 84.0% of individuals (1,520) out of the total population between 25 and 64 years of age (1,810) are in the labor force, with 3.2% or 49 of them being unemployed. The group with the highest labor force participation rate are those with the educational attainment of less than high school, with 94.0% or 79 individuals in the labor force. Within the labor force, individuals with high school diploma education have the highest percentage of unemployment, with 8.0% or 44 of them being unemployed.
| Educational Attainment | In Labor Force | Unemployed |
| Less than High School | 79 (94.0%) | 0 (0.0%) |
| High School Diploma | 550 (81.5%) | 54 (8.0%) |
| College / Associate Degree | 535 (87.7%) | 0 (0.0%) |
| Bachelor's Degree or higher | 357 (81.0%) | 5 (1.1%) |
| Total | 1,520 (84.0%) | 58 (3.2%) |
Employment Occupations by Sex in Ballville
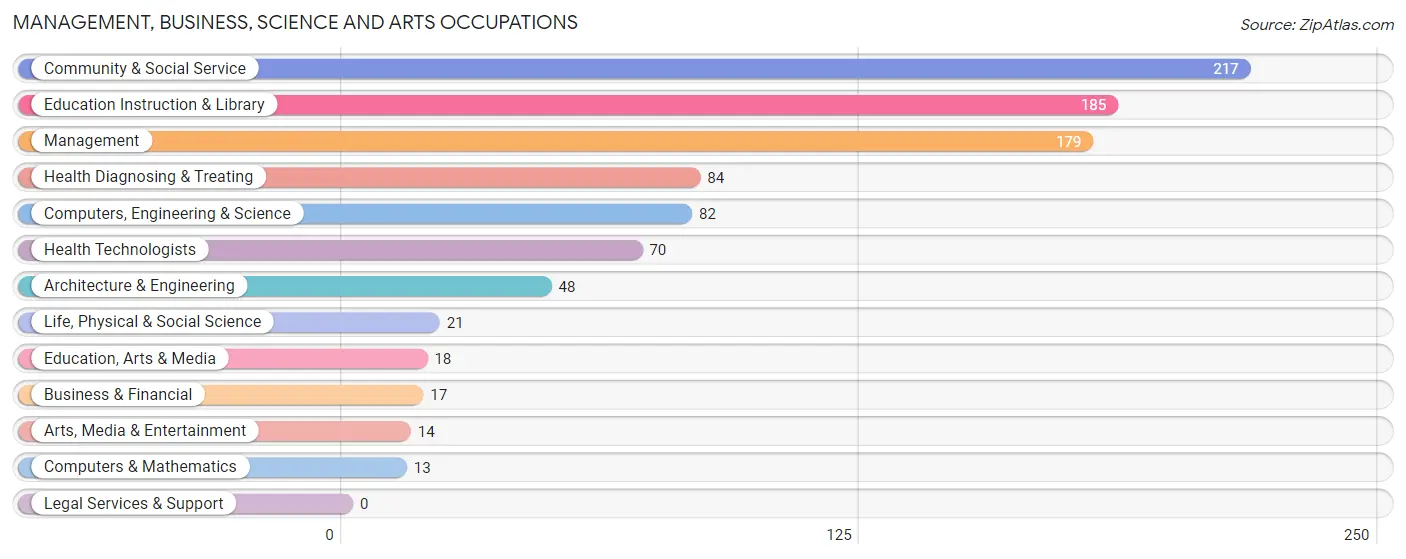
Management, Business, Science and Arts Occupations
The most common Management, Business, Science and Arts occupations in Ballville are Community & Social Service (217 | 12.5%), Education Instruction & Library (185 | 10.7%), Management (179 | 10.3%), Health Diagnosing & Treating (84 | 4.9%), and Computers, Engineering & Science (82 | 4.7%).
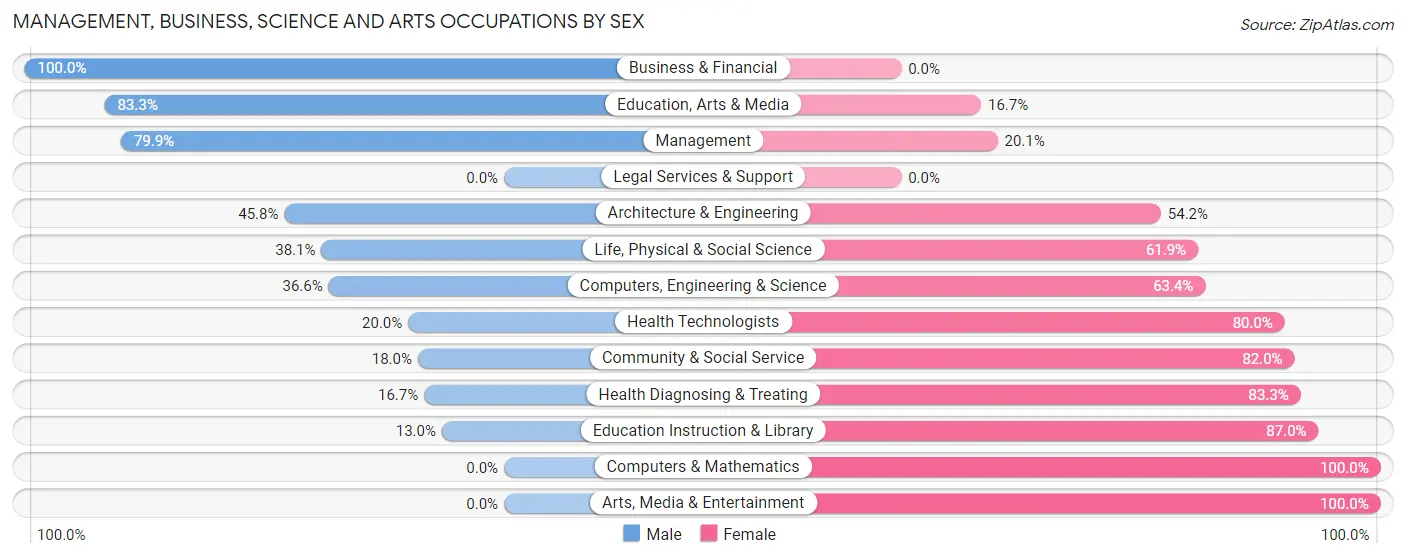
Management, Business, Science and Arts Occupations by Sex
Within the Management, Business, Science and Arts occupations in Ballville, the most male-oriented occupations are Business & Financial (100.0%), Education, Arts & Media (83.3%), and Management (79.9%), while the most female-oriented occupations are Computers & Mathematics (100.0%), Arts, Media & Entertainment (100.0%), and Education Instruction & Library (87.0%).
| Occupation | Male | Female |
| Management | 143 (79.9%) | 36 (20.1%) |
| Business & Financial | 17 (100.0%) | 0 (0.0%) |
| Computers, Engineering & Science | 30 (36.6%) | 52 (63.4%) |
| Computers & Mathematics | 0 (0.0%) | 13 (100.0%) |
| Architecture & Engineering | 22 (45.8%) | 26 (54.2%) |
| Life, Physical & Social Science | 8 (38.1%) | 13 (61.9%) |
| Community & Social Service | 39 (18.0%) | 178 (82.0%) |
| Education, Arts & Media | 15 (83.3%) | 3 (16.7%) |
| Legal Services & Support | 0 (0.0%) | 0 (0.0%) |
| Education Instruction & Library | 24 (13.0%) | 161 (87.0%) |
| Arts, Media & Entertainment | 0 (0.0%) | 14 (100.0%) |
| Health Diagnosing & Treating | 14 (16.7%) | 70 (83.3%) |
| Health Technologists | 14 (20.0%) | 56 (80.0%) |
| Total (Category) | 243 (42.0%) | 336 (58.0%) |
| Total (Overall) | 924 (53.3%) | 809 (46.7%) |
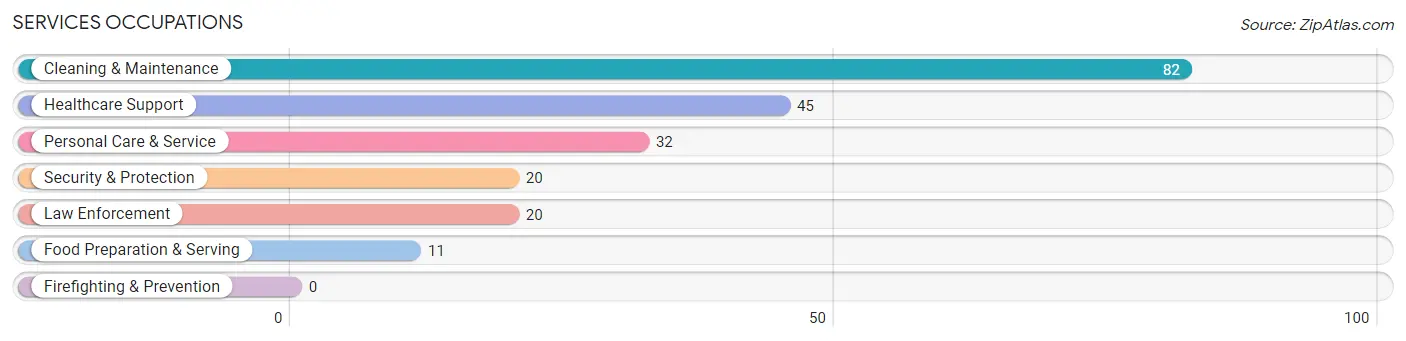
Services Occupations
The most common Services occupations in Ballville are Cleaning & Maintenance (82 | 4.7%), Healthcare Support (45 | 2.6%), Personal Care & Service (32 | 1.8%), Security & Protection (20 | 1.1%), and Law Enforcement (20 | 1.1%).
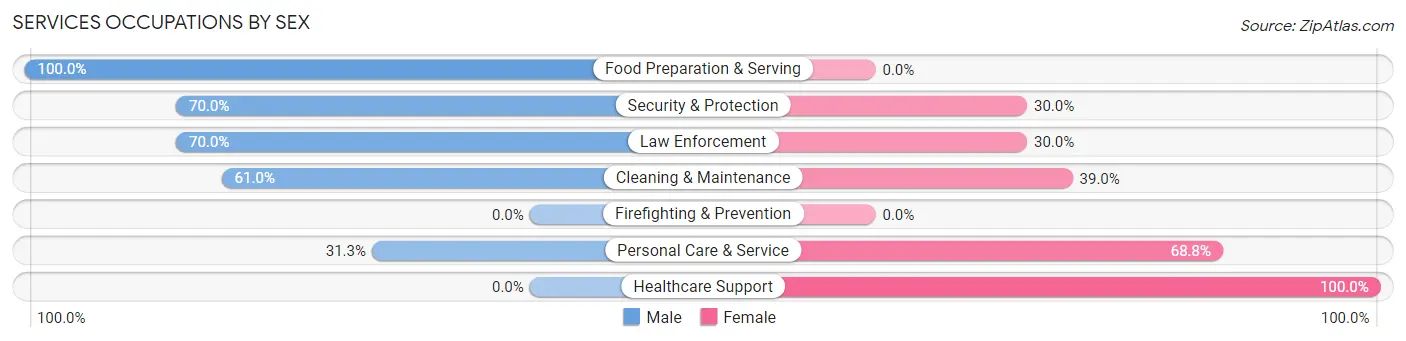
Services Occupations by Sex
Within the Services occupations in Ballville, the most male-oriented occupations are Food Preparation & Serving (100.0%), Security & Protection (70.0%), and Law Enforcement (70.0%), while the most female-oriented occupations are Healthcare Support (100.0%), Personal Care & Service (68.8%), and Cleaning & Maintenance (39.0%).
| Occupation | Male | Female |
| Healthcare Support | 0 (0.0%) | 45 (100.0%) |
| Security & Protection | 14 (70.0%) | 6 (30.0%) |
| Firefighting & Prevention | 0 (0.0%) | 0 (0.0%) |
| Law Enforcement | 14 (70.0%) | 6 (30.0%) |
| Food Preparation & Serving | 11 (100.0%) | 0 (0.0%) |
| Cleaning & Maintenance | 50 (61.0%) | 32 (39.0%) |
| Personal Care & Service | 10 (31.2%) | 22 (68.8%) |
| Total (Category) | 85 (44.7%) | 105 (55.3%) |
| Total (Overall) | 924 (53.3%) | 809 (46.7%) |
Sales and Office Occupations
The most common Sales and Office occupations in Ballville are Office & Administration (308 | 17.8%), and Sales & Related (134 | 7.7%).

Sales and Office Occupations by Sex
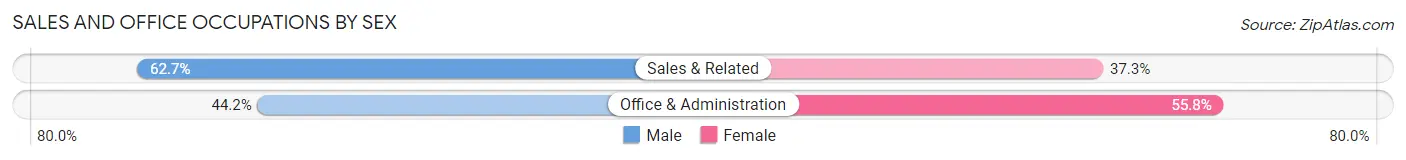
| Occupation | Male | Female |
| Sales & Related | 84 (62.7%) | 50 (37.3%) |
| Office & Administration | 136 (44.2%) | 172 (55.8%) |
| Total (Category) | 220 (49.8%) | 222 (50.2%) |
| Total (Overall) | 924 (53.3%) | 809 (46.7%) |
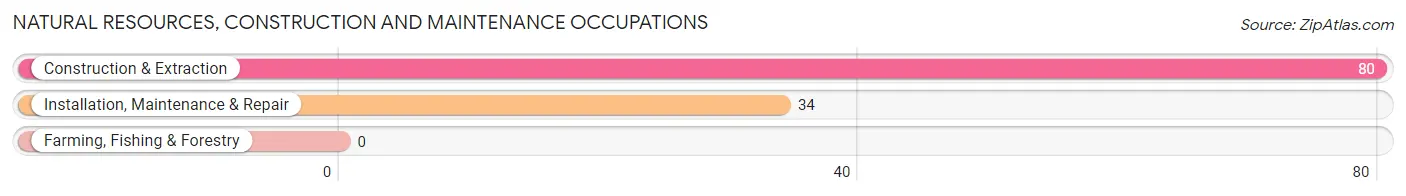
Natural Resources, Construction and Maintenance Occupations
The most common Natural Resources, Construction and Maintenance occupations in Ballville are Construction & Extraction (80 | 4.6%), and Installation, Maintenance & Repair (34 | 2.0%).
Natural Resources, Construction and Maintenance Occupations by Sex
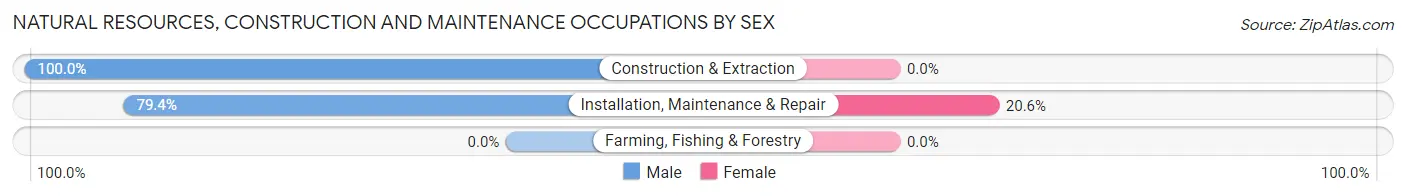
| Occupation | Male | Female |
| Farming, Fishing & Forestry | 0 (0.0%) | 0 (0.0%) |
| Construction & Extraction | 80 (100.0%) | 0 (0.0%) |
| Installation, Maintenance & Repair | 27 (79.4%) | 7 (20.6%) |
| Total (Category) | 107 (93.9%) | 7 (6.1%) |
| Total (Overall) | 924 (53.3%) | 809 (46.7%) |
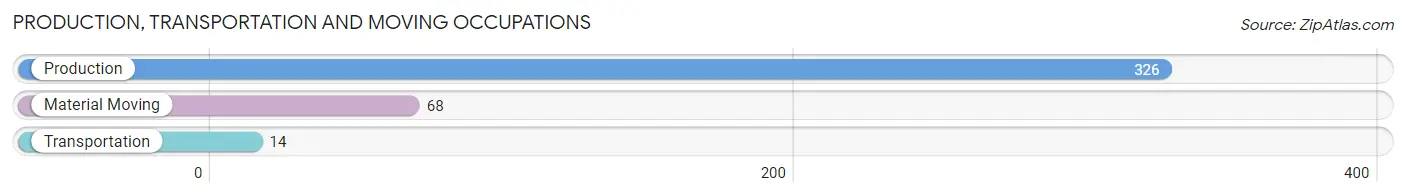
Production, Transportation and Moving Occupations
The most common Production, Transportation and Moving occupations in Ballville are Production (326 | 18.8%), Material Moving (68 | 3.9%), and Transportation (14 | 0.8%).
Production, Transportation and Moving Occupations by Sex
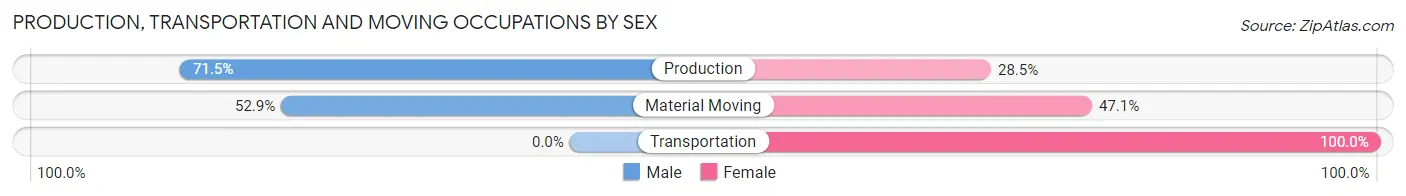
| Occupation | Male | Female |
| Production | 233 (71.5%) | 93 (28.5%) |
| Transportation | 0 (0.0%) | 14 (100.0%) |
| Material Moving | 36 (52.9%) | 32 (47.1%) |
| Total (Category) | 269 (65.9%) | 139 (34.1%) |
| Total (Overall) | 924 (53.3%) | 809 (46.7%) |
Employment Industries by Sex in Ballville
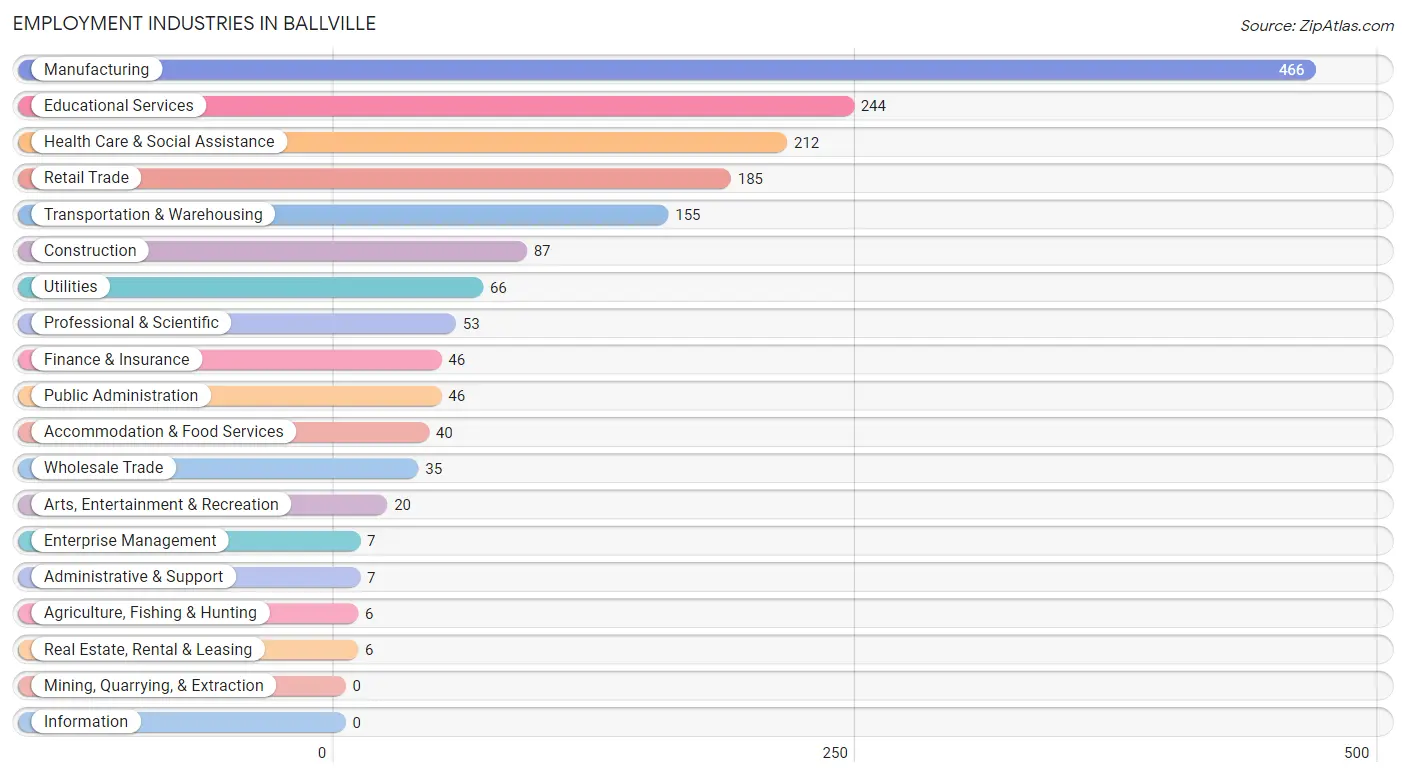
Employment Industries in Ballville
The major employment industries in Ballville include Manufacturing (466 | 26.9%), Educational Services (244 | 14.1%), Health Care & Social Assistance (212 | 12.2%), Retail Trade (185 | 10.7%), and Transportation & Warehousing (155 | 8.9%).
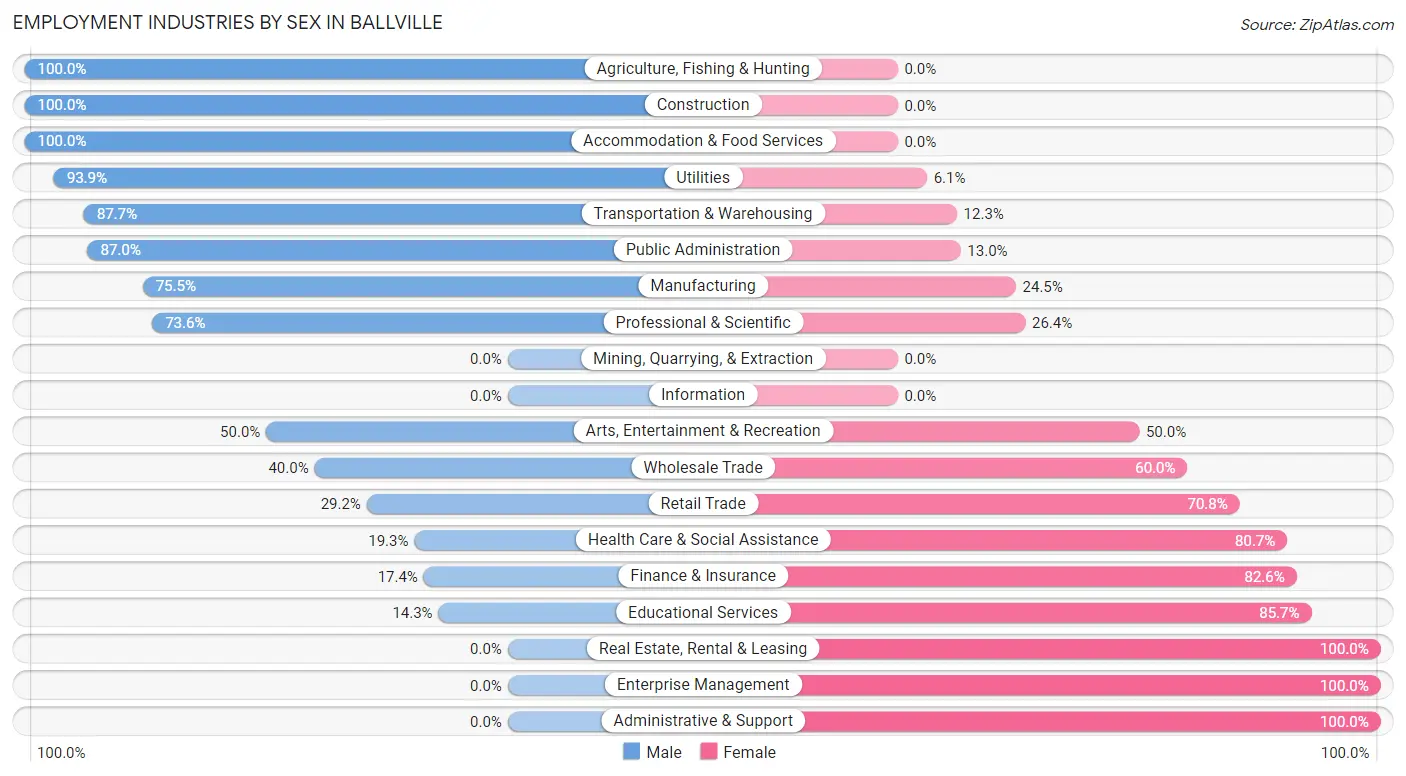
Employment Industries by Sex in Ballville
The Ballville industries that see more men than women are Agriculture, Fishing & Hunting (100.0%), Construction (100.0%), and Accommodation & Food Services (100.0%), whereas the industries that tend to have a higher number of women are Real Estate, Rental & Leasing (100.0%), Enterprise Management (100.0%), and Administrative & Support (100.0%).
| Industry | Male | Female |
| Agriculture, Fishing & Hunting | 6 (100.0%) | 0 (0.0%) |
| Mining, Quarrying, & Extraction | 0 (0.0%) | 0 (0.0%) |
| Construction | 87 (100.0%) | 0 (0.0%) |
| Manufacturing | 352 (75.5%) | 114 (24.5%) |
| Wholesale Trade | 14 (40.0%) | 21 (60.0%) |
| Retail Trade | 54 (29.2%) | 131 (70.8%) |
| Transportation & Warehousing | 136 (87.7%) | 19 (12.3%) |
| Utilities | 62 (93.9%) | 4 (6.1%) |
| Information | 0 (0.0%) | 0 (0.0%) |
| Finance & Insurance | 8 (17.4%) | 38 (82.6%) |
| Real Estate, Rental & Leasing | 0 (0.0%) | 6 (100.0%) |
| Professional & Scientific | 39 (73.6%) | 14 (26.4%) |
| Enterprise Management | 0 (0.0%) | 7 (100.0%) |
| Administrative & Support | 0 (0.0%) | 7 (100.0%) |
| Educational Services | 35 (14.3%) | 209 (85.7%) |
| Health Care & Social Assistance | 41 (19.3%) | 171 (80.7%) |
| Arts, Entertainment & Recreation | 10 (50.0%) | 10 (50.0%) |
| Accommodation & Food Services | 40 (100.0%) | 0 (0.0%) |
| Public Administration | 40 (87.0%) | 6 (13.0%) |
| Total | 924 (53.3%) | 809 (46.7%) |
Education in Ballville
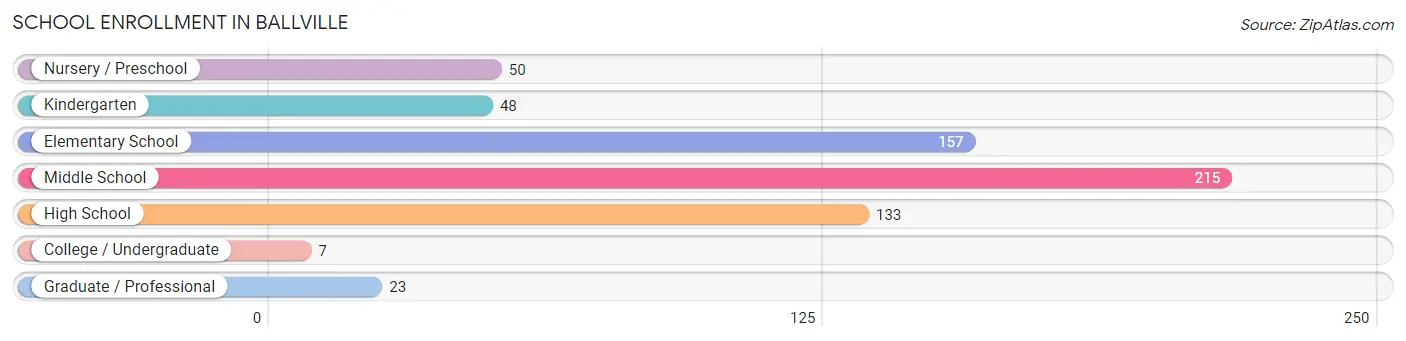
School Enrollment in Ballville
The most common levels of schooling among the 633 students in Ballville are middle school (215 | 34.0%), elementary school (157 | 24.8%), and high school (133 | 21.0%).
| School Level | # Students | % Students |
| Nursery / Preschool | 50 | 7.9% |
| Kindergarten | 48 | 7.6% |
| Elementary School | 157 | 24.8% |
| Middle School | 215 | 34.0% |
| High School | 133 | 21.0% |
| College / Undergraduate | 7 | 1.1% |
| Graduate / Professional | 23 | 3.6% |
| Total | 633 | 100.0% |
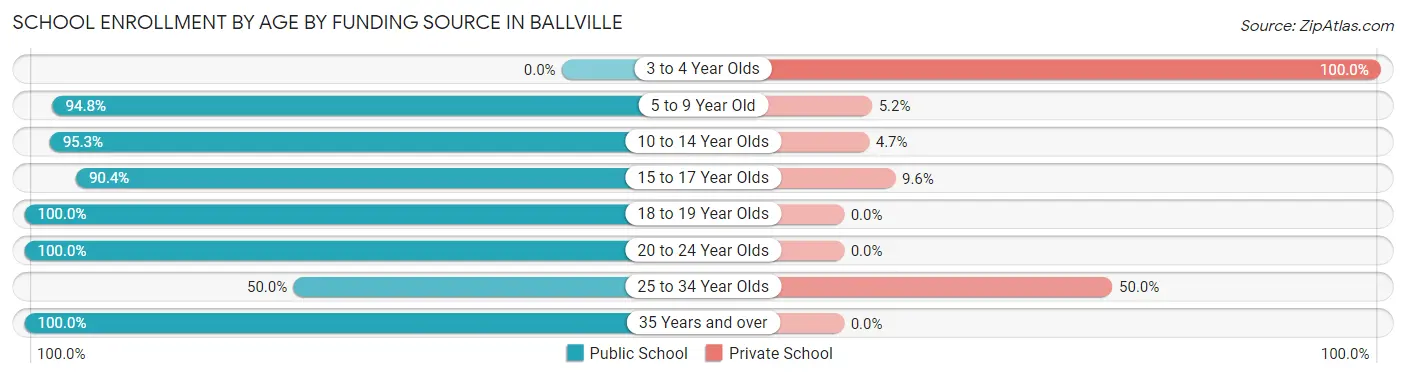
School Enrollment by Age by Funding Source in Ballville
Out of a total of 633 students who are enrolled in schools in Ballville, 70 (11.1%) attend a private institution, while the remaining 563 (88.9%) are enrolled in public schools. The age group of 3 to 4 year olds has the highest likelihood of being enrolled in private schools, with 31 (100.0% in the age bracket) enrolled. Conversely, the age group of 18 to 19 year olds has the lowest likelihood of being enrolled in a private school, with 7 (100.0% in the age bracket) attending a public institution.
| Age Bracket | Public School | Private School |
| 3 to 4 Year Olds | 0 (0.0%) | 31 (100.0%) |
| 5 to 9 Year Old | 163 (94.8%) | 9 (5.2%) |
| 10 to 14 Year Olds | 285 (95.3%) | 14 (4.7%) |
| 15 to 17 Year Olds | 85 (90.4%) | 9 (9.6%) |
| 18 to 19 Year Olds | 7 (100.0%) | 0 (0.0%) |
| 20 to 24 Year Olds | 9 (100.0%) | 0 (0.0%) |
| 25 to 34 Year Olds | 7 (50.0%) | 7 (50.0%) |
| 35 Years and over | 7 (100.0%) | 0 (0.0%) |
| Total | 563 (88.9%) | 70 (11.1%) |
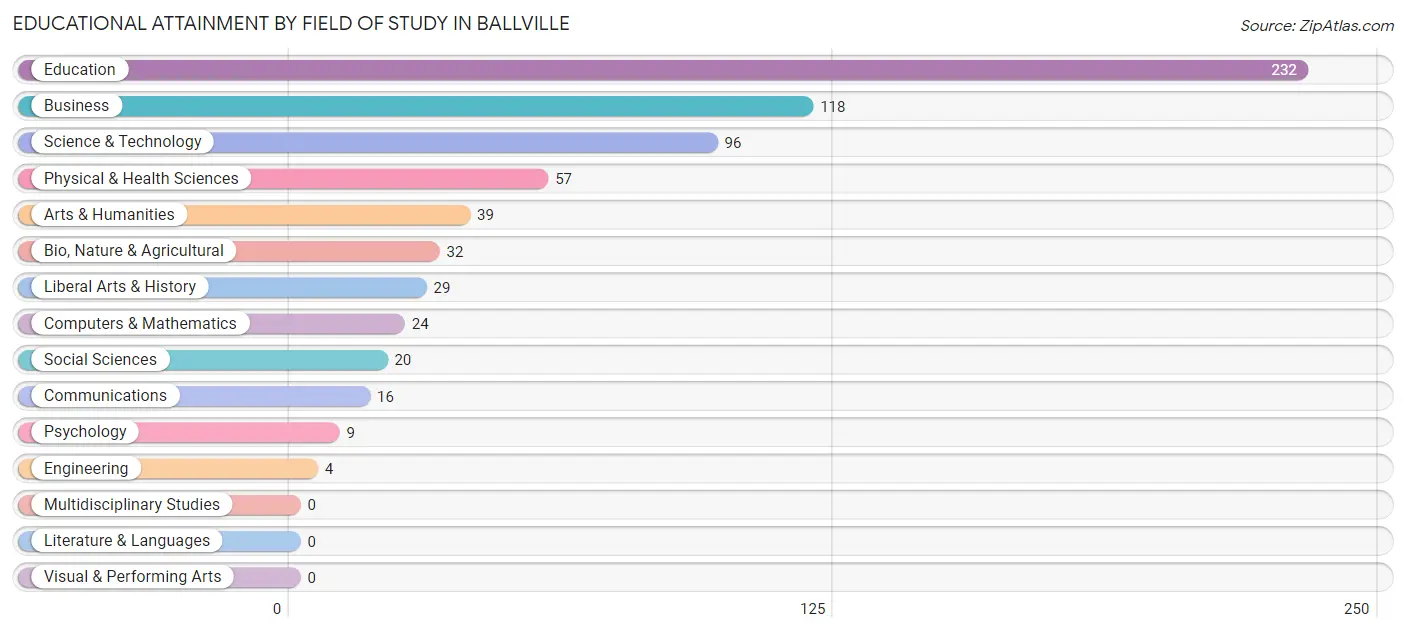
Educational Attainment by Field of Study in Ballville
Education (232 | 34.3%), business (118 | 17.5%), science & technology (96 | 14.2%), physical & health sciences (57 | 8.4%), and arts & humanities (39 | 5.8%) are the most common fields of study among 676 individuals in Ballville who have obtained a bachelor's degree or higher.
| Field of Study | # Graduates | % Graduates |
| Computers & Mathematics | 24 | 3.5% |
| Bio, Nature & Agricultural | 32 | 4.7% |
| Physical & Health Sciences | 57 | 8.4% |
| Psychology | 9 | 1.3% |
| Social Sciences | 20 | 3.0% |
| Engineering | 4 | 0.6% |
| Multidisciplinary Studies | 0 | 0.0% |
| Science & Technology | 96 | 14.2% |
| Business | 118 | 17.5% |
| Education | 232 | 34.3% |
| Literature & Languages | 0 | 0.0% |
| Liberal Arts & History | 29 | 4.3% |
| Visual & Performing Arts | 0 | 0.0% |
| Communications | 16 | 2.4% |
| Arts & Humanities | 39 | 5.8% |
| Total | 676 | 100.0% |
Transportation & Commute in Ballville
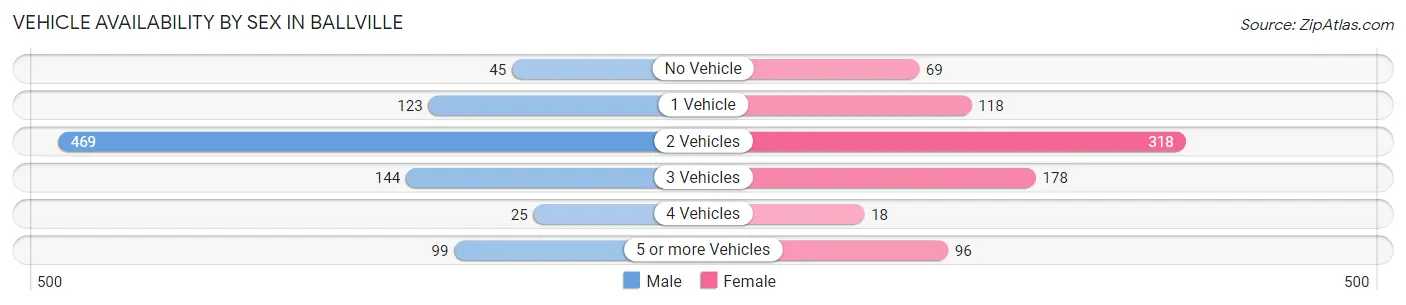
Vehicle Availability by Sex in Ballville
The most prevalent vehicle ownership categories in Ballville are males with 2 vehicles (469, accounting for 51.8%) and females with 2 vehicles (318, making up 58.9%).
| Vehicles Available | Male | Female |
| No Vehicle | 45 (5.0%) | 69 (8.7%) |
| 1 Vehicle | 123 (13.6%) | 118 (14.8%) |
| 2 Vehicles | 469 (51.8%) | 318 (39.9%) |
| 3 Vehicles | 144 (15.9%) | 178 (22.3%) |
| 4 Vehicles | 25 (2.8%) | 18 (2.3%) |
| 5 or more Vehicles | 99 (10.9%) | 96 (12.0%) |
| Total | 905 (100.0%) | 797 (100.0%) |
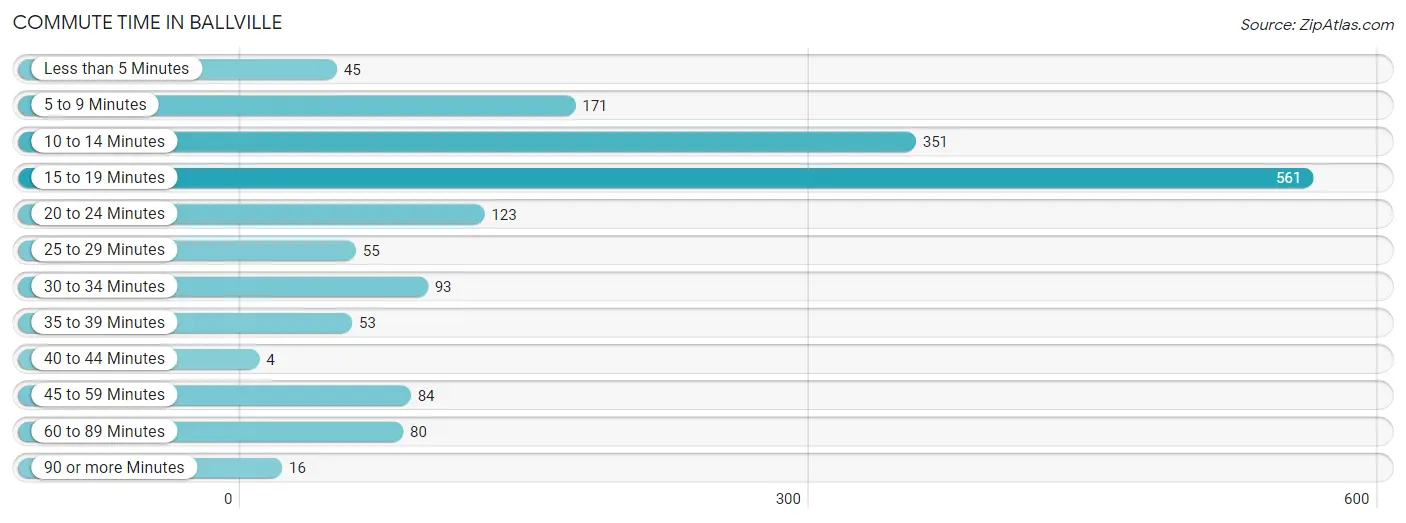
Commute Time in Ballville
The most frequently occuring commute durations in Ballville are 15 to 19 minutes (561 commuters, 34.3%), 10 to 14 minutes (351 commuters, 21.4%), and 5 to 9 minutes (171 commuters, 10.4%).
| Commute Time | # Commuters | % Commuters |
| Less than 5 Minutes | 45 | 2.8% |
| 5 to 9 Minutes | 171 | 10.4% |
| 10 to 14 Minutes | 351 | 21.4% |
| 15 to 19 Minutes | 561 | 34.3% |
| 20 to 24 Minutes | 123 | 7.5% |
| 25 to 29 Minutes | 55 | 3.4% |
| 30 to 34 Minutes | 93 | 5.7% |
| 35 to 39 Minutes | 53 | 3.2% |
| 40 to 44 Minutes | 4 | 0.2% |
| 45 to 59 Minutes | 84 | 5.1% |
| 60 to 89 Minutes | 80 | 4.9% |
| 90 or more Minutes | 16 | 1.0% |
Commute Time by Sex in Ballville
The most common commute times in Ballville are 15 to 19 minutes (338 commuters, 38.2%) for males and 10 to 14 minutes (249 commuters, 33.2%) for females.
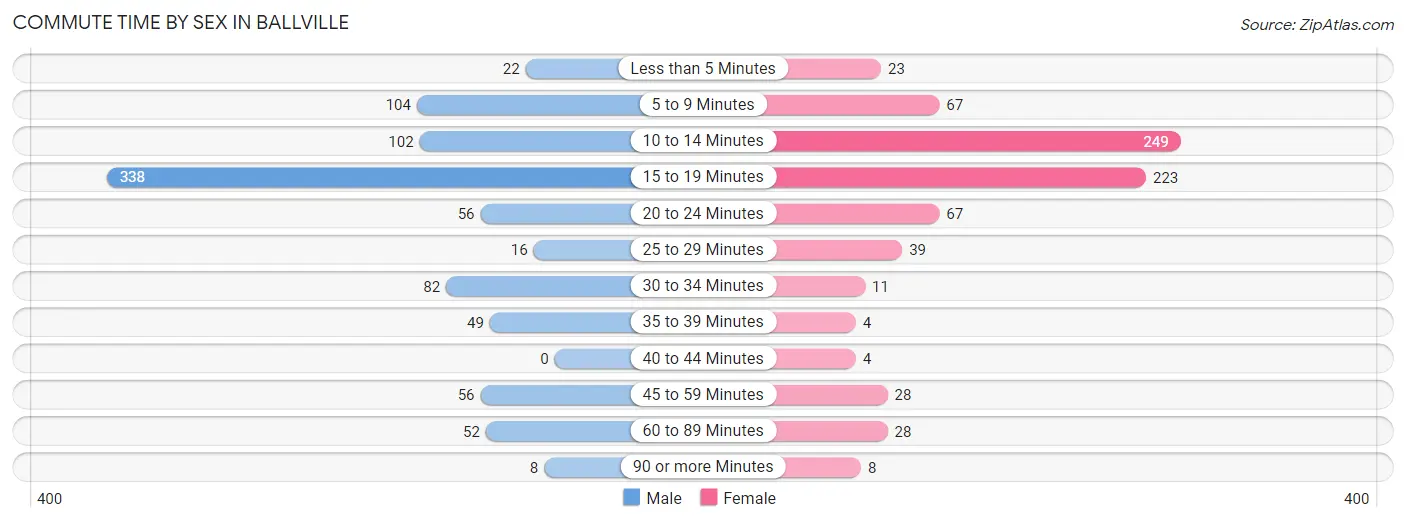
| Commute Time | Male | Female |
| Less than 5 Minutes | 22 (2.5%) | 23 (3.1%) |
| 5 to 9 Minutes | 104 (11.7%) | 67 (8.9%) |
| 10 to 14 Minutes | 102 (11.5%) | 249 (33.2%) |
| 15 to 19 Minutes | 338 (38.2%) | 223 (29.7%) |
| 20 to 24 Minutes | 56 (6.3%) | 67 (8.9%) |
| 25 to 29 Minutes | 16 (1.8%) | 39 (5.2%) |
| 30 to 34 Minutes | 82 (9.3%) | 11 (1.5%) |
| 35 to 39 Minutes | 49 (5.5%) | 4 (0.5%) |
| 40 to 44 Minutes | 0 (0.0%) | 4 (0.5%) |
| 45 to 59 Minutes | 56 (6.3%) | 28 (3.7%) |
| 60 to 89 Minutes | 52 (5.9%) | 28 (3.7%) |
| 90 or more Minutes | 8 (0.9%) | 8 (1.1%) |
Time of Departure to Work by Sex in Ballville
The most frequent times of departure to work in Ballville are 12:00 PM to 3:59 PM (152, 17.2%) for males and 4:00 PM to 11:59 PM (111, 14.8%) for females.
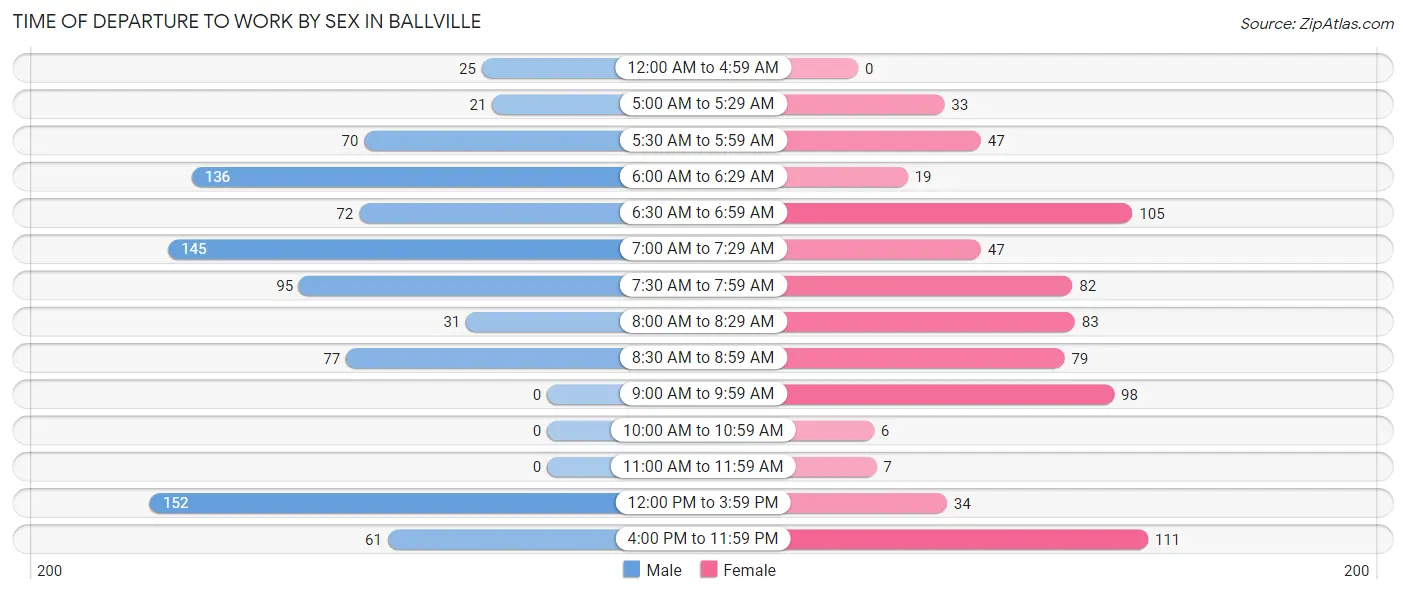
| Time of Departure | Male | Female |
| 12:00 AM to 4:59 AM | 25 (2.8%) | 0 (0.0%) |
| 5:00 AM to 5:29 AM | 21 (2.4%) | 33 (4.4%) |
| 5:30 AM to 5:59 AM | 70 (7.9%) | 47 (6.3%) |
| 6:00 AM to 6:29 AM | 136 (15.4%) | 19 (2.5%) |
| 6:30 AM to 6:59 AM | 72 (8.1%) | 105 (14.0%) |
| 7:00 AM to 7:29 AM | 145 (16.4%) | 47 (6.3%) |
| 7:30 AM to 7:59 AM | 95 (10.7%) | 82 (10.9%) |
| 8:00 AM to 8:29 AM | 31 (3.5%) | 83 (11.1%) |
| 8:30 AM to 8:59 AM | 77 (8.7%) | 79 (10.5%) |
| 9:00 AM to 9:59 AM | 0 (0.0%) | 98 (13.1%) |
| 10:00 AM to 10:59 AM | 0 (0.0%) | 6 (0.8%) |
| 11:00 AM to 11:59 AM | 0 (0.0%) | 7 (0.9%) |
| 12:00 PM to 3:59 PM | 152 (17.2%) | 34 (4.5%) |
| 4:00 PM to 11:59 PM | 61 (6.9%) | 111 (14.8%) |
| Total | 885 (100.0%) | 751 (100.0%) |
Housing Occupancy in Ballville
Occupancy by Ownership in Ballville
Of the total 1,572 dwellings in Ballville, owner-occupied units account for 1,452 (92.4%), while renter-occupied units make up 120 (7.6%).
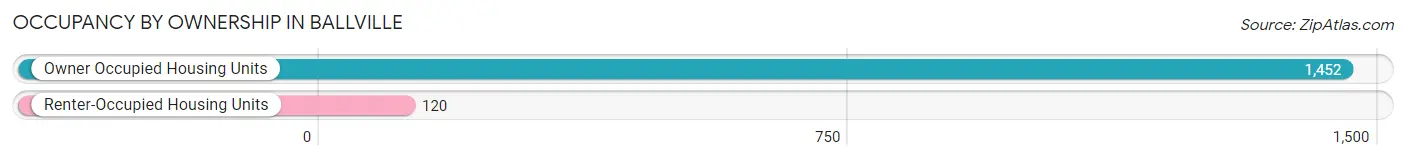
| Occupancy | # Housing Units | % Housing Units |
| Owner Occupied Housing Units | 1,452 | 92.4% |
| Renter-Occupied Housing Units | 120 | 7.6% |
| Total Occupied Housing Units | 1,572 | 100.0% |
Occupancy by Household Size in Ballville
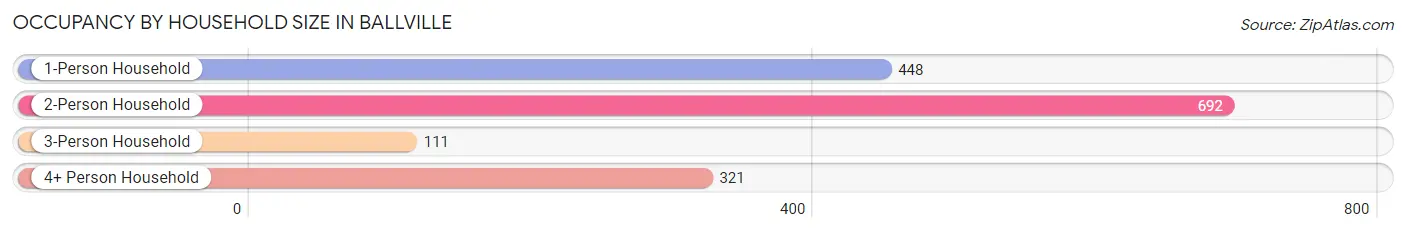
| Household Size | # Housing Units | % Housing Units |
| 1-Person Household | 448 | 28.5% |
| 2-Person Household | 692 | 44.0% |
| 3-Person Household | 111 | 7.1% |
| 4+ Person Household | 321 | 20.4% |
| Total Housing Units | 1,572 | 100.0% |
Occupancy by Ownership by Household Size in Ballville
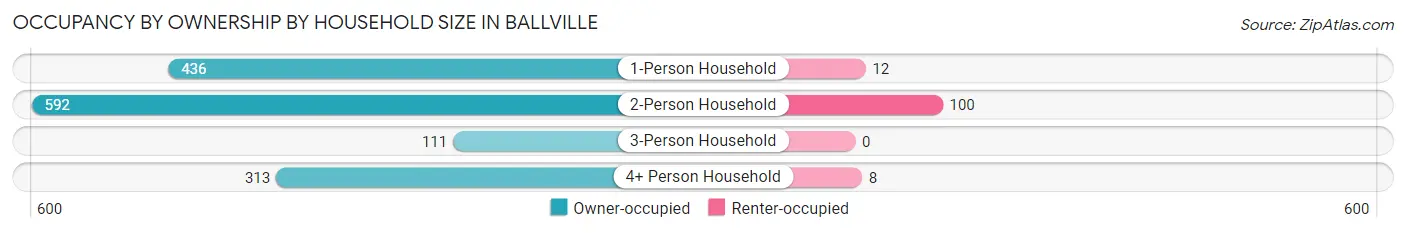
| Household Size | Owner-occupied | Renter-occupied |
| 1-Person Household | 436 (97.3%) | 12 (2.7%) |
| 2-Person Household | 592 (85.6%) | 100 (14.4%) |
| 3-Person Household | 111 (100.0%) | 0 (0.0%) |
| 4+ Person Household | 313 (97.5%) | 8 (2.5%) |
| Total Housing Units | 1,452 (92.4%) | 120 (7.6%) |
Occupancy by Educational Attainment in Ballville
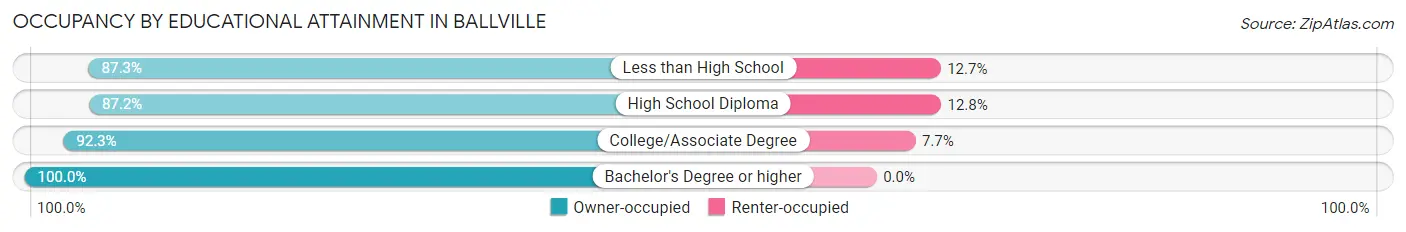
| Household Size | Owner-occupied | Renter-occupied |
| Less than High School | 55 (87.3%) | 8 (12.7%) |
| High School Diploma | 465 (87.2%) | 68 (12.8%) |
| College/Associate Degree | 528 (92.3%) | 44 (7.7%) |
| Bachelor's Degree or higher | 404 (100.0%) | 0 (0.0%) |
Occupancy by Age of Householder in Ballville
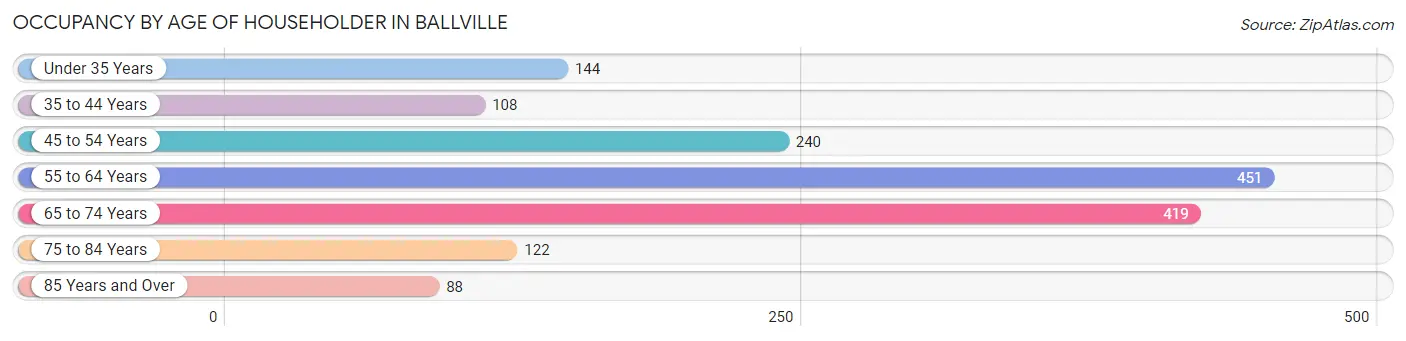
| Age Bracket | # Households | % Households |
| Under 35 Years | 144 | 9.2% |
| 35 to 44 Years | 108 | 6.9% |
| 45 to 54 Years | 240 | 15.3% |
| 55 to 64 Years | 451 | 28.7% |
| 65 to 74 Years | 419 | 26.7% |
| 75 to 84 Years | 122 | 7.8% |
| 85 Years and Over | 88 | 5.6% |
| Total | 1,572 | 100.0% |
Housing Finances in Ballville
Median Income by Occupancy in Ballville
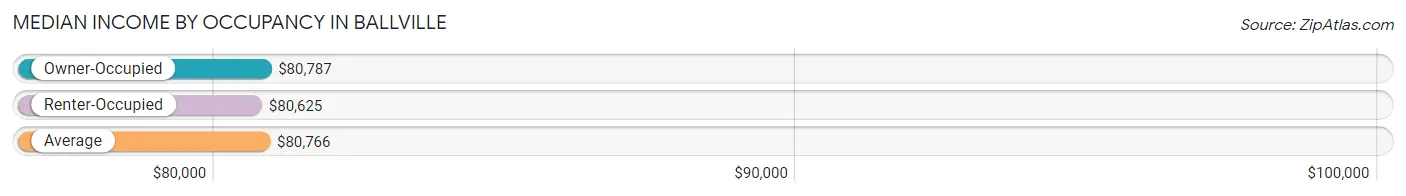
| Occupancy Type | # Households | Median Income |
| Owner-Occupied | 1,452 (92.4%) | $80,787 |
| Renter-Occupied | 120 (7.6%) | $80,625 |
| Average | 1,572 (100.0%) | $80,766 |
Occupancy by Householder Income Bracket in Ballville
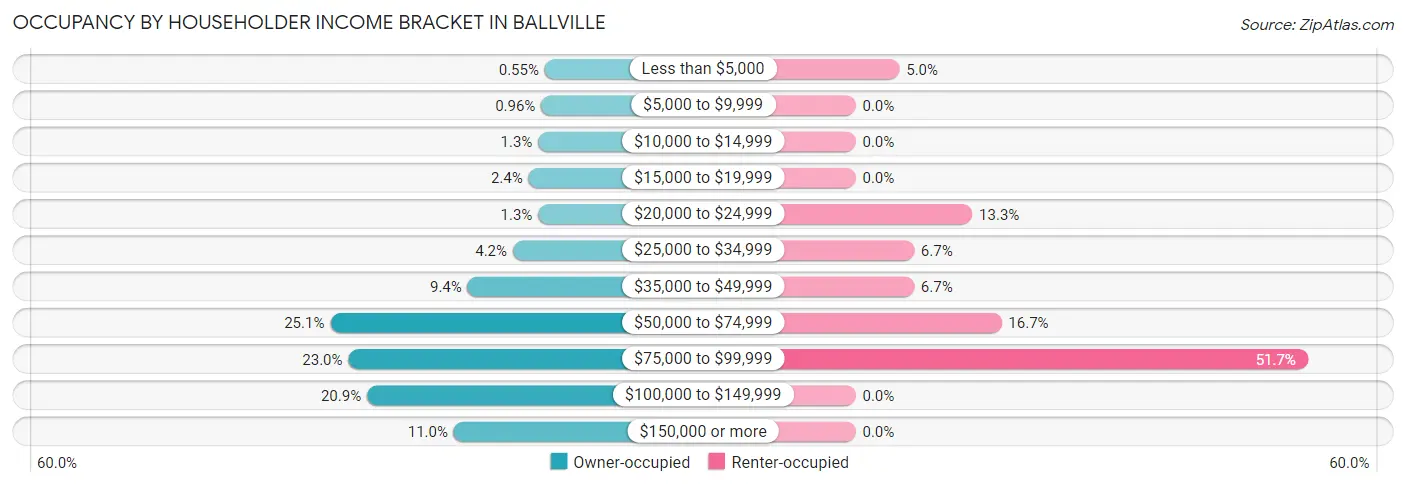
| Income Bracket | Owner-occupied | Renter-occupied |
| Less than $5,000 | 8 (0.5%) | 6 (5.0%) |
| $5,000 to $9,999 | 14 (1.0%) | 0 (0.0%) |
| $10,000 to $14,999 | 19 (1.3%) | 0 (0.0%) |
| $15,000 to $19,999 | 35 (2.4%) | 0 (0.0%) |
| $20,000 to $24,999 | 19 (1.3%) | 16 (13.3%) |
| $25,000 to $34,999 | 61 (4.2%) | 8 (6.7%) |
| $35,000 to $49,999 | 136 (9.4%) | 8 (6.7%) |
| $50,000 to $74,999 | 364 (25.1%) | 20 (16.7%) |
| $75,000 to $99,999 | 334 (23.0%) | 62 (51.7%) |
| $100,000 to $149,999 | 303 (20.9%) | 0 (0.0%) |
| $150,000 or more | 159 (11.0%) | 0 (0.0%) |
| Total | 1,452 (100.0%) | 120 (100.0%) |
Monthly Housing Cost Tiers in Ballville
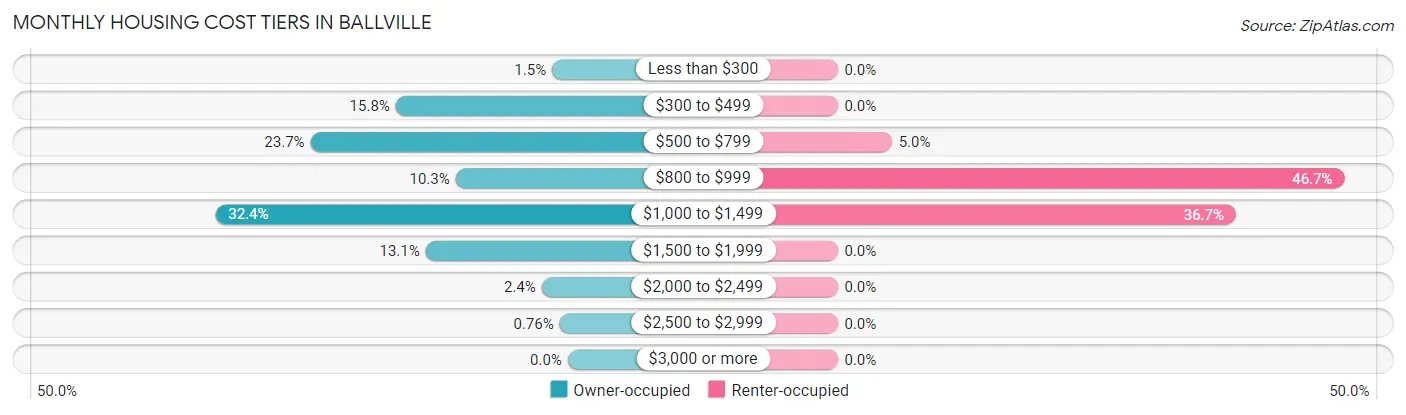
| Monthly Cost | Owner-occupied | Renter-occupied |
| Less than $300 | 21 (1.5%) | 0 (0.0%) |
| $300 to $499 | 230 (15.8%) | 0 (0.0%) |
| $500 to $799 | 344 (23.7%) | 6 (5.0%) |
| $800 to $999 | 150 (10.3%) | 56 (46.7%) |
| $1,000 to $1,499 | 471 (32.4%) | 44 (36.7%) |
| $1,500 to $1,999 | 190 (13.1%) | 0 (0.0%) |
| $2,000 to $2,499 | 35 (2.4%) | 0 (0.0%) |
| $2,500 to $2,999 | 11 (0.8%) | 0 (0.0%) |
| $3,000 or more | 0 (0.0%) | 0 (0.0%) |
| Total | 1,452 (100.0%) | 120 (100.0%) |
Physical Housing Characteristics in Ballville
Housing Structures in Ballville
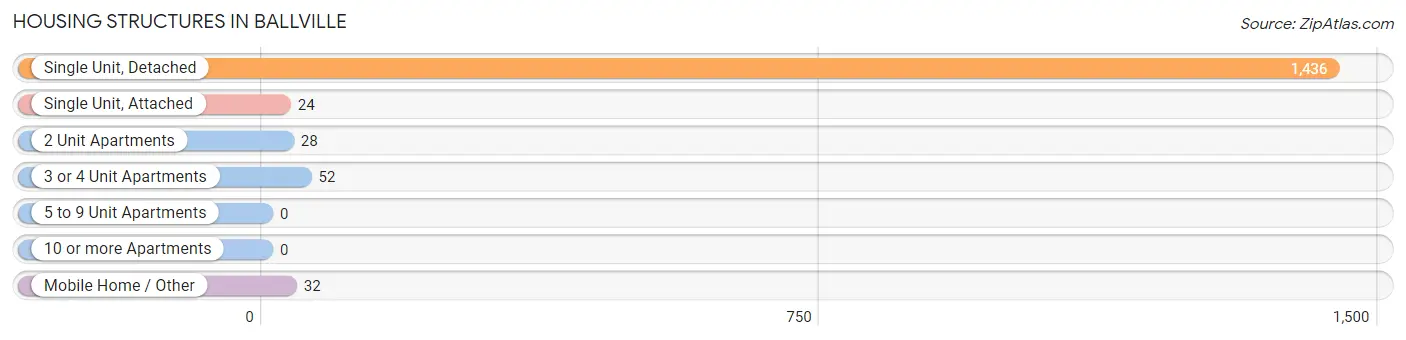
| Structure Type | # Housing Units | % Housing Units |
| Single Unit, Detached | 1,436 | 91.3% |
| Single Unit, Attached | 24 | 1.5% |
| 2 Unit Apartments | 28 | 1.8% |
| 3 or 4 Unit Apartments | 52 | 3.3% |
| 5 to 9 Unit Apartments | 0 | 0.0% |
| 10 or more Apartments | 0 | 0.0% |
| Mobile Home / Other | 32 | 2.0% |
| Total | 1,572 | 100.0% |
Housing Structures by Occupancy in Ballville
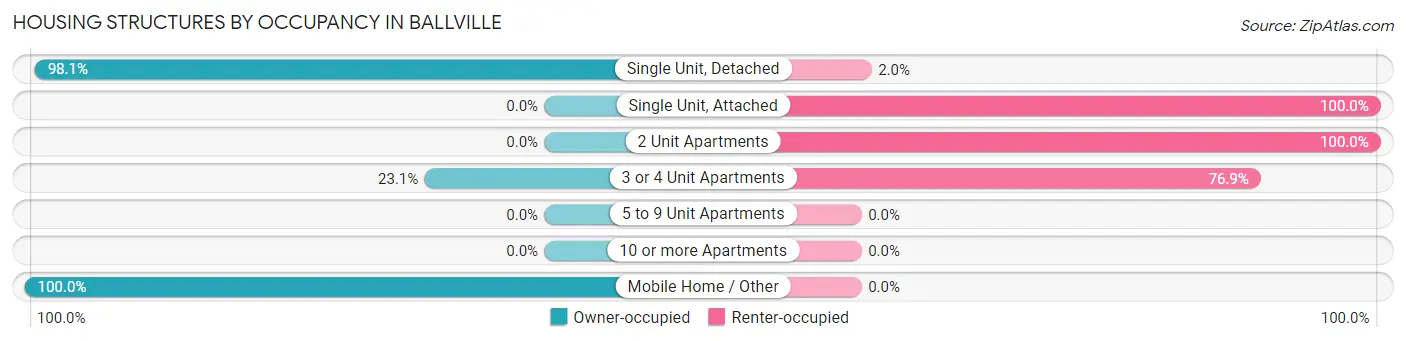
| Structure Type | Owner-occupied | Renter-occupied |
| Single Unit, Detached | 1,408 (98.1%) | 28 (1.9%) |
| Single Unit, Attached | 0 (0.0%) | 24 (100.0%) |
| 2 Unit Apartments | 0 (0.0%) | 28 (100.0%) |
| 3 or 4 Unit Apartments | 12 (23.1%) | 40 (76.9%) |
| 5 to 9 Unit Apartments | 0 (0.0%) | 0 (0.0%) |
| 10 or more Apartments | 0 (0.0%) | 0 (0.0%) |
| Mobile Home / Other | 32 (100.0%) | 0 (0.0%) |
| Total | 1,452 (92.4%) | 120 (7.6%) |
Housing Structures by Number of Rooms in Ballville
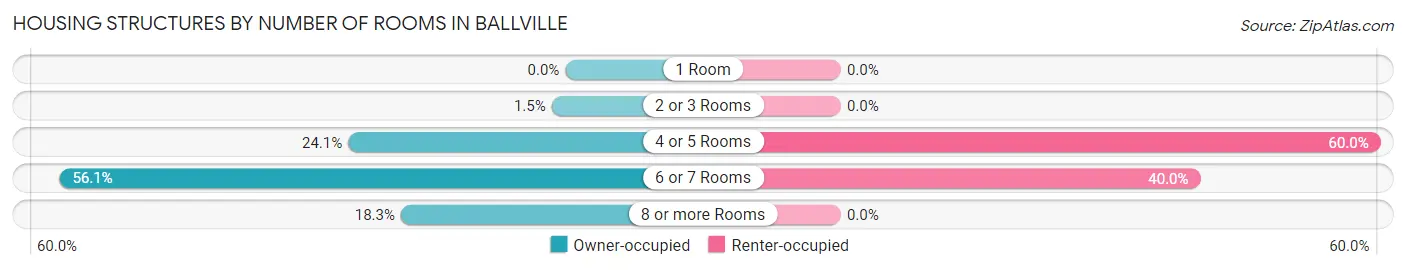
| Number of Rooms | Owner-occupied | Renter-occupied |
| 1 Room | 0 (0.0%) | 0 (0.0%) |
| 2 or 3 Rooms | 22 (1.5%) | 0 (0.0%) |
| 4 or 5 Rooms | 350 (24.1%) | 72 (60.0%) |
| 6 or 7 Rooms | 815 (56.1%) | 48 (40.0%) |
| 8 or more Rooms | 265 (18.2%) | 0 (0.0%) |
| Total | 1,452 (100.0%) | 120 (100.0%) |
Housing Structure by Heating Type in Ballville
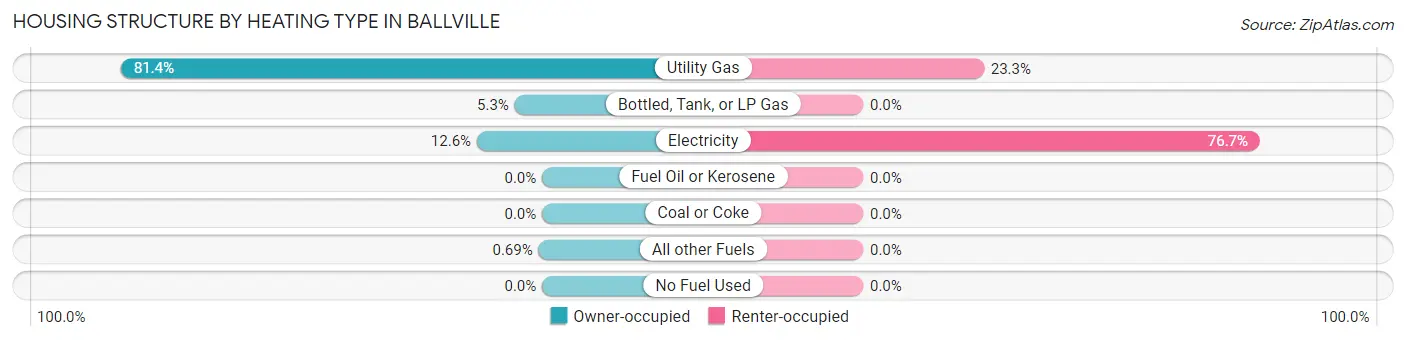
| Heating Type | Owner-occupied | Renter-occupied |
| Utility Gas | 1,182 (81.4%) | 28 (23.3%) |
| Bottled, Tank, or LP Gas | 77 (5.3%) | 0 (0.0%) |
| Electricity | 183 (12.6%) | 92 (76.7%) |
| Fuel Oil or Kerosene | 0 (0.0%) | 0 (0.0%) |
| Coal or Coke | 0 (0.0%) | 0 (0.0%) |
| All other Fuels | 10 (0.7%) | 0 (0.0%) |
| No Fuel Used | 0 (0.0%) | 0 (0.0%) |
| Total | 1,452 (100.0%) | 120 (100.0%) |
Household Vehicle Usage in Ballville
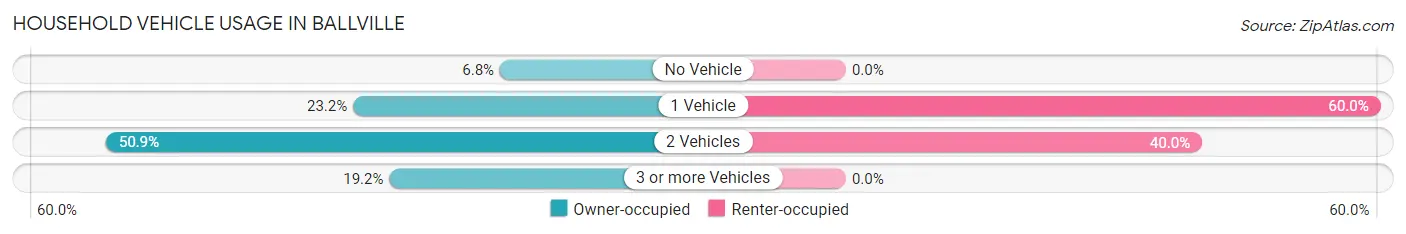
| Vehicles per Household | Owner-occupied | Renter-occupied |
| No Vehicle | 98 (6.8%) | 0 (0.0%) |
| 1 Vehicle | 337 (23.2%) | 72 (60.0%) |
| 2 Vehicles | 739 (50.9%) | 48 (40.0%) |
| 3 or more Vehicles | 278 (19.2%) | 0 (0.0%) |
| Total | 1,452 (100.0%) | 120 (100.0%) |
Real Estate & Mortgages in Ballville
Real Estate and Mortgage Overview in Ballville
| Characteristic | Without Mortgage | With Mortgage |
| Housing Units | 550 | 902 |
| Median Property Value | $179,900 | $159,200 |
| Median Household Income | $65,833 | $98 |
| Monthly Housing Costs | $575 | $0 |
| Real Estate Taxes | $2,195 | $65 |
Property Value by Mortgage Status in Ballville
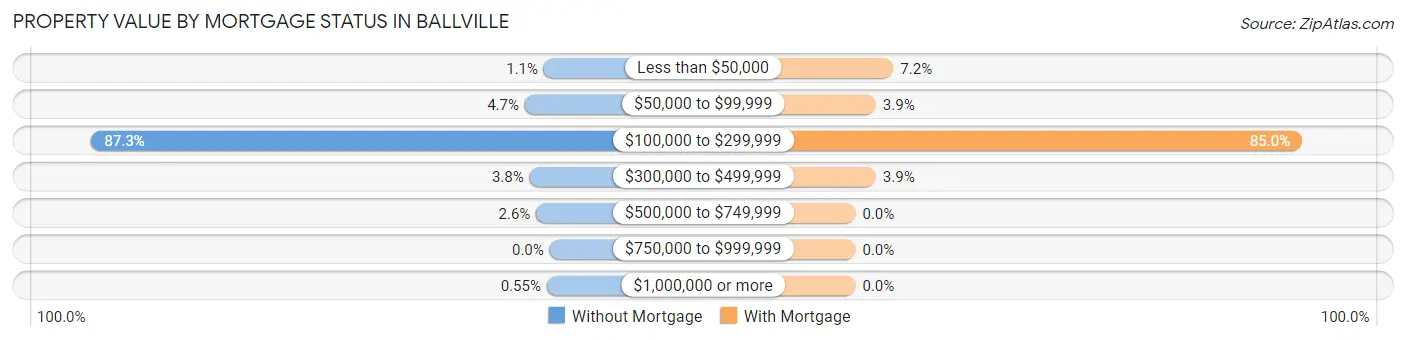
| Property Value | Without Mortgage | With Mortgage |
| Less than $50,000 | 6 (1.1%) | 65 (7.2%) |
| $50,000 to $99,999 | 26 (4.7%) | 35 (3.9%) |
| $100,000 to $299,999 | 480 (87.3%) | 767 (85.0%) |
| $300,000 to $499,999 | 21 (3.8%) | 35 (3.9%) |
| $500,000 to $749,999 | 14 (2.5%) | 0 (0.0%) |
| $750,000 to $999,999 | 0 (0.0%) | 0 (0.0%) |
| $1,000,000 or more | 3 (0.5%) | 0 (0.0%) |
| Total | 550 (100.0%) | 902 (100.0%) |
Household Income by Mortgage Status in Ballville
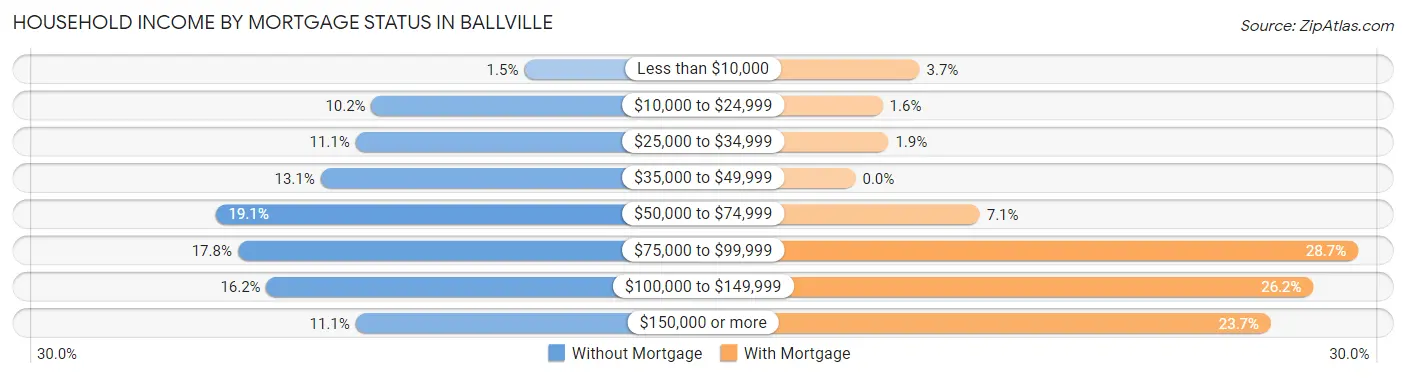
| Household Income | Without Mortgage | With Mortgage |
| Less than $10,000 | 8 (1.5%) | 33 (3.7%) |
| $10,000 to $24,999 | 56 (10.2%) | 14 (1.5%) |
| $25,000 to $34,999 | 61 (11.1%) | 17 (1.9%) |
| $35,000 to $49,999 | 72 (13.1%) | 0 (0.0%) |
| $50,000 to $74,999 | 105 (19.1%) | 64 (7.1%) |
| $75,000 to $99,999 | 98 (17.8%) | 259 (28.7%) |
| $100,000 to $149,999 | 89 (16.2%) | 236 (26.2%) |
| $150,000 or more | 61 (11.1%) | 214 (23.7%) |
| Total | 550 (100.0%) | 902 (100.0%) |
Property Value to Household Income Ratio in Ballville
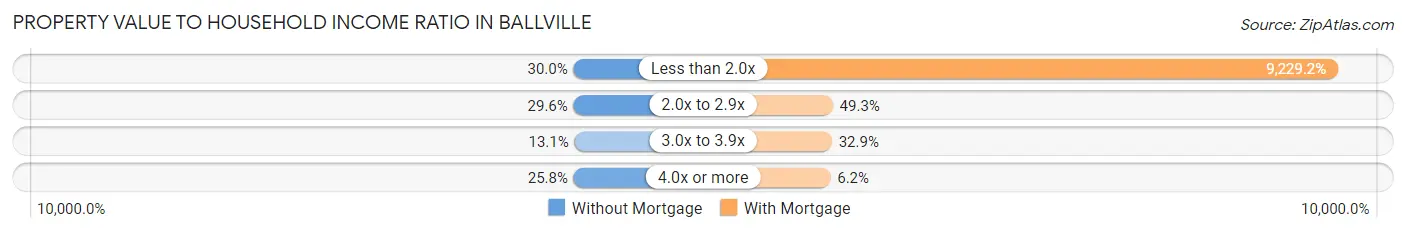
| Value-to-Income Ratio | Without Mortgage | With Mortgage |
| Less than 2.0x | 165 (30.0%) | 83,247 (9,229.2%) |
| 2.0x to 2.9x | 163 (29.6%) | 445 (49.3%) |
| 3.0x to 3.9x | 72 (13.1%) | 297 (32.9%) |
| 4.0x or more | 142 (25.8%) | 56 (6.2%) |
| Total | 550 (100.0%) | 902 (100.0%) |
Real Estate Taxes by Mortgage Status in Ballville
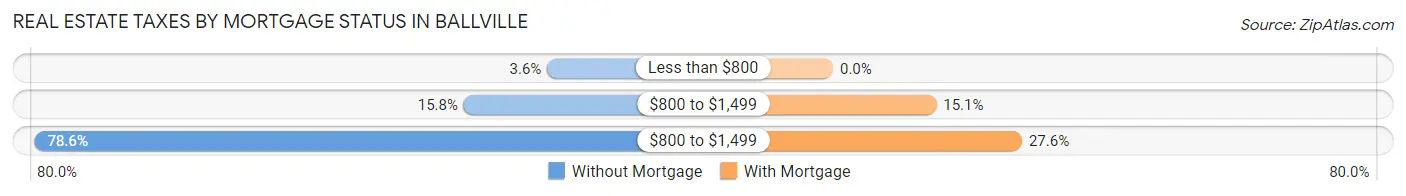
| Property Taxes | Without Mortgage | With Mortgage |
| Less than $800 | 20 (3.6%) | 0 (0.0%) |
| $800 to $1,499 | 87 (15.8%) | 136 (15.1%) |
| $800 to $1,499 | 432 (78.5%) | 249 (27.6%) |
| Total | 550 (100.0%) | 902 (100.0%) |
Health & Disability in Ballville
Health Insurance Coverage by Age in Ballville
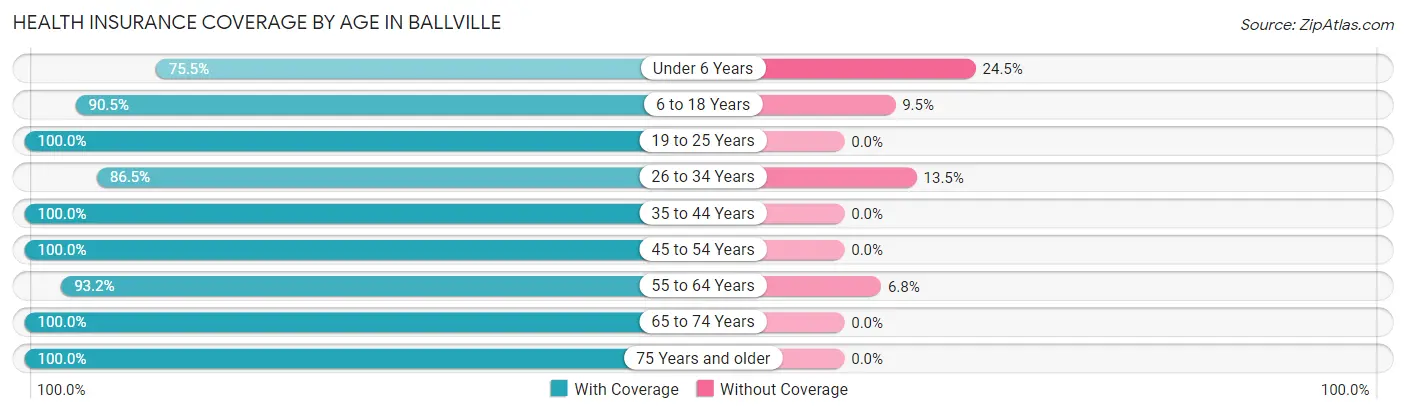
| Age Bracket | With Coverage | Without Coverage |
| Under 6 Years | 148 (75.5%) | 48 (24.5%) |
| 6 to 18 Years | 457 (90.5%) | 48 (9.5%) |
| 19 to 25 Years | 150 (100.0%) | 0 (0.0%) |
| 26 to 34 Years | 321 (86.5%) | 50 (13.5%) |
| 35 to 44 Years | 276 (100.0%) | 0 (0.0%) |
| 45 to 54 Years | 447 (100.0%) | 0 (0.0%) |
| 55 to 64 Years | 667 (93.2%) | 49 (6.8%) |
| 65 to 74 Years | 596 (100.0%) | 0 (0.0%) |
| 75 Years and older | 378 (100.0%) | 0 (0.0%) |
| Total | 3,440 (94.6%) | 195 (5.4%) |
Health Insurance Coverage by Citizenship Status in Ballville
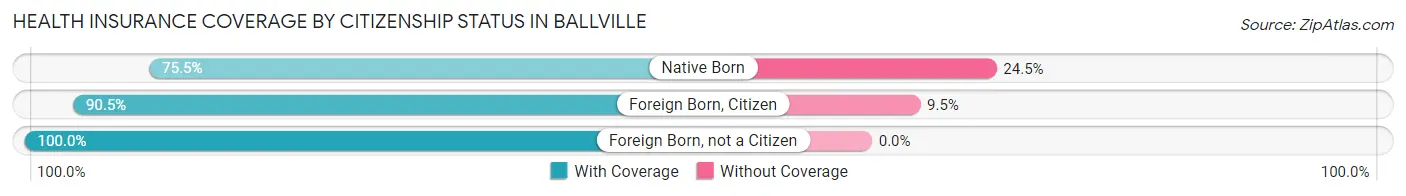
| Citizenship Status | With Coverage | Without Coverage |
| Native Born | 148 (75.5%) | 48 (24.5%) |
| Foreign Born, Citizen | 457 (90.5%) | 48 (9.5%) |
| Foreign Born, not a Citizen | 150 (100.0%) | 0 (0.0%) |
Health Insurance Coverage by Household Income in Ballville
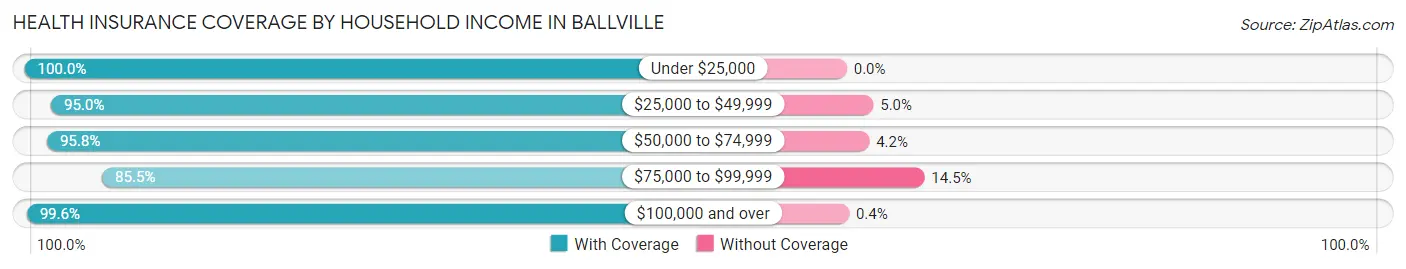
| Household Income | With Coverage | Without Coverage |
| Under $25,000 | 174 (100.0%) | 0 (0.0%) |
| $25,000 to $49,999 | 268 (95.0%) | 14 (5.0%) |
| $50,000 to $74,999 | 661 (95.8%) | 29 (4.2%) |
| $75,000 to $99,999 | 858 (85.5%) | 146 (14.5%) |
| $100,000 and over | 1,479 (99.6%) | 6 (0.4%) |
Public vs Private Health Insurance Coverage by Age in Ballville
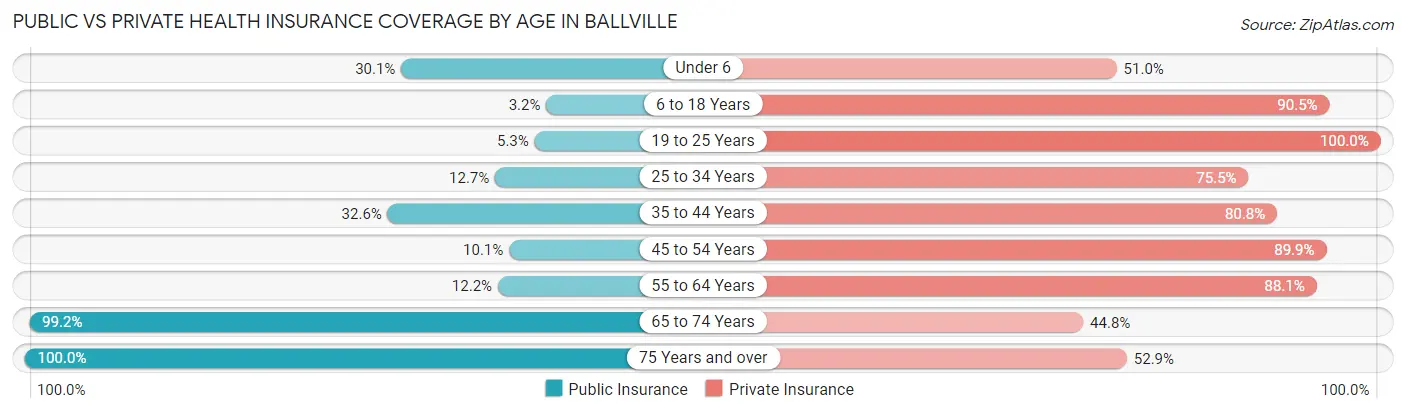
| Age Bracket | Public Insurance | Private Insurance |
| Under 6 | 59 (30.1%) | 100 (51.0%) |
| 6 to 18 Years | 16 (3.2%) | 457 (90.5%) |
| 19 to 25 Years | 8 (5.3%) | 150 (100.0%) |
| 25 to 34 Years | 47 (12.7%) | 280 (75.5%) |
| 35 to 44 Years | 90 (32.6%) | 223 (80.8%) |
| 45 to 54 Years | 45 (10.1%) | 402 (89.9%) |
| 55 to 64 Years | 87 (12.1%) | 631 (88.1%) |
| 65 to 74 Years | 591 (99.2%) | 267 (44.8%) |
| 75 Years and over | 378 (100.0%) | 200 (52.9%) |
| Total | 1,321 (36.3%) | 2,710 (74.6%) |
Disability Status by Sex by Age in Ballville
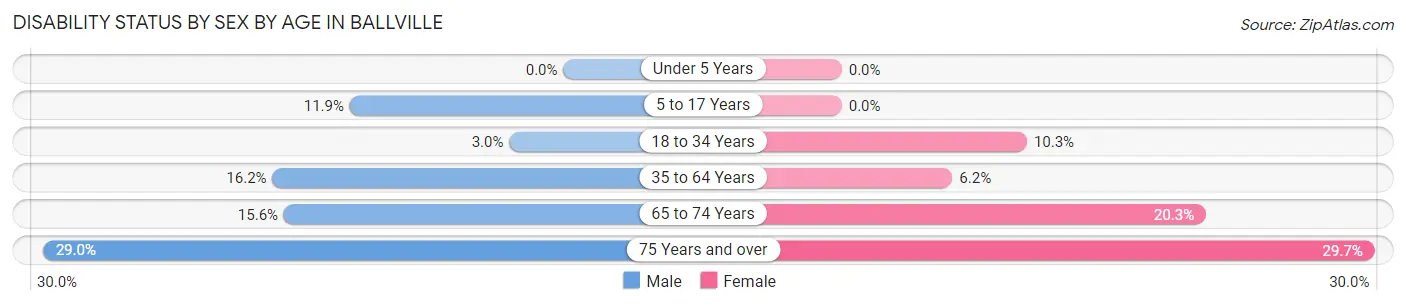
| Age Bracket | Male | Female |
| Under 5 Years | 0 (0.0%) | 0 (0.0%) |
| 5 to 17 Years | 27 (11.9%) | 0 (0.0%) |
| 18 to 34 Years | 8 (3.0%) | 27 (10.3%) |
| 35 to 64 Years | 128 (16.2%) | 40 (6.2%) |
| 65 to 74 Years | 49 (15.6%) | 57 (20.3%) |
| 75 Years and over | 49 (29.0%) | 62 (29.7%) |
Disability Class by Sex by Age in Ballville
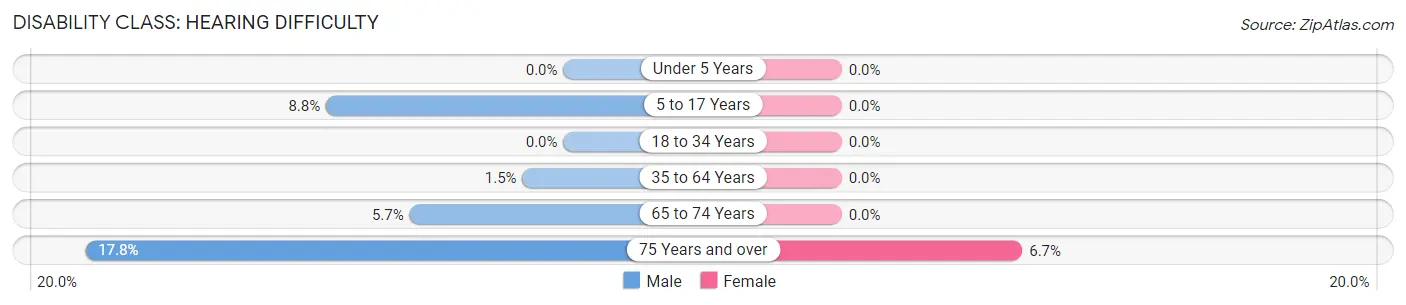
Disability Class: Hearing Difficulty
| Age Bracket | Male | Female |
| Under 5 Years | 0 (0.0%) | 0 (0.0%) |
| 5 to 17 Years | 20 (8.8%) | 0 (0.0%) |
| 18 to 34 Years | 0 (0.0%) | 0 (0.0%) |
| 35 to 64 Years | 12 (1.5%) | 0 (0.0%) |
| 65 to 74 Years | 18 (5.7%) | 0 (0.0%) |
| 75 Years and over | 30 (17.7%) | 14 (6.7%) |
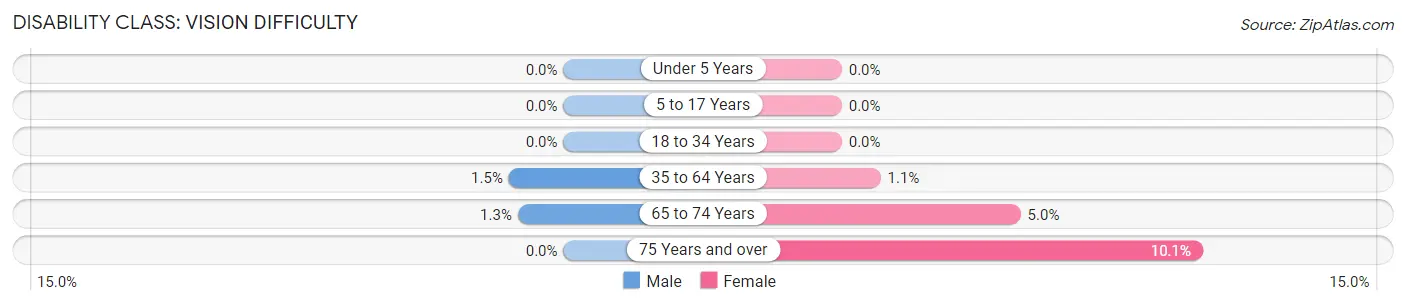
Disability Class: Vision Difficulty
| Age Bracket | Male | Female |
| Under 5 Years | 0 (0.0%) | 0 (0.0%) |
| 5 to 17 Years | 0 (0.0%) | 0 (0.0%) |
| 18 to 34 Years | 0 (0.0%) | 0 (0.0%) |
| 35 to 64 Years | 12 (1.5%) | 7 (1.1%) |
| 65 to 74 Years | 4 (1.3%) | 14 (5.0%) |
| 75 Years and over | 0 (0.0%) | 21 (10.1%) |
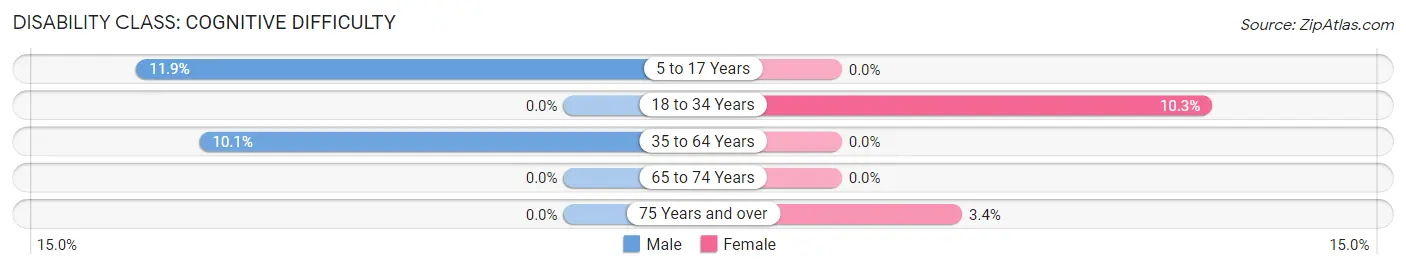
Disability Class: Cognitive Difficulty
| Age Bracket | Male | Female |
| 5 to 17 Years | 27 (11.9%) | 0 (0.0%) |
| 18 to 34 Years | 0 (0.0%) | 27 (10.3%) |
| 35 to 64 Years | 80 (10.1%) | 0 (0.0%) |
| 65 to 74 Years | 0 (0.0%) | 0 (0.0%) |
| 75 Years and over | 0 (0.0%) | 7 (3.4%) |
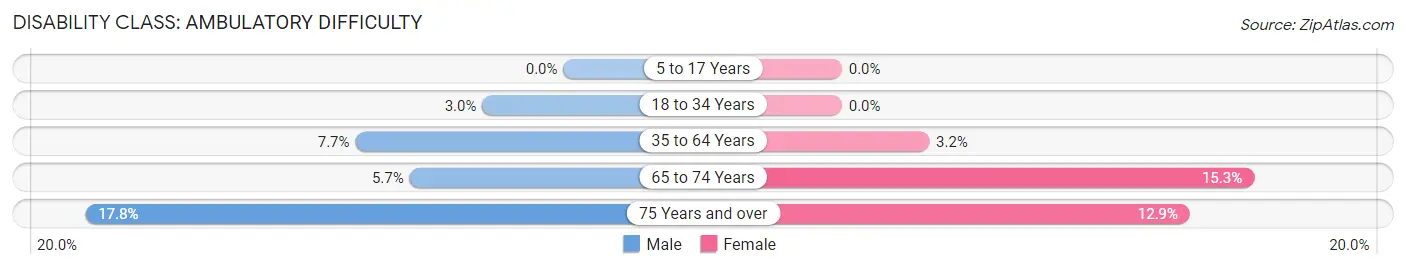
Disability Class: Ambulatory Difficulty
| Age Bracket | Male | Female |
| 5 to 17 Years | 0 (0.0%) | 0 (0.0%) |
| 18 to 34 Years | 8 (3.0%) | 0 (0.0%) |
| 35 to 64 Years | 61 (7.7%) | 21 (3.2%) |
| 65 to 74 Years | 18 (5.7%) | 43 (15.3%) |
| 75 Years and over | 30 (17.7%) | 27 (12.9%) |
Disability Class: Self-Care Difficulty
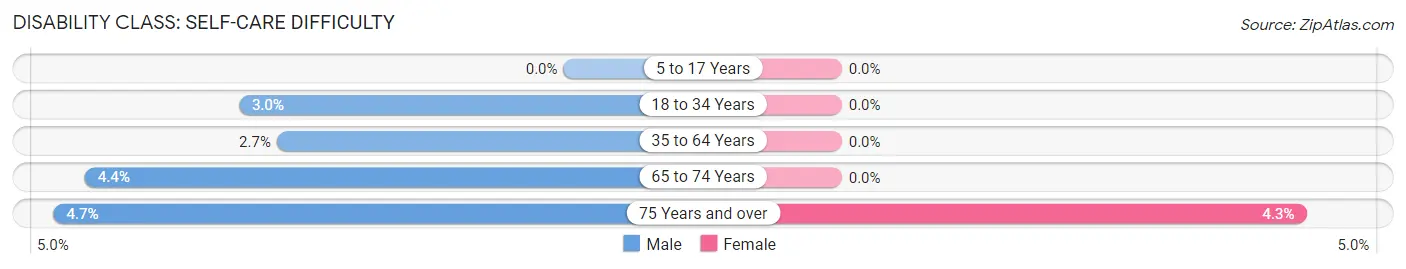
| Age Bracket | Male | Female |
| 5 to 17 Years | 0 (0.0%) | 0 (0.0%) |
| 18 to 34 Years | 8 (3.0%) | 0 (0.0%) |
| 35 to 64 Years | 21 (2.7%) | 0 (0.0%) |
| 65 to 74 Years | 14 (4.4%) | 0 (0.0%) |
| 75 Years and over | 8 (4.7%) | 9 (4.3%) |
Technology Access in Ballville
Computing Device Access in Ballville
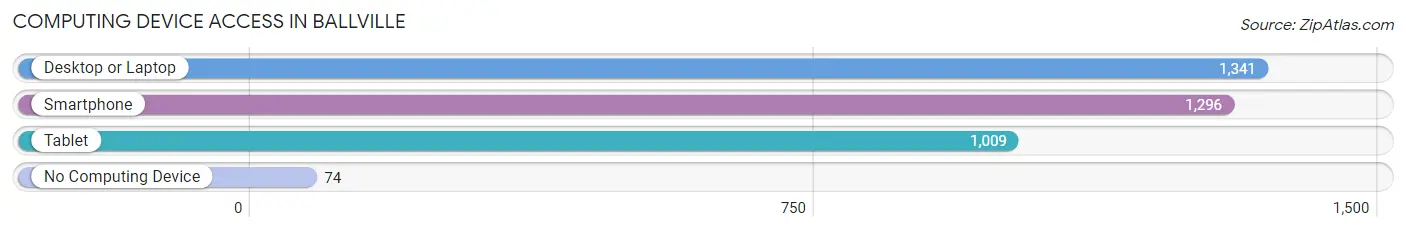
| Device Type | # Households | % Households |
| Desktop or Laptop | 1,341 | 85.3% |
| Smartphone | 1,296 | 82.4% |
| Tablet | 1,009 | 64.2% |
| No Computing Device | 74 | 4.7% |
| Total | 1,572 | 100.0% |
Internet Access in Ballville
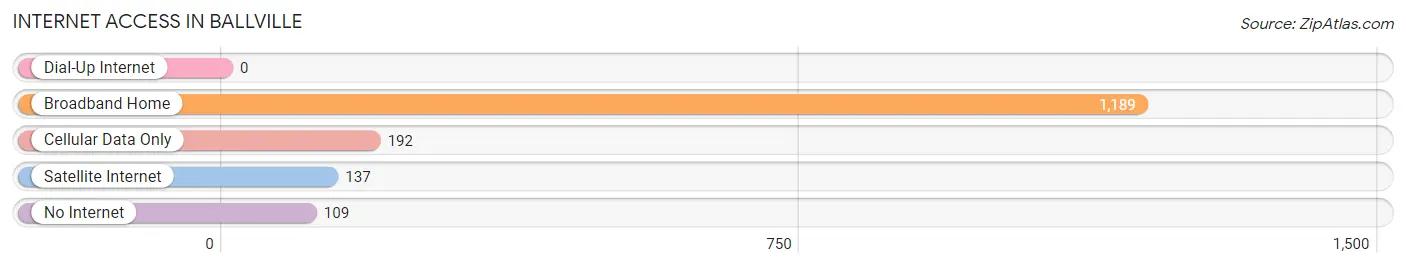
| Internet Type | # Households | % Households |
| Dial-Up Internet | 0 | 0.0% |
| Broadband Home | 1,189 | 75.6% |
| Cellular Data Only | 192 | 12.2% |
| Satellite Internet | 137 | 8.7% |
| No Internet | 109 | 6.9% |
| Total | 1,572 | 100.0% |
Ballville Summary
Ballville, Ohio is a small village located in Sandusky County, Ohio. It is situated on the Sandusky River, approximately 10 miles south of Fremont. The village was founded in 1837 and was named after the Ball family, who were early settlers in the area.
Geography
Ballville is located at 41°20'N, 83°2'W (41.33, -83.03). It is situated on the Sandusky River, approximately 10 miles south of Fremont. The village has a total area of 0.6 square miles, all of which is land.
Demographics
As of the 2010 census, Ballville had a population of 1,717. The racial makeup of the village was 97.2% White, 0.7% African American, 0.2% Native American, 0.3% Asian, 0.1% from other races, and 1.5% from two or more races. Hispanic or Latino of any race were 0.7% of the population.
Economy
Ballville’s economy is largely based on agriculture and manufacturing. The village is home to several small businesses, including a grocery store, a hardware store, and a few restaurants. The village also has a few small industrial parks, which provide employment for many of the residents.
History
Ballville was founded in 1837 by the Ball family, who were early settlers in the area. The village was originally known as Ball’s Landing, and was later renamed Ballville. The village was incorporated in 1867.
In the late 19th century, Ballville was a thriving community, with a population of over 1,000. The village was home to several businesses, including a flour mill, a sawmill, a grist mill, and a brickyard. The village also had a post office, a bank, and a newspaper.
In the early 20th century, Ballville’s economy began to decline. The village’s population decreased, and many of the businesses closed. In the 1950s, the village was revitalized with the construction of a new bridge over the Sandusky River. The bridge allowed for increased access to the village, and the population began to grow again.
Today, Ballville is a small, rural village with a population of just over 1,700. The village is home to several small businesses, and is a popular destination for outdoor recreation. The village is also home to a few historic sites, including the Ballville Dam and the Ballville Cemetery.
Common Questions
What is the Total Population of Ballville?
Total Population of Ballville is 3,635.
What is the Total Male Population of Ballville?
Total Male Population of Ballville is 1,832.
What is the Total Female Population of Ballville?
Total Female Population of Ballville is 1,803.
What is the Ratio of Males per 100 Females in Ballville?
There are 101.61 Males per 100 Females in Ballville.
What is the Ratio of Females per 100 Males in Ballville?
There are 98.42 Females per 100 Males in Ballville.
What is the Median Population Age in Ballville?
Median Population Age in Ballville is 51.5 Years.
What is the Average Family Size in Ballville
Average Family Size in Ballville is 2.8 People.
What is the Average Household Size in Ballville
Average Household Size in Ballville is 2.3 People.
What is Per Capita Income in Ballville?
Per Capita income in Ballville is $38,847.
What is the Median Family Income in Ballville?
Median Family Income in Ballville is $85,878.
What is the Median Household income in Ballville?
Median Household Income in Ballville is $80,766.
What is Income or Wage Gap in Ballville?
Income or Wage Gap in Ballville is 30.8%.
Women in Ballville earn 69.2 cents for every dollar earned by a man.
What is Family Income Deficit in Ballville?
Family Income Deficit in Ballville is $3,948.
Families that are below poverty line in Ballville earn $3,948 less on average than the poverty threshold level.
What is Inequality or Gini Index in Ballville?
Inequality or Gini Index in Ballville is 0.32.
How Large is the Labor Force in Ballville?
There are 1,830 People in the Labor Forcein in Ballville.
What is the Percentage of People in the Labor Force in Ballville?
61.2% of People are in the Labor Force in Ballville.
What is the Unemployment Rate in Ballville?
Unemployment Rate in Ballville is 5.2%.