Rocky Ridge, OH
Rocky Ridge Map
Rocky Ridge Overview
323
TOTAL POPULATION
158
MALE POPULATION
165
FEMALE POPULATION
95.76
MALES / 100 FEMALES
104.43
FEMALES / 100 MALES
38.1
MEDIAN AGE
2.7
AVG FAMILY SIZE
2.3
AVG HOUSEHOLD SIZE
$29,217
PER CAPITA INCOME
$49,583
AVG FAMILY INCOME
$66,563
AVG HOUSEHOLD INCOME
19.1%
WAGE / INCOME GAP [ % ]
80.9¢/ $1
WAGE / INCOME GAP [ $ ]
0.34
INEQUALITY / GINI INDEX
187
LABOR FORCE [ PEOPLE ]
64.5%
PERCENT IN LABOR FORCE
7.0%
UNEMPLOYMENT RATE
Rocky Ridge Zip Codes
Rocky Ridge Area Codes
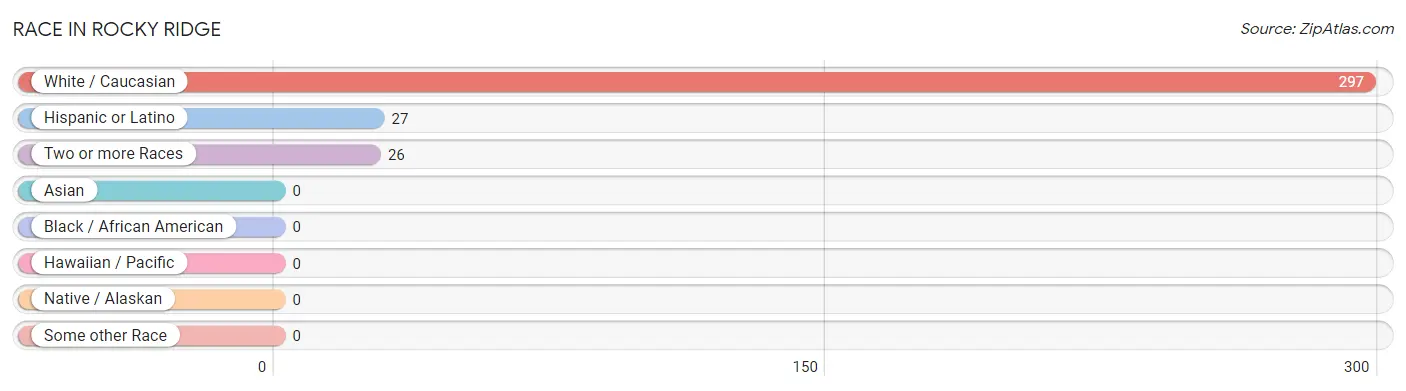
Race in Rocky Ridge
The most populous races in Rocky Ridge are White / Caucasian (297 | 91.9%), Hispanic or Latino (27 | 8.4%), and Two or more Races (26 | 8.1%).
| Race | # Population | % Population |
| Asian | 0 | 0.0% |
| Black / African American | 0 | 0.0% |
| Hawaiian / Pacific | 0 | 0.0% |
| Hispanic or Latino | 27 | 8.4% |
| Native / Alaskan | 0 | 0.0% |
| White / Caucasian | 297 | 91.9% |
| Two or more Races | 26 | 8.1% |
| Some other Race | 0 | 0.0% |
| Total | 323 | 100.0% |
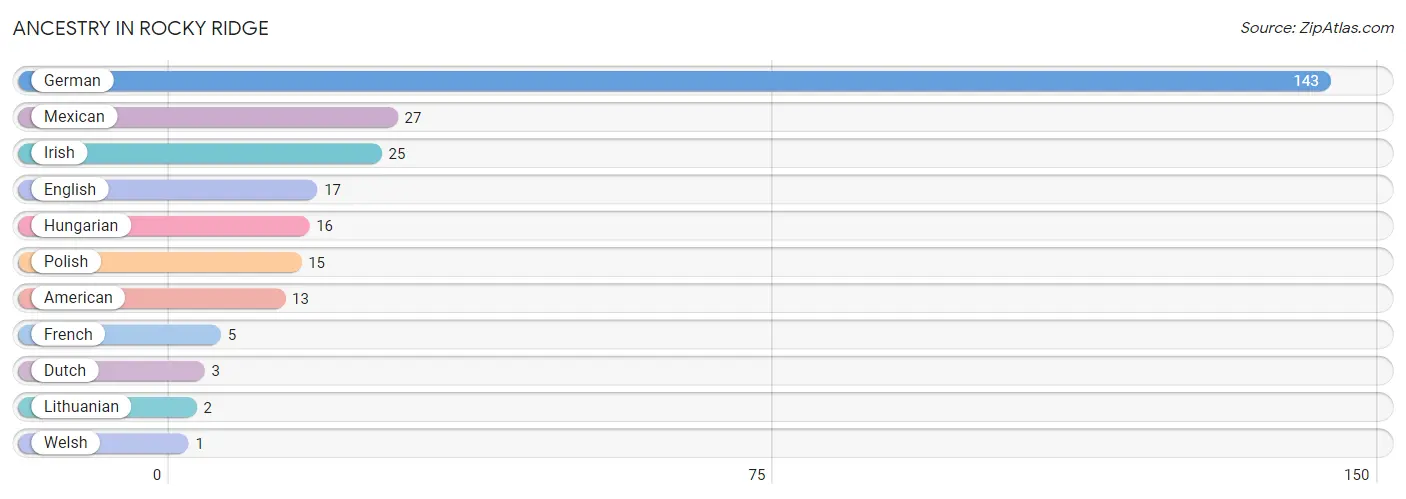
Ancestry in Rocky Ridge
The most populous ancestries reported in Rocky Ridge are German (143 | 44.3%), Mexican (27 | 8.4%), Irish (25 | 7.7%), English (17 | 5.3%), and Hungarian (16 | 5.0%), together accounting for 70.6% of all Rocky Ridge residents.
| Ancestry | # Population | % Population |
| American | 13 | 4.0% |
| Dutch | 3 | 0.9% |
| English | 17 | 5.3% |
| French | 5 | 1.5% |
| German | 143 | 44.3% |
| Hungarian | 16 | 5.0% |
| Irish | 25 | 7.7% |
| Lithuanian | 2 | 0.6% |
| Mexican | 27 | 8.4% |
| Polish | 15 | 4.6% |
| Welsh | 1 | 0.3% | View All 11 Rows |
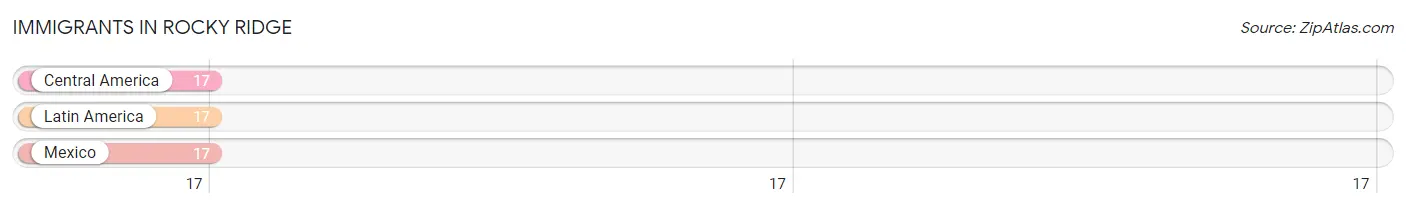
Immigrants in Rocky Ridge
The most numerous immigrant groups reported in Rocky Ridge came from Central America (17 | 5.3%), Latin America (17 | 5.3%), and Mexico (17 | 5.3%), together accounting for 15.8% of all Rocky Ridge residents.
| Immigration Origin | # Population | % Population |
| Central America | 17 | 5.3% |
| Latin America | 17 | 5.3% |
| Mexico | 17 | 5.3% | View All 3 Rows |
Sex and Age in Rocky Ridge
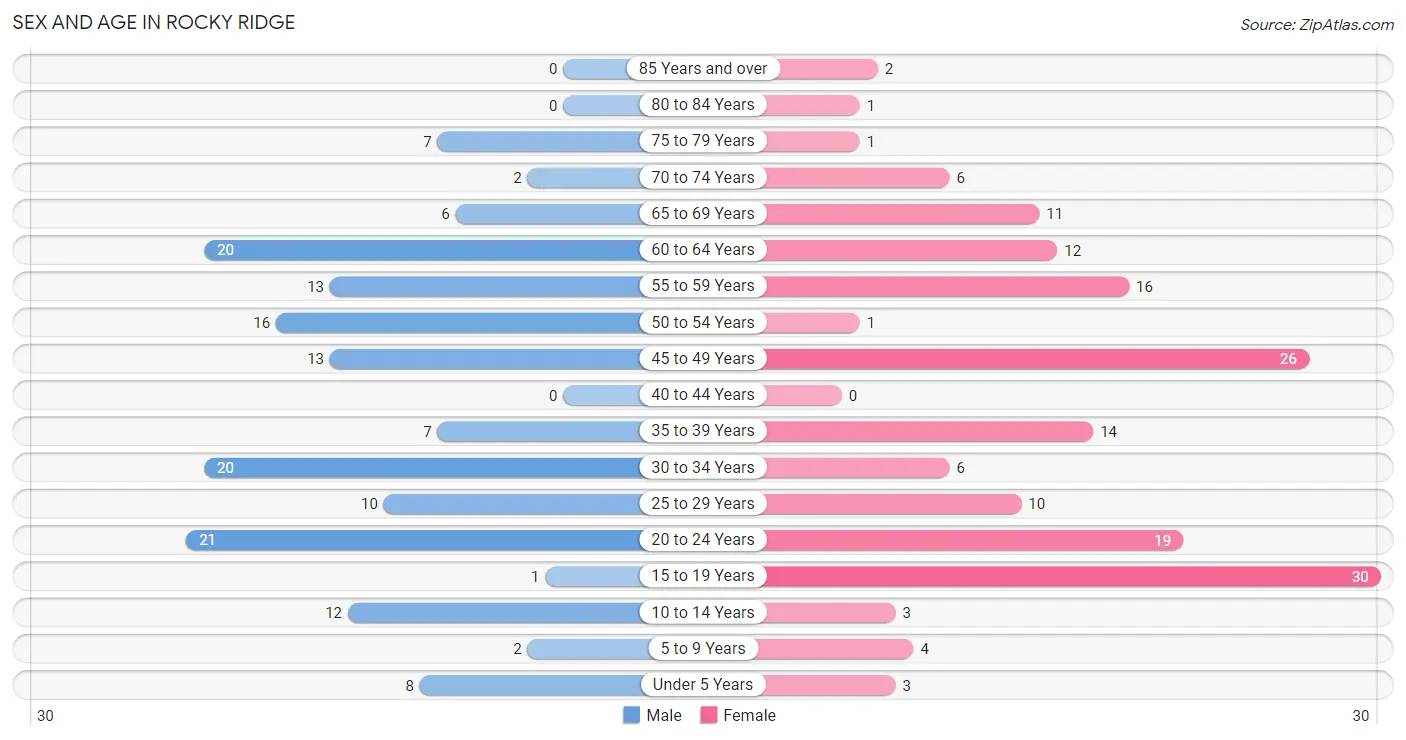
Sex and Age in Rocky Ridge
The most populous age groups in Rocky Ridge are 20 to 24 Years (21 | 13.3%) for men and 15 to 19 Years (30 | 18.2%) for women.
| Age Bracket | Male | Female |
| Under 5 Years | 8 (5.1%) | 3 (1.8%) |
| 5 to 9 Years | 2 (1.3%) | 4 (2.4%) |
| 10 to 14 Years | 12 (7.6%) | 3 (1.8%) |
| 15 to 19 Years | 1 (0.6%) | 30 (18.2%) |
| 20 to 24 Years | 21 (13.3%) | 19 (11.5%) |
| 25 to 29 Years | 10 (6.3%) | 10 (6.1%) |
| 30 to 34 Years | 20 (12.7%) | 6 (3.6%) |
| 35 to 39 Years | 7 (4.4%) | 14 (8.5%) |
| 40 to 44 Years | 0 (0.0%) | 0 (0.0%) |
| 45 to 49 Years | 13 (8.2%) | 26 (15.8%) |
| 50 to 54 Years | 16 (10.1%) | 1 (0.6%) |
| 55 to 59 Years | 13 (8.2%) | 16 (9.7%) |
| 60 to 64 Years | 20 (12.7%) | 12 (7.3%) |
| 65 to 69 Years | 6 (3.8%) | 11 (6.7%) |
| 70 to 74 Years | 2 (1.3%) | 6 (3.6%) |
| 75 to 79 Years | 7 (4.4%) | 1 (0.6%) |
| 80 to 84 Years | 0 (0.0%) | 1 (0.6%) |
| 85 Years and over | 0 (0.0%) | 2 (1.2%) |
| Total | 158 (100.0%) | 165 (100.0%) |
Families and Households in Rocky Ridge
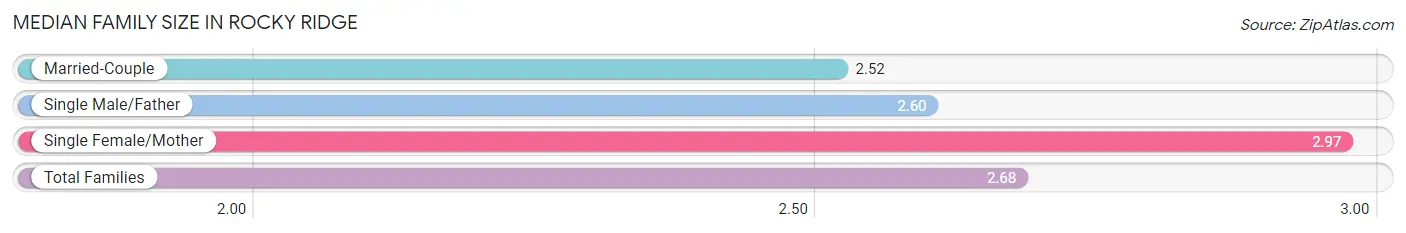
Median Family Size in Rocky Ridge
The median family size in Rocky Ridge is 2.68 persons per family, with single female/mother families (30 | 34.5%) accounting for the largest median family size of 2.97 persons per family. On the other hand, married-couple families (52 | 59.8%) represent the smallest median family size with 2.52 persons per family.
| Family Type | # Families | Family Size |
| Married-Couple | 52 (59.8%) | 2.52 |
| Single Male/Father | 5 (5.8%) | 2.60 |
| Single Female/Mother | 30 (34.5%) | 2.97 |
| Total Families | 87 (100.0%) | 2.68 |
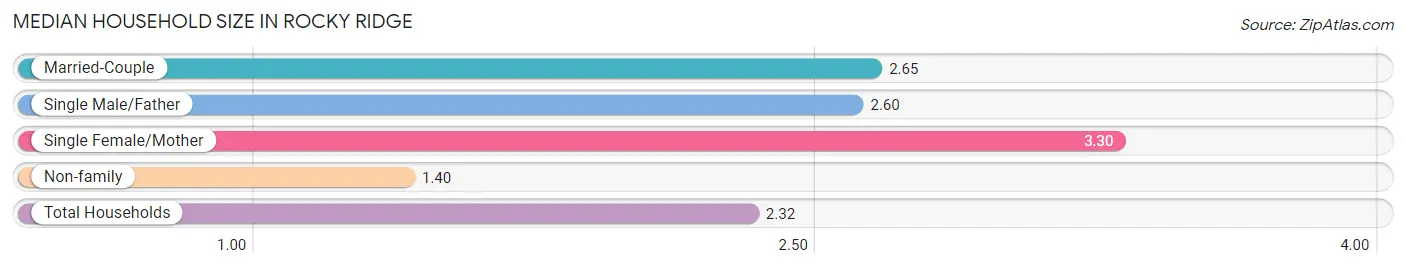
Median Household Size in Rocky Ridge
The median household size in Rocky Ridge is 2.32 persons per household, with single female/mother households (30 | 21.6%) accounting for the largest median household size of 3.3 persons per household. non-family households (52 | 37.4%) represent the smallest median household size with 1.40 persons per household.
| Household Type | # Households | Household Size |
| Married-Couple | 52 (37.4%) | 2.65 |
| Single Male/Father | 5 (3.6%) | 2.60 |
| Single Female/Mother | 30 (21.6%) | 3.30 |
| Non-family | 52 (37.4%) | 1.40 |
| Total Households | 139 (100.0%) | 2.32 |
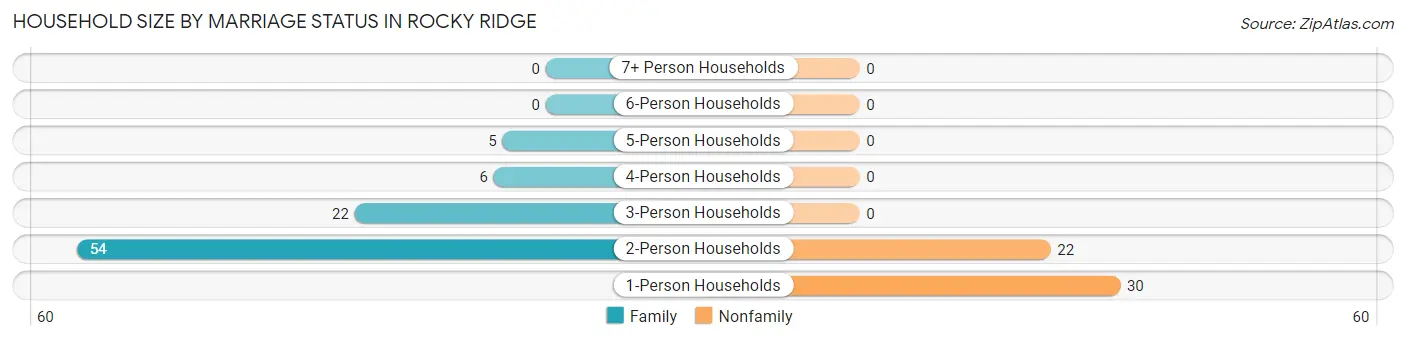
Household Size by Marriage Status in Rocky Ridge
Out of a total of 139 households in Rocky Ridge, 87 (62.6%) are family households, while 52 (37.4%) are nonfamily households. The most numerous type of family households are 2-person households, comprising 54, and the most common type of nonfamily households are 1-person households, comprising 30.
| Household Size | Family Households | Nonfamily Households |
| 1-Person Households | - | 30 (21.6%) |
| 2-Person Households | 54 (38.9%) | 22 (15.8%) |
| 3-Person Households | 22 (15.8%) | 0 (0.0%) |
| 4-Person Households | 6 (4.3%) | 0 (0.0%) |
| 5-Person Households | 5 (3.6%) | 0 (0.0%) |
| 6-Person Households | 0 (0.0%) | 0 (0.0%) |
| 7+ Person Households | 0 (0.0%) | 0 (0.0%) |
| Total | 87 (62.6%) | 52 (37.4%) |
Female Fertility in Rocky Ridge
Fertility by Age in Rocky Ridge
Average fertility rate in Rocky Ridge is 10.0 births per 1,000 women. Women in the age bracket of 20 to 34 years have the highest fertility rate with 29.0 births per 1,000 women. Women in the age bracket of 20 to 34 years acount for 100.0% of all women with births.
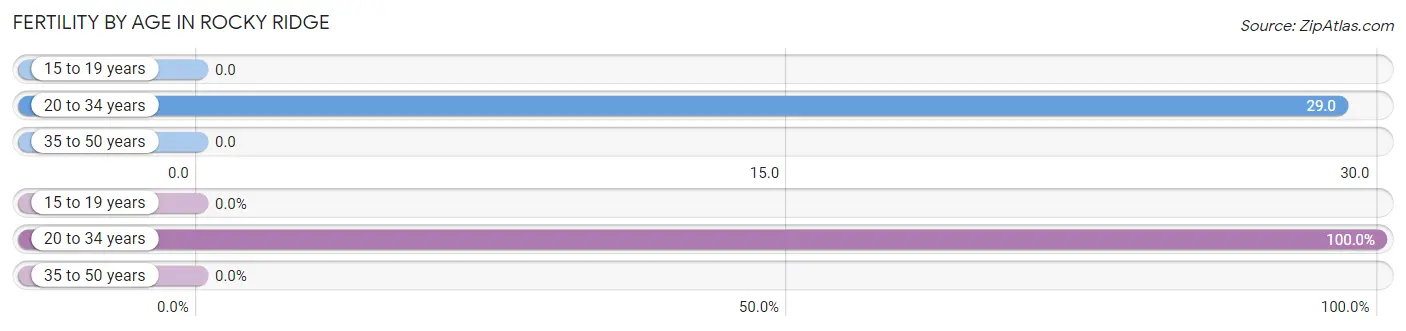
| Age Bracket | Women with Births | Births / 1,000 Women |
| 15 to 19 years | 0 (0.0%) | 0.0 |
| 20 to 34 years | 1 (100.0%) | 29.0 |
| 35 to 50 years | 0 (0.0%) | 0.0 |
| Total | 1 (100.0%) | 10.0 |
Fertility by Age by Marriage Status in Rocky Ridge
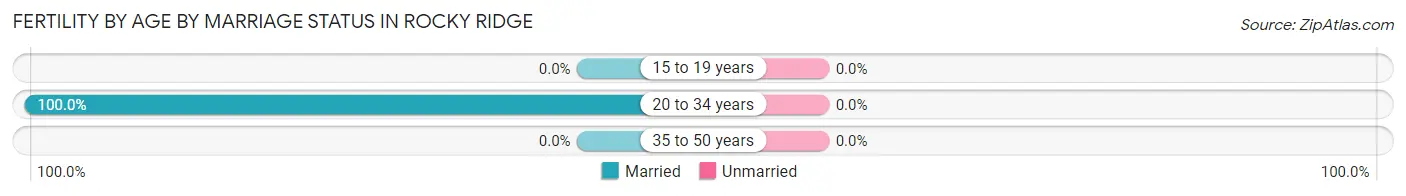
| Age Bracket | Married | Unmarried |
| 15 to 19 years | 0 (0.0%) | 0 (0.0%) |
| 20 to 34 years | 1 (100.0%) | 0 (0.0%) |
| 35 to 50 years | 0 (0.0%) | 0 (0.0%) |
| Total | 1 (100.0%) | 0 (0.0%) |
Fertility by Education in Rocky Ridge
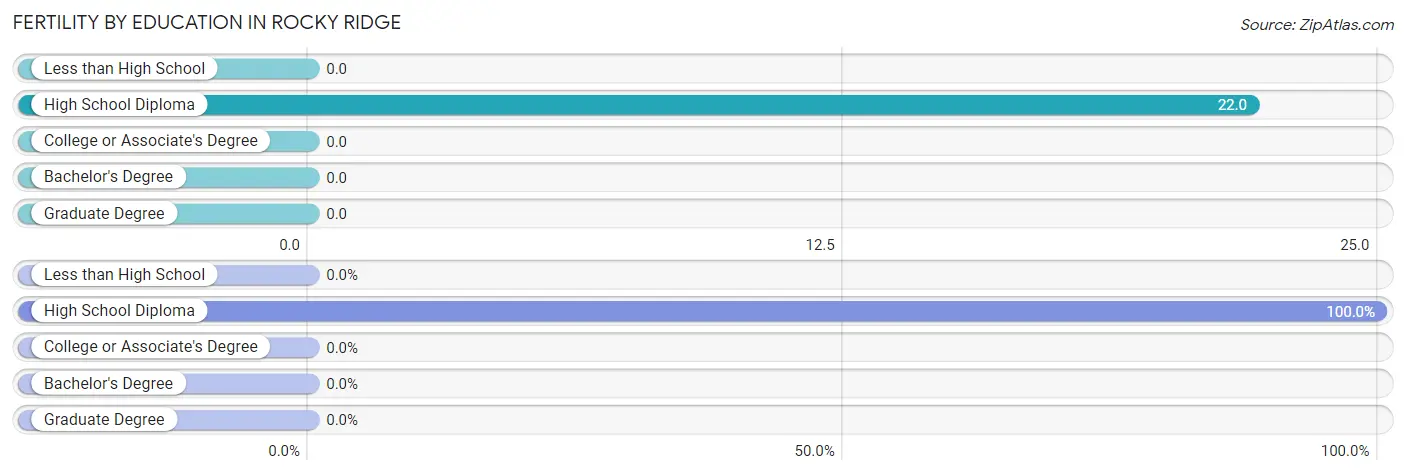
| Educational Attainment | Women with Births | Births / 1,000 Women |
| Less than High School | 0 (0.0%) | 0.0 |
| High School Diploma | 1 (100.0%) | 22.0 |
| College or Associate's Degree | 0 (0.0%) | 0.0 |
| Bachelor's Degree | 0 (0.0%) | 0.0 |
| Graduate Degree | 0 (0.0%) | 0.0 |
| Total | 1 (100.0%) | 10.0 |
Fertility by Education by Marriage Status in Rocky Ridge
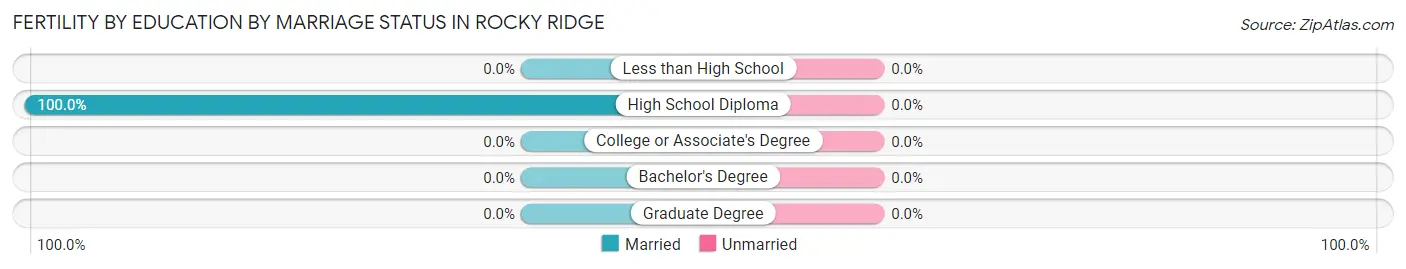
| Educational Attainment | Married | Unmarried |
| Less than High School | 0 (0.0%) | 0 (0.0%) |
| High School Diploma | 1 (100.0%) | 0 (0.0%) |
| College or Associate's Degree | 0 (0.0%) | 0 (0.0%) |
| Bachelor's Degree | 0 (0.0%) | 0 (0.0%) |
| Graduate Degree | 0 (0.0%) | 0 (0.0%) |
| Total | 1 (100.0%) | 0 (0.0%) |
Income in Rocky Ridge
Income Overview in Rocky Ridge
Per Capita Income in Rocky Ridge is $29,217, while median incomes of families and households are $49,583 and $66,563 respectively.
| Characteristic | Number | Measure |
| Per Capita Income | 323 | $29,217 |
| Median Family Income | 87 | $49,583 |
| Mean Family Income | 87 | $64,628 |
| Median Household Income | 139 | $66,563 |
| Mean Household Income | 139 | $64,699 |
| Income Deficit | 87 | $0 |
| Wage / Income Gap (%) | 323 | 19.08% |
| Wage / Income Gap ($) | 323 | 80.92¢ per $1 |
| Gini / Inequality Index | 323 | 0.34 |
Earnings by Sex in Rocky Ridge
Average Earnings in Rocky Ridge are $36,875, $43,977 for men and $35,588 for women, a difference of 19.1%.
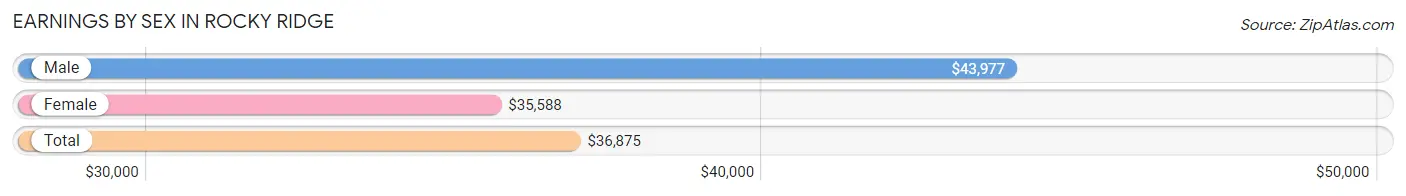
| Sex | Number | Average Earnings |
| Male | 99 (52.4%) | $43,977 |
| Female | 90 (47.6%) | $35,588 |
| Total | 189 (100.0%) | $36,875 |
Earnings by Sex by Income Bracket in Rocky Ridge
The most common earnings brackets in Rocky Ridge are $25,000 to $29,999 for men (18 | 18.2%) and $30,000 to $34,999 for women (21 | 23.3%).
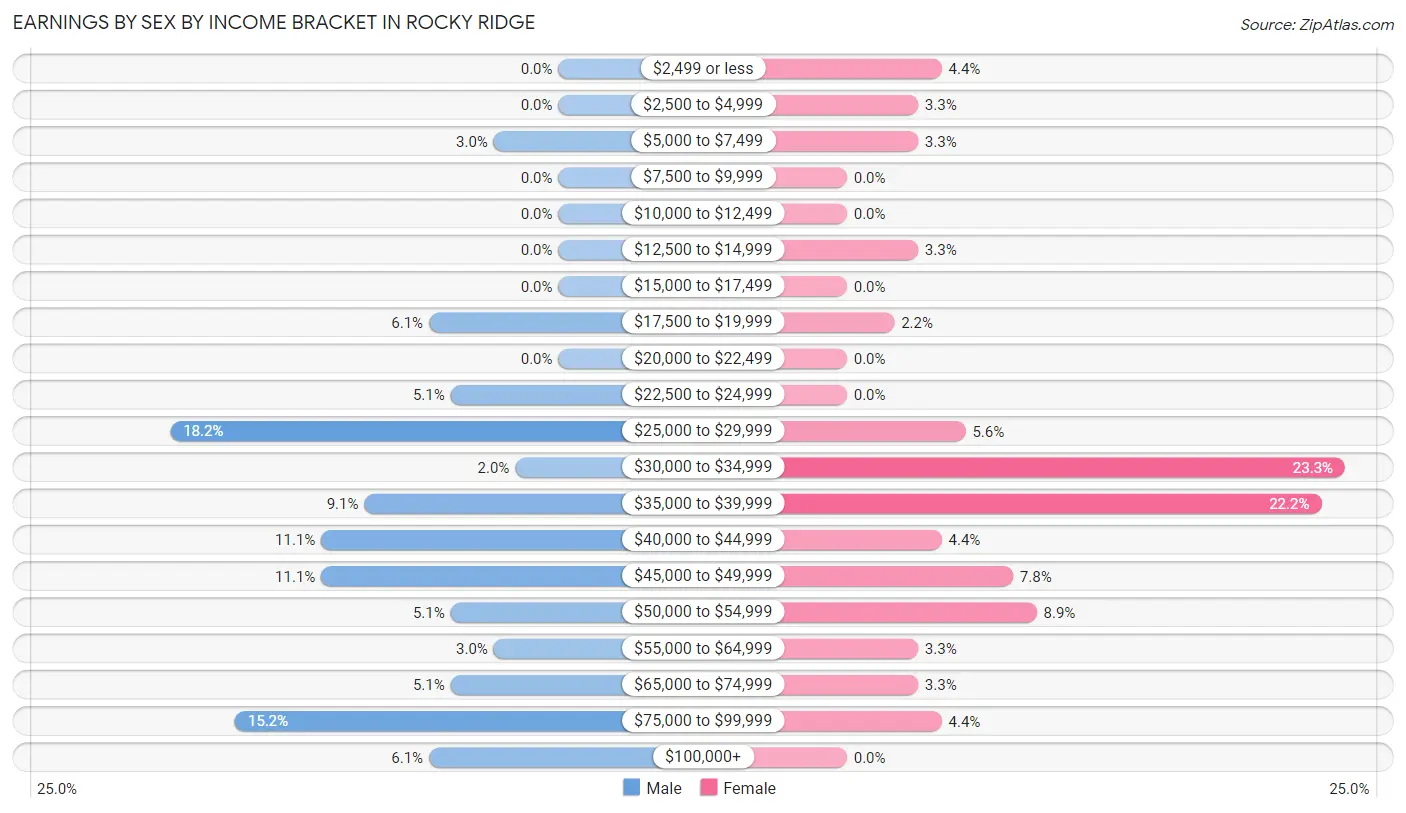
| Income | Male | Female |
| $2,499 or less | 0 (0.0%) | 4 (4.4%) |
| $2,500 to $4,999 | 0 (0.0%) | 3 (3.3%) |
| $5,000 to $7,499 | 3 (3.0%) | 3 (3.3%) |
| $7,500 to $9,999 | 0 (0.0%) | 0 (0.0%) |
| $10,000 to $12,499 | 0 (0.0%) | 0 (0.0%) |
| $12,500 to $14,999 | 0 (0.0%) | 3 (3.3%) |
| $15,000 to $17,499 | 0 (0.0%) | 0 (0.0%) |
| $17,500 to $19,999 | 6 (6.1%) | 2 (2.2%) |
| $20,000 to $22,499 | 0 (0.0%) | 0 (0.0%) |
| $22,500 to $24,999 | 5 (5.1%) | 0 (0.0%) |
| $25,000 to $29,999 | 18 (18.2%) | 5 (5.6%) |
| $30,000 to $34,999 | 2 (2.0%) | 21 (23.3%) |
| $35,000 to $39,999 | 9 (9.1%) | 20 (22.2%) |
| $40,000 to $44,999 | 11 (11.1%) | 4 (4.4%) |
| $45,000 to $49,999 | 11 (11.1%) | 7 (7.8%) |
| $50,000 to $54,999 | 5 (5.1%) | 8 (8.9%) |
| $55,000 to $64,999 | 3 (3.0%) | 3 (3.3%) |
| $65,000 to $74,999 | 5 (5.1%) | 3 (3.3%) |
| $75,000 to $99,999 | 15 (15.1%) | 4 (4.4%) |
| $100,000+ | 6 (6.1%) | 0 (0.0%) |
| Total | 99 (100.0%) | 90 (100.0%) |
Earnings by Sex by Educational Attainment in Rocky Ridge
Average earnings in Rocky Ridge are $41,250 for men and $37,206 for women, a difference of 9.8%. Men with an educational attainment of college or associate's degree enjoy the highest average annual earnings of $75,000, while those with high school diploma education earn the least with $32,500. Women with an educational attainment of bachelor's degree earn the most with the average annual earnings of $71,250, while those with high school diploma education have the smallest earnings of $35,536.
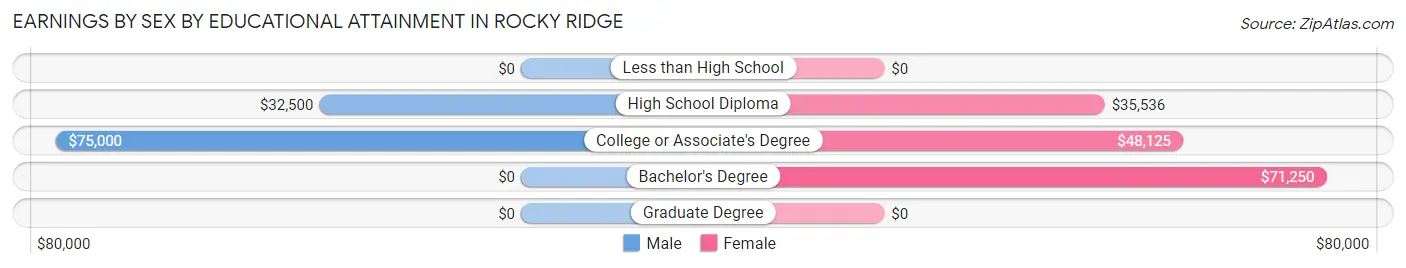
| Educational Attainment | Male Income | Female Income |
| Less than High School | - | - |
| High School Diploma | $32,500 | $35,536 |
| College or Associate's Degree | $75,000 | $48,125 |
| Bachelor's Degree | - | - |
| Graduate Degree | - | - |
| Total | $41,250 | $37,206 |
Family Income in Rocky Ridge
Family Income Brackets in Rocky Ridge
According to the Rocky Ridge family income data, there are 22 families falling into the $35,000 to $49,999 income range, which is the most common income bracket and makes up 25.3% of all families.
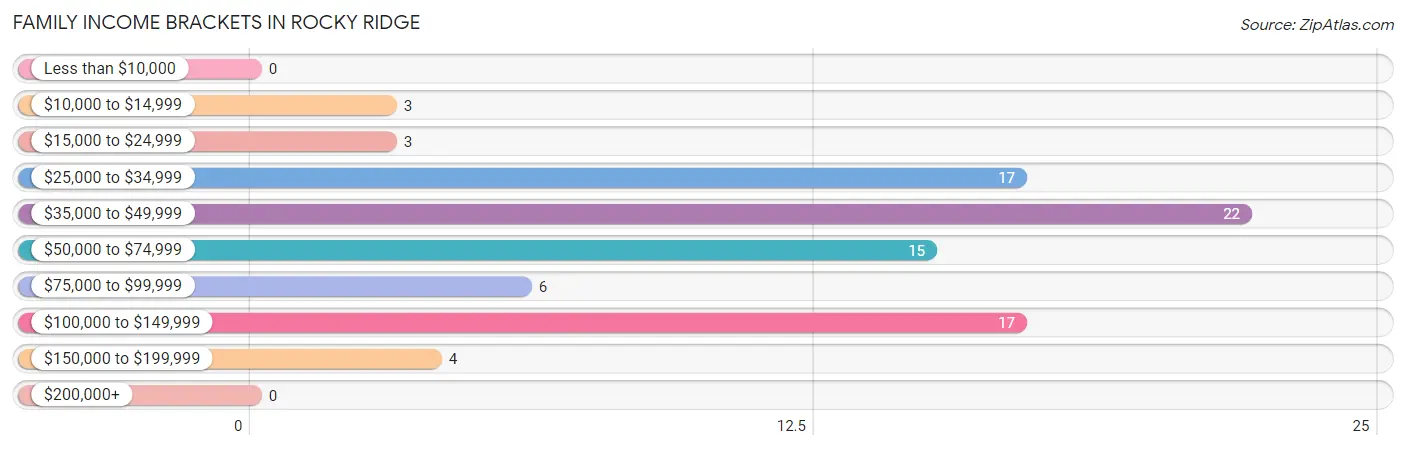
| Income Bracket | # Families | % Families |
| Less than $10,000 | 0 | 0.0% |
| $10,000 to $14,999 | 3 | 3.4% |
| $15,000 to $24,999 | 3 | 3.4% |
| $25,000 to $34,999 | 17 | 19.5% |
| $35,000 to $49,999 | 22 | 25.3% |
| $50,000 to $74,999 | 15 | 17.2% |
| $75,000 to $99,999 | 6 | 6.9% |
| $100,000 to $149,999 | 17 | 19.5% |
| $150,000 to $199,999 | 4 | 4.6% |
| $200,000+ | 0 | 0.0% |
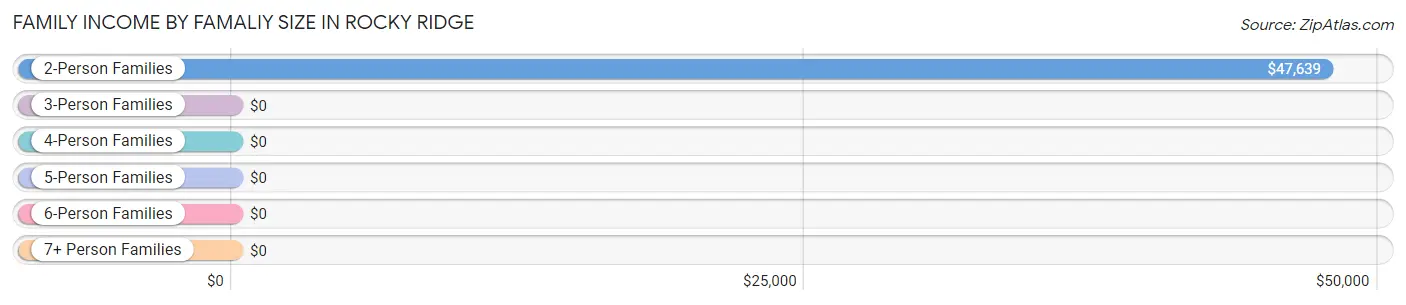
Family Income by Famaliy Size in Rocky Ridge
2-person families (69 | 79.3%) account for the highest median family income in Rocky Ridge with $47,639 per family, while 2-person families (69 | 79.3%) have the highest median income of $23,820 per family member.
| Income Bracket | # Families | Median Income |
| 2-Person Families | 69 (79.3%) | $47,639 |
| 3-Person Families | 10 (11.5%) | $0 |
| 4-Person Families | 3 (3.5%) | $0 |
| 5-Person Families | 5 (5.8%) | $0 |
| 6-Person Families | 0 (0.0%) | $0 |
| 7+ Person Families | 0 (0.0%) | $0 |
| Total | 87 (100.0%) | $49,583 |
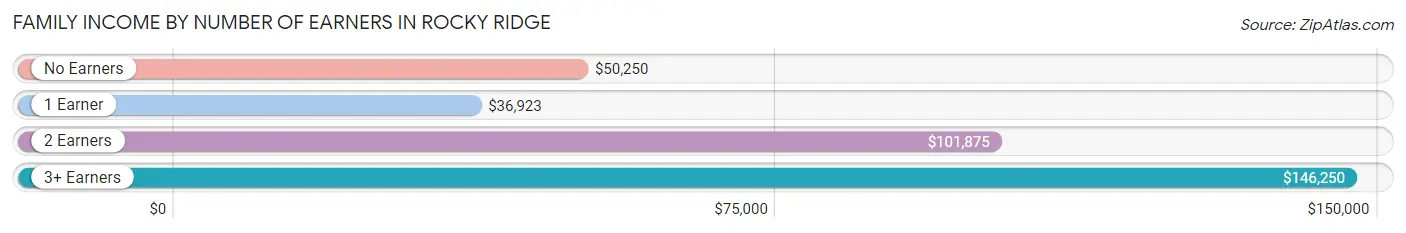
Family Income by Number of Earners in Rocky Ridge
The median family income in Rocky Ridge is $49,583, with families comprising 3+ earners (6) having the highest median family income of $146,250, while families with 1 earner (50) have the lowest median family income of $36,923, accounting for 6.9% and 57.5% of families, respectively.
| Number of Earners | # Families | Median Income |
| No Earners | 13 (14.9%) | $50,250 |
| 1 Earner | 50 (57.5%) | $36,923 |
| 2 Earners | 18 (20.7%) | $101,875 |
| 3+ Earners | 6 (6.9%) | $146,250 |
| Total | 87 (100.0%) | $49,583 |
Household Income in Rocky Ridge
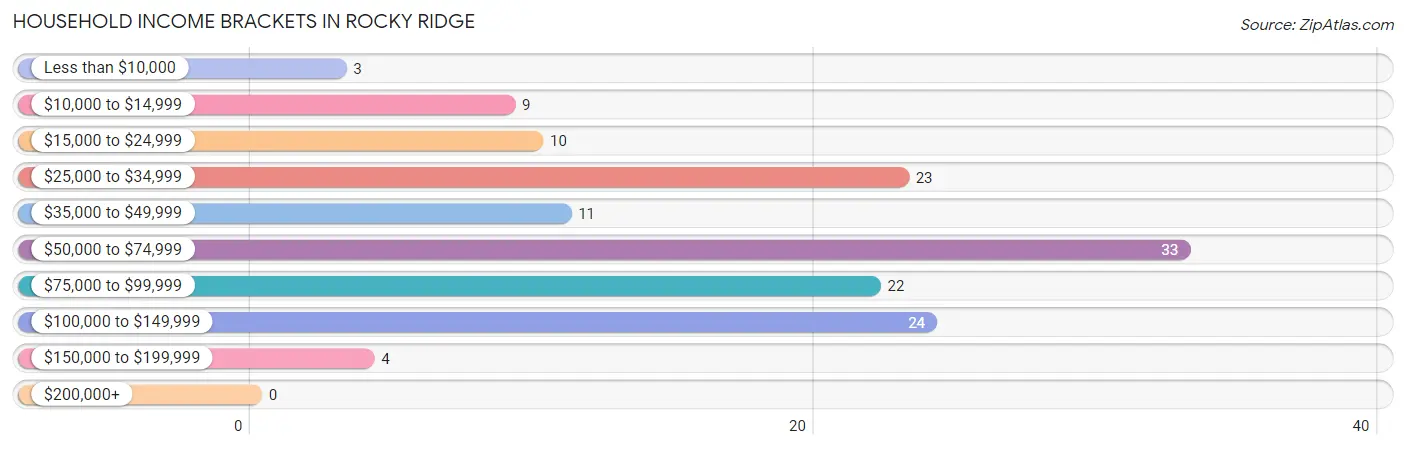
Household Income Brackets in Rocky Ridge
With 33 households falling in the category, the $50,000 to $74,999 income range is the most frequent in Rocky Ridge, accounting for 23.7% of all households.
| Income Bracket | # Households | % Households |
| Less than $10,000 | 3 | 2.2% |
| $10,000 to $14,999 | 9 | 6.5% |
| $15,000 to $24,999 | 10 | 7.2% |
| $25,000 to $34,999 | 23 | 16.5% |
| $35,000 to $49,999 | 11 | 7.9% |
| $50,000 to $74,999 | 33 | 23.7% |
| $75,000 to $99,999 | 22 | 15.8% |
| $100,000 to $149,999 | 24 | 17.3% |
| $150,000 to $199,999 | 4 | 2.9% |
| $200,000+ | 0 | 0.0% |
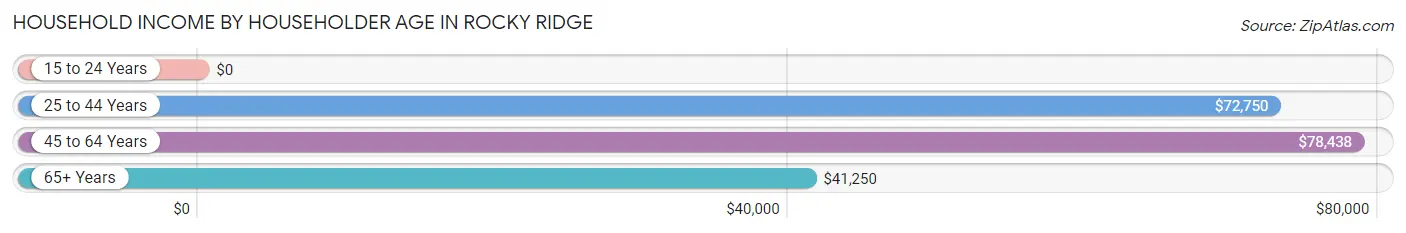
Household Income by Householder Age in Rocky Ridge
The median household income in Rocky Ridge is $66,563, with the highest median household income of $78,438 found in the 45 to 64 years age bracket for the primary householder. A total of 76 households (54.7%) fall into this category. Meanwhile, the 15 to 24 years age bracket for the primary householder has the lowest median household income of $0, with 4 households (2.9%) in this group.
| Income Bracket | # Households | Median Income |
| 15 to 24 Years | 4 (2.9%) | $0 |
| 25 to 44 Years | 33 (23.7%) | $72,750 |
| 45 to 64 Years | 76 (54.7%) | $78,438 |
| 65+ Years | 26 (18.7%) | $41,250 |
| Total | 139 (100.0%) | $66,563 |
Poverty in Rocky Ridge
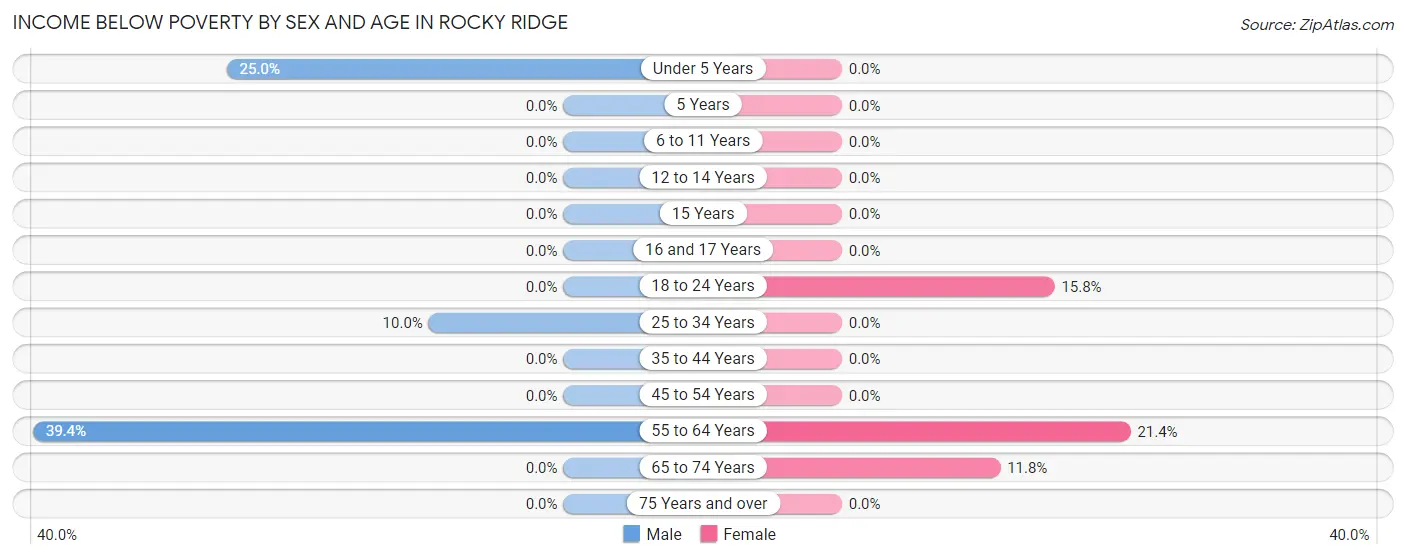
Income Below Poverty by Sex and Age in Rocky Ridge
With 11.0% poverty level for males and 6.7% for females among the residents of Rocky Ridge, 55 to 64 year old males and 55 to 64 year old females are the most vulnerable to poverty, with 13 males (39.4%) and 6 females (21.4%) in their respective age groups living below the poverty level.
| Age Bracket | Male | Female |
| Under 5 Years | 1 (25.0%) | 0 (0.0%) |
| 5 Years | 0 (0.0%) | 0 (0.0%) |
| 6 to 11 Years | 0 (0.0%) | 0 (0.0%) |
| 12 to 14 Years | 0 (0.0%) | 0 (0.0%) |
| 15 Years | 0 (0.0%) | 0 (0.0%) |
| 16 and 17 Years | 0 (0.0%) | 0 (0.0%) |
| 18 to 24 Years | 0 (0.0%) | 3 (15.8%) |
| 25 to 34 Years | 3 (10.0%) | 0 (0.0%) |
| 35 to 44 Years | 0 (0.0%) | 0 (0.0%) |
| 45 to 54 Years | 0 (0.0%) | 0 (0.0%) |
| 55 to 64 Years | 13 (39.4%) | 6 (21.4%) |
| 65 to 74 Years | 0 (0.0%) | 2 (11.8%) |
| 75 Years and over | 0 (0.0%) | 0 (0.0%) |
| Total | 17 (11.0%) | 11 (6.7%) |
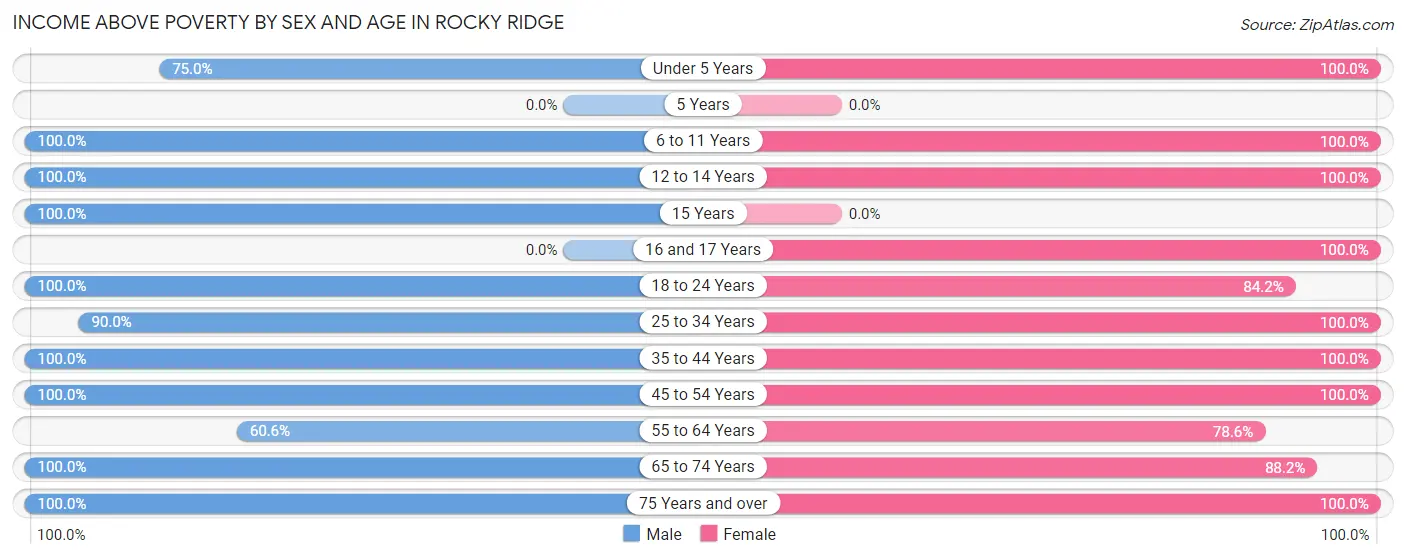
Income Above Poverty by Sex and Age in Rocky Ridge
According to the poverty statistics in Rocky Ridge, males aged 6 to 11 years and females aged under 5 years are the age groups that are most secure financially, with 100.0% of males and 100.0% of females in these age groups living above the poverty line.
| Age Bracket | Male | Female |
| Under 5 Years | 3 (75.0%) | 3 (100.0%) |
| 5 Years | 0 (0.0%) | 0 (0.0%) |
| 6 to 11 Years | 12 (100.0%) | 5 (100.0%) |
| 12 to 14 Years | 2 (100.0%) | 2 (100.0%) |
| 15 Years | 1 (100.0%) | 0 (0.0%) |
| 16 and 17 Years | 0 (0.0%) | 30 (100.0%) |
| 18 to 24 Years | 21 (100.0%) | 16 (84.2%) |
| 25 to 34 Years | 27 (90.0%) | 16 (100.0%) |
| 35 to 44 Years | 7 (100.0%) | 14 (100.0%) |
| 45 to 54 Years | 29 (100.0%) | 27 (100.0%) |
| 55 to 64 Years | 20 (60.6%) | 22 (78.6%) |
| 65 to 74 Years | 8 (100.0%) | 15 (88.2%) |
| 75 Years and over | 7 (100.0%) | 4 (100.0%) |
| Total | 137 (89.0%) | 154 (93.3%) |
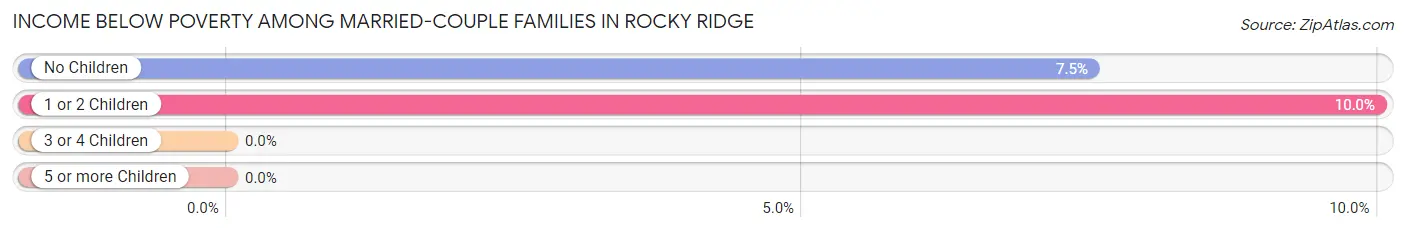
Income Below Poverty Among Married-Couple Families in Rocky Ridge
The poverty statistics for married-couple families in Rocky Ridge show that 7.7% or 4 of the total 52 families live below the poverty line. Families with 1 or 2 children have the highest poverty rate of 10.0%, comprising of 1 families. On the other hand, families with 3 or 4 children have the lowest poverty rate of 0.0%, which includes 0 families.
| Children | Above Poverty | Below Poverty |
| No Children | 37 (92.5%) | 3 (7.5%) |
| 1 or 2 Children | 9 (90.0%) | 1 (10.0%) |
| 3 or 4 Children | 2 (100.0%) | 0 (0.0%) |
| 5 or more Children | 0 (0.0%) | 0 (0.0%) |
| Total | 48 (92.3%) | 4 (7.7%) |
Income Below Poverty Among Single-Parent Households in Rocky Ridge
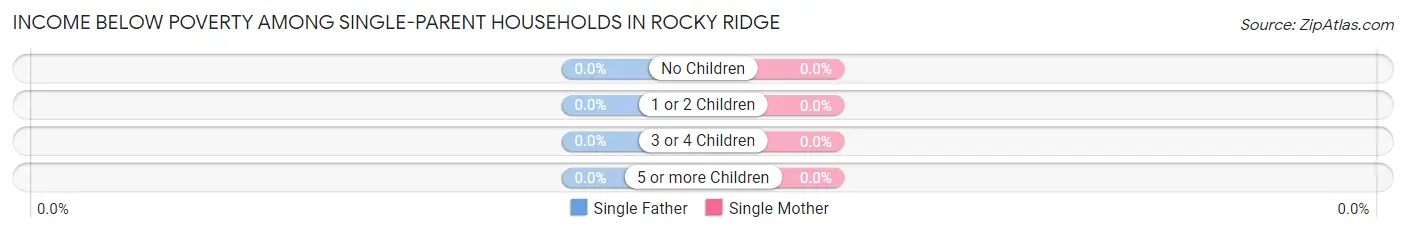
| Children | Single Father | Single Mother |
| No Children | 0 (0.0%) | 0 (0.0%) |
| 1 or 2 Children | 0 (0.0%) | 0 (0.0%) |
| 3 or 4 Children | 0 (0.0%) | 0 (0.0%) |
| 5 or more Children | 0 (0.0%) | 0 (0.0%) |
| Total | 0 (0.0%) | 0 (0.0%) |
Income Below Poverty Among Married-Couple vs Single-Parent Households in Rocky Ridge
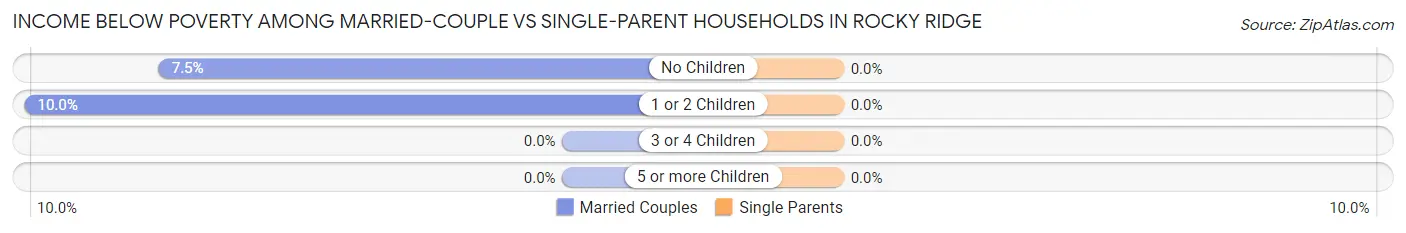
| Children | Married-Couple Families | Single-Parent Households |
| No Children | 3 (7.5%) | 0 (0.0%) |
| 1 or 2 Children | 1 (10.0%) | 0 (0.0%) |
| 3 or 4 Children | 0 (0.0%) | 0 (0.0%) |
| 5 or more Children | 0 (0.0%) | 0 (0.0%) |
| Total | 4 (7.7%) | 0 (0.0%) |
Employment Characteristics in Rocky Ridge
Employment by Class of Employer in Rocky Ridge
Among the 173 employed individuals in Rocky Ridge, private company employees (138 | 79.8%), local government employees (18 | 10.4%), and not-for-profit organizations (17 | 9.8%) make up the most common classes of employment.
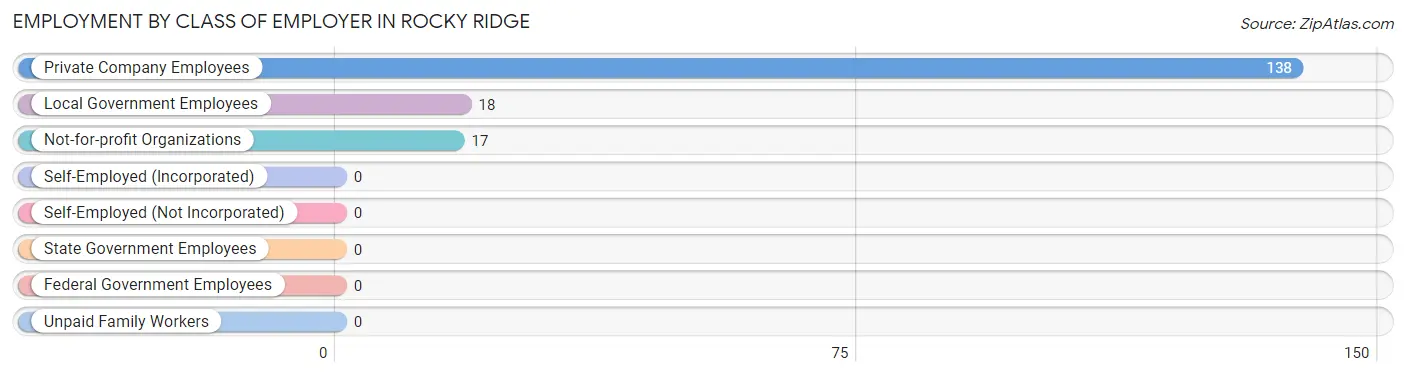
| Employer Class | # Employees | % Employees |
| Private Company Employees | 138 | 79.8% |
| Self-Employed (Incorporated) | 0 | 0.0% |
| Self-Employed (Not Incorporated) | 0 | 0.0% |
| Not-for-profit Organizations | 17 | 9.8% |
| Local Government Employees | 18 | 10.4% |
| State Government Employees | 0 | 0.0% |
| Federal Government Employees | 0 | 0.0% |
| Unpaid Family Workers | 0 | 0.0% |
| Total | 173 | 100.0% |
Employment Status by Age in Rocky Ridge
According to the labor force statistics for Rocky Ridge, out of the total population over 16 years of age (290), 64.5% or 187 individuals are in the labor force, with 7.0% or 13 of them unemployed. The age group with the highest labor force participation rate is 20 to 24 years, with 100.0% or 40 individuals in the labor force. Within the labor force, the 45 to 54 years age range has the highest percentage of unemployed individuals, with 25.0% or 13 of them being unemployed.
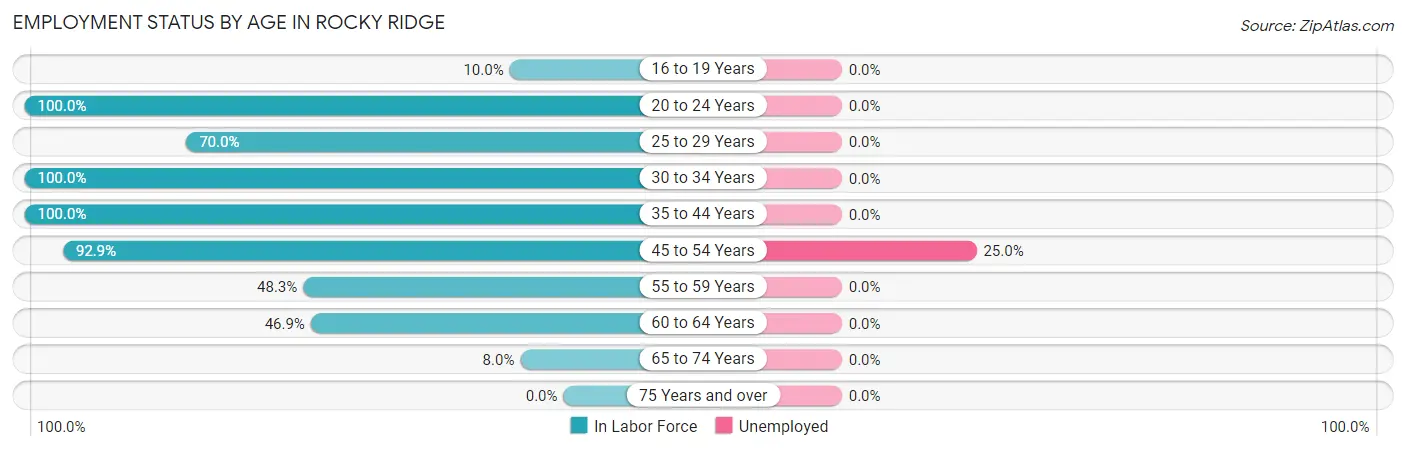
| Age Bracket | In Labor Force | Unemployed |
| 16 to 19 Years | 3 (10.0%) | 0 (0.0%) |
| 20 to 24 Years | 40 (100.0%) | 0 (0.0%) |
| 25 to 29 Years | 14 (70.0%) | 0 (0.0%) |
| 30 to 34 Years | 26 (100.0%) | 0 (0.0%) |
| 35 to 44 Years | 21 (100.0%) | 0 (0.0%) |
| 45 to 54 Years | 52 (92.9%) | 13 (25.0%) |
| 55 to 59 Years | 14 (48.3%) | 0 (0.0%) |
| 60 to 64 Years | 15 (46.9%) | 0 (0.0%) |
| 65 to 74 Years | 2 (8.0%) | 0 (0.0%) |
| 75 Years and over | 0 (0.0%) | 0 (0.0%) |
| Total | 187 (64.5%) | 13 (7.0%) |
Employment Status by Educational Attainment in Rocky Ridge
According to labor force statistics for Rocky Ridge, 77.2% of individuals (142) out of the total population between 25 and 64 years of age (184) are in the labor force, with 9.2% or 13 of them being unemployed. The group with the highest labor force participation rate are those with the educational attainment of bachelor's degree or higher, with 100.0% or 15 individuals in the labor force. Within the labor force, individuals with high school diploma education have the highest percentage of unemployment, with 14.4% or 13 of them being unemployed.
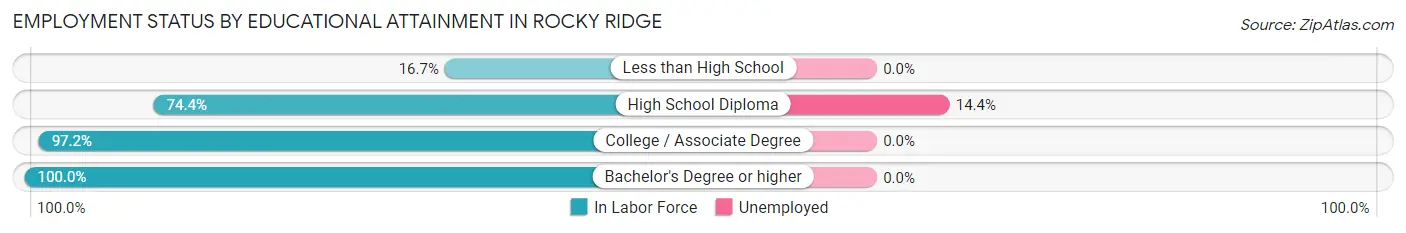
| Educational Attainment | In Labor Force | Unemployed |
| Less than High School | 2 (16.7%) | 0 (0.0%) |
| High School Diploma | 90 (74.4%) | 17 (14.4%) |
| College / Associate Degree | 35 (97.2%) | 0 (0.0%) |
| Bachelor's Degree or higher | 15 (100.0%) | 0 (0.0%) |
| Total | 142 (77.2%) | 17 (9.2%) |
Employment Occupations by Sex in Rocky Ridge
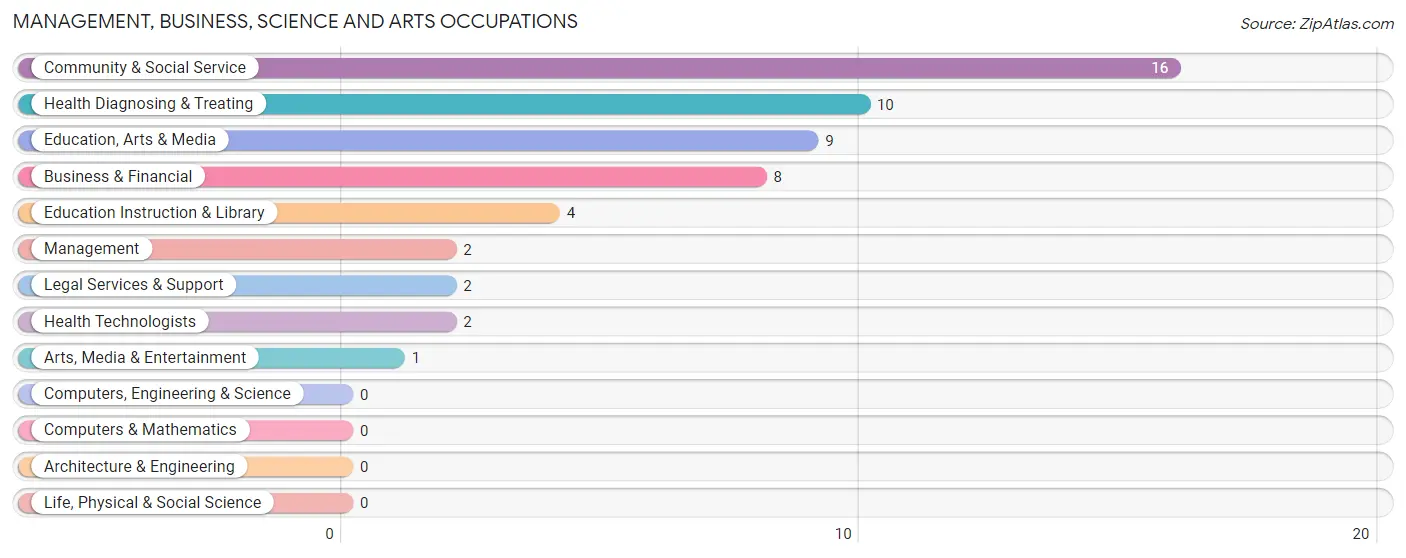
Management, Business, Science and Arts Occupations
The most common Management, Business, Science and Arts occupations in Rocky Ridge are Community & Social Service (16 | 9.2%), Health Diagnosing & Treating (10 | 5.8%), Education, Arts & Media (9 | 5.2%), Business & Financial (8 | 4.6%), and Education Instruction & Library (4 | 2.3%).
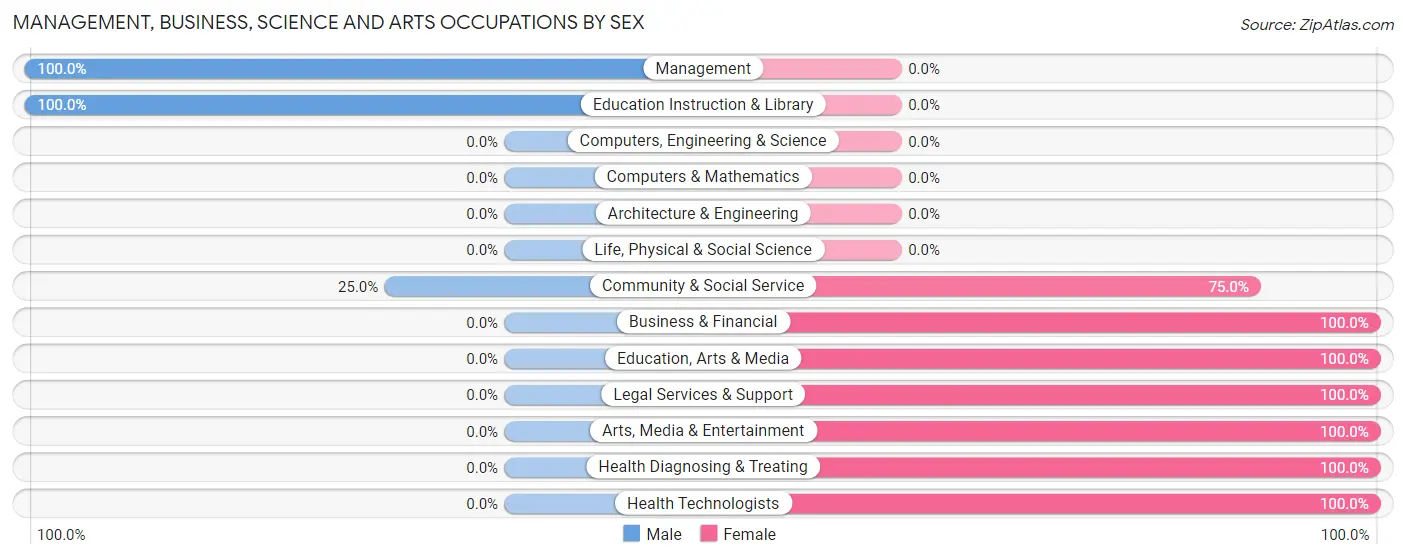
Management, Business, Science and Arts Occupations by Sex
Within the Management, Business, Science and Arts occupations in Rocky Ridge, the most male-oriented occupations are Management (100.0%), Education Instruction & Library (100.0%), and Community & Social Service (25.0%), while the most female-oriented occupations are Business & Financial (100.0%), Education, Arts & Media (100.0%), and Legal Services & Support (100.0%).
| Occupation | Male | Female |
| Management | 2 (100.0%) | 0 (0.0%) |
| Business & Financial | 0 (0.0%) | 8 (100.0%) |
| Computers, Engineering & Science | 0 (0.0%) | 0 (0.0%) |
| Computers & Mathematics | 0 (0.0%) | 0 (0.0%) |
| Architecture & Engineering | 0 (0.0%) | 0 (0.0%) |
| Life, Physical & Social Science | 0 (0.0%) | 0 (0.0%) |
| Community & Social Service | 4 (25.0%) | 12 (75.0%) |
| Education, Arts & Media | 0 (0.0%) | 9 (100.0%) |
| Legal Services & Support | 0 (0.0%) | 2 (100.0%) |
| Education Instruction & Library | 4 (100.0%) | 0 (0.0%) |
| Arts, Media & Entertainment | 0 (0.0%) | 1 (100.0%) |
| Health Diagnosing & Treating | 0 (0.0%) | 10 (100.0%) |
| Health Technologists | 0 (0.0%) | 2 (100.0%) |
| Total (Category) | 6 (16.7%) | 30 (83.3%) |
| Total (Overall) | 90 (51.7%) | 84 (48.3%) |
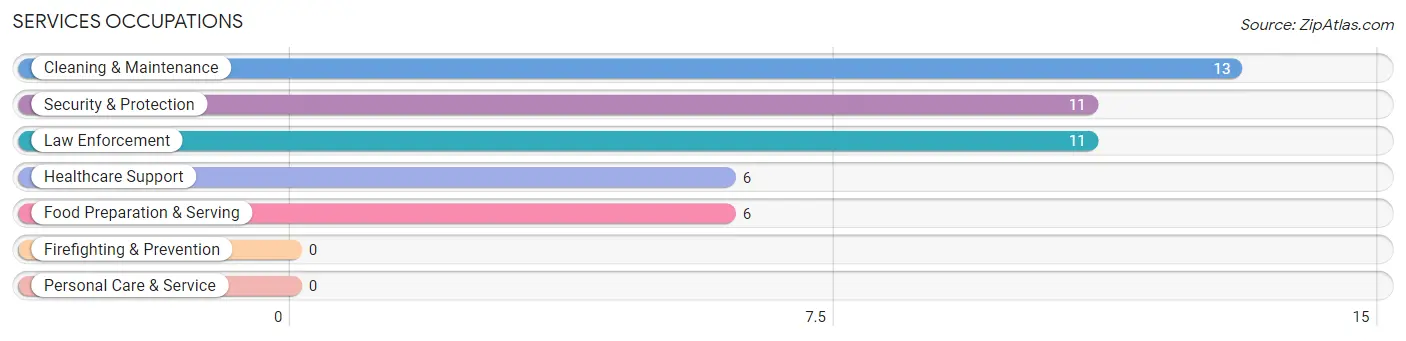
Services Occupations
The most common Services occupations in Rocky Ridge are Cleaning & Maintenance (13 | 7.5%), Security & Protection (11 | 6.3%), Law Enforcement (11 | 6.3%), Healthcare Support (6 | 3.5%), and Food Preparation & Serving (6 | 3.5%).
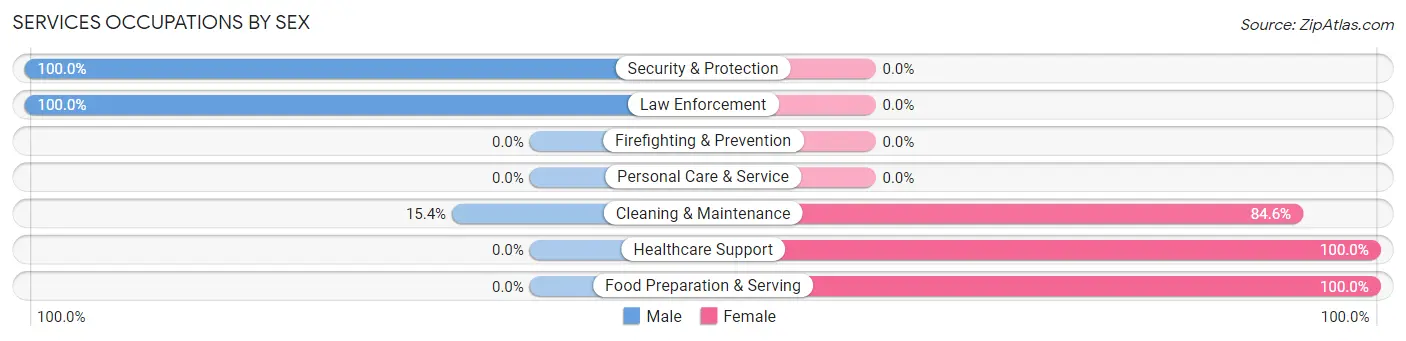
Services Occupations by Sex
Within the Services occupations in Rocky Ridge, the most male-oriented occupations are Security & Protection (100.0%), Law Enforcement (100.0%), and Cleaning & Maintenance (15.4%), while the most female-oriented occupations are Healthcare Support (100.0%), Food Preparation & Serving (100.0%), and Cleaning & Maintenance (84.6%).
| Occupation | Male | Female |
| Healthcare Support | 0 (0.0%) | 6 (100.0%) |
| Security & Protection | 11 (100.0%) | 0 (0.0%) |
| Firefighting & Prevention | 0 (0.0%) | 0 (0.0%) |
| Law Enforcement | 11 (100.0%) | 0 (0.0%) |
| Food Preparation & Serving | 0 (0.0%) | 6 (100.0%) |
| Cleaning & Maintenance | 2 (15.4%) | 11 (84.6%) |
| Personal Care & Service | 0 (0.0%) | 0 (0.0%) |
| Total (Category) | 13 (36.1%) | 23 (63.9%) |
| Total (Overall) | 90 (51.7%) | 84 (48.3%) |
Sales and Office Occupations
The most common Sales and Office occupations in Rocky Ridge are Sales & Related (20 | 11.5%), and Office & Administration (4 | 2.3%).
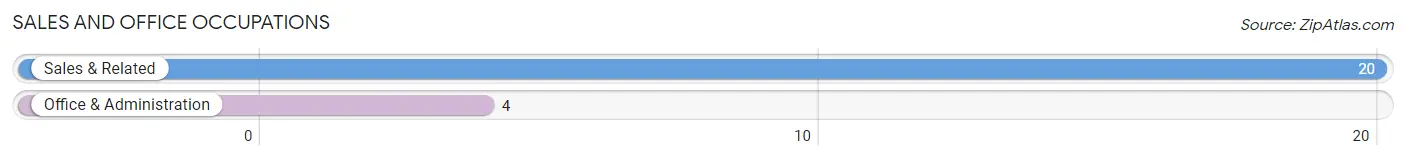
Sales and Office Occupations by Sex
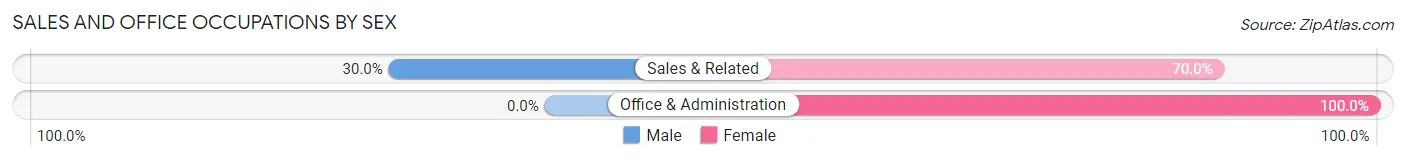
| Occupation | Male | Female |
| Sales & Related | 6 (30.0%) | 14 (70.0%) |
| Office & Administration | 0 (0.0%) | 4 (100.0%) |
| Total (Category) | 6 (25.0%) | 18 (75.0%) |
| Total (Overall) | 90 (51.7%) | 84 (48.3%) |
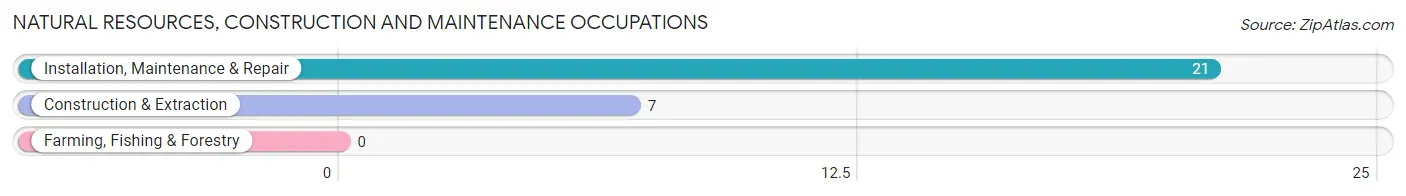
Natural Resources, Construction and Maintenance Occupations
The most common Natural Resources, Construction and Maintenance occupations in Rocky Ridge are Installation, Maintenance & Repair (21 | 12.1%), and Construction & Extraction (7 | 4.0%).
Natural Resources, Construction and Maintenance Occupations by Sex
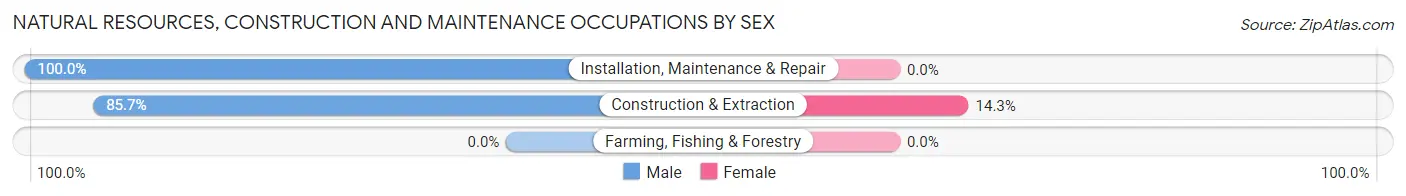
| Occupation | Male | Female |
| Farming, Fishing & Forestry | 0 (0.0%) | 0 (0.0%) |
| Construction & Extraction | 6 (85.7%) | 1 (14.3%) |
| Installation, Maintenance & Repair | 21 (100.0%) | 0 (0.0%) |
| Total (Category) | 27 (96.4%) | 1 (3.6%) |
| Total (Overall) | 90 (51.7%) | 84 (48.3%) |
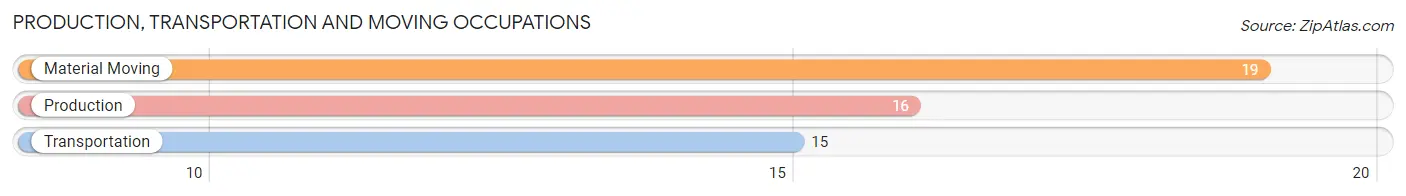
Production, Transportation and Moving Occupations
The most common Production, Transportation and Moving occupations in Rocky Ridge are Material Moving (19 | 10.9%), Production (16 | 9.2%), and Transportation (15 | 8.6%).
Production, Transportation and Moving Occupations by Sex
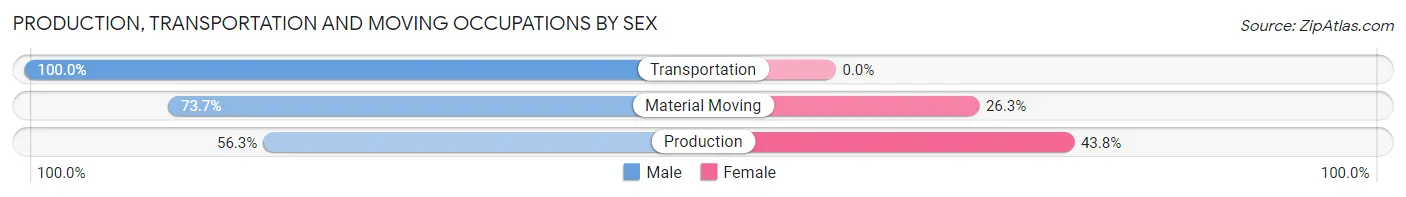
| Occupation | Male | Female |
| Production | 9 (56.2%) | 7 (43.8%) |
| Transportation | 15 (100.0%) | 0 (0.0%) |
| Material Moving | 14 (73.7%) | 5 (26.3%) |
| Total (Category) | 38 (76.0%) | 12 (24.0%) |
| Total (Overall) | 90 (51.7%) | 84 (48.3%) |
Employment Industries by Sex in Rocky Ridge
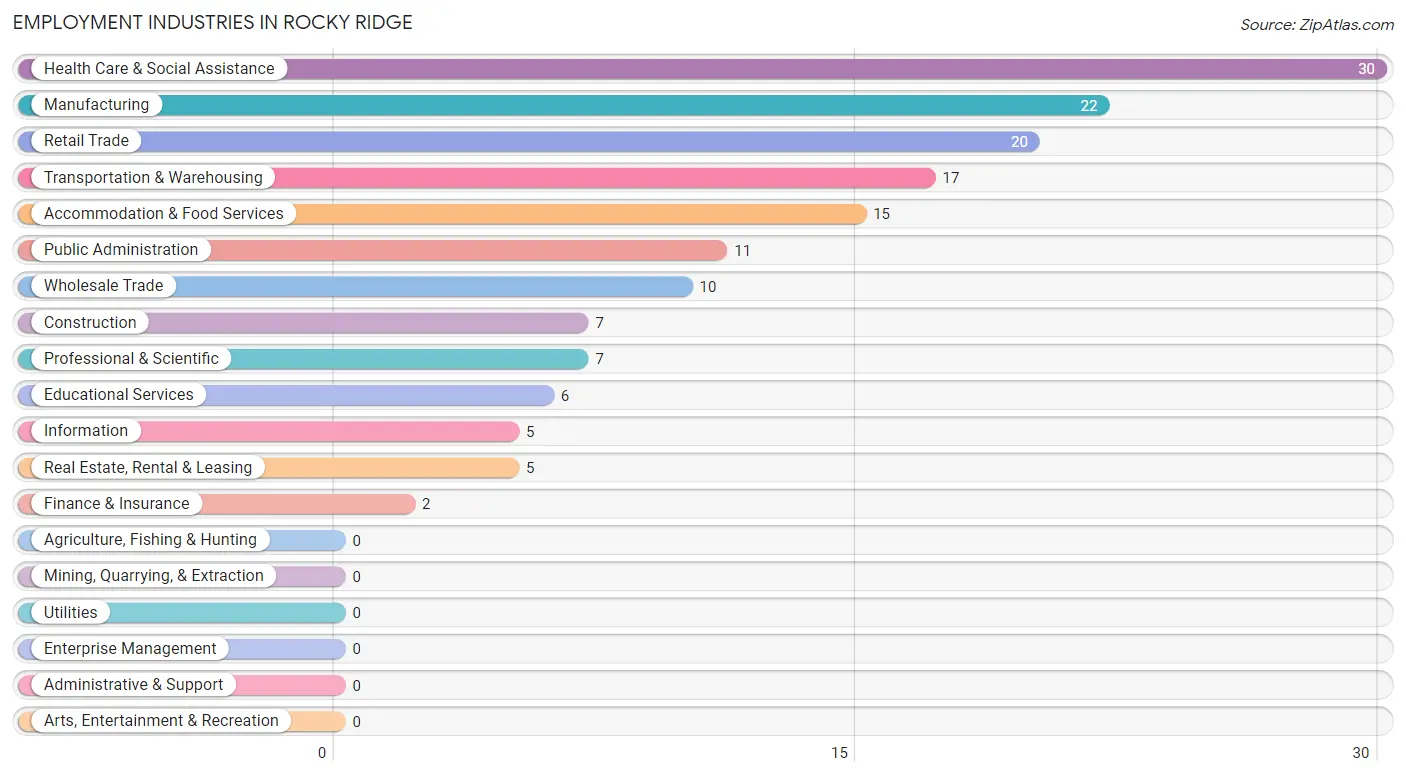
Employment Industries in Rocky Ridge
The major employment industries in Rocky Ridge include Health Care & Social Assistance (30 | 17.2%), Manufacturing (22 | 12.6%), Retail Trade (20 | 11.5%), Transportation & Warehousing (17 | 9.8%), and Accommodation & Food Services (15 | 8.6%).
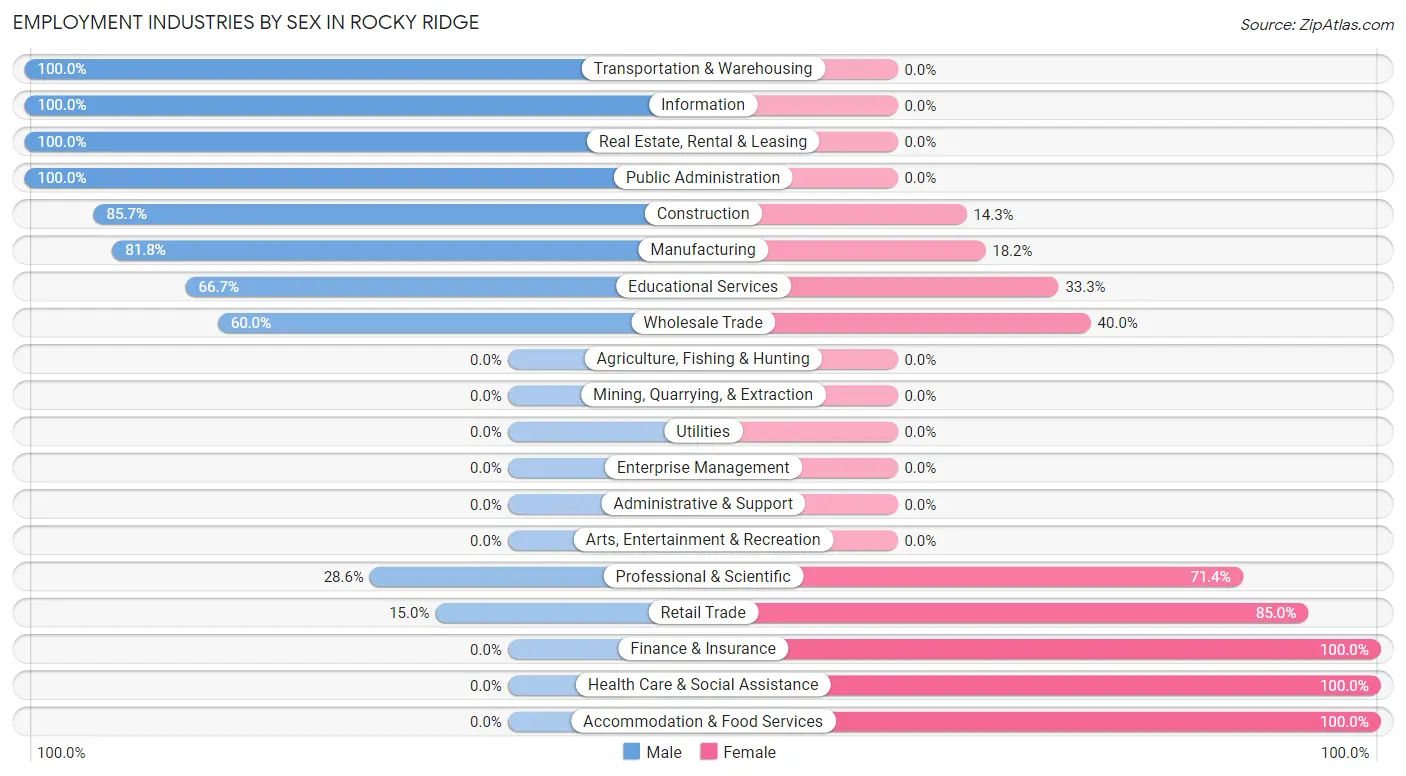
Employment Industries by Sex in Rocky Ridge
The Rocky Ridge industries that see more men than women are Transportation & Warehousing (100.0%), Information (100.0%), and Real Estate, Rental & Leasing (100.0%), whereas the industries that tend to have a higher number of women are Finance & Insurance (100.0%), Health Care & Social Assistance (100.0%), and Accommodation & Food Services (100.0%).
| Industry | Male | Female |
| Agriculture, Fishing & Hunting | 0 (0.0%) | 0 (0.0%) |
| Mining, Quarrying, & Extraction | 0 (0.0%) | 0 (0.0%) |
| Construction | 6 (85.7%) | 1 (14.3%) |
| Manufacturing | 18 (81.8%) | 4 (18.2%) |
| Wholesale Trade | 6 (60.0%) | 4 (40.0%) |
| Retail Trade | 3 (15.0%) | 17 (85.0%) |
| Transportation & Warehousing | 17 (100.0%) | 0 (0.0%) |
| Utilities | 0 (0.0%) | 0 (0.0%) |
| Information | 5 (100.0%) | 0 (0.0%) |
| Finance & Insurance | 0 (0.0%) | 2 (100.0%) |
| Real Estate, Rental & Leasing | 5 (100.0%) | 0 (0.0%) |
| Professional & Scientific | 2 (28.6%) | 5 (71.4%) |
| Enterprise Management | 0 (0.0%) | 0 (0.0%) |
| Administrative & Support | 0 (0.0%) | 0 (0.0%) |
| Educational Services | 4 (66.7%) | 2 (33.3%) |
| Health Care & Social Assistance | 0 (0.0%) | 30 (100.0%) |
| Arts, Entertainment & Recreation | 0 (0.0%) | 0 (0.0%) |
| Accommodation & Food Services | 0 (0.0%) | 15 (100.0%) |
| Public Administration | 11 (100.0%) | 0 (0.0%) |
| Total | 90 (51.7%) | 84 (48.3%) |
Education in Rocky Ridge
School Enrollment in Rocky Ridge
The most common levels of schooling among the 36 students in Rocky Ridge are college / undergraduate (11 | 30.6%), middle school (9 | 25.0%), and elementary school (7 | 19.4%).
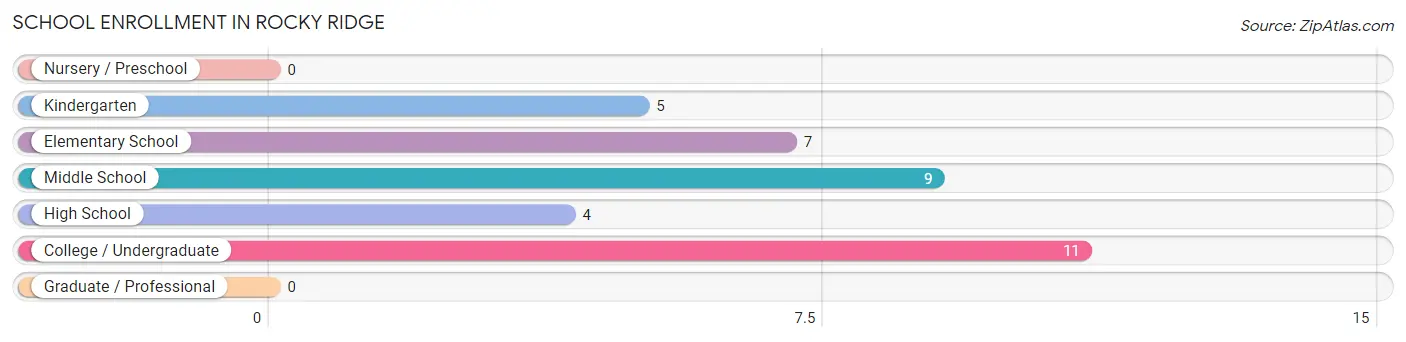
| School Level | # Students | % Students |
| Nursery / Preschool | 0 | 0.0% |
| Kindergarten | 5 | 13.9% |
| Elementary School | 7 | 19.4% |
| Middle School | 9 | 25.0% |
| High School | 4 | 11.1% |
| College / Undergraduate | 11 | 30.6% |
| Graduate / Professional | 0 | 0.0% |
| Total | 36 | 100.0% |
School Enrollment by Age by Funding Source in Rocky Ridge
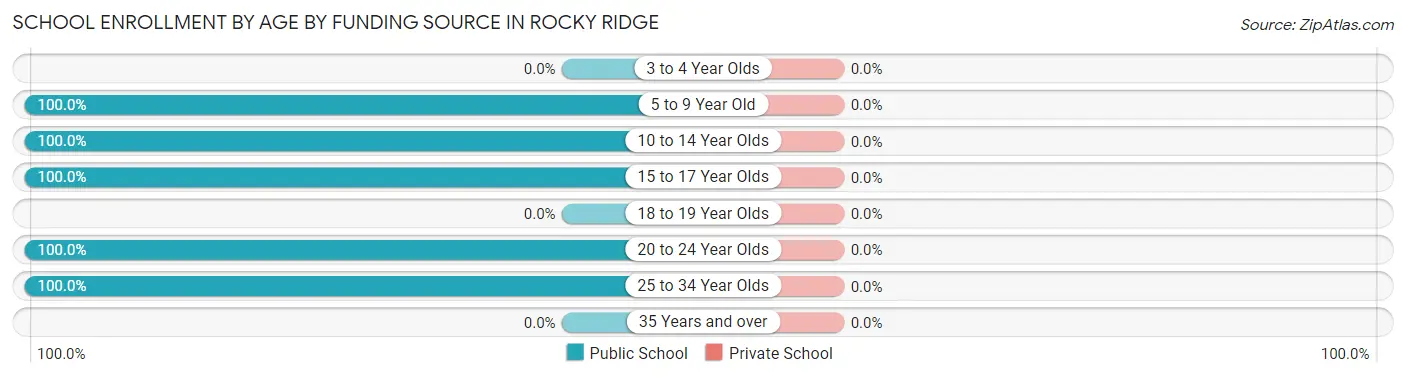
| Age Bracket | Public School | Private School |
| 3 to 4 Year Olds | 0 (0.0%) | 0 (0.0%) |
| 5 to 9 Year Old | 6 (100.0%) | 0 (0.0%) |
| 10 to 14 Year Olds | 15 (100.0%) | 0 (0.0%) |
| 15 to 17 Year Olds | 4 (100.0%) | 0 (0.0%) |
| 18 to 19 Year Olds | 0 (0.0%) | 0 (0.0%) |
| 20 to 24 Year Olds | 10 (100.0%) | 0 (0.0%) |
| 25 to 34 Year Olds | 1 (100.0%) | 0 (0.0%) |
| 35 Years and over | 0 (0.0%) | 0 (0.0%) |
| Total | 36 (100.0%) | 0 (0.0%) |
Educational Attainment by Field of Study in Rocky Ridge
Business (7 | 41.2%), education (6 | 35.3%), and science & technology (4 | 23.5%) are the most common fields of study among 17 individuals in Rocky Ridge who have obtained a bachelor's degree or higher.
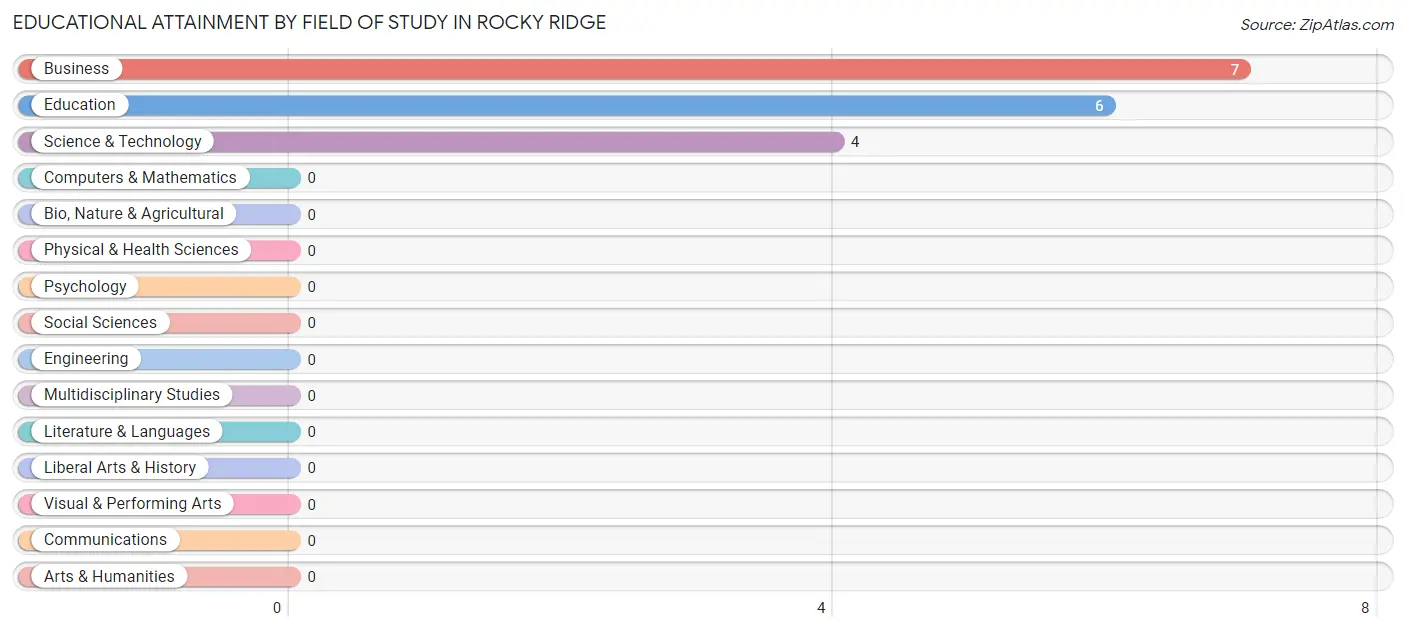
| Field of Study | # Graduates | % Graduates |
| Computers & Mathematics | 0 | 0.0% |
| Bio, Nature & Agricultural | 0 | 0.0% |
| Physical & Health Sciences | 0 | 0.0% |
| Psychology | 0 | 0.0% |
| Social Sciences | 0 | 0.0% |
| Engineering | 0 | 0.0% |
| Multidisciplinary Studies | 0 | 0.0% |
| Science & Technology | 4 | 23.5% |
| Business | 7 | 41.2% |
| Education | 6 | 35.3% |
| Literature & Languages | 0 | 0.0% |
| Liberal Arts & History | 0 | 0.0% |
| Visual & Performing Arts | 0 | 0.0% |
| Communications | 0 | 0.0% |
| Arts & Humanities | 0 | 0.0% |
| Total | 17 | 100.0% |
Transportation & Commute in Rocky Ridge
Vehicle Availability by Sex in Rocky Ridge
The most prevalent vehicle ownership categories in Rocky Ridge are males with 2 vehicles (60, accounting for 67.4%) and females with 2 vehicles (44, making up 71.4%).
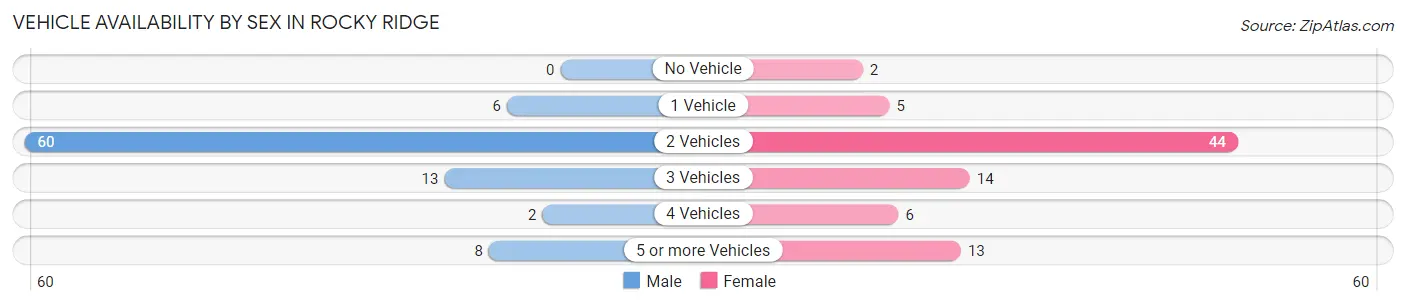
| Vehicles Available | Male | Female |
| No Vehicle | 0 (0.0%) | 2 (2.4%) |
| 1 Vehicle | 6 (6.7%) | 5 (5.9%) |
| 2 Vehicles | 60 (67.4%) | 44 (52.4%) |
| 3 Vehicles | 13 (14.6%) | 14 (16.7%) |
| 4 Vehicles | 2 (2.2%) | 6 (7.1%) |
| 5 or more Vehicles | 8 (9.0%) | 13 (15.5%) |
| Total | 89 (100.0%) | 84 (100.0%) |
Commute Time in Rocky Ridge
The most frequently occuring commute durations in Rocky Ridge are 30 to 34 minutes (50 commuters, 29.2%), 5 to 9 minutes (29 commuters, 17.0%), and 20 to 24 minutes (22 commuters, 12.9%).
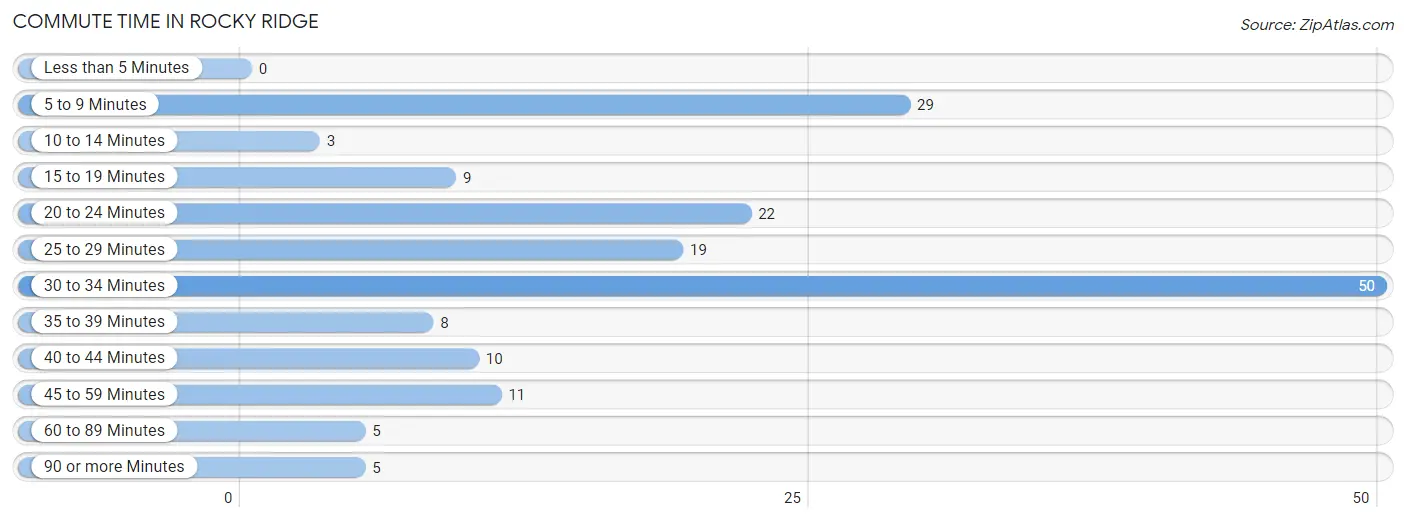
| Commute Time | # Commuters | % Commuters |
| Less than 5 Minutes | 0 | 0.0% |
| 5 to 9 Minutes | 29 | 17.0% |
| 10 to 14 Minutes | 3 | 1.8% |
| 15 to 19 Minutes | 9 | 5.3% |
| 20 to 24 Minutes | 22 | 12.9% |
| 25 to 29 Minutes | 19 | 11.1% |
| 30 to 34 Minutes | 50 | 29.2% |
| 35 to 39 Minutes | 8 | 4.7% |
| 40 to 44 Minutes | 10 | 5.9% |
| 45 to 59 Minutes | 11 | 6.4% |
| 60 to 89 Minutes | 5 | 2.9% |
| 90 or more Minutes | 5 | 2.9% |
Commute Time by Sex in Rocky Ridge
The most common commute times in Rocky Ridge are 30 to 34 minutes (29 commuters, 32.6%) for males and 30 to 34 minutes (21 commuters, 25.6%) for females.
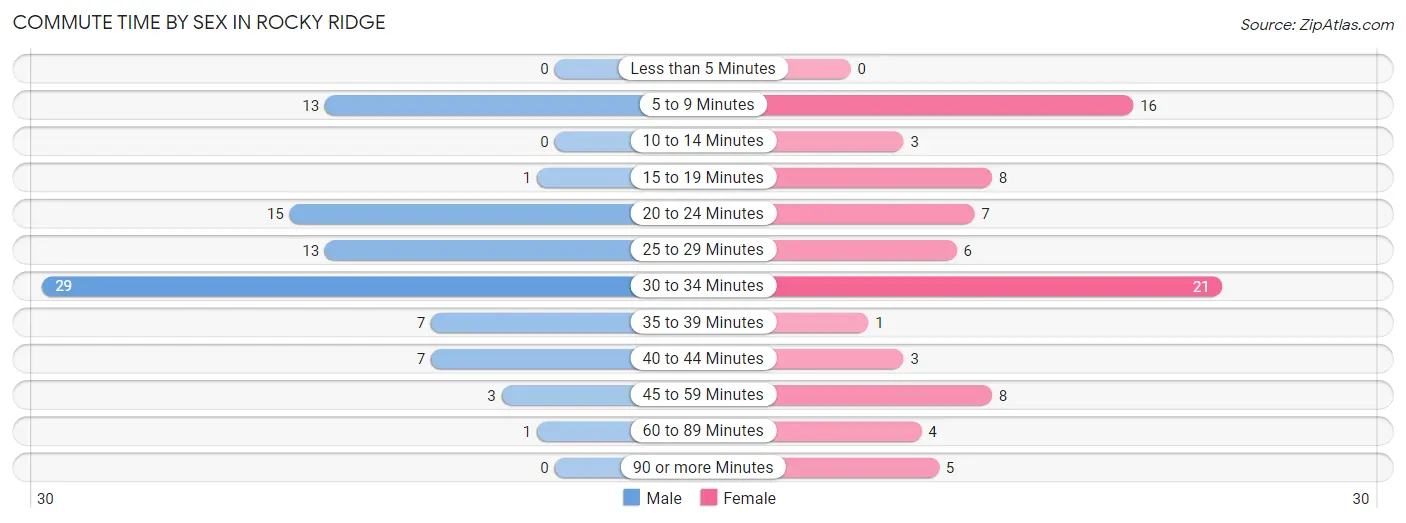
| Commute Time | Male | Female |
| Less than 5 Minutes | 0 (0.0%) | 0 (0.0%) |
| 5 to 9 Minutes | 13 (14.6%) | 16 (19.5%) |
| 10 to 14 Minutes | 0 (0.0%) | 3 (3.7%) |
| 15 to 19 Minutes | 1 (1.1%) | 8 (9.8%) |
| 20 to 24 Minutes | 15 (16.9%) | 7 (8.5%) |
| 25 to 29 Minutes | 13 (14.6%) | 6 (7.3%) |
| 30 to 34 Minutes | 29 (32.6%) | 21 (25.6%) |
| 35 to 39 Minutes | 7 (7.9%) | 1 (1.2%) |
| 40 to 44 Minutes | 7 (7.9%) | 3 (3.7%) |
| 45 to 59 Minutes | 3 (3.4%) | 8 (9.8%) |
| 60 to 89 Minutes | 1 (1.1%) | 4 (4.9%) |
| 90 or more Minutes | 0 (0.0%) | 5 (6.1%) |
Time of Departure to Work by Sex in Rocky Ridge
The most frequent times of departure to work in Rocky Ridge are 8:00 AM to 8:29 AM (20, 22.5%) for males and 5:30 AM to 5:59 AM (19, 23.2%) for females.
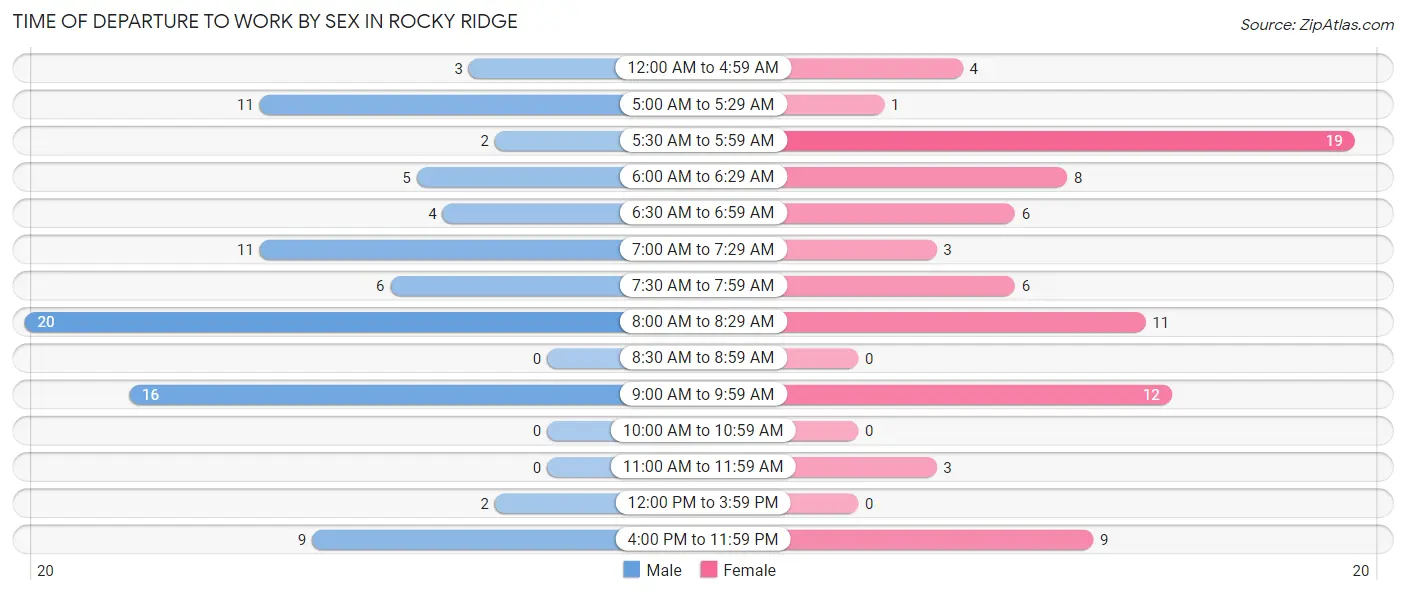
| Time of Departure | Male | Female |
| 12:00 AM to 4:59 AM | 3 (3.4%) | 4 (4.9%) |
| 5:00 AM to 5:29 AM | 11 (12.4%) | 1 (1.2%) |
| 5:30 AM to 5:59 AM | 2 (2.2%) | 19 (23.2%) |
| 6:00 AM to 6:29 AM | 5 (5.6%) | 8 (9.8%) |
| 6:30 AM to 6:59 AM | 4 (4.5%) | 6 (7.3%) |
| 7:00 AM to 7:29 AM | 11 (12.4%) | 3 (3.7%) |
| 7:30 AM to 7:59 AM | 6 (6.7%) | 6 (7.3%) |
| 8:00 AM to 8:29 AM | 20 (22.5%) | 11 (13.4%) |
| 8:30 AM to 8:59 AM | 0 (0.0%) | 0 (0.0%) |
| 9:00 AM to 9:59 AM | 16 (18.0%) | 12 (14.6%) |
| 10:00 AM to 10:59 AM | 0 (0.0%) | 0 (0.0%) |
| 11:00 AM to 11:59 AM | 0 (0.0%) | 3 (3.7%) |
| 12:00 PM to 3:59 PM | 2 (2.2%) | 0 (0.0%) |
| 4:00 PM to 11:59 PM | 9 (10.1%) | 9 (11.0%) |
| Total | 89 (100.0%) | 82 (100.0%) |
Housing Occupancy in Rocky Ridge
Occupancy by Ownership in Rocky Ridge
Of the total 139 dwellings in Rocky Ridge, owner-occupied units account for 108 (77.7%), while renter-occupied units make up 31 (22.3%).
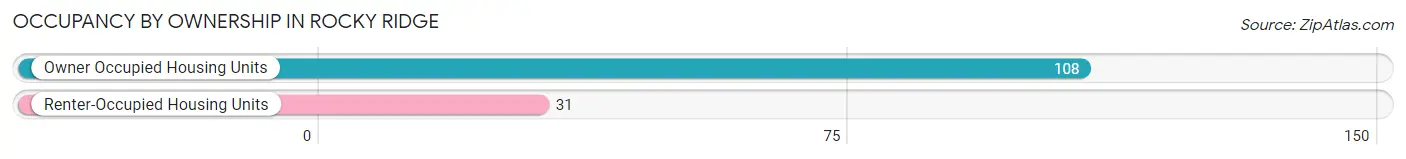
| Occupancy | # Housing Units | % Housing Units |
| Owner Occupied Housing Units | 108 | 77.7% |
| Renter-Occupied Housing Units | 31 | 22.3% |
| Total Occupied Housing Units | 139 | 100.0% |
Occupancy by Household Size in Rocky Ridge
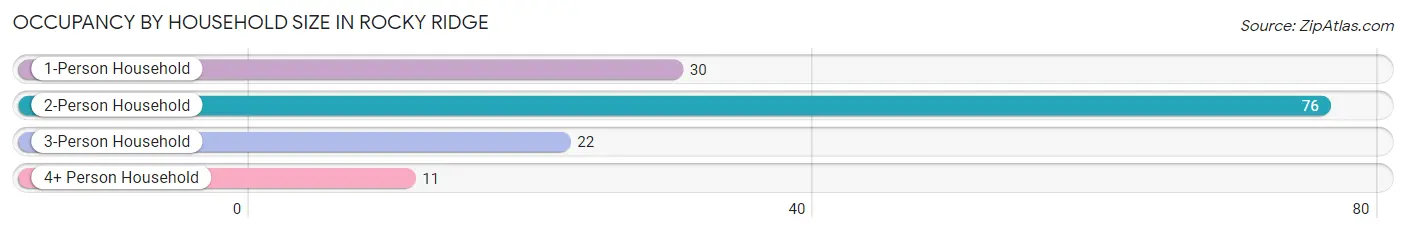
| Household Size | # Housing Units | % Housing Units |
| 1-Person Household | 30 | 21.6% |
| 2-Person Household | 76 | 54.7% |
| 3-Person Household | 22 | 15.8% |
| 4+ Person Household | 11 | 7.9% |
| Total Housing Units | 139 | 100.0% |
Occupancy by Ownership by Household Size in Rocky Ridge
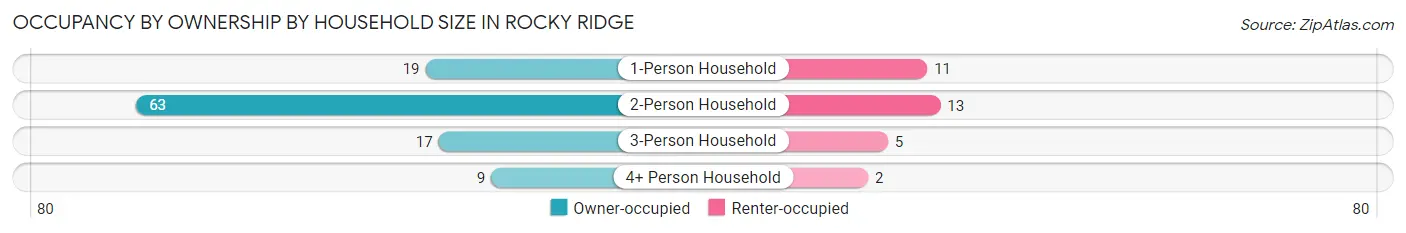
| Household Size | Owner-occupied | Renter-occupied |
| 1-Person Household | 19 (63.3%) | 11 (36.7%) |
| 2-Person Household | 63 (82.9%) | 13 (17.1%) |
| 3-Person Household | 17 (77.3%) | 5 (22.7%) |
| 4+ Person Household | 9 (81.8%) | 2 (18.2%) |
| Total Housing Units | 108 (77.7%) | 31 (22.3%) |
Occupancy by Educational Attainment in Rocky Ridge
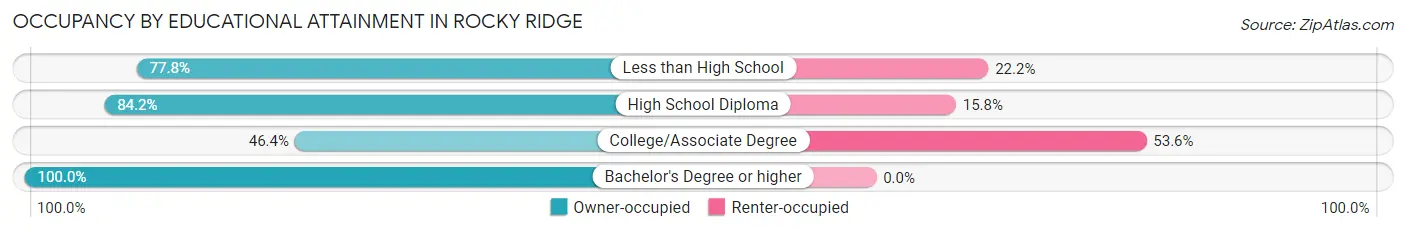
| Household Size | Owner-occupied | Renter-occupied |
| Less than High School | 14 (77.8%) | 4 (22.2%) |
| High School Diploma | 64 (84.2%) | 12 (15.8%) |
| College/Associate Degree | 13 (46.4%) | 15 (53.6%) |
| Bachelor's Degree or higher | 17 (100.0%) | 0 (0.0%) |
Occupancy by Age of Householder in Rocky Ridge
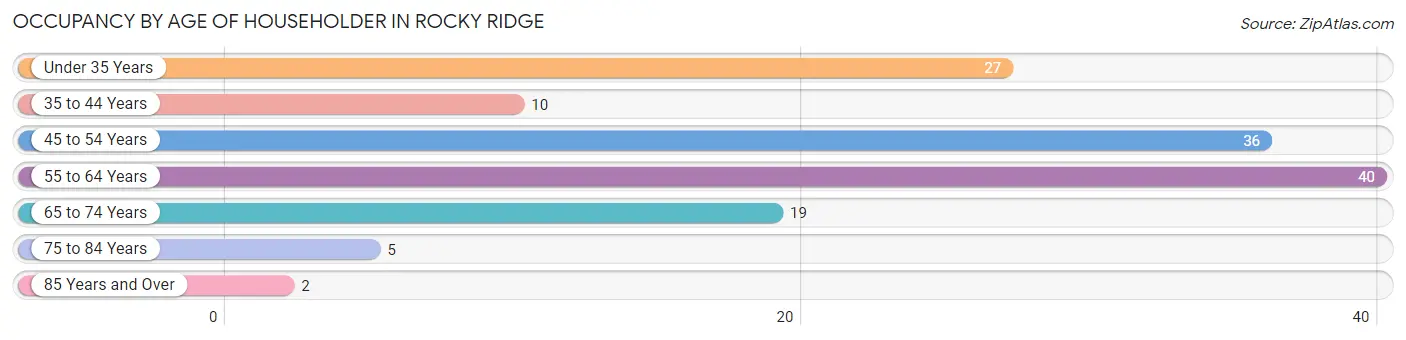
| Age Bracket | # Households | % Households |
| Under 35 Years | 27 | 19.4% |
| 35 to 44 Years | 10 | 7.2% |
| 45 to 54 Years | 36 | 25.9% |
| 55 to 64 Years | 40 | 28.8% |
| 65 to 74 Years | 19 | 13.7% |
| 75 to 84 Years | 5 | 3.6% |
| 85 Years and Over | 2 | 1.4% |
| Total | 139 | 100.0% |
Housing Finances in Rocky Ridge
Median Income by Occupancy in Rocky Ridge
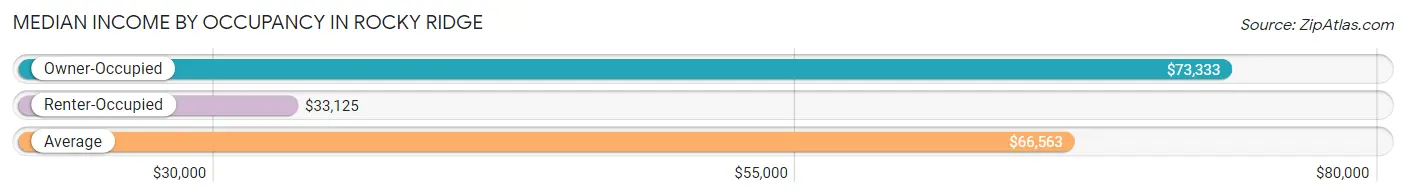
| Occupancy Type | # Households | Median Income |
| Owner-Occupied | 108 (77.7%) | $73,333 |
| Renter-Occupied | 31 (22.3%) | $33,125 |
| Average | 139 (100.0%) | $66,563 |
Occupancy by Householder Income Bracket in Rocky Ridge
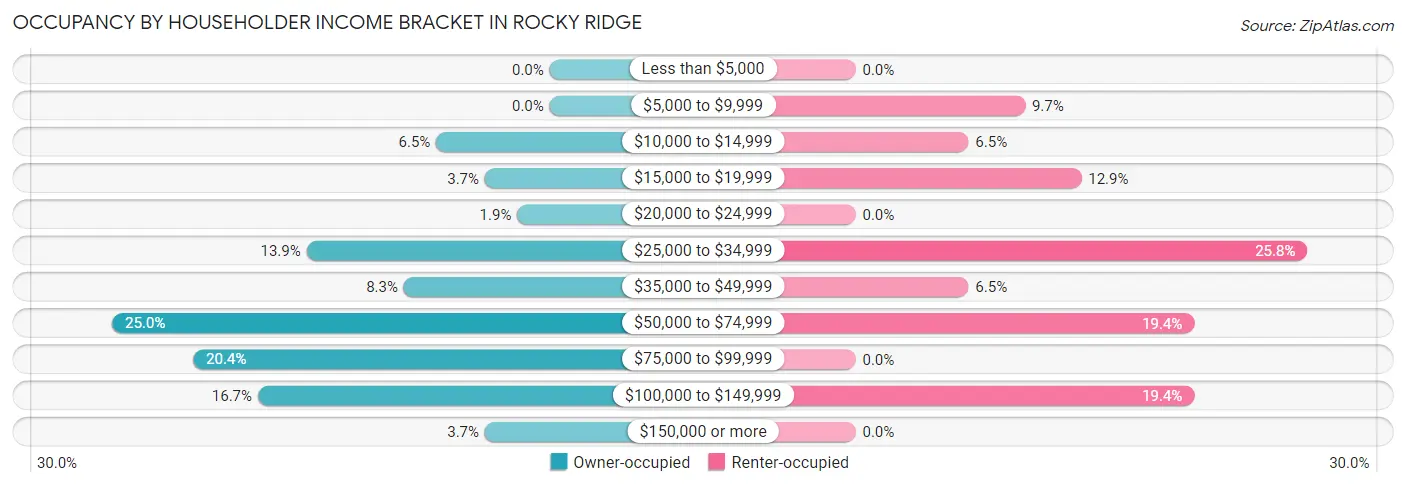
| Income Bracket | Owner-occupied | Renter-occupied |
| Less than $5,000 | 0 (0.0%) | 0 (0.0%) |
| $5,000 to $9,999 | 0 (0.0%) | 3 (9.7%) |
| $10,000 to $14,999 | 7 (6.5%) | 2 (6.5%) |
| $15,000 to $19,999 | 4 (3.7%) | 4 (12.9%) |
| $20,000 to $24,999 | 2 (1.8%) | 0 (0.0%) |
| $25,000 to $34,999 | 15 (13.9%) | 8 (25.8%) |
| $35,000 to $49,999 | 9 (8.3%) | 2 (6.5%) |
| $50,000 to $74,999 | 27 (25.0%) | 6 (19.4%) |
| $75,000 to $99,999 | 22 (20.4%) | 0 (0.0%) |
| $100,000 to $149,999 | 18 (16.7%) | 6 (19.4%) |
| $150,000 or more | 4 (3.7%) | 0 (0.0%) |
| Total | 108 (100.0%) | 31 (100.0%) |
Monthly Housing Cost Tiers in Rocky Ridge
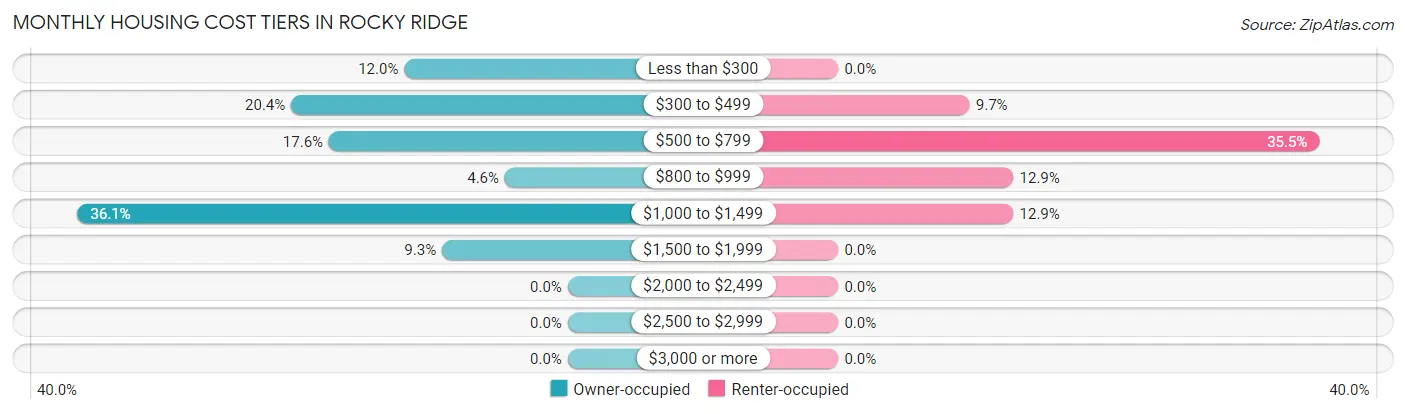
| Monthly Cost | Owner-occupied | Renter-occupied |
| Less than $300 | 13 (12.0%) | 0 (0.0%) |
| $300 to $499 | 22 (20.4%) | 3 (9.7%) |
| $500 to $799 | 19 (17.6%) | 11 (35.5%) |
| $800 to $999 | 5 (4.6%) | 4 (12.9%) |
| $1,000 to $1,499 | 39 (36.1%) | 4 (12.9%) |
| $1,500 to $1,999 | 10 (9.3%) | 0 (0.0%) |
| $2,000 to $2,499 | 0 (0.0%) | 0 (0.0%) |
| $2,500 to $2,999 | 0 (0.0%) | 0 (0.0%) |
| $3,000 or more | 0 (0.0%) | 0 (0.0%) |
| Total | 108 (100.0%) | 31 (100.0%) |
Physical Housing Characteristics in Rocky Ridge
Housing Structures in Rocky Ridge
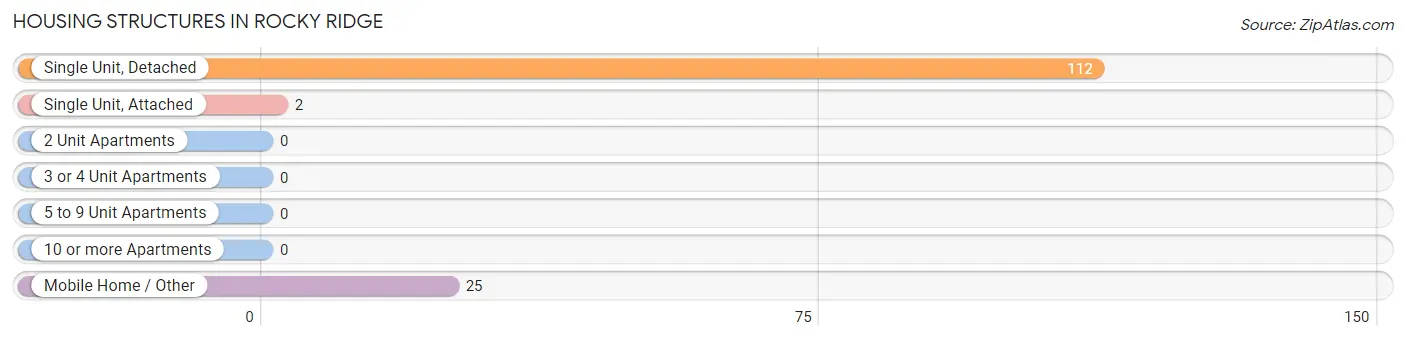
| Structure Type | # Housing Units | % Housing Units |
| Single Unit, Detached | 112 | 80.6% |
| Single Unit, Attached | 2 | 1.4% |
| 2 Unit Apartments | 0 | 0.0% |
| 3 or 4 Unit Apartments | 0 | 0.0% |
| 5 to 9 Unit Apartments | 0 | 0.0% |
| 10 or more Apartments | 0 | 0.0% |
| Mobile Home / Other | 25 | 18.0% |
| Total | 139 | 100.0% |
Housing Structures by Occupancy in Rocky Ridge
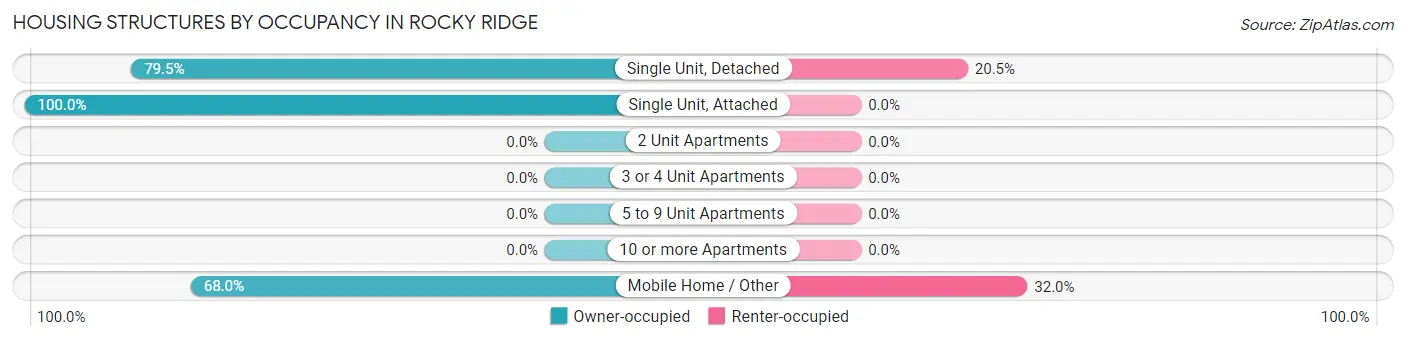
| Structure Type | Owner-occupied | Renter-occupied |
| Single Unit, Detached | 89 (79.5%) | 23 (20.5%) |
| Single Unit, Attached | 2 (100.0%) | 0 (0.0%) |
| 2 Unit Apartments | 0 (0.0%) | 0 (0.0%) |
| 3 or 4 Unit Apartments | 0 (0.0%) | 0 (0.0%) |
| 5 to 9 Unit Apartments | 0 (0.0%) | 0 (0.0%) |
| 10 or more Apartments | 0 (0.0%) | 0 (0.0%) |
| Mobile Home / Other | 17 (68.0%) | 8 (32.0%) |
| Total | 108 (77.7%) | 31 (22.3%) |
Housing Structures by Number of Rooms in Rocky Ridge
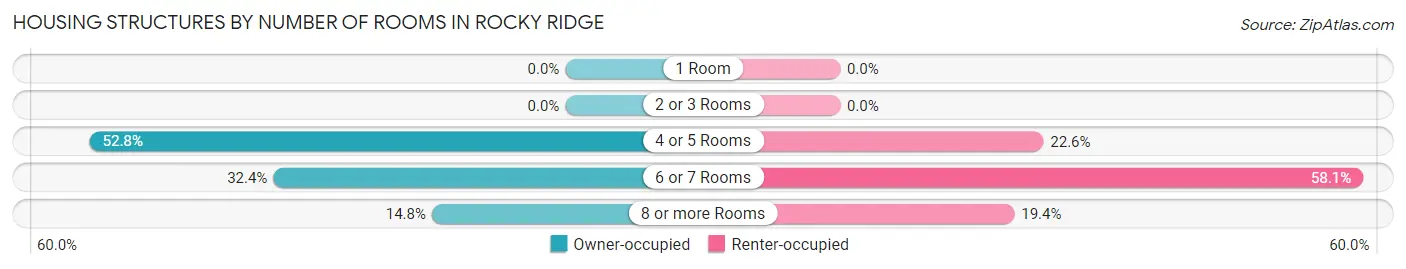
| Number of Rooms | Owner-occupied | Renter-occupied |
| 1 Room | 0 (0.0%) | 0 (0.0%) |
| 2 or 3 Rooms | 0 (0.0%) | 0 (0.0%) |
| 4 or 5 Rooms | 57 (52.8%) | 7 (22.6%) |
| 6 or 7 Rooms | 35 (32.4%) | 18 (58.1%) |
| 8 or more Rooms | 16 (14.8%) | 6 (19.4%) |
| Total | 108 (100.0%) | 31 (100.0%) |
Housing Structure by Heating Type in Rocky Ridge
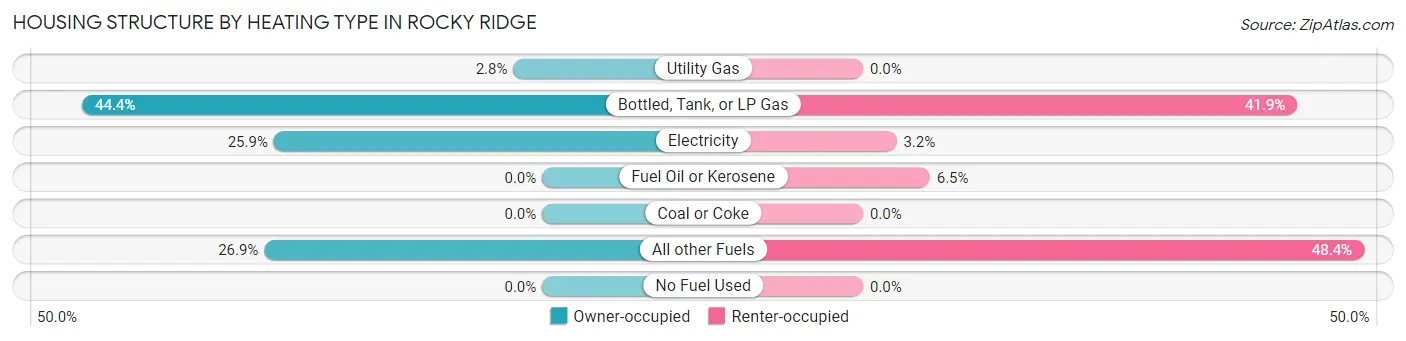
| Heating Type | Owner-occupied | Renter-occupied |
| Utility Gas | 3 (2.8%) | 0 (0.0%) |
| Bottled, Tank, or LP Gas | 48 (44.4%) | 13 (41.9%) |
| Electricity | 28 (25.9%) | 1 (3.2%) |
| Fuel Oil or Kerosene | 0 (0.0%) | 2 (6.5%) |
| Coal or Coke | 0 (0.0%) | 0 (0.0%) |
| All other Fuels | 29 (26.9%) | 15 (48.4%) |
| No Fuel Used | 0 (0.0%) | 0 (0.0%) |
| Total | 108 (100.0%) | 31 (100.0%) |
Household Vehicle Usage in Rocky Ridge
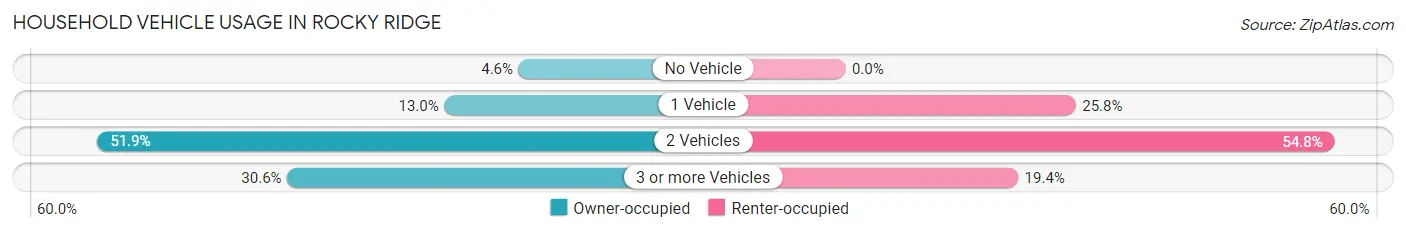
| Vehicles per Household | Owner-occupied | Renter-occupied |
| No Vehicle | 5 (4.6%) | 0 (0.0%) |
| 1 Vehicle | 14 (13.0%) | 8 (25.8%) |
| 2 Vehicles | 56 (51.8%) | 17 (54.8%) |
| 3 or more Vehicles | 33 (30.6%) | 6 (19.4%) |
| Total | 108 (100.0%) | 31 (100.0%) |
Real Estate & Mortgages in Rocky Ridge
Real Estate and Mortgage Overview in Rocky Ridge
| Characteristic | Without Mortgage | With Mortgage |
| Housing Units | 52 | 56 |
| Median Property Value | $90,000 | $112,500 |
| Median Household Income | $41,250 | $4 |
| Monthly Housing Costs | $431 | $0 |
| Real Estate Taxes | $1,077 | $0 |
Property Value by Mortgage Status in Rocky Ridge
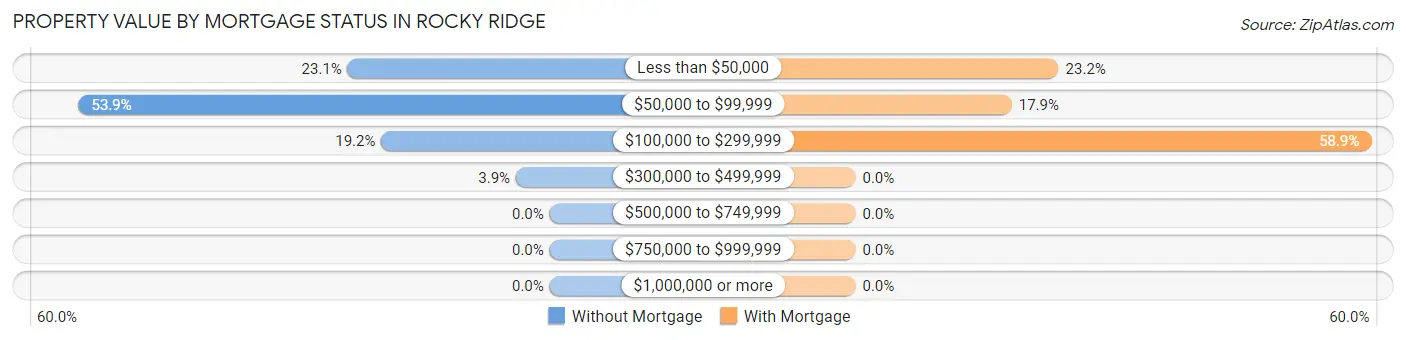
| Property Value | Without Mortgage | With Mortgage |
| Less than $50,000 | 12 (23.1%) | 13 (23.2%) |
| $50,000 to $99,999 | 28 (53.8%) | 10 (17.9%) |
| $100,000 to $299,999 | 10 (19.2%) | 33 (58.9%) |
| $300,000 to $499,999 | 2 (3.8%) | 0 (0.0%) |
| $500,000 to $749,999 | 0 (0.0%) | 0 (0.0%) |
| $750,000 to $999,999 | 0 (0.0%) | 0 (0.0%) |
| $1,000,000 or more | 0 (0.0%) | 0 (0.0%) |
| Total | 52 (100.0%) | 56 (100.0%) |
Household Income by Mortgage Status in Rocky Ridge
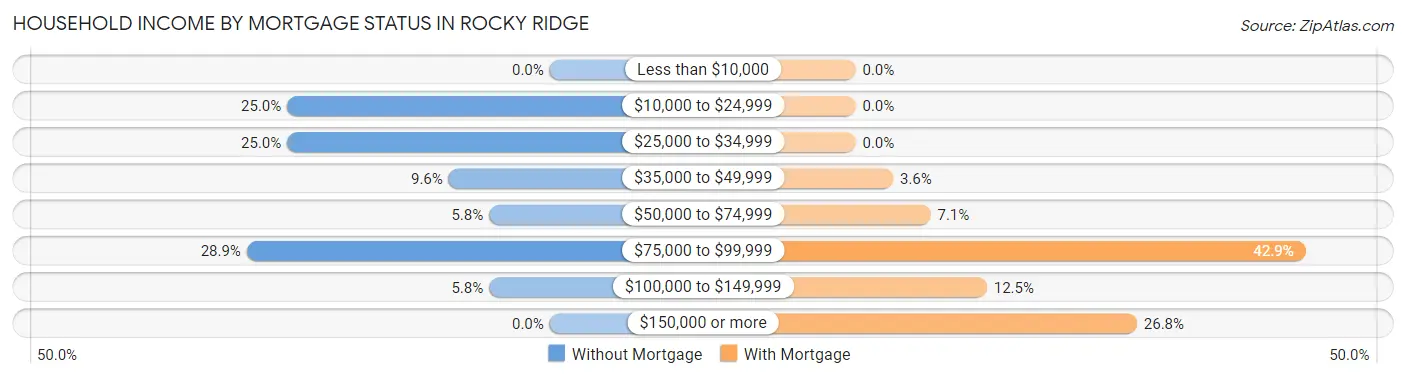
| Household Income | Without Mortgage | With Mortgage |
| Less than $10,000 | 0 (0.0%) | 0 (0.0%) |
| $10,000 to $24,999 | 13 (25.0%) | 0 (0.0%) |
| $25,000 to $34,999 | 13 (25.0%) | 0 (0.0%) |
| $35,000 to $49,999 | 5 (9.6%) | 2 (3.6%) |
| $50,000 to $74,999 | 3 (5.8%) | 4 (7.1%) |
| $75,000 to $99,999 | 15 (28.8%) | 24 (42.9%) |
| $100,000 to $149,999 | 3 (5.8%) | 7 (12.5%) |
| $150,000 or more | 0 (0.0%) | 15 (26.8%) |
| Total | 52 (100.0%) | 56 (100.0%) |
Property Value to Household Income Ratio in Rocky Ridge
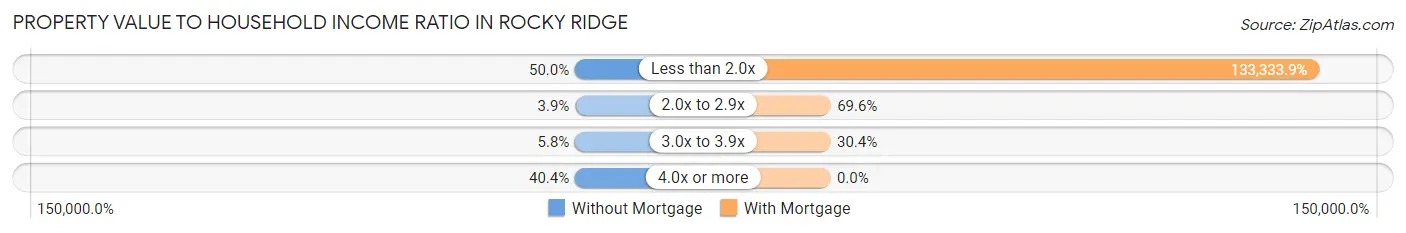
| Value-to-Income Ratio | Without Mortgage | With Mortgage |
| Less than 2.0x | 26 (50.0%) | 74,667 (133,333.9%) |
| 2.0x to 2.9x | 2 (3.8%) | 39 (69.6%) |
| 3.0x to 3.9x | 3 (5.8%) | 17 (30.4%) |
| 4.0x or more | 21 (40.4%) | 0 (0.0%) |
| Total | 52 (100.0%) | 56 (100.0%) |
Real Estate Taxes by Mortgage Status in Rocky Ridge
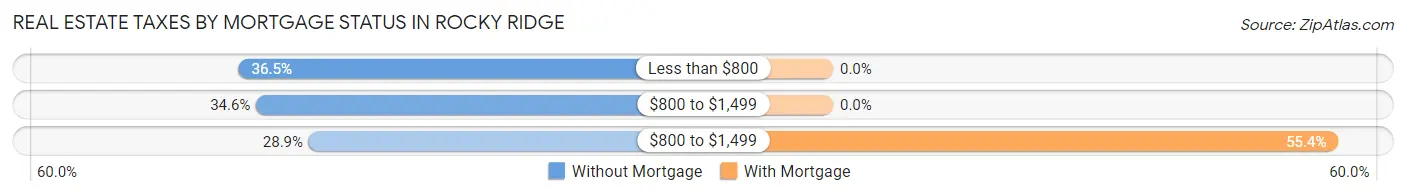
| Property Taxes | Without Mortgage | With Mortgage |
| Less than $800 | 19 (36.5%) | 0 (0.0%) |
| $800 to $1,499 | 18 (34.6%) | 0 (0.0%) |
| $800 to $1,499 | 15 (28.8%) | 31 (55.4%) |
| Total | 52 (100.0%) | 56 (100.0%) |
Health & Disability in Rocky Ridge
Health Insurance Coverage by Age in Rocky Ridge
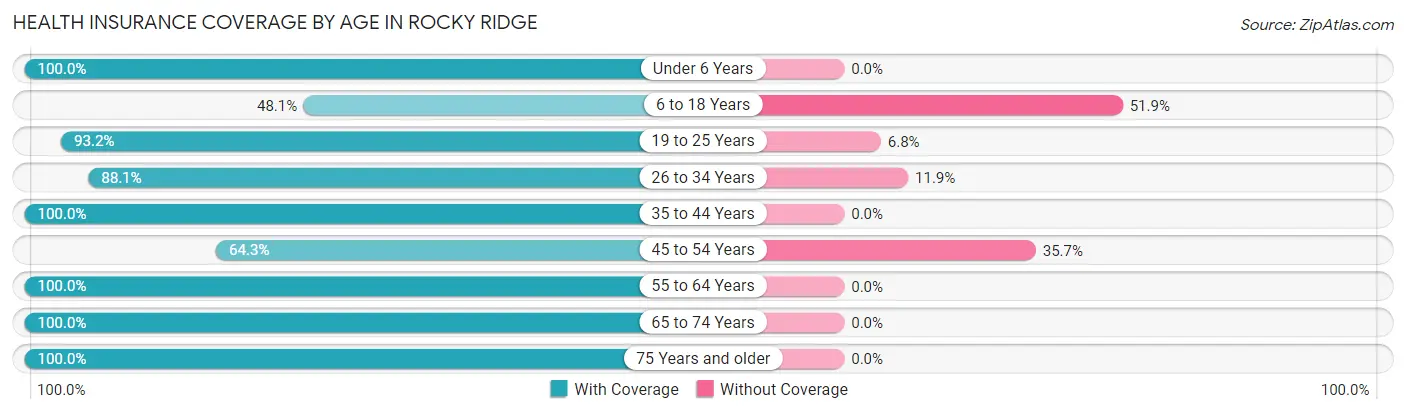
| Age Bracket | With Coverage | Without Coverage |
| Under 6 Years | 11 (100.0%) | 0 (0.0%) |
| 6 to 18 Years | 25 (48.1%) | 27 (51.9%) |
| 19 to 25 Years | 41 (93.2%) | 3 (6.8%) |
| 26 to 34 Years | 37 (88.1%) | 5 (11.9%) |
| 35 to 44 Years | 21 (100.0%) | 0 (0.0%) |
| 45 to 54 Years | 36 (64.3%) | 20 (35.7%) |
| 55 to 64 Years | 61 (100.0%) | 0 (0.0%) |
| 65 to 74 Years | 25 (100.0%) | 0 (0.0%) |
| 75 Years and older | 11 (100.0%) | 0 (0.0%) |
| Total | 268 (83.0%) | 55 (17.0%) |
Health Insurance Coverage by Citizenship Status in Rocky Ridge
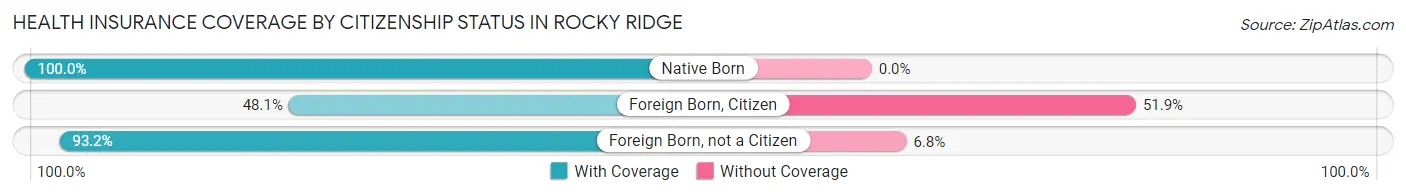
| Citizenship Status | With Coverage | Without Coverage |
| Native Born | 11 (100.0%) | 0 (0.0%) |
| Foreign Born, Citizen | 25 (48.1%) | 27 (51.9%) |
| Foreign Born, not a Citizen | 41 (93.2%) | 3 (6.8%) |
Health Insurance Coverage by Household Income in Rocky Ridge
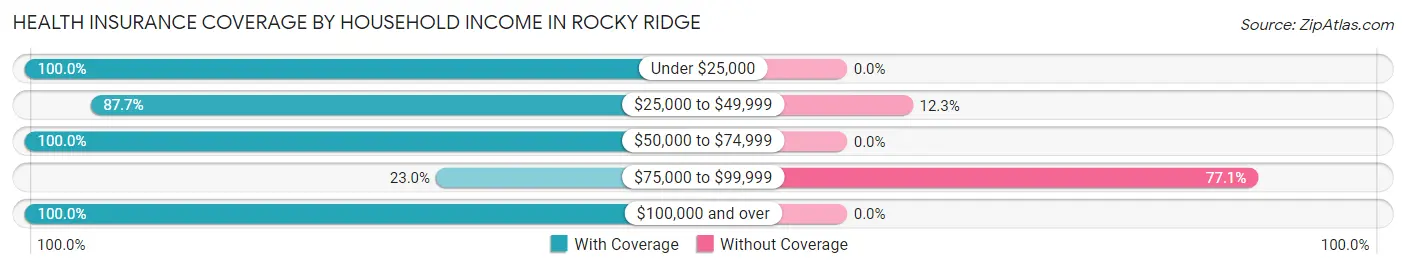
| Household Income | With Coverage | Without Coverage |
| Under $25,000 | 35 (100.0%) | 0 (0.0%) |
| $25,000 to $49,999 | 57 (87.7%) | 8 (12.3%) |
| $50,000 to $74,999 | 70 (100.0%) | 0 (0.0%) |
| $75,000 to $99,999 | 14 (23.0%) | 47 (77.0%) |
| $100,000 and over | 92 (100.0%) | 0 (0.0%) |
Public vs Private Health Insurance Coverage by Age in Rocky Ridge
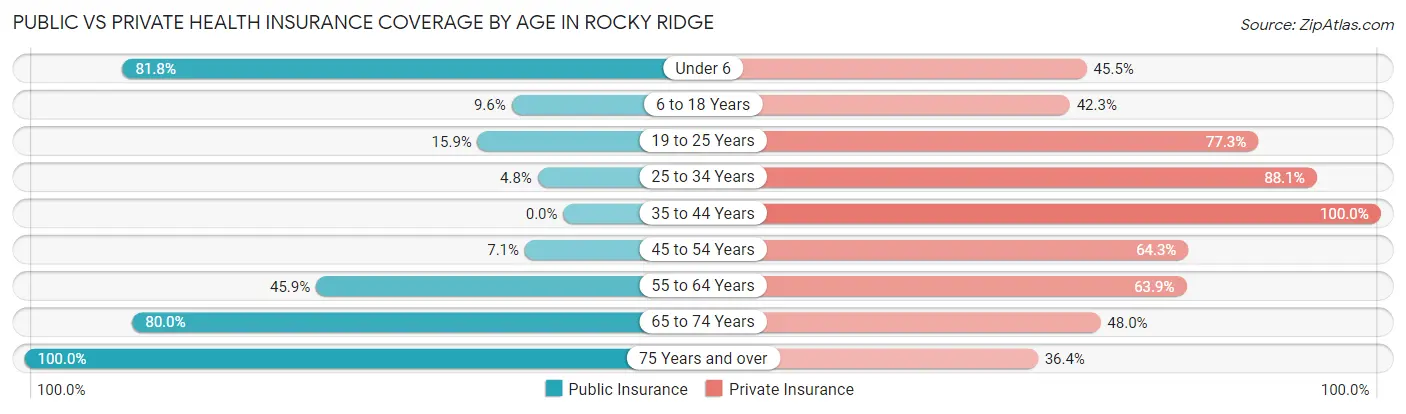
| Age Bracket | Public Insurance | Private Insurance |
| Under 6 | 9 (81.8%) | 5 (45.5%) |
| 6 to 18 Years | 5 (9.6%) | 22 (42.3%) |
| 19 to 25 Years | 7 (15.9%) | 34 (77.3%) |
| 25 to 34 Years | 2 (4.8%) | 37 (88.1%) |
| 35 to 44 Years | 0 (0.0%) | 21 (100.0%) |
| 45 to 54 Years | 4 (7.1%) | 36 (64.3%) |
| 55 to 64 Years | 28 (45.9%) | 39 (63.9%) |
| 65 to 74 Years | 20 (80.0%) | 12 (48.0%) |
| 75 Years and over | 11 (100.0%) | 4 (36.4%) |
| Total | 86 (26.6%) | 210 (65.0%) |
Disability Status by Sex by Age in Rocky Ridge
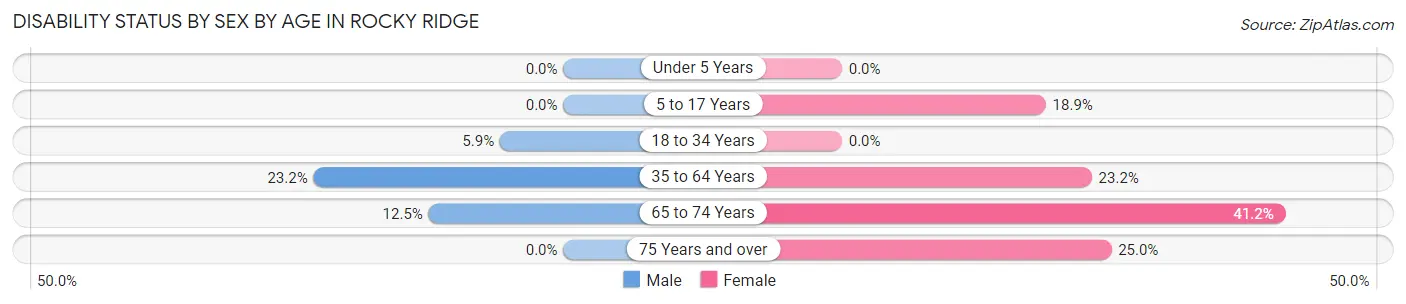
| Age Bracket | Male | Female |
| Under 5 Years | 0 (0.0%) | 0 (0.0%) |
| 5 to 17 Years | 0 (0.0%) | 7 (18.9%) |
| 18 to 34 Years | 3 (5.9%) | 0 (0.0%) |
| 35 to 64 Years | 16 (23.2%) | 16 (23.2%) |
| 65 to 74 Years | 1 (12.5%) | 7 (41.2%) |
| 75 Years and over | 0 (0.0%) | 1 (25.0%) |
Disability Class by Sex by Age in Rocky Ridge
Disability Class: Hearing Difficulty
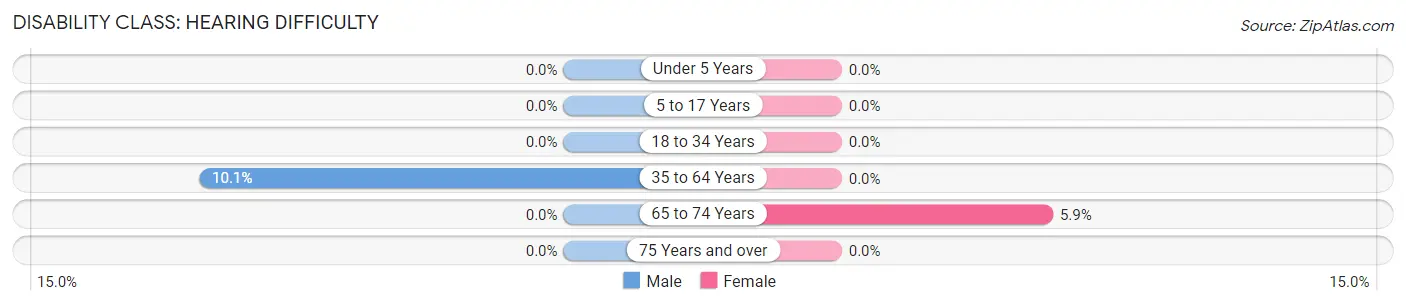
| Age Bracket | Male | Female |
| Under 5 Years | 0 (0.0%) | 0 (0.0%) |
| 5 to 17 Years | 0 (0.0%) | 0 (0.0%) |
| 18 to 34 Years | 0 (0.0%) | 0 (0.0%) |
| 35 to 64 Years | 7 (10.1%) | 0 (0.0%) |
| 65 to 74 Years | 0 (0.0%) | 1 (5.9%) |
| 75 Years and over | 0 (0.0%) | 0 (0.0%) |
Disability Class: Vision Difficulty
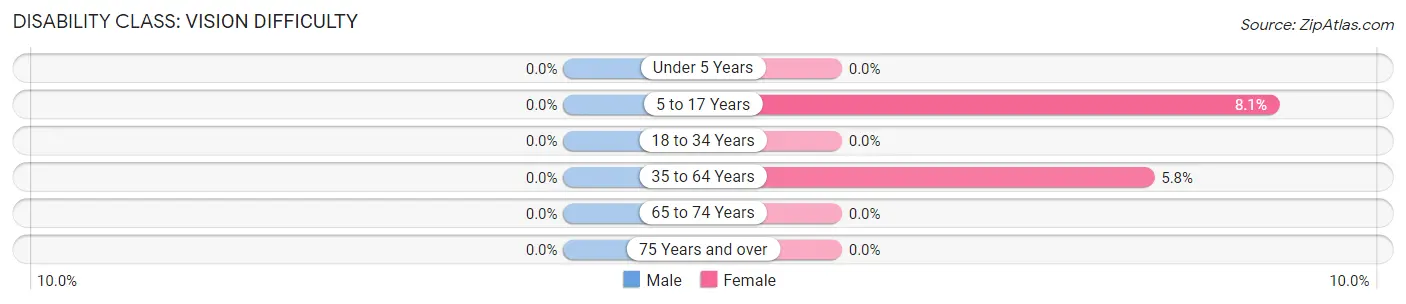
| Age Bracket | Male | Female |
| Under 5 Years | 0 (0.0%) | 0 (0.0%) |
| 5 to 17 Years | 0 (0.0%) | 3 (8.1%) |
| 18 to 34 Years | 0 (0.0%) | 0 (0.0%) |
| 35 to 64 Years | 0 (0.0%) | 4 (5.8%) |
| 65 to 74 Years | 0 (0.0%) | 0 (0.0%) |
| 75 Years and over | 0 (0.0%) | 0 (0.0%) |
Disability Class: Cognitive Difficulty
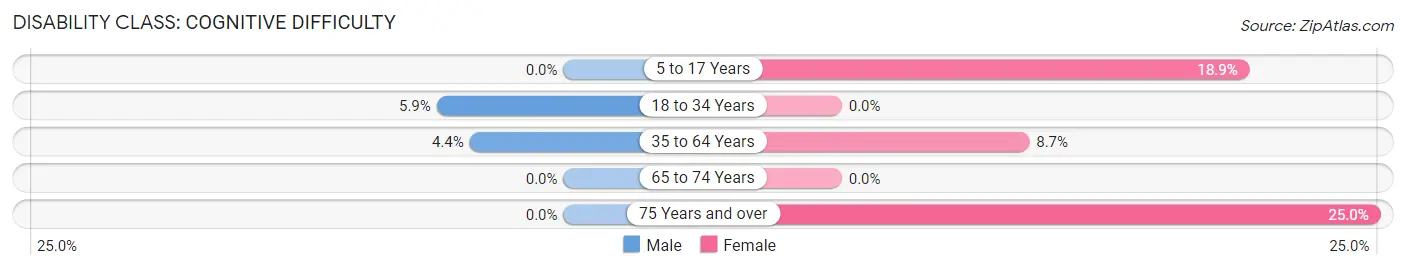
| Age Bracket | Male | Female |
| 5 to 17 Years | 0 (0.0%) | 7 (18.9%) |
| 18 to 34 Years | 3 (5.9%) | 0 (0.0%) |
| 35 to 64 Years | 3 (4.3%) | 6 (8.7%) |
| 65 to 74 Years | 0 (0.0%) | 0 (0.0%) |
| 75 Years and over | 0 (0.0%) | 1 (25.0%) |
Disability Class: Ambulatory Difficulty
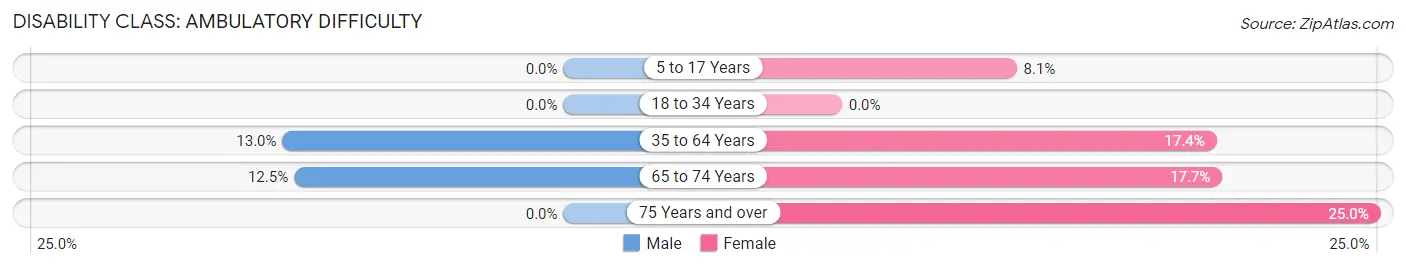
| Age Bracket | Male | Female |
| 5 to 17 Years | 0 (0.0%) | 3 (8.1%) |
| 18 to 34 Years | 0 (0.0%) | 0 (0.0%) |
| 35 to 64 Years | 9 (13.0%) | 12 (17.4%) |
| 65 to 74 Years | 1 (12.5%) | 3 (17.6%) |
| 75 Years and over | 0 (0.0%) | 1 (25.0%) |
Disability Class: Self-Care Difficulty
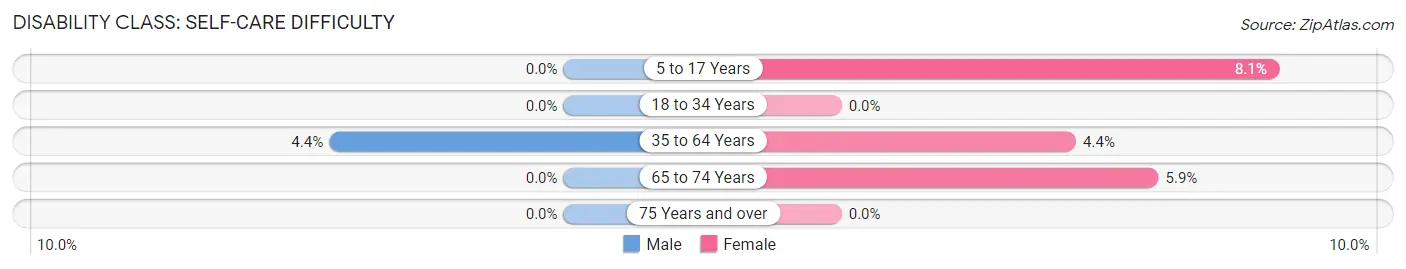
| Age Bracket | Male | Female |
| 5 to 17 Years | 0 (0.0%) | 3 (8.1%) |
| 18 to 34 Years | 0 (0.0%) | 0 (0.0%) |
| 35 to 64 Years | 3 (4.3%) | 3 (4.3%) |
| 65 to 74 Years | 0 (0.0%) | 1 (5.9%) |
| 75 Years and over | 0 (0.0%) | 0 (0.0%) |
Technology Access in Rocky Ridge
Computing Device Access in Rocky Ridge
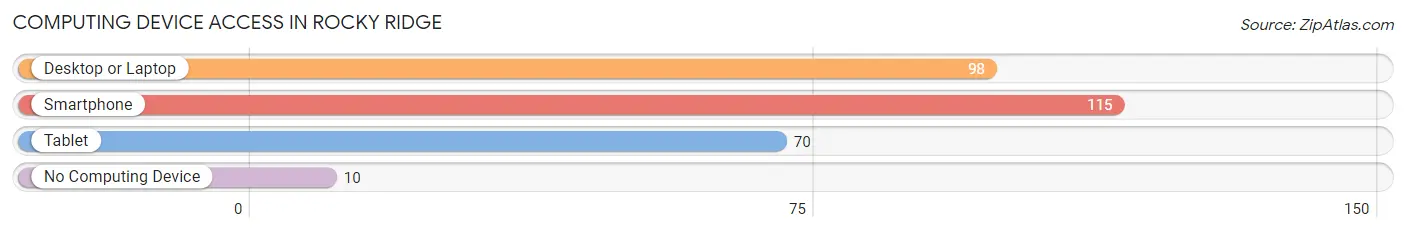
| Device Type | # Households | % Households |
| Desktop or Laptop | 98 | 70.5% |
| Smartphone | 115 | 82.7% |
| Tablet | 70 | 50.4% |
| No Computing Device | 10 | 7.2% |
| Total | 139 | 100.0% |
Internet Access in Rocky Ridge
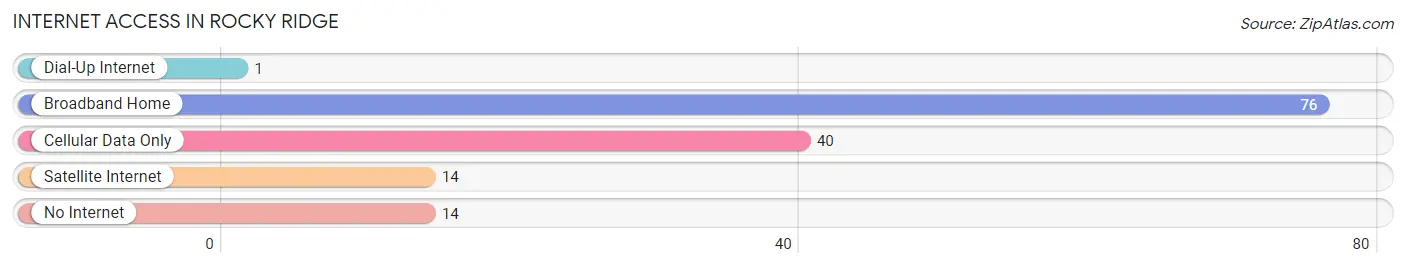
| Internet Type | # Households | % Households |
| Dial-Up Internet | 1 | 0.7% |
| Broadband Home | 76 | 54.7% |
| Cellular Data Only | 40 | 28.8% |
| Satellite Internet | 14 | 10.1% |
| No Internet | 14 | 10.1% |
| Total | 139 | 100.0% |
Rocky Ridge Summary
Rocky Ridge, Ohio is a small village located in the northwest corner of Fulton County, Ohio. The village is situated on the banks of the Maumee River, and is surrounded by rolling hills and farmland. The village was founded in 1837 and has a population of approximately 500 people.
History
Rocky Ridge was founded in 1837 by a group of settlers from Pennsylvania. The settlers were looking for a place to settle and start a new life, and they found it in Rocky Ridge. The village was named after the rocky ridge that runs through the area. The settlers built a small log cabin and began to farm the land. The village grew slowly over the years, and by the late 1800s, it had become a thriving community.
The village was home to a variety of businesses, including a general store, a blacksmith shop, a sawmill, and a gristmill. The village also had a post office, a school, and a church. The village was a popular destination for travelers, and it was known for its hospitality and friendly atmosphere.
In the early 1900s, the village began to decline. The population began to dwindle, and many of the businesses closed. The village was eventually abandoned, and by the 1950s, it was a ghost town.
In the late 1970s, the village was rediscovered by a group of local residents who wanted to restore it to its former glory. They began to restore the buildings and the village was eventually re-inhabited. Today, Rocky Ridge is a small, quiet village with a population of approximately 500 people.
Geography
Rocky Ridge is located in the northwest corner of Fulton County, Ohio. The village is situated on the banks of the Maumee River, and is surrounded by rolling hills and farmland. The village is located approximately 25 miles from Toledo, Ohio, and is close to the Michigan border.
The village is located in a rural area, and is surrounded by small towns and villages. The nearest major city is Toledo, which is approximately 25 miles away. The village is also close to the Michigan border, and is within driving distance of Detroit and other major cities in Michigan.
Economy
The economy of Rocky Ridge is largely based on agriculture. The village is surrounded by farmland, and many of the residents are involved in farming and related activities. The village also has a few small businesses, including a general store, a restaurant, and a few other small shops.
The village is also home to a few small manufacturing companies, which produce a variety of products, including furniture and clothing. The village is also home to a few small service businesses, such as a barber shop and a beauty salon.
Demographics
The population of Rocky Ridge is approximately 500 people. The village is predominantly white, with a small minority population. The median age of the population is approximately 40 years old. The median household income is approximately $50,000 per year.
The village is home to a variety of religious denominations, including Catholic, Protestant, and Jewish. The village is also home to a variety of cultural and recreational activities, including a community theater, a library, and a variety of parks and trails.
Conclusion
Rocky Ridge, Ohio is a small village located in the northwest corner of Fulton County, Ohio. The village was founded in 1837 and has a population of approximately 500 people. The village is situated on the banks of the Maumee River, and is surrounded by rolling hills and farmland. The economy of Rocky Ridge is largely based on agriculture, and the village is home to a variety of religious denominations and cultural and recreational activities.
Common Questions
What is the Total Population of Rocky Ridge?
Total Population of Rocky Ridge is 323.
What is the Total Male Population of Rocky Ridge?
Total Male Population of Rocky Ridge is 158.
What is the Total Female Population of Rocky Ridge?
Total Female Population of Rocky Ridge is 165.
What is the Ratio of Males per 100 Females in Rocky Ridge?
There are 95.76 Males per 100 Females in Rocky Ridge.
What is the Ratio of Females per 100 Males in Rocky Ridge?
There are 104.43 Females per 100 Males in Rocky Ridge.
What is the Median Population Age in Rocky Ridge?
Median Population Age in Rocky Ridge is 38.1 Years.
What is the Average Family Size in Rocky Ridge
Average Family Size in Rocky Ridge is 2.7 People.
What is the Average Household Size in Rocky Ridge
Average Household Size in Rocky Ridge is 2.3 People.
What is Per Capita Income in Rocky Ridge?
Per Capita income in Rocky Ridge is $29,217.
What is the Median Family Income in Rocky Ridge?
Median Family Income in Rocky Ridge is $49,583.
What is the Median Household income in Rocky Ridge?
Median Household Income in Rocky Ridge is $66,563.
What is Income or Wage Gap in Rocky Ridge?
Income or Wage Gap in Rocky Ridge is 19.1%.
Women in Rocky Ridge earn 80.9 cents for every dollar earned by a man.
What is Inequality or Gini Index in Rocky Ridge?
Inequality or Gini Index in Rocky Ridge is 0.34.
How Large is the Labor Force in Rocky Ridge?
There are 187 People in the Labor Forcein in Rocky Ridge.
What is the Percentage of People in the Labor Force in Rocky Ridge?
64.5% of People are in the Labor Force in Rocky Ridge.
What is the Unemployment Rate in Rocky Ridge?
Unemployment Rate in Rocky Ridge is 7.0%.