Mount Healthy Heights, OH
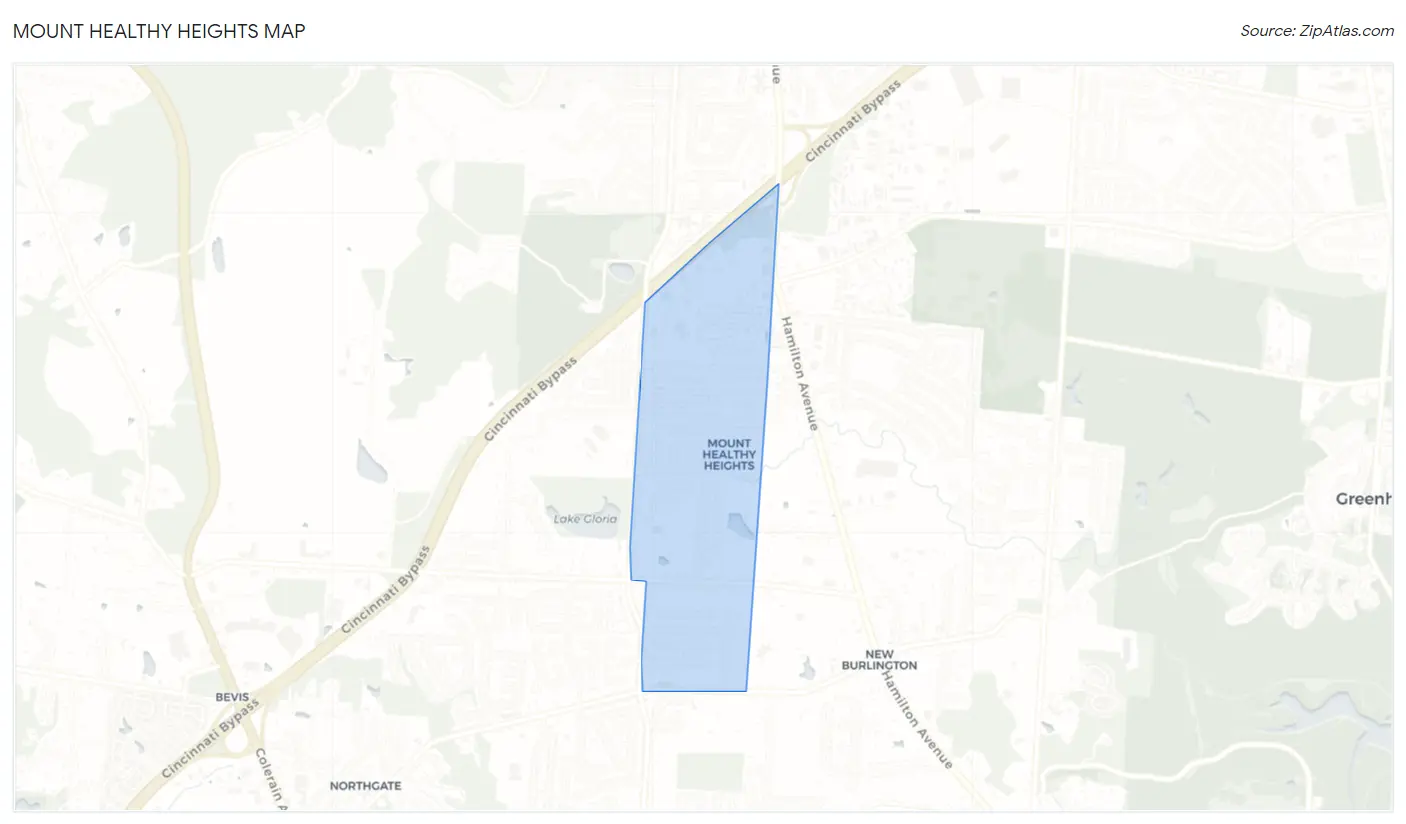
Mount Healthy Heights Map
Mount Healthy Heights Overview
3,135
TOTAL POPULATION
1,573
MALE POPULATION
1,562
FEMALE POPULATION
100.70
MALES / 100 FEMALES
99.30
FEMALES / 100 MALES
29.3
MEDIAN AGE
3.6
AVG FAMILY SIZE
2.8
AVG HOUSEHOLD SIZE
$25,676
PER CAPITA INCOME
$78,378
AVG FAMILY INCOME
$52,089
AVG HOUSEHOLD INCOME
5.4%
WAGE / INCOME GAP [ % ]
94.6¢/ $1
WAGE / INCOME GAP [ $ ]
0.35
INEQUALITY / GINI INDEX
1,451
LABOR FORCE [ PEOPLE ]
75.7%
PERCENT IN LABOR FORCE
7.0%
UNEMPLOYMENT RATE
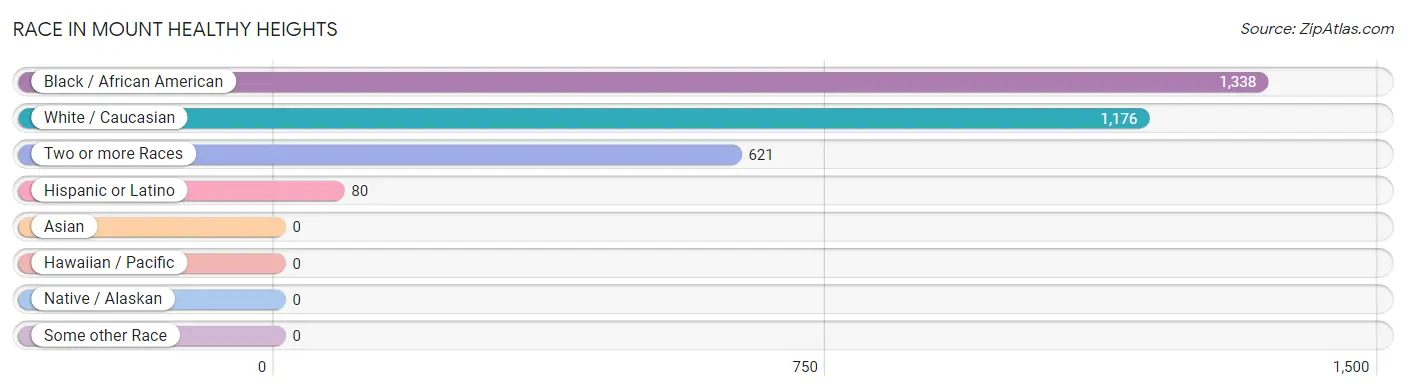
Race in Mount Healthy Heights
The most populous races in Mount Healthy Heights are Black / African American (1,338 | 42.7%), White / Caucasian (1,176 | 37.5%), and Two or more Races (621 | 19.8%).
| Race | # Population | % Population |
| Asian | 0 | 0.0% |
| Black / African American | 1,338 | 42.7% |
| Hawaiian / Pacific | 0 | 0.0% |
| Hispanic or Latino | 80 | 2.5% |
| Native / Alaskan | 0 | 0.0% |
| White / Caucasian | 1,176 | 37.5% |
| Two or more Races | 621 | 19.8% |
| Some other Race | 0 | 0.0% |
| Total | 3,135 | 100.0% |
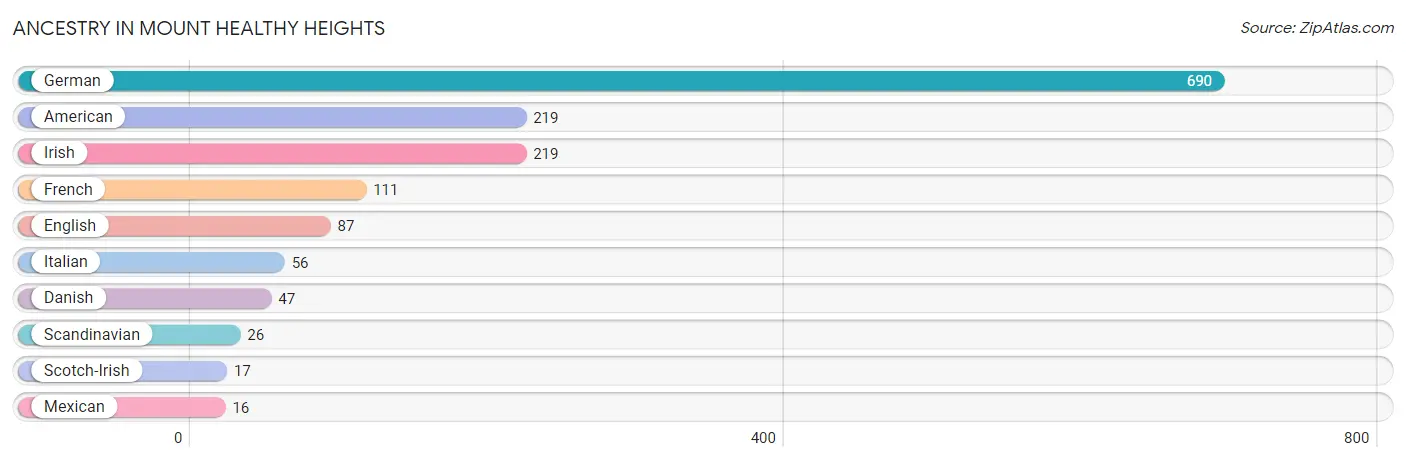
Ancestry in Mount Healthy Heights
The most populous ancestries reported in Mount Healthy Heights are German (690 | 22.0%), American (219 | 7.0%), Irish (219 | 7.0%), French (111 | 3.5%), and English (87 | 2.8%), together accounting for 42.3% of all Mount Healthy Heights residents.
| Ancestry | # Population | % Population |
| American | 219 | 7.0% |
| Danish | 47 | 1.5% |
| English | 87 | 2.8% |
| French | 111 | 3.5% |
| German | 690 | 22.0% |
| Irish | 219 | 7.0% |
| Italian | 56 | 1.8% |
| Mexican | 16 | 0.5% |
| Scandinavian | 26 | 0.8% |
| Scotch-Irish | 17 | 0.5% | View All 10 Rows |
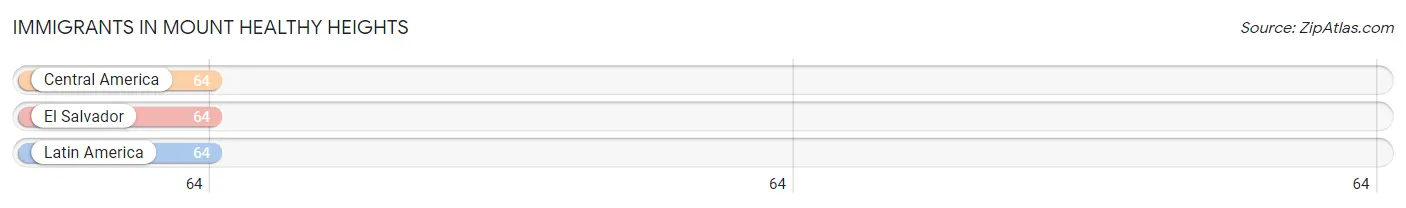
Immigrants in Mount Healthy Heights
The most numerous immigrant groups reported in Mount Healthy Heights came from Central America (64 | 2.0%), El Salvador (64 | 2.0%), and Latin America (64 | 2.0%), together accounting for 6.1% of all Mount Healthy Heights residents.
| Immigration Origin | # Population | % Population |
| Central America | 64 | 2.0% |
| El Salvador | 64 | 2.0% |
| Latin America | 64 | 2.0% | View All 3 Rows |
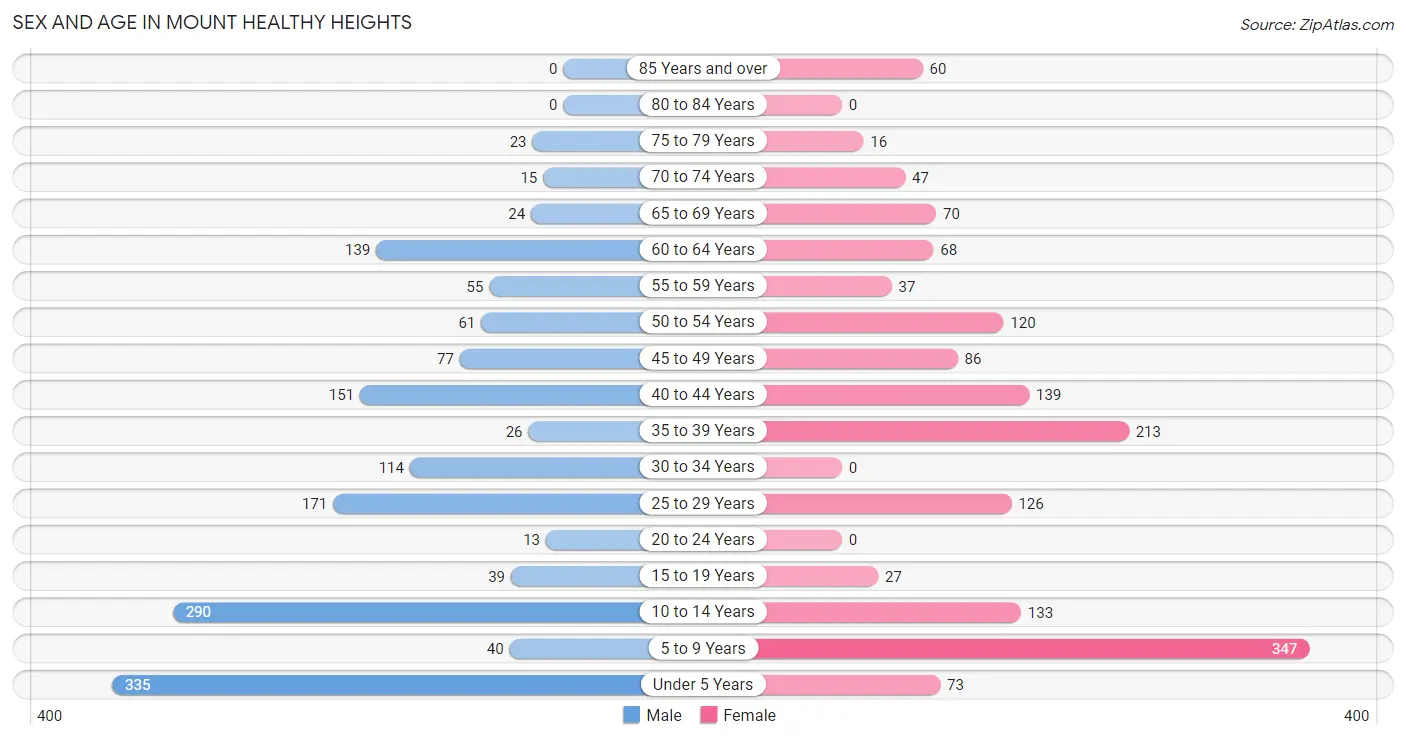
Sex and Age in Mount Healthy Heights
Sex and Age in Mount Healthy Heights
The most populous age groups in Mount Healthy Heights are Under 5 Years (335 | 21.3%) for men and 5 to 9 Years (347 | 22.2%) for women.
| Age Bracket | Male | Female |
| Under 5 Years | 335 (21.3%) | 73 (4.7%) |
| 5 to 9 Years | 40 (2.5%) | 347 (22.2%) |
| 10 to 14 Years | 290 (18.4%) | 133 (8.5%) |
| 15 to 19 Years | 39 (2.5%) | 27 (1.7%) |
| 20 to 24 Years | 13 (0.8%) | 0 (0.0%) |
| 25 to 29 Years | 171 (10.9%) | 126 (8.1%) |
| 30 to 34 Years | 114 (7.2%) | 0 (0.0%) |
| 35 to 39 Years | 26 (1.7%) | 213 (13.6%) |
| 40 to 44 Years | 151 (9.6%) | 139 (8.9%) |
| 45 to 49 Years | 77 (4.9%) | 86 (5.5%) |
| 50 to 54 Years | 61 (3.9%) | 120 (7.7%) |
| 55 to 59 Years | 55 (3.5%) | 37 (2.4%) |
| 60 to 64 Years | 139 (8.8%) | 68 (4.3%) |
| 65 to 69 Years | 24 (1.5%) | 70 (4.5%) |
| 70 to 74 Years | 15 (0.9%) | 47 (3.0%) |
| 75 to 79 Years | 23 (1.5%) | 16 (1.0%) |
| 80 to 84 Years | 0 (0.0%) | 0 (0.0%) |
| 85 Years and over | 0 (0.0%) | 60 (3.8%) |
| Total | 1,573 (100.0%) | 1,562 (100.0%) |
Families and Households in Mount Healthy Heights
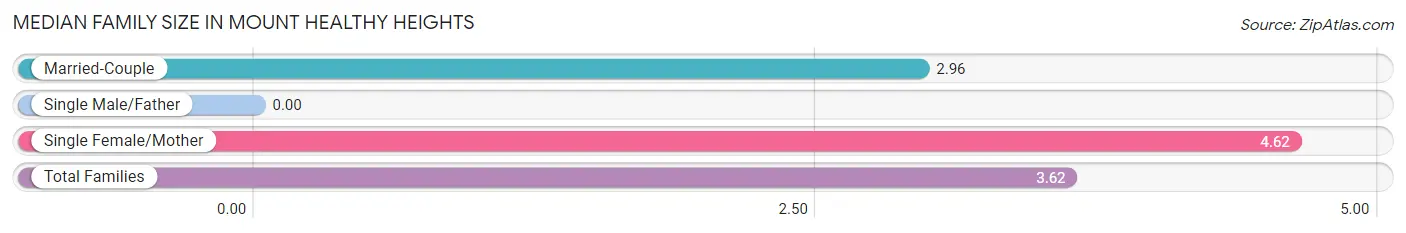
Median Family Size in Mount Healthy Heights
| Family Type | # Families | Family Size |
| Married-Couple | 457 (60.5%) | 2.96 |
| Single Male/Father | 0 (0.0%) | - |
| Single Female/Mother | 299 (39.6%) | 4.62 |
| Total Families | 756 (100.0%) | 3.62 |
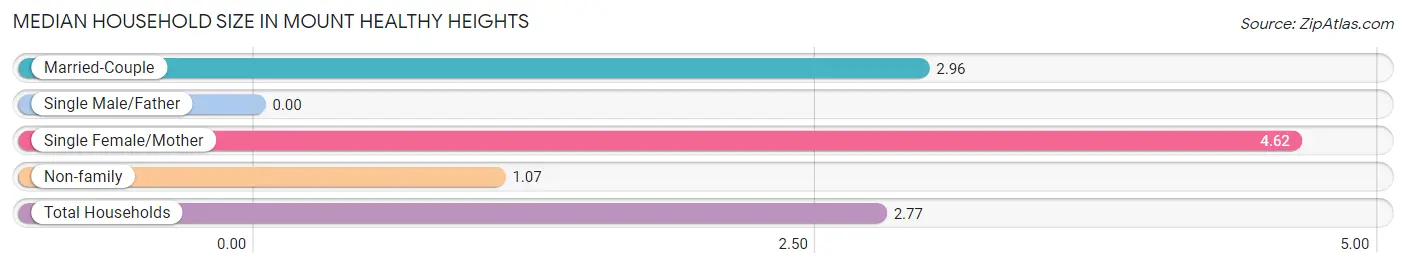
Median Household Size in Mount Healthy Heights
| Household Type | # Households | Household Size |
| Married-Couple | 457 (40.4%) | 2.96 |
| Single Male/Father | 0 (0.0%) | - |
| Single Female/Mother | 299 (26.4%) | 4.62 |
| Non-family | 375 (33.2%) | 1.07 |
| Total Households | 1,131 (100.0%) | 2.77 |
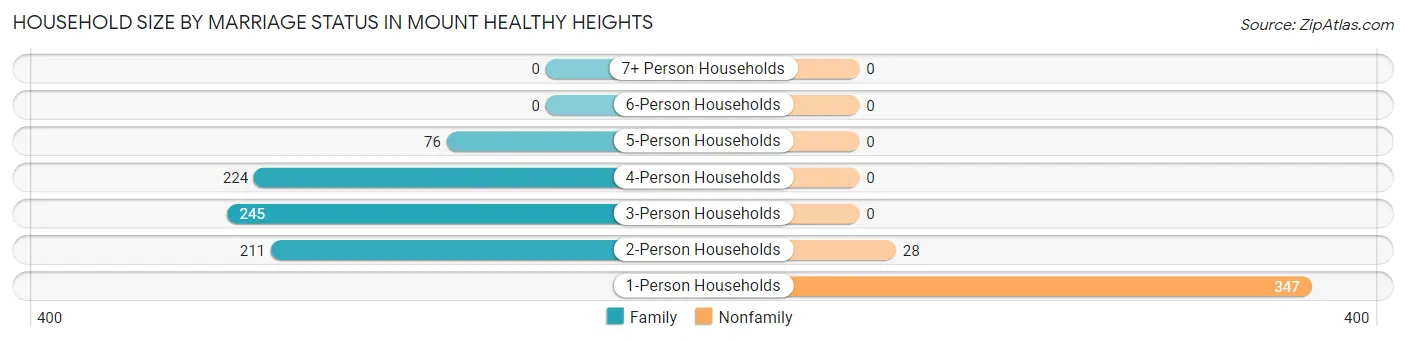
Household Size by Marriage Status in Mount Healthy Heights
Out of a total of 1,131 households in Mount Healthy Heights, 756 (66.8%) are family households, while 375 (33.2%) are nonfamily households. The most numerous type of family households are 3-person households, comprising 245, and the most common type of nonfamily households are 1-person households, comprising 347.
| Household Size | Family Households | Nonfamily Households |
| 1-Person Households | - | 347 (30.7%) |
| 2-Person Households | 211 (18.7%) | 28 (2.5%) |
| 3-Person Households | 245 (21.7%) | 0 (0.0%) |
| 4-Person Households | 224 (19.8%) | 0 (0.0%) |
| 5-Person Households | 76 (6.7%) | 0 (0.0%) |
| 6-Person Households | 0 (0.0%) | 0 (0.0%) |
| 7+ Person Households | 0 (0.0%) | 0 (0.0%) |
| Total | 756 (66.8%) | 375 (33.2%) |
Female Fertility in Mount Healthy Heights
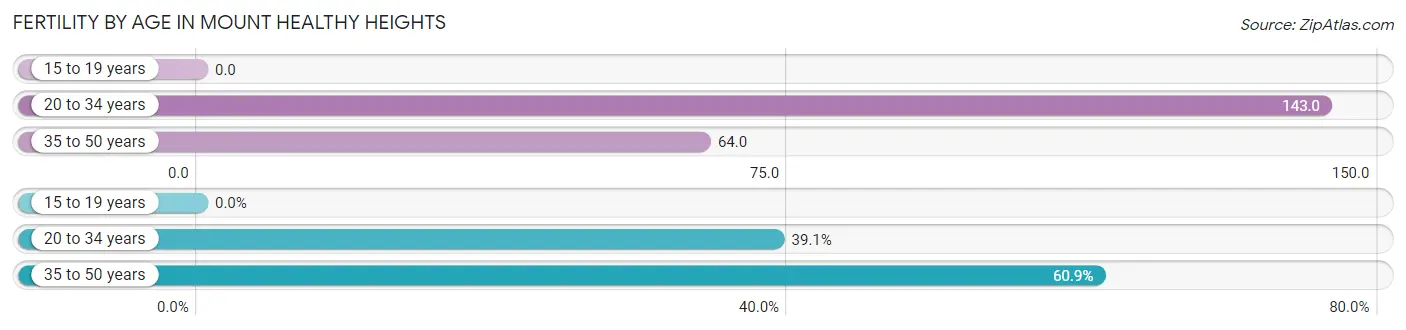
Fertility by Age in Mount Healthy Heights
Average fertility rate in Mount Healthy Heights is 78.0 births per 1,000 women. Women in the age bracket of 20 to 34 years have the highest fertility rate with 143.0 births per 1,000 women. Women in the age bracket of 35 to 50 years acount for 60.9% of all women with births.
| Age Bracket | Women with Births | Births / 1,000 Women |
| 15 to 19 years | 0 (0.0%) | 0.0 |
| 20 to 34 years | 18 (39.1%) | 143.0 |
| 35 to 50 years | 28 (60.9%) | 64.0 |
| Total | 46 (100.0%) | 78.0 |
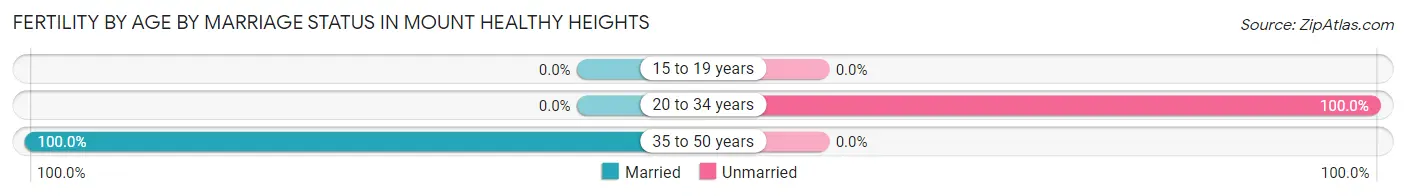
Fertility by Age by Marriage Status in Mount Healthy Heights
60.9% of women with births (46) in Mount Healthy Heights are married. The highest percentage of unmarried women with births falls into 20 to 34 years age bracket with 100.0% of them unmarried at the time of birth, while the lowest percentage of unmarried women with births belong to 35 to 50 years age bracket with 0.0% of them unmarried.
| Age Bracket | Married | Unmarried |
| 15 to 19 years | 0 (0.0%) | 0 (0.0%) |
| 20 to 34 years | 0 (0.0%) | 18 (100.0%) |
| 35 to 50 years | 28 (100.0%) | 0 (0.0%) |
| Total | 28 (60.9%) | 18 (39.1%) |
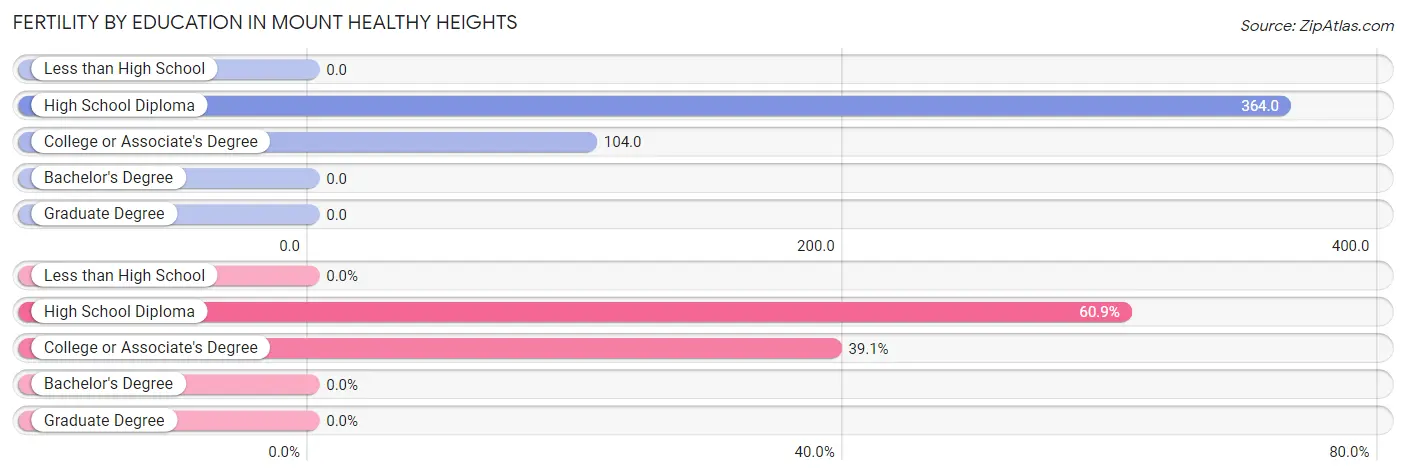
Fertility by Education in Mount Healthy Heights
| Educational Attainment | Women with Births | Births / 1,000 Women |
| Less than High School | 0 (0.0%) | 0.0 |
| High School Diploma | 28 (60.9%) | 364.0 |
| College or Associate's Degree | 18 (39.1%) | 104.0 |
| Bachelor's Degree | 0 (0.0%) | 0.0 |
| Graduate Degree | 0 (0.0%) | 0.0 |
| Total | 46 (100.0%) | 78.0 |
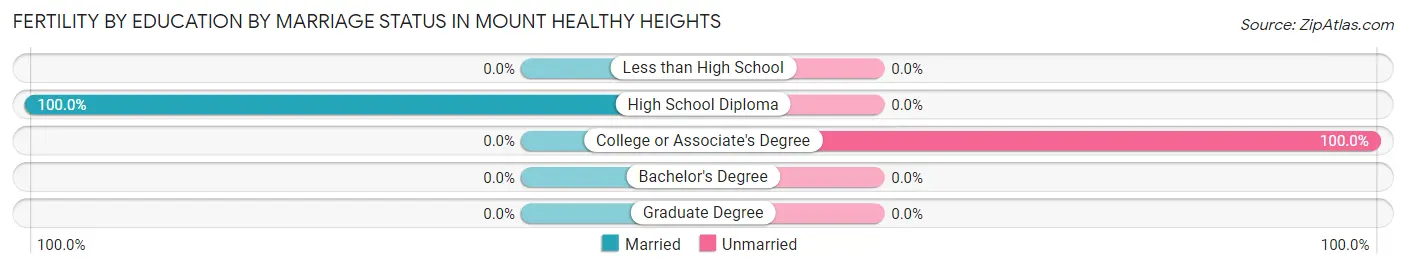
Fertility by Education by Marriage Status in Mount Healthy Heights
39.1% of women with births in Mount Healthy Heights are unmarried. Women with the educational attainment of high school diploma are most likely to be married with 100.0% of them married at childbirth, while women with the educational attainment of college or associate's degree are least likely to be married with 100.0% of them unmarried at childbirth.
| Educational Attainment | Married | Unmarried |
| Less than High School | 0 (0.0%) | 0 (0.0%) |
| High School Diploma | 28 (100.0%) | 0 (0.0%) |
| College or Associate's Degree | 0 (0.0%) | 18 (100.0%) |
| Bachelor's Degree | 0 (0.0%) | 0 (0.0%) |
| Graduate Degree | 0 (0.0%) | 0 (0.0%) |
| Total | 28 (60.9%) | 18 (39.1%) |
Income in Mount Healthy Heights
Income Overview in Mount Healthy Heights
Per Capita Income in Mount Healthy Heights is $25,676, while median incomes of families and households are $78,378 and $52,089 respectively.
| Characteristic | Number | Measure |
| Per Capita Income | 3,135 | $25,676 |
| Median Family Income | 756 | $78,378 |
| Mean Family Income | 756 | $85,482 |
| Median Household Income | 1,131 | $52,089 |
| Mean Household Income | 1,131 | $69,601 |
| Income Deficit | 756 | $0 |
| Wage / Income Gap (%) | 3,135 | 5.35% |
| Wage / Income Gap ($) | 3,135 | 94.65¢ per $1 |
| Gini / Inequality Index | 3,135 | 0.35 |
Earnings by Sex in Mount Healthy Heights
Average Earnings in Mount Healthy Heights are $44,003, $44,625 for men and $42,237 for women, a difference of 5.3%.
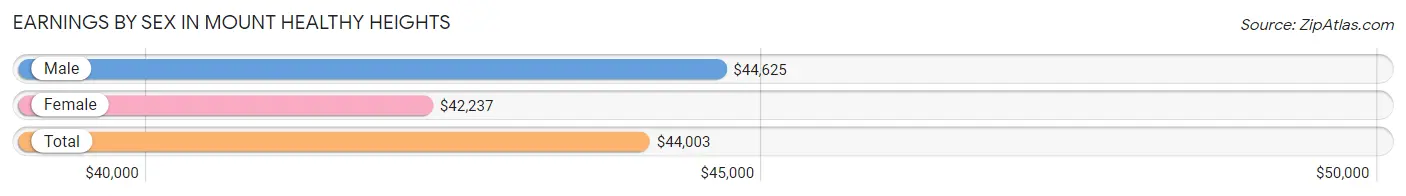
| Sex | Number | Average Earnings |
| Male | 749 (50.5%) | $44,625 |
| Female | 734 (49.5%) | $42,237 |
| Total | 1,483 (100.0%) | $44,003 |
Earnings by Sex by Income Bracket in Mount Healthy Heights
The most common earnings brackets in Mount Healthy Heights are $55,000 to $64,999 for men (104 | 13.9%) and $50,000 to $54,999 for women (204 | 27.8%).
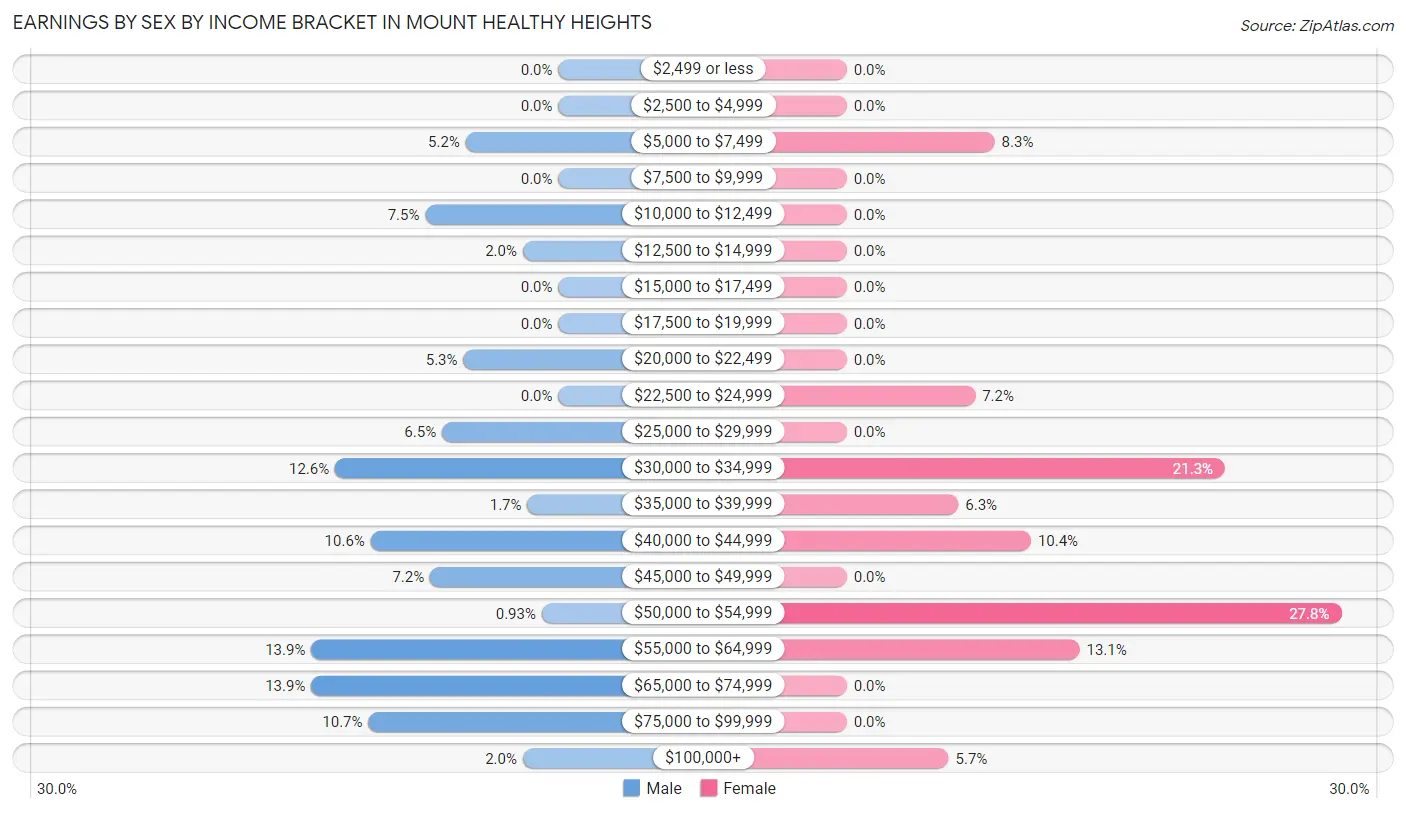
| Income | Male | Female |
| $2,499 or less | 0 (0.0%) | 0 (0.0%) |
| $2,500 to $4,999 | 0 (0.0%) | 0 (0.0%) |
| $5,000 to $7,499 | 39 (5.2%) | 61 (8.3%) |
| $7,500 to $9,999 | 0 (0.0%) | 0 (0.0%) |
| $10,000 to $12,499 | 56 (7.5%) | 0 (0.0%) |
| $12,500 to $14,999 | 15 (2.0%) | 0 (0.0%) |
| $15,000 to $17,499 | 0 (0.0%) | 0 (0.0%) |
| $17,500 to $19,999 | 0 (0.0%) | 0 (0.0%) |
| $20,000 to $22,499 | 40 (5.3%) | 0 (0.0%) |
| $22,500 to $24,999 | 0 (0.0%) | 53 (7.2%) |
| $25,000 to $29,999 | 49 (6.5%) | 0 (0.0%) |
| $30,000 to $34,999 | 94 (12.6%) | 156 (21.2%) |
| $35,000 to $39,999 | 13 (1.7%) | 46 (6.3%) |
| $40,000 to $44,999 | 79 (10.5%) | 76 (10.3%) |
| $45,000 to $49,999 | 54 (7.2%) | 0 (0.0%) |
| $50,000 to $54,999 | 7 (0.9%) | 204 (27.8%) |
| $55,000 to $64,999 | 104 (13.9%) | 96 (13.1%) |
| $65,000 to $74,999 | 104 (13.9%) | 0 (0.0%) |
| $75,000 to $99,999 | 80 (10.7%) | 0 (0.0%) |
| $100,000+ | 15 (2.0%) | 42 (5.7%) |
| Total | 749 (100.0%) | 734 (100.0%) |
Earnings by Sex by Educational Attainment in Mount Healthy Heights
Average earnings in Mount Healthy Heights are $45,718 for men and $42,237 for women, a difference of 7.6%. Men with an educational attainment of bachelor's degree enjoy the highest average annual earnings of $71,543, while those with college or associate's degree education earn the least with $58,438. Women with an educational attainment of high school diploma earn the most with the average annual earnings of $52,188, while those with college or associate's degree education have the smallest earnings of $37,708.
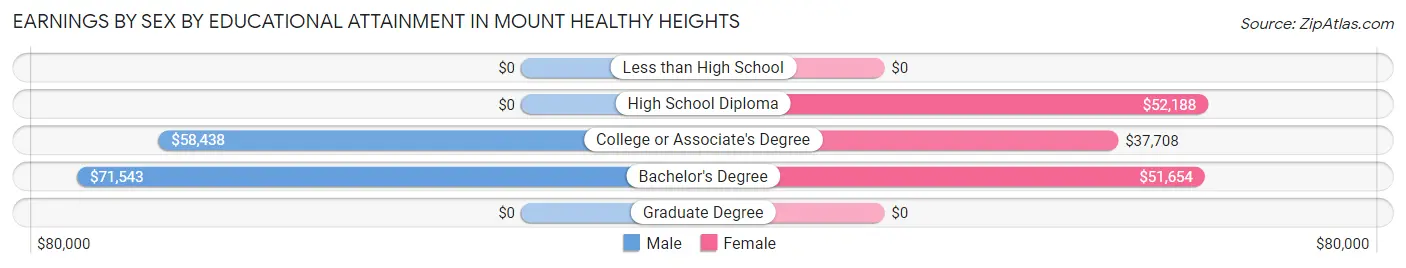
| Educational Attainment | Male Income | Female Income |
| Less than High School | - | - |
| High School Diploma | - | - |
| College or Associate's Degree | $58,438 | $37,708 |
| Bachelor's Degree | $71,543 | $51,654 |
| Graduate Degree | - | - |
| Total | $45,718 | $42,237 |
Family Income in Mount Healthy Heights
Family Income Brackets in Mount Healthy Heights
According to the Mount Healthy Heights family income data, there are 230 families falling into the $50,000 to $74,999 income range, which is the most common income bracket and makes up 30.4% of all families.
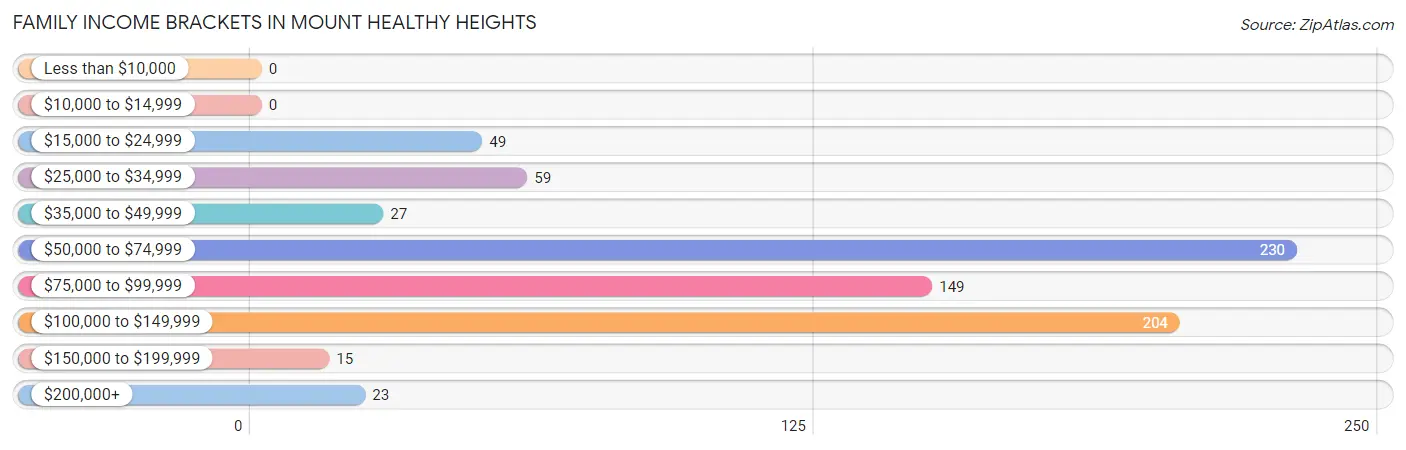
| Income Bracket | # Families | % Families |
| Less than $10,000 | 0 | 0.0% |
| $10,000 to $14,999 | 0 | 0.0% |
| $15,000 to $24,999 | 49 | 6.5% |
| $25,000 to $34,999 | 59 | 7.8% |
| $35,000 to $49,999 | 27 | 3.6% |
| $50,000 to $74,999 | 230 | 30.4% |
| $75,000 to $99,999 | 149 | 19.7% |
| $100,000 to $149,999 | 204 | 27.0% |
| $150,000 to $199,999 | 15 | 2.0% |
| $200,000+ | 23 | 3.0% |
Family Income by Famaliy Size in Mount Healthy Heights
2-person families (211 | 27.9%) account for the highest median family income in Mount Healthy Heights with $127,526 per family, while 2-person families (211 | 27.9%) have the highest median income of $63,763 per family member.
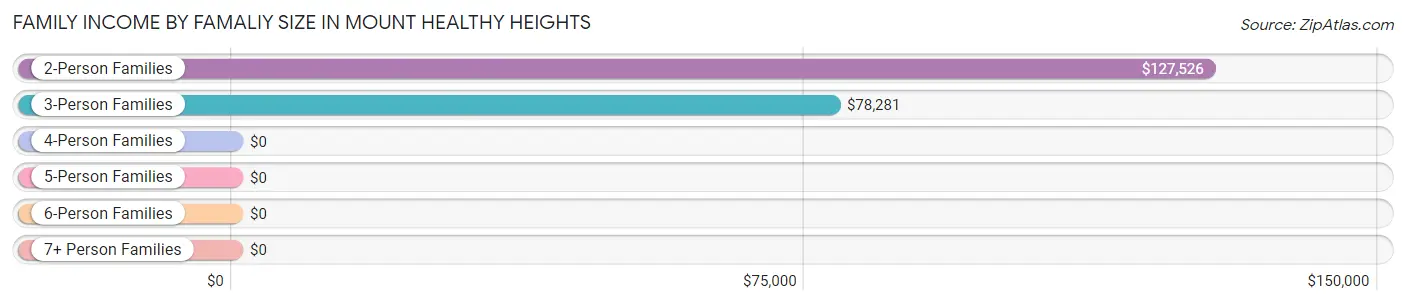
| Income Bracket | # Families | Median Income |
| 2-Person Families | 211 (27.9%) | $127,526 |
| 3-Person Families | 245 (32.4%) | $78,281 |
| 4-Person Families | 224 (29.6%) | $0 |
| 5-Person Families | 76 (10.1%) | $0 |
| 6-Person Families | 0 (0.0%) | $0 |
| 7+ Person Families | 0 (0.0%) | $0 |
| Total | 756 (100.0%) | $78,378 |
Family Income by Number of Earners in Mount Healthy Heights
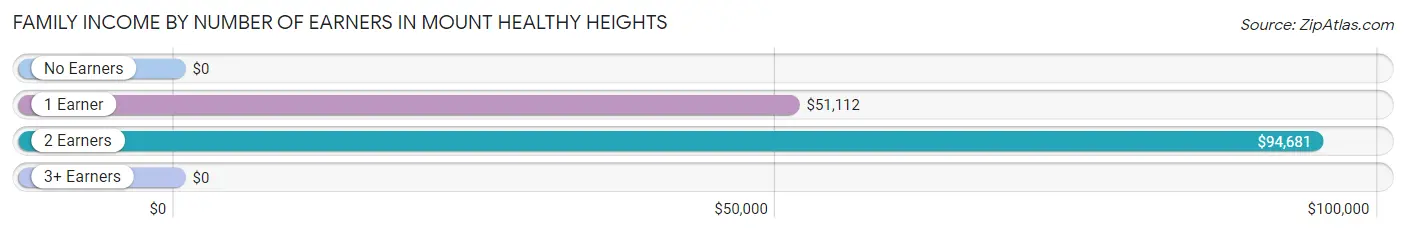
| Number of Earners | # Families | Median Income |
| No Earners | 58 (7.7%) | $0 |
| 1 Earner | 275 (36.4%) | $51,112 |
| 2 Earners | 350 (46.3%) | $94,681 |
| 3+ Earners | 73 (9.7%) | $0 |
| Total | 756 (100.0%) | $78,378 |
Household Income in Mount Healthy Heights
Household Income Brackets in Mount Healthy Heights
With 280 households falling in the category, the $50,000 to $74,999 income range is the most frequent in Mount Healthy Heights, accounting for 24.8% of all households.
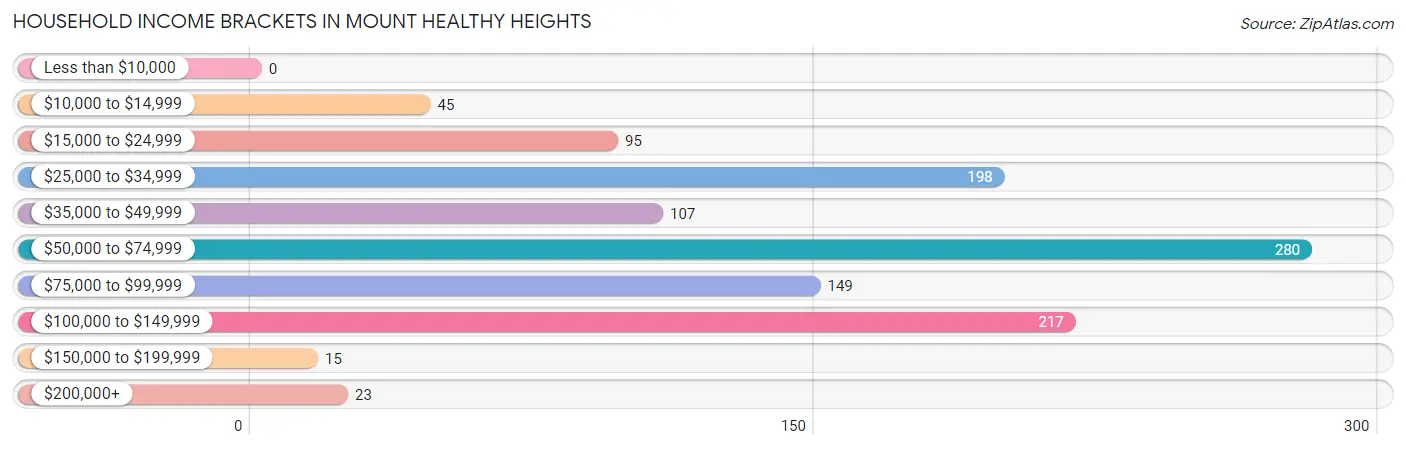
| Income Bracket | # Households | % Households |
| Less than $10,000 | 0 | 0.0% |
| $10,000 to $14,999 | 45 | 4.0% |
| $15,000 to $24,999 | 95 | 8.4% |
| $25,000 to $34,999 | 198 | 17.5% |
| $35,000 to $49,999 | 107 | 9.5% |
| $50,000 to $74,999 | 280 | 24.8% |
| $75,000 to $99,999 | 149 | 13.2% |
| $100,000 to $149,999 | 217 | 19.2% |
| $150,000 to $199,999 | 15 | 1.3% |
| $200,000+ | 23 | 2.0% |
Household Income by Householder Age in Mount Healthy Heights
The median household income in Mount Healthy Heights is $52,089, with the highest median household income of $87,566 found in the 45 to 64 years age bracket for the primary householder. A total of 373 households (33.0%) fall into this category.
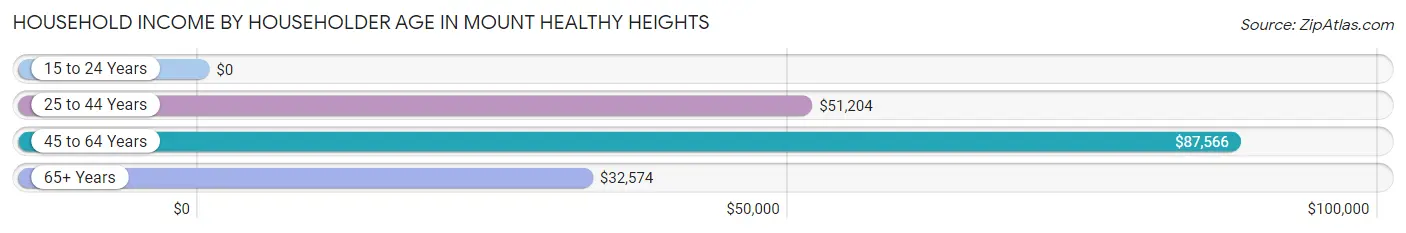
| Income Bracket | # Households | Median Income |
| 15 to 24 Years | 0 (0.0%) | $0 |
| 25 to 44 Years | 631 (55.8%) | $51,204 |
| 45 to 64 Years | 373 (33.0%) | $87,566 |
| 65+ Years | 127 (11.2%) | $32,574 |
| Total | 1,131 (100.0%) | $52,089 |
Poverty in Mount Healthy Heights
Income Below Poverty by Sex and Age in Mount Healthy Heights
With 5.8% poverty level for males and 28.5% for females among the residents of Mount Healthy Heights, under 5 year old males and under 5 year old females are the most vulnerable to poverty, with 76 males (22.7%) and 73 females (100.0%) in their respective age groups living below the poverty level.
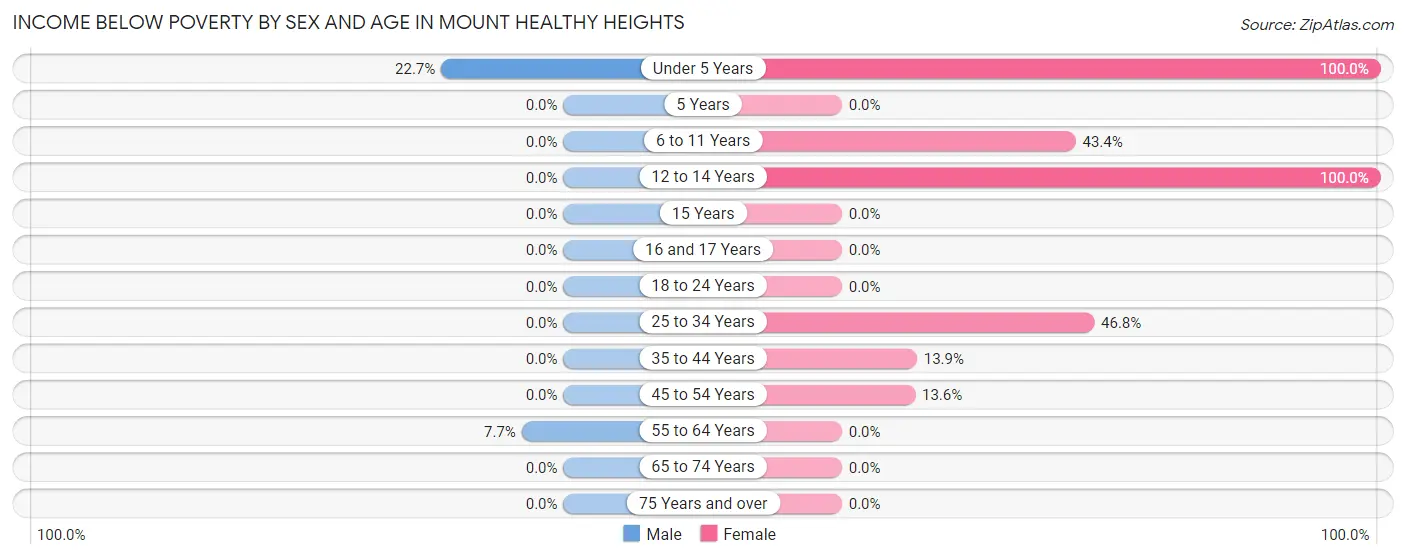
| Age Bracket | Male | Female |
| Under 5 Years | 76 (22.7%) | 73 (100.0%) |
| 5 Years | 0 (0.0%) | 0 (0.0%) |
| 6 to 11 Years | 0 (0.0%) | 187 (43.4%) |
| 12 to 14 Years | 0 (0.0%) | 49 (100.0%) |
| 15 Years | 0 (0.0%) | 0 (0.0%) |
| 16 and 17 Years | 0 (0.0%) | 0 (0.0%) |
| 18 to 24 Years | 0 (0.0%) | 0 (0.0%) |
| 25 to 34 Years | 0 (0.0%) | 59 (46.8%) |
| 35 to 44 Years | 0 (0.0%) | 49 (13.9%) |
| 45 to 54 Years | 0 (0.0%) | 28 (13.6%) |
| 55 to 64 Years | 15 (7.7%) | 0 (0.0%) |
| 65 to 74 Years | 0 (0.0%) | 0 (0.0%) |
| 75 Years and over | 0 (0.0%) | 0 (0.0%) |
| Total | 91 (5.8%) | 445 (28.5%) |
Income Above Poverty by Sex and Age in Mount Healthy Heights
According to the poverty statistics in Mount Healthy Heights, males aged 6 to 11 years and females aged 16 and 17 years are the age groups that are most secure financially, with 100.0% of males and 100.0% of females in these age groups living above the poverty line.
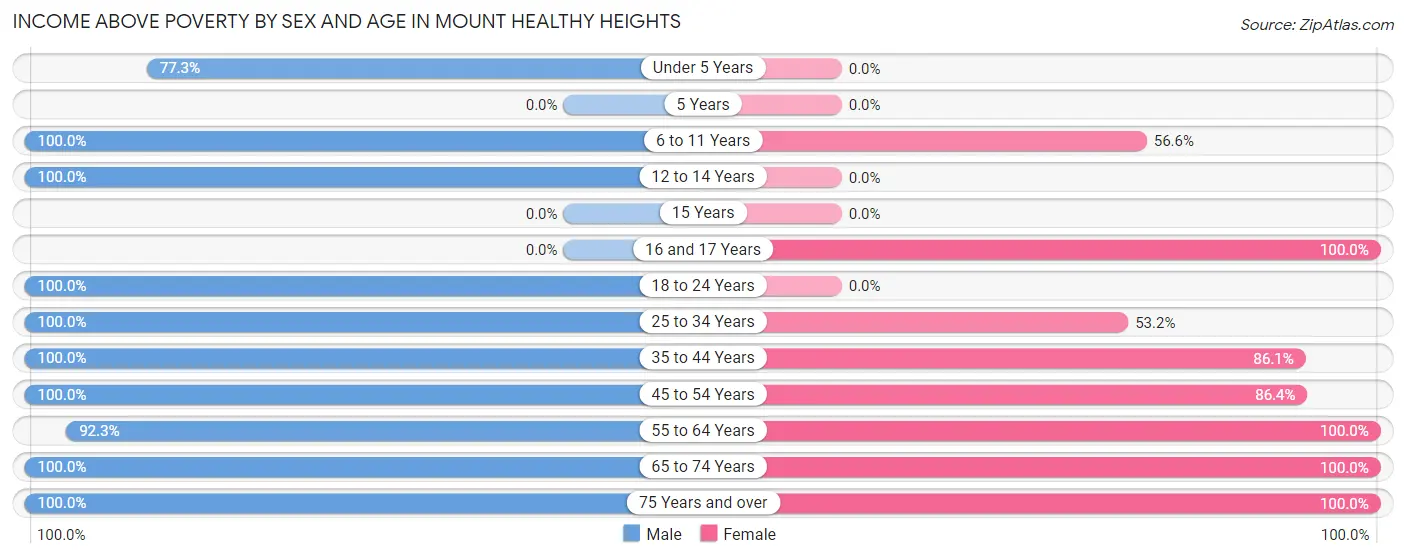
| Age Bracket | Male | Female |
| Under 5 Years | 259 (77.3%) | 0 (0.0%) |
| 5 Years | 0 (0.0%) | 0 (0.0%) |
| 6 to 11 Years | 254 (100.0%) | 244 (56.6%) |
| 12 to 14 Years | 76 (100.0%) | 0 (0.0%) |
| 15 Years | 0 (0.0%) | 0 (0.0%) |
| 16 and 17 Years | 0 (0.0%) | 27 (100.0%) |
| 18 to 24 Years | 52 (100.0%) | 0 (0.0%) |
| 25 to 34 Years | 285 (100.0%) | 67 (53.2%) |
| 35 to 44 Years | 177 (100.0%) | 303 (86.1%) |
| 45 to 54 Years | 138 (100.0%) | 178 (86.4%) |
| 55 to 64 Years | 179 (92.3%) | 105 (100.0%) |
| 65 to 74 Years | 39 (100.0%) | 117 (100.0%) |
| 75 Years and over | 23 (100.0%) | 76 (100.0%) |
| Total | 1,482 (94.2%) | 1,117 (71.5%) |
Income Below Poverty Among Married-Couple Families in Mount Healthy Heights
| Children | Above Poverty | Below Poverty |
| No Children | 287 (100.0%) | 0 (0.0%) |
| 1 or 2 Children | 153 (100.0%) | 0 (0.0%) |
| 3 or 4 Children | 17 (100.0%) | 0 (0.0%) |
| 5 or more Children | 0 (0.0%) | 0 (0.0%) |
| Total | 457 (100.0%) | 0 (0.0%) |
Income Below Poverty Among Single-Parent Households in Mount Healthy Heights
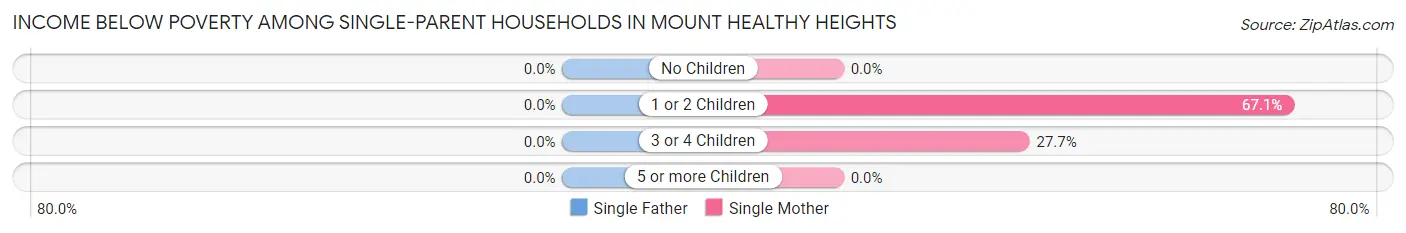
| Children | Single Father | Single Mother |
| No Children | 0 (0.0%) | 0 (0.0%) |
| 1 or 2 Children | 0 (0.0%) | 49 (67.1%) |
| 3 or 4 Children | 0 (0.0%) | 59 (27.7%) |
| 5 or more Children | 0 (0.0%) | 0 (0.0%) |
| Total | 0 (0.0%) | 108 (36.1%) |
Income Below Poverty Among Married-Couple vs Single-Parent Households in Mount Healthy Heights
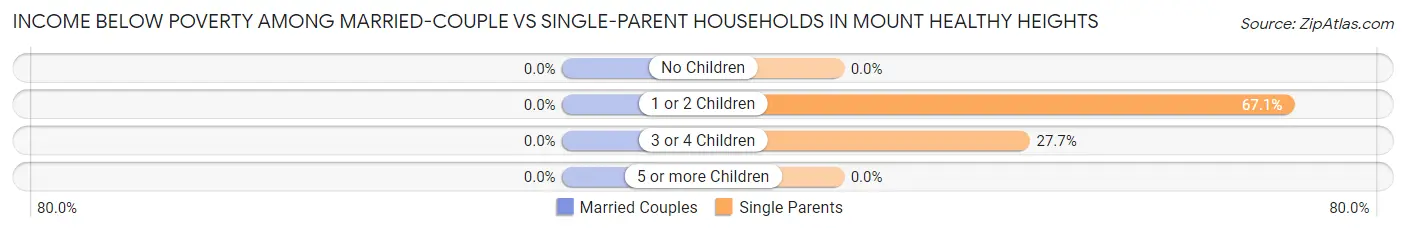
| Children | Married-Couple Families | Single-Parent Households |
| No Children | 0 (0.0%) | 0 (0.0%) |
| 1 or 2 Children | 0 (0.0%) | 49 (67.1%) |
| 3 or 4 Children | 0 (0.0%) | 59 (27.7%) |
| 5 or more Children | 0 (0.0%) | 0 (0.0%) |
| Total | 0 (0.0%) | 108 (36.1%) |
Employment Characteristics in Mount Healthy Heights
Employment by Class of Employer in Mount Healthy Heights
Among the 1,349 employed individuals in Mount Healthy Heights, private company employees (1,044 | 77.4%), local government employees (194 | 14.4%), and not-for-profit organizations (46 | 3.4%) make up the most common classes of employment.
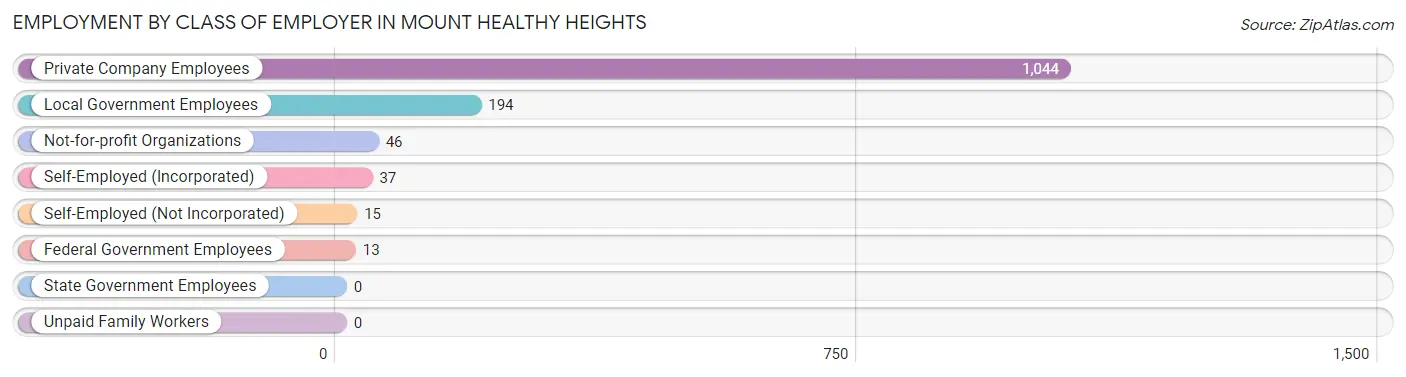
| Employer Class | # Employees | % Employees |
| Private Company Employees | 1,044 | 77.4% |
| Self-Employed (Incorporated) | 37 | 2.7% |
| Self-Employed (Not Incorporated) | 15 | 1.1% |
| Not-for-profit Organizations | 46 | 3.4% |
| Local Government Employees | 194 | 14.4% |
| State Government Employees | 0 | 0.0% |
| Federal Government Employees | 13 | 1.0% |
| Unpaid Family Workers | 0 | 0.0% |
| Total | 1,349 | 100.0% |
Employment Status by Age in Mount Healthy Heights
According to the labor force statistics for Mount Healthy Heights, out of the total population over 16 years of age (1,917), 75.7% or 1,451 individuals are in the labor force, with 7.0% or 102 of them unemployed. The age group with the highest labor force participation rate is 20 to 24 years, with 100.0% or 13 individuals in the labor force. Within the labor force, the 35 to 44 years age range has the highest percentage of unemployed individuals, with 19.3% or 102 of them being unemployed.
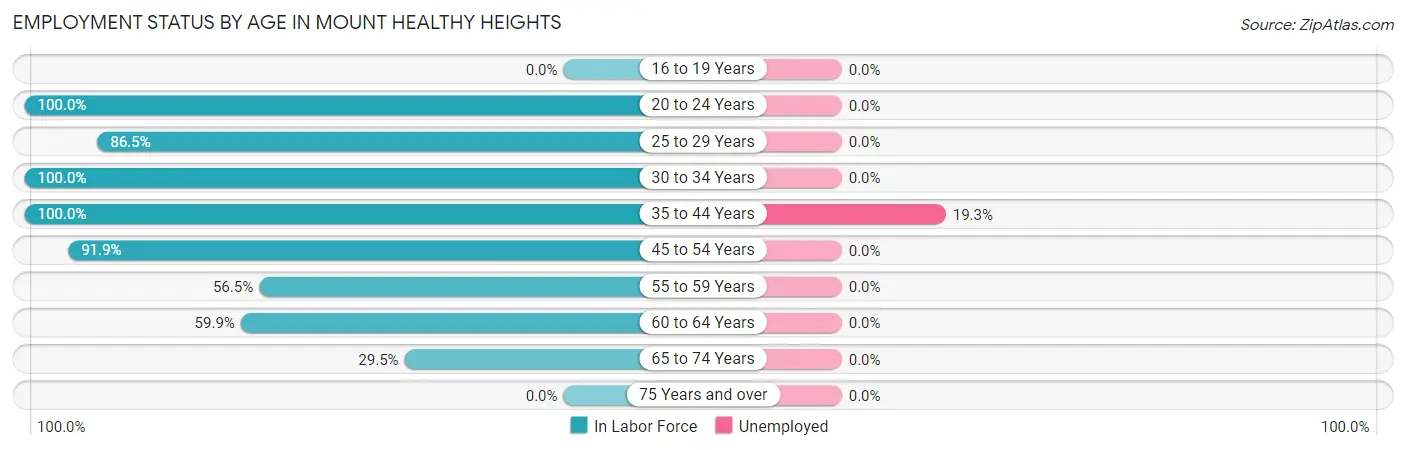
| Age Bracket | In Labor Force | Unemployed |
| 16 to 19 Years | 0 (0.0%) | 0 (0.0%) |
| 20 to 24 Years | 13 (100.0%) | 0 (0.0%) |
| 25 to 29 Years | 257 (86.5%) | 0 (0.0%) |
| 30 to 34 Years | 114 (100.0%) | 0 (0.0%) |
| 35 to 44 Years | 529 (100.0%) | 102 (19.3%) |
| 45 to 54 Years | 316 (91.9%) | 0 (0.0%) |
| 55 to 59 Years | 52 (56.5%) | 0 (0.0%) |
| 60 to 64 Years | 124 (59.9%) | 0 (0.0%) |
| 65 to 74 Years | 46 (29.5%) | 0 (0.0%) |
| 75 Years and over | 0 (0.0%) | 0 (0.0%) |
| Total | 1,451 (75.7%) | 102 (7.0%) |
Employment Status by Educational Attainment in Mount Healthy Heights
According to labor force statistics for Mount Healthy Heights, 87.9% of individuals (1,391) out of the total population between 25 and 64 years of age (1,583) are in the labor force, with 7.3% or 102 of them being unemployed. The group with the highest labor force participation rate are those with the educational attainment of less than high school, with 100.0% or 91 individuals in the labor force. Within the labor force, individuals with high school diploma education have the highest percentage of unemployment, with 34.0% or 102 of them being unemployed.
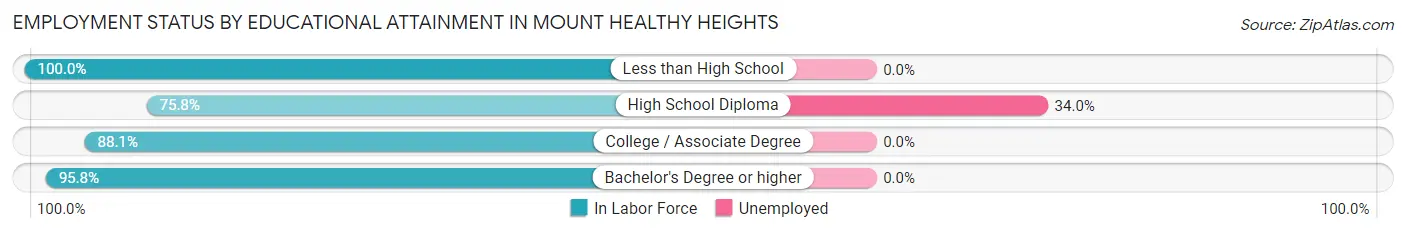
| Educational Attainment | In Labor Force | Unemployed |
| Less than High School | 91 (100.0%) | 0 (0.0%) |
| High School Diploma | 300 (75.8%) | 135 (34.0%) |
| College / Associate Degree | 564 (88.1%) | 0 (0.0%) |
| Bachelor's Degree or higher | 437 (95.8%) | 0 (0.0%) |
| Total | 1,391 (87.9%) | 116 (7.3%) |
Employment Occupations by Sex in Mount Healthy Heights
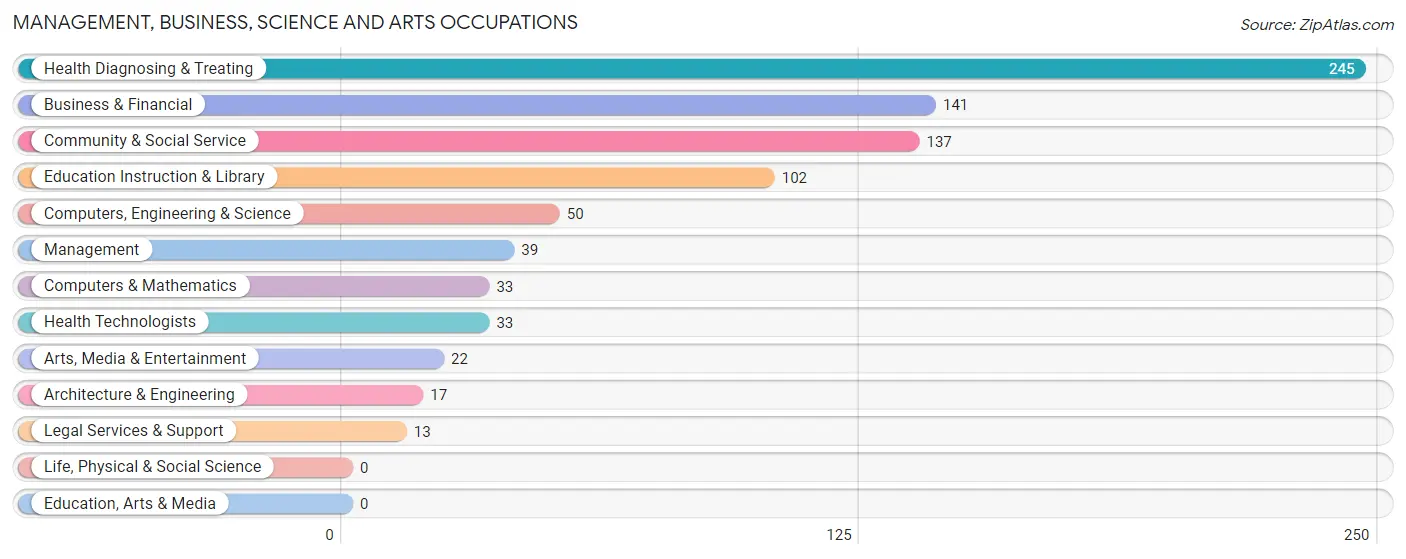
Management, Business, Science and Arts Occupations
The most common Management, Business, Science and Arts occupations in Mount Healthy Heights are Health Diagnosing & Treating (245 | 18.2%), Business & Financial (141 | 10.4%), Community & Social Service (137 | 10.2%), Education Instruction & Library (102 | 7.6%), and Computers, Engineering & Science (50 | 3.7%).
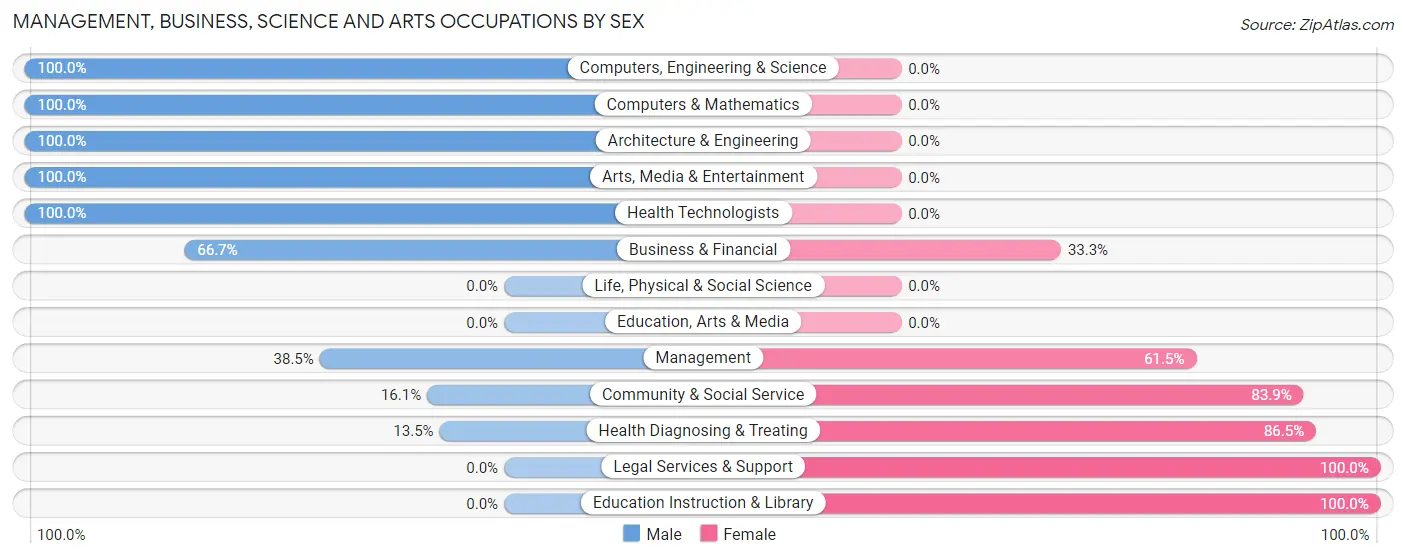
Management, Business, Science and Arts Occupations by Sex
Within the Management, Business, Science and Arts occupations in Mount Healthy Heights, the most male-oriented occupations are Computers, Engineering & Science (100.0%), Computers & Mathematics (100.0%), and Architecture & Engineering (100.0%), while the most female-oriented occupations are Legal Services & Support (100.0%), Education Instruction & Library (100.0%), and Health Diagnosing & Treating (86.5%).
| Occupation | Male | Female |
| Management | 15 (38.5%) | 24 (61.5%) |
| Business & Financial | 94 (66.7%) | 47 (33.3%) |
| Computers, Engineering & Science | 50 (100.0%) | 0 (0.0%) |
| Computers & Mathematics | 33 (100.0%) | 0 (0.0%) |
| Architecture & Engineering | 17 (100.0%) | 0 (0.0%) |
| Life, Physical & Social Science | 0 (0.0%) | 0 (0.0%) |
| Community & Social Service | 22 (16.1%) | 115 (83.9%) |
| Education, Arts & Media | 0 (0.0%) | 0 (0.0%) |
| Legal Services & Support | 0 (0.0%) | 13 (100.0%) |
| Education Instruction & Library | 0 (0.0%) | 102 (100.0%) |
| Arts, Media & Entertainment | 22 (100.0%) | 0 (0.0%) |
| Health Diagnosing & Treating | 33 (13.5%) | 212 (86.5%) |
| Health Technologists | 33 (100.0%) | 0 (0.0%) |
| Total (Category) | 214 (35.0%) | 398 (65.0%) |
| Total (Overall) | 634 (47.0%) | 715 (53.0%) |
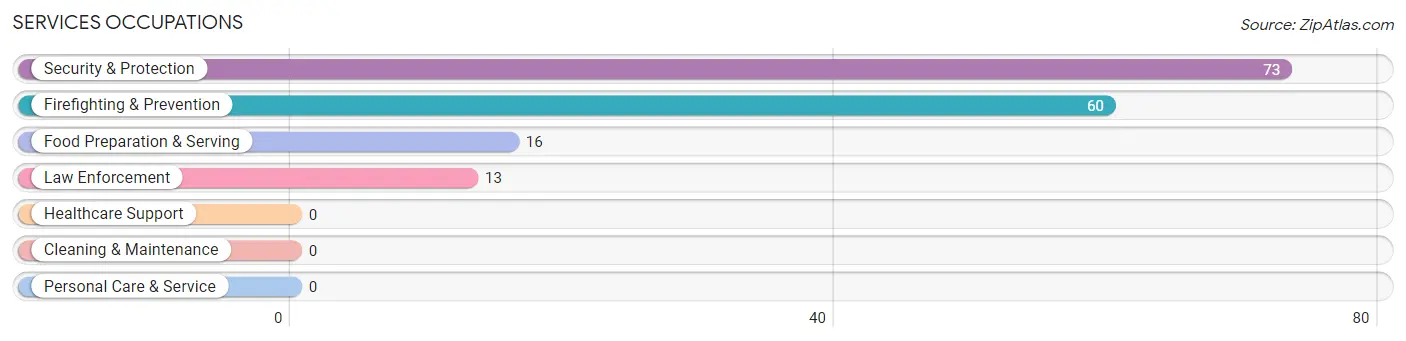
Services Occupations
The most common Services occupations in Mount Healthy Heights are Security & Protection (73 | 5.4%), Firefighting & Prevention (60 | 4.4%), Food Preparation & Serving (16 | 1.2%), and Law Enforcement (13 | 1.0%).
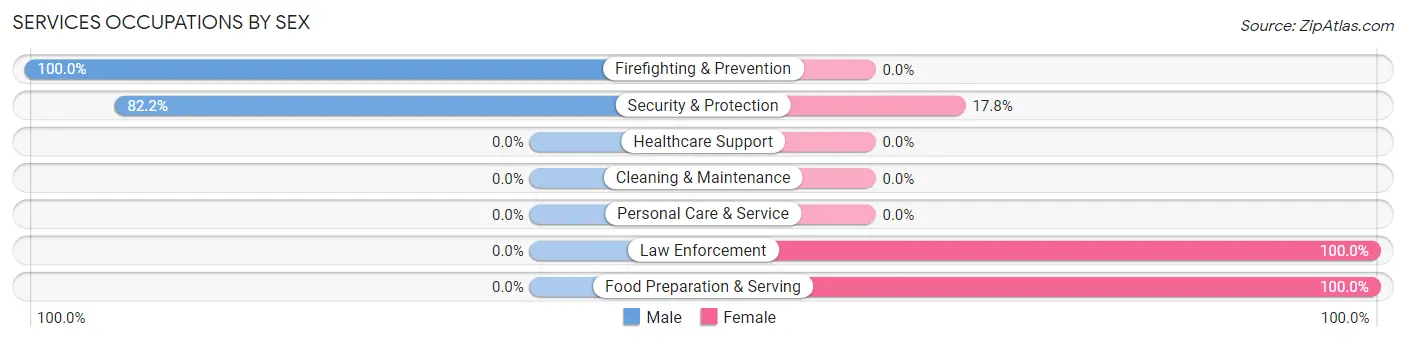
Services Occupations by Sex
Within the Services occupations in Mount Healthy Heights, the most male-oriented occupations are Firefighting & Prevention (100.0%), and Security & Protection (82.2%), while the most female-oriented occupations are Law Enforcement (100.0%), Food Preparation & Serving (100.0%), and Security & Protection (17.8%).
| Occupation | Male | Female |
| Healthcare Support | 0 (0.0%) | 0 (0.0%) |
| Security & Protection | 60 (82.2%) | 13 (17.8%) |
| Firefighting & Prevention | 60 (100.0%) | 0 (0.0%) |
| Law Enforcement | 0 (0.0%) | 13 (100.0%) |
| Food Preparation & Serving | 0 (0.0%) | 16 (100.0%) |
| Cleaning & Maintenance | 0 (0.0%) | 0 (0.0%) |
| Personal Care & Service | 0 (0.0%) | 0 (0.0%) |
| Total (Category) | 60 (67.4%) | 29 (32.6%) |
| Total (Overall) | 634 (47.0%) | 715 (53.0%) |
Sales and Office Occupations
The most common Sales and Office occupations in Mount Healthy Heights are Office & Administration (199 | 14.7%), and Sales & Related (54 | 4.0%).
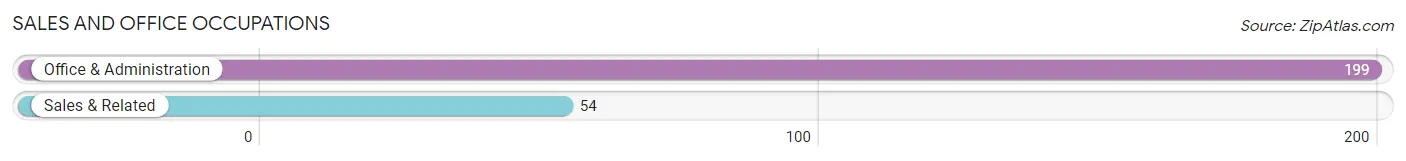
Sales and Office Occupations by Sex
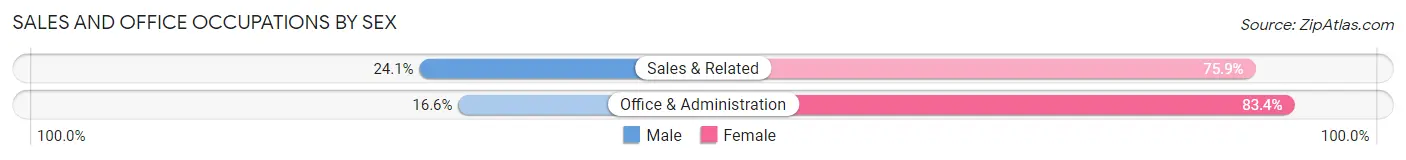
| Occupation | Male | Female |
| Sales & Related | 13 (24.1%) | 41 (75.9%) |
| Office & Administration | 33 (16.6%) | 166 (83.4%) |
| Total (Category) | 46 (18.2%) | 207 (81.8%) |
| Total (Overall) | 634 (47.0%) | 715 (53.0%) |
Natural Resources, Construction and Maintenance Occupations
The most common Natural Resources, Construction and Maintenance occupations in Mount Healthy Heights are , and Installation, Maintenance & Repair (67 | 5.0%).
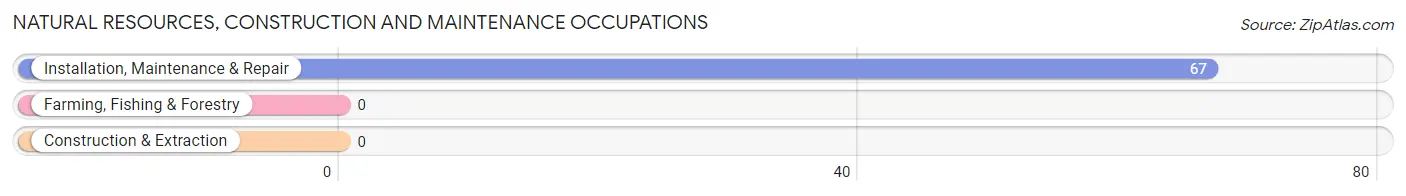
Natural Resources, Construction and Maintenance Occupations by Sex
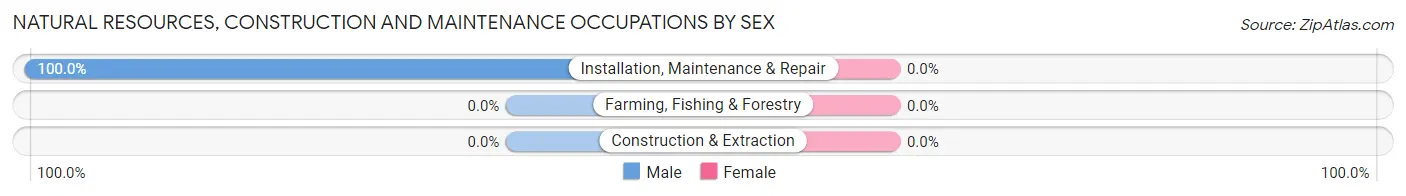
| Occupation | Male | Female |
| Farming, Fishing & Forestry | 0 (0.0%) | 0 (0.0%) |
| Construction & Extraction | 0 (0.0%) | 0 (0.0%) |
| Installation, Maintenance & Repair | 67 (100.0%) | 0 (0.0%) |
| Total (Category) | 67 (100.0%) | 0 (0.0%) |
| Total (Overall) | 634 (47.0%) | 715 (53.0%) |
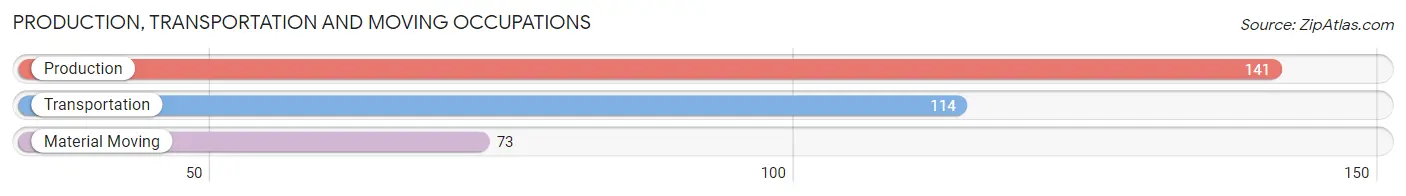
Production, Transportation and Moving Occupations
The most common Production, Transportation and Moving occupations in Mount Healthy Heights are Production (141 | 10.4%), Transportation (114 | 8.5%), and Material Moving (73 | 5.4%).
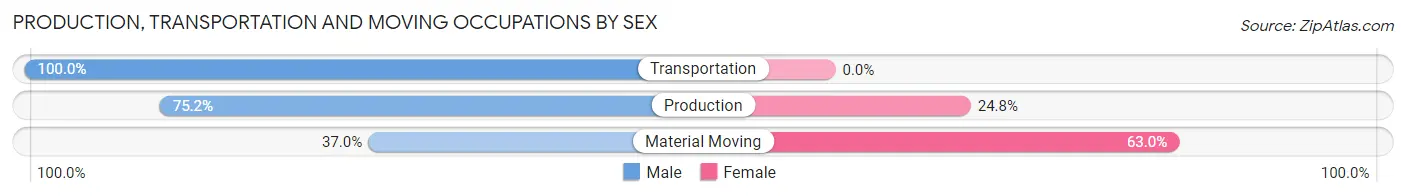
Production, Transportation and Moving Occupations by Sex
| Occupation | Male | Female |
| Production | 106 (75.2%) | 35 (24.8%) |
| Transportation | 114 (100.0%) | 0 (0.0%) |
| Material Moving | 27 (37.0%) | 46 (63.0%) |
| Total (Category) | 247 (75.3%) | 81 (24.7%) |
| Total (Overall) | 634 (47.0%) | 715 (53.0%) |
Employment Industries by Sex in Mount Healthy Heights
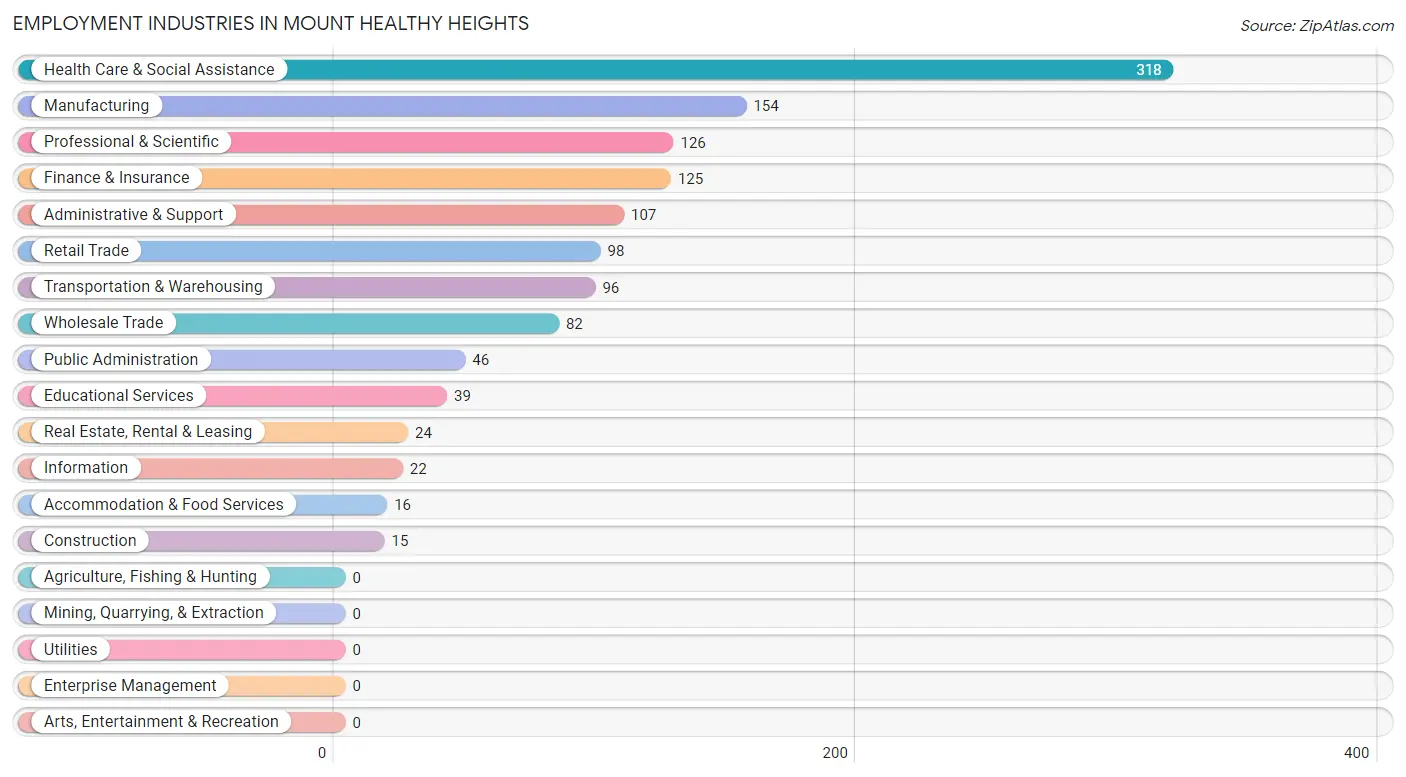
Employment Industries in Mount Healthy Heights
The major employment industries in Mount Healthy Heights include Health Care & Social Assistance (318 | 23.6%), Manufacturing (154 | 11.4%), Professional & Scientific (126 | 9.3%), Finance & Insurance (125 | 9.3%), and Administrative & Support (107 | 7.9%).
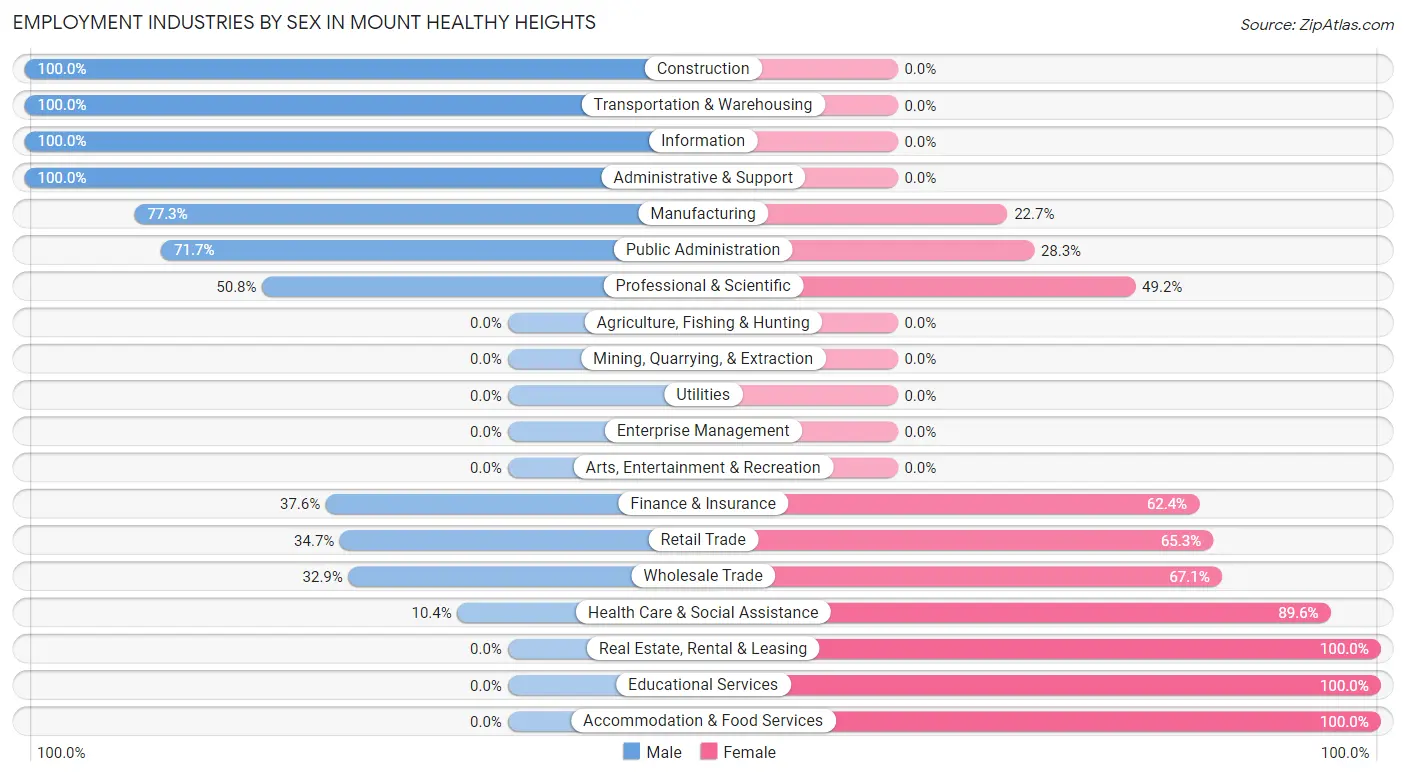
Employment Industries by Sex in Mount Healthy Heights
The Mount Healthy Heights industries that see more men than women are Construction (100.0%), Transportation & Warehousing (100.0%), and Information (100.0%), whereas the industries that tend to have a higher number of women are Real Estate, Rental & Leasing (100.0%), Educational Services (100.0%), and Accommodation & Food Services (100.0%).
| Industry | Male | Female |
| Agriculture, Fishing & Hunting | 0 (0.0%) | 0 (0.0%) |
| Mining, Quarrying, & Extraction | 0 (0.0%) | 0 (0.0%) |
| Construction | 15 (100.0%) | 0 (0.0%) |
| Manufacturing | 119 (77.3%) | 35 (22.7%) |
| Wholesale Trade | 27 (32.9%) | 55 (67.1%) |
| Retail Trade | 34 (34.7%) | 64 (65.3%) |
| Transportation & Warehousing | 96 (100.0%) | 0 (0.0%) |
| Utilities | 0 (0.0%) | 0 (0.0%) |
| Information | 22 (100.0%) | 0 (0.0%) |
| Finance & Insurance | 47 (37.6%) | 78 (62.4%) |
| Real Estate, Rental & Leasing | 0 (0.0%) | 24 (100.0%) |
| Professional & Scientific | 64 (50.8%) | 62 (49.2%) |
| Enterprise Management | 0 (0.0%) | 0 (0.0%) |
| Administrative & Support | 107 (100.0%) | 0 (0.0%) |
| Educational Services | 0 (0.0%) | 39 (100.0%) |
| Health Care & Social Assistance | 33 (10.4%) | 285 (89.6%) |
| Arts, Entertainment & Recreation | 0 (0.0%) | 0 (0.0%) |
| Accommodation & Food Services | 0 (0.0%) | 16 (100.0%) |
| Public Administration | 33 (71.7%) | 13 (28.3%) |
| Total | 634 (47.0%) | 715 (53.0%) |
Education in Mount Healthy Heights
School Enrollment in Mount Healthy Heights
The most common levels of schooling among the 876 students in Mount Healthy Heights are elementary school (387 | 44.2%), middle school (386 | 44.1%), and high school (64 | 7.3%).
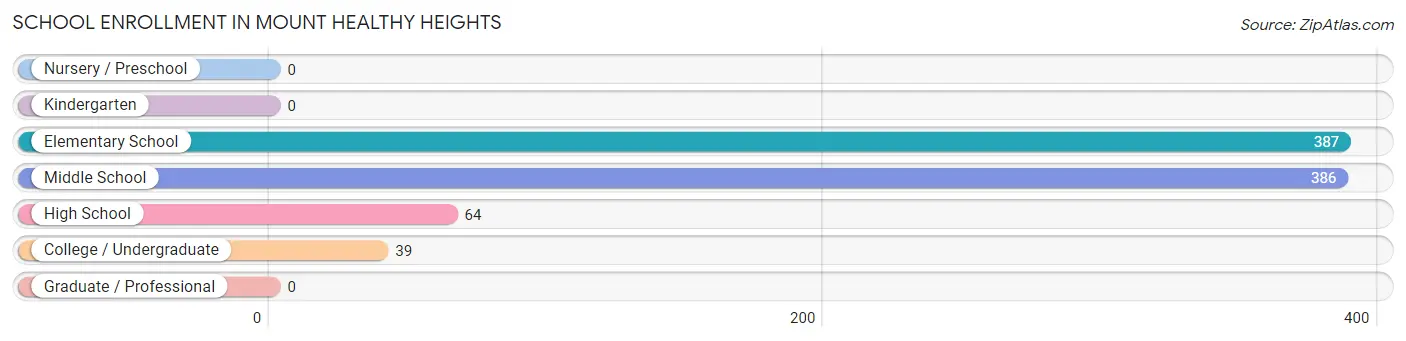
| School Level | # Students | % Students |
| Nursery / Preschool | 0 | 0.0% |
| Kindergarten | 0 | 0.0% |
| Elementary School | 387 | 44.2% |
| Middle School | 386 | 44.1% |
| High School | 64 | 7.3% |
| College / Undergraduate | 39 | 4.4% |
| Graduate / Professional | 0 | 0.0% |
| Total | 876 | 100.0% |
School Enrollment by Age by Funding Source in Mount Healthy Heights
Out of a total of 876 students who are enrolled in schools in Mount Healthy Heights, 386 (44.1%) attend a private institution, while the remaining 490 (55.9%) are enrolled in public schools. The age group of 18 to 19 year olds has the highest likelihood of being enrolled in private schools, with 39 (100.0% in the age bracket) enrolled. Conversely, the age group of 15 to 17 year olds has the lowest likelihood of being enrolled in a private school, with 27 (100.0% in the age bracket) attending a public institution.
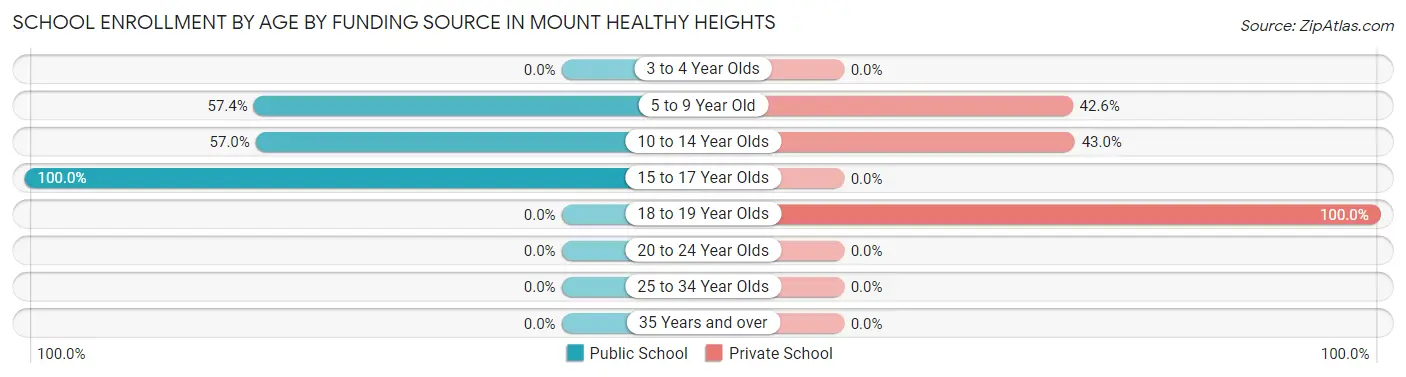
| Age Bracket | Public School | Private School |
| 3 to 4 Year Olds | 0 (0.0%) | 0 (0.0%) |
| 5 to 9 Year Old | 222 (57.4%) | 165 (42.6%) |
| 10 to 14 Year Olds | 241 (57.0%) | 182 (43.0%) |
| 15 to 17 Year Olds | 27 (100.0%) | 0 (0.0%) |
| 18 to 19 Year Olds | 0 (0.0%) | 39 (100.0%) |
| 20 to 24 Year Olds | 0 (0.0%) | 0 (0.0%) |
| 25 to 34 Year Olds | 0 (0.0%) | 0 (0.0%) |
| 35 Years and over | 0 (0.0%) | 0 (0.0%) |
| Total | 490 (55.9%) | 386 (44.1%) |
Educational Attainment by Field of Study in Mount Healthy Heights
Science & technology (183 | 39.4%), education (82 | 17.6%), business (75 | 16.1%), engineering (47 | 10.1%), and arts & humanities (47 | 10.1%) are the most common fields of study among 465 individuals in Mount Healthy Heights who have obtained a bachelor's degree or higher.

| Field of Study | # Graduates | % Graduates |
| Computers & Mathematics | 0 | 0.0% |
| Bio, Nature & Agricultural | 0 | 0.0% |
| Physical & Health Sciences | 0 | 0.0% |
| Psychology | 9 | 1.9% |
| Social Sciences | 0 | 0.0% |
| Engineering | 47 | 10.1% |
| Multidisciplinary Studies | 0 | 0.0% |
| Science & Technology | 183 | 39.4% |
| Business | 75 | 16.1% |
| Education | 82 | 17.6% |
| Literature & Languages | 0 | 0.0% |
| Liberal Arts & History | 22 | 4.7% |
| Visual & Performing Arts | 0 | 0.0% |
| Communications | 0 | 0.0% |
| Arts & Humanities | 47 | 10.1% |
| Total | 465 | 100.0% |
Transportation & Commute in Mount Healthy Heights
Vehicle Availability by Sex in Mount Healthy Heights
The most prevalent vehicle ownership categories in Mount Healthy Heights are males with 2 vehicles (282, accounting for 44.5%) and females with 2 vehicles (284, making up 39.4%).
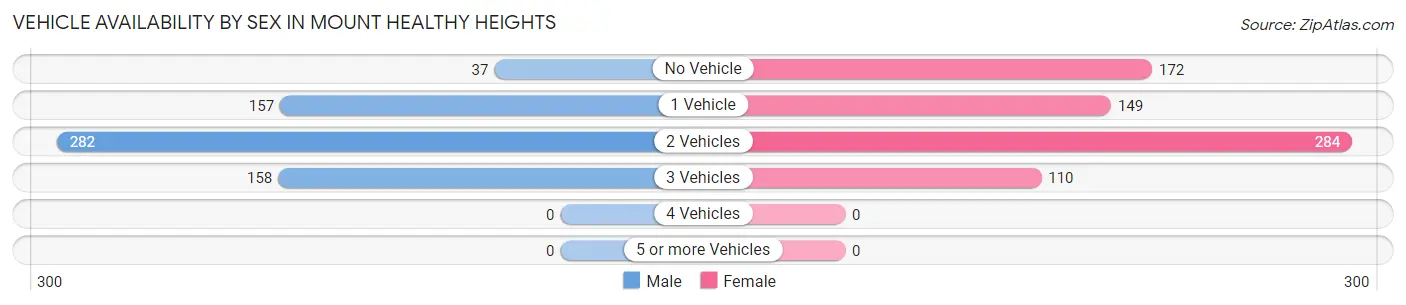
| Vehicles Available | Male | Female |
| No Vehicle | 37 (5.8%) | 172 (24.1%) |
| 1 Vehicle | 157 (24.8%) | 149 (20.8%) |
| 2 Vehicles | 282 (44.5%) | 284 (39.7%) |
| 3 Vehicles | 158 (24.9%) | 110 (15.4%) |
| 4 Vehicles | 0 (0.0%) | 0 (0.0%) |
| 5 or more Vehicles | 0 (0.0%) | 0 (0.0%) |
| Total | 634 (100.0%) | 715 (100.0%) |
Commute Time in Mount Healthy Heights
The most frequently occuring commute durations in Mount Healthy Heights are 30 to 34 minutes (382 commuters, 29.4%), 20 to 24 minutes (267 commuters, 20.5%), and 15 to 19 minutes (172 commuters, 13.2%).
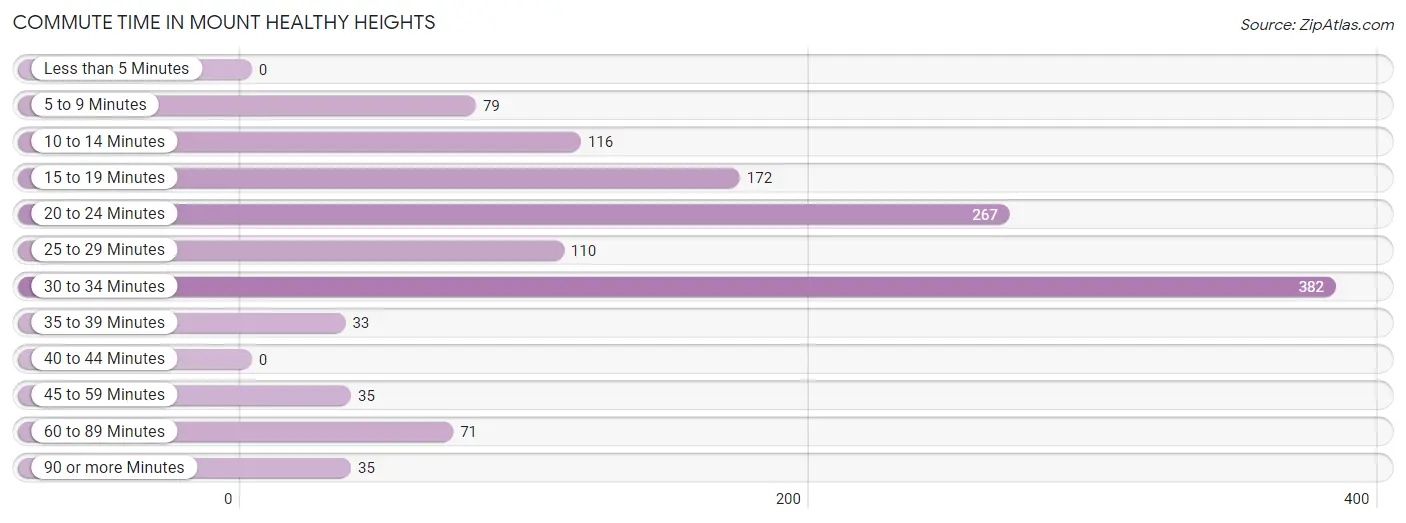
| Commute Time | # Commuters | % Commuters |
| Less than 5 Minutes | 0 | 0.0% |
| 5 to 9 Minutes | 79 | 6.1% |
| 10 to 14 Minutes | 116 | 8.9% |
| 15 to 19 Minutes | 172 | 13.2% |
| 20 to 24 Minutes | 267 | 20.5% |
| 25 to 29 Minutes | 110 | 8.5% |
| 30 to 34 Minutes | 382 | 29.4% |
| 35 to 39 Minutes | 33 | 2.5% |
| 40 to 44 Minutes | 0 | 0.0% |
| 45 to 59 Minutes | 35 | 2.7% |
| 60 to 89 Minutes | 71 | 5.5% |
| 90 or more Minutes | 35 | 2.7% |
Commute Time by Sex in Mount Healthy Heights
The most common commute times in Mount Healthy Heights are 30 to 34 minutes (330 commuters, 52.0%) for males and 20 to 24 minutes (213 commuters, 32.0%) for females.
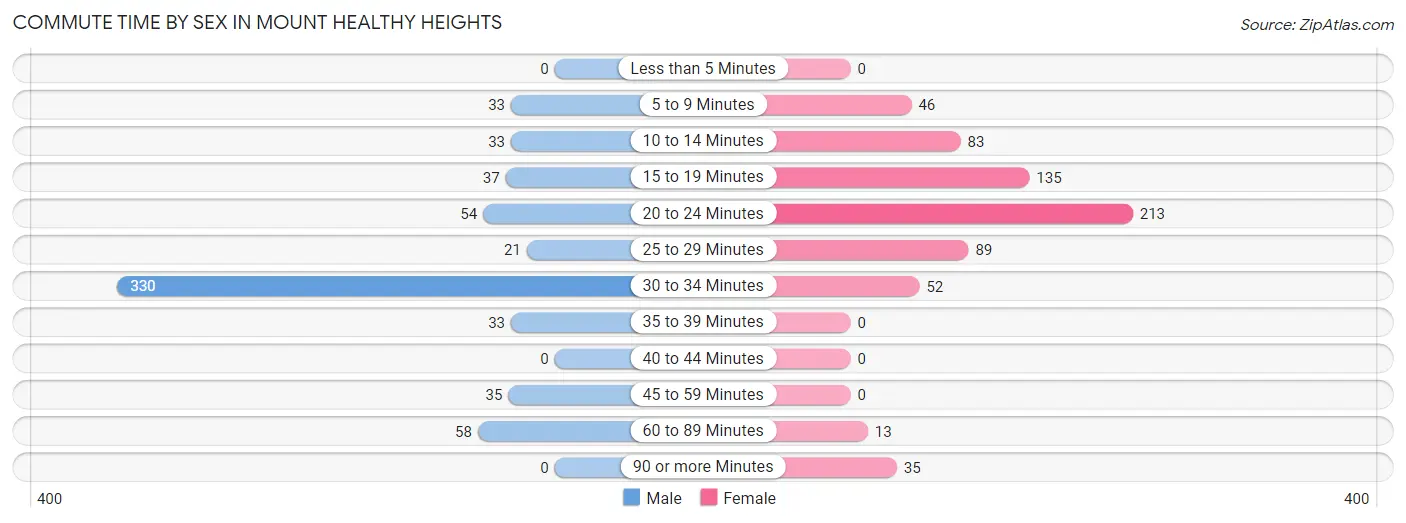
| Commute Time | Male | Female |
| Less than 5 Minutes | 0 (0.0%) | 0 (0.0%) |
| 5 to 9 Minutes | 33 (5.2%) | 46 (6.9%) |
| 10 to 14 Minutes | 33 (5.2%) | 83 (12.5%) |
| 15 to 19 Minutes | 37 (5.8%) | 135 (20.3%) |
| 20 to 24 Minutes | 54 (8.5%) | 213 (32.0%) |
| 25 to 29 Minutes | 21 (3.3%) | 89 (13.4%) |
| 30 to 34 Minutes | 330 (52.0%) | 52 (7.8%) |
| 35 to 39 Minutes | 33 (5.2%) | 0 (0.0%) |
| 40 to 44 Minutes | 0 (0.0%) | 0 (0.0%) |
| 45 to 59 Minutes | 35 (5.5%) | 0 (0.0%) |
| 60 to 89 Minutes | 58 (9.1%) | 13 (1.9%) |
| 90 or more Minutes | 0 (0.0%) | 35 (5.3%) |
Time of Departure to Work by Sex in Mount Healthy Heights
The most frequent times of departure to work in Mount Healthy Heights are 8:00 AM to 8:29 AM (84, 13.3%) for males and 6:30 AM to 6:59 AM (208, 31.2%) for females.
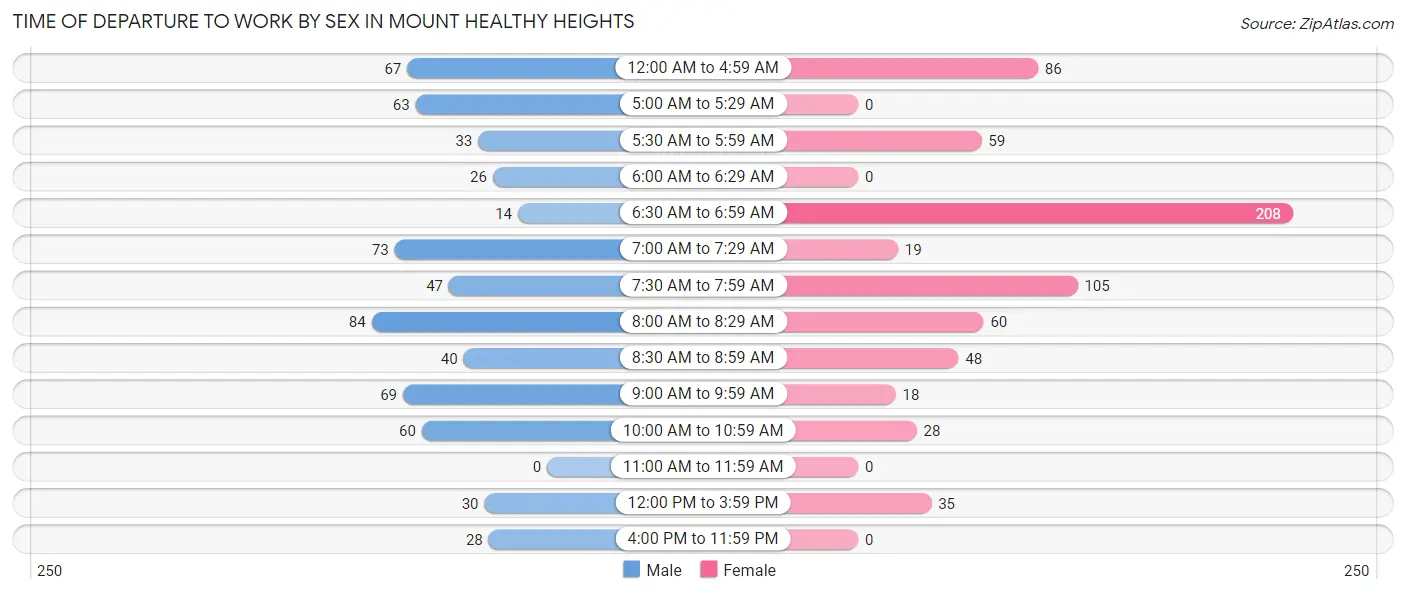
| Time of Departure | Male | Female |
| 12:00 AM to 4:59 AM | 67 (10.6%) | 86 (12.9%) |
| 5:00 AM to 5:29 AM | 63 (9.9%) | 0 (0.0%) |
| 5:30 AM to 5:59 AM | 33 (5.2%) | 59 (8.9%) |
| 6:00 AM to 6:29 AM | 26 (4.1%) | 0 (0.0%) |
| 6:30 AM to 6:59 AM | 14 (2.2%) | 208 (31.2%) |
| 7:00 AM to 7:29 AM | 73 (11.5%) | 19 (2.9%) |
| 7:30 AM to 7:59 AM | 47 (7.4%) | 105 (15.8%) |
| 8:00 AM to 8:29 AM | 84 (13.3%) | 60 (9.0%) |
| 8:30 AM to 8:59 AM | 40 (6.3%) | 48 (7.2%) |
| 9:00 AM to 9:59 AM | 69 (10.9%) | 18 (2.7%) |
| 10:00 AM to 10:59 AM | 60 (9.5%) | 28 (4.2%) |
| 11:00 AM to 11:59 AM | 0 (0.0%) | 0 (0.0%) |
| 12:00 PM to 3:59 PM | 30 (4.7%) | 35 (5.3%) |
| 4:00 PM to 11:59 PM | 28 (4.4%) | 0 (0.0%) |
| Total | 634 (100.0%) | 666 (100.0%) |
Housing Occupancy in Mount Healthy Heights
Occupancy by Ownership in Mount Healthy Heights
Of the total 1,131 dwellings in Mount Healthy Heights, owner-occupied units account for 651 (57.6%), while renter-occupied units make up 480 (42.4%).
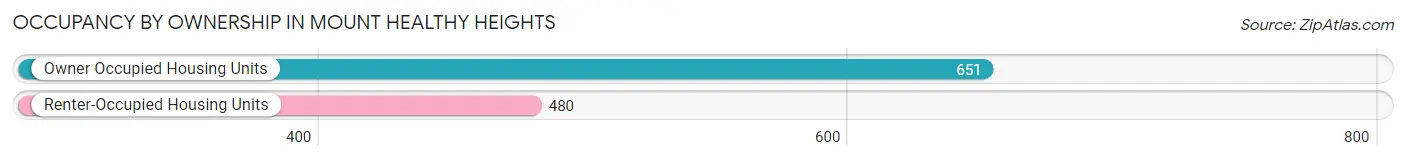
| Occupancy | # Housing Units | % Housing Units |
| Owner Occupied Housing Units | 651 | 57.6% |
| Renter-Occupied Housing Units | 480 | 42.4% |
| Total Occupied Housing Units | 1,131 | 100.0% |
Occupancy by Household Size in Mount Healthy Heights
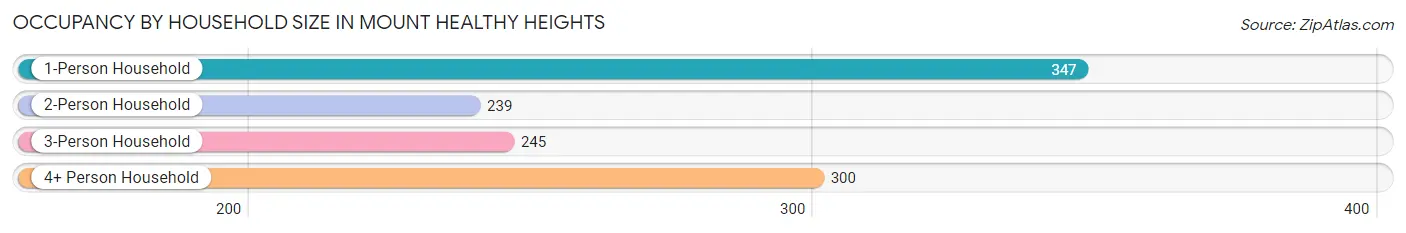
| Household Size | # Housing Units | % Housing Units |
| 1-Person Household | 347 | 30.7% |
| 2-Person Household | 239 | 21.1% |
| 3-Person Household | 245 | 21.7% |
| 4+ Person Household | 300 | 26.5% |
| Total Housing Units | 1,131 | 100.0% |
Occupancy by Ownership by Household Size in Mount Healthy Heights
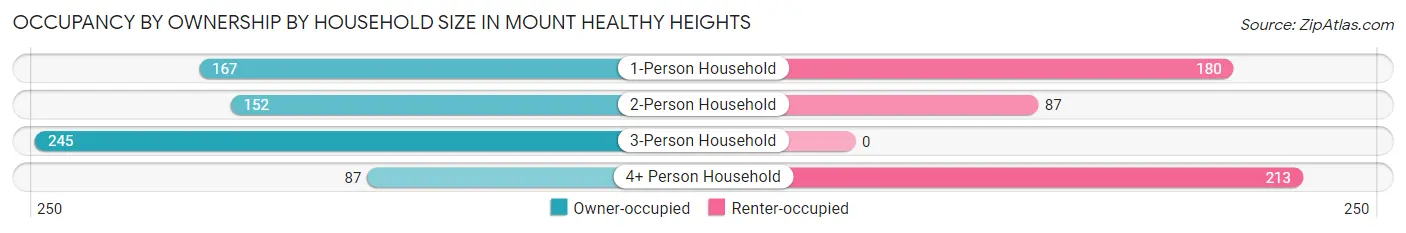
| Household Size | Owner-occupied | Renter-occupied |
| 1-Person Household | 167 (48.1%) | 180 (51.9%) |
| 2-Person Household | 152 (63.6%) | 87 (36.4%) |
| 3-Person Household | 245 (100.0%) | 0 (0.0%) |
| 4+ Person Household | 87 (29.0%) | 213 (71.0%) |
| Total Housing Units | 651 (57.6%) | 480 (42.4%) |
Occupancy by Educational Attainment in Mount Healthy Heights
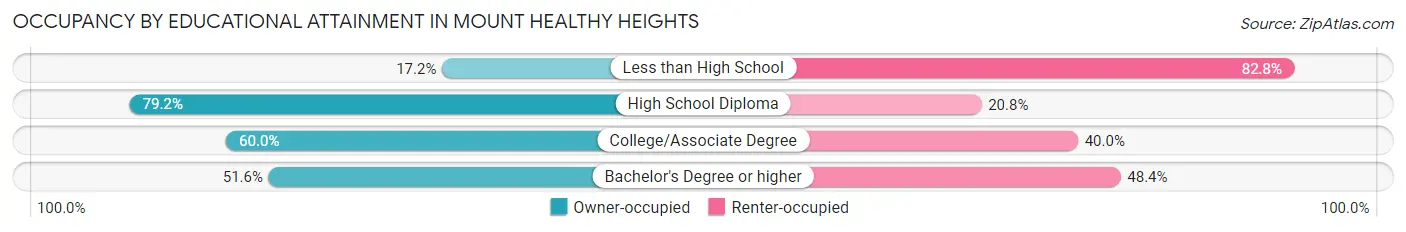
| Household Size | Owner-occupied | Renter-occupied |
| Less than High School | 16 (17.2%) | 77 (82.8%) |
| High School Diploma | 171 (79.2%) | 45 (20.8%) |
| College/Associate Degree | 284 (60.0%) | 189 (40.0%) |
| Bachelor's Degree or higher | 180 (51.6%) | 169 (48.4%) |
Occupancy by Age of Householder in Mount Healthy Heights
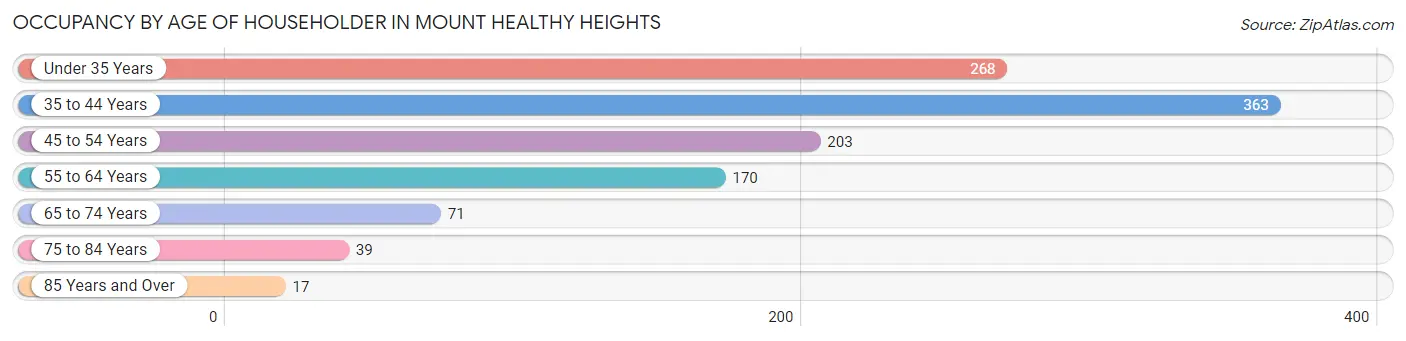
| Age Bracket | # Households | % Households |
| Under 35 Years | 268 | 23.7% |
| 35 to 44 Years | 363 | 32.1% |
| 45 to 54 Years | 203 | 17.9% |
| 55 to 64 Years | 170 | 15.0% |
| 65 to 74 Years | 71 | 6.3% |
| 75 to 84 Years | 39 | 3.5% |
| 85 Years and Over | 17 | 1.5% |
| Total | 1,131 | 100.0% |
Housing Finances in Mount Healthy Heights
Median Income by Occupancy in Mount Healthy Heights
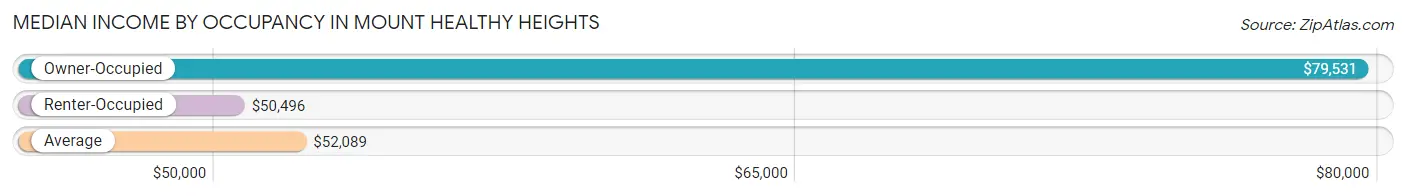
| Occupancy Type | # Households | Median Income |
| Owner-Occupied | 651 (57.6%) | $79,531 |
| Renter-Occupied | 480 (42.4%) | $50,496 |
| Average | 1,131 (100.0%) | $52,089 |
Occupancy by Householder Income Bracket in Mount Healthy Heights
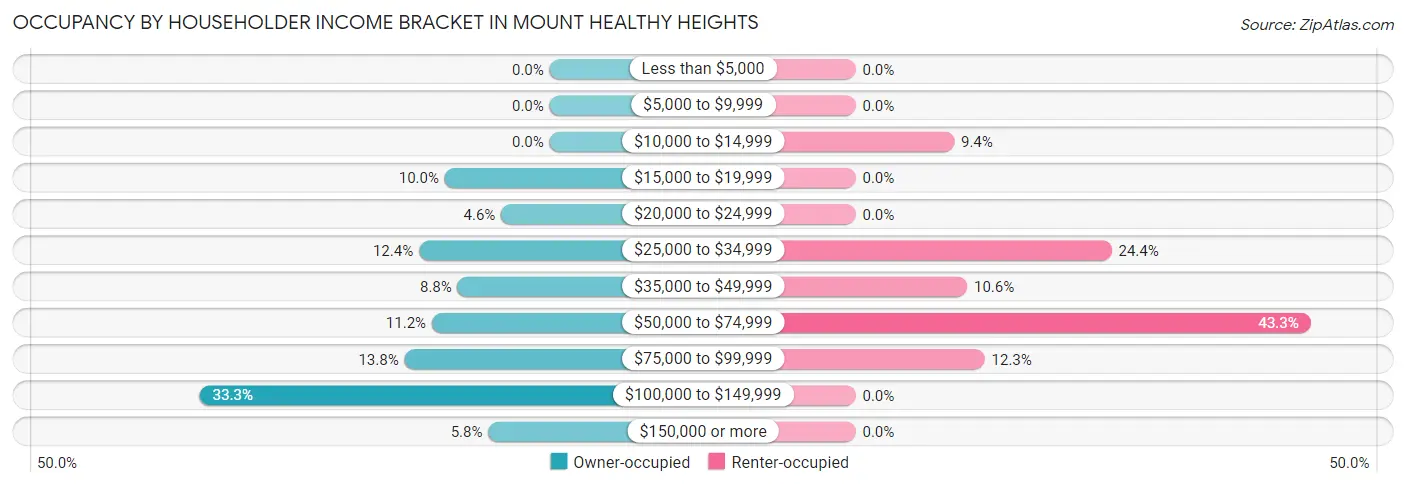
| Income Bracket | Owner-occupied | Renter-occupied |
| Less than $5,000 | 0 (0.0%) | 0 (0.0%) |
| $5,000 to $9,999 | 0 (0.0%) | 0 (0.0%) |
| $10,000 to $14,999 | 0 (0.0%) | 45 (9.4%) |
| $15,000 to $19,999 | 65 (10.0%) | 0 (0.0%) |
| $20,000 to $24,999 | 30 (4.6%) | 0 (0.0%) |
| $25,000 to $34,999 | 81 (12.4%) | 117 (24.4%) |
| $35,000 to $49,999 | 57 (8.8%) | 51 (10.6%) |
| $50,000 to $74,999 | 73 (11.2%) | 208 (43.3%) |
| $75,000 to $99,999 | 90 (13.8%) | 59 (12.3%) |
| $100,000 to $149,999 | 217 (33.3%) | 0 (0.0%) |
| $150,000 or more | 38 (5.8%) | 0 (0.0%) |
| Total | 651 (100.0%) | 480 (100.0%) |
Monthly Housing Cost Tiers in Mount Healthy Heights
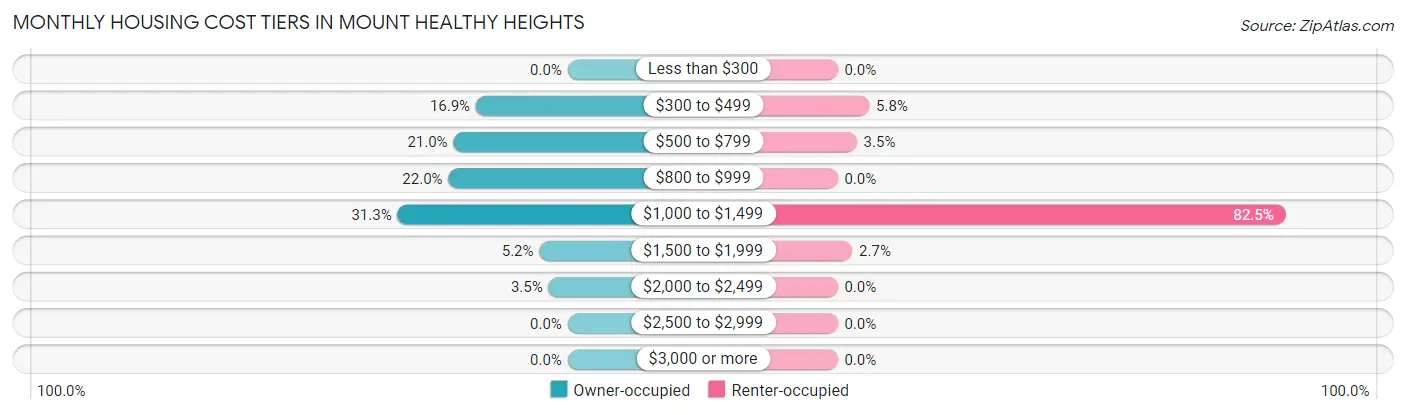
| Monthly Cost | Owner-occupied | Renter-occupied |
| Less than $300 | 0 (0.0%) | 0 (0.0%) |
| $300 to $499 | 110 (16.9%) | 28 (5.8%) |
| $500 to $799 | 137 (21.0%) | 17 (3.5%) |
| $800 to $999 | 143 (22.0%) | 0 (0.0%) |
| $1,000 to $1,499 | 204 (31.3%) | 396 (82.5%) |
| $1,500 to $1,999 | 34 (5.2%) | 13 (2.7%) |
| $2,000 to $2,499 | 23 (3.5%) | 0 (0.0%) |
| $2,500 to $2,999 | 0 (0.0%) | 0 (0.0%) |
| $3,000 or more | 0 (0.0%) | 0 (0.0%) |
| Total | 651 (100.0%) | 480 (100.0%) |
Physical Housing Characteristics in Mount Healthy Heights
Housing Structures in Mount Healthy Heights
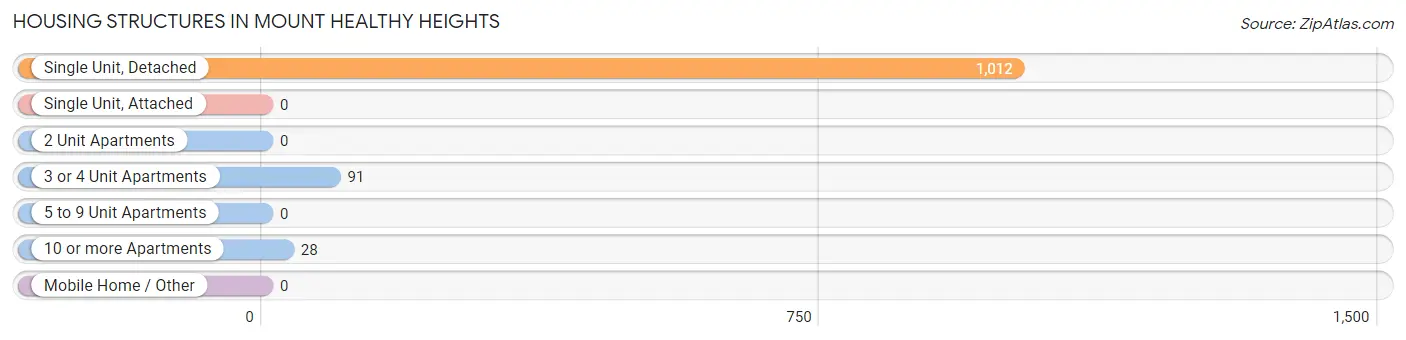
| Structure Type | # Housing Units | % Housing Units |
| Single Unit, Detached | 1,012 | 89.5% |
| Single Unit, Attached | 0 | 0.0% |
| 2 Unit Apartments | 0 | 0.0% |
| 3 or 4 Unit Apartments | 91 | 8.1% |
| 5 to 9 Unit Apartments | 0 | 0.0% |
| 10 or more Apartments | 28 | 2.5% |
| Mobile Home / Other | 0 | 0.0% |
| Total | 1,131 | 100.0% |
Housing Structures by Occupancy in Mount Healthy Heights
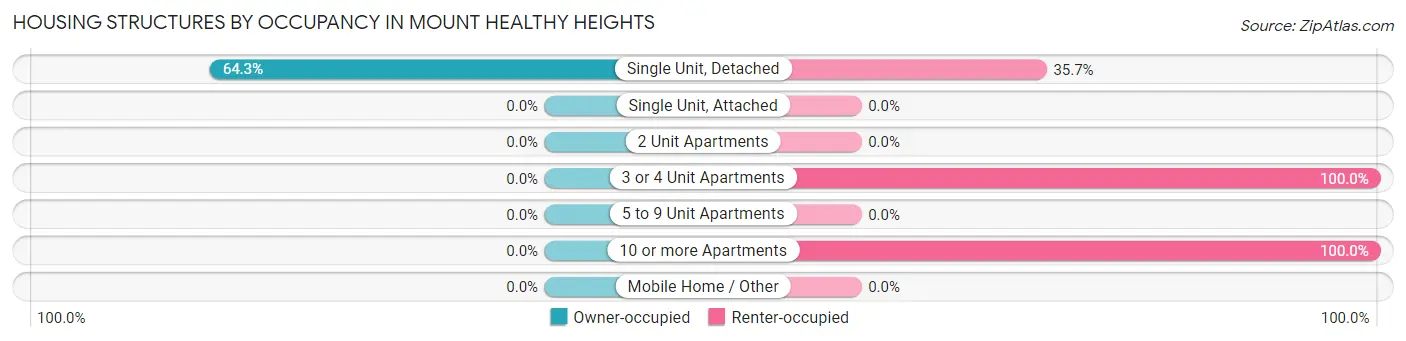
| Structure Type | Owner-occupied | Renter-occupied |
| Single Unit, Detached | 651 (64.3%) | 361 (35.7%) |
| Single Unit, Attached | 0 (0.0%) | 0 (0.0%) |
| 2 Unit Apartments | 0 (0.0%) | 0 (0.0%) |
| 3 or 4 Unit Apartments | 0 (0.0%) | 91 (100.0%) |
| 5 to 9 Unit Apartments | 0 (0.0%) | 0 (0.0%) |
| 10 or more Apartments | 0 (0.0%) | 28 (100.0%) |
| Mobile Home / Other | 0 (0.0%) | 0 (0.0%) |
| Total | 651 (57.6%) | 480 (42.4%) |
Housing Structures by Number of Rooms in Mount Healthy Heights
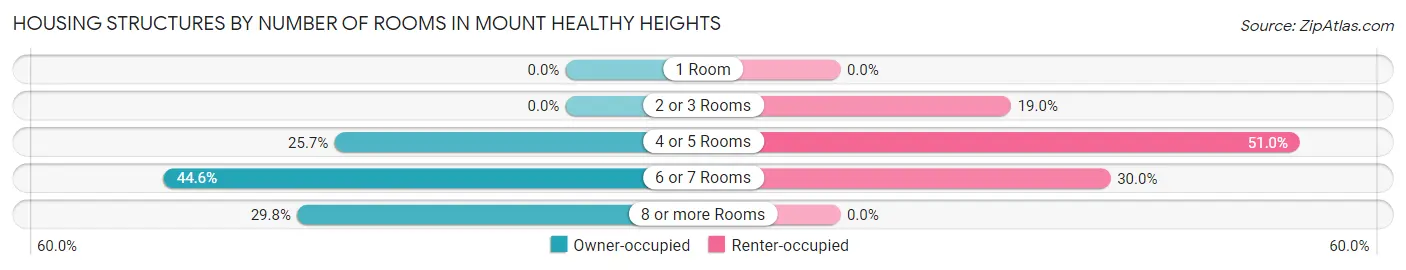
| Number of Rooms | Owner-occupied | Renter-occupied |
| 1 Room | 0 (0.0%) | 0 (0.0%) |
| 2 or 3 Rooms | 0 (0.0%) | 91 (19.0%) |
| 4 or 5 Rooms | 167 (25.7%) | 245 (51.0%) |
| 6 or 7 Rooms | 290 (44.6%) | 144 (30.0%) |
| 8 or more Rooms | 194 (29.8%) | 0 (0.0%) |
| Total | 651 (100.0%) | 480 (100.0%) |
Housing Structure by Heating Type in Mount Healthy Heights
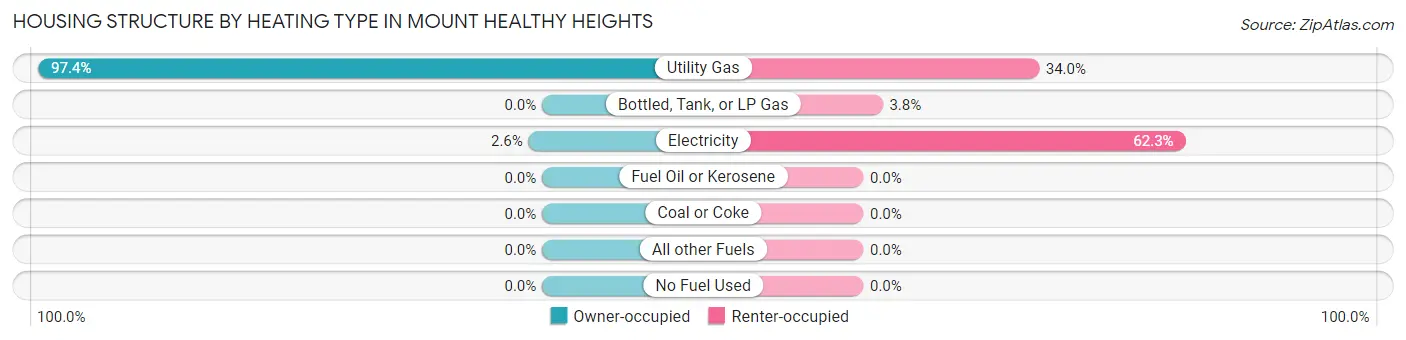
| Heating Type | Owner-occupied | Renter-occupied |
| Utility Gas | 634 (97.4%) | 163 (34.0%) |
| Bottled, Tank, or LP Gas | 0 (0.0%) | 18 (3.7%) |
| Electricity | 17 (2.6%) | 299 (62.3%) |
| Fuel Oil or Kerosene | 0 (0.0%) | 0 (0.0%) |
| Coal or Coke | 0 (0.0%) | 0 (0.0%) |
| All other Fuels | 0 (0.0%) | 0 (0.0%) |
| No Fuel Used | 0 (0.0%) | 0 (0.0%) |
| Total | 651 (100.0%) | 480 (100.0%) |
Household Vehicle Usage in Mount Healthy Heights
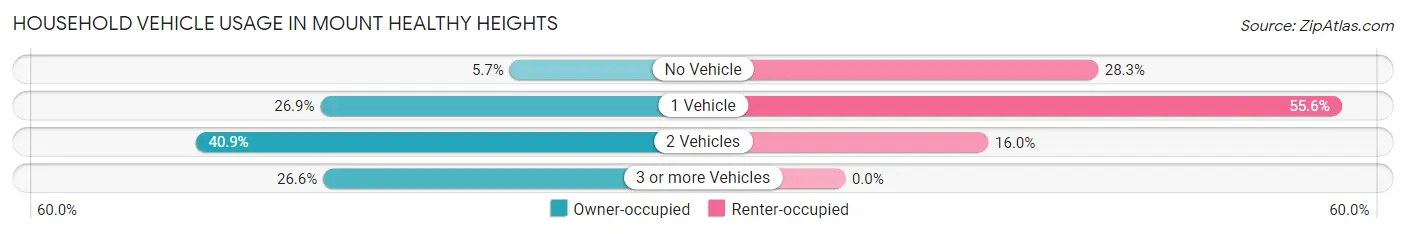
| Vehicles per Household | Owner-occupied | Renter-occupied |
| No Vehicle | 37 (5.7%) | 136 (28.3%) |
| 1 Vehicle | 175 (26.9%) | 267 (55.6%) |
| 2 Vehicles | 266 (40.9%) | 77 (16.0%) |
| 3 or more Vehicles | 173 (26.6%) | 0 (0.0%) |
| Total | 651 (100.0%) | 480 (100.0%) |
Real Estate & Mortgages in Mount Healthy Heights
Real Estate and Mortgage Overview in Mount Healthy Heights
| Characteristic | Without Mortgage | With Mortgage |
| Housing Units | 277 | 374 |
| Median Property Value | $116,700 | $142,600 |
| Median Household Income | $118,125 | $23 |
| Monthly Housing Costs | $589 | $0 |
| Real Estate Taxes | $2,310 | $0 |
Property Value by Mortgage Status in Mount Healthy Heights
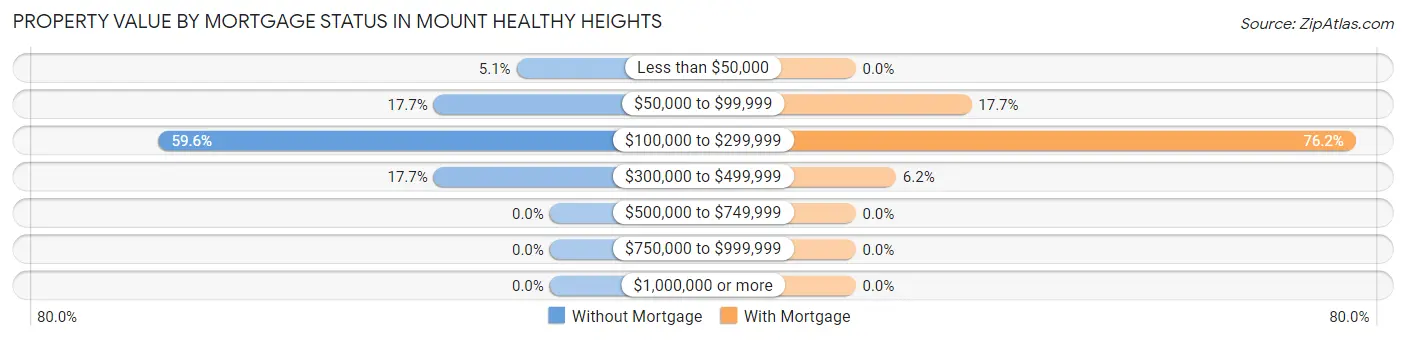
| Property Value | Without Mortgage | With Mortgage |
| Less than $50,000 | 14 (5.1%) | 0 (0.0%) |
| $50,000 to $99,999 | 49 (17.7%) | 66 (17.6%) |
| $100,000 to $299,999 | 165 (59.6%) | 285 (76.2%) |
| $300,000 to $499,999 | 49 (17.7%) | 23 (6.1%) |
| $500,000 to $749,999 | 0 (0.0%) | 0 (0.0%) |
| $750,000 to $999,999 | 0 (0.0%) | 0 (0.0%) |
| $1,000,000 or more | 0 (0.0%) | 0 (0.0%) |
| Total | 277 (100.0%) | 374 (100.0%) |
Household Income by Mortgage Status in Mount Healthy Heights
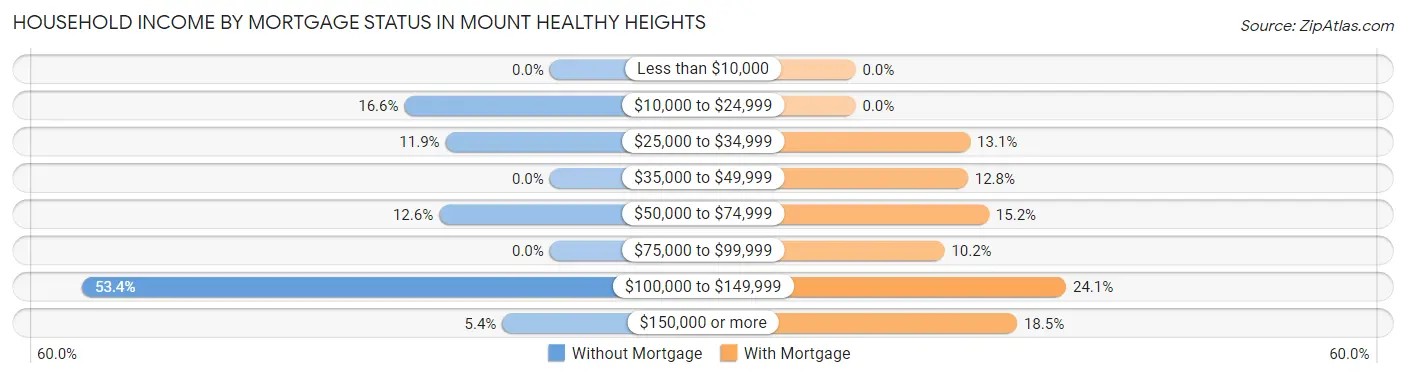
| Household Income | Without Mortgage | With Mortgage |
| Less than $10,000 | 0 (0.0%) | 0 (0.0%) |
| $10,000 to $24,999 | 46 (16.6%) | 0 (0.0%) |
| $25,000 to $34,999 | 33 (11.9%) | 49 (13.1%) |
| $35,000 to $49,999 | 0 (0.0%) | 48 (12.8%) |
| $50,000 to $74,999 | 35 (12.6%) | 57 (15.2%) |
| $75,000 to $99,999 | 0 (0.0%) | 38 (10.2%) |
| $100,000 to $149,999 | 148 (53.4%) | 90 (24.1%) |
| $150,000 or more | 15 (5.4%) | 69 (18.4%) |
| Total | 277 (100.0%) | 374 (100.0%) |
Property Value to Household Income Ratio in Mount Healthy Heights
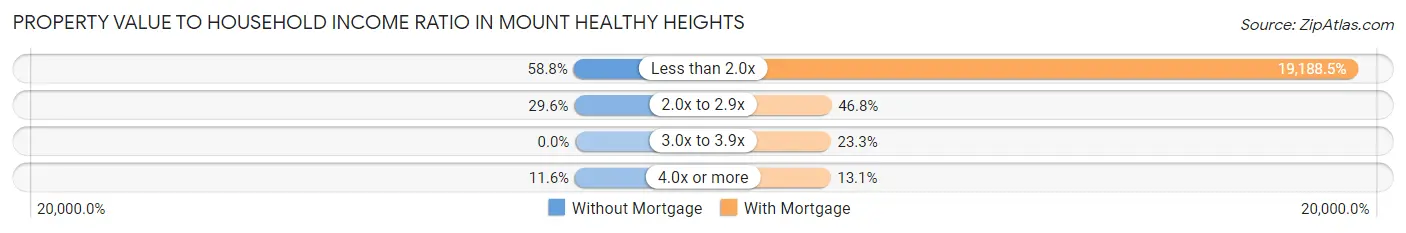
| Value-to-Income Ratio | Without Mortgage | With Mortgage |
| Less than 2.0x | 163 (58.8%) | 71,765 (19,188.5%) |
| 2.0x to 2.9x | 82 (29.6%) | 175 (46.8%) |
| 3.0x to 3.9x | 0 (0.0%) | 87 (23.3%) |
| 4.0x or more | 32 (11.6%) | 49 (13.1%) |
| Total | 277 (100.0%) | 374 (100.0%) |
Real Estate Taxes by Mortgage Status in Mount Healthy Heights
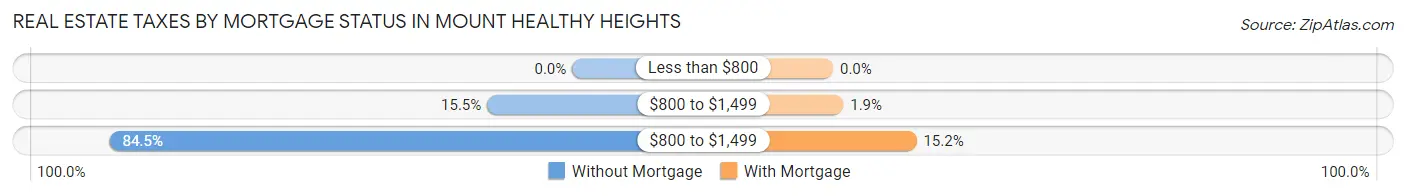
| Property Taxes | Without Mortgage | With Mortgage |
| Less than $800 | 0 (0.0%) | 0 (0.0%) |
| $800 to $1,499 | 43 (15.5%) | 7 (1.9%) |
| $800 to $1,499 | 234 (84.5%) | 57 (15.2%) |
| Total | 277 (100.0%) | 374 (100.0%) |
Health & Disability in Mount Healthy Heights
Health Insurance Coverage by Age in Mount Healthy Heights
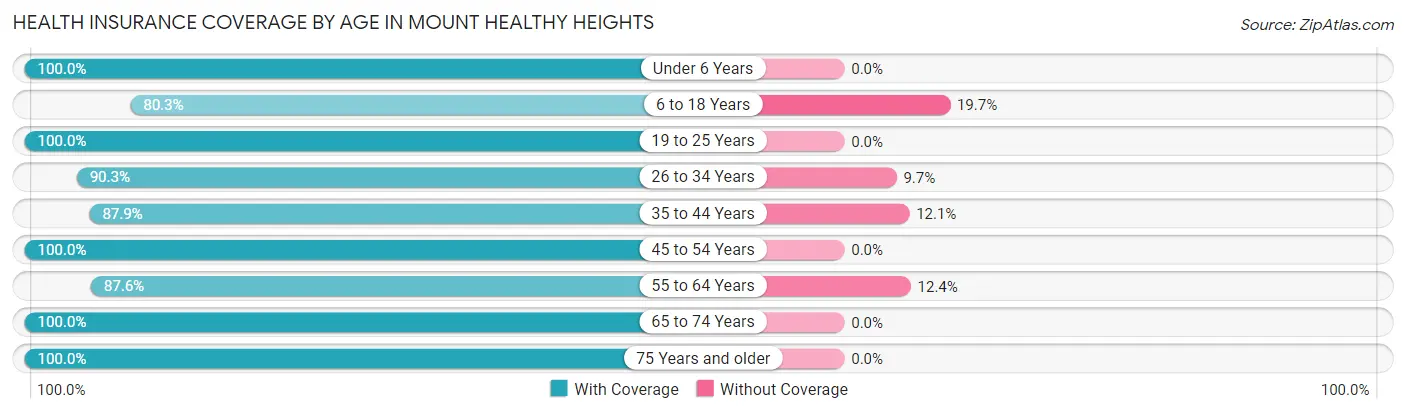
| Age Bracket | With Coverage | Without Coverage |
| Under 6 Years | 408 (100.0%) | 0 (0.0%) |
| 6 to 18 Years | 672 (80.3%) | 165 (19.7%) |
| 19 to 25 Years | 52 (100.0%) | 0 (0.0%) |
| 26 to 34 Years | 371 (90.3%) | 40 (9.7%) |
| 35 to 44 Years | 465 (87.9%) | 64 (12.1%) |
| 45 to 54 Years | 344 (100.0%) | 0 (0.0%) |
| 55 to 64 Years | 262 (87.6%) | 37 (12.4%) |
| 65 to 74 Years | 156 (100.0%) | 0 (0.0%) |
| 75 Years and older | 99 (100.0%) | 0 (0.0%) |
| Total | 2,829 (90.2%) | 306 (9.8%) |
Health Insurance Coverage by Citizenship Status in Mount Healthy Heights
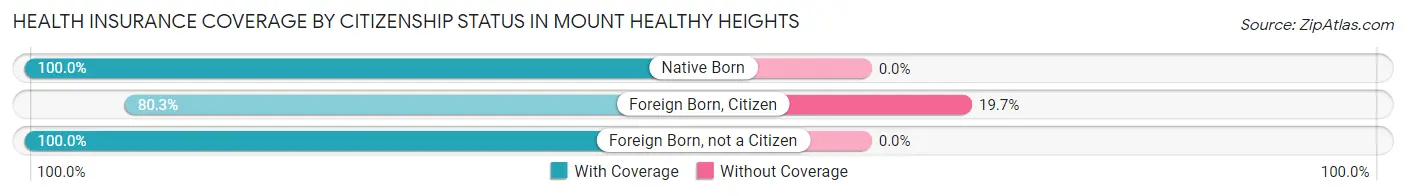
| Citizenship Status | With Coverage | Without Coverage |
| Native Born | 408 (100.0%) | 0 (0.0%) |
| Foreign Born, Citizen | 672 (80.3%) | 165 (19.7%) |
| Foreign Born, not a Citizen | 52 (100.0%) | 0 (0.0%) |
Health Insurance Coverage by Household Income in Mount Healthy Heights
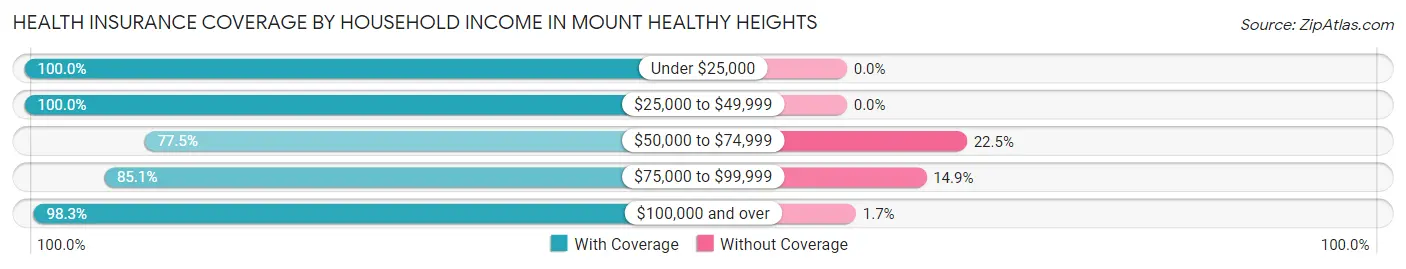
| Household Income | With Coverage | Without Coverage |
| Under $25,000 | 238 (100.0%) | 0 (0.0%) |
| $25,000 to $49,999 | 685 (100.0%) | 0 (0.0%) |
| $50,000 to $74,999 | 790 (77.5%) | 229 (22.5%) |
| $75,000 to $99,999 | 366 (85.1%) | 64 (14.9%) |
| $100,000 and over | 750 (98.3%) | 13 (1.7%) |
Public vs Private Health Insurance Coverage by Age in Mount Healthy Heights
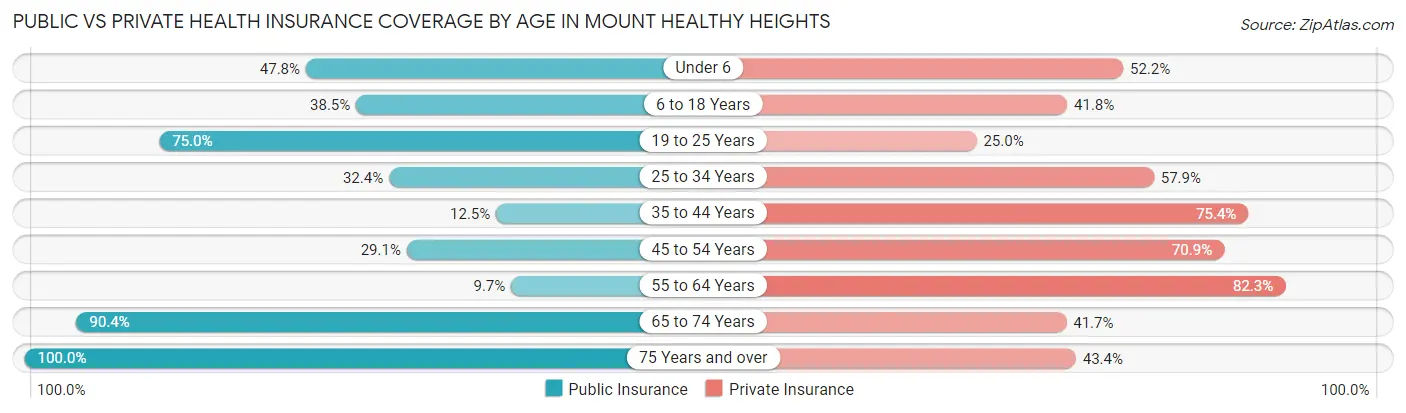
| Age Bracket | Public Insurance | Private Insurance |
| Under 6 | 195 (47.8%) | 213 (52.2%) |
| 6 to 18 Years | 322 (38.5%) | 350 (41.8%) |
| 19 to 25 Years | 39 (75.0%) | 13 (25.0%) |
| 25 to 34 Years | 133 (32.4%) | 238 (57.9%) |
| 35 to 44 Years | 66 (12.5%) | 399 (75.4%) |
| 45 to 54 Years | 100 (29.1%) | 244 (70.9%) |
| 55 to 64 Years | 29 (9.7%) | 246 (82.3%) |
| 65 to 74 Years | 141 (90.4%) | 65 (41.7%) |
| 75 Years and over | 99 (100.0%) | 43 (43.4%) |
| Total | 1,124 (35.8%) | 1,811 (57.8%) |
Disability Status by Sex by Age in Mount Healthy Heights
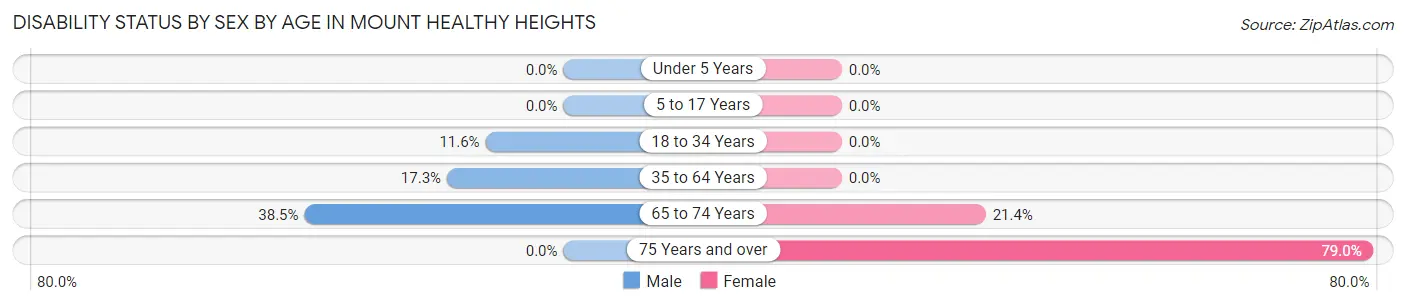
| Age Bracket | Male | Female |
| Under 5 Years | 0 (0.0%) | 0 (0.0%) |
| 5 to 17 Years | 0 (0.0%) | 0 (0.0%) |
| 18 to 34 Years | 39 (11.6%) | 0 (0.0%) |
| 35 to 64 Years | 88 (17.3%) | 0 (0.0%) |
| 65 to 74 Years | 15 (38.5%) | 25 (21.4%) |
| 75 Years and over | 0 (0.0%) | 60 (78.9%) |
Disability Class by Sex by Age in Mount Healthy Heights
Disability Class: Hearing Difficulty
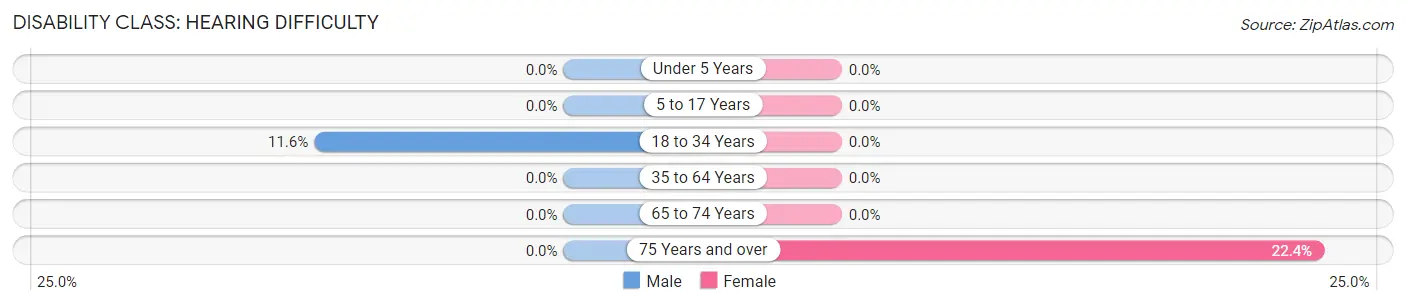
| Age Bracket | Male | Female |
| Under 5 Years | 0 (0.0%) | 0 (0.0%) |
| 5 to 17 Years | 0 (0.0%) | 0 (0.0%) |
| 18 to 34 Years | 39 (11.6%) | 0 (0.0%) |
| 35 to 64 Years | 0 (0.0%) | 0 (0.0%) |
| 65 to 74 Years | 0 (0.0%) | 0 (0.0%) |
| 75 Years and over | 0 (0.0%) | 17 (22.4%) |
Disability Class: Vision Difficulty
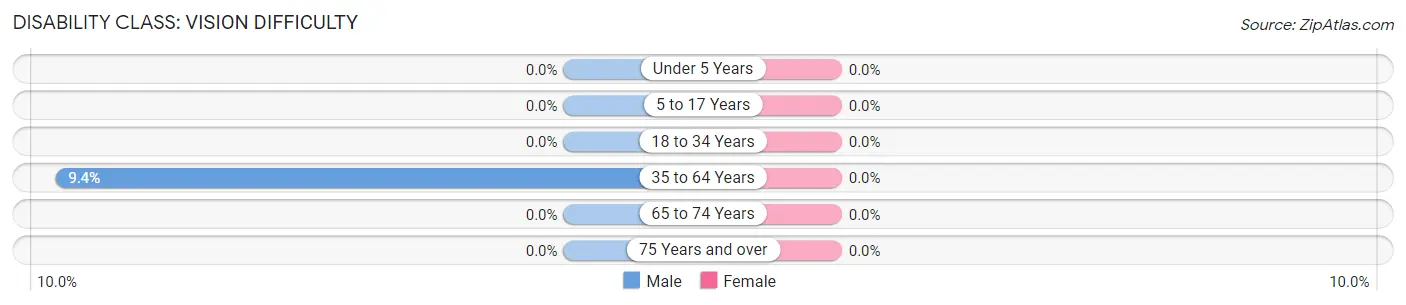
| Age Bracket | Male | Female |
| Under 5 Years | 0 (0.0%) | 0 (0.0%) |
| 5 to 17 Years | 0 (0.0%) | 0 (0.0%) |
| 18 to 34 Years | 0 (0.0%) | 0 (0.0%) |
| 35 to 64 Years | 48 (9.4%) | 0 (0.0%) |
| 65 to 74 Years | 0 (0.0%) | 0 (0.0%) |
| 75 Years and over | 0 (0.0%) | 0 (0.0%) |
Disability Class: Cognitive Difficulty
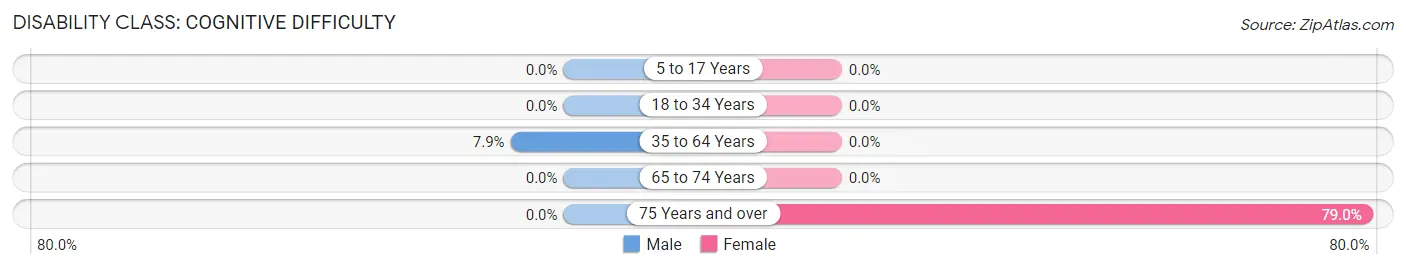
| Age Bracket | Male | Female |
| 5 to 17 Years | 0 (0.0%) | 0 (0.0%) |
| 18 to 34 Years | 0 (0.0%) | 0 (0.0%) |
| 35 to 64 Years | 40 (7.9%) | 0 (0.0%) |
| 65 to 74 Years | 0 (0.0%) | 0 (0.0%) |
| 75 Years and over | 0 (0.0%) | 60 (78.9%) |
Disability Class: Ambulatory Difficulty
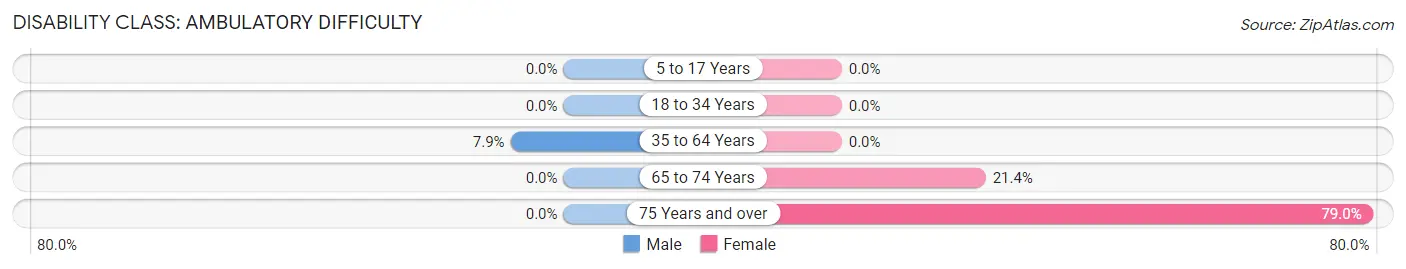
| Age Bracket | Male | Female |
| 5 to 17 Years | 0 (0.0%) | 0 (0.0%) |
| 18 to 34 Years | 0 (0.0%) | 0 (0.0%) |
| 35 to 64 Years | 40 (7.9%) | 0 (0.0%) |
| 65 to 74 Years | 0 (0.0%) | 25 (21.4%) |
| 75 Years and over | 0 (0.0%) | 60 (78.9%) |
Disability Class: Self-Care Difficulty
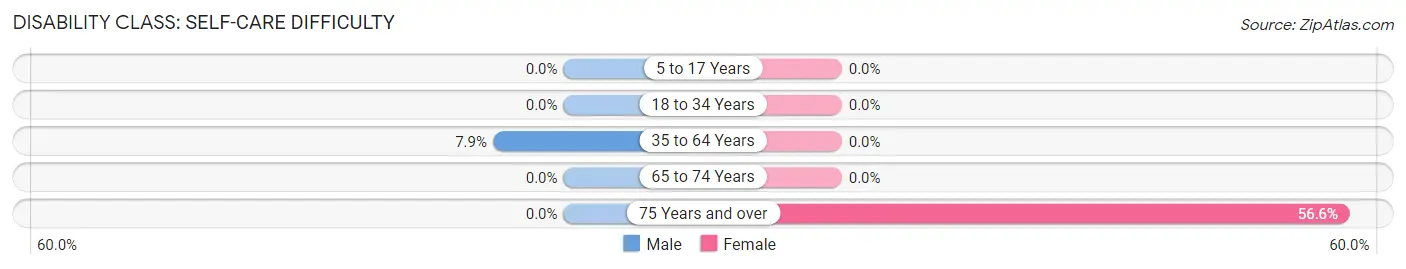
| Age Bracket | Male | Female |
| 5 to 17 Years | 0 (0.0%) | 0 (0.0%) |
| 18 to 34 Years | 0 (0.0%) | 0 (0.0%) |
| 35 to 64 Years | 40 (7.9%) | 0 (0.0%) |
| 65 to 74 Years | 0 (0.0%) | 0 (0.0%) |
| 75 Years and over | 0 (0.0%) | 43 (56.6%) |
Technology Access in Mount Healthy Heights
Computing Device Access in Mount Healthy Heights
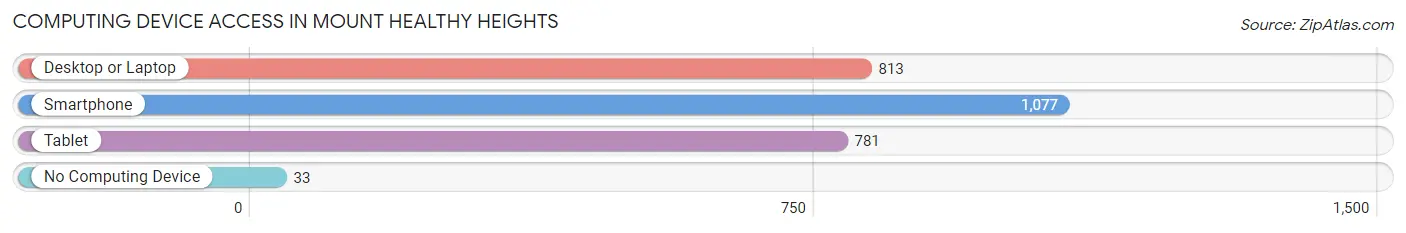
| Device Type | # Households | % Households |
| Desktop or Laptop | 813 | 71.9% |
| Smartphone | 1,077 | 95.2% |
| Tablet | 781 | 69.1% |
| No Computing Device | 33 | 2.9% |
| Total | 1,131 | 100.0% |
Internet Access in Mount Healthy Heights
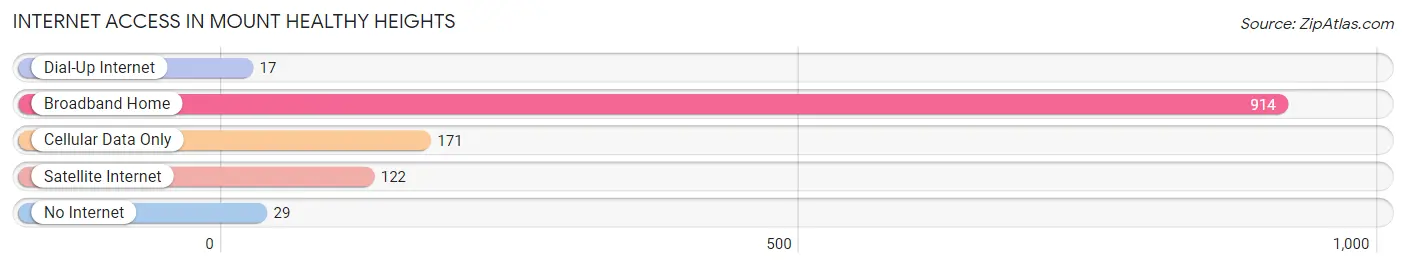
| Internet Type | # Households | % Households |
| Dial-Up Internet | 17 | 1.5% |
| Broadband Home | 914 | 80.8% |
| Cellular Data Only | 171 | 15.1% |
| Satellite Internet | 122 | 10.8% |
| No Internet | 29 | 2.6% |
| Total | 1,131 | 100.0% |
Mount Healthy Heights Summary
History
Mount Healthy Heights is a small city located in Hamilton County, Ohio. It is a suburb of Cincinnati and is part of the Cincinnati Metropolitan Statistical Area. The city was founded in 1817 and was originally known as Mount Healthy. The name was changed to Mount Healthy Heights in 1891.
The city was originally settled by German immigrants who were attracted to the area by its fertile soil and abundant natural resources. The first settlers were farmers who grew wheat, corn, and other crops. The city was also home to a number of small businesses, including a sawmill, a gristmill, and a blacksmith shop.
In the late 19th century, the city began to grow rapidly as the Cincinnati streetcar system was extended to the area. This allowed for easy access to the city and made it a desirable place to live. The population of the city grew from just over 500 in 1890 to over 3,000 by 1910.
The city continued to grow throughout the 20th century, reaching a peak population of over 5,000 in the 1970s. Since then, the population has declined slightly, but the city remains a vibrant and diverse community.
Geography
Mount Healthy Heights is located in Hamilton County, Ohio, approximately 10 miles north of downtown Cincinnati. The city is situated on the banks of the Mill Creek, a tributary of the Ohio River. The city covers an area of 1.7 square miles and has a population of 4,845 as of the 2010 census.
The city is primarily residential, with a mix of single-family homes, townhouses, and apartment buildings. The city also has several parks, including Mount Healthy Park, which features a playground, basketball courts, and a walking trail.
Economy
The economy of Mount Healthy Heights is largely based on the service industry. The city is home to a number of restaurants, retail stores, and other businesses. The city also has a number of manufacturing companies, including a plastics manufacturer and a metal fabrication company.
The city is also home to a number of educational institutions, including the University of Cincinnati, Cincinnati State Technical and Community College, and the Cincinnati College of Mortuary Science.
Demographics
As of the 2010 census, the population of Mount Healthy Heights was 4,845. The racial makeup of the city was 79.3% White, 15.2% African American, 0.3% Native American, 1.2% Asian, 0.1% Pacific Islander, 1.2% from other races, and 2.9% from two or more races. Hispanic or Latino of any race were 3.3% of the population.
The median household income in the city was $41,944, and the median family income was $50,917. The per capita income was $20,945. About 11.3% of families and 14.2% of the population were below the poverty line, including 22.2% of those under age 18 and 8.2% of those age 65 or over.
Common Questions
What is the Total Population of Mount Healthy Heights?
Total Population of Mount Healthy Heights is 3,135.
What is the Total Male Population of Mount Healthy Heights?
Total Male Population of Mount Healthy Heights is 1,573.
What is the Total Female Population of Mount Healthy Heights?
Total Female Population of Mount Healthy Heights is 1,562.
What is the Ratio of Males per 100 Females in Mount Healthy Heights?
There are 100.70 Males per 100 Females in Mount Healthy Heights.
What is the Ratio of Females per 100 Males in Mount Healthy Heights?
There are 99.30 Females per 100 Males in Mount Healthy Heights.
What is the Median Population Age in Mount Healthy Heights?
Median Population Age in Mount Healthy Heights is 29.3 Years.
What is the Average Family Size in Mount Healthy Heights
Average Family Size in Mount Healthy Heights is 3.6 People.
What is the Average Household Size in Mount Healthy Heights
Average Household Size in Mount Healthy Heights is 2.8 People.
What is Per Capita Income in Mount Healthy Heights?
Per Capita income in Mount Healthy Heights is $25,676.
What is the Median Family Income in Mount Healthy Heights?
Median Family Income in Mount Healthy Heights is $78,378.
What is the Median Household income in Mount Healthy Heights?
Median Household Income in Mount Healthy Heights is $52,089.
What is Income or Wage Gap in Mount Healthy Heights?
Income or Wage Gap in Mount Healthy Heights is 5.4%.
Women in Mount Healthy Heights earn 94.6 cents for every dollar earned by a man.
What is Inequality or Gini Index in Mount Healthy Heights?
Inequality or Gini Index in Mount Healthy Heights is 0.35.
How Large is the Labor Force in Mount Healthy Heights?
There are 1,451 People in the Labor Forcein in Mount Healthy Heights.
What is the Percentage of People in the Labor Force in Mount Healthy Heights?
75.7% of People are in the Labor Force in Mount Healthy Heights.
What is the Unemployment Rate in Mount Healthy Heights?
Unemployment Rate in Mount Healthy Heights is 7.0%.