Turpin Hills, OH
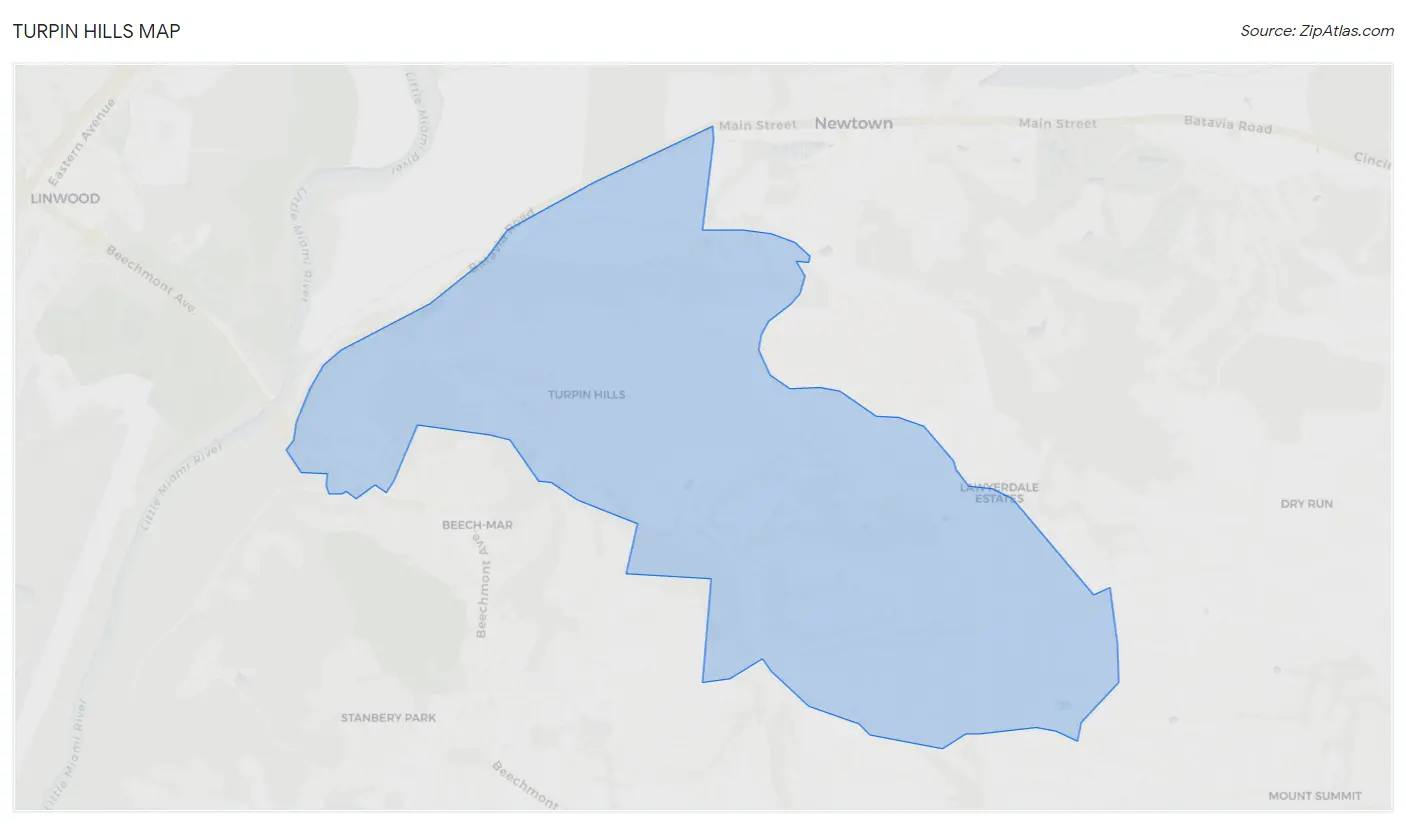
Turpin Hills Map
Turpin Hills Overview
5,831
TOTAL POPULATION
3,263
MALE POPULATION
2,568
FEMALE POPULATION
127.06
MALES / 100 FEMALES
78.70
FEMALES / 100 MALES
39.2
MEDIAN AGE
3.4
AVG FAMILY SIZE
3.0
AVG HOUSEHOLD SIZE
$65,209
PER CAPITA INCOME
$169,583
AVG FAMILY INCOME
$145,817
AVG HOUSEHOLD INCOME
31.9%
WAGE / INCOME GAP [ % ]
68.1¢/ $1
WAGE / INCOME GAP [ $ ]
0.43
INEQUALITY / GINI INDEX
3,210
LABOR FORCE [ PEOPLE ]
77.2%
PERCENT IN LABOR FORCE
3.6%
UNEMPLOYMENT RATE
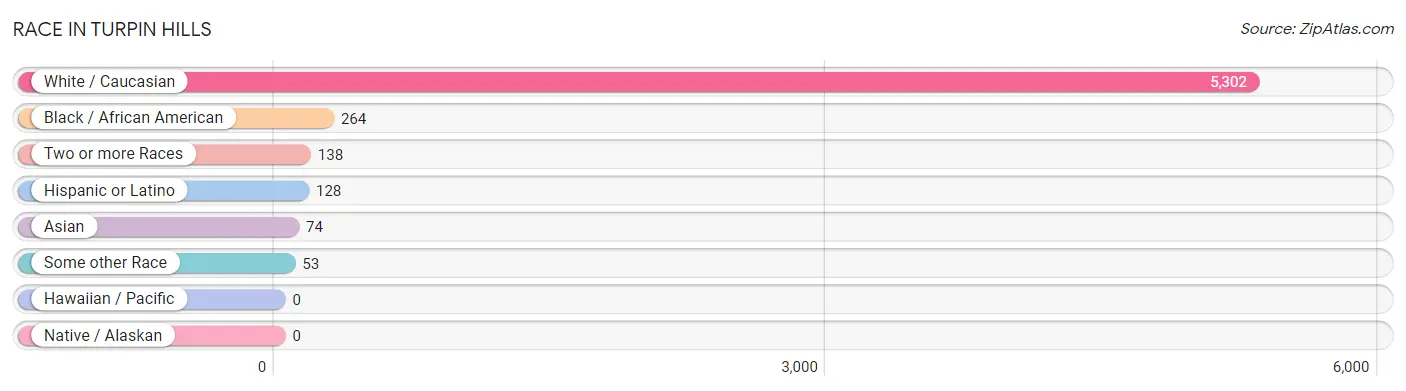
Race in Turpin Hills
The most populous races in Turpin Hills are White / Caucasian (5,302 | 90.9%), Black / African American (264 | 4.5%), and Two or more Races (138 | 2.4%).
| Race | # Population | % Population |
| Asian | 74 | 1.3% |
| Black / African American | 264 | 4.5% |
| Hawaiian / Pacific | 0 | 0.0% |
| Hispanic or Latino | 128 | 2.2% |
| Native / Alaskan | 0 | 0.0% |
| White / Caucasian | 5,302 | 90.9% |
| Two or more Races | 138 | 2.4% |
| Some other Race | 53 | 0.9% |
| Total | 5,831 | 100.0% |
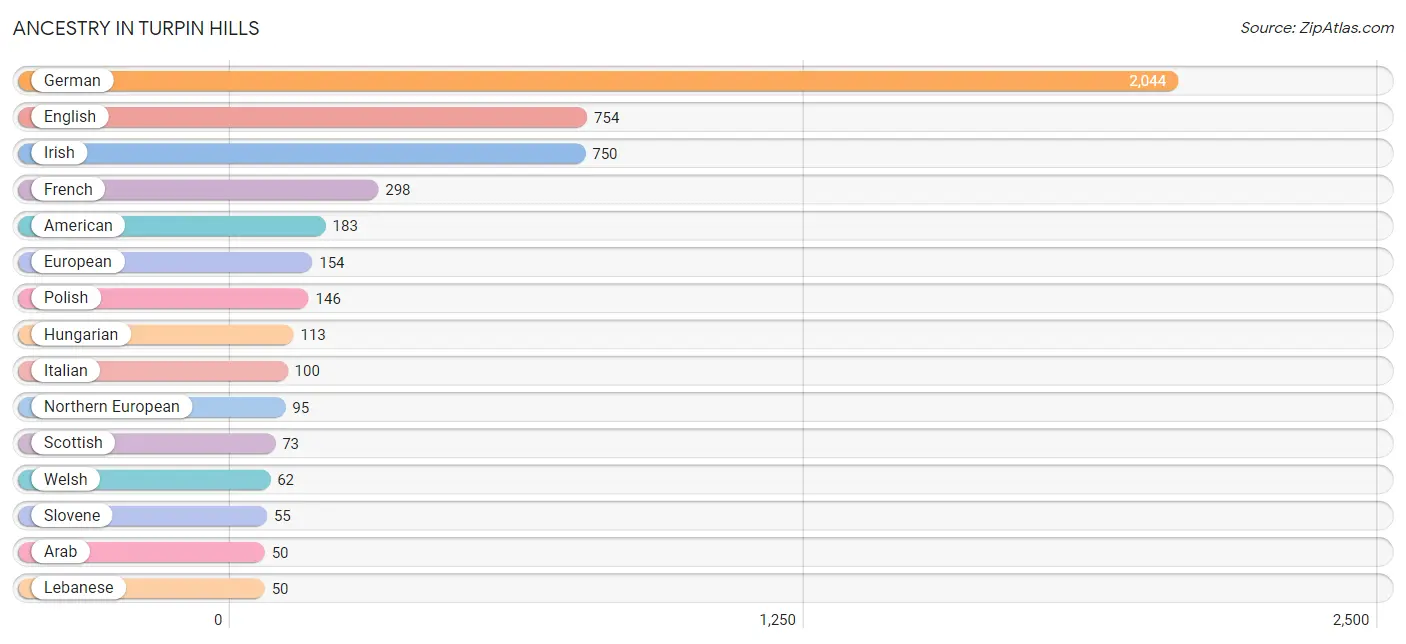
Ancestry in Turpin Hills
The most populous ancestries reported in Turpin Hills are German (2,044 | 35.0%), English (754 | 12.9%), Irish (750 | 12.9%), French (298 | 5.1%), and American (183 | 3.1%), together accounting for 69.1% of all Turpin Hills residents.
| Ancestry | # Population | % Population |
| American | 183 | 3.1% |
| Arab | 50 | 0.9% |
| Bhutanese | 35 | 0.6% |
| Brazilian | 32 | 0.5% |
| British | 25 | 0.4% |
| Central American | 42 | 0.7% |
| Cuban | 8 | 0.1% |
| Czech | 15 | 0.3% |
| Dutch | 9 | 0.2% |
| Eastern European | 34 | 0.6% |
| Ecuadorian | 36 | 0.6% |
| English | 754 | 12.9% |
| European | 154 | 2.6% |
| French | 298 | 5.1% |
| German | 2,044 | 35.0% |
| Greek | 16 | 0.3% |
| Honduran | 4 | 0.1% |
| Hungarian | 113 | 1.9% |
| Indian (Asian) | 19 | 0.3% |
| Irish | 750 | 12.9% |
| Italian | 100 | 1.7% |
| Korean | 49 | 0.8% |
| Lebanese | 50 | 0.9% |
| Mexican | 35 | 0.6% |
| Northern European | 95 | 1.6% |
| Norwegian | 40 | 0.7% |
| Polish | 146 | 2.5% |
| Puerto Rican | 7 | 0.1% |
| Salvadoran | 38 | 0.6% |
| Scandinavian | 17 | 0.3% |
| Scotch-Irish | 37 | 0.6% |
| Scottish | 73 | 1.3% |
| Slovak | 14 | 0.2% |
| Slovene | 55 | 0.9% |
| South African | 14 | 0.2% |
| South American | 36 | 0.6% |
| Subsaharan African | 14 | 0.2% |
| Swedish | 41 | 0.7% |
| Swiss | 17 | 0.3% |
| Thai | 38 | 0.6% |
| Ute | 2 | 0.0% |
| Welsh | 62 | 1.1% | View All 42 Rows |
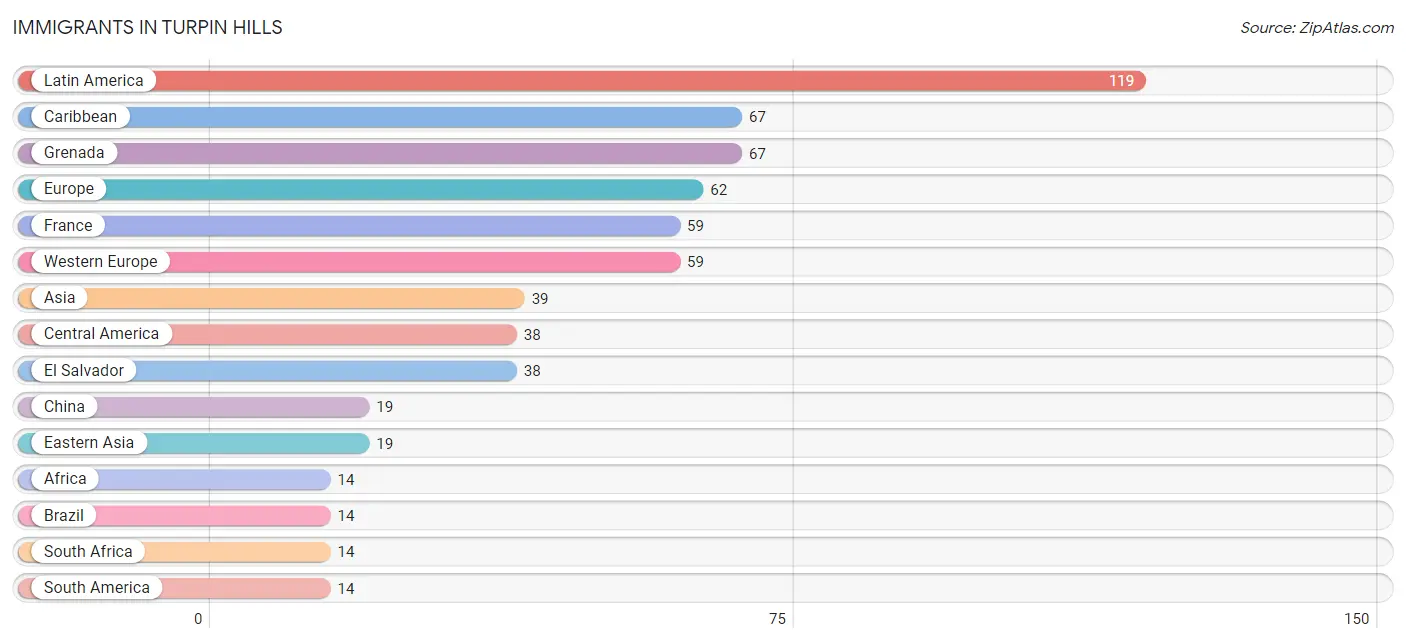
Immigrants in Turpin Hills
The most numerous immigrant groups reported in Turpin Hills came from Latin America (119 | 2.0%), Caribbean (67 | 1.1%), Grenada (67 | 1.1%), Europe (62 | 1.1%), and France (59 | 1.0%), together accounting for 6.4% of all Turpin Hills residents.
| Immigration Origin | # Population | % Population |
| Africa | 14 | 0.2% |
| Asia | 39 | 0.7% |
| Brazil | 14 | 0.2% |
| Caribbean | 67 | 1.1% |
| Central America | 38 | 0.6% |
| China | 19 | 0.3% |
| Eastern Asia | 19 | 0.3% |
| El Salvador | 38 | 0.6% |
| Europe | 62 | 1.1% |
| France | 59 | 1.0% |
| Grenada | 67 | 1.1% |
| India | 8 | 0.1% |
| Italy | 3 | 0.1% |
| Latin America | 119 | 2.0% |
| Philippines | 12 | 0.2% |
| South Africa | 14 | 0.2% |
| South America | 14 | 0.2% |
| South Central Asia | 8 | 0.1% |
| South Eastern Asia | 12 | 0.2% |
| Southern Europe | 3 | 0.1% |
| Western Europe | 59 | 1.0% | View All 21 Rows |
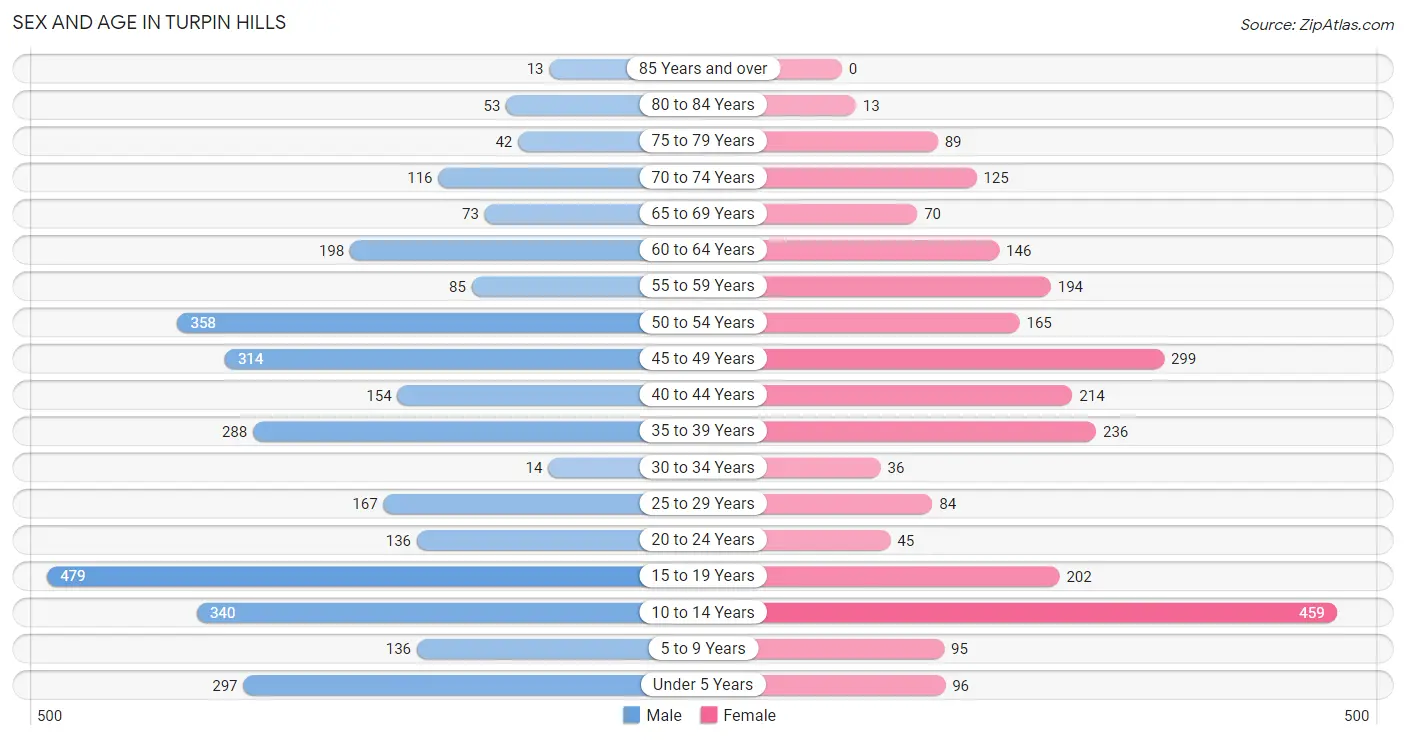
Sex and Age in Turpin Hills
Sex and Age in Turpin Hills
The most populous age groups in Turpin Hills are 15 to 19 Years (479 | 14.7%) for men and 10 to 14 Years (459 | 17.9%) for women.
| Age Bracket | Male | Female |
| Under 5 Years | 297 (9.1%) | 96 (3.7%) |
| 5 to 9 Years | 136 (4.2%) | 95 (3.7%) |
| 10 to 14 Years | 340 (10.4%) | 459 (17.9%) |
| 15 to 19 Years | 479 (14.7%) | 202 (7.9%) |
| 20 to 24 Years | 136 (4.2%) | 45 (1.8%) |
| 25 to 29 Years | 167 (5.1%) | 84 (3.3%) |
| 30 to 34 Years | 14 (0.4%) | 36 (1.4%) |
| 35 to 39 Years | 288 (8.8%) | 236 (9.2%) |
| 40 to 44 Years | 154 (4.7%) | 214 (8.3%) |
| 45 to 49 Years | 314 (9.6%) | 299 (11.6%) |
| 50 to 54 Years | 358 (11.0%) | 165 (6.4%) |
| 55 to 59 Years | 85 (2.6%) | 194 (7.5%) |
| 60 to 64 Years | 198 (6.1%) | 146 (5.7%) |
| 65 to 69 Years | 73 (2.2%) | 70 (2.7%) |
| 70 to 74 Years | 116 (3.6%) | 125 (4.9%) |
| 75 to 79 Years | 42 (1.3%) | 89 (3.5%) |
| 80 to 84 Years | 53 (1.6%) | 13 (0.5%) |
| 85 Years and over | 13 (0.4%) | 0 (0.0%) |
| Total | 3,263 (100.0%) | 2,568 (100.0%) |
Families and Households in Turpin Hills
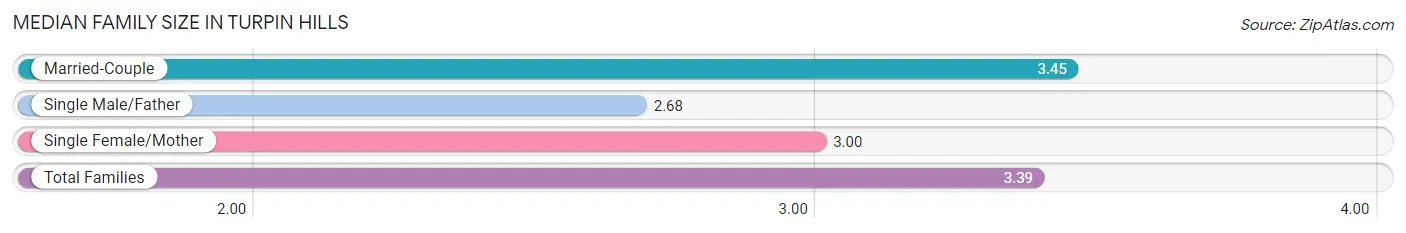
Median Family Size in Turpin Hills
The median family size in Turpin Hills is 3.39 persons per family, with married-couple families (1,412 | 89.6%) accounting for the largest median family size of 3.45 persons per family. On the other hand, single male/father families (73 | 4.6%) represent the smallest median family size with 2.68 persons per family.
| Family Type | # Families | Family Size |
| Married-Couple | 1,412 (89.6%) | 3.45 |
| Single Male/Father | 73 (4.6%) | 2.68 |
| Single Female/Mother | 90 (5.7%) | 3.00 |
| Total Families | 1,575 (100.0%) | 3.39 |
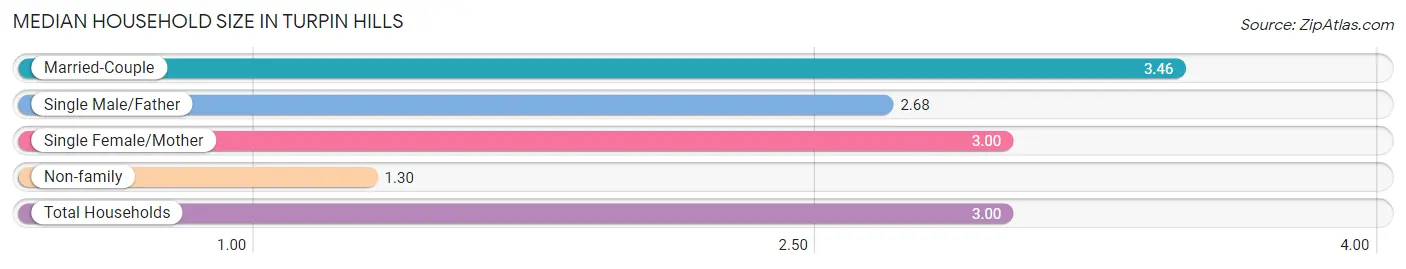
Median Household Size in Turpin Hills
The median household size in Turpin Hills is 3.00 persons per household, with married-couple households (1,412 | 72.7%) accounting for the largest median household size of 3.46 persons per household. non-family households (368 | 18.9%) represent the smallest median household size with 1.30 persons per household.
| Household Type | # Households | Household Size |
| Married-Couple | 1,412 (72.7%) | 3.46 |
| Single Male/Father | 73 (3.8%) | 2.68 |
| Single Female/Mother | 90 (4.6%) | 3.00 |
| Non-family | 368 (18.9%) | 1.30 |
| Total Households | 1,943 (100.0%) | 3.00 |
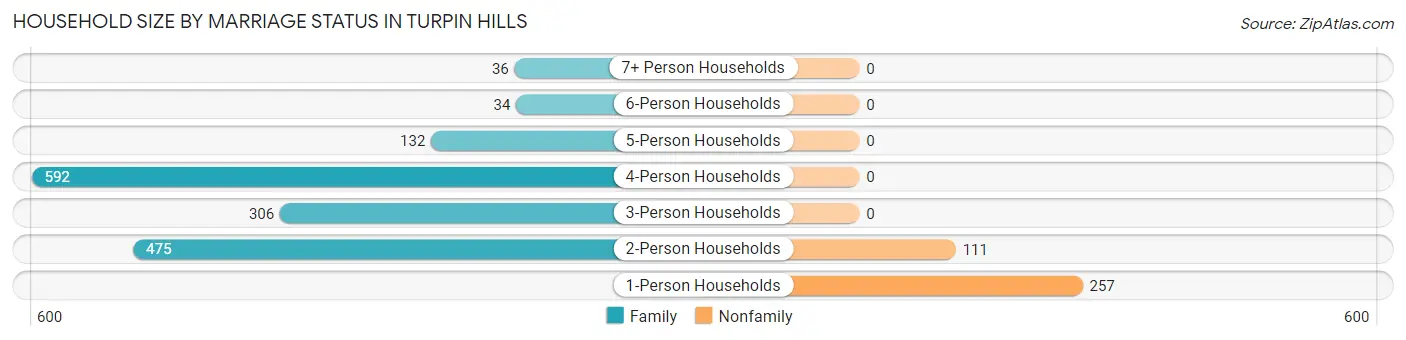
Household Size by Marriage Status in Turpin Hills
Out of a total of 1,943 households in Turpin Hills, 1,575 (81.1%) are family households, while 368 (18.9%) are nonfamily households. The most numerous type of family households are 4-person households, comprising 592, and the most common type of nonfamily households are 1-person households, comprising 257.
| Household Size | Family Households | Nonfamily Households |
| 1-Person Households | - | 257 (13.2%) |
| 2-Person Households | 475 (24.4%) | 111 (5.7%) |
| 3-Person Households | 306 (15.8%) | 0 (0.0%) |
| 4-Person Households | 592 (30.5%) | 0 (0.0%) |
| 5-Person Households | 132 (6.8%) | 0 (0.0%) |
| 6-Person Households | 34 (1.8%) | 0 (0.0%) |
| 7+ Person Households | 36 (1.8%) | 0 (0.0%) |
| Total | 1,575 (81.1%) | 368 (18.9%) |
Female Fertility in Turpin Hills
Fertility by Age in Turpin Hills
Average fertility rate in Turpin Hills is 51.0 births per 1,000 women. Women in the age bracket of 20 to 34 years have the highest fertility rate with 121.0 births per 1,000 women. Women in the age bracket of 35 to 50 years acount for 65.5% of all women with births.
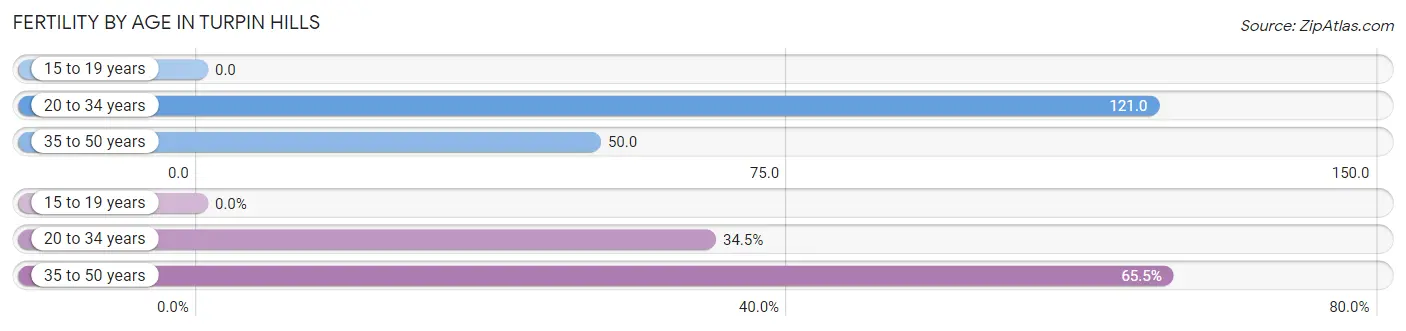
| Age Bracket | Women with Births | Births / 1,000 Women |
| 15 to 19 years | 0 (0.0%) | 0.0 |
| 20 to 34 years | 20 (34.5%) | 121.0 |
| 35 to 50 years | 38 (65.5%) | 50.0 |
| Total | 58 (100.0%) | 51.0 |
Fertility by Age by Marriage Status in Turpin Hills
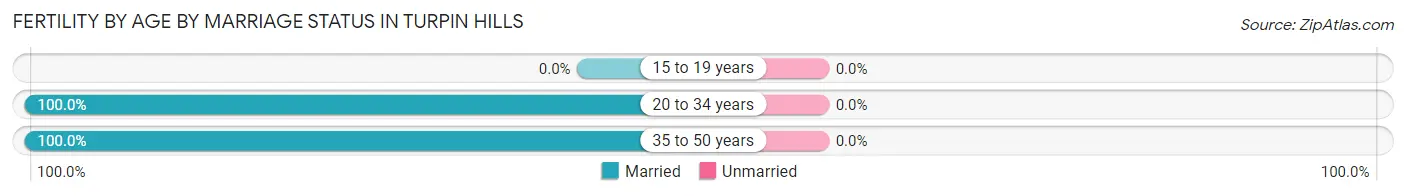
| Age Bracket | Married | Unmarried |
| 15 to 19 years | 0 (0.0%) | 0 (0.0%) |
| 20 to 34 years | 20 (100.0%) | 0 (0.0%) |
| 35 to 50 years | 38 (100.0%) | 0 (0.0%) |
| Total | 58 (100.0%) | 0 (0.0%) |
Fertility by Education in Turpin Hills
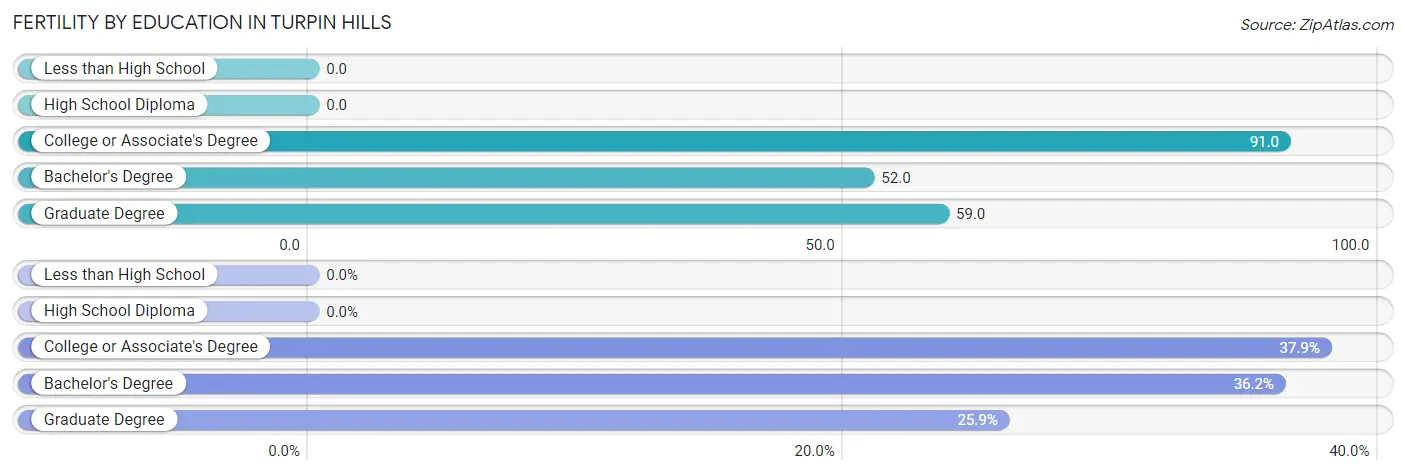
| Educational Attainment | Women with Births | Births / 1,000 Women |
| Less than High School | 0 (0.0%) | 0.0 |
| High School Diploma | 0 (0.0%) | 0.0 |
| College or Associate's Degree | 22 (37.9%) | 91.0 |
| Bachelor's Degree | 21 (36.2%) | 52.0 |
| Graduate Degree | 15 (25.9%) | 59.0 |
| Total | 58 (100.0%) | 51.0 |
Fertility by Education by Marriage Status in Turpin Hills
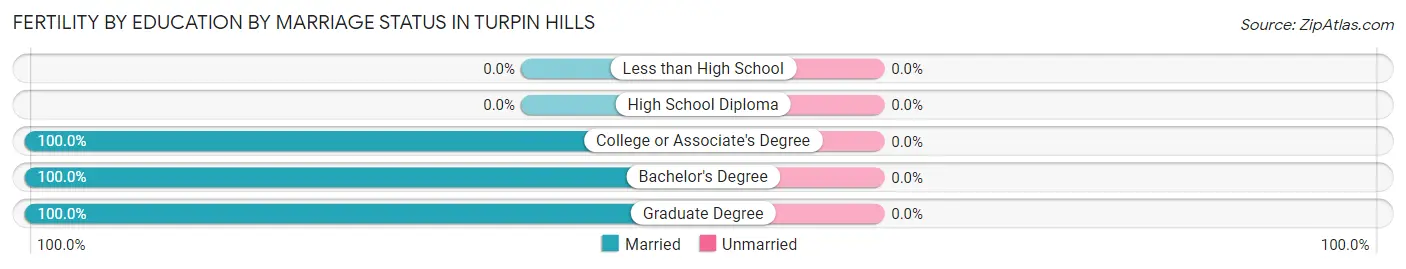
| Educational Attainment | Married | Unmarried |
| Less than High School | 0 (0.0%) | 0 (0.0%) |
| High School Diploma | 0 (0.0%) | 0 (0.0%) |
| College or Associate's Degree | 22 (100.0%) | 0 (0.0%) |
| Bachelor's Degree | 21 (100.0%) | 0 (0.0%) |
| Graduate Degree | 15 (100.0%) | 0 (0.0%) |
| Total | 58 (100.0%) | 0 (0.0%) |
Income in Turpin Hills
Income Overview in Turpin Hills
Per Capita Income in Turpin Hills is $65,209, while median incomes of families and households are $169,583 and $145,817 respectively.
| Characteristic | Number | Measure |
| Per Capita Income | 5,831 | $65,209 |
| Median Family Income | 1,575 | $169,583 |
| Mean Family Income | 1,575 | $221,039 |
| Median Household Income | 1,943 | $145,817 |
| Mean Household Income | 1,943 | $197,257 |
| Income Deficit | 1,575 | $0 |
| Wage / Income Gap (%) | 5,831 | 31.87% |
| Wage / Income Gap ($) | 5,831 | 68.13¢ per $1 |
| Gini / Inequality Index | 5,831 | 0.43 |
Earnings by Sex in Turpin Hills
Average Earnings in Turpin Hills are $71,671, $81,917 for men and $55,809 for women, a difference of 31.9%.
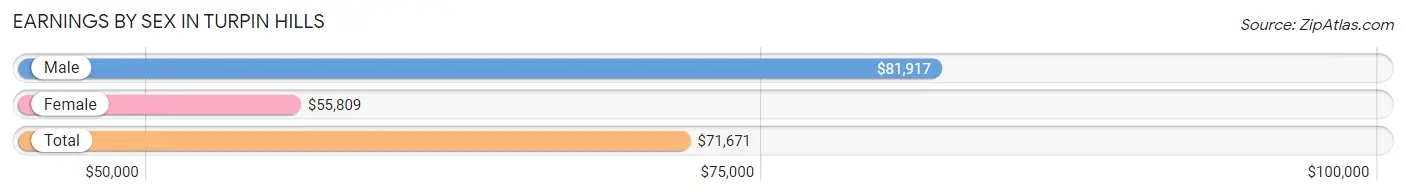
| Sex | Number | Average Earnings |
| Male | 1,998 (60.1%) | $81,917 |
| Female | 1,325 (39.9%) | $55,809 |
| Total | 3,323 (100.0%) | $71,671 |
Earnings by Sex by Income Bracket in Turpin Hills
The most common earnings brackets in Turpin Hills are $100,000+ for men (751 | 37.6%) and $100,000+ for women (334 | 25.2%).
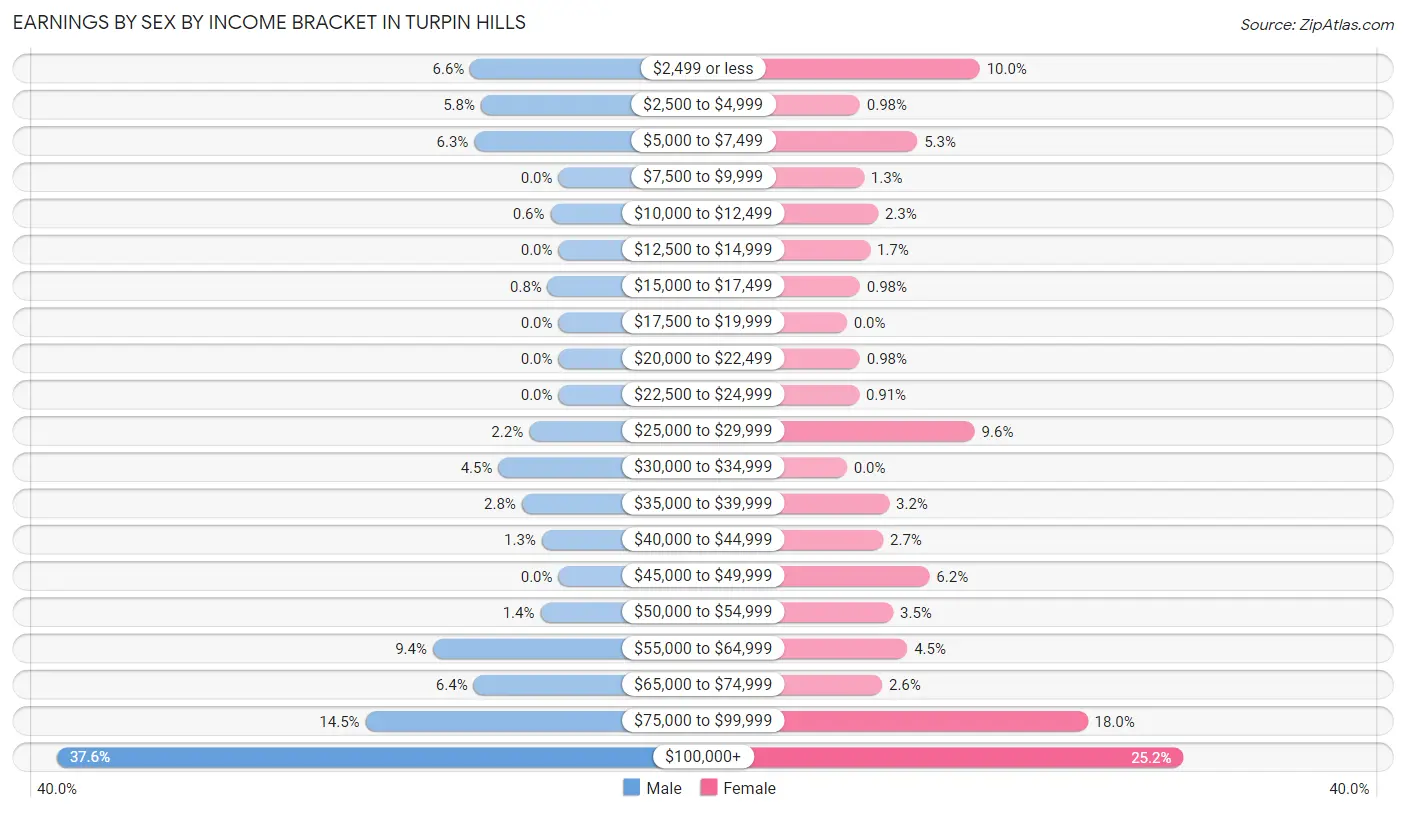
| Income | Male | Female |
| $2,499 or less | 132 (6.6%) | 132 (10.0%) |
| $2,500 to $4,999 | 116 (5.8%) | 13 (1.0%) |
| $5,000 to $7,499 | 126 (6.3%) | 70 (5.3%) |
| $7,500 to $9,999 | 0 (0.0%) | 17 (1.3%) |
| $10,000 to $12,499 | 12 (0.6%) | 31 (2.3%) |
| $12,500 to $14,999 | 0 (0.0%) | 23 (1.7%) |
| $15,000 to $17,499 | 16 (0.8%) | 13 (1.0%) |
| $17,500 to $19,999 | 0 (0.0%) | 0 (0.0%) |
| $20,000 to $22,499 | 0 (0.0%) | 13 (1.0%) |
| $22,500 to $24,999 | 0 (0.0%) | 12 (0.9%) |
| $25,000 to $29,999 | 44 (2.2%) | 127 (9.6%) |
| $30,000 to $34,999 | 90 (4.5%) | 0 (0.0%) |
| $35,000 to $39,999 | 55 (2.8%) | 42 (3.2%) |
| $40,000 to $44,999 | 25 (1.3%) | 36 (2.7%) |
| $45,000 to $49,999 | 0 (0.0%) | 82 (6.2%) |
| $50,000 to $54,999 | 27 (1.3%) | 46 (3.5%) |
| $55,000 to $64,999 | 188 (9.4%) | 60 (4.5%) |
| $65,000 to $74,999 | 127 (6.4%) | 35 (2.6%) |
| $75,000 to $99,999 | 289 (14.5%) | 239 (18.0%) |
| $100,000+ | 751 (37.6%) | 334 (25.2%) |
| Total | 1,998 (100.0%) | 1,325 (100.0%) |
Earnings by Sex by Educational Attainment in Turpin Hills
Average earnings in Turpin Hills are $92,188 for men and $63,667 for women, a difference of 30.9%. Men with an educational attainment of graduate degree enjoy the highest average annual earnings of $175,000, while those with less than high school education earn the least with $58,158. Women with an educational attainment of graduate degree earn the most with the average annual earnings of $101,026, while those with college or associate's degree education have the smallest earnings of $26,451.
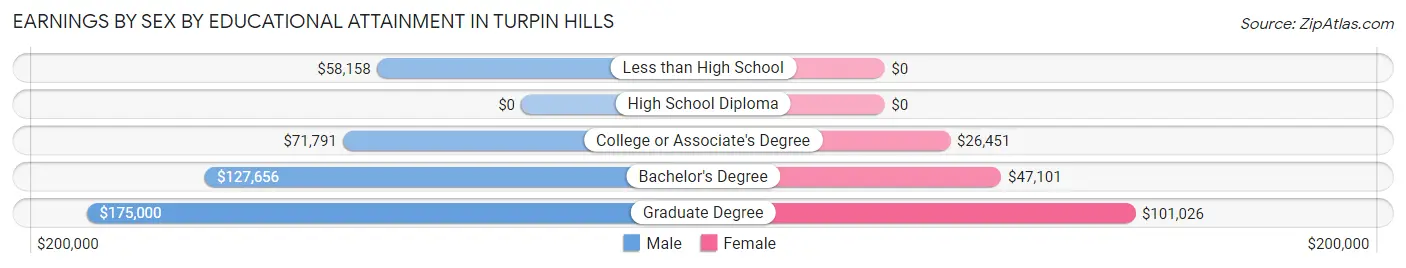
| Educational Attainment | Male Income | Female Income |
| Less than High School | $58,158 | $0 |
| High School Diploma | - | - |
| College or Associate's Degree | $71,791 | $26,451 |
| Bachelor's Degree | $127,656 | $47,101 |
| Graduate Degree | $175,000 | $101,026 |
| Total | $92,188 | $63,667 |
Family Income in Turpin Hills
Family Income Brackets in Turpin Hills
According to the Turpin Hills family income data, there are 698 families falling into the $200,000+ income range, which is the most common income bracket and makes up 44.3% of all families.
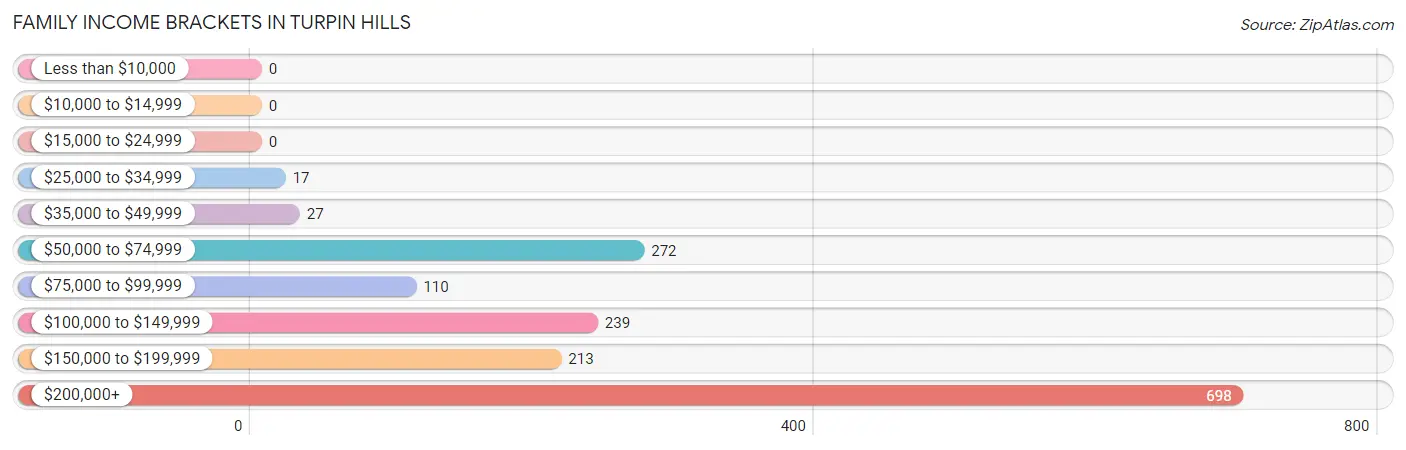
| Income Bracket | # Families | % Families |
| Less than $10,000 | 0 | 0.0% |
| $10,000 to $14,999 | 0 | 0.0% |
| $15,000 to $24,999 | 0 | 0.0% |
| $25,000 to $34,999 | 17 | 1.1% |
| $35,000 to $49,999 | 27 | 1.7% |
| $50,000 to $74,999 | 272 | 17.3% |
| $75,000 to $99,999 | 110 | 7.0% |
| $100,000 to $149,999 | 239 | 15.2% |
| $150,000 to $199,999 | 213 | 13.5% |
| $200,000+ | 698 | 44.3% |
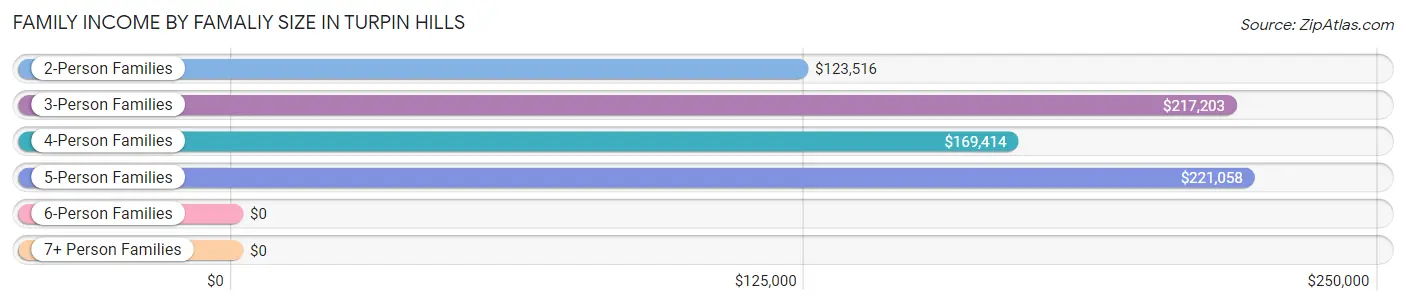
Family Income by Famaliy Size in Turpin Hills
5-person families (117 | 7.4%) account for the highest median family income in Turpin Hills with $221,058 per family, while 3-person families (306 | 19.4%) have the highest median income of $72,401 per family member.
| Income Bracket | # Families | Median Income |
| 2-Person Families | 475 (30.2%) | $123,516 |
| 3-Person Families | 306 (19.4%) | $217,203 |
| 4-Person Families | 607 (38.5%) | $169,414 |
| 5-Person Families | 117 (7.4%) | $221,058 |
| 6-Person Families | 34 (2.2%) | $0 |
| 7+ Person Families | 36 (2.3%) | $0 |
| Total | 1,575 (100.0%) | $169,583 |
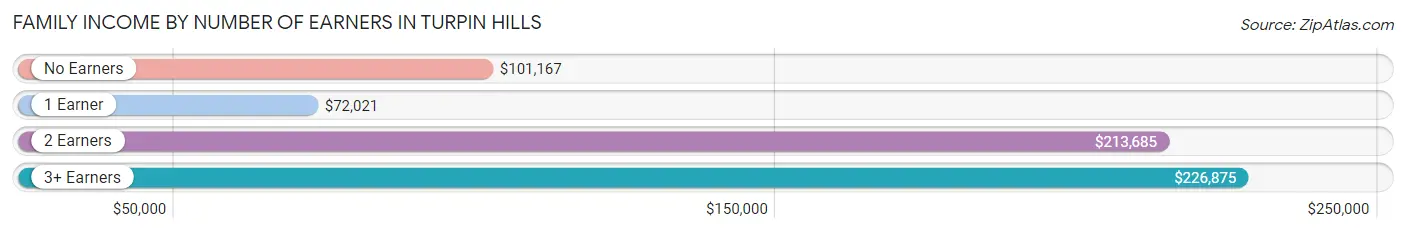
Family Income by Number of Earners in Turpin Hills
The median family income in Turpin Hills is $169,583, with families comprising 3+ earners (317) having the highest median family income of $226,875, while families with 1 earner (301) have the lowest median family income of $72,021, accounting for 20.1% and 19.1% of families, respectively.
| Number of Earners | # Families | Median Income |
| No Earners | 170 (10.8%) | $101,167 |
| 1 Earner | 301 (19.1%) | $72,021 |
| 2 Earners | 787 (50.0%) | $213,685 |
| 3+ Earners | 317 (20.1%) | $226,875 |
| Total | 1,575 (100.0%) | $169,583 |
Household Income in Turpin Hills
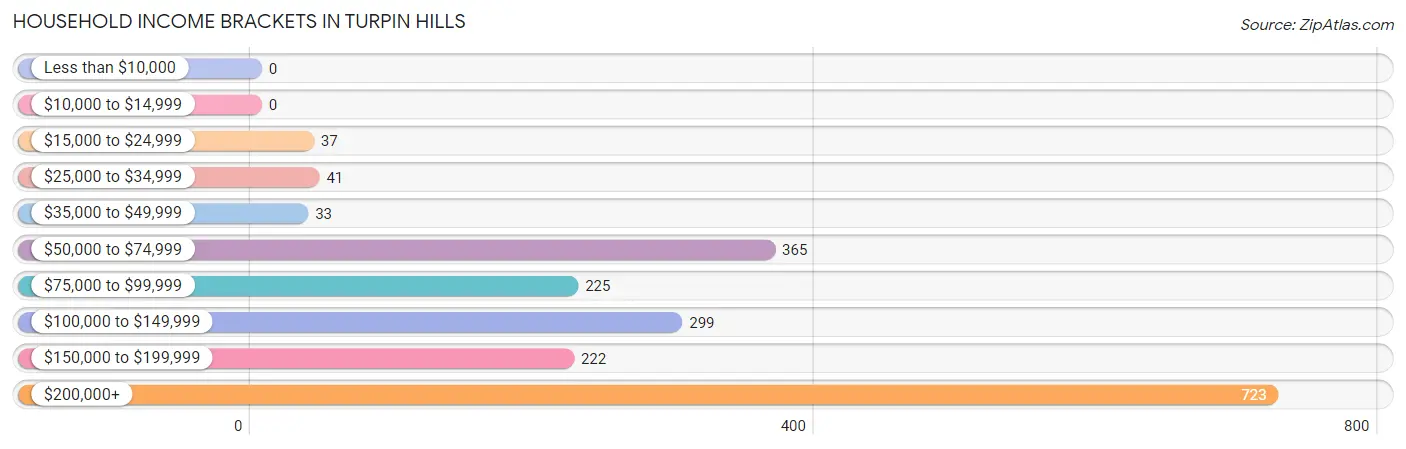
Household Income Brackets in Turpin Hills
With 723 households falling in the category, the $200,000+ income range is the most frequent in Turpin Hills, accounting for 37.2% of all households.
| Income Bracket | # Households | % Households |
| Less than $10,000 | 0 | 0.0% |
| $10,000 to $14,999 | 0 | 0.0% |
| $15,000 to $24,999 | 37 | 1.9% |
| $25,000 to $34,999 | 41 | 2.1% |
| $35,000 to $49,999 | 33 | 1.7% |
| $50,000 to $74,999 | 365 | 18.8% |
| $75,000 to $99,999 | 225 | 11.6% |
| $100,000 to $149,999 | 299 | 15.4% |
| $150,000 to $199,999 | 222 | 11.4% |
| $200,000+ | 723 | 37.2% |
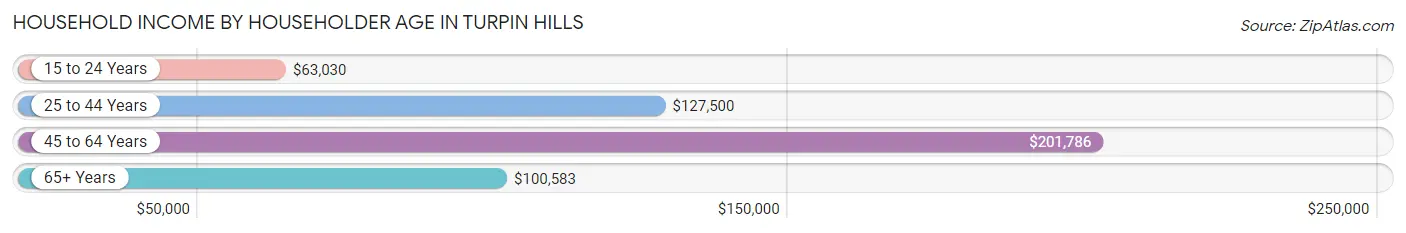
Household Income by Householder Age in Turpin Hills
The median household income in Turpin Hills is $145,817, with the highest median household income of $201,786 found in the 45 to 64 years age bracket for the primary householder. A total of 982 households (50.5%) fall into this category. Meanwhile, the 15 to 24 years age bracket for the primary householder has the lowest median household income of $63,030, with 52 households (2.7%) in this group.
| Income Bracket | # Households | Median Income |
| 15 to 24 Years | 52 (2.7%) | $63,030 |
| 25 to 44 Years | 526 (27.1%) | $127,500 |
| 45 to 64 Years | 982 (50.5%) | $201,786 |
| 65+ Years | 383 (19.7%) | $100,583 |
| Total | 1,943 (100.0%) | $145,817 |
Poverty in Turpin Hills
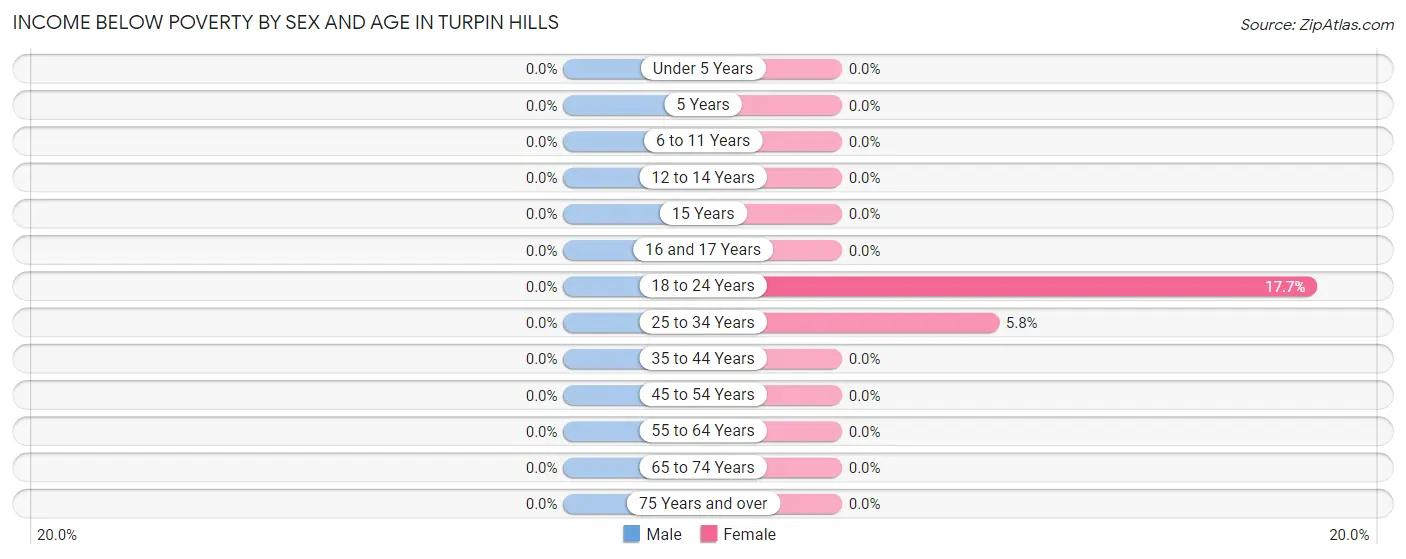
Income Below Poverty by Sex and Age in Turpin Hills
| Age Bracket | Male | Female |
| Under 5 Years | 0 (0.0%) | 0 (0.0%) |
| 5 Years | 0 (0.0%) | 0 (0.0%) |
| 6 to 11 Years | 0 (0.0%) | 0 (0.0%) |
| 12 to 14 Years | 0 (0.0%) | 0 (0.0%) |
| 15 Years | 0 (0.0%) | 0 (0.0%) |
| 16 and 17 Years | 0 (0.0%) | 0 (0.0%) |
| 18 to 24 Years | 0 (0.0%) | 12 (17.6%) |
| 25 to 34 Years | 0 (0.0%) | 7 (5.8%) |
| 35 to 44 Years | 0 (0.0%) | 0 (0.0%) |
| 45 to 54 Years | 0 (0.0%) | 0 (0.0%) |
| 55 to 64 Years | 0 (0.0%) | 0 (0.0%) |
| 65 to 74 Years | 0 (0.0%) | 0 (0.0%) |
| 75 Years and over | 0 (0.0%) | 0 (0.0%) |
| Total | 0 (0.0%) | 19 (0.7%) |
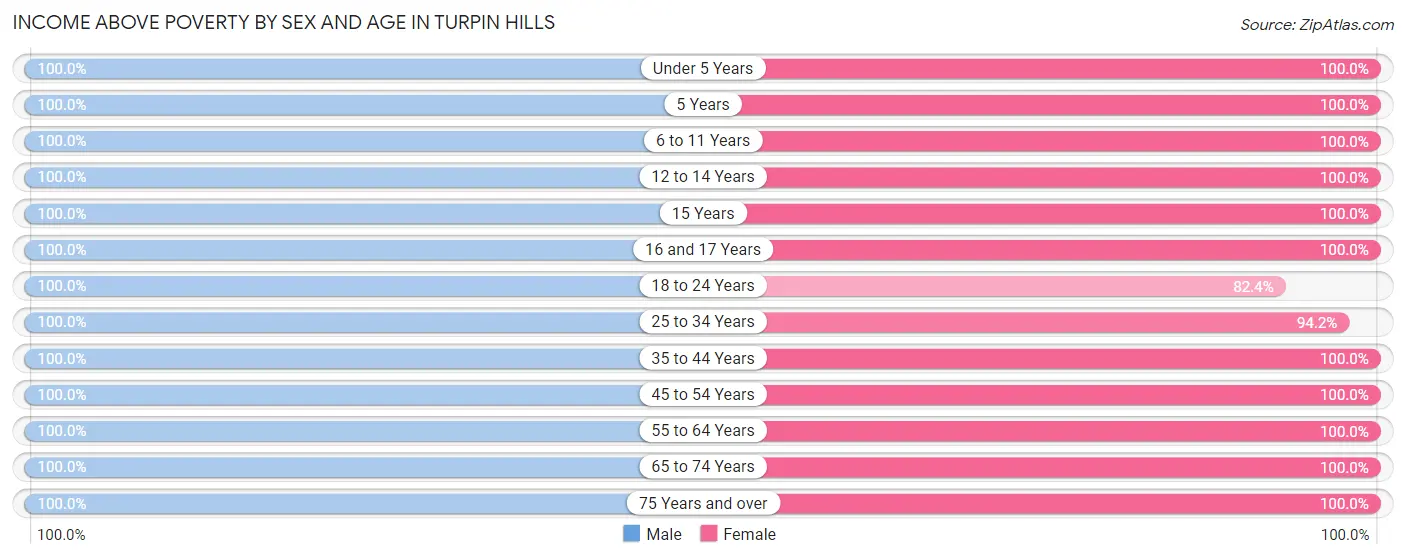
Income Above Poverty by Sex and Age in Turpin Hills
According to the poverty statistics in Turpin Hills, males aged under 5 years and females aged under 5 years are the age groups that are most secure financially, with 100.0% of males and 100.0% of females in these age groups living above the poverty line.
| Age Bracket | Male | Female |
| Under 5 Years | 297 (100.0%) | 96 (100.0%) |
| 5 Years | 28 (100.0%) | 31 (100.0%) |
| 6 to 11 Years | 249 (100.0%) | 293 (100.0%) |
| 12 to 14 Years | 199 (100.0%) | 230 (100.0%) |
| 15 Years | 139 (100.0%) | 111 (100.0%) |
| 16 and 17 Years | 195 (100.0%) | 68 (100.0%) |
| 18 to 24 Years | 281 (100.0%) | 56 (82.4%) |
| 25 to 34 Years | 181 (100.0%) | 113 (94.2%) |
| 35 to 44 Years | 442 (100.0%) | 450 (100.0%) |
| 45 to 54 Years | 672 (100.0%) | 464 (100.0%) |
| 55 to 64 Years | 283 (100.0%) | 340 (100.0%) |
| 65 to 74 Years | 189 (100.0%) | 195 (100.0%) |
| 75 Years and over | 108 (100.0%) | 102 (100.0%) |
| Total | 3,263 (100.0%) | 2,549 (99.3%) |
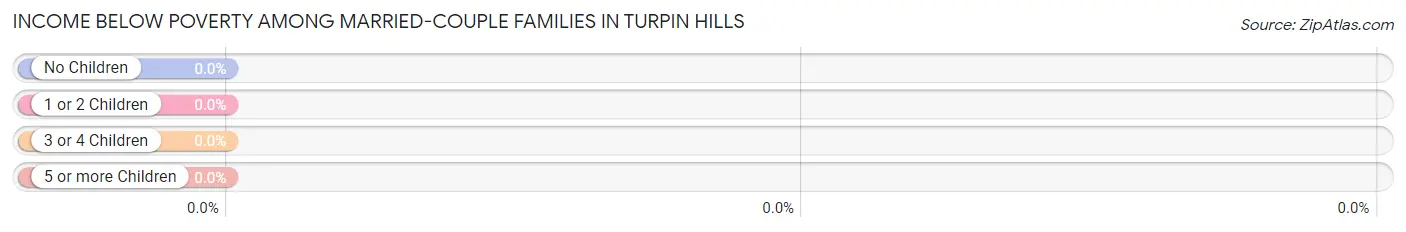
Income Below Poverty Among Married-Couple Families in Turpin Hills
| Children | Above Poverty | Below Poverty |
| No Children | 499 (100.0%) | 0 (0.0%) |
| 1 or 2 Children | 777 (100.0%) | 0 (0.0%) |
| 3 or 4 Children | 136 (100.0%) | 0 (0.0%) |
| 5 or more Children | 0 (0.0%) | 0 (0.0%) |
| Total | 1,412 (100.0%) | 0 (0.0%) |
Income Below Poverty Among Single-Parent Households in Turpin Hills
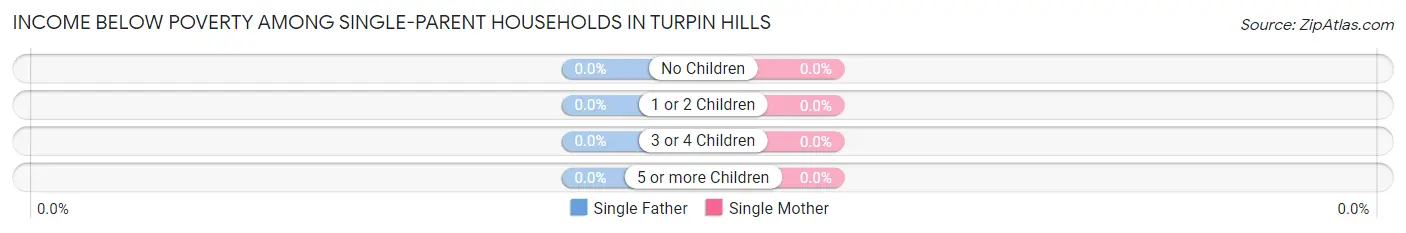
| Children | Single Father | Single Mother |
| No Children | 0 (0.0%) | 0 (0.0%) |
| 1 or 2 Children | 0 (0.0%) | 0 (0.0%) |
| 3 or 4 Children | 0 (0.0%) | 0 (0.0%) |
| 5 or more Children | 0 (0.0%) | 0 (0.0%) |
| Total | 0 (0.0%) | 0 (0.0%) |
Income Below Poverty Among Married-Couple vs Single-Parent Households in Turpin Hills
| Children | Married-Couple Families | Single-Parent Households |
| No Children | 0 (0.0%) | 0 (0.0%) |
| 1 or 2 Children | 0 (0.0%) | 0 (0.0%) |
| 3 or 4 Children | 0 (0.0%) | 0 (0.0%) |
| 5 or more Children | 0 (0.0%) | 0 (0.0%) |
| Total | 0 (0.0%) | 0 (0.0%) |
Employment Characteristics in Turpin Hills
Employment by Class of Employer in Turpin Hills
Among the 3,080 employed individuals in Turpin Hills, private company employees (1,831 | 59.5%), not-for-profit organizations (505 | 16.4%), and self-employed (not incorporated) (280 | 9.1%) make up the most common classes of employment.
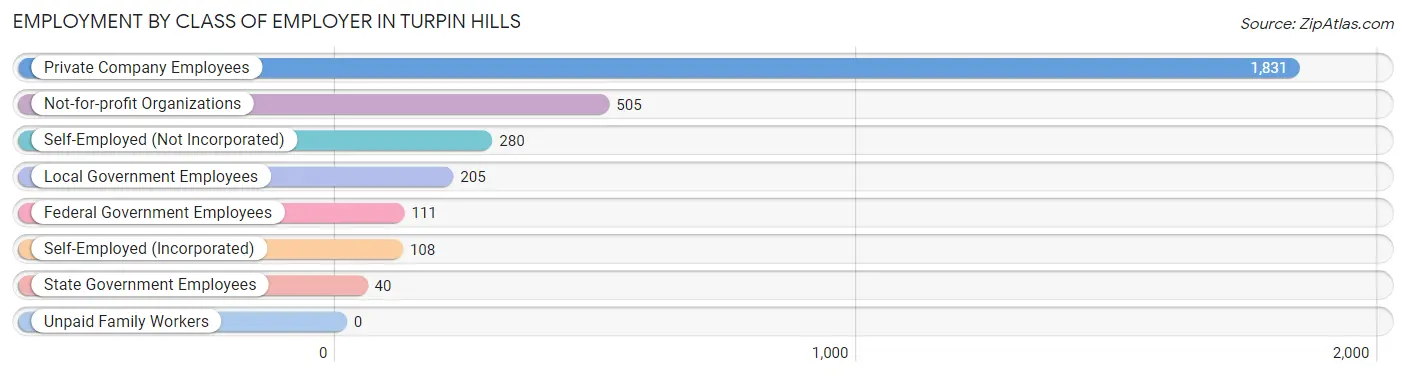
| Employer Class | # Employees | % Employees |
| Private Company Employees | 1,831 | 59.5% |
| Self-Employed (Incorporated) | 108 | 3.5% |
| Self-Employed (Not Incorporated) | 280 | 9.1% |
| Not-for-profit Organizations | 505 | 16.4% |
| Local Government Employees | 205 | 6.7% |
| State Government Employees | 40 | 1.3% |
| Federal Government Employees | 111 | 3.6% |
| Unpaid Family Workers | 0 | 0.0% |
| Total | 3,080 | 100.0% |
Employment Status by Age in Turpin Hills
According to the labor force statistics for Turpin Hills, out of the total population over 16 years of age (4,158), 77.2% or 3,210 individuals are in the labor force, with 3.6% or 116 of them unemployed. The age group with the highest labor force participation rate is 30 to 34 years, with 100.0% or 50 individuals in the labor force. Within the labor force, the 55 to 59 years age range has the highest percentage of unemployed individuals, with 29.9% or 69 of them being unemployed.
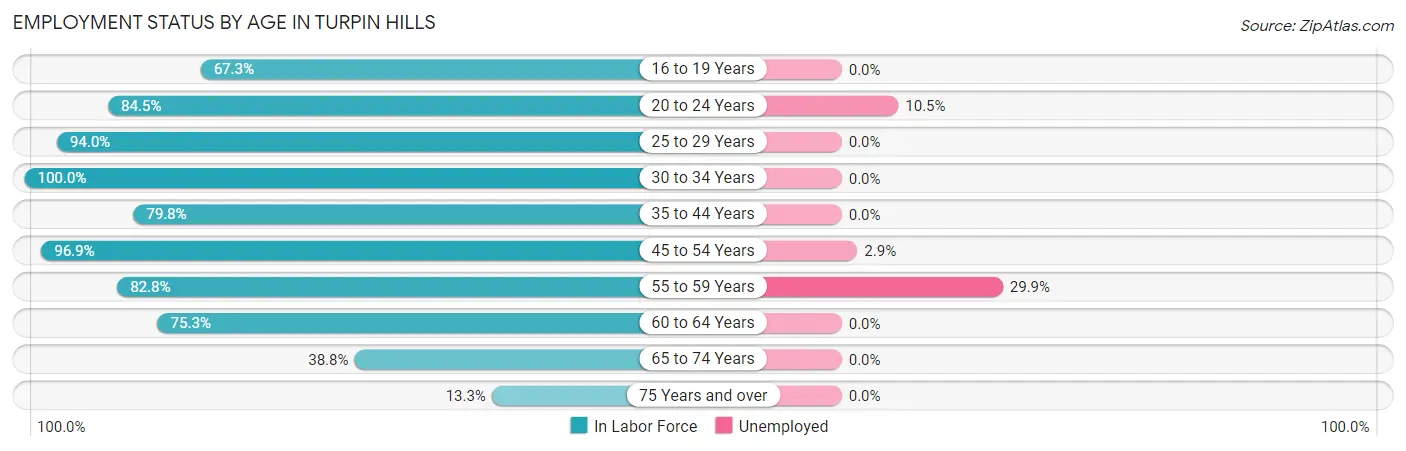
| Age Bracket | In Labor Force | Unemployed |
| 16 to 19 Years | 290 (67.3%) | 0 (0.0%) |
| 20 to 24 Years | 153 (84.5%) | 16 (10.5%) |
| 25 to 29 Years | 236 (94.0%) | 0 (0.0%) |
| 30 to 34 Years | 50 (100.0%) | 0 (0.0%) |
| 35 to 44 Years | 712 (79.8%) | 0 (0.0%) |
| 45 to 54 Years | 1,101 (96.9%) | 32 (2.9%) |
| 55 to 59 Years | 231 (82.8%) | 69 (29.9%) |
| 60 to 64 Years | 259 (75.3%) | 0 (0.0%) |
| 65 to 74 Years | 149 (38.8%) | 0 (0.0%) |
| 75 Years and over | 28 (13.3%) | 0 (0.0%) |
| Total | 3,210 (77.2%) | 116 (3.6%) |
Employment Status by Educational Attainment in Turpin Hills
According to labor force statistics for Turpin Hills, 87.7% of individuals (2,589) out of the total population between 25 and 64 years of age (2,952) are in the labor force, with 3.9% or 101 of them being unemployed. The group with the highest labor force participation rate are those with the educational attainment of high school diploma, with 94.9% or 203 individuals in the labor force. Within the labor force, individuals with less than high school education have the highest percentage of unemployment, with 50.0% or 32 of them being unemployed.
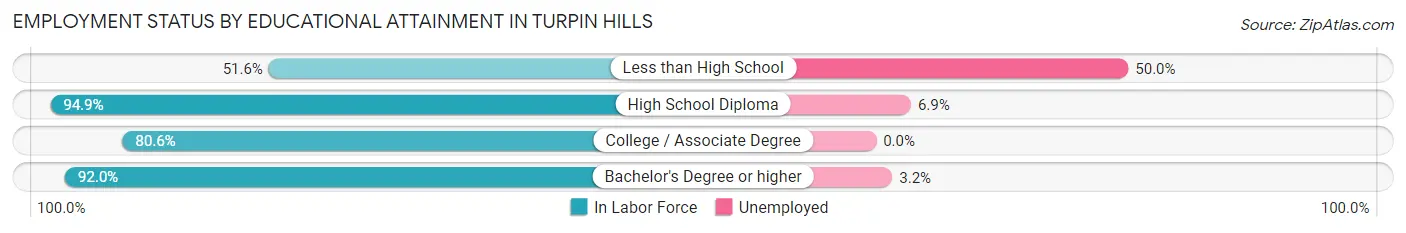
| Educational Attainment | In Labor Force | Unemployed |
| Less than High School | 64 (51.6%) | 62 (50.0%) |
| High School Diploma | 203 (94.9%) | 15 (6.9%) |
| College / Associate Degree | 591 (80.6%) | 0 (0.0%) |
| Bachelor's Degree or higher | 1,731 (92.0%) | 60 (3.2%) |
| Total | 2,589 (87.7%) | 115 (3.9%) |
Employment Occupations by Sex in Turpin Hills
Management, Business, Science and Arts Occupations
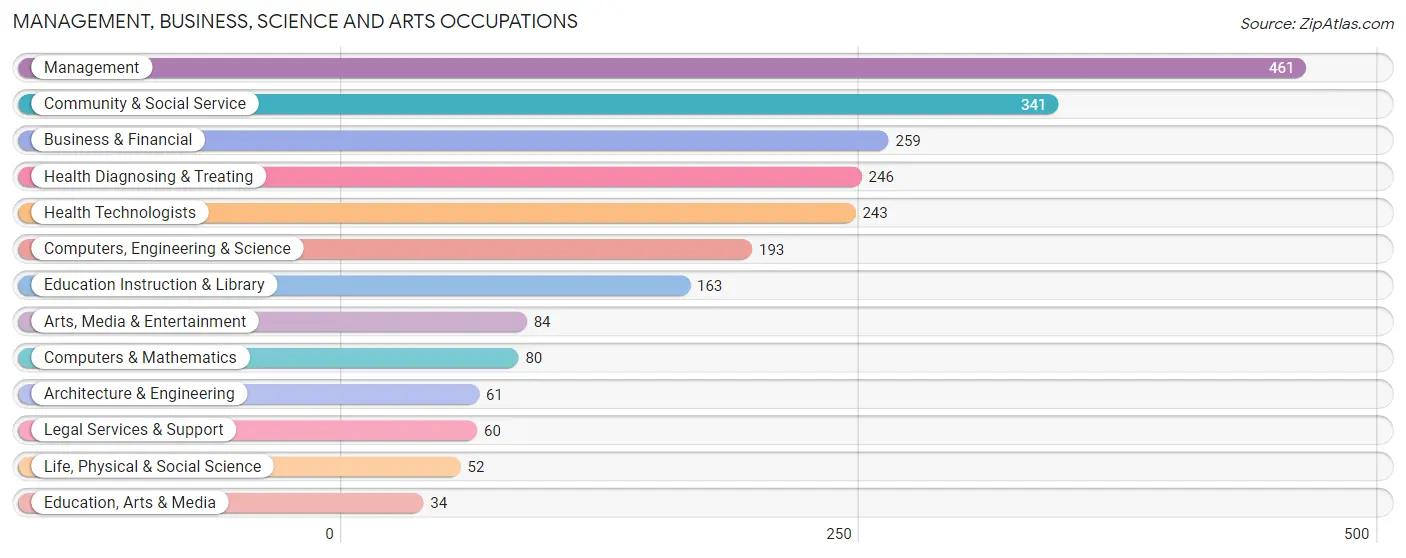
The most common Management, Business, Science and Arts occupations in Turpin Hills are Management (461 | 14.9%), Community & Social Service (341 | 11.0%), Business & Financial (259 | 8.4%), Health Diagnosing & Treating (246 | 8.0%), and Health Technologists (243 | 7.9%).
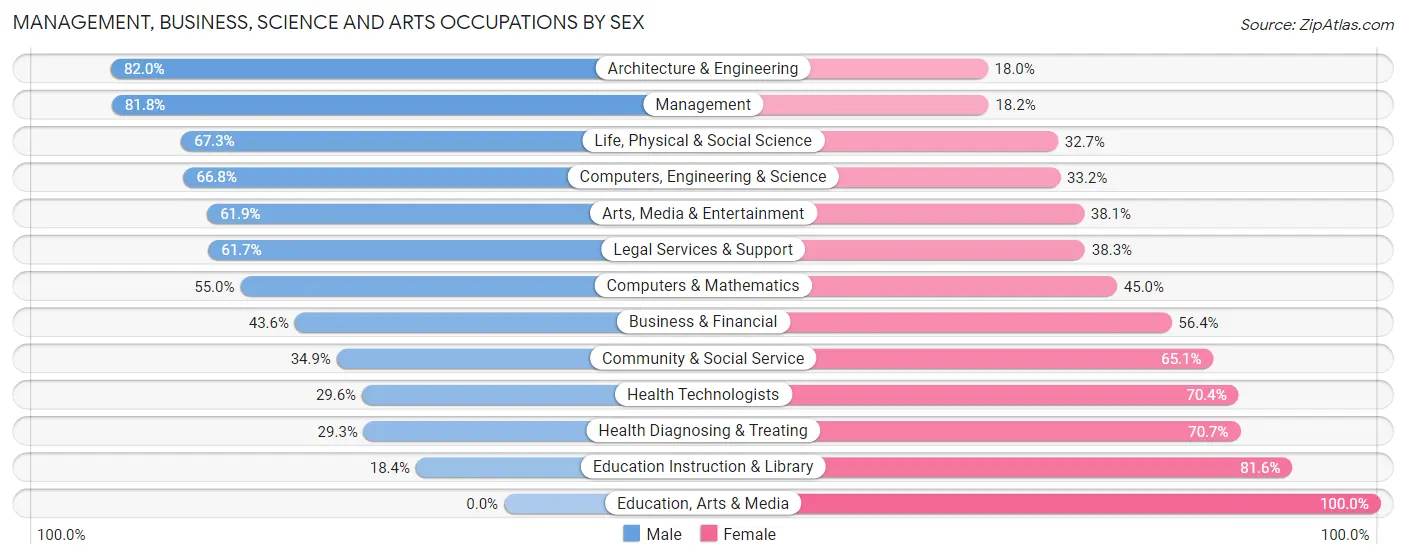
Management, Business, Science and Arts Occupations by Sex
Within the Management, Business, Science and Arts occupations in Turpin Hills, the most male-oriented occupations are Architecture & Engineering (82.0%), Management (81.8%), and Life, Physical & Social Science (67.3%), while the most female-oriented occupations are Education, Arts & Media (100.0%), Education Instruction & Library (81.6%), and Health Diagnosing & Treating (70.7%).
| Occupation | Male | Female |
| Management | 377 (81.8%) | 84 (18.2%) |
| Business & Financial | 113 (43.6%) | 146 (56.4%) |
| Computers, Engineering & Science | 129 (66.8%) | 64 (33.2%) |
| Computers & Mathematics | 44 (55.0%) | 36 (45.0%) |
| Architecture & Engineering | 50 (82.0%) | 11 (18.0%) |
| Life, Physical & Social Science | 35 (67.3%) | 17 (32.7%) |
| Community & Social Service | 119 (34.9%) | 222 (65.1%) |
| Education, Arts & Media | 0 (0.0%) | 34 (100.0%) |
| Legal Services & Support | 37 (61.7%) | 23 (38.3%) |
| Education Instruction & Library | 30 (18.4%) | 133 (81.6%) |
| Arts, Media & Entertainment | 52 (61.9%) | 32 (38.1%) |
| Health Diagnosing & Treating | 72 (29.3%) | 174 (70.7%) |
| Health Technologists | 72 (29.6%) | 171 (70.4%) |
| Total (Category) | 810 (54.0%) | 690 (46.0%) |
| Total (Overall) | 1,880 (60.8%) | 1,212 (39.2%) |
Services Occupations
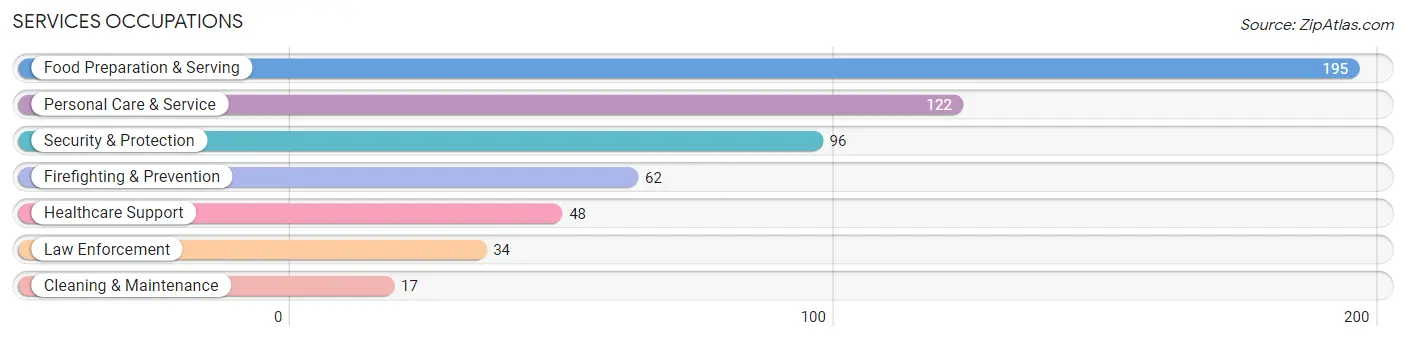
The most common Services occupations in Turpin Hills are Food Preparation & Serving (195 | 6.3%), Personal Care & Service (122 | 4.0%), Security & Protection (96 | 3.1%), Firefighting & Prevention (62 | 2.0%), and Healthcare Support (48 | 1.5%).
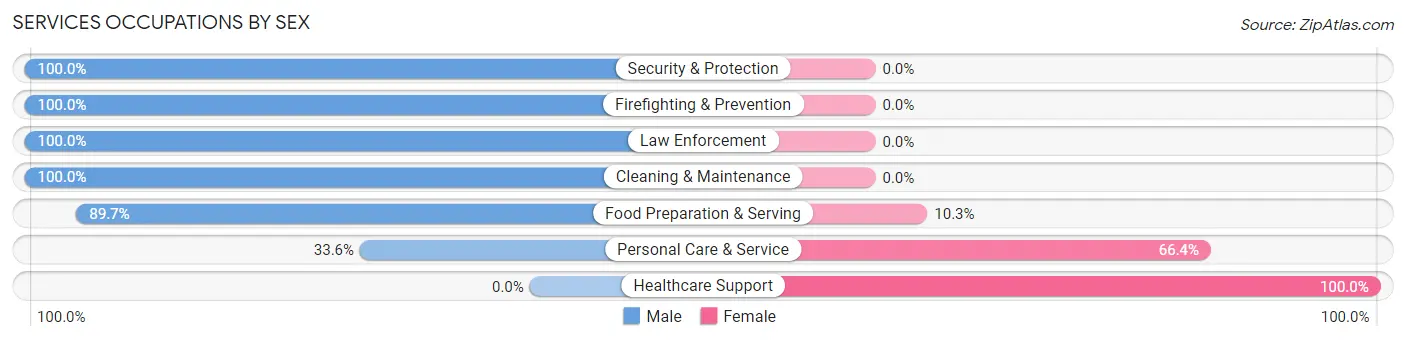
Services Occupations by Sex
Within the Services occupations in Turpin Hills, the most male-oriented occupations are Security & Protection (100.0%), Firefighting & Prevention (100.0%), and Law Enforcement (100.0%), while the most female-oriented occupations are Healthcare Support (100.0%), Personal Care & Service (66.4%), and Food Preparation & Serving (10.3%).
| Occupation | Male | Female |
| Healthcare Support | 0 (0.0%) | 48 (100.0%) |
| Security & Protection | 96 (100.0%) | 0 (0.0%) |
| Firefighting & Prevention | 62 (100.0%) | 0 (0.0%) |
| Law Enforcement | 34 (100.0%) | 0 (0.0%) |
| Food Preparation & Serving | 175 (89.7%) | 20 (10.3%) |
| Cleaning & Maintenance | 17 (100.0%) | 0 (0.0%) |
| Personal Care & Service | 41 (33.6%) | 81 (66.4%) |
| Total (Category) | 329 (68.8%) | 149 (31.2%) |
| Total (Overall) | 1,880 (60.8%) | 1,212 (39.2%) |
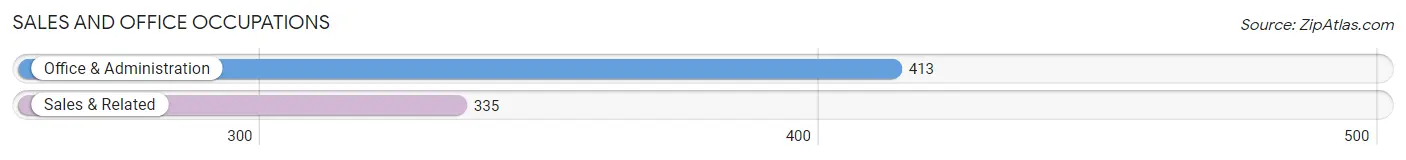
Sales and Office Occupations
The most common Sales and Office occupations in Turpin Hills are Office & Administration (413 | 13.4%), and Sales & Related (335 | 10.8%).
Sales and Office Occupations by Sex
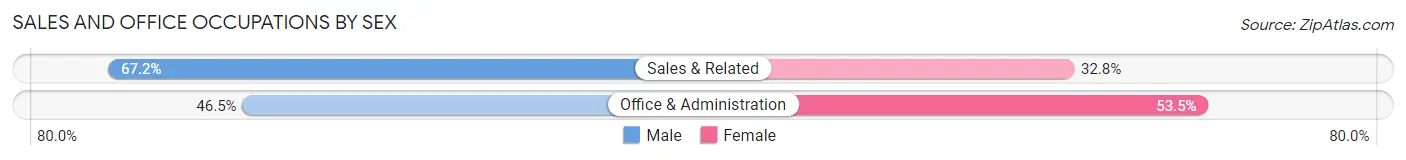
| Occupation | Male | Female |
| Sales & Related | 225 (67.2%) | 110 (32.8%) |
| Office & Administration | 192 (46.5%) | 221 (53.5%) |
| Total (Category) | 417 (55.7%) | 331 (44.3%) |
| Total (Overall) | 1,880 (60.8%) | 1,212 (39.2%) |
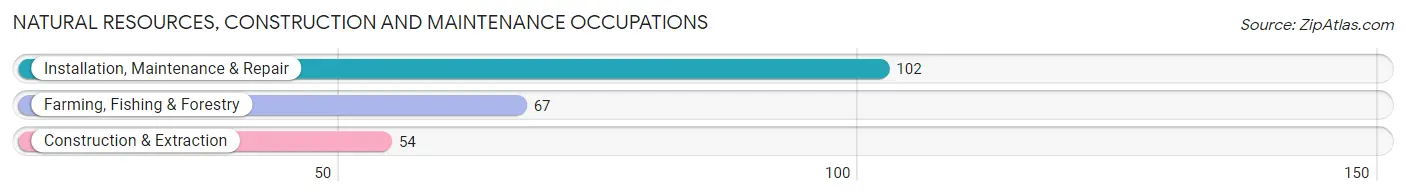
Natural Resources, Construction and Maintenance Occupations
The most common Natural Resources, Construction and Maintenance occupations in Turpin Hills are Installation, Maintenance & Repair (102 | 3.3%), Farming, Fishing & Forestry (67 | 2.2%), and Construction & Extraction (54 | 1.8%).
Natural Resources, Construction and Maintenance Occupations by Sex
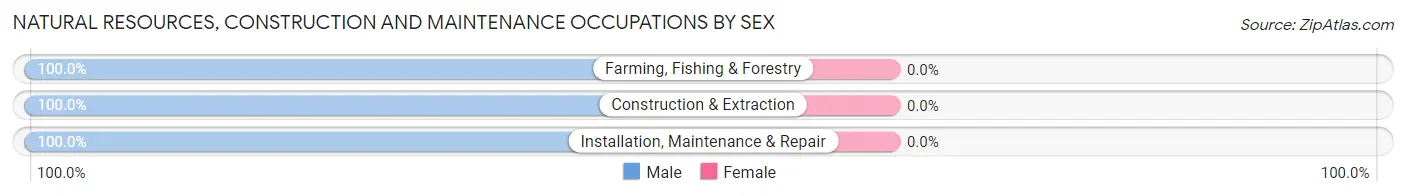
| Occupation | Male | Female |
| Farming, Fishing & Forestry | 67 (100.0%) | 0 (0.0%) |
| Construction & Extraction | 54 (100.0%) | 0 (0.0%) |
| Installation, Maintenance & Repair | 102 (100.0%) | 0 (0.0%) |
| Total (Category) | 223 (100.0%) | 0 (0.0%) |
| Total (Overall) | 1,880 (60.8%) | 1,212 (39.2%) |
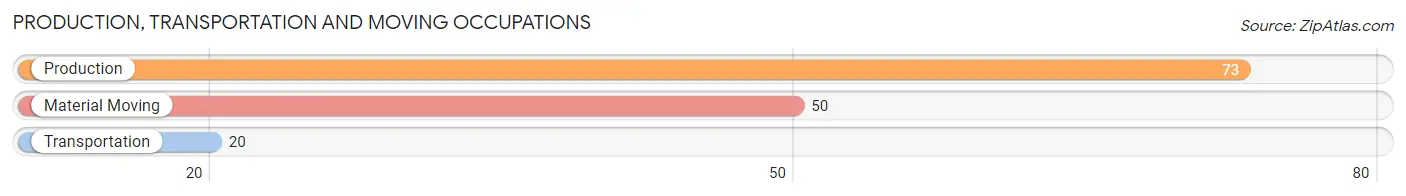
Production, Transportation and Moving Occupations
The most common Production, Transportation and Moving occupations in Turpin Hills are Production (73 | 2.4%), Material Moving (50 | 1.6%), and Transportation (20 | 0.6%).
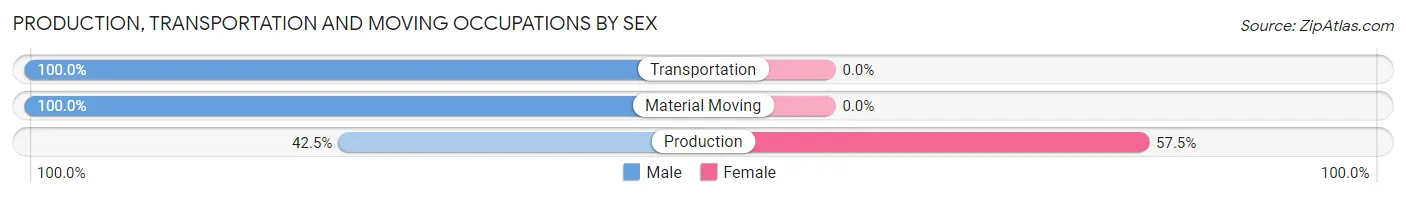
Production, Transportation and Moving Occupations by Sex
| Occupation | Male | Female |
| Production | 31 (42.5%) | 42 (57.5%) |
| Transportation | 20 (100.0%) | 0 (0.0%) |
| Material Moving | 50 (100.0%) | 0 (0.0%) |
| Total (Category) | 101 (70.6%) | 42 (29.4%) |
| Total (Overall) | 1,880 (60.8%) | 1,212 (39.2%) |
Employment Industries by Sex in Turpin Hills
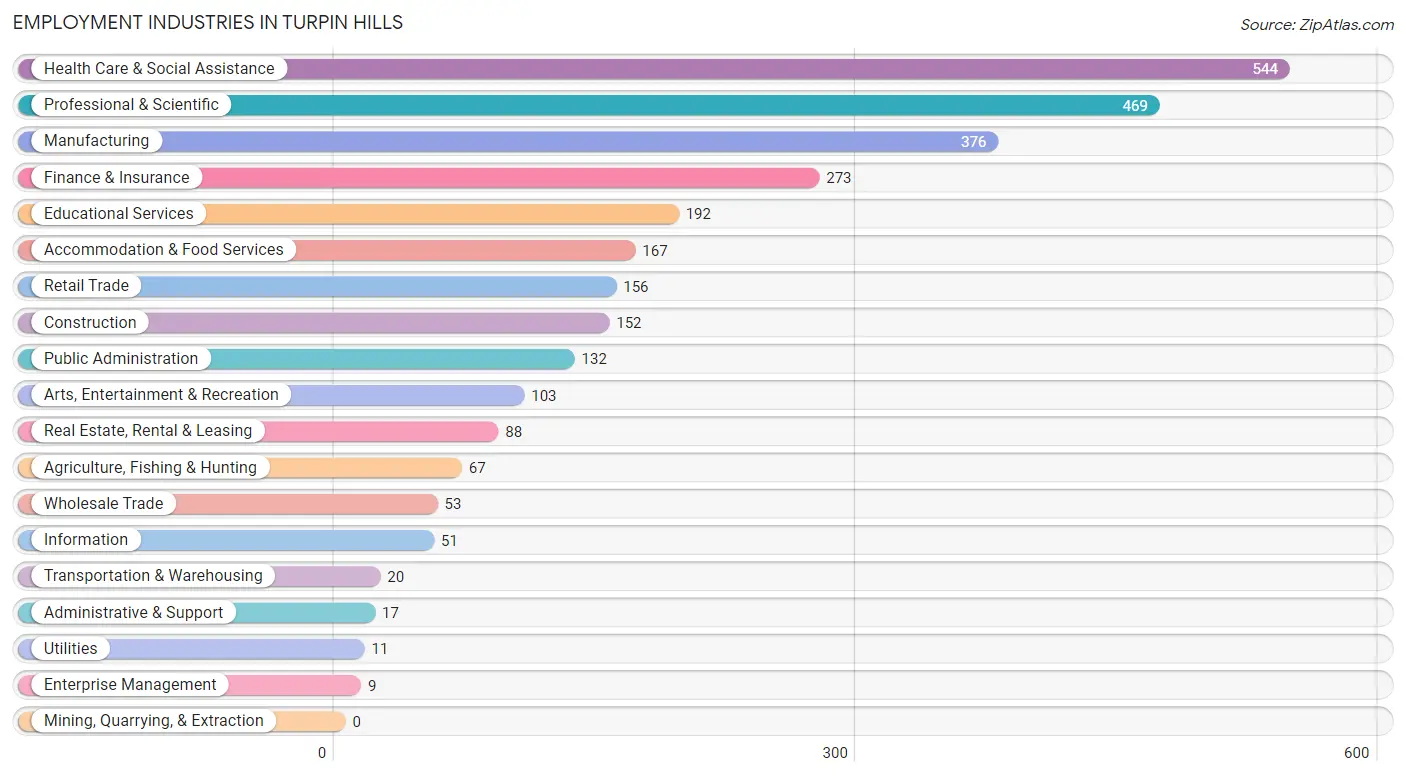
Employment Industries in Turpin Hills
The major employment industries in Turpin Hills include Health Care & Social Assistance (544 | 17.6%), Professional & Scientific (469 | 15.2%), Manufacturing (376 | 12.2%), Finance & Insurance (273 | 8.8%), and Educational Services (192 | 6.2%).
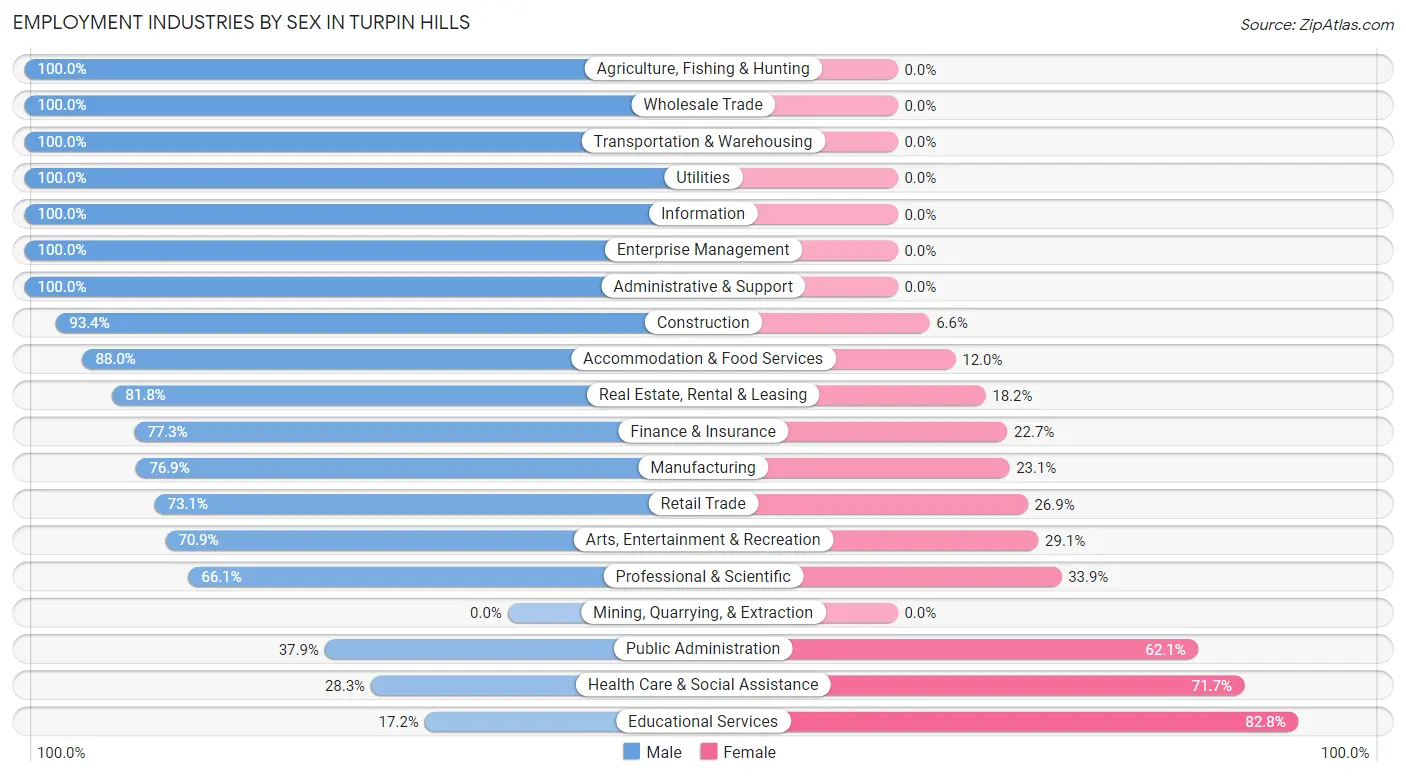
Employment Industries by Sex in Turpin Hills
The Turpin Hills industries that see more men than women are Agriculture, Fishing & Hunting (100.0%), Wholesale Trade (100.0%), and Transportation & Warehousing (100.0%), whereas the industries that tend to have a higher number of women are Educational Services (82.8%), Health Care & Social Assistance (71.7%), and Public Administration (62.1%).
| Industry | Male | Female |
| Agriculture, Fishing & Hunting | 67 (100.0%) | 0 (0.0%) |
| Mining, Quarrying, & Extraction | 0 (0.0%) | 0 (0.0%) |
| Construction | 142 (93.4%) | 10 (6.6%) |
| Manufacturing | 289 (76.9%) | 87 (23.1%) |
| Wholesale Trade | 53 (100.0%) | 0 (0.0%) |
| Retail Trade | 114 (73.1%) | 42 (26.9%) |
| Transportation & Warehousing | 20 (100.0%) | 0 (0.0%) |
| Utilities | 11 (100.0%) | 0 (0.0%) |
| Information | 51 (100.0%) | 0 (0.0%) |
| Finance & Insurance | 211 (77.3%) | 62 (22.7%) |
| Real Estate, Rental & Leasing | 72 (81.8%) | 16 (18.2%) |
| Professional & Scientific | 310 (66.1%) | 159 (33.9%) |
| Enterprise Management | 9 (100.0%) | 0 (0.0%) |
| Administrative & Support | 17 (100.0%) | 0 (0.0%) |
| Educational Services | 33 (17.2%) | 159 (82.8%) |
| Health Care & Social Assistance | 154 (28.3%) | 390 (71.7%) |
| Arts, Entertainment & Recreation | 73 (70.9%) | 30 (29.1%) |
| Accommodation & Food Services | 147 (88.0%) | 20 (12.0%) |
| Public Administration | 50 (37.9%) | 82 (62.1%) |
| Total | 1,880 (60.8%) | 1,212 (39.2%) |
Education in Turpin Hills
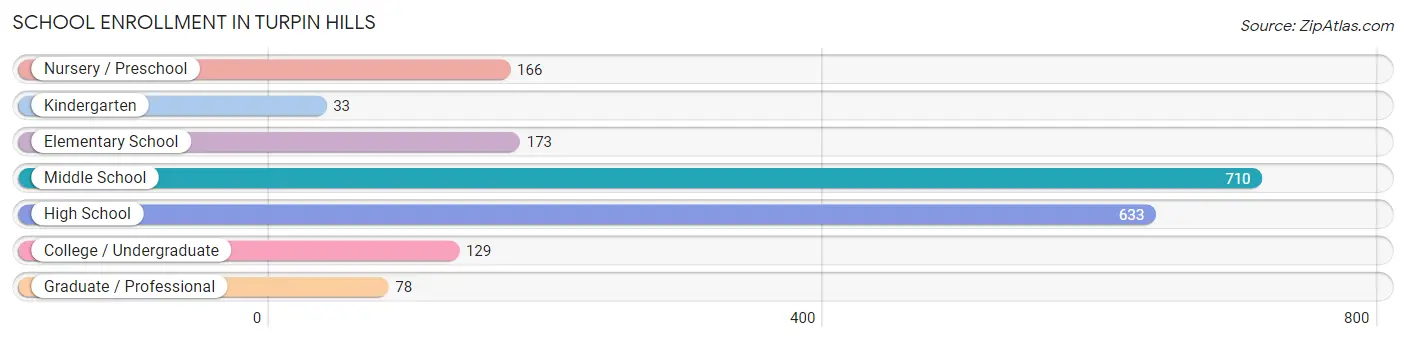
School Enrollment in Turpin Hills
The most common levels of schooling among the 1,922 students in Turpin Hills are middle school (710 | 36.9%), high school (633 | 32.9%), and elementary school (173 | 9.0%).
| School Level | # Students | % Students |
| Nursery / Preschool | 166 | 8.6% |
| Kindergarten | 33 | 1.7% |
| Elementary School | 173 | 9.0% |
| Middle School | 710 | 36.9% |
| High School | 633 | 32.9% |
| College / Undergraduate | 129 | 6.7% |
| Graduate / Professional | 78 | 4.1% |
| Total | 1,922 | 100.0% |
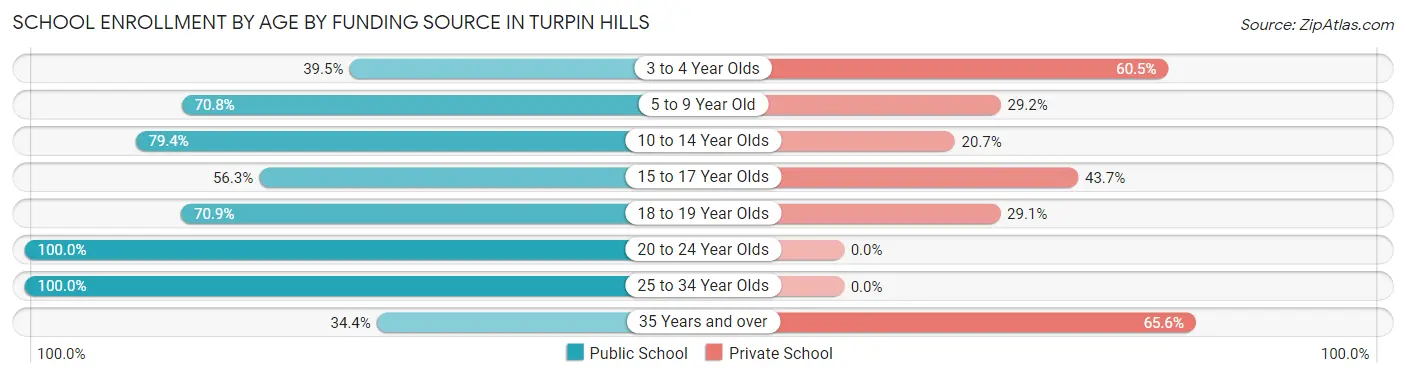
School Enrollment by Age by Funding Source in Turpin Hills
Out of a total of 1,922 students who are enrolled in schools in Turpin Hills, 609 (31.7%) attend a private institution, while the remaining 1,313 (68.3%) are enrolled in public schools. The age group of 35 years and over has the highest likelihood of being enrolled in private schools, with 40 (65.6% in the age bracket) enrolled. Conversely, the age group of 20 to 24 year olds has the lowest likelihood of being enrolled in a private school, with 37 (100.0% in the age bracket) attending a public institution.
| Age Bracket | Public School | Private School |
| 3 to 4 Year Olds | 51 (39.5%) | 78 (60.5%) |
| 5 to 9 Year Old | 155 (70.8%) | 64 (29.2%) |
| 10 to 14 Year Olds | 615 (79.3%) | 160 (20.6%) |
| 15 to 17 Year Olds | 289 (56.3%) | 224 (43.7%) |
| 18 to 19 Year Olds | 107 (70.9%) | 44 (29.1%) |
| 20 to 24 Year Olds | 37 (100.0%) | 0 (0.0%) |
| 25 to 34 Year Olds | 37 (100.0%) | 0 (0.0%) |
| 35 Years and over | 21 (34.4%) | 40 (65.6%) |
| Total | 1,313 (68.3%) | 609 (31.7%) |
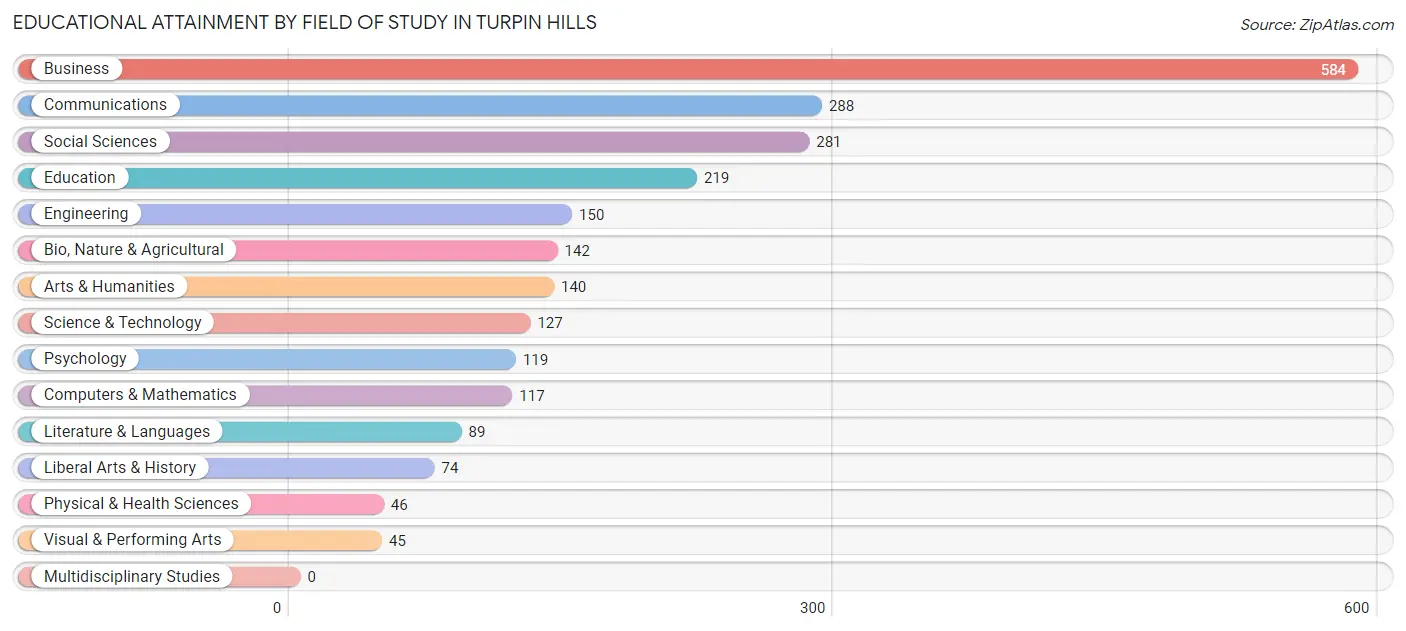
Educational Attainment by Field of Study in Turpin Hills
Business (584 | 24.1%), communications (288 | 11.9%), social sciences (281 | 11.6%), education (219 | 9.0%), and engineering (150 | 6.2%) are the most common fields of study among 2,421 individuals in Turpin Hills who have obtained a bachelor's degree or higher.
| Field of Study | # Graduates | % Graduates |
| Computers & Mathematics | 117 | 4.8% |
| Bio, Nature & Agricultural | 142 | 5.9% |
| Physical & Health Sciences | 46 | 1.9% |
| Psychology | 119 | 4.9% |
| Social Sciences | 281 | 11.6% |
| Engineering | 150 | 6.2% |
| Multidisciplinary Studies | 0 | 0.0% |
| Science & Technology | 127 | 5.2% |
| Business | 584 | 24.1% |
| Education | 219 | 9.0% |
| Literature & Languages | 89 | 3.7% |
| Liberal Arts & History | 74 | 3.1% |
| Visual & Performing Arts | 45 | 1.9% |
| Communications | 288 | 11.9% |
| Arts & Humanities | 140 | 5.8% |
| Total | 2,421 | 100.0% |
Transportation & Commute in Turpin Hills
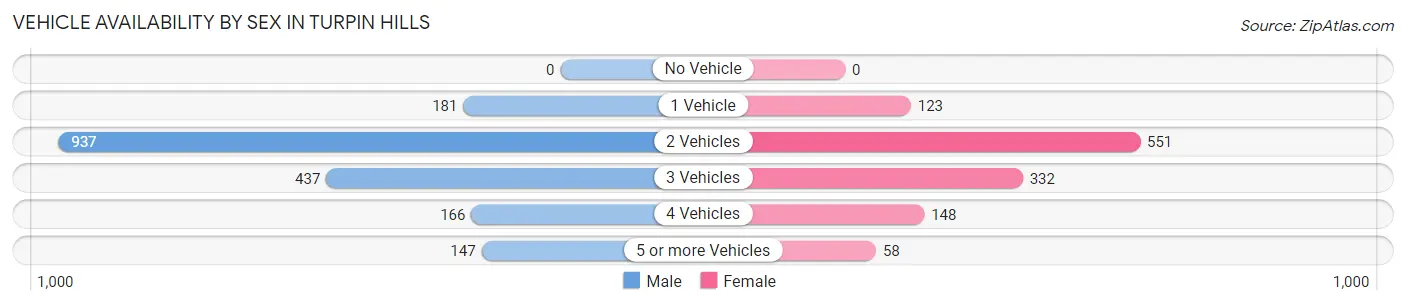
Vehicle Availability by Sex in Turpin Hills
The most prevalent vehicle ownership categories in Turpin Hills are males with 2 vehicles (937, accounting for 50.2%) and females with 2 vehicles (551, making up 77.3%).
| Vehicles Available | Male | Female |
| No Vehicle | 0 (0.0%) | 0 (0.0%) |
| 1 Vehicle | 181 (9.7%) | 123 (10.2%) |
| 2 Vehicles | 937 (50.2%) | 551 (45.5%) |
| 3 Vehicles | 437 (23.4%) | 332 (27.4%) |
| 4 Vehicles | 166 (8.9%) | 148 (12.2%) |
| 5 or more Vehicles | 147 (7.9%) | 58 (4.8%) |
| Total | 1,868 (100.0%) | 1,212 (100.0%) |
Commute Time in Turpin Hills
The most frequently occuring commute durations in Turpin Hills are 30 to 34 minutes (523 commuters, 20.3%), 25 to 29 minutes (478 commuters, 18.5%), and 10 to 14 minutes (409 commuters, 15.9%).
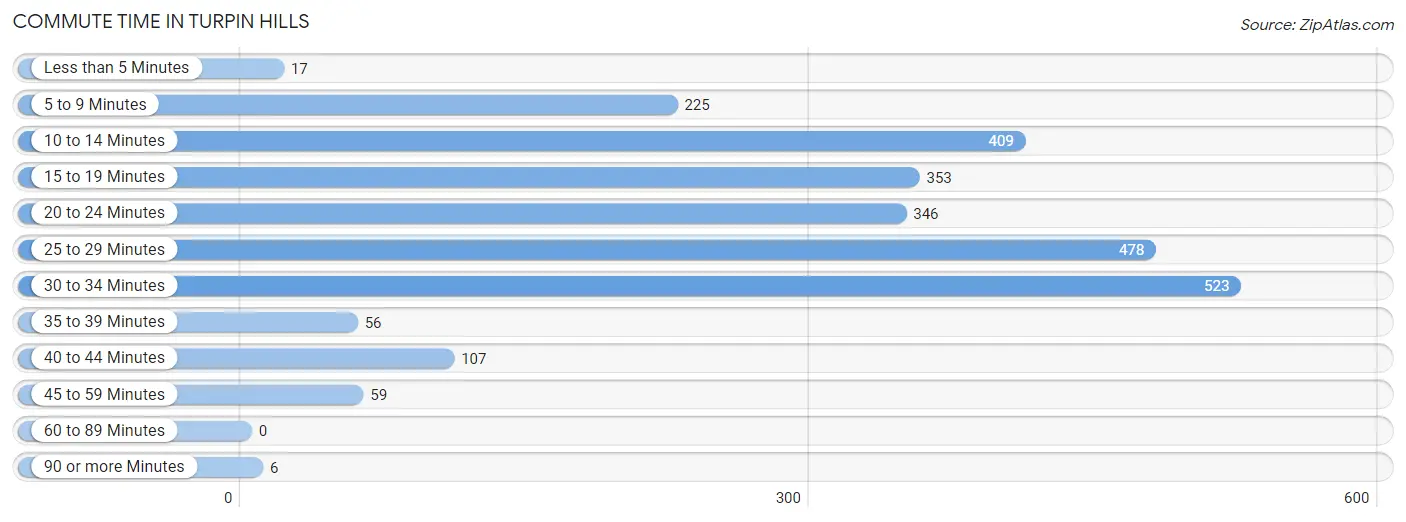
| Commute Time | # Commuters | % Commuters |
| Less than 5 Minutes | 17 | 0.7% |
| 5 to 9 Minutes | 225 | 8.7% |
| 10 to 14 Minutes | 409 | 15.9% |
| 15 to 19 Minutes | 353 | 13.7% |
| 20 to 24 Minutes | 346 | 13.4% |
| 25 to 29 Minutes | 478 | 18.5% |
| 30 to 34 Minutes | 523 | 20.3% |
| 35 to 39 Minutes | 56 | 2.2% |
| 40 to 44 Minutes | 107 | 4.2% |
| 45 to 59 Minutes | 59 | 2.3% |
| 60 to 89 Minutes | 0 | 0.0% |
| 90 or more Minutes | 6 | 0.2% |
Commute Time by Sex in Turpin Hills
The most common commute times in Turpin Hills are 30 to 34 minutes (398 commuters, 24.9%) for males and 25 to 29 minutes (240 commuters, 24.5%) for females.
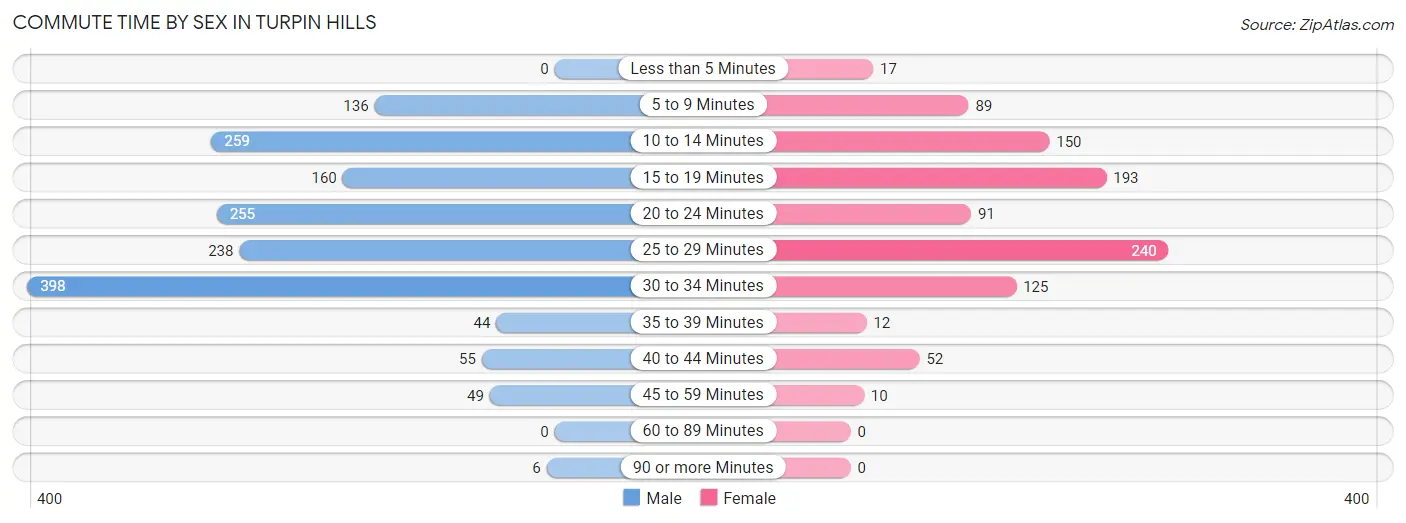
| Commute Time | Male | Female |
| Less than 5 Minutes | 0 (0.0%) | 17 (1.7%) |
| 5 to 9 Minutes | 136 (8.5%) | 89 (9.1%) |
| 10 to 14 Minutes | 259 (16.2%) | 150 (15.3%) |
| 15 to 19 Minutes | 160 (10.0%) | 193 (19.7%) |
| 20 to 24 Minutes | 255 (15.9%) | 91 (9.3%) |
| 25 to 29 Minutes | 238 (14.9%) | 240 (24.5%) |
| 30 to 34 Minutes | 398 (24.9%) | 125 (12.8%) |
| 35 to 39 Minutes | 44 (2.8%) | 12 (1.2%) |
| 40 to 44 Minutes | 55 (3.4%) | 52 (5.3%) |
| 45 to 59 Minutes | 49 (3.1%) | 10 (1.0%) |
| 60 to 89 Minutes | 0 (0.0%) | 0 (0.0%) |
| 90 or more Minutes | 6 (0.4%) | 0 (0.0%) |
Time of Departure to Work by Sex in Turpin Hills
The most frequent times of departure to work in Turpin Hills are 8:30 AM to 8:59 AM (318, 19.9%) for males and 7:30 AM to 7:59 AM (208, 21.2%) for females.
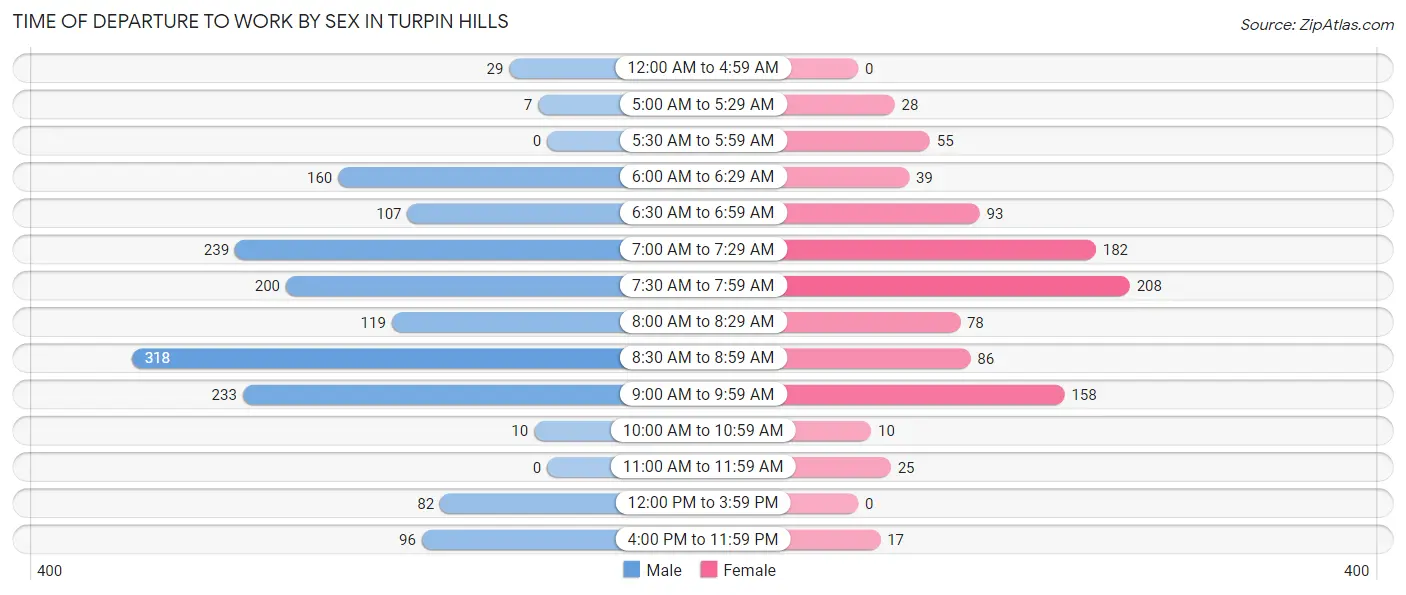
| Time of Departure | Male | Female |
| 12:00 AM to 4:59 AM | 29 (1.8%) | 0 (0.0%) |
| 5:00 AM to 5:29 AM | 7 (0.4%) | 28 (2.9%) |
| 5:30 AM to 5:59 AM | 0 (0.0%) | 55 (5.6%) |
| 6:00 AM to 6:29 AM | 160 (10.0%) | 39 (4.0%) |
| 6:30 AM to 6:59 AM | 107 (6.7%) | 93 (9.5%) |
| 7:00 AM to 7:29 AM | 239 (14.9%) | 182 (18.6%) |
| 7:30 AM to 7:59 AM | 200 (12.5%) | 208 (21.2%) |
| 8:00 AM to 8:29 AM | 119 (7.4%) | 78 (8.0%) |
| 8:30 AM to 8:59 AM | 318 (19.9%) | 86 (8.8%) |
| 9:00 AM to 9:59 AM | 233 (14.6%) | 158 (16.1%) |
| 10:00 AM to 10:59 AM | 10 (0.6%) | 10 (1.0%) |
| 11:00 AM to 11:59 AM | 0 (0.0%) | 25 (2.5%) |
| 12:00 PM to 3:59 PM | 82 (5.1%) | 0 (0.0%) |
| 4:00 PM to 11:59 PM | 96 (6.0%) | 17 (1.7%) |
| Total | 1,600 (100.0%) | 979 (100.0%) |
Housing Occupancy in Turpin Hills
Occupancy by Ownership in Turpin Hills
Of the total 1,943 dwellings in Turpin Hills, owner-occupied units account for 1,653 (85.1%), while renter-occupied units make up 290 (14.9%).
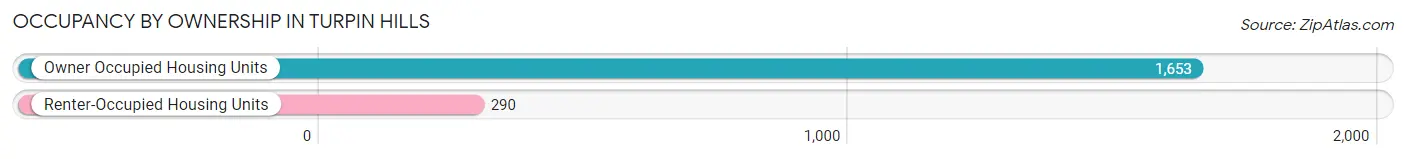
| Occupancy | # Housing Units | % Housing Units |
| Owner Occupied Housing Units | 1,653 | 85.1% |
| Renter-Occupied Housing Units | 290 | 14.9% |
| Total Occupied Housing Units | 1,943 | 100.0% |
Occupancy by Household Size in Turpin Hills
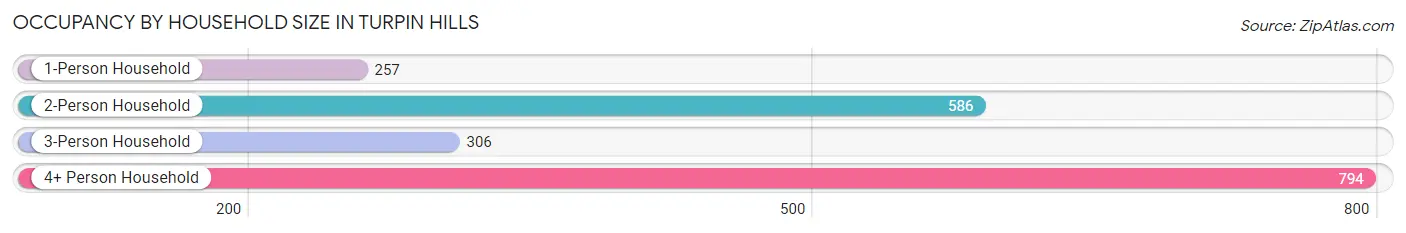
| Household Size | # Housing Units | % Housing Units |
| 1-Person Household | 257 | 13.2% |
| 2-Person Household | 586 | 30.2% |
| 3-Person Household | 306 | 15.8% |
| 4+ Person Household | 794 | 40.9% |
| Total Housing Units | 1,943 | 100.0% |
Occupancy by Ownership by Household Size in Turpin Hills
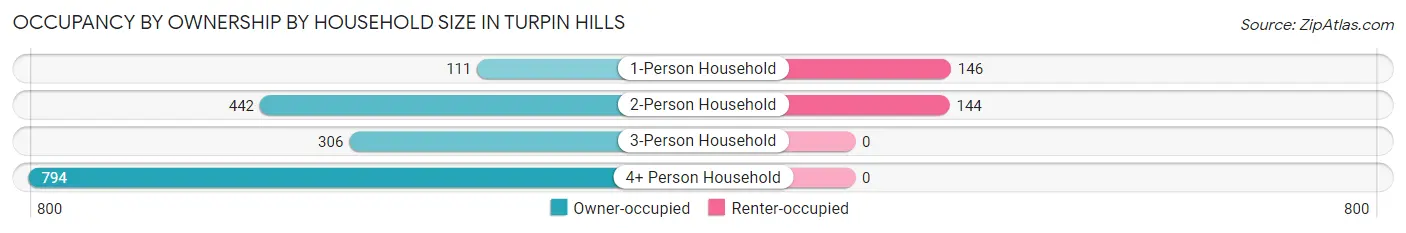
| Household Size | Owner-occupied | Renter-occupied |
| 1-Person Household | 111 (43.2%) | 146 (56.8%) |
| 2-Person Household | 442 (75.4%) | 144 (24.6%) |
| 3-Person Household | 306 (100.0%) | 0 (0.0%) |
| 4+ Person Household | 794 (100.0%) | 0 (0.0%) |
| Total Housing Units | 1,653 (85.1%) | 290 (14.9%) |
Occupancy by Educational Attainment in Turpin Hills
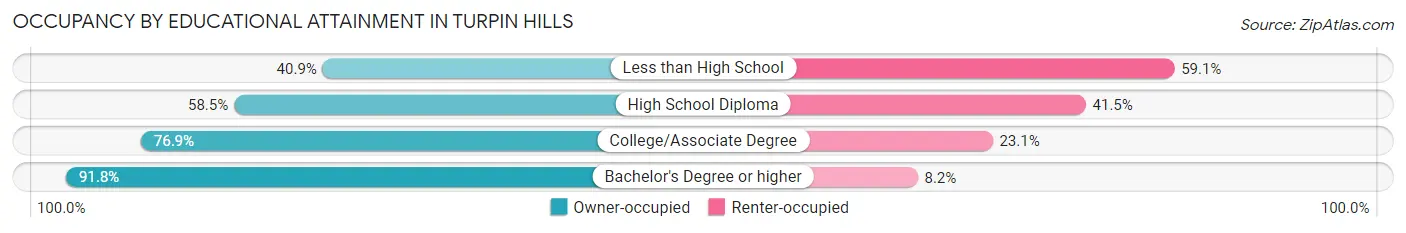
| Household Size | Owner-occupied | Renter-occupied |
| Less than High School | 18 (40.9%) | 26 (59.1%) |
| High School Diploma | 69 (58.5%) | 49 (41.5%) |
| College/Associate Degree | 357 (76.9%) | 107 (23.1%) |
| Bachelor's Degree or higher | 1,209 (91.8%) | 108 (8.2%) |
Occupancy by Age of Householder in Turpin Hills
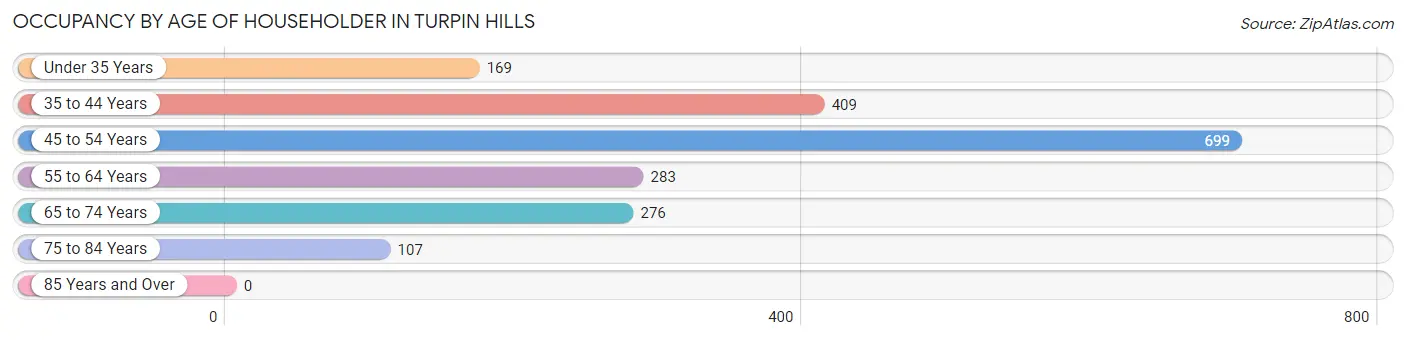
| Age Bracket | # Households | % Households |
| Under 35 Years | 169 | 8.7% |
| 35 to 44 Years | 409 | 21.0% |
| 45 to 54 Years | 699 | 36.0% |
| 55 to 64 Years | 283 | 14.6% |
| 65 to 74 Years | 276 | 14.2% |
| 75 to 84 Years | 107 | 5.5% |
| 85 Years and Over | 0 | 0.0% |
| Total | 1,943 | 100.0% |
Housing Finances in Turpin Hills
Median Income by Occupancy in Turpin Hills
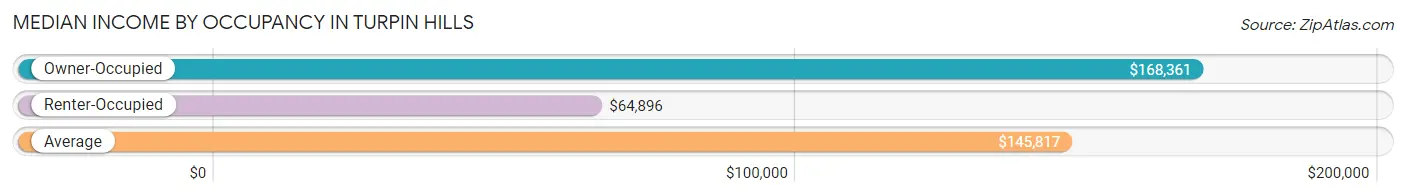
| Occupancy Type | # Households | Median Income |
| Owner-Occupied | 1,653 (85.1%) | $168,361 |
| Renter-Occupied | 290 (14.9%) | $64,896 |
| Average | 1,943 (100.0%) | $145,817 |
Occupancy by Householder Income Bracket in Turpin Hills
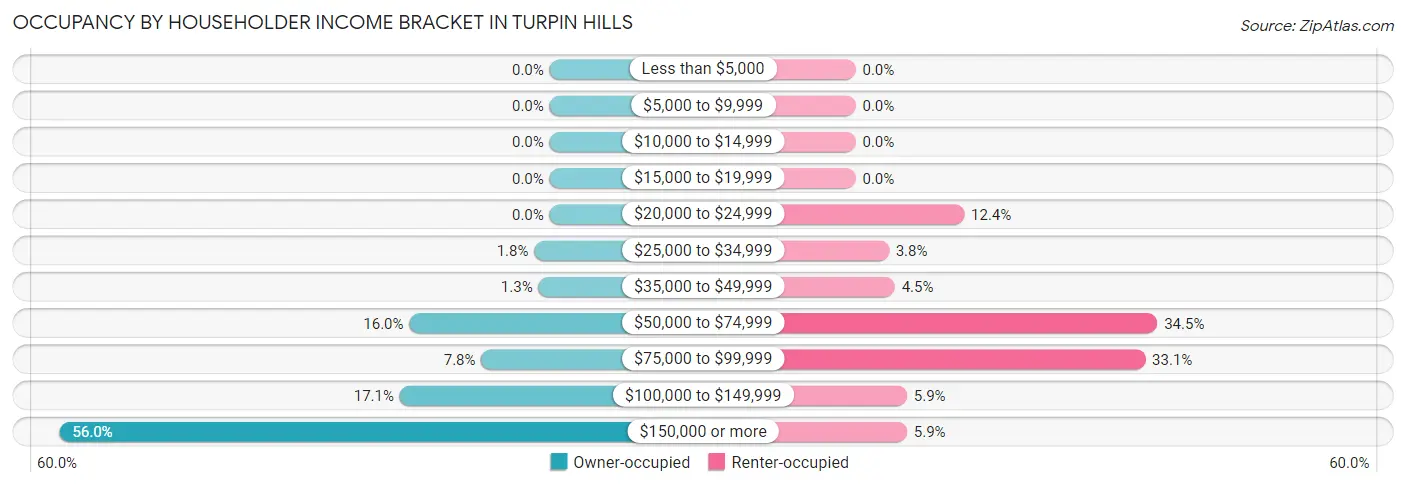
| Income Bracket | Owner-occupied | Renter-occupied |
| Less than $5,000 | 0 (0.0%) | 0 (0.0%) |
| $5,000 to $9,999 | 0 (0.0%) | 0 (0.0%) |
| $10,000 to $14,999 | 0 (0.0%) | 0 (0.0%) |
| $15,000 to $19,999 | 0 (0.0%) | 0 (0.0%) |
| $20,000 to $24,999 | 0 (0.0%) | 36 (12.4%) |
| $25,000 to $34,999 | 29 (1.8%) | 11 (3.8%) |
| $35,000 to $49,999 | 21 (1.3%) | 13 (4.5%) |
| $50,000 to $74,999 | 265 (16.0%) | 100 (34.5%) |
| $75,000 to $99,999 | 129 (7.8%) | 96 (33.1%) |
| $100,000 to $149,999 | 283 (17.1%) | 17 (5.9%) |
| $150,000 or more | 926 (56.0%) | 17 (5.9%) |
| Total | 1,653 (100.0%) | 290 (100.0%) |
Monthly Housing Cost Tiers in Turpin Hills
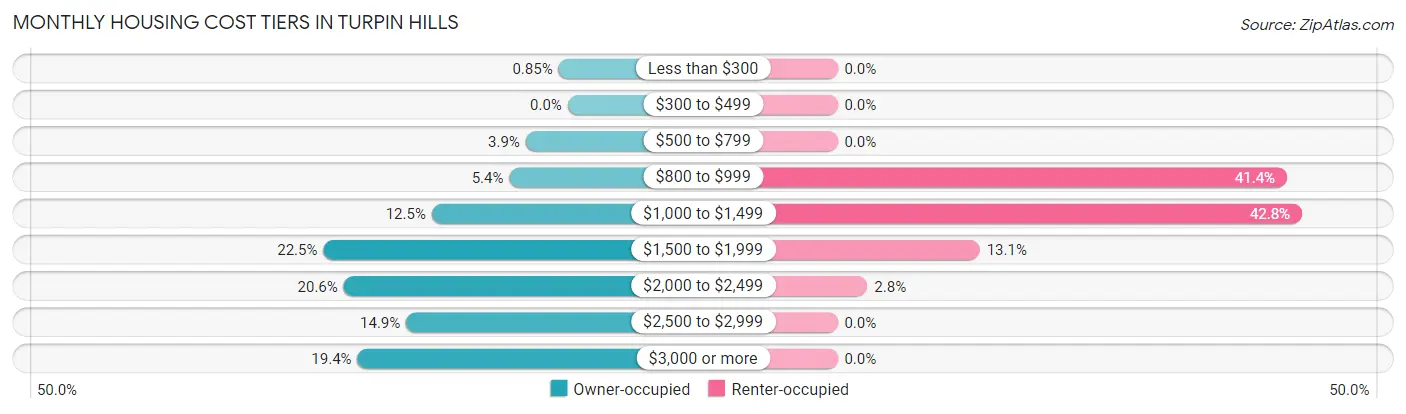
| Monthly Cost | Owner-occupied | Renter-occupied |
| Less than $300 | 14 (0.9%) | 0 (0.0%) |
| $300 to $499 | 0 (0.0%) | 0 (0.0%) |
| $500 to $799 | 64 (3.9%) | 0 (0.0%) |
| $800 to $999 | 89 (5.4%) | 120 (41.4%) |
| $1,000 to $1,499 | 207 (12.5%) | 124 (42.8%) |
| $1,500 to $1,999 | 372 (22.5%) | 38 (13.1%) |
| $2,000 to $2,499 | 341 (20.6%) | 8 (2.8%) |
| $2,500 to $2,999 | 246 (14.9%) | 0 (0.0%) |
| $3,000 or more | 320 (19.4%) | 0 (0.0%) |
| Total | 1,653 (100.0%) | 290 (100.0%) |
Physical Housing Characteristics in Turpin Hills
Housing Structures in Turpin Hills
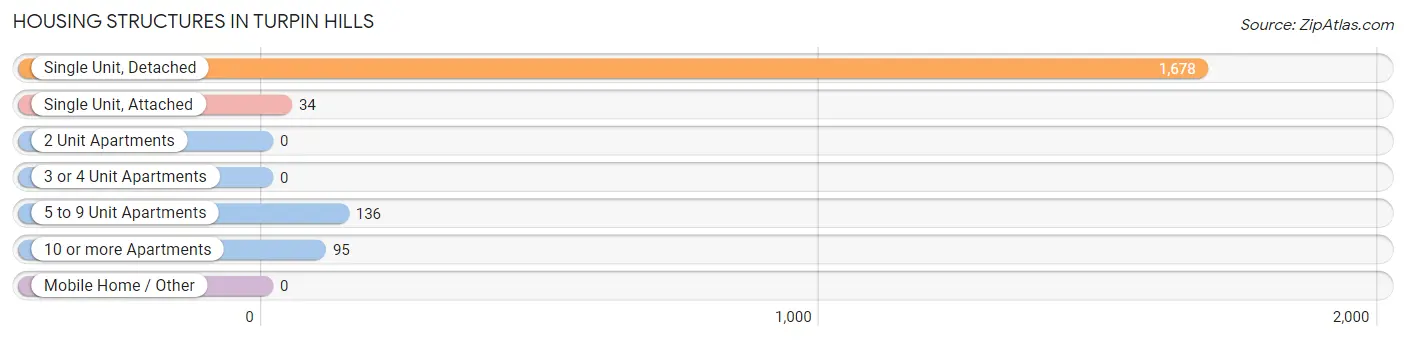
| Structure Type | # Housing Units | % Housing Units |
| Single Unit, Detached | 1,678 | 86.4% |
| Single Unit, Attached | 34 | 1.8% |
| 2 Unit Apartments | 0 | 0.0% |
| 3 or 4 Unit Apartments | 0 | 0.0% |
| 5 to 9 Unit Apartments | 136 | 7.0% |
| 10 or more Apartments | 95 | 4.9% |
| Mobile Home / Other | 0 | 0.0% |
| Total | 1,943 | 100.0% |
Housing Structures by Occupancy in Turpin Hills
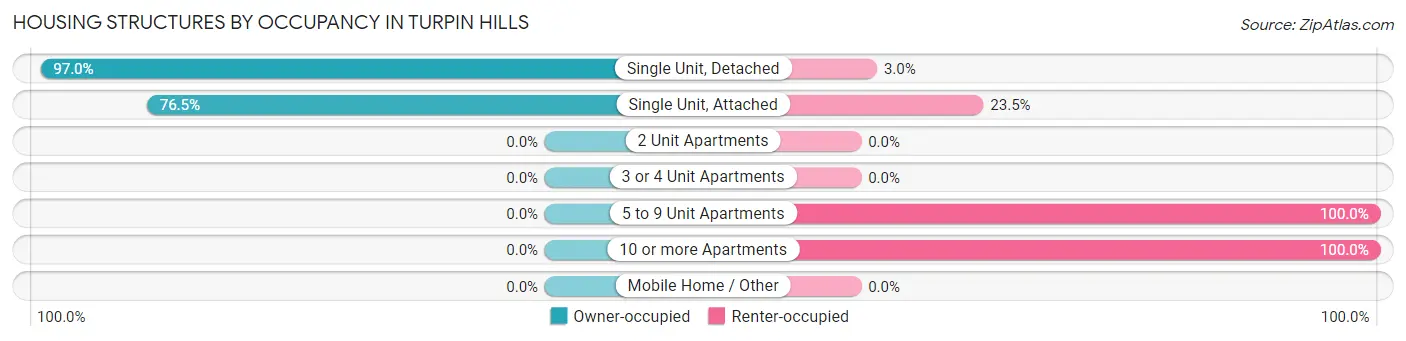
| Structure Type | Owner-occupied | Renter-occupied |
| Single Unit, Detached | 1,627 (97.0%) | 51 (3.0%) |
| Single Unit, Attached | 26 (76.5%) | 8 (23.5%) |
| 2 Unit Apartments | 0 (0.0%) | 0 (0.0%) |
| 3 or 4 Unit Apartments | 0 (0.0%) | 0 (0.0%) |
| 5 to 9 Unit Apartments | 0 (0.0%) | 136 (100.0%) |
| 10 or more Apartments | 0 (0.0%) | 95 (100.0%) |
| Mobile Home / Other | 0 (0.0%) | 0 (0.0%) |
| Total | 1,653 (85.1%) | 290 (14.9%) |
Housing Structures by Number of Rooms in Turpin Hills
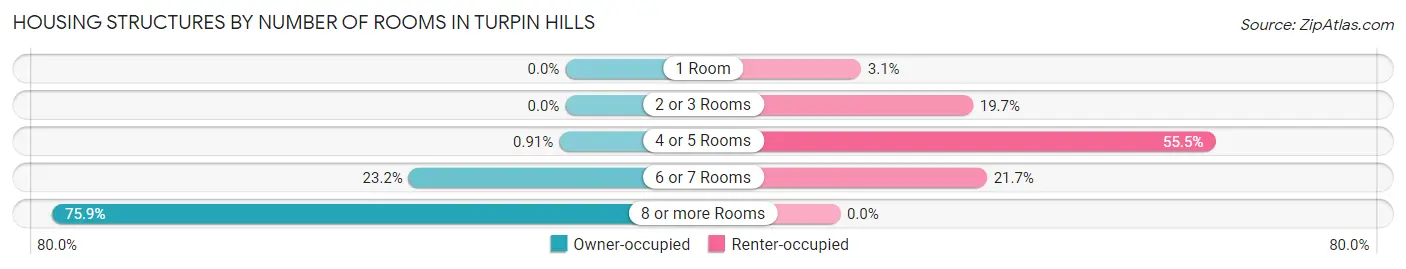
| Number of Rooms | Owner-occupied | Renter-occupied |
| 1 Room | 0 (0.0%) | 9 (3.1%) |
| 2 or 3 Rooms | 0 (0.0%) | 57 (19.7%) |
| 4 or 5 Rooms | 15 (0.9%) | 161 (55.5%) |
| 6 or 7 Rooms | 383 (23.2%) | 63 (21.7%) |
| 8 or more Rooms | 1,255 (75.9%) | 0 (0.0%) |
| Total | 1,653 (100.0%) | 290 (100.0%) |
Housing Structure by Heating Type in Turpin Hills
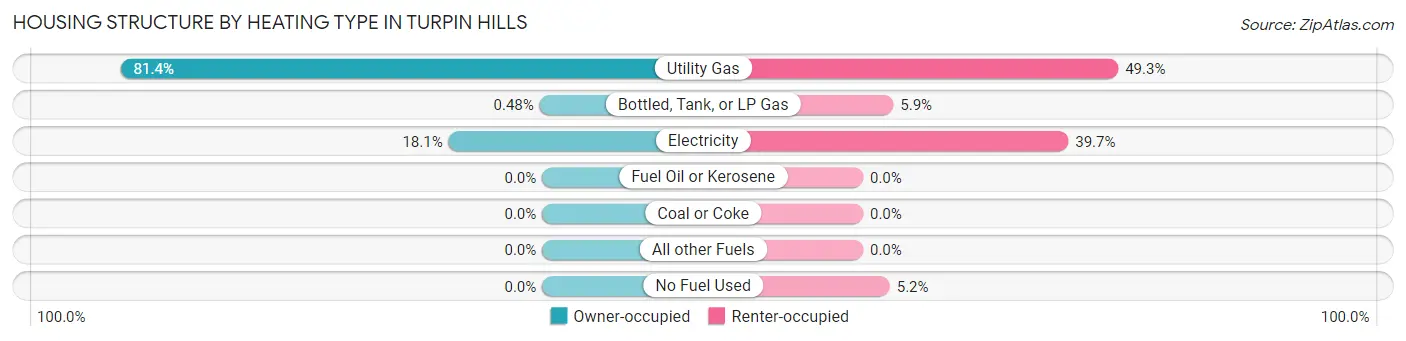
| Heating Type | Owner-occupied | Renter-occupied |
| Utility Gas | 1,346 (81.4%) | 143 (49.3%) |
| Bottled, Tank, or LP Gas | 8 (0.5%) | 17 (5.9%) |
| Electricity | 299 (18.1%) | 115 (39.7%) |
| Fuel Oil or Kerosene | 0 (0.0%) | 0 (0.0%) |
| Coal or Coke | 0 (0.0%) | 0 (0.0%) |
| All other Fuels | 0 (0.0%) | 0 (0.0%) |
| No Fuel Used | 0 (0.0%) | 15 (5.2%) |
| Total | 1,653 (100.0%) | 290 (100.0%) |
Household Vehicle Usage in Turpin Hills
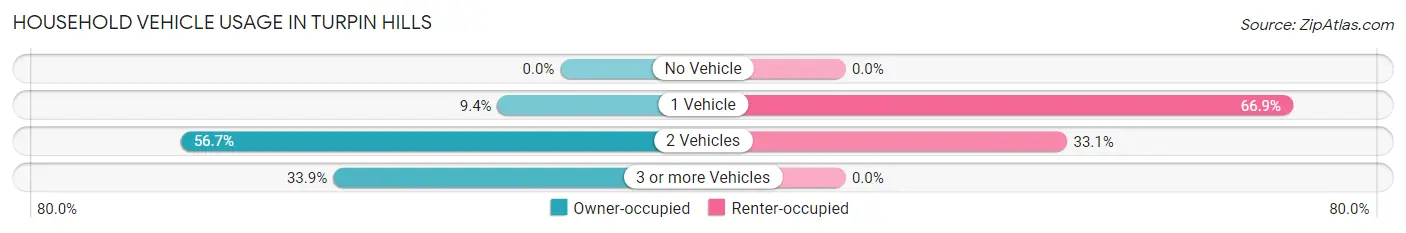
| Vehicles per Household | Owner-occupied | Renter-occupied |
| No Vehicle | 0 (0.0%) | 0 (0.0%) |
| 1 Vehicle | 155 (9.4%) | 194 (66.9%) |
| 2 Vehicles | 937 (56.7%) | 96 (33.1%) |
| 3 or more Vehicles | 561 (33.9%) | 0 (0.0%) |
| Total | 1,653 (100.0%) | 290 (100.0%) |
Real Estate & Mortgages in Turpin Hills
Real Estate and Mortgage Overview in Turpin Hills
| Characteristic | Without Mortgage | With Mortgage |
| Housing Units | 350 | 1,303 |
| Median Property Value | $394,500 | $387,300 |
| Median Household Income | $142,361 | $752 |
| Monthly Housing Costs | $1,054 | $307 |
| Real Estate Taxes | $7,807 | $0 |
Property Value by Mortgage Status in Turpin Hills
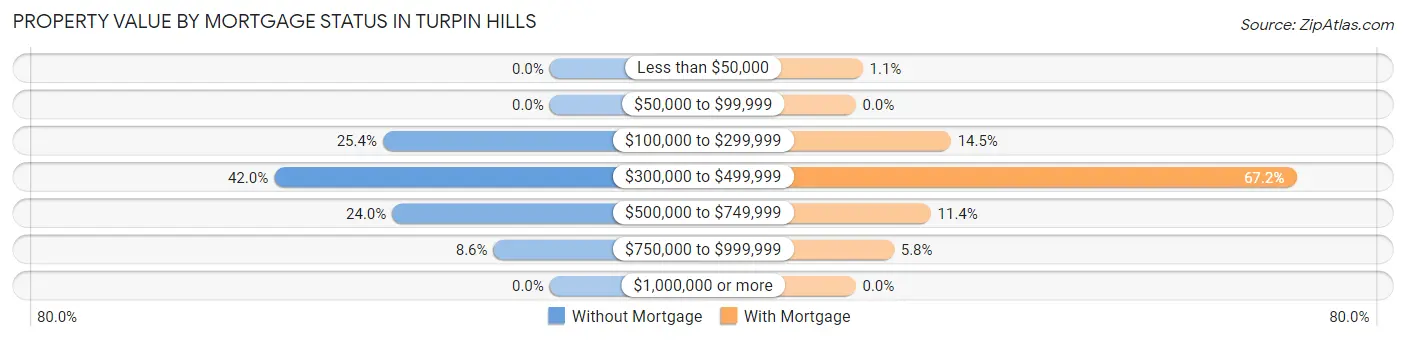
| Property Value | Without Mortgage | With Mortgage |
| Less than $50,000 | 0 (0.0%) | 14 (1.1%) |
| $50,000 to $99,999 | 0 (0.0%) | 0 (0.0%) |
| $100,000 to $299,999 | 89 (25.4%) | 189 (14.5%) |
| $300,000 to $499,999 | 147 (42.0%) | 875 (67.1%) |
| $500,000 to $749,999 | 84 (24.0%) | 149 (11.4%) |
| $750,000 to $999,999 | 30 (8.6%) | 76 (5.8%) |
| $1,000,000 or more | 0 (0.0%) | 0 (0.0%) |
| Total | 350 (100.0%) | 1,303 (100.0%) |
Household Income by Mortgage Status in Turpin Hills
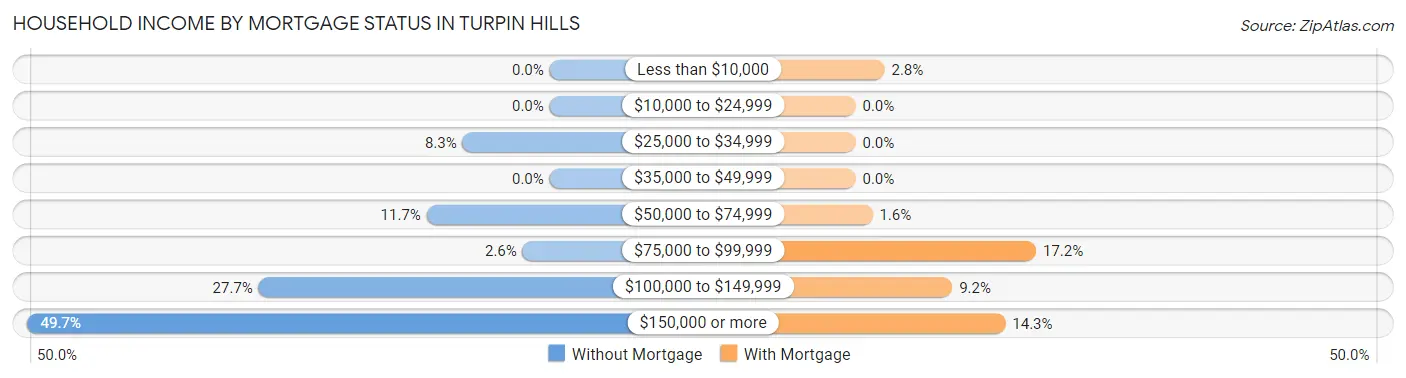
| Household Income | Without Mortgage | With Mortgage |
| Less than $10,000 | 0 (0.0%) | 36 (2.8%) |
| $10,000 to $24,999 | 0 (0.0%) | 0 (0.0%) |
| $25,000 to $34,999 | 29 (8.3%) | 0 (0.0%) |
| $35,000 to $49,999 | 0 (0.0%) | 0 (0.0%) |
| $50,000 to $74,999 | 41 (11.7%) | 21 (1.6%) |
| $75,000 to $99,999 | 9 (2.6%) | 224 (17.2%) |
| $100,000 to $149,999 | 97 (27.7%) | 120 (9.2%) |
| $150,000 or more | 174 (49.7%) | 186 (14.3%) |
| Total | 350 (100.0%) | 1,303 (100.0%) |
Property Value to Household Income Ratio in Turpin Hills
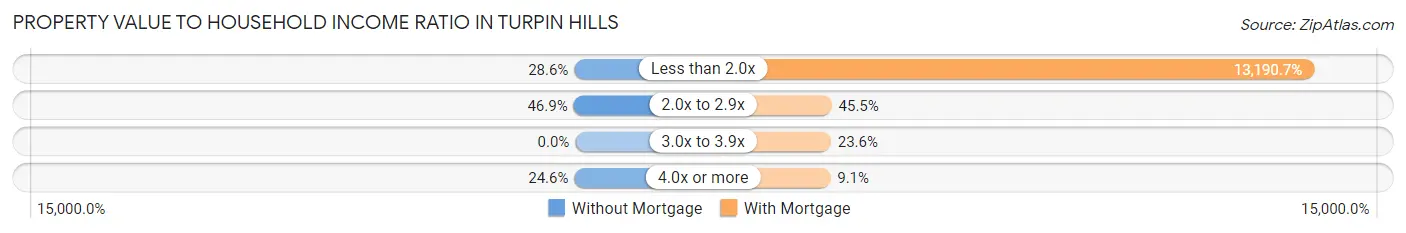
| Value-to-Income Ratio | Without Mortgage | With Mortgage |
| Less than 2.0x | 100 (28.6%) | 171,875 (13,190.7%) |
| 2.0x to 2.9x | 164 (46.9%) | 593 (45.5%) |
| 3.0x to 3.9x | 0 (0.0%) | 308 (23.6%) |
| 4.0x or more | 86 (24.6%) | 119 (9.1%) |
| Total | 350 (100.0%) | 1,303 (100.0%) |
Real Estate Taxes by Mortgage Status in Turpin Hills
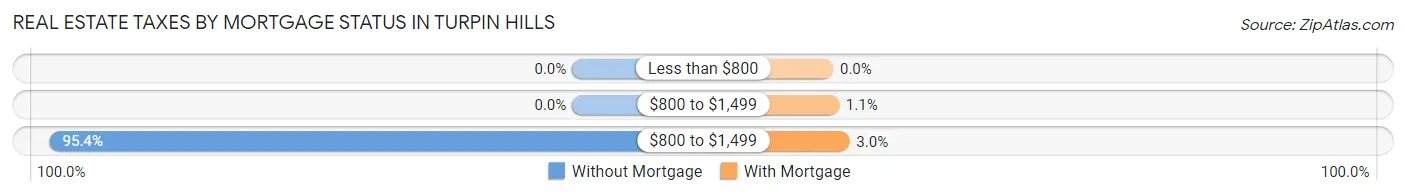
| Property Taxes | Without Mortgage | With Mortgage |
| Less than $800 | 0 (0.0%) | 0 (0.0%) |
| $800 to $1,499 | 0 (0.0%) | 14 (1.1%) |
| $800 to $1,499 | 334 (95.4%) | 39 (3.0%) |
| Total | 350 (100.0%) | 1,303 (100.0%) |
Health & Disability in Turpin Hills
Health Insurance Coverage by Age in Turpin Hills
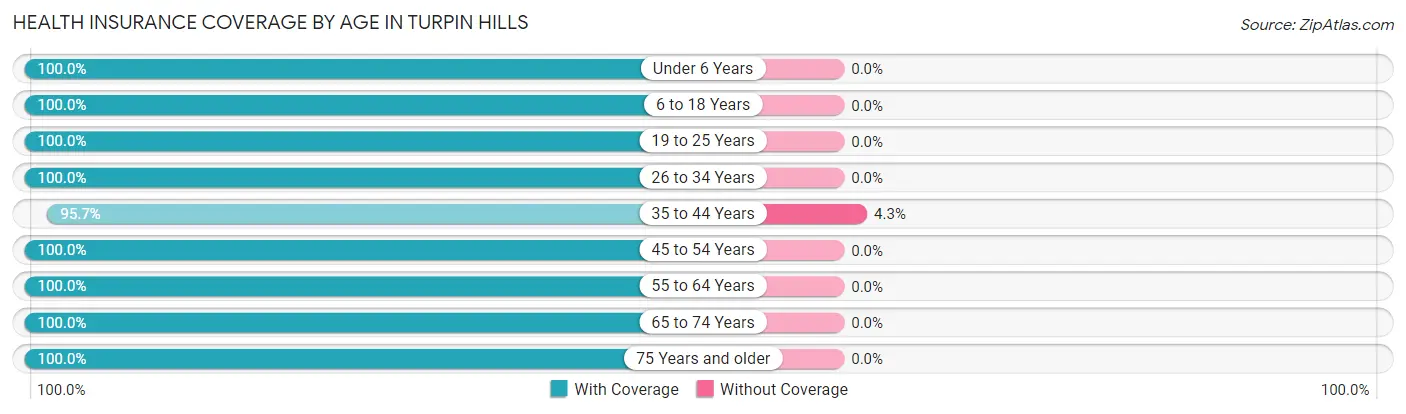
| Age Bracket | With Coverage | Without Coverage |
| Under 6 Years | 452 (100.0%) | 0 (0.0%) |
| 6 to 18 Years | 1,566 (100.0%) | 0 (0.0%) |
| 19 to 25 Years | 342 (100.0%) | 0 (0.0%) |
| 26 to 34 Years | 226 (100.0%) | 0 (0.0%) |
| 35 to 44 Years | 854 (95.7%) | 38 (4.3%) |
| 45 to 54 Years | 1,136 (100.0%) | 0 (0.0%) |
| 55 to 64 Years | 623 (100.0%) | 0 (0.0%) |
| 65 to 74 Years | 384 (100.0%) | 0 (0.0%) |
| 75 Years and older | 210 (100.0%) | 0 (0.0%) |
| Total | 5,793 (99.4%) | 38 (0.6%) |
Health Insurance Coverage by Citizenship Status in Turpin Hills
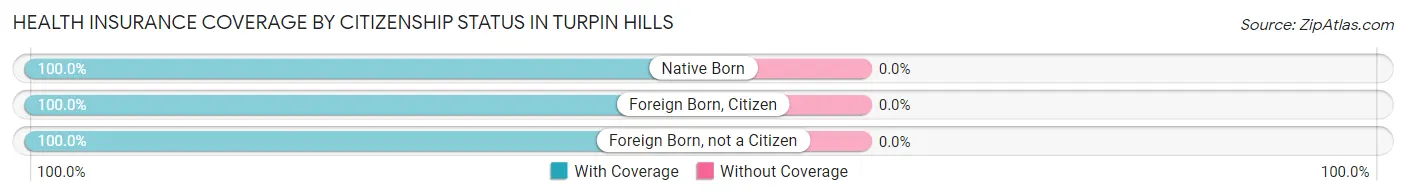
| Citizenship Status | With Coverage | Without Coverage |
| Native Born | 452 (100.0%) | 0 (0.0%) |
| Foreign Born, Citizen | 1,566 (100.0%) | 0 (0.0%) |
| Foreign Born, not a Citizen | 342 (100.0%) | 0 (0.0%) |
Health Insurance Coverage by Household Income in Turpin Hills
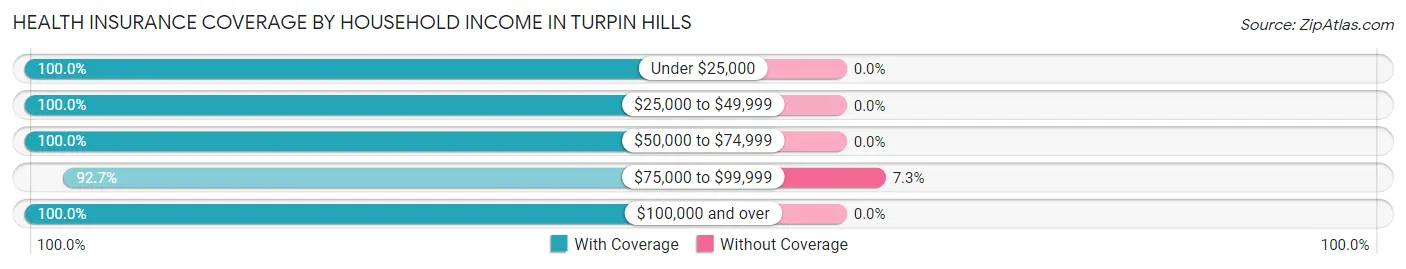
| Household Income | With Coverage | Without Coverage |
| Under $25,000 | 36 (100.0%) | 0 (0.0%) |
| $25,000 to $49,999 | 158 (100.0%) | 0 (0.0%) |
| $50,000 to $74,999 | 920 (100.0%) | 0 (0.0%) |
| $75,000 to $99,999 | 483 (92.7%) | 38 (7.3%) |
| $100,000 and over | 4,196 (100.0%) | 0 (0.0%) |
Public vs Private Health Insurance Coverage by Age in Turpin Hills
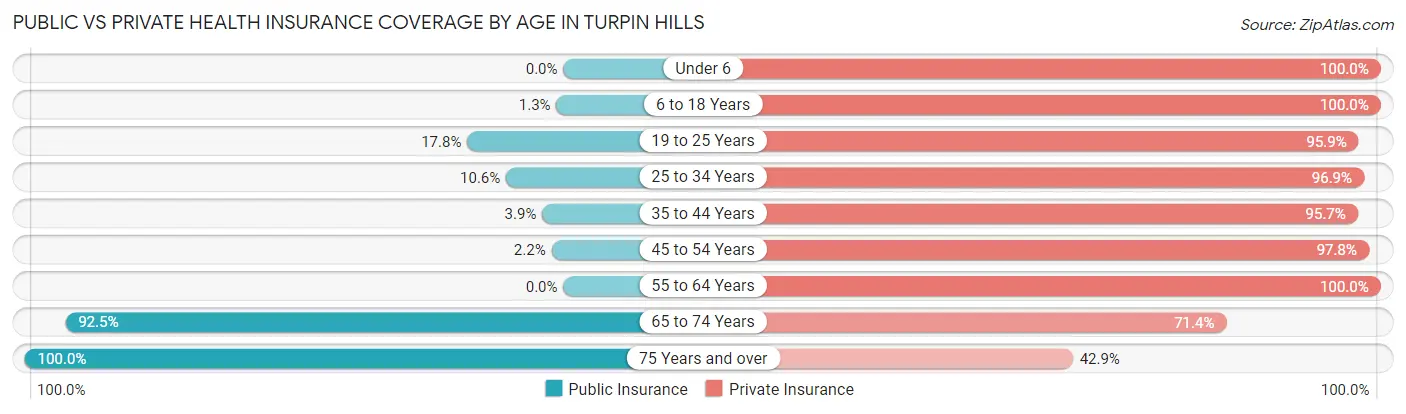
| Age Bracket | Public Insurance | Private Insurance |
| Under 6 | 0 (0.0%) | 452 (100.0%) |
| 6 to 18 Years | 20 (1.3%) | 1,566 (100.0%) |
| 19 to 25 Years | 61 (17.8%) | 328 (95.9%) |
| 25 to 34 Years | 24 (10.6%) | 219 (96.9%) |
| 35 to 44 Years | 35 (3.9%) | 854 (95.7%) |
| 45 to 54 Years | 25 (2.2%) | 1,111 (97.8%) |
| 55 to 64 Years | 0 (0.0%) | 623 (100.0%) |
| 65 to 74 Years | 355 (92.4%) | 274 (71.4%) |
| 75 Years and over | 210 (100.0%) | 90 (42.9%) |
| Total | 730 (12.5%) | 5,517 (94.6%) |
Disability Status by Sex by Age in Turpin Hills
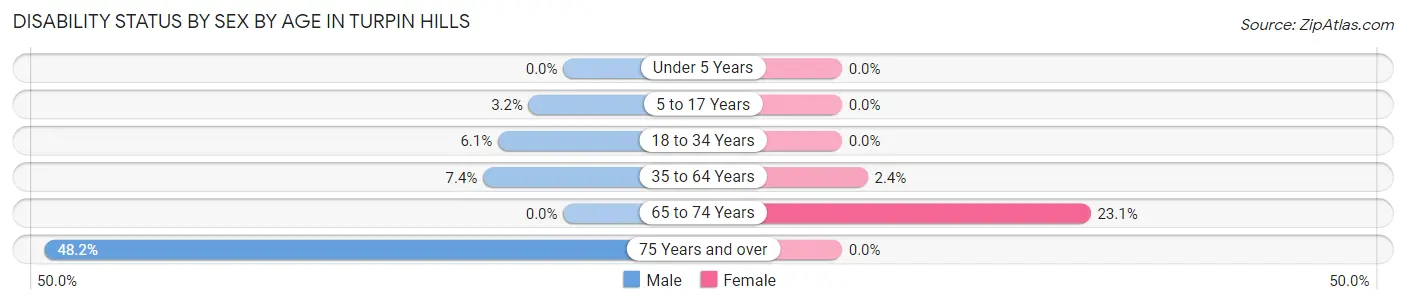
| Age Bracket | Male | Female |
| Under 5 Years | 0 (0.0%) | 0 (0.0%) |
| 5 to 17 Years | 26 (3.2%) | 0 (0.0%) |
| 18 to 34 Years | 28 (6.1%) | 0 (0.0%) |
| 35 to 64 Years | 104 (7.4%) | 30 (2.4%) |
| 65 to 74 Years | 0 (0.0%) | 45 (23.1%) |
| 75 Years and over | 52 (48.1%) | 0 (0.0%) |
Disability Class by Sex by Age in Turpin Hills
Disability Class: Hearing Difficulty
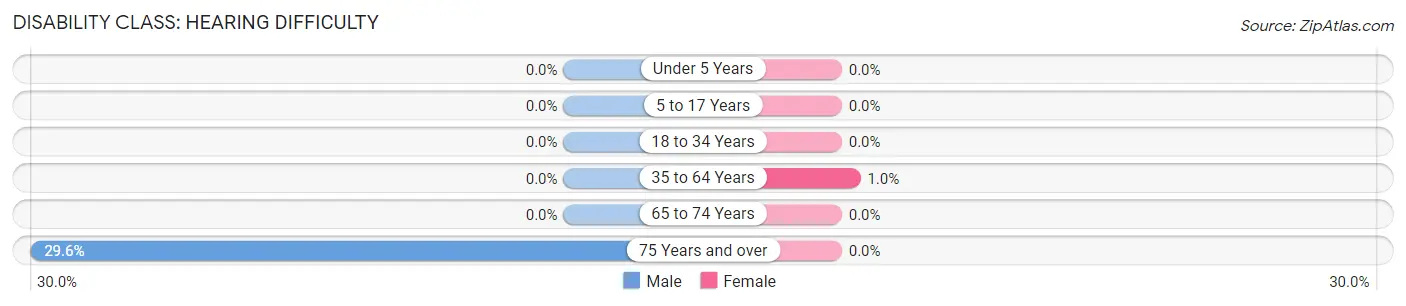
| Age Bracket | Male | Female |
| Under 5 Years | 0 (0.0%) | 0 (0.0%) |
| 5 to 17 Years | 0 (0.0%) | 0 (0.0%) |
| 18 to 34 Years | 0 (0.0%) | 0 (0.0%) |
| 35 to 64 Years | 0 (0.0%) | 13 (1.0%) |
| 65 to 74 Years | 0 (0.0%) | 0 (0.0%) |
| 75 Years and over | 32 (29.6%) | 0 (0.0%) |
Disability Class: Vision Difficulty
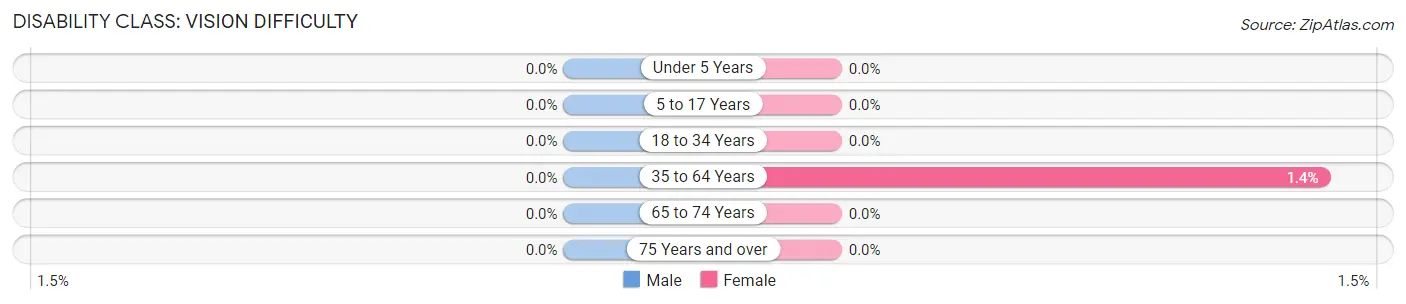
| Age Bracket | Male | Female |
| Under 5 Years | 0 (0.0%) | 0 (0.0%) |
| 5 to 17 Years | 0 (0.0%) | 0 (0.0%) |
| 18 to 34 Years | 0 (0.0%) | 0 (0.0%) |
| 35 to 64 Years | 0 (0.0%) | 17 (1.4%) |
| 65 to 74 Years | 0 (0.0%) | 0 (0.0%) |
| 75 Years and over | 0 (0.0%) | 0 (0.0%) |
Disability Class: Cognitive Difficulty
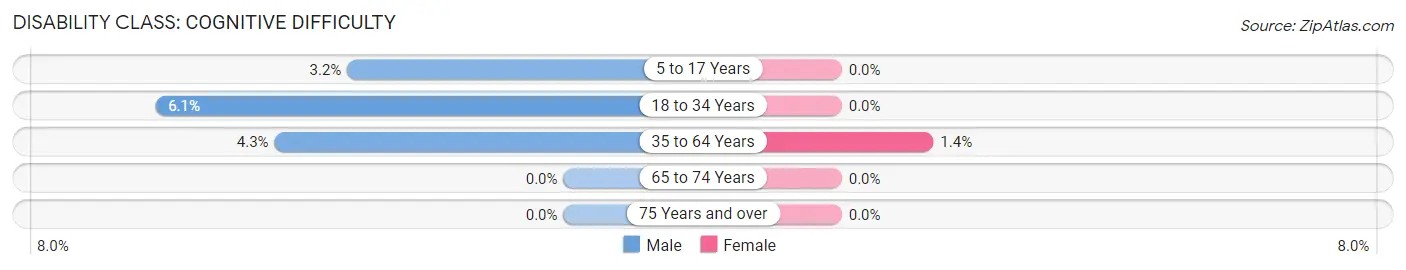
| Age Bracket | Male | Female |
| 5 to 17 Years | 26 (3.2%) | 0 (0.0%) |
| 18 to 34 Years | 28 (6.1%) | 0 (0.0%) |
| 35 to 64 Years | 60 (4.3%) | 17 (1.4%) |
| 65 to 74 Years | 0 (0.0%) | 0 (0.0%) |
| 75 Years and over | 0 (0.0%) | 0 (0.0%) |
Disability Class: Ambulatory Difficulty
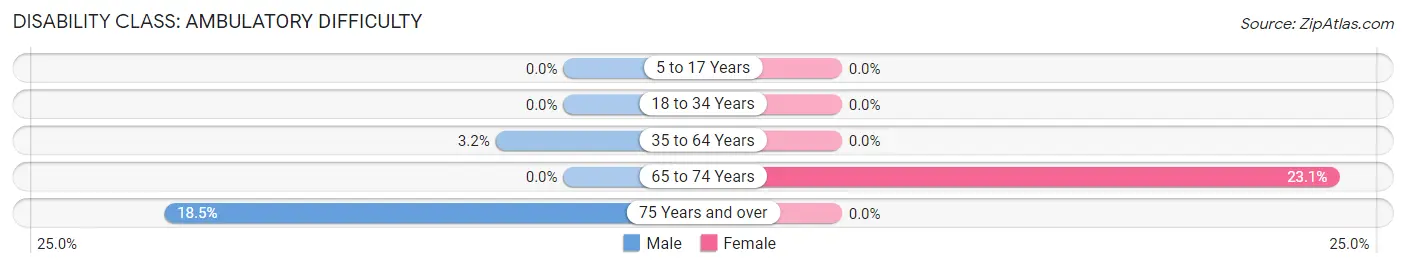
| Age Bracket | Male | Female |
| 5 to 17 Years | 0 (0.0%) | 0 (0.0%) |
| 18 to 34 Years | 0 (0.0%) | 0 (0.0%) |
| 35 to 64 Years | 44 (3.2%) | 0 (0.0%) |
| 65 to 74 Years | 0 (0.0%) | 45 (23.1%) |
| 75 Years and over | 20 (18.5%) | 0 (0.0%) |
Disability Class: Self-Care Difficulty
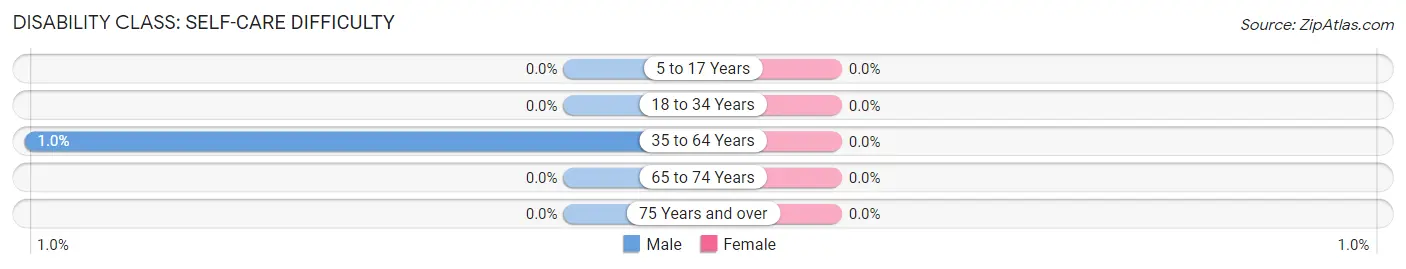
| Age Bracket | Male | Female |
| 5 to 17 Years | 0 (0.0%) | 0 (0.0%) |
| 18 to 34 Years | 0 (0.0%) | 0 (0.0%) |
| 35 to 64 Years | 14 (1.0%) | 0 (0.0%) |
| 65 to 74 Years | 0 (0.0%) | 0 (0.0%) |
| 75 Years and over | 0 (0.0%) | 0 (0.0%) |
Technology Access in Turpin Hills
Computing Device Access in Turpin Hills
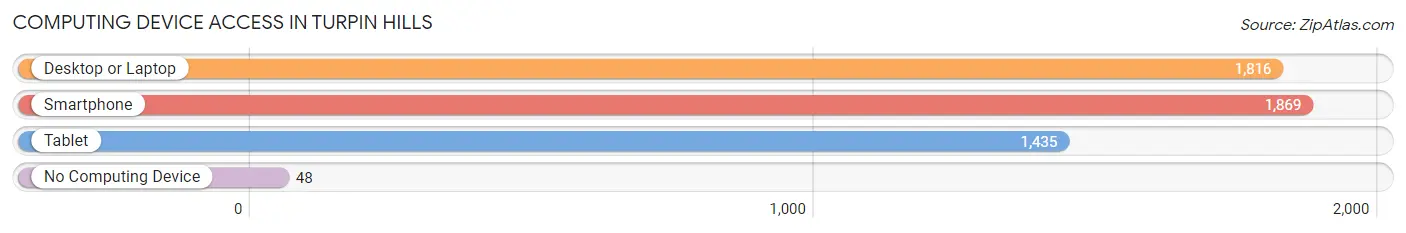
| Device Type | # Households | % Households |
| Desktop or Laptop | 1,816 | 93.5% |
| Smartphone | 1,869 | 96.2% |
| Tablet | 1,435 | 73.9% |
| No Computing Device | 48 | 2.5% |
| Total | 1,943 | 100.0% |
Internet Access in Turpin Hills
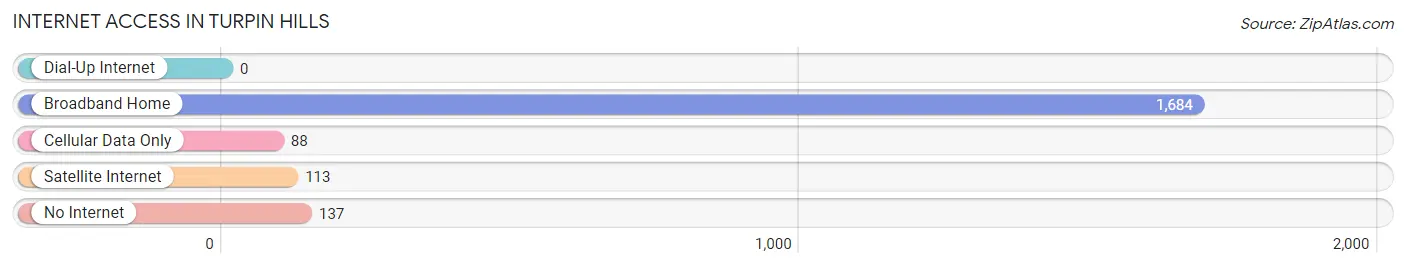
| Internet Type | # Households | % Households |
| Dial-Up Internet | 0 | 0.0% |
| Broadband Home | 1,684 | 86.7% |
| Cellular Data Only | 88 | 4.5% |
| Satellite Internet | 113 | 5.8% |
| No Internet | 137 | 7.0% |
| Total | 1,943 | 100.0% |
Turpin Hills Summary
Turpin Hills is a small village located in Hamilton County, Ohio. It is situated in the southwestern corner of the county, just north of the city of Cincinnati. The village is bordered by the cities of Sharonville and Blue Ash, and is part of the Cincinnati metropolitan area. The population of Turpin Hills was 2,845 at the 2010 census.
History
The area that is now Turpin Hills was originally inhabited by the Shawnee Native American tribe. The first European settlers arrived in the area in the late 1700s, and the village was officially founded in 1817. The village was named after the Turpin family, who were among the first settlers in the area.
In the early 1900s, Turpin Hills was a rural farming community. The village was home to several small businesses, including a general store, a blacksmith shop, and a post office. In the 1950s, the village began to experience rapid growth as the Cincinnati metropolitan area expanded. The population of Turpin Hills increased from 1,000 in 1950 to 2,845 in 2010.
Geography
Turpin Hills is located in southwestern Hamilton County, Ohio. It is situated at the intersection of Interstate 75 and State Route 4. The village is bordered by the cities of Sharonville and Blue Ash. The total area of Turpin Hills is 1.3 square miles, all of which is land.
The terrain of Turpin Hills is mostly flat, with some rolling hills. The village is located in the Miami Valley, and is part of the Cincinnati metropolitan area. The climate of Turpin Hills is humid continental, with hot summers and cold winters.
Economy
The economy of Turpin Hills is largely based on the service industry. The village is home to several small businesses, including restaurants, retail stores, and professional services. The village is also home to several corporate offices, including the headquarters of the Cincinnati-based company, Procter & Gamble.
The median household income in Turpin Hills is $50,000, and the median home value is $150,000. The unemployment rate in the village is 4.2%, which is lower than the national average.
Demographics
As of the 2010 census, the population of Turpin Hills was 2,845. The racial makeup of the village was 87.3% White, 8.2% African American, 0.7% Asian, and 3.8% from other races. The median age in Turpin Hills is 38.7 years, and the median household income is $50,000.
The village is home to several churches, including the Turpin Hills United Methodist Church and the Turpin Hills Baptist Church. The village is also home to several schools, including Turpin Hills Elementary School and Turpin Hills High School.
Conclusion
Turpin Hills is a small village located in Hamilton County, Ohio. It is situated in the southwestern corner of the county, just north of the city of Cincinnati. The village is bordered by the cities of Sharonville and Blue Ash, and is part of the Cincinnati metropolitan area. The population of Turpin Hills was 2,845 at the 2010 census. The economy of Turpin Hills is largely based on the service industry, and the median household income is $50,000. The village is home to several churches and schools, and is a popular destination for those looking to live in a small, rural community.
Common Questions
What is the Total Population of Turpin Hills?
Total Population of Turpin Hills is 5,831.
What is the Total Male Population of Turpin Hills?
Total Male Population of Turpin Hills is 3,263.
What is the Total Female Population of Turpin Hills?
Total Female Population of Turpin Hills is 2,568.
What is the Ratio of Males per 100 Females in Turpin Hills?
There are 127.06 Males per 100 Females in Turpin Hills.
What is the Ratio of Females per 100 Males in Turpin Hills?
There are 78.70 Females per 100 Males in Turpin Hills.
What is the Median Population Age in Turpin Hills?
Median Population Age in Turpin Hills is 39.2 Years.
What is the Average Family Size in Turpin Hills
Average Family Size in Turpin Hills is 3.4 People.
What is the Average Household Size in Turpin Hills
Average Household Size in Turpin Hills is 3.0 People.
What is Per Capita Income in Turpin Hills?
Per Capita income in Turpin Hills is $65,209.
What is the Median Family Income in Turpin Hills?
Median Family Income in Turpin Hills is $169,583.
What is the Median Household income in Turpin Hills?
Median Household Income in Turpin Hills is $145,817.
What is Income or Wage Gap in Turpin Hills?
Income or Wage Gap in Turpin Hills is 31.9%.
Women in Turpin Hills earn 68.1 cents for every dollar earned by a man.
What is Inequality or Gini Index in Turpin Hills?
Inequality or Gini Index in Turpin Hills is 0.43.
How Large is the Labor Force in Turpin Hills?
There are 3,210 People in the Labor Forcein in Turpin Hills.
What is the Percentage of People in the Labor Force in Turpin Hills?
77.2% of People are in the Labor Force in Turpin Hills.
What is the Unemployment Rate in Turpin Hills?
Unemployment Rate in Turpin Hills is 3.6%.