Rio Grande, OH
Rio Grande Map
Rio Grande Overview
856
TOTAL POPULATION
397
MALE POPULATION
459
FEMALE POPULATION
86.49
MALES / 100 FEMALES
115.62
FEMALES / 100 MALES
21.8
MEDIAN AGE
2.9
AVG FAMILY SIZE
2.6
AVG HOUSEHOLD SIZE
$17,036
PER CAPITA INCOME
$39,583
AVG FAMILY INCOME
$39,286
AVG HOUSEHOLD INCOME
$11,054
FAMILY INCOME DEFICIT
0.51
INEQUALITY / GINI INDEX
336
LABOR FORCE [ PEOPLE ]
48.6%
PERCENT IN LABOR FORCE
6.0%
UNEMPLOYMENT RATE
Rio Grande Zip Codes
Rio Grande Area Codes
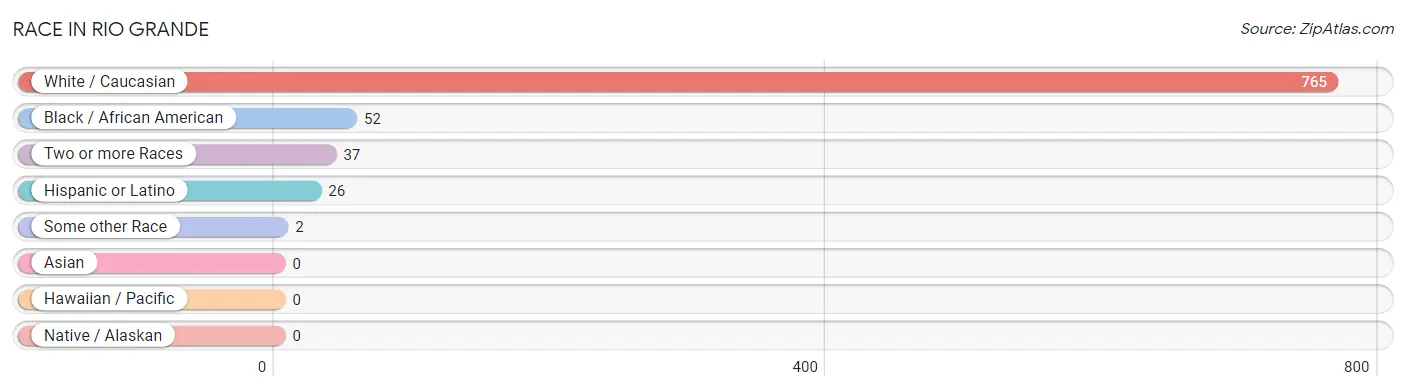
Race in Rio Grande
The most populous races in Rio Grande are White / Caucasian (765 | 89.4%), Black / African American (52 | 6.1%), and Two or more Races (37 | 4.3%).
| Race | # Population | % Population |
| Asian | 0 | 0.0% |
| Black / African American | 52 | 6.1% |
| Hawaiian / Pacific | 0 | 0.0% |
| Hispanic or Latino | 26 | 3.0% |
| Native / Alaskan | 0 | 0.0% |
| White / Caucasian | 765 | 89.4% |
| Two or more Races | 37 | 4.3% |
| Some other Race | 2 | 0.2% |
| Total | 856 | 100.0% |
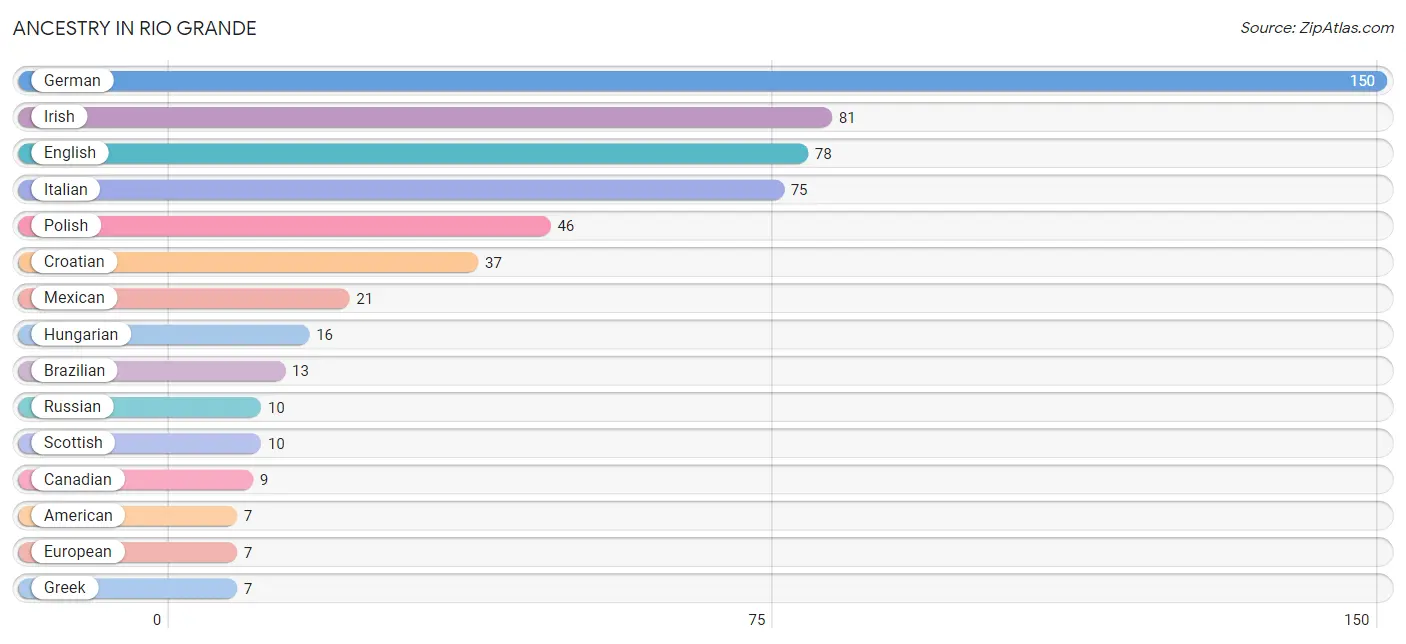
Ancestry in Rio Grande
The most populous ancestries reported in Rio Grande are German (150 | 17.5%), Irish (81 | 9.5%), English (78 | 9.1%), Italian (75 | 8.8%), and Polish (46 | 5.4%), together accounting for 50.2% of all Rio Grande residents.
| Ancestry | # Population | % Population |
| African | 2 | 0.2% |
| American | 7 | 0.8% |
| Arab | 3 | 0.4% |
| Brazilian | 13 | 1.5% |
| Canadian | 9 | 1.1% |
| Chilean | 2 | 0.2% |
| Croatian | 37 | 4.3% |
| Dutch | 6 | 0.7% |
| Ecuadorian | 3 | 0.4% |
| English | 78 | 9.1% |
| European | 7 | 0.8% |
| French | 2 | 0.2% |
| German | 150 | 17.5% |
| Greek | 7 | 0.8% |
| Hungarian | 16 | 1.9% |
| Irish | 81 | 9.5% |
| Italian | 75 | 8.8% |
| Lebanese | 3 | 0.4% |
| Mexican | 21 | 2.5% |
| Polish | 46 | 5.4% |
| Russian | 10 | 1.2% |
| Samoan | 3 | 0.4% |
| Scandinavian | 2 | 0.2% |
| Scotch-Irish | 4 | 0.5% |
| Scottish | 10 | 1.2% |
| Slovak | 4 | 0.5% |
| South American | 5 | 0.6% |
| Subsaharan African | 2 | 0.2% |
| Swiss | 3 | 0.4% |
| Welsh | 2 | 0.2% | View All 30 Rows |
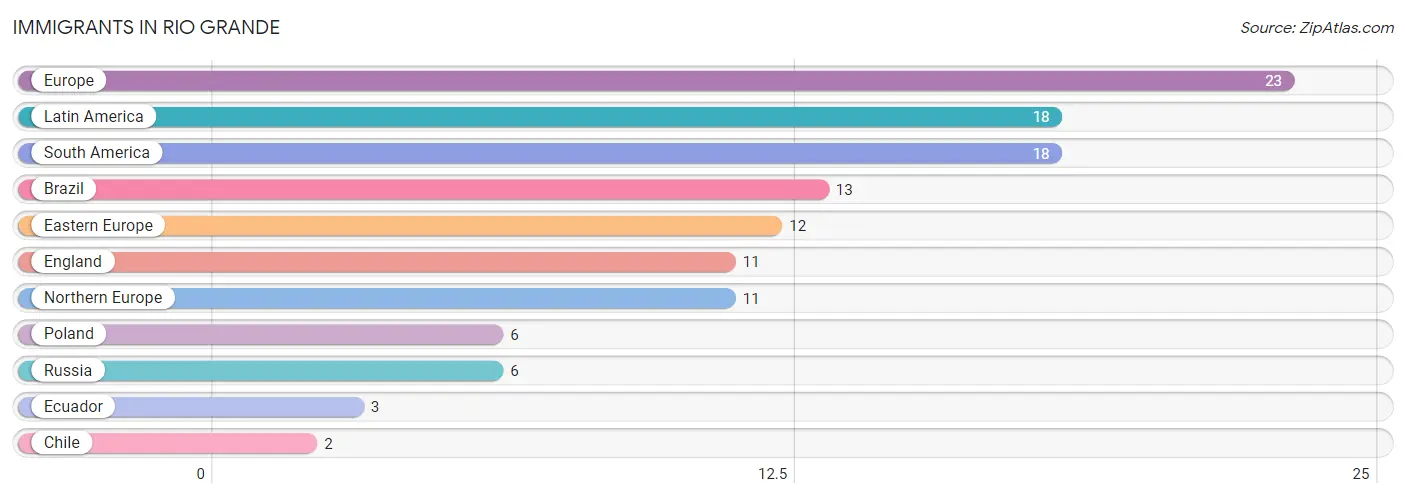
Immigrants in Rio Grande
The most numerous immigrant groups reported in Rio Grande came from Europe (23 | 2.7%), Latin America (18 | 2.1%), South America (18 | 2.1%), Brazil (13 | 1.5%), and Eastern Europe (12 | 1.4%), together accounting for 9.8% of all Rio Grande residents.
| Immigration Origin | # Population | % Population |
| Brazil | 13 | 1.5% |
| Chile | 2 | 0.2% |
| Eastern Europe | 12 | 1.4% |
| Ecuador | 3 | 0.4% |
| England | 11 | 1.3% |
| Europe | 23 | 2.7% |
| Latin America | 18 | 2.1% |
| Northern Europe | 11 | 1.3% |
| Poland | 6 | 0.7% |
| Russia | 6 | 0.7% |
| South America | 18 | 2.1% | View All 11 Rows |
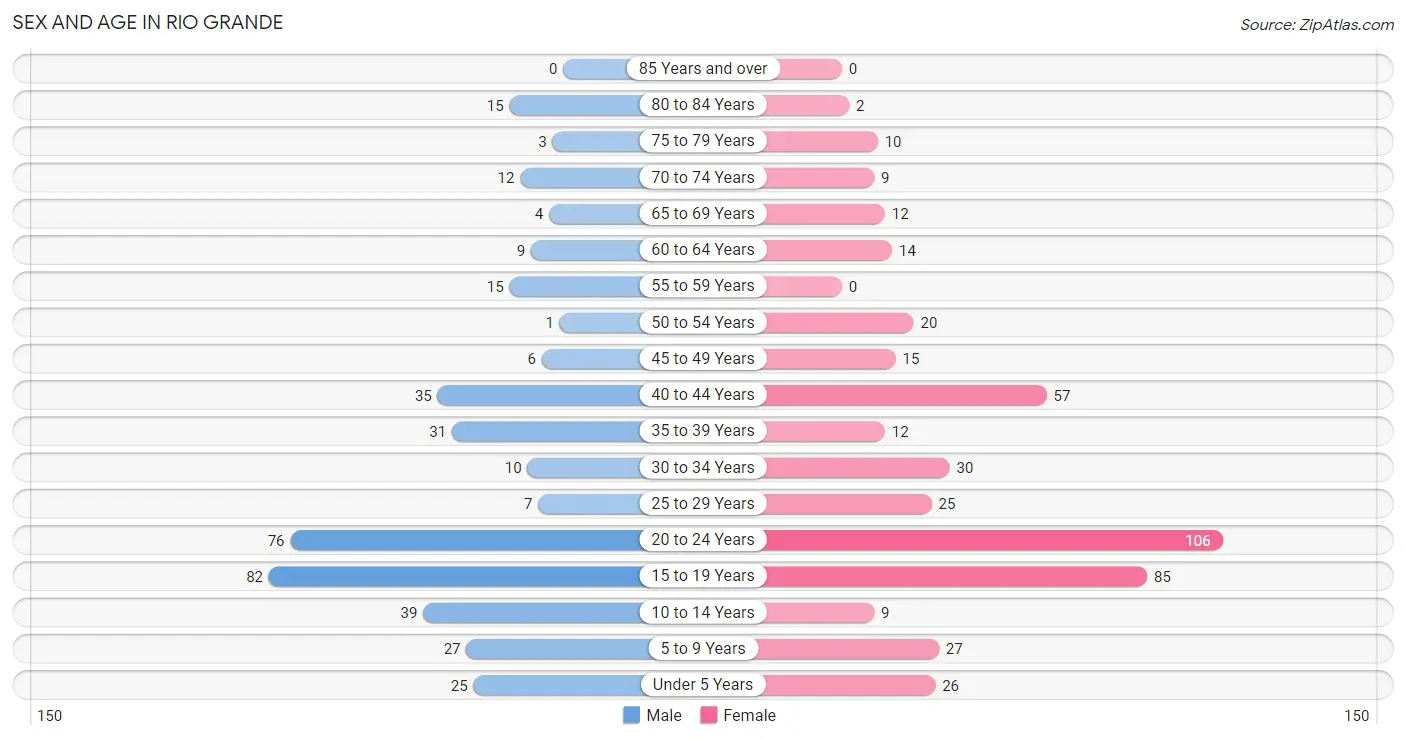
Sex and Age in Rio Grande
Sex and Age in Rio Grande
The most populous age groups in Rio Grande are 15 to 19 Years (82 | 20.6%) for men and 20 to 24 Years (106 | 23.1%) for women.
| Age Bracket | Male | Female |
| Under 5 Years | 25 (6.3%) | 26 (5.7%) |
| 5 to 9 Years | 27 (6.8%) | 27 (5.9%) |
| 10 to 14 Years | 39 (9.8%) | 9 (2.0%) |
| 15 to 19 Years | 82 (20.6%) | 85 (18.5%) |
| 20 to 24 Years | 76 (19.1%) | 106 (23.1%) |
| 25 to 29 Years | 7 (1.8%) | 25 (5.4%) |
| 30 to 34 Years | 10 (2.5%) | 30 (6.5%) |
| 35 to 39 Years | 31 (7.8%) | 12 (2.6%) |
| 40 to 44 Years | 35 (8.8%) | 57 (12.4%) |
| 45 to 49 Years | 6 (1.5%) | 15 (3.3%) |
| 50 to 54 Years | 1 (0.3%) | 20 (4.4%) |
| 55 to 59 Years | 15 (3.8%) | 0 (0.0%) |
| 60 to 64 Years | 9 (2.3%) | 14 (3.0%) |
| 65 to 69 Years | 4 (1.0%) | 12 (2.6%) |
| 70 to 74 Years | 12 (3.0%) | 9 (2.0%) |
| 75 to 79 Years | 3 (0.8%) | 10 (2.2%) |
| 80 to 84 Years | 15 (3.8%) | 2 (0.4%) |
| 85 Years and over | 0 (0.0%) | 0 (0.0%) |
| Total | 397 (100.0%) | 459 (100.0%) |
Families and Households in Rio Grande
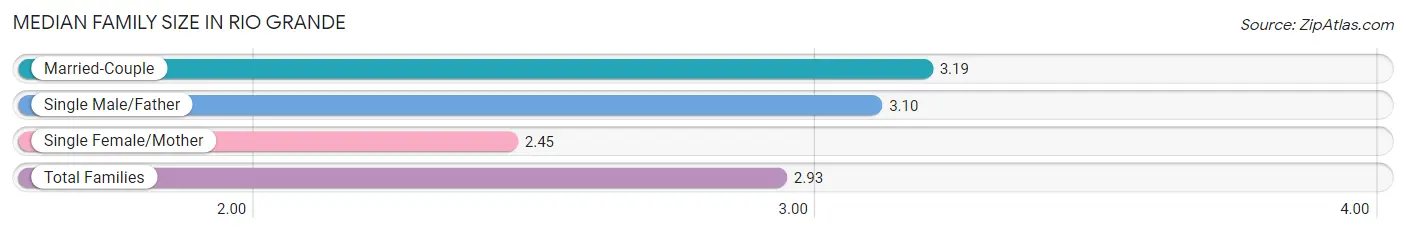
Median Family Size in Rio Grande
The median family size in Rio Grande is 2.93 persons per family, with married-couple families (90 | 58.8%) accounting for the largest median family size of 3.19 persons per family. On the other hand, single female/mother families (53 | 34.6%) represent the smallest median family size with 2.45 persons per family.
| Family Type | # Families | Family Size |
| Married-Couple | 90 (58.8%) | 3.19 |
| Single Male/Father | 10 (6.5%) | 3.10 |
| Single Female/Mother | 53 (34.6%) | 2.45 |
| Total Families | 153 (100.0%) | 2.93 |
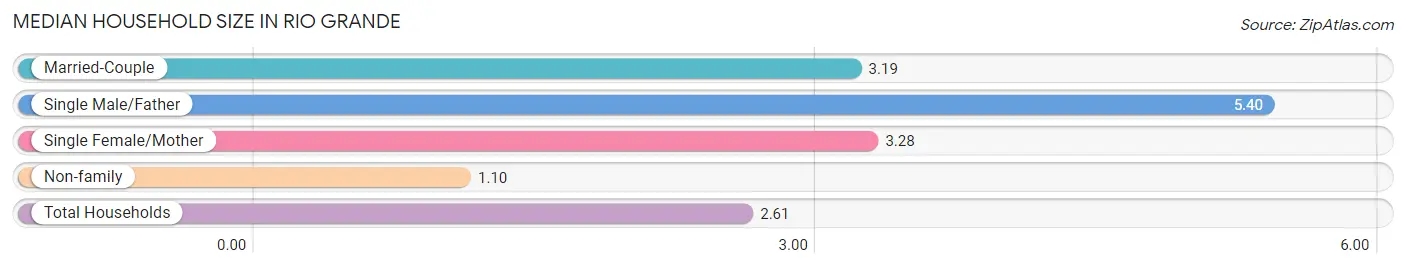
Median Household Size in Rio Grande
The median household size in Rio Grande is 2.61 persons per household, with single male/father households (10 | 4.3%) accounting for the largest median household size of 5.4 persons per household. non-family households (77 | 33.5%) represent the smallest median household size with 1.10 persons per household.
| Household Type | # Households | Household Size |
| Married-Couple | 90 (39.1%) | 3.19 |
| Single Male/Father | 10 (4.3%) | 5.40 |
| Single Female/Mother | 53 (23.0%) | 3.28 |
| Non-family | 77 (33.5%) | 1.10 |
| Total Households | 230 (100.0%) | 2.61 |
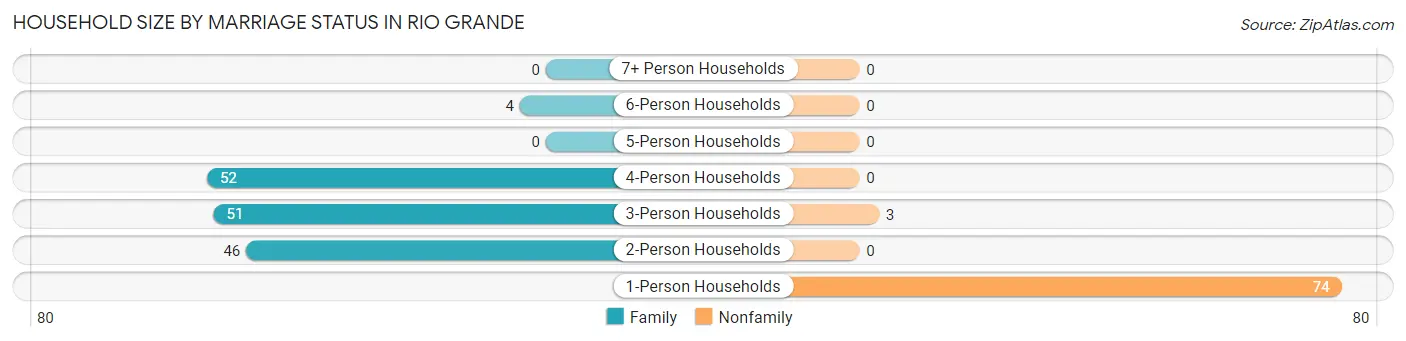
Household Size by Marriage Status in Rio Grande
Out of a total of 230 households in Rio Grande, 153 (66.5%) are family households, while 77 (33.5%) are nonfamily households. The most numerous type of family households are 4-person households, comprising 52, and the most common type of nonfamily households are 1-person households, comprising 74.
| Household Size | Family Households | Nonfamily Households |
| 1-Person Households | - | 74 (32.2%) |
| 2-Person Households | 46 (20.0%) | 0 (0.0%) |
| 3-Person Households | 51 (22.2%) | 3 (1.3%) |
| 4-Person Households | 52 (22.6%) | 0 (0.0%) |
| 5-Person Households | 0 (0.0%) | 0 (0.0%) |
| 6-Person Households | 4 (1.7%) | 0 (0.0%) |
| 7+ Person Households | 0 (0.0%) | 0 (0.0%) |
| Total | 153 (66.5%) | 77 (33.5%) |
Female Fertility in Rio Grande
Fertility by Age in Rio Grande
Average fertility rate in Rio Grande is 18.0 births per 1,000 women. Women in the age bracket of 20 to 34 years have the highest fertility rate with 37.0 births per 1,000 women. Women in the age bracket of 20 to 34 years acount for 100.0% of all women with births.
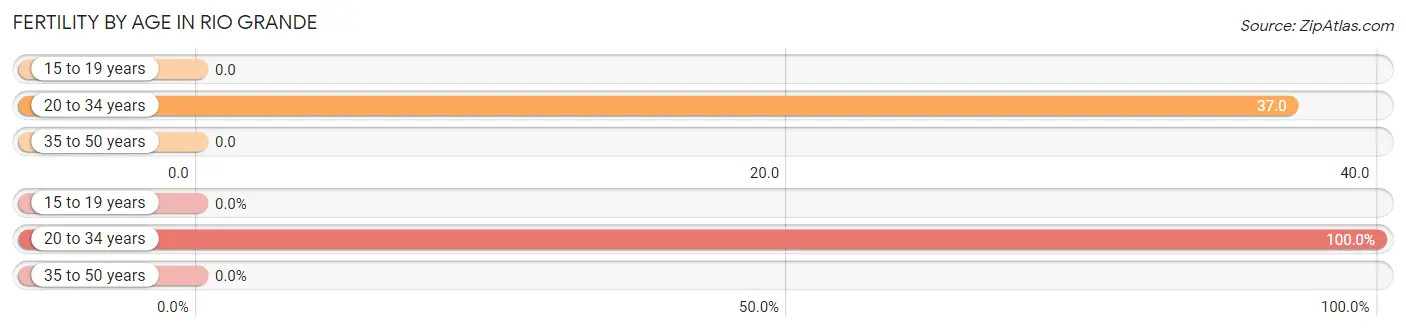
| Age Bracket | Women with Births | Births / 1,000 Women |
| 15 to 19 years | 0 (0.0%) | 0.0 |
| 20 to 34 years | 6 (100.0%) | 37.0 |
| 35 to 50 years | 0 (0.0%) | 0.0 |
| Total | 6 (100.0%) | 18.0 |
Fertility by Age by Marriage Status in Rio Grande
66.7% of women with births (6) in Rio Grande are married. The highest percentage of unmarried women with births falls into 20 to 34 years age bracket with 33.3% of them unmarried at the time of birth, while the lowest percentage of unmarried women with births belong to 20 to 34 years age bracket with 33.3% of them unmarried.
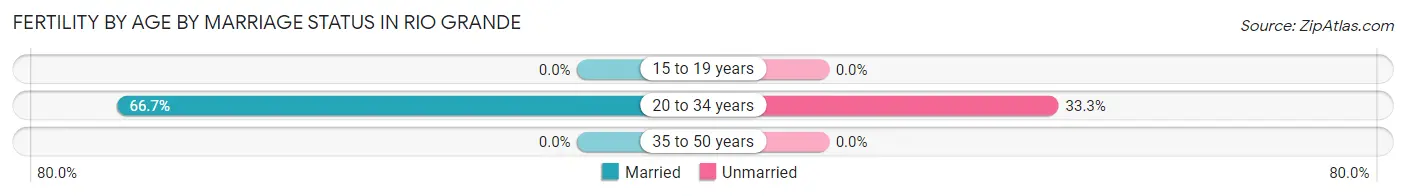
| Age Bracket | Married | Unmarried |
| 15 to 19 years | 0 (0.0%) | 0 (0.0%) |
| 20 to 34 years | 4 (66.7%) | 2 (33.3%) |
| 35 to 50 years | 0 (0.0%) | 0 (0.0%) |
| Total | 4 (66.7%) | 2 (33.3%) |
Fertility by Education in Rio Grande
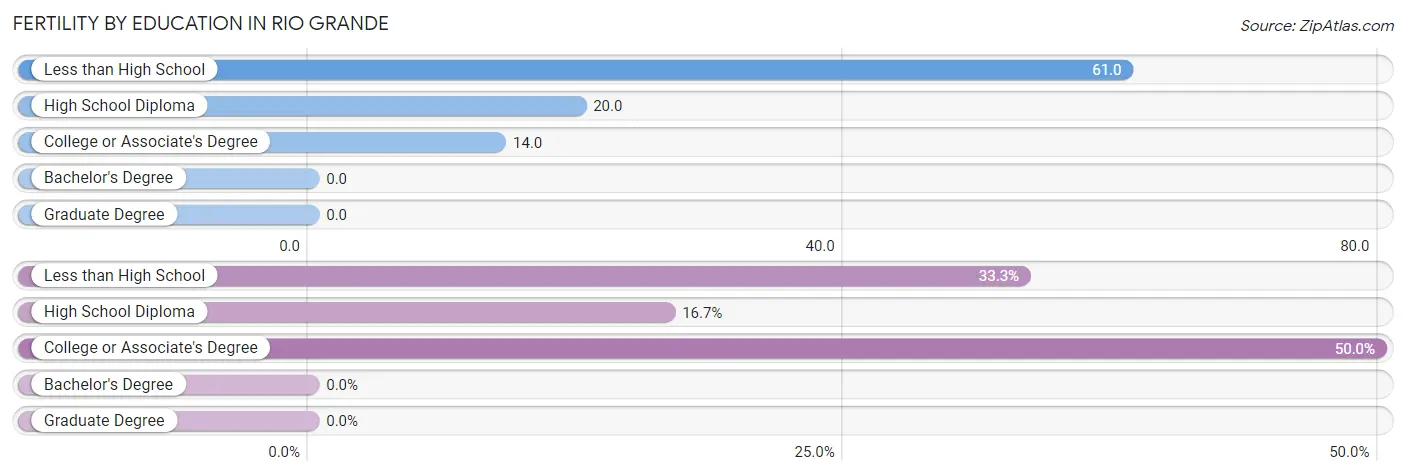
| Educational Attainment | Women with Births | Births / 1,000 Women |
| Less than High School | 2 (33.3%) | 61.0 |
| High School Diploma | 1 (16.7%) | 20.0 |
| College or Associate's Degree | 3 (50.0%) | 14.0 |
| Bachelor's Degree | 0 (0.0%) | 0.0 |
| Graduate Degree | 0 (0.0%) | 0.0 |
| Total | 6 (100.0%) | 18.0 |
Fertility by Education by Marriage Status in Rio Grande
33.3% of women with births in Rio Grande are unmarried. Women with the educational attainment of high school diploma are most likely to be married with 100.0% of them married at childbirth, while women with the educational attainment of less than high school are least likely to be married with 100.0% of them unmarried at childbirth.
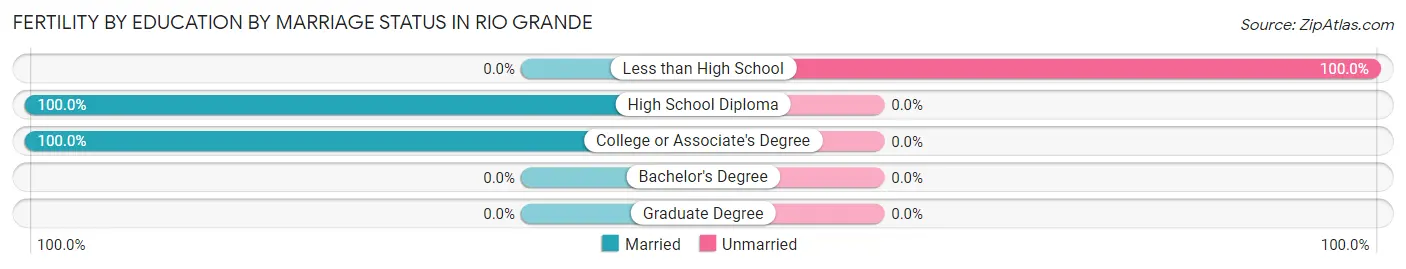
| Educational Attainment | Married | Unmarried |
| Less than High School | 0 (0.0%) | 2 (100.0%) |
| High School Diploma | 1 (100.0%) | 0 (0.0%) |
| College or Associate's Degree | 3 (100.0%) | 0 (0.0%) |
| Bachelor's Degree | 0 (0.0%) | 0 (0.0%) |
| Graduate Degree | 0 (0.0%) | 0 (0.0%) |
| Total | 4 (66.7%) | 2 (33.3%) |
Income in Rio Grande
Income Overview in Rio Grande
Per Capita Income in Rio Grande is $17,036, while median incomes of families and households are $39,583 and $39,286 respectively.
| Characteristic | Number | Measure |
| Per Capita Income | 856 | $17,036 |
| Median Family Income | 153 | $39,583 |
| Mean Family Income | 153 | $66,375 |
| Median Household Income | 230 | $39,286 |
| Mean Household Income | 230 | $56,565 |
| Income Deficit | 153 | $11,054 |
| Wage / Income Gap (%) | 856 | 0.00% |
| Wage / Income Gap ($) | 856 | 100.00¢ per $1 |
| Gini / Inequality Index | 856 | 0.51 |
Earnings by Sex in Rio Grande
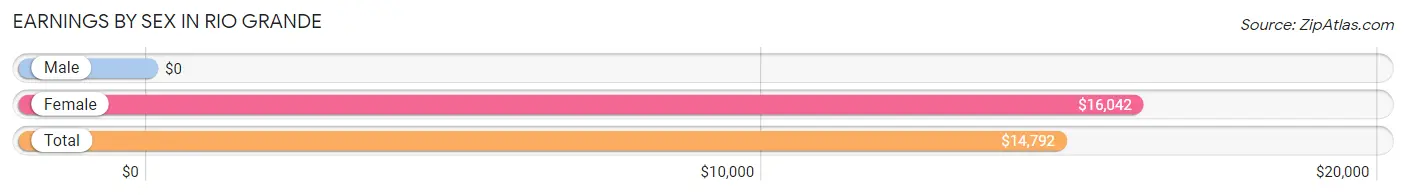
| Sex | Number | Average Earnings |
| Male | 191 (46.0%) | $0 |
| Female | 224 (54.0%) | $16,042 |
| Total | 415 (100.0%) | $14,792 |
Earnings by Sex by Income Bracket in Rio Grande
The most common earnings brackets in Rio Grande are $2,499 or less for men (40 | 20.9%) and $10,000 to $12,499 for women (27 | 12.0%).
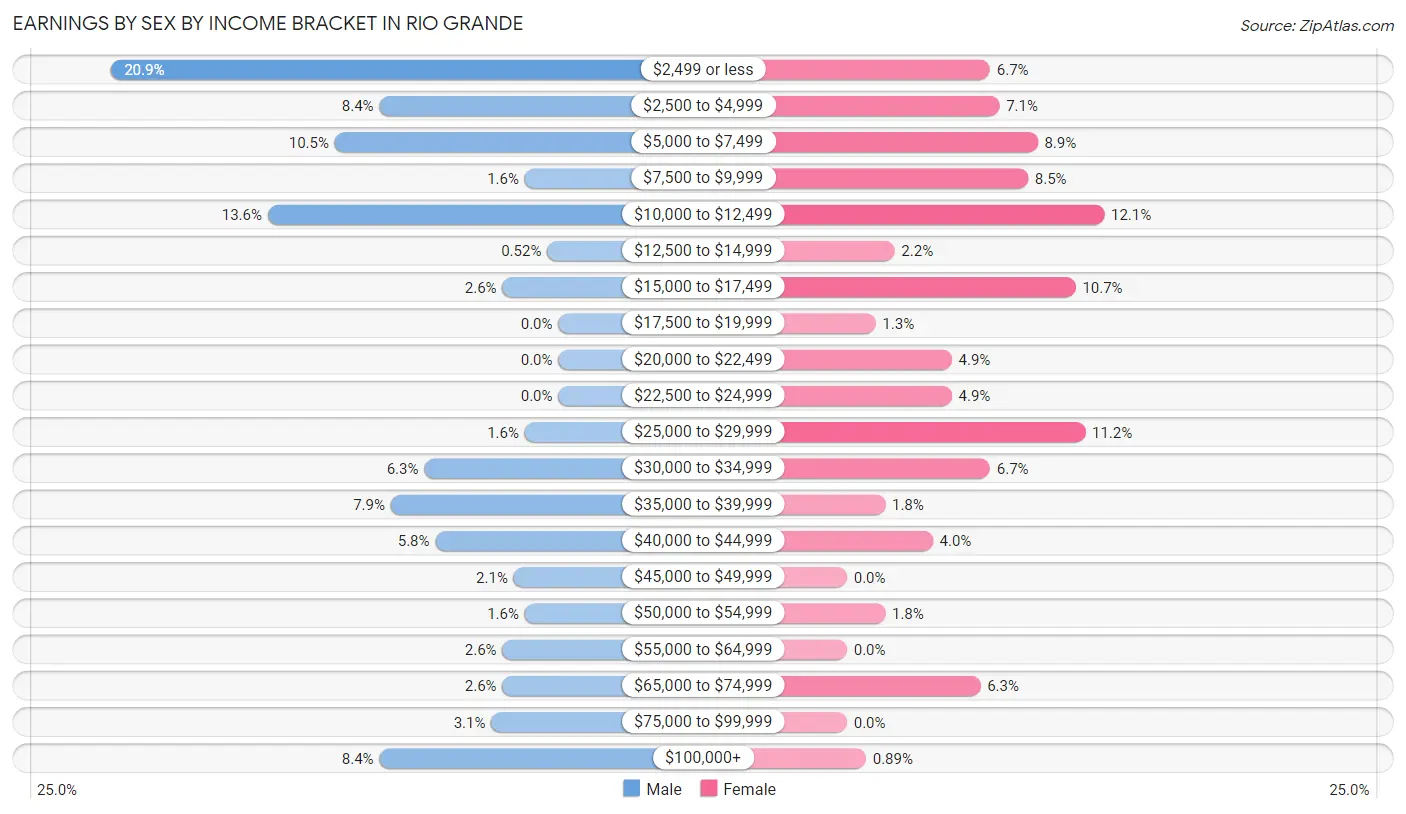
| Income | Male | Female |
| $2,499 or less | 40 (20.9%) | 15 (6.7%) |
| $2,500 to $4,999 | 16 (8.4%) | 16 (7.1%) |
| $5,000 to $7,499 | 20 (10.5%) | 20 (8.9%) |
| $7,500 to $9,999 | 3 (1.6%) | 19 (8.5%) |
| $10,000 to $12,499 | 26 (13.6%) | 27 (12.0%) |
| $12,500 to $14,999 | 1 (0.5%) | 5 (2.2%) |
| $15,000 to $17,499 | 5 (2.6%) | 24 (10.7%) |
| $17,500 to $19,999 | 0 (0.0%) | 3 (1.3%) |
| $20,000 to $22,499 | 0 (0.0%) | 11 (4.9%) |
| $22,500 to $24,999 | 0 (0.0%) | 11 (4.9%) |
| $25,000 to $29,999 | 3 (1.6%) | 25 (11.2%) |
| $30,000 to $34,999 | 12 (6.3%) | 15 (6.7%) |
| $35,000 to $39,999 | 15 (7.9%) | 4 (1.8%) |
| $40,000 to $44,999 | 11 (5.8%) | 9 (4.0%) |
| $45,000 to $49,999 | 4 (2.1%) | 0 (0.0%) |
| $50,000 to $54,999 | 3 (1.6%) | 4 (1.8%) |
| $55,000 to $64,999 | 5 (2.6%) | 0 (0.0%) |
| $65,000 to $74,999 | 5 (2.6%) | 14 (6.2%) |
| $75,000 to $99,999 | 6 (3.1%) | 0 (0.0%) |
| $100,000+ | 16 (8.4%) | 2 (0.9%) |
| Total | 191 (100.0%) | 224 (100.0%) |
Earnings by Sex by Educational Attainment in Rio Grande
Average earnings in Rio Grande are $41,406 for men and $28,750 for women, a difference of 30.6%. Men with an educational attainment of college or associate's degree enjoy the highest average annual earnings of $48,750, while those with high school diploma education earn the least with $33,438. Women with an educational attainment of college or associate's degree earn the most with the average annual earnings of $30,521, while those with high school diploma education have the smallest earnings of $16,538.
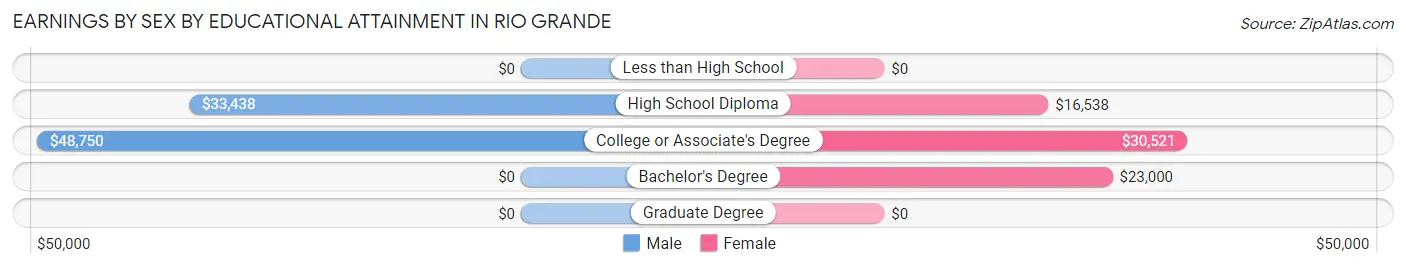
| Educational Attainment | Male Income | Female Income |
| Less than High School | - | - |
| High School Diploma | $33,438 | $16,538 |
| College or Associate's Degree | $48,750 | $30,521 |
| Bachelor's Degree | - | - |
| Graduate Degree | - | - |
| Total | $41,406 | $28,750 |
Family Income in Rio Grande
Family Income Brackets in Rio Grande
According to the Rio Grande family income data, there are 29 families falling into the $15,000 to $24,999 income range, which is the most common income bracket and makes up 19.0% of all families.
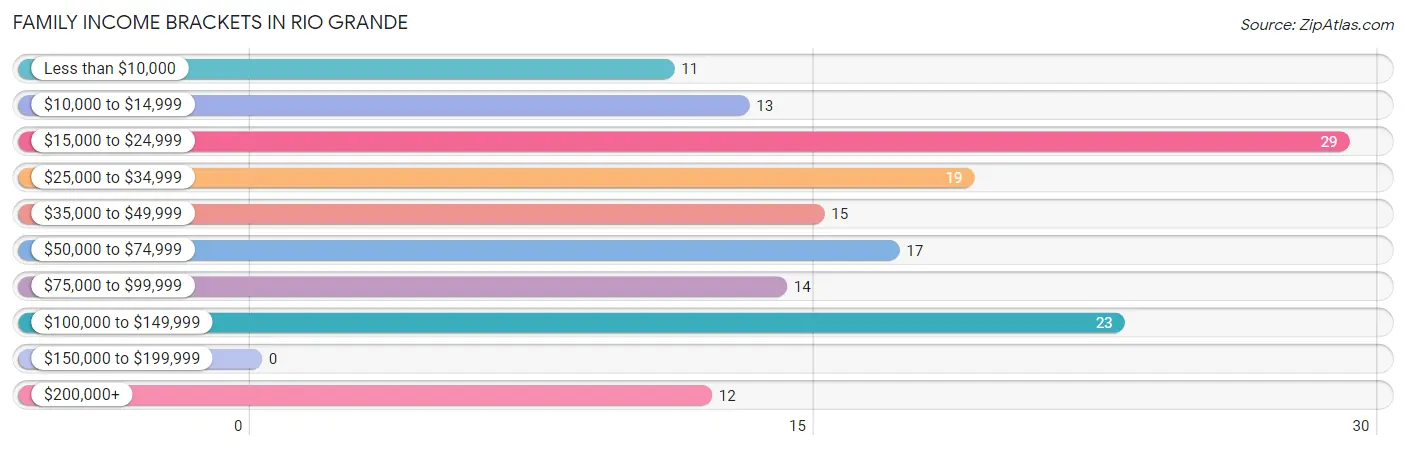
| Income Bracket | # Families | % Families |
| Less than $10,000 | 11 | 7.2% |
| $10,000 to $14,999 | 13 | 8.5% |
| $15,000 to $24,999 | 29 | 19.0% |
| $25,000 to $34,999 | 19 | 12.4% |
| $35,000 to $49,999 | 15 | 9.8% |
| $50,000 to $74,999 | 17 | 11.1% |
| $75,000 to $99,999 | 14 | 9.2% |
| $100,000 to $149,999 | 23 | 15.0% |
| $150,000 to $199,999 | 0 | 0.0% |
| $200,000+ | 12 | 7.8% |
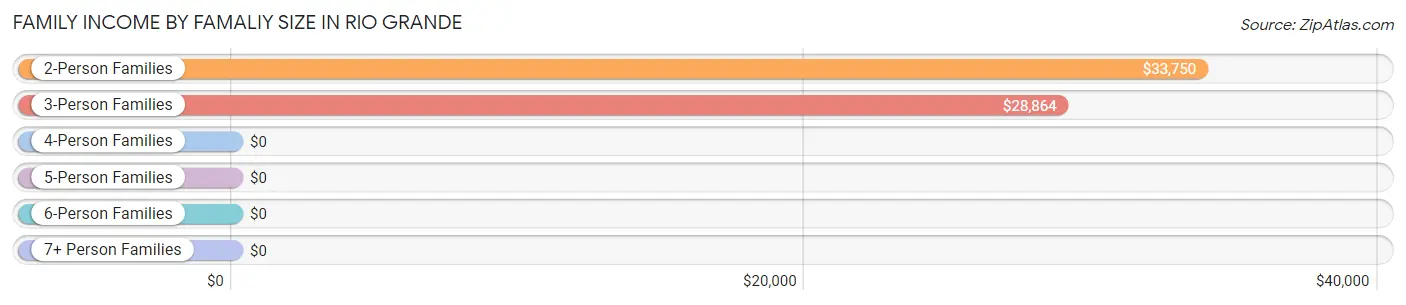
Family Income by Famaliy Size in Rio Grande
2-person families (62 | 40.5%) account for the highest median family income in Rio Grande with $33,750 per family, while 2-person families (62 | 40.5%) have the highest median income of $16,875 per family member.
| Income Bracket | # Families | Median Income |
| 2-Person Families | 62 (40.5%) | $33,750 |
| 3-Person Families | 60 (39.2%) | $28,864 |
| 4-Person Families | 27 (17.6%) | $0 |
| 5-Person Families | 2 (1.3%) | $0 |
| 6-Person Families | 2 (1.3%) | $0 |
| 7+ Person Families | 0 (0.0%) | $0 |
| Total | 153 (100.0%) | $39,583 |
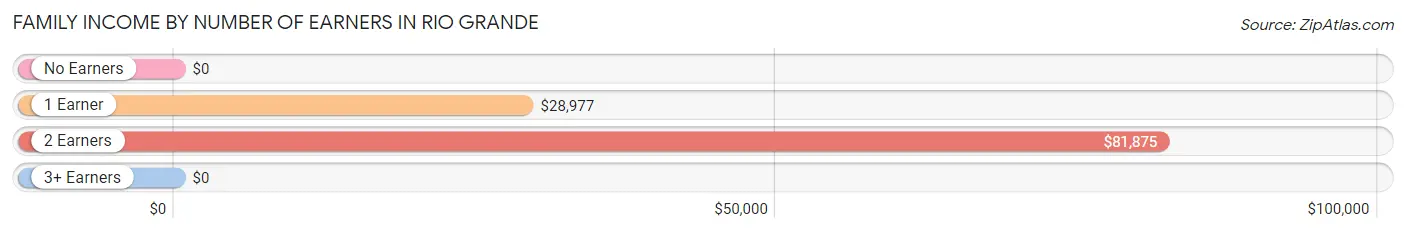
Family Income by Number of Earners in Rio Grande
| Number of Earners | # Families | Median Income |
| No Earners | 38 (24.8%) | $0 |
| 1 Earner | 55 (35.9%) | $28,977 |
| 2 Earners | 60 (39.2%) | $81,875 |
| 3+ Earners | 0 (0.0%) | $0 |
| Total | 153 (100.0%) | $39,583 |
Household Income in Rio Grande
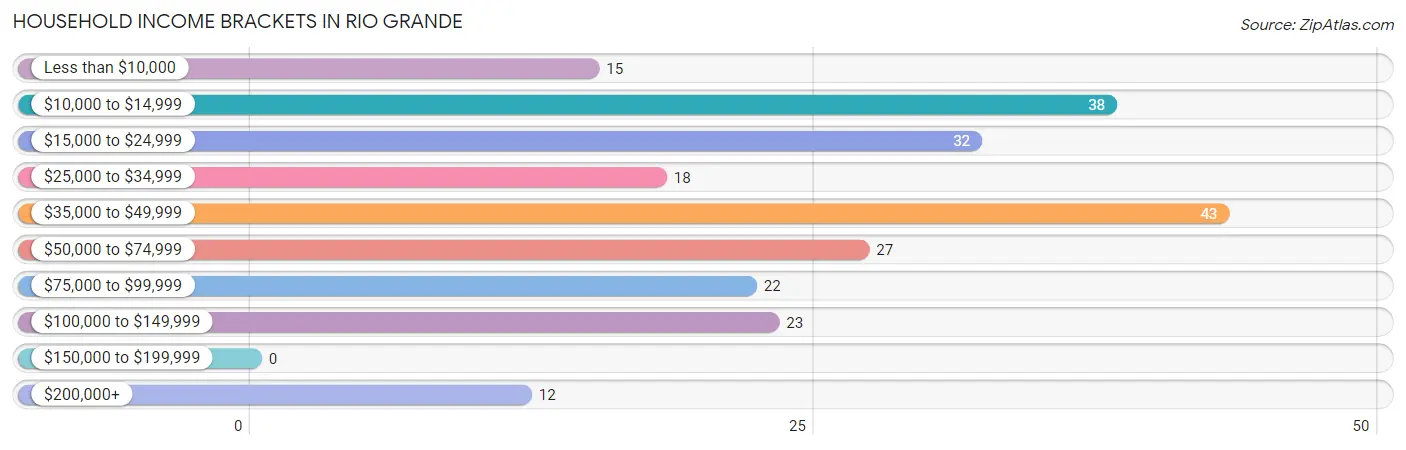
Household Income Brackets in Rio Grande
With 43 households falling in the category, the $35,000 to $49,999 income range is the most frequent in Rio Grande, accounting for 18.7% of all households.
| Income Bracket | # Households | % Households |
| Less than $10,000 | 15 | 6.5% |
| $10,000 to $14,999 | 38 | 16.5% |
| $15,000 to $24,999 | 32 | 13.9% |
| $25,000 to $34,999 | 18 | 7.8% |
| $35,000 to $49,999 | 43 | 18.7% |
| $50,000 to $74,999 | 27 | 11.7% |
| $75,000 to $99,999 | 22 | 9.6% |
| $100,000 to $149,999 | 23 | 10.0% |
| $150,000 to $199,999 | 0 | 0.0% |
| $200,000+ | 12 | 5.2% |
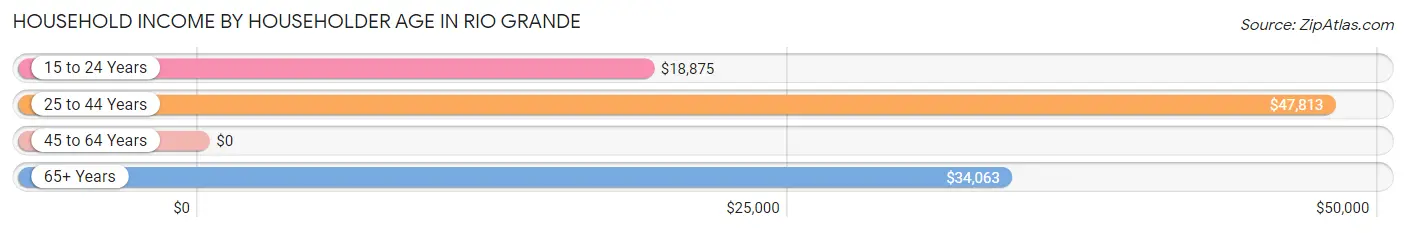
Household Income by Householder Age in Rio Grande
The median household income in Rio Grande is $39,286, with the highest median household income of $47,813 found in the 25 to 44 years age bracket for the primary householder. A total of 102 households (44.4%) fall into this category. Meanwhile, the 45 to 64 years age bracket for the primary householder has the lowest median household income of $0, with 62 households (27.0%) in this group.
| Income Bracket | # Households | Median Income |
| 15 to 24 Years | 19 (8.3%) | $18,875 |
| 25 to 44 Years | 102 (44.4%) | $47,813 |
| 45 to 64 Years | 62 (27.0%) | $0 |
| 65+ Years | 47 (20.4%) | $34,063 |
| Total | 230 (100.0%) | $39,286 |
Poverty in Rio Grande
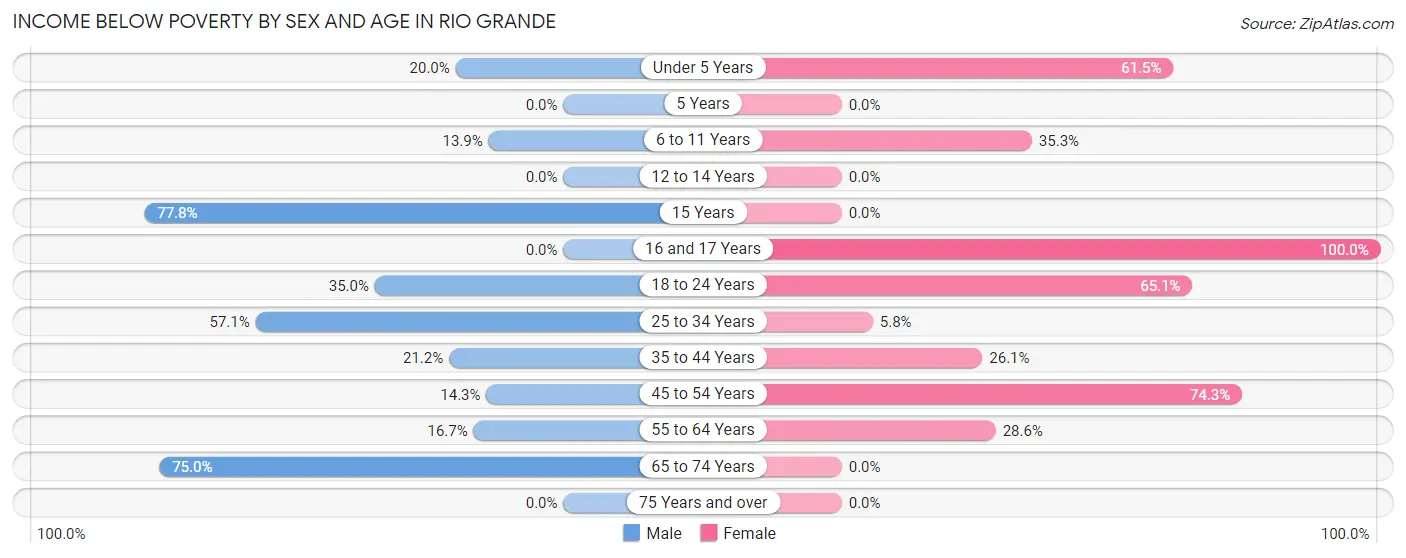
Income Below Poverty by Sex and Age in Rio Grande
With 24.7% poverty level for males and 35.2% for females among the residents of Rio Grande, 15 year old males and 16 and 17 year old females are the most vulnerable to poverty, with 7 males (77.8%) and 4 females (100.0%) in their respective age groups living below the poverty level.
| Age Bracket | Male | Female |
| Under 5 Years | 5 (20.0%) | 16 (61.5%) |
| 5 Years | 0 (0.0%) | 0 (0.0%) |
| 6 to 11 Years | 5 (13.9%) | 6 (35.3%) |
| 12 to 14 Years | 0 (0.0%) | 0 (0.0%) |
| 15 Years | 7 (77.8%) | 0 (0.0%) |
| 16 and 17 Years | 0 (0.0%) | 4 (100.0%) |
| 18 to 24 Years | 7 (35.0%) | 41 (65.1%) |
| 25 to 34 Years | 8 (57.1%) | 3 (5.8%) |
| 35 to 44 Years | 14 (21.2%) | 18 (26.1%) |
| 45 to 54 Years | 1 (14.3%) | 26 (74.3%) |
| 55 to 64 Years | 4 (16.7%) | 4 (28.6%) |
| 65 to 74 Years | 12 (75.0%) | 0 (0.0%) |
| 75 Years and over | 0 (0.0%) | 0 (0.0%) |
| Total | 63 (24.7%) | 118 (35.2%) |
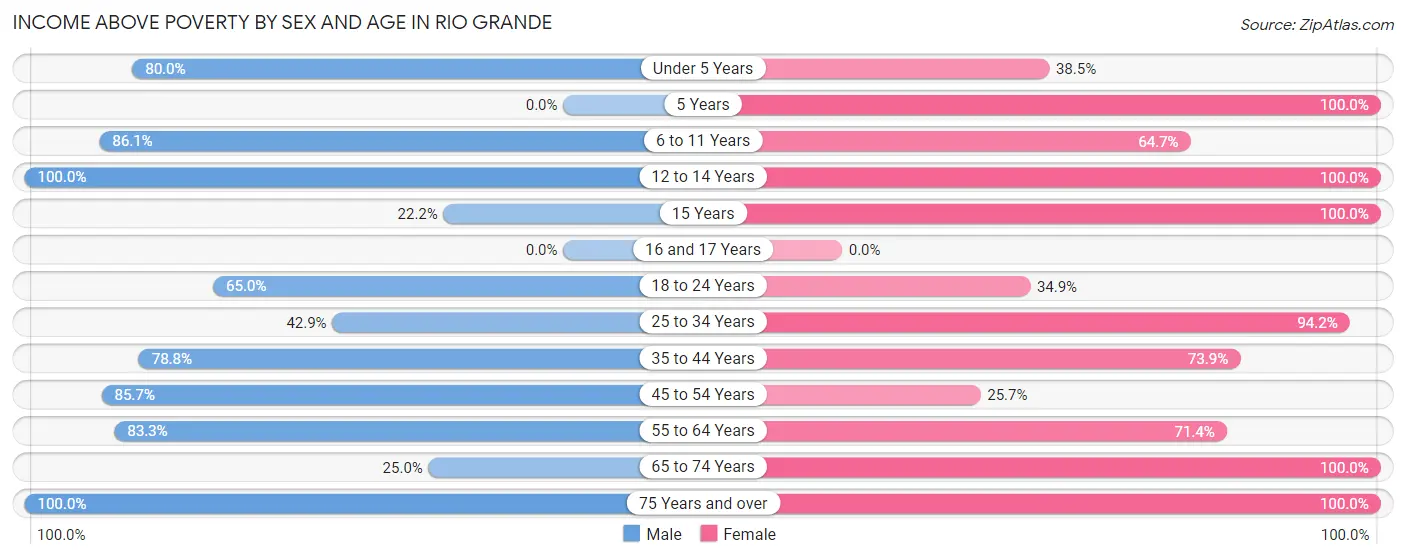
Income Above Poverty by Sex and Age in Rio Grande
According to the poverty statistics in Rio Grande, males aged 12 to 14 years and females aged 5 years are the age groups that are most secure financially, with 100.0% of males and 100.0% of females in these age groups living above the poverty line.
| Age Bracket | Male | Female |
| Under 5 Years | 20 (80.0%) | 10 (38.5%) |
| 5 Years | 0 (0.0%) | 18 (100.0%) |
| 6 to 11 Years | 31 (86.1%) | 11 (64.7%) |
| 12 to 14 Years | 20 (100.0%) | 1 (100.0%) |
| 15 Years | 2 (22.2%) | 3 (100.0%) |
| 16 and 17 Years | 0 (0.0%) | 0 (0.0%) |
| 18 to 24 Years | 13 (65.0%) | 22 (34.9%) |
| 25 to 34 Years | 6 (42.9%) | 49 (94.2%) |
| 35 to 44 Years | 52 (78.8%) | 51 (73.9%) |
| 45 to 54 Years | 6 (85.7%) | 9 (25.7%) |
| 55 to 64 Years | 20 (83.3%) | 10 (71.4%) |
| 65 to 74 Years | 4 (25.0%) | 21 (100.0%) |
| 75 Years and over | 18 (100.0%) | 12 (100.0%) |
| Total | 192 (75.3%) | 217 (64.8%) |
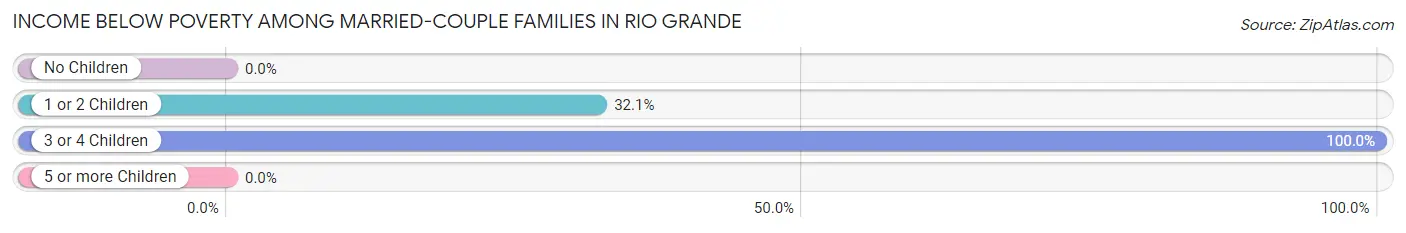
Income Below Poverty Among Married-Couple Families in Rio Grande
The poverty statistics for married-couple families in Rio Grande show that 22.2% or 20 of the total 90 families live below the poverty line. Families with 3 or 4 children have the highest poverty rate of 100.0%, comprising of 2 families. On the other hand, families with no children have the lowest poverty rate of 0.0%, which includes 0 families.
| Children | Above Poverty | Below Poverty |
| No Children | 32 (100.0%) | 0 (0.0%) |
| 1 or 2 Children | 38 (67.9%) | 18 (32.1%) |
| 3 or 4 Children | 0 (0.0%) | 2 (100.0%) |
| 5 or more Children | 0 (0.0%) | 0 (0.0%) |
| Total | 70 (77.8%) | 20 (22.2%) |
Income Below Poverty Among Single-Parent Households in Rio Grande
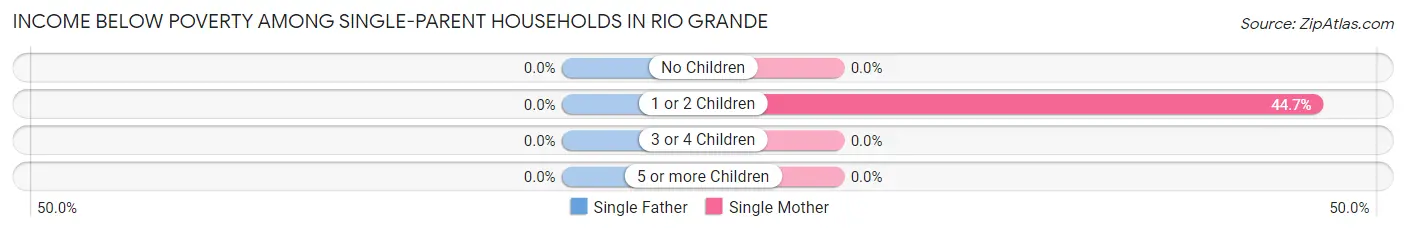
| Children | Single Father | Single Mother |
| No Children | 0 (0.0%) | 0 (0.0%) |
| 1 or 2 Children | 0 (0.0%) | 21 (44.7%) |
| 3 or 4 Children | 0 (0.0%) | 0 (0.0%) |
| 5 or more Children | 0 (0.0%) | 0 (0.0%) |
| Total | 0 (0.0%) | 21 (39.6%) |
Income Below Poverty Among Married-Couple vs Single-Parent Households in Rio Grande
The poverty data for Rio Grande shows that 20 of the married-couple family households (22.2%) and 21 of the single-parent households (33.3%) are living below the poverty level. Within the married-couple family households, those with 3 or 4 children have the highest poverty rate, with 2 households (100.0%) falling below the poverty line. Among the single-parent households, those with 1 or 2 children have the highest poverty rate, with 21 household (36.8%) living below poverty.
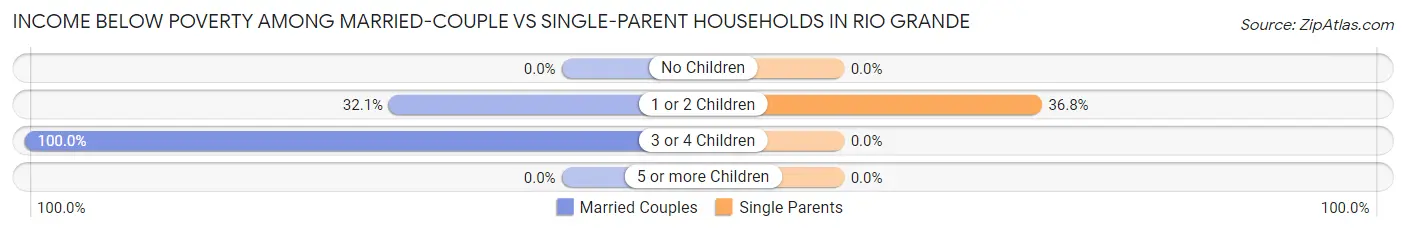
| Children | Married-Couple Families | Single-Parent Households |
| No Children | 0 (0.0%) | 0 (0.0%) |
| 1 or 2 Children | 18 (32.1%) | 21 (36.8%) |
| 3 or 4 Children | 2 (100.0%) | 0 (0.0%) |
| 5 or more Children | 0 (0.0%) | 0 (0.0%) |
| Total | 20 (22.2%) | 21 (33.3%) |
Employment Characteristics in Rio Grande
Employment by Class of Employer in Rio Grande
Among the 300 employed individuals in Rio Grande, private company employees (215 | 71.7%), not-for-profit organizations (25 | 8.3%), and state government employees (24 | 8.0%) make up the most common classes of employment.
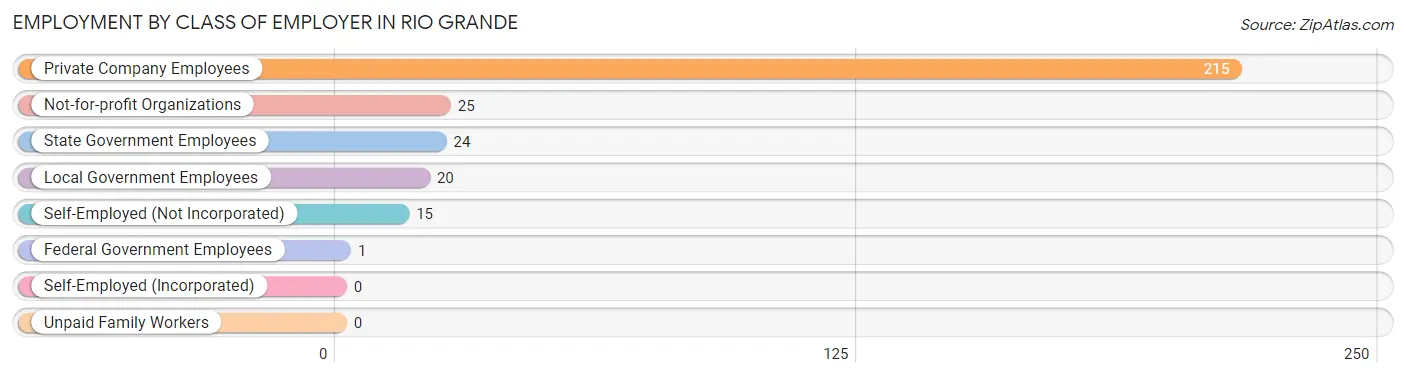
| Employer Class | # Employees | % Employees |
| Private Company Employees | 215 | 71.7% |
| Self-Employed (Incorporated) | 0 | 0.0% |
| Self-Employed (Not Incorporated) | 15 | 5.0% |
| Not-for-profit Organizations | 25 | 8.3% |
| Local Government Employees | 20 | 6.7% |
| State Government Employees | 24 | 8.0% |
| Federal Government Employees | 1 | 0.3% |
| Unpaid Family Workers | 0 | 0.0% |
| Total | 300 | 100.0% |
Employment Status by Age in Rio Grande
According to the labor force statistics for Rio Grande, out of the total population over 16 years of age (691), 48.6% or 336 individuals are in the labor force, with 6.0% or 20 of them unemployed. The age group with the highest labor force participation rate is 35 to 44 years, with 80.7% or 109 individuals in the labor force. Within the labor force, the 45 to 54 years age range has the highest percentage of unemployed individuals, with 22.2% or 4 of them being unemployed.
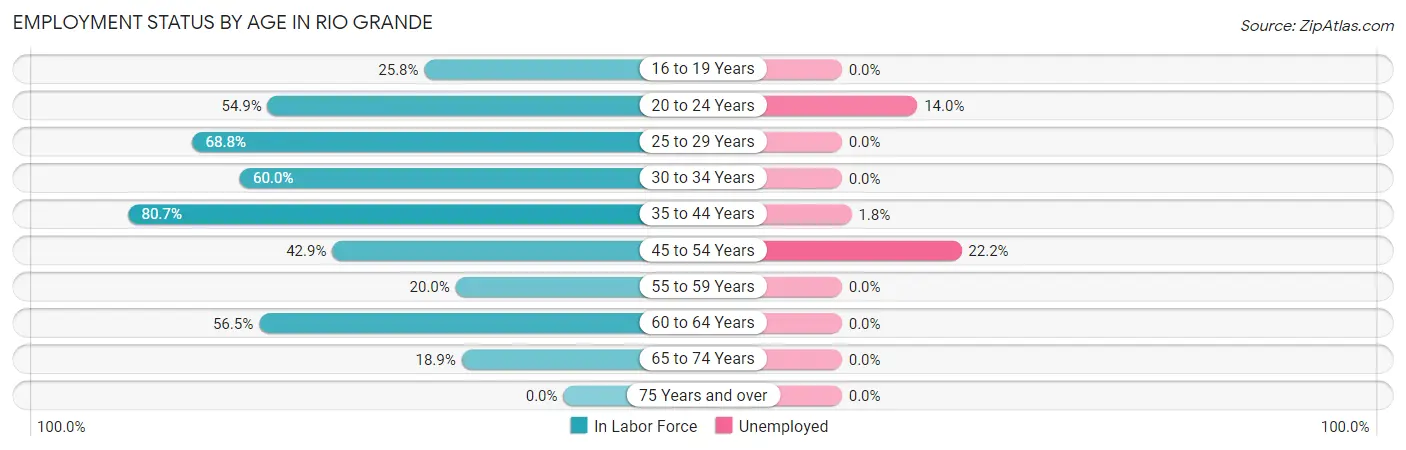
| Age Bracket | In Labor Force | Unemployed |
| 16 to 19 Years | 40 (25.8%) | 0 (0.0%) |
| 20 to 24 Years | 100 (54.9%) | 14 (14.0%) |
| 25 to 29 Years | 22 (68.8%) | 0 (0.0%) |
| 30 to 34 Years | 24 (60.0%) | 0 (0.0%) |
| 35 to 44 Years | 109 (80.7%) | 2 (1.8%) |
| 45 to 54 Years | 18 (42.9%) | 4 (22.2%) |
| 55 to 59 Years | 3 (20.0%) | 0 (0.0%) |
| 60 to 64 Years | 13 (56.5%) | 0 (0.0%) |
| 65 to 74 Years | 7 (18.9%) | 0 (0.0%) |
| 75 Years and over | 0 (0.0%) | 0 (0.0%) |
| Total | 336 (48.6%) | 20 (6.0%) |
Employment Status by Educational Attainment in Rio Grande
According to labor force statistics for Rio Grande, 65.9% of individuals (189) out of the total population between 25 and 64 years of age (287) are in the labor force, with 3.2% or 6 of them being unemployed. The group with the highest labor force participation rate are those with the educational attainment of college / associate degree, with 88.8% or 87 individuals in the labor force. Within the labor force, individuals with college / associate degree education have the highest percentage of unemployment, with 5.7% or 5 of them being unemployed.
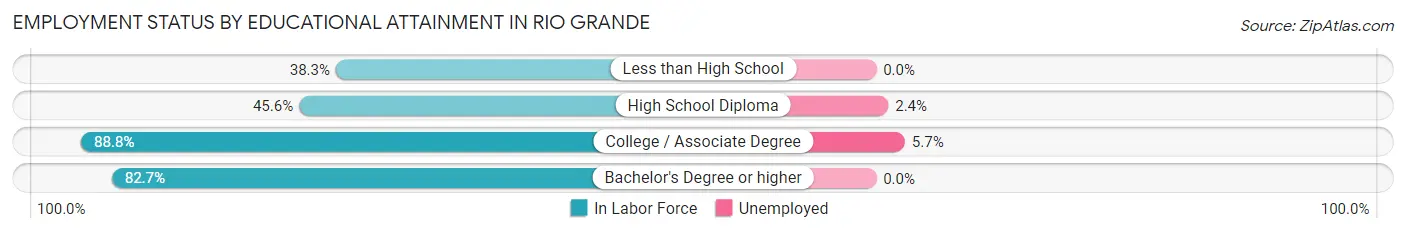
| Educational Attainment | In Labor Force | Unemployed |
| Less than High School | 18 (38.3%) | 0 (0.0%) |
| High School Diploma | 41 (45.6%) | 2 (2.4%) |
| College / Associate Degree | 87 (88.8%) | 6 (5.7%) |
| Bachelor's Degree or higher | 43 (82.7%) | 0 (0.0%) |
| Total | 189 (65.9%) | 9 (3.2%) |
Employment Occupations by Sex in Rio Grande
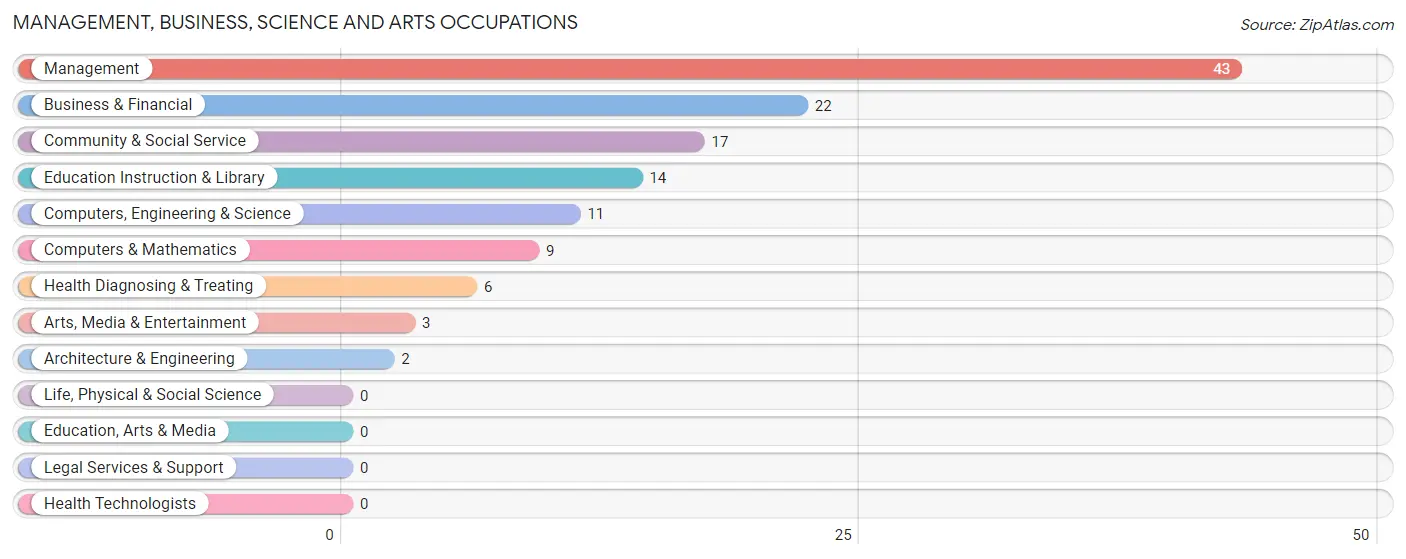
Management, Business, Science and Arts Occupations
The most common Management, Business, Science and Arts occupations in Rio Grande are Management (43 | 13.6%), Business & Financial (22 | 7.0%), Community & Social Service (17 | 5.4%), Education Instruction & Library (14 | 4.4%), and Computers, Engineering & Science (11 | 3.5%).
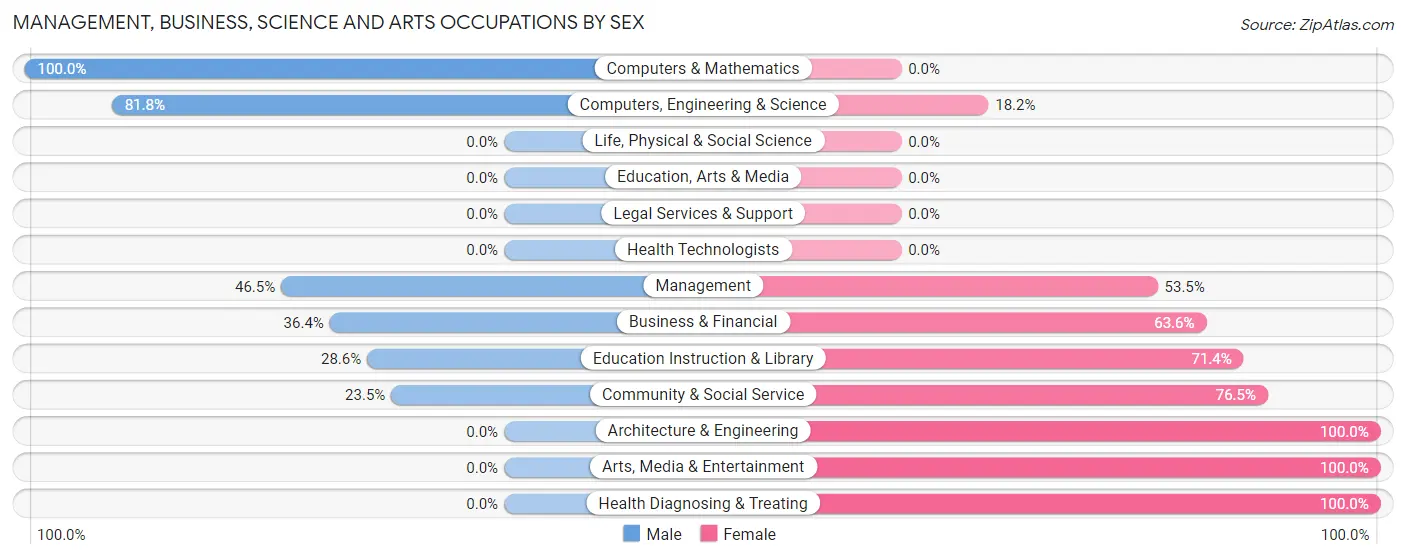
Management, Business, Science and Arts Occupations by Sex
Within the Management, Business, Science and Arts occupations in Rio Grande, the most male-oriented occupations are Computers & Mathematics (100.0%), Computers, Engineering & Science (81.8%), and Management (46.5%), while the most female-oriented occupations are Architecture & Engineering (100.0%), Arts, Media & Entertainment (100.0%), and Health Diagnosing & Treating (100.0%).
| Occupation | Male | Female |
| Management | 20 (46.5%) | 23 (53.5%) |
| Business & Financial | 8 (36.4%) | 14 (63.6%) |
| Computers, Engineering & Science | 9 (81.8%) | 2 (18.2%) |
| Computers & Mathematics | 9 (100.0%) | 0 (0.0%) |
| Architecture & Engineering | 0 (0.0%) | 2 (100.0%) |
| Life, Physical & Social Science | 0 (0.0%) | 0 (0.0%) |
| Community & Social Service | 4 (23.5%) | 13 (76.5%) |
| Education, Arts & Media | 0 (0.0%) | 0 (0.0%) |
| Legal Services & Support | 0 (0.0%) | 0 (0.0%) |
| Education Instruction & Library | 4 (28.6%) | 10 (71.4%) |
| Arts, Media & Entertainment | 0 (0.0%) | 3 (100.0%) |
| Health Diagnosing & Treating | 0 (0.0%) | 6 (100.0%) |
| Health Technologists | 0 (0.0%) | 0 (0.0%) |
| Total (Category) | 41 (41.4%) | 58 (58.6%) |
| Total (Overall) | 133 (42.1%) | 183 (57.9%) |
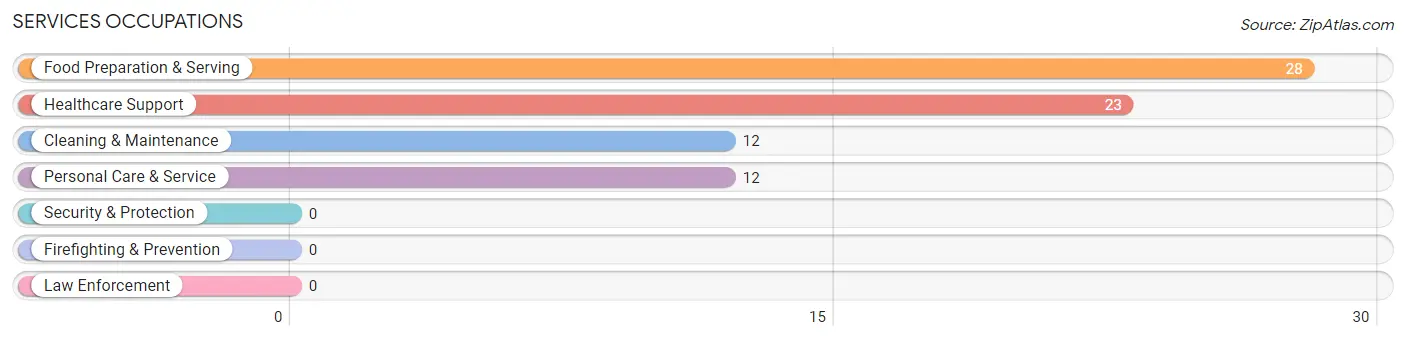
Services Occupations
The most common Services occupations in Rio Grande are Food Preparation & Serving (28 | 8.9%), Healthcare Support (23 | 7.3%), Cleaning & Maintenance (12 | 3.8%), and Personal Care & Service (12 | 3.8%).
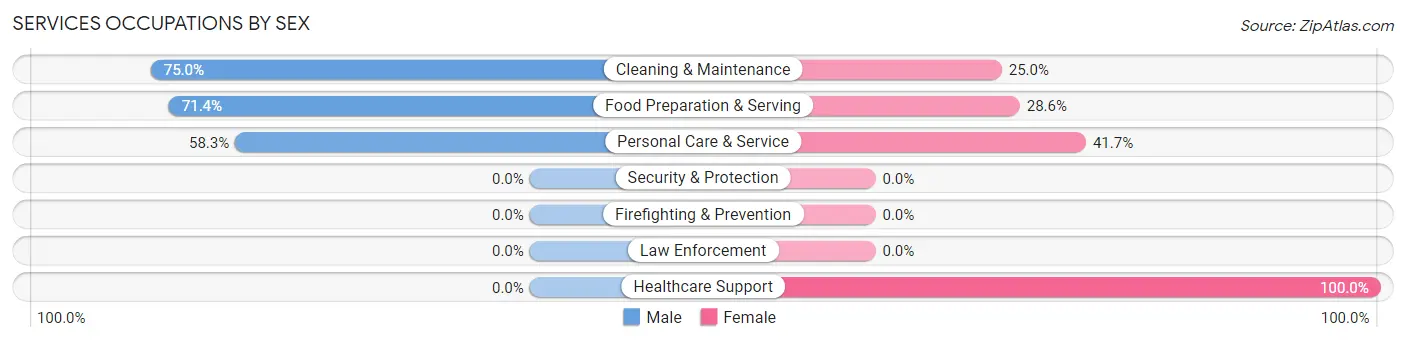
Services Occupations by Sex
Within the Services occupations in Rio Grande, the most male-oriented occupations are Cleaning & Maintenance (75.0%), Food Preparation & Serving (71.4%), and Personal Care & Service (58.3%), while the most female-oriented occupations are Healthcare Support (100.0%), Personal Care & Service (41.7%), and Food Preparation & Serving (28.6%).
| Occupation | Male | Female |
| Healthcare Support | 0 (0.0%) | 23 (100.0%) |
| Security & Protection | 0 (0.0%) | 0 (0.0%) |
| Firefighting & Prevention | 0 (0.0%) | 0 (0.0%) |
| Law Enforcement | 0 (0.0%) | 0 (0.0%) |
| Food Preparation & Serving | 20 (71.4%) | 8 (28.6%) |
| Cleaning & Maintenance | 9 (75.0%) | 3 (25.0%) |
| Personal Care & Service | 7 (58.3%) | 5 (41.7%) |
| Total (Category) | 36 (48.0%) | 39 (52.0%) |
| Total (Overall) | 133 (42.1%) | 183 (57.9%) |
Sales and Office Occupations
The most common Sales and Office occupations in Rio Grande are Office & Administration (68 | 21.5%), and Sales & Related (15 | 4.8%).
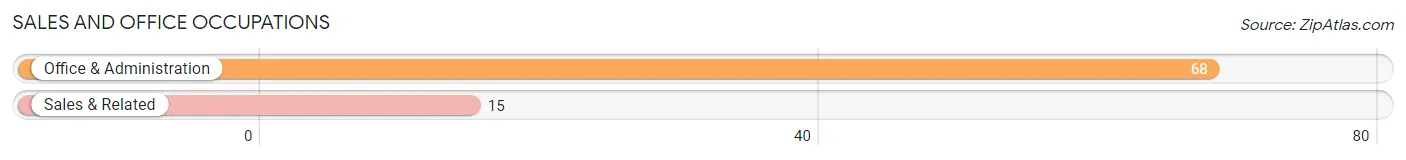
Sales and Office Occupations by Sex

| Occupation | Male | Female |
| Sales & Related | 1 (6.7%) | 14 (93.3%) |
| Office & Administration | 8 (11.8%) | 60 (88.2%) |
| Total (Category) | 9 (10.8%) | 74 (89.2%) |
| Total (Overall) | 133 (42.1%) | 183 (57.9%) |
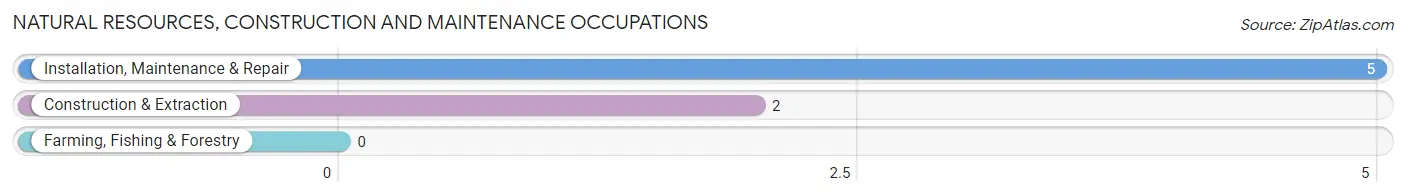
Natural Resources, Construction and Maintenance Occupations
The most common Natural Resources, Construction and Maintenance occupations in Rio Grande are Installation, Maintenance & Repair (5 | 1.6%), and Construction & Extraction (2 | 0.6%).
Natural Resources, Construction and Maintenance Occupations by Sex
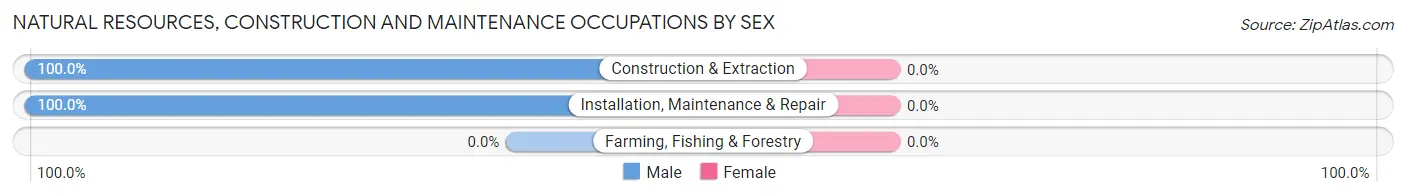
| Occupation | Male | Female |
| Farming, Fishing & Forestry | 0 (0.0%) | 0 (0.0%) |
| Construction & Extraction | 2 (100.0%) | 0 (0.0%) |
| Installation, Maintenance & Repair | 5 (100.0%) | 0 (0.0%) |
| Total (Category) | 7 (100.0%) | 0 (0.0%) |
| Total (Overall) | 133 (42.1%) | 183 (57.9%) |
Production, Transportation and Moving Occupations
The most common Production, Transportation and Moving occupations in Rio Grande are Material Moving (29 | 9.2%), Production (14 | 4.4%), and Transportation (9 | 2.9%).
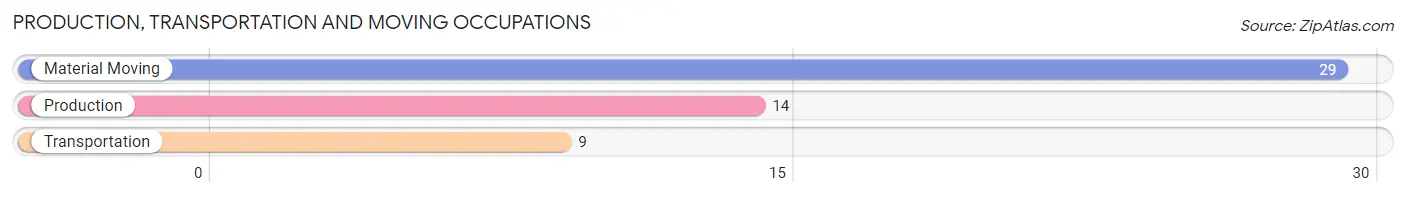
Production, Transportation and Moving Occupations by Sex
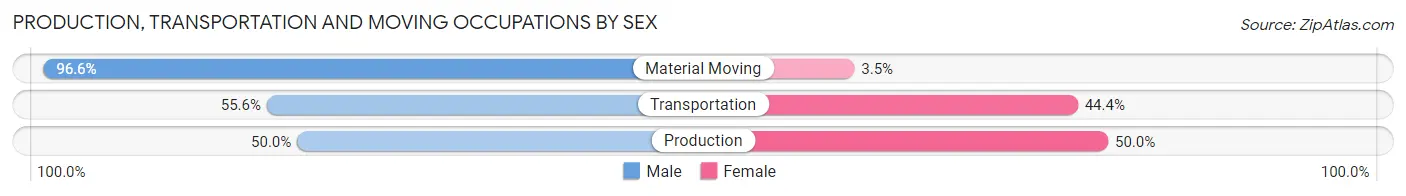
| Occupation | Male | Female |
| Production | 7 (50.0%) | 7 (50.0%) |
| Transportation | 5 (55.6%) | 4 (44.4%) |
| Material Moving | 28 (96.6%) | 1 (3.5%) |
| Total (Category) | 40 (76.9%) | 12 (23.1%) |
| Total (Overall) | 133 (42.1%) | 183 (57.9%) |
Employment Industries by Sex in Rio Grande
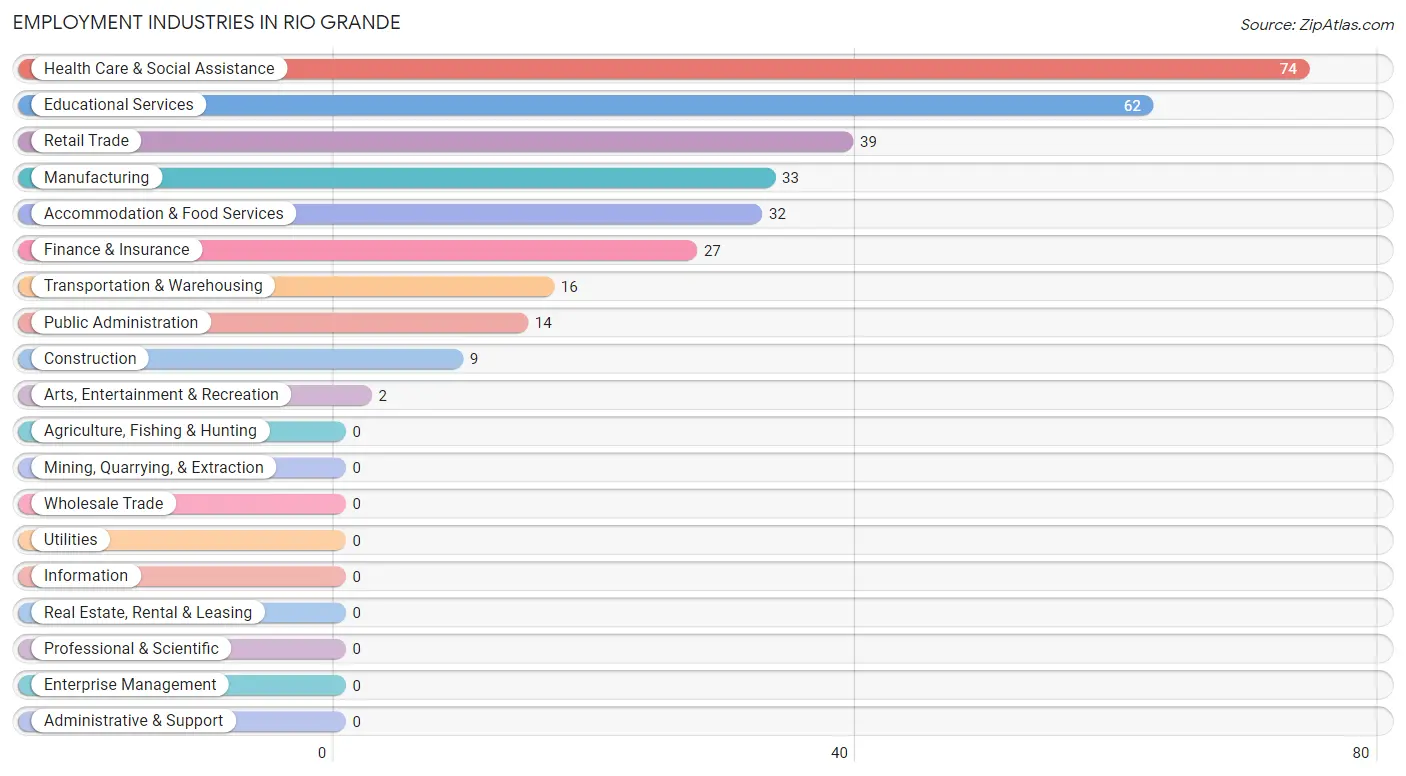
Employment Industries in Rio Grande
The major employment industries in Rio Grande include Health Care & Social Assistance (74 | 23.4%), Educational Services (62 | 19.6%), Retail Trade (39 | 12.3%), Manufacturing (33 | 10.4%), and Accommodation & Food Services (32 | 10.1%).
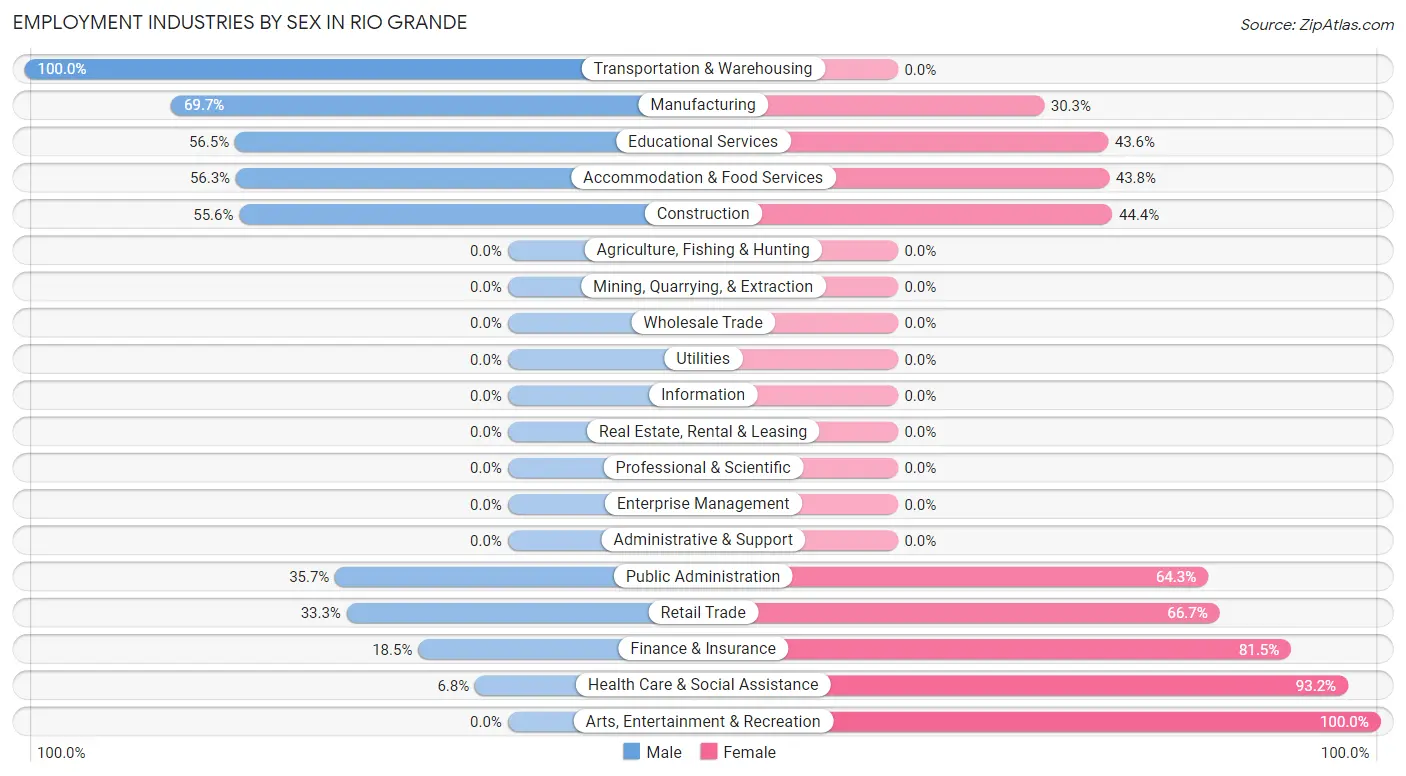
Employment Industries by Sex in Rio Grande
The Rio Grande industries that see more men than women are Transportation & Warehousing (100.0%), Manufacturing (69.7%), and Educational Services (56.5%), whereas the industries that tend to have a higher number of women are Arts, Entertainment & Recreation (100.0%), Health Care & Social Assistance (93.2%), and Finance & Insurance (81.5%).
| Industry | Male | Female |
| Agriculture, Fishing & Hunting | 0 (0.0%) | 0 (0.0%) |
| Mining, Quarrying, & Extraction | 0 (0.0%) | 0 (0.0%) |
| Construction | 5 (55.6%) | 4 (44.4%) |
| Manufacturing | 23 (69.7%) | 10 (30.3%) |
| Wholesale Trade | 0 (0.0%) | 0 (0.0%) |
| Retail Trade | 13 (33.3%) | 26 (66.7%) |
| Transportation & Warehousing | 16 (100.0%) | 0 (0.0%) |
| Utilities | 0 (0.0%) | 0 (0.0%) |
| Information | 0 (0.0%) | 0 (0.0%) |
| Finance & Insurance | 5 (18.5%) | 22 (81.5%) |
| Real Estate, Rental & Leasing | 0 (0.0%) | 0 (0.0%) |
| Professional & Scientific | 0 (0.0%) | 0 (0.0%) |
| Enterprise Management | 0 (0.0%) | 0 (0.0%) |
| Administrative & Support | 0 (0.0%) | 0 (0.0%) |
| Educational Services | 35 (56.5%) | 27 (43.5%) |
| Health Care & Social Assistance | 5 (6.8%) | 69 (93.2%) |
| Arts, Entertainment & Recreation | 0 (0.0%) | 2 (100.0%) |
| Accommodation & Food Services | 18 (56.2%) | 14 (43.8%) |
| Public Administration | 5 (35.7%) | 9 (64.3%) |
| Total | 133 (42.1%) | 183 (57.9%) |
Education in Rio Grande
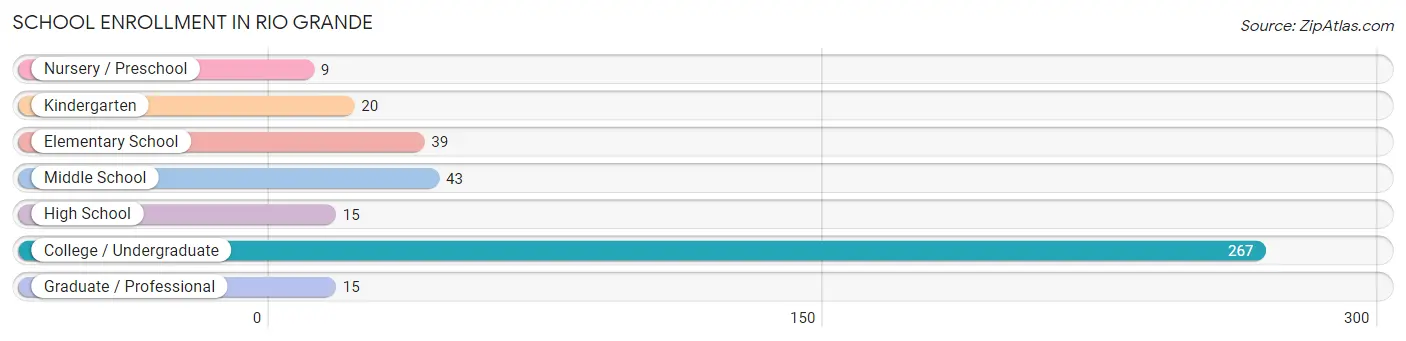
School Enrollment in Rio Grande
The most common levels of schooling among the 408 students in Rio Grande are college / undergraduate (267 | 65.4%), middle school (43 | 10.5%), and elementary school (39 | 9.6%).
| School Level | # Students | % Students |
| Nursery / Preschool | 9 | 2.2% |
| Kindergarten | 20 | 4.9% |
| Elementary School | 39 | 9.6% |
| Middle School | 43 | 10.5% |
| High School | 15 | 3.7% |
| College / Undergraduate | 267 | 65.4% |
| Graduate / Professional | 15 | 3.7% |
| Total | 408 | 100.0% |
School Enrollment by Age by Funding Source in Rio Grande
Out of a total of 408 students who are enrolled in schools in Rio Grande, 64 (15.7%) attend a private institution, while the remaining 344 (84.3%) are enrolled in public schools. The age group of 15 to 17 year olds has the highest likelihood of being enrolled in private schools, with 4 (30.8% in the age bracket) enrolled. Conversely, the age group of 3 to 4 year olds has the lowest likelihood of being enrolled in a private school, with 9 (100.0% in the age bracket) attending a public institution.
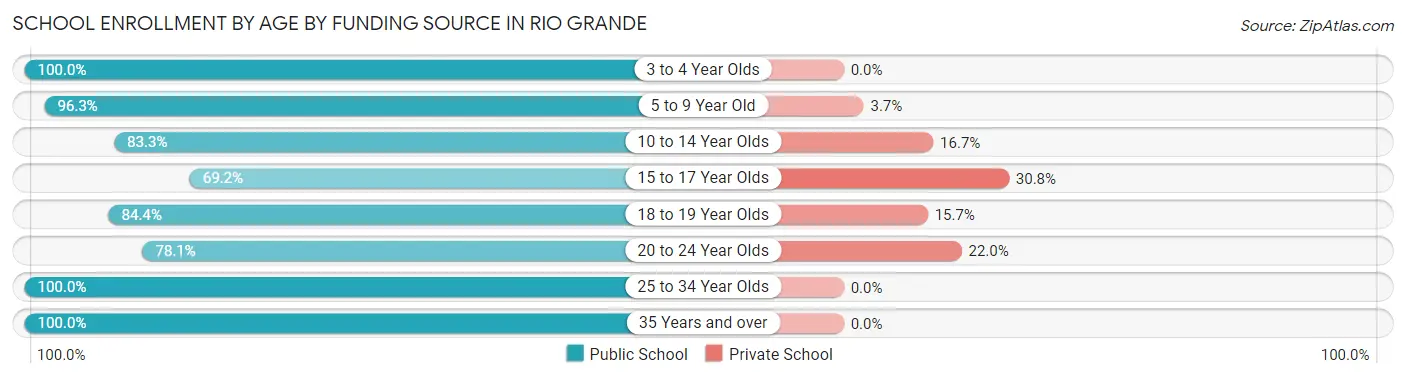
| Age Bracket | Public School | Private School |
| 3 to 4 Year Olds | 9 (100.0%) | 0 (0.0%) |
| 5 to 9 Year Old | 52 (96.3%) | 2 (3.7%) |
| 10 to 14 Year Olds | 40 (83.3%) | 8 (16.7%) |
| 15 to 17 Year Olds | 9 (69.2%) | 4 (30.8%) |
| 18 to 19 Year Olds | 124 (84.4%) | 23 (15.7%) |
| 20 to 24 Year Olds | 96 (78.0%) | 27 (22.0%) |
| 25 to 34 Year Olds | 12 (100.0%) | 0 (0.0%) |
| 35 Years and over | 2 (100.0%) | 0 (0.0%) |
| Total | 344 (84.3%) | 64 (15.7%) |
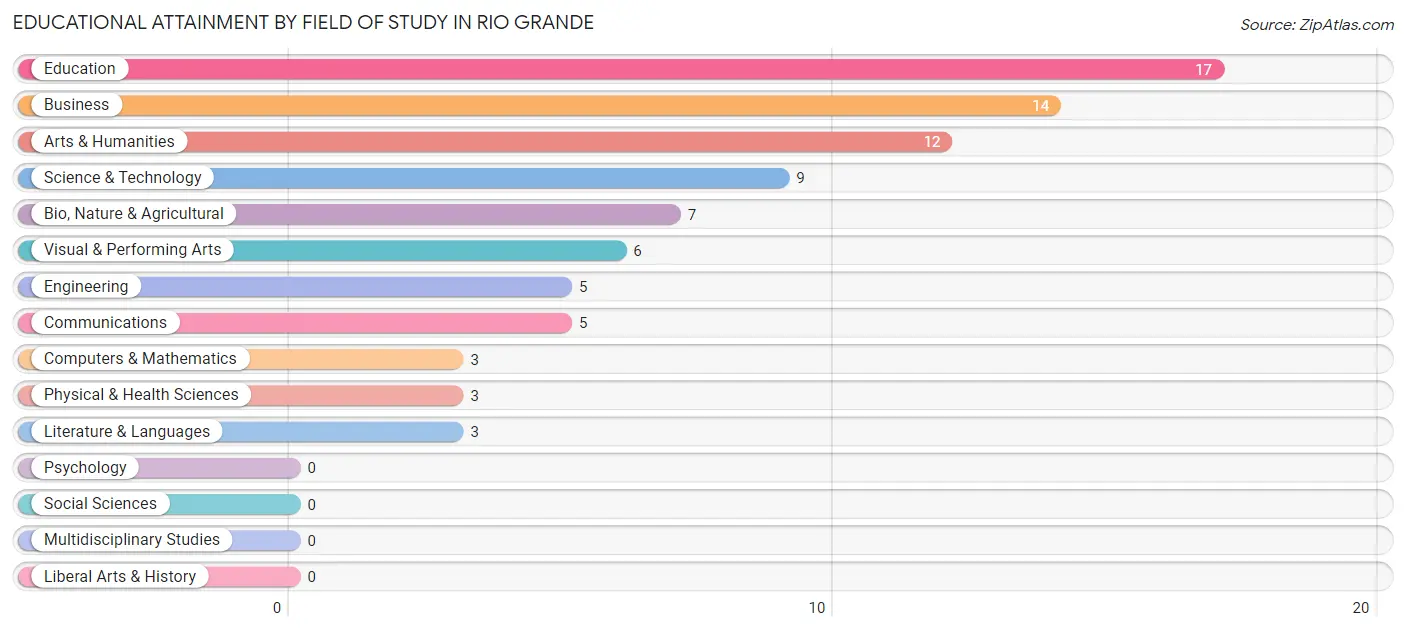
Educational Attainment by Field of Study in Rio Grande
Education (17 | 20.2%), business (14 | 16.7%), arts & humanities (12 | 14.3%), science & technology (9 | 10.7%), and bio, nature & agricultural (7 | 8.3%) are the most common fields of study among 84 individuals in Rio Grande who have obtained a bachelor's degree or higher.
| Field of Study | # Graduates | % Graduates |
| Computers & Mathematics | 3 | 3.6% |
| Bio, Nature & Agricultural | 7 | 8.3% |
| Physical & Health Sciences | 3 | 3.6% |
| Psychology | 0 | 0.0% |
| Social Sciences | 0 | 0.0% |
| Engineering | 5 | 5.9% |
| Multidisciplinary Studies | 0 | 0.0% |
| Science & Technology | 9 | 10.7% |
| Business | 14 | 16.7% |
| Education | 17 | 20.2% |
| Literature & Languages | 3 | 3.6% |
| Liberal Arts & History | 0 | 0.0% |
| Visual & Performing Arts | 6 | 7.1% |
| Communications | 5 | 5.9% |
| Arts & Humanities | 12 | 14.3% |
| Total | 84 | 100.0% |
Transportation & Commute in Rio Grande
Vehicle Availability by Sex in Rio Grande
The most prevalent vehicle ownership categories in Rio Grande are males with 2 vehicles (49, accounting for 55.1%) and females with 2 vehicles (90, making up 31.8%).
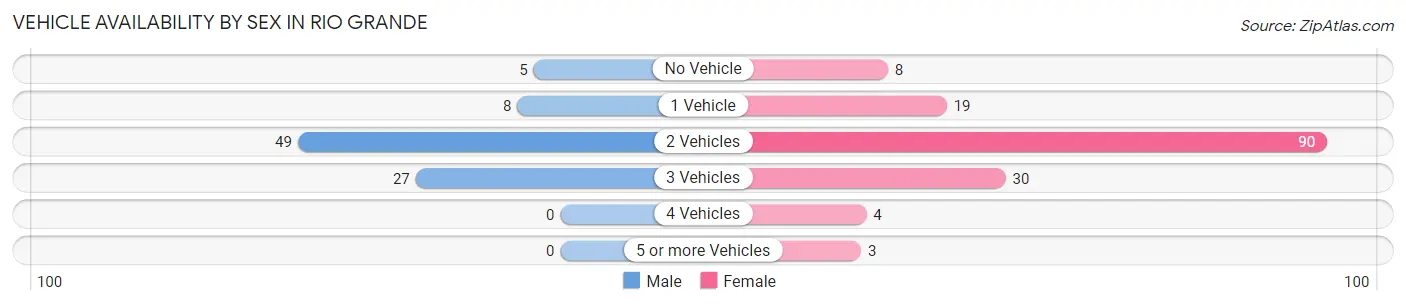
| Vehicles Available | Male | Female |
| No Vehicle | 5 (5.6%) | 8 (5.2%) |
| 1 Vehicle | 8 (9.0%) | 19 (12.3%) |
| 2 Vehicles | 49 (55.1%) | 90 (58.4%) |
| 3 Vehicles | 27 (30.3%) | 30 (19.5%) |
| 4 Vehicles | 0 (0.0%) | 4 (2.6%) |
| 5 or more Vehicles | 0 (0.0%) | 3 (1.9%) |
| Total | 89 (100.0%) | 154 (100.0%) |
Commute Time in Rio Grande
The most frequently occuring commute durations in Rio Grande are 10 to 14 minutes (54 commuters, 19.3%), 5 to 9 minutes (51 commuters, 18.2%), and less than 5 minutes (44 commuters, 15.7%).
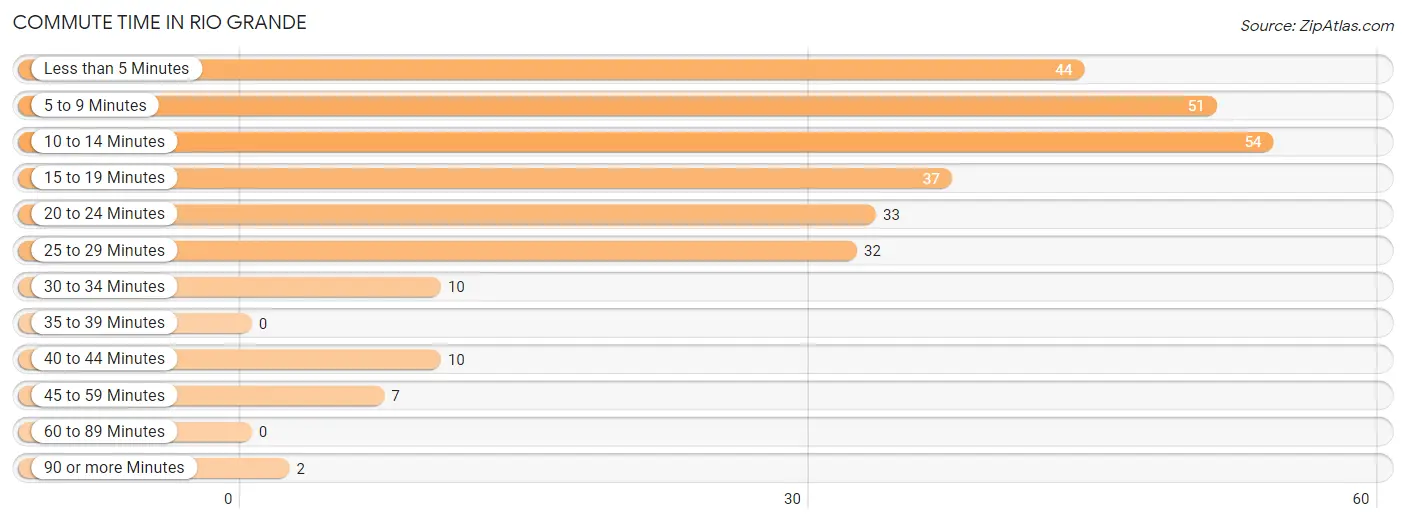
| Commute Time | # Commuters | % Commuters |
| Less than 5 Minutes | 44 | 15.7% |
| 5 to 9 Minutes | 51 | 18.2% |
| 10 to 14 Minutes | 54 | 19.3% |
| 15 to 19 Minutes | 37 | 13.2% |
| 20 to 24 Minutes | 33 | 11.8% |
| 25 to 29 Minutes | 32 | 11.4% |
| 30 to 34 Minutes | 10 | 3.6% |
| 35 to 39 Minutes | 0 | 0.0% |
| 40 to 44 Minutes | 10 | 3.6% |
| 45 to 59 Minutes | 7 | 2.5% |
| 60 to 89 Minutes | 0 | 0.0% |
| 90 or more Minutes | 2 | 0.7% |
Commute Time by Sex in Rio Grande
The most common commute times in Rio Grande are less than 5 minutes (44 commuters, 37.6%) for males and 10 to 14 minutes (37 commuters, 22.7%) for females.
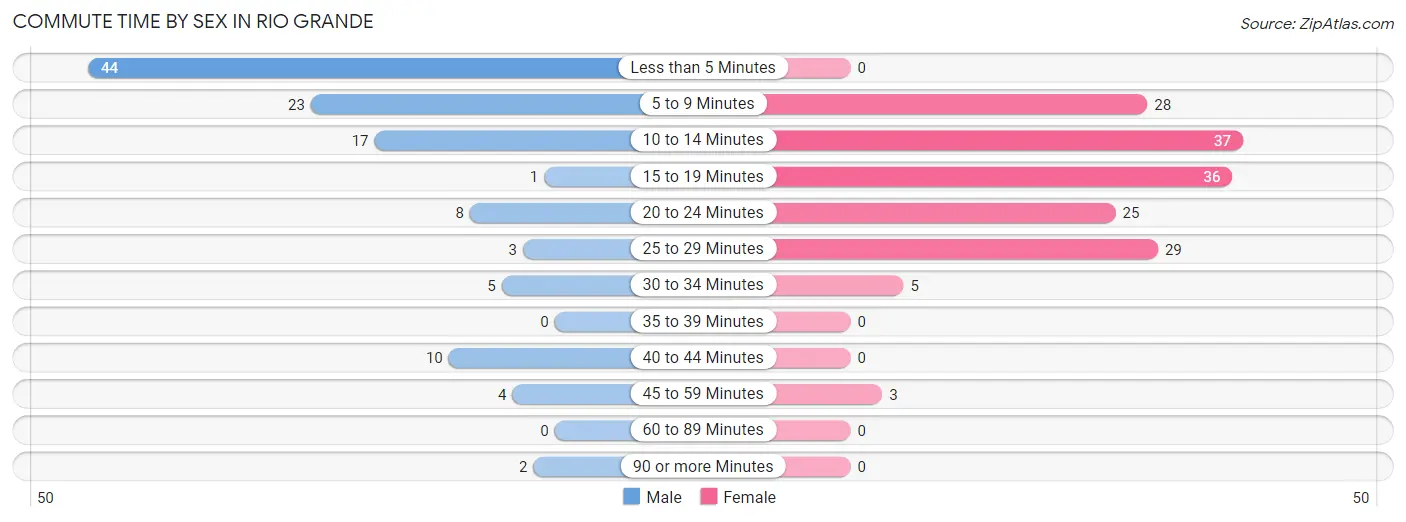
| Commute Time | Male | Female |
| Less than 5 Minutes | 44 (37.6%) | 0 (0.0%) |
| 5 to 9 Minutes | 23 (19.7%) | 28 (17.2%) |
| 10 to 14 Minutes | 17 (14.5%) | 37 (22.7%) |
| 15 to 19 Minutes | 1 (0.9%) | 36 (22.1%) |
| 20 to 24 Minutes | 8 (6.8%) | 25 (15.3%) |
| 25 to 29 Minutes | 3 (2.6%) | 29 (17.8%) |
| 30 to 34 Minutes | 5 (4.3%) | 5 (3.1%) |
| 35 to 39 Minutes | 0 (0.0%) | 0 (0.0%) |
| 40 to 44 Minutes | 10 (8.6%) | 0 (0.0%) |
| 45 to 59 Minutes | 4 (3.4%) | 3 (1.8%) |
| 60 to 89 Minutes | 0 (0.0%) | 0 (0.0%) |
| 90 or more Minutes | 2 (1.7%) | 0 (0.0%) |
Time of Departure to Work by Sex in Rio Grande
The most frequent times of departure to work in Rio Grande are 7:00 AM to 7:29 AM (36, 30.8%) for males and 9:00 AM to 9:59 AM (38, 23.3%) for females.
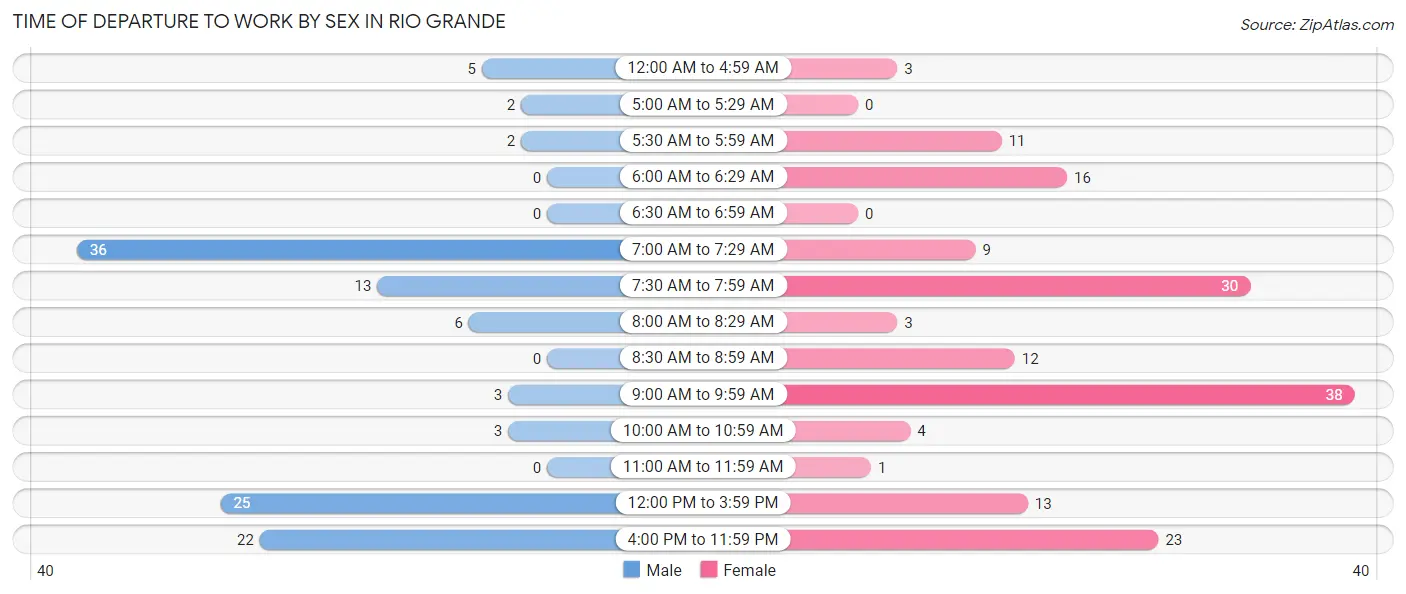
| Time of Departure | Male | Female |
| 12:00 AM to 4:59 AM | 5 (4.3%) | 3 (1.8%) |
| 5:00 AM to 5:29 AM | 2 (1.7%) | 0 (0.0%) |
| 5:30 AM to 5:59 AM | 2 (1.7%) | 11 (6.8%) |
| 6:00 AM to 6:29 AM | 0 (0.0%) | 16 (9.8%) |
| 6:30 AM to 6:59 AM | 0 (0.0%) | 0 (0.0%) |
| 7:00 AM to 7:29 AM | 36 (30.8%) | 9 (5.5%) |
| 7:30 AM to 7:59 AM | 13 (11.1%) | 30 (18.4%) |
| 8:00 AM to 8:29 AM | 6 (5.1%) | 3 (1.8%) |
| 8:30 AM to 8:59 AM | 0 (0.0%) | 12 (7.4%) |
| 9:00 AM to 9:59 AM | 3 (2.6%) | 38 (23.3%) |
| 10:00 AM to 10:59 AM | 3 (2.6%) | 4 (2.5%) |
| 11:00 AM to 11:59 AM | 0 (0.0%) | 1 (0.6%) |
| 12:00 PM to 3:59 PM | 25 (21.4%) | 13 (8.0%) |
| 4:00 PM to 11:59 PM | 22 (18.8%) | 23 (14.1%) |
| Total | 117 (100.0%) | 163 (100.0%) |
Housing Occupancy in Rio Grande
Occupancy by Ownership in Rio Grande
Of the total 230 dwellings in Rio Grande, owner-occupied units account for 74 (32.2%), while renter-occupied units make up 156 (67.8%).
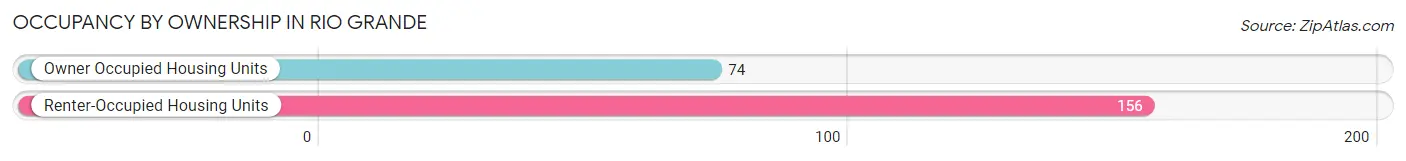
| Occupancy | # Housing Units | % Housing Units |
| Owner Occupied Housing Units | 74 | 32.2% |
| Renter-Occupied Housing Units | 156 | 67.8% |
| Total Occupied Housing Units | 230 | 100.0% |
Occupancy by Household Size in Rio Grande
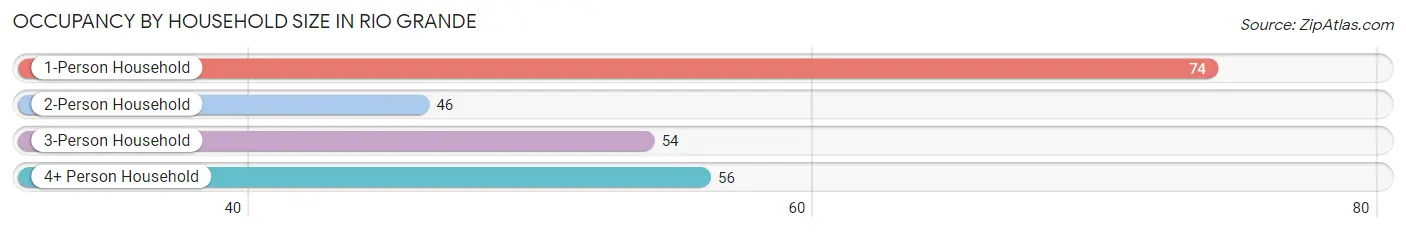
| Household Size | # Housing Units | % Housing Units |
| 1-Person Household | 74 | 32.2% |
| 2-Person Household | 46 | 20.0% |
| 3-Person Household | 54 | 23.5% |
| 4+ Person Household | 56 | 24.3% |
| Total Housing Units | 230 | 100.0% |
Occupancy by Ownership by Household Size in Rio Grande
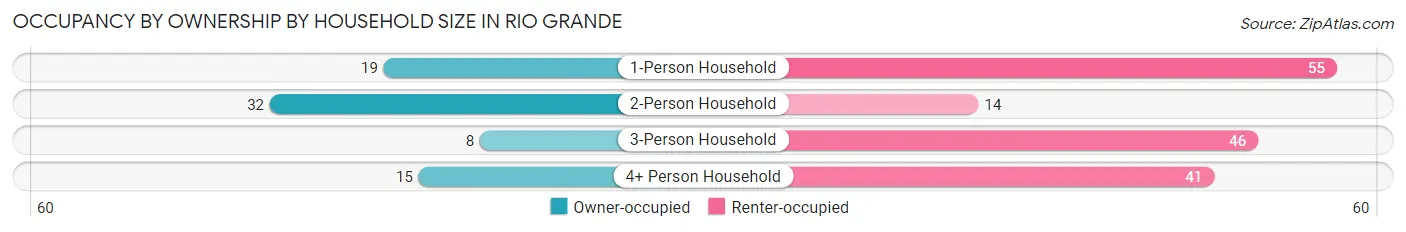
| Household Size | Owner-occupied | Renter-occupied |
| 1-Person Household | 19 (25.7%) | 55 (74.3%) |
| 2-Person Household | 32 (69.6%) | 14 (30.4%) |
| 3-Person Household | 8 (14.8%) | 46 (85.2%) |
| 4+ Person Household | 15 (26.8%) | 41 (73.2%) |
| Total Housing Units | 74 (32.2%) | 156 (67.8%) |
Occupancy by Educational Attainment in Rio Grande
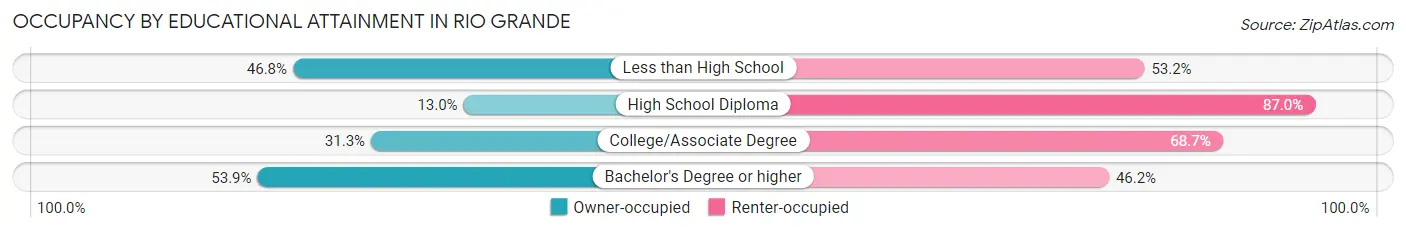
| Household Size | Owner-occupied | Renter-occupied |
| Less than High School | 22 (46.8%) | 25 (53.2%) |
| High School Diploma | 10 (13.0%) | 67 (87.0%) |
| College/Associate Degree | 21 (31.3%) | 46 (68.7%) |
| Bachelor's Degree or higher | 21 (53.8%) | 18 (46.2%) |
Occupancy by Age of Householder in Rio Grande
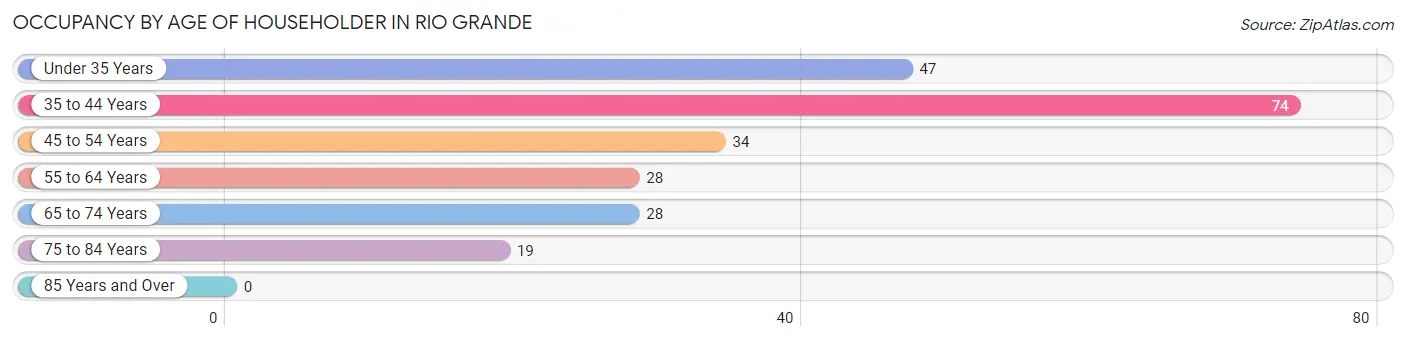
| Age Bracket | # Households | % Households |
| Under 35 Years | 47 | 20.4% |
| 35 to 44 Years | 74 | 32.2% |
| 45 to 54 Years | 34 | 14.8% |
| 55 to 64 Years | 28 | 12.2% |
| 65 to 74 Years | 28 | 12.2% |
| 75 to 84 Years | 19 | 8.3% |
| 85 Years and Over | 0 | 0.0% |
| Total | 230 | 100.0% |
Housing Finances in Rio Grande
Median Income by Occupancy in Rio Grande
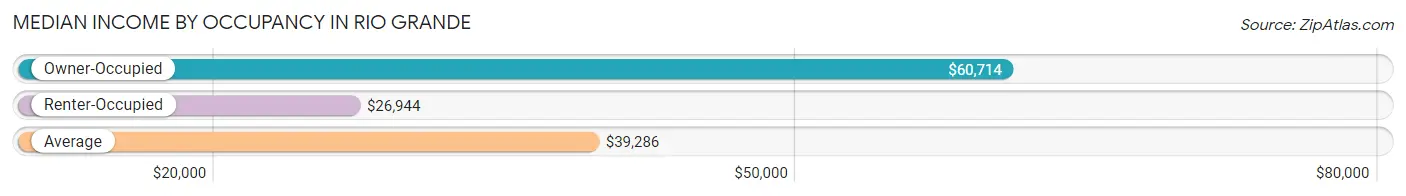
| Occupancy Type | # Households | Median Income |
| Owner-Occupied | 74 (32.2%) | $60,714 |
| Renter-Occupied | 156 (67.8%) | $26,944 |
| Average | 230 (100.0%) | $39,286 |
Occupancy by Householder Income Bracket in Rio Grande
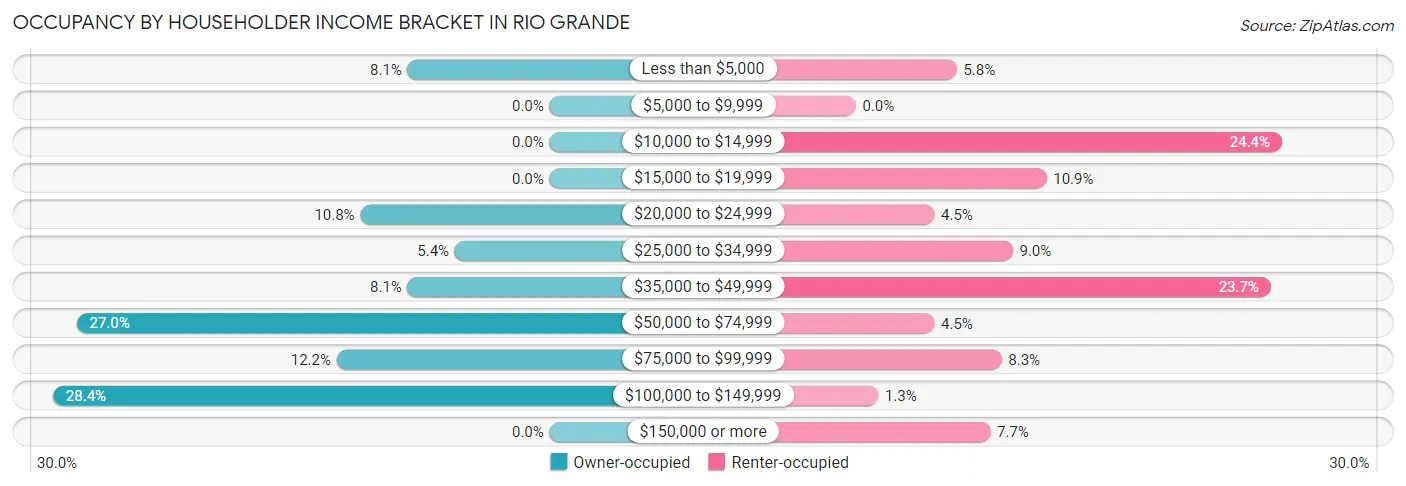
| Income Bracket | Owner-occupied | Renter-occupied |
| Less than $5,000 | 6 (8.1%) | 9 (5.8%) |
| $5,000 to $9,999 | 0 (0.0%) | 0 (0.0%) |
| $10,000 to $14,999 | 0 (0.0%) | 38 (24.4%) |
| $15,000 to $19,999 | 0 (0.0%) | 17 (10.9%) |
| $20,000 to $24,999 | 8 (10.8%) | 7 (4.5%) |
| $25,000 to $34,999 | 4 (5.4%) | 14 (9.0%) |
| $35,000 to $49,999 | 6 (8.1%) | 37 (23.7%) |
| $50,000 to $74,999 | 20 (27.0%) | 7 (4.5%) |
| $75,000 to $99,999 | 9 (12.2%) | 13 (8.3%) |
| $100,000 to $149,999 | 21 (28.4%) | 2 (1.3%) |
| $150,000 or more | 0 (0.0%) | 12 (7.7%) |
| Total | 74 (100.0%) | 156 (100.0%) |
Monthly Housing Cost Tiers in Rio Grande
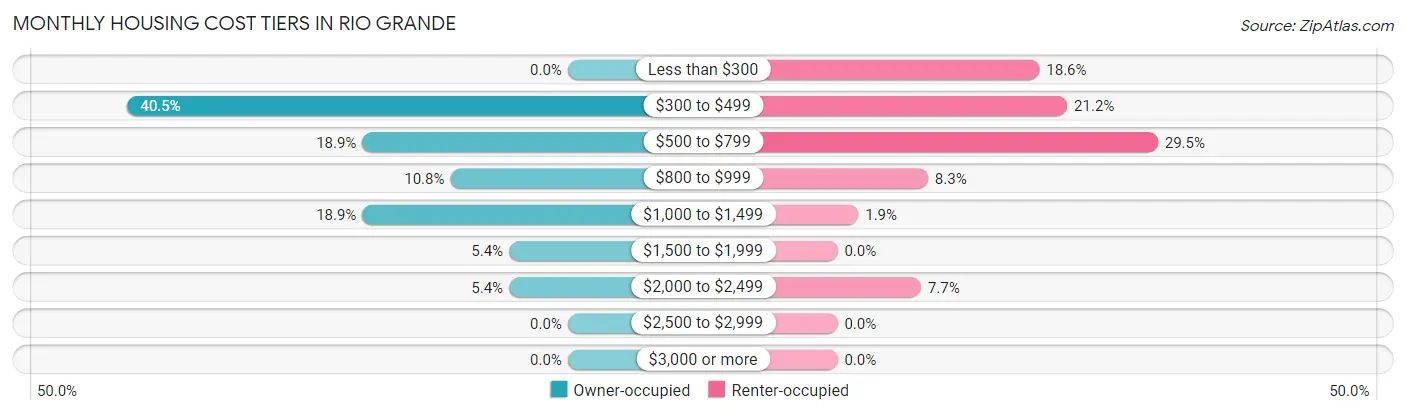
| Monthly Cost | Owner-occupied | Renter-occupied |
| Less than $300 | 0 (0.0%) | 29 (18.6%) |
| $300 to $499 | 30 (40.5%) | 33 (21.1%) |
| $500 to $799 | 14 (18.9%) | 46 (29.5%) |
| $800 to $999 | 8 (10.8%) | 13 (8.3%) |
| $1,000 to $1,499 | 14 (18.9%) | 3 (1.9%) |
| $1,500 to $1,999 | 4 (5.4%) | 0 (0.0%) |
| $2,000 to $2,499 | 4 (5.4%) | 12 (7.7%) |
| $2,500 to $2,999 | 0 (0.0%) | 0 (0.0%) |
| $3,000 or more | 0 (0.0%) | 0 (0.0%) |
| Total | 74 (100.0%) | 156 (100.0%) |
Physical Housing Characteristics in Rio Grande
Housing Structures in Rio Grande
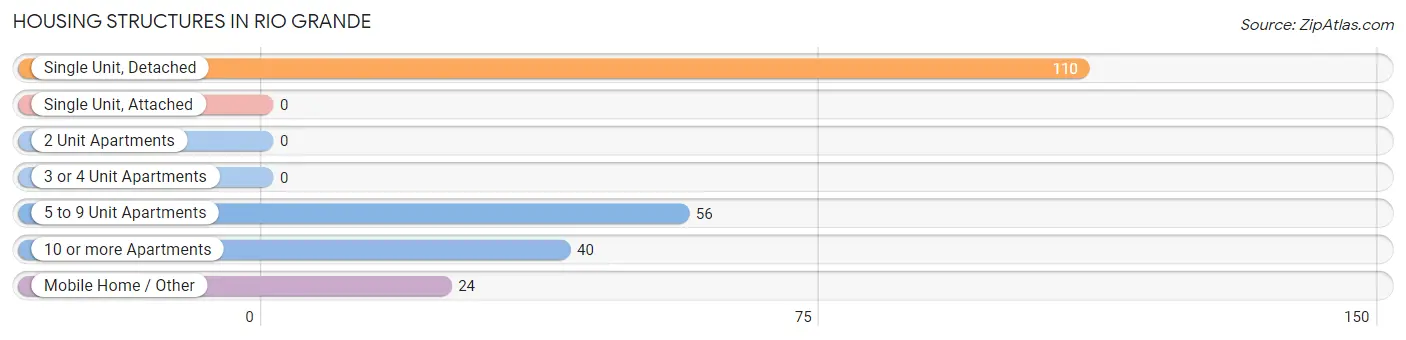
| Structure Type | # Housing Units | % Housing Units |
| Single Unit, Detached | 110 | 47.8% |
| Single Unit, Attached | 0 | 0.0% |
| 2 Unit Apartments | 0 | 0.0% |
| 3 or 4 Unit Apartments | 0 | 0.0% |
| 5 to 9 Unit Apartments | 56 | 24.3% |
| 10 or more Apartments | 40 | 17.4% |
| Mobile Home / Other | 24 | 10.4% |
| Total | 230 | 100.0% |
Housing Structures by Occupancy in Rio Grande
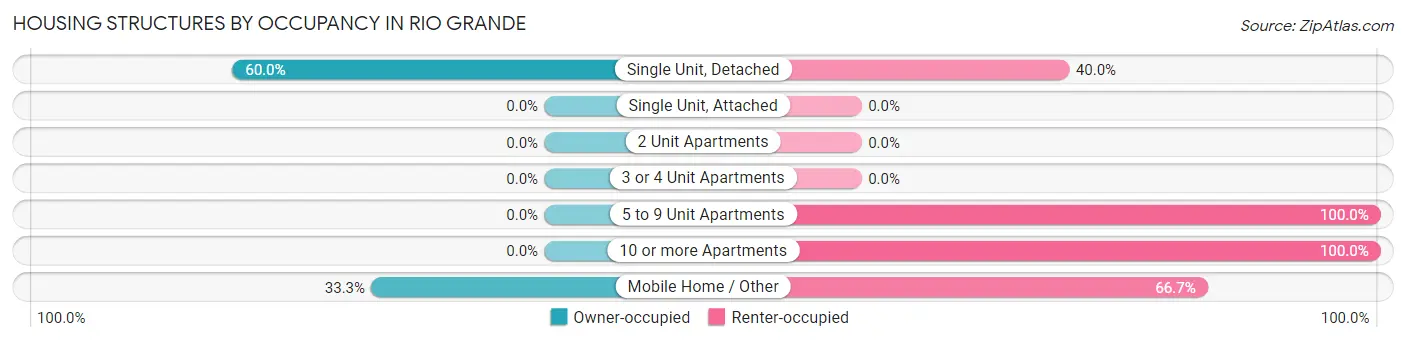
| Structure Type | Owner-occupied | Renter-occupied |
| Single Unit, Detached | 66 (60.0%) | 44 (40.0%) |
| Single Unit, Attached | 0 (0.0%) | 0 (0.0%) |
| 2 Unit Apartments | 0 (0.0%) | 0 (0.0%) |
| 3 or 4 Unit Apartments | 0 (0.0%) | 0 (0.0%) |
| 5 to 9 Unit Apartments | 0 (0.0%) | 56 (100.0%) |
| 10 or more Apartments | 0 (0.0%) | 40 (100.0%) |
| Mobile Home / Other | 8 (33.3%) | 16 (66.7%) |
| Total | 74 (32.2%) | 156 (67.8%) |
Housing Structures by Number of Rooms in Rio Grande
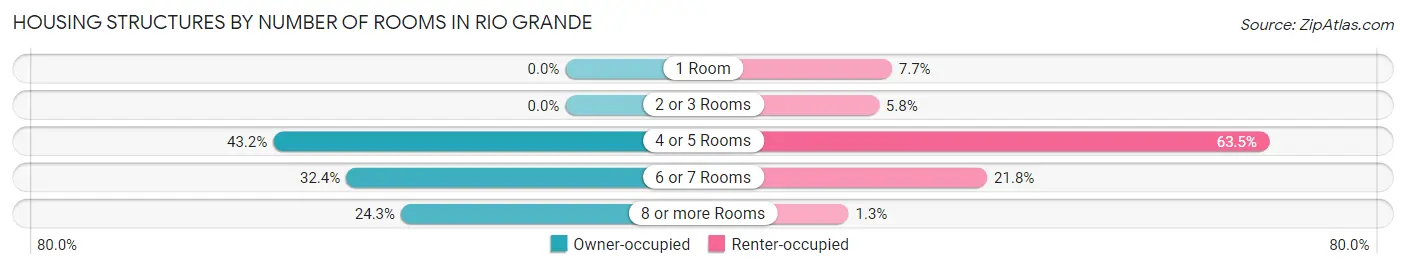
| Number of Rooms | Owner-occupied | Renter-occupied |
| 1 Room | 0 (0.0%) | 12 (7.7%) |
| 2 or 3 Rooms | 0 (0.0%) | 9 (5.8%) |
| 4 or 5 Rooms | 32 (43.2%) | 99 (63.5%) |
| 6 or 7 Rooms | 24 (32.4%) | 34 (21.8%) |
| 8 or more Rooms | 18 (24.3%) | 2 (1.3%) |
| Total | 74 (100.0%) | 156 (100.0%) |
Housing Structure by Heating Type in Rio Grande
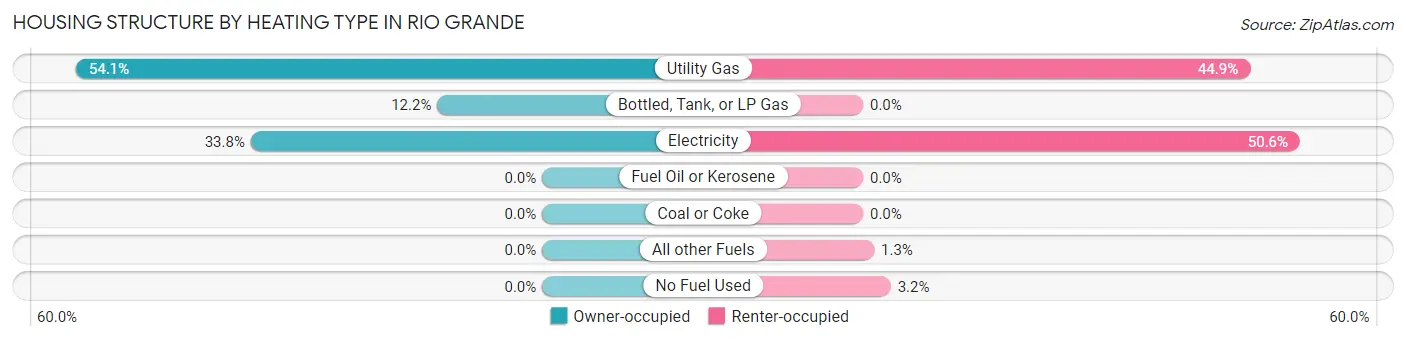
| Heating Type | Owner-occupied | Renter-occupied |
| Utility Gas | 40 (54.0%) | 70 (44.9%) |
| Bottled, Tank, or LP Gas | 9 (12.2%) | 0 (0.0%) |
| Electricity | 25 (33.8%) | 79 (50.6%) |
| Fuel Oil or Kerosene | 0 (0.0%) | 0 (0.0%) |
| Coal or Coke | 0 (0.0%) | 0 (0.0%) |
| All other Fuels | 0 (0.0%) | 2 (1.3%) |
| No Fuel Used | 0 (0.0%) | 5 (3.2%) |
| Total | 74 (100.0%) | 156 (100.0%) |
Household Vehicle Usage in Rio Grande
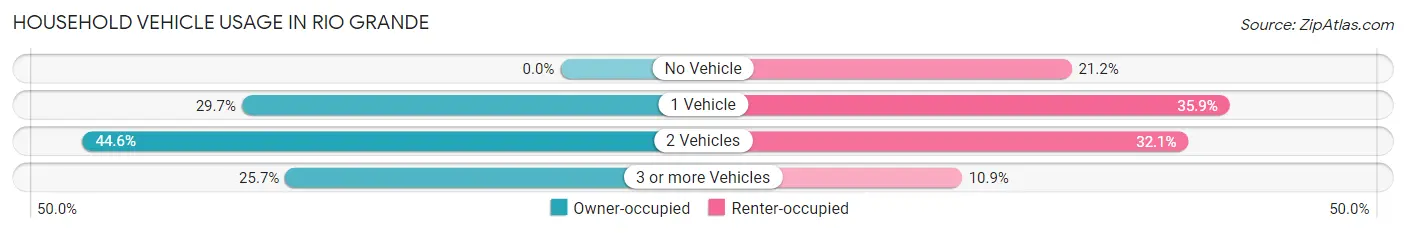
| Vehicles per Household | Owner-occupied | Renter-occupied |
| No Vehicle | 0 (0.0%) | 33 (21.1%) |
| 1 Vehicle | 22 (29.7%) | 56 (35.9%) |
| 2 Vehicles | 33 (44.6%) | 50 (32.1%) |
| 3 or more Vehicles | 19 (25.7%) | 17 (10.9%) |
| Total | 74 (100.0%) | 156 (100.0%) |
Real Estate & Mortgages in Rio Grande
Real Estate and Mortgage Overview in Rio Grande
| Characteristic | Without Mortgage | With Mortgage |
| Housing Units | 44 | 30 |
| Median Property Value | $117,900 | $187,500 |
| Median Household Income | $41,667 | $0 |
| Monthly Housing Costs | $467 | $0 |
| Real Estate Taxes | $941 | $0 |
Property Value by Mortgage Status in Rio Grande
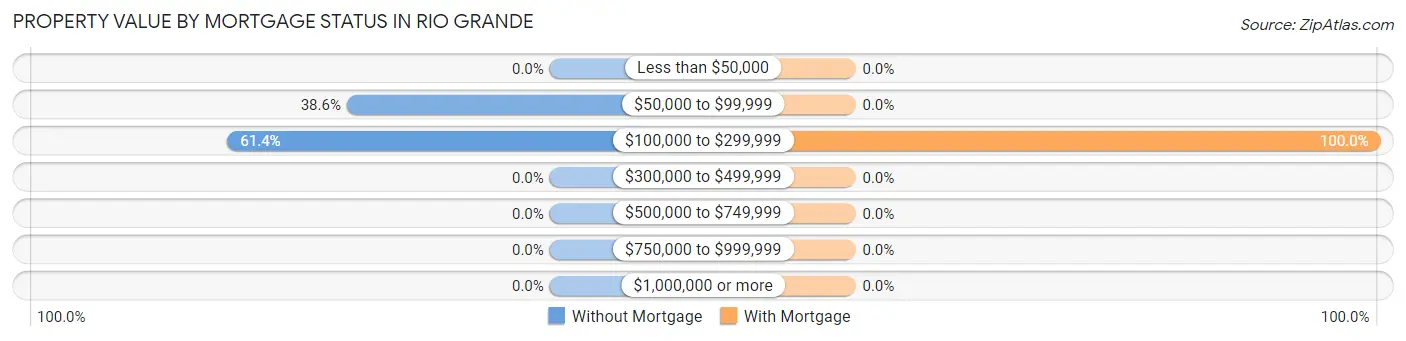
| Property Value | Without Mortgage | With Mortgage |
| Less than $50,000 | 0 (0.0%) | 0 (0.0%) |
| $50,000 to $99,999 | 17 (38.6%) | 0 (0.0%) |
| $100,000 to $299,999 | 27 (61.4%) | 30 (100.0%) |
| $300,000 to $499,999 | 0 (0.0%) | 0 (0.0%) |
| $500,000 to $749,999 | 0 (0.0%) | 0 (0.0%) |
| $750,000 to $999,999 | 0 (0.0%) | 0 (0.0%) |
| $1,000,000 or more | 0 (0.0%) | 0 (0.0%) |
| Total | 44 (100.0%) | 30 (100.0%) |
Household Income by Mortgage Status in Rio Grande
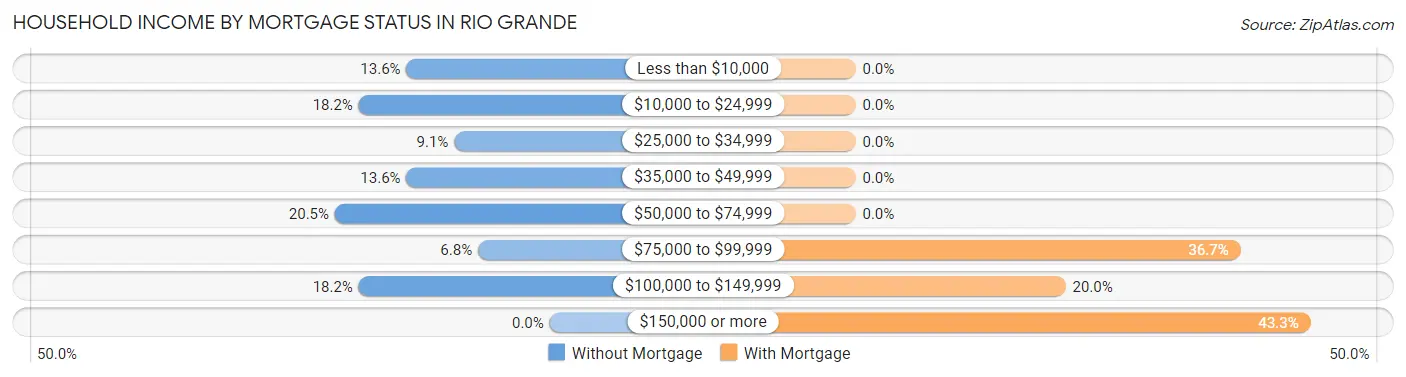
| Household Income | Without Mortgage | With Mortgage |
| Less than $10,000 | 6 (13.6%) | 0 (0.0%) |
| $10,000 to $24,999 | 8 (18.2%) | 0 (0.0%) |
| $25,000 to $34,999 | 4 (9.1%) | 0 (0.0%) |
| $35,000 to $49,999 | 6 (13.6%) | 0 (0.0%) |
| $50,000 to $74,999 | 9 (20.4%) | 0 (0.0%) |
| $75,000 to $99,999 | 3 (6.8%) | 11 (36.7%) |
| $100,000 to $149,999 | 8 (18.2%) | 6 (20.0%) |
| $150,000 or more | 0 (0.0%) | 13 (43.3%) |
| Total | 44 (100.0%) | 30 (100.0%) |
Property Value to Household Income Ratio in Rio Grande
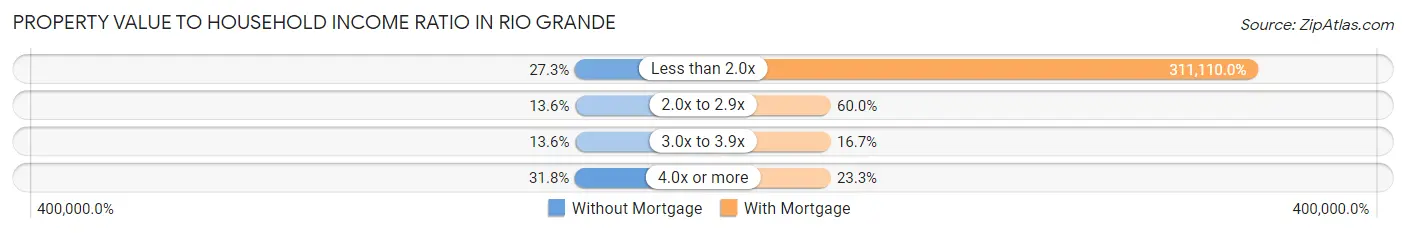
| Value-to-Income Ratio | Without Mortgage | With Mortgage |
| Less than 2.0x | 12 (27.3%) | 93,333 (311,110.0%) |
| 2.0x to 2.9x | 6 (13.6%) | 18 (60.0%) |
| 3.0x to 3.9x | 6 (13.6%) | 5 (16.7%) |
| 4.0x or more | 14 (31.8%) | 7 (23.3%) |
| Total | 44 (100.0%) | 30 (100.0%) |
Real Estate Taxes by Mortgage Status in Rio Grande
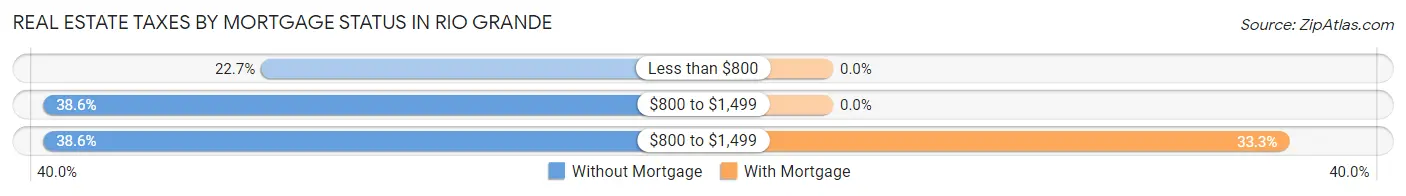
| Property Taxes | Without Mortgage | With Mortgage |
| Less than $800 | 10 (22.7%) | 0 (0.0%) |
| $800 to $1,499 | 17 (38.6%) | 0 (0.0%) |
| $800 to $1,499 | 17 (38.6%) | 10 (33.3%) |
| Total | 44 (100.0%) | 30 (100.0%) |
Health & Disability in Rio Grande
Health Insurance Coverage by Age in Rio Grande
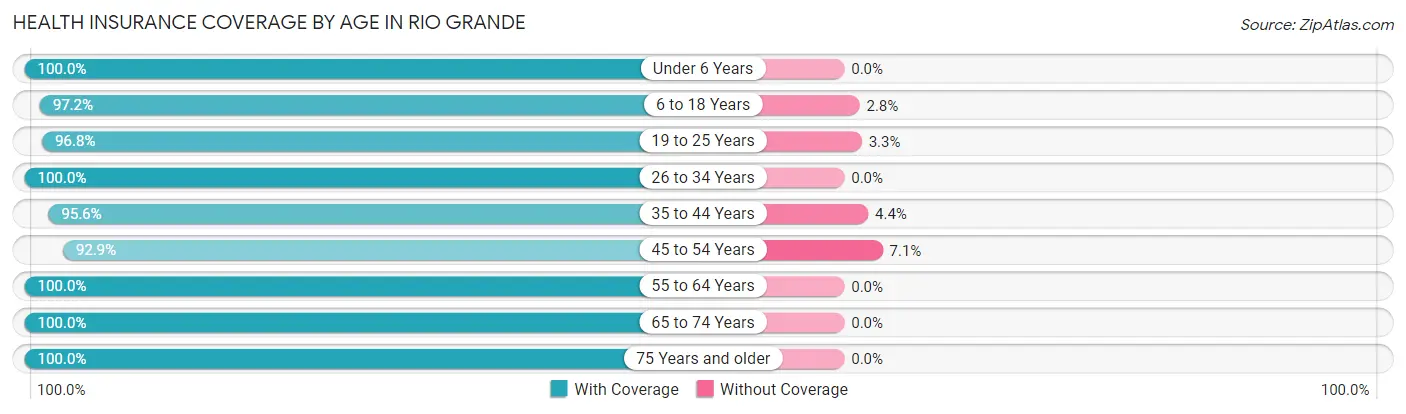
| Age Bracket | With Coverage | Without Coverage |
| Under 6 Years | 69 (100.0%) | 0 (0.0%) |
| 6 to 18 Years | 171 (97.2%) | 5 (2.8%) |
| 19 to 25 Years | 268 (96.8%) | 9 (3.3%) |
| 26 to 34 Years | 52 (100.0%) | 0 (0.0%) |
| 35 to 44 Years | 129 (95.6%) | 6 (4.4%) |
| 45 to 54 Years | 39 (92.9%) | 3 (7.1%) |
| 55 to 64 Years | 38 (100.0%) | 0 (0.0%) |
| 65 to 74 Years | 37 (100.0%) | 0 (0.0%) |
| 75 Years and older | 30 (100.0%) | 0 (0.0%) |
| Total | 833 (97.3%) | 23 (2.7%) |
Health Insurance Coverage by Citizenship Status in Rio Grande
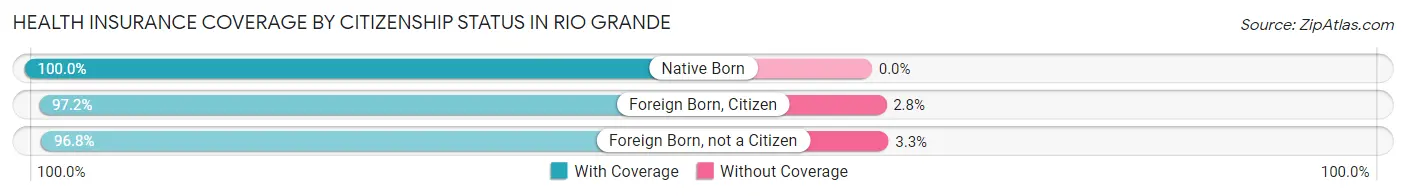
| Citizenship Status | With Coverage | Without Coverage |
| Native Born | 69 (100.0%) | 0 (0.0%) |
| Foreign Born, Citizen | 171 (97.2%) | 5 (2.8%) |
| Foreign Born, not a Citizen | 268 (96.8%) | 9 (3.3%) |
Health Insurance Coverage by Household Income in Rio Grande
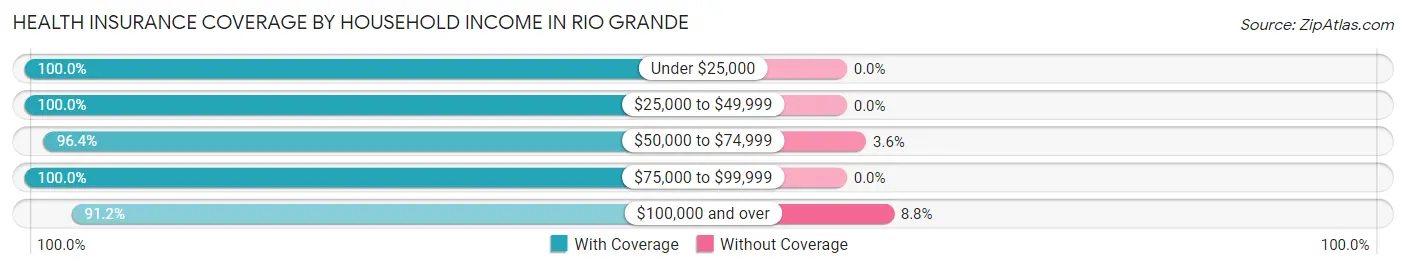
| Household Income | With Coverage | Without Coverage |
| Under $25,000 | 172 (100.0%) | 0 (0.0%) |
| $25,000 to $49,999 | 166 (100.0%) | 0 (0.0%) |
| $50,000 to $74,999 | 80 (96.4%) | 3 (3.6%) |
| $75,000 to $99,999 | 54 (100.0%) | 0 (0.0%) |
| $100,000 and over | 114 (91.2%) | 11 (8.8%) |
Public vs Private Health Insurance Coverage by Age in Rio Grande
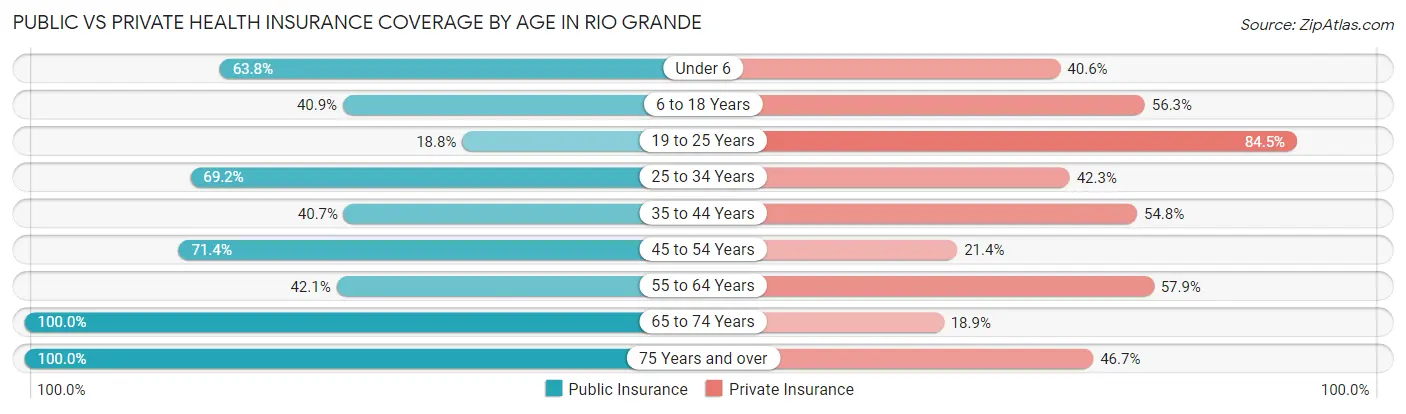
| Age Bracket | Public Insurance | Private Insurance |
| Under 6 | 44 (63.8%) | 28 (40.6%) |
| 6 to 18 Years | 72 (40.9%) | 99 (56.2%) |
| 19 to 25 Years | 52 (18.8%) | 234 (84.5%) |
| 25 to 34 Years | 36 (69.2%) | 22 (42.3%) |
| 35 to 44 Years | 55 (40.7%) | 74 (54.8%) |
| 45 to 54 Years | 30 (71.4%) | 9 (21.4%) |
| 55 to 64 Years | 16 (42.1%) | 22 (57.9%) |
| 65 to 74 Years | 37 (100.0%) | 7 (18.9%) |
| 75 Years and over | 30 (100.0%) | 14 (46.7%) |
| Total | 372 (43.5%) | 509 (59.5%) |
Disability Status by Sex by Age in Rio Grande
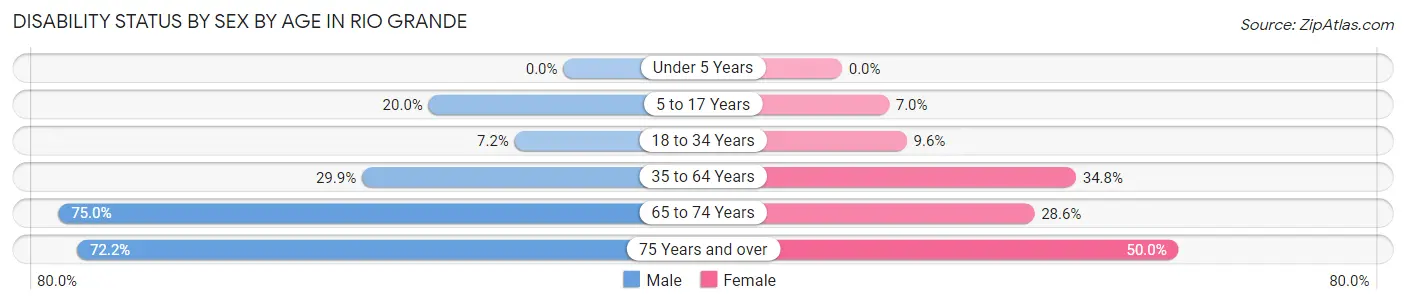
| Age Bracket | Male | Female |
| Under 5 Years | 0 (0.0%) | 0 (0.0%) |
| 5 to 17 Years | 15 (20.0%) | 3 (7.0%) |
| 18 to 34 Years | 12 (7.2%) | 23 (9.6%) |
| 35 to 64 Years | 29 (29.9%) | 41 (34.7%) |
| 65 to 74 Years | 12 (75.0%) | 6 (28.6%) |
| 75 Years and over | 13 (72.2%) | 6 (50.0%) |
Disability Class by Sex by Age in Rio Grande
Disability Class: Hearing Difficulty
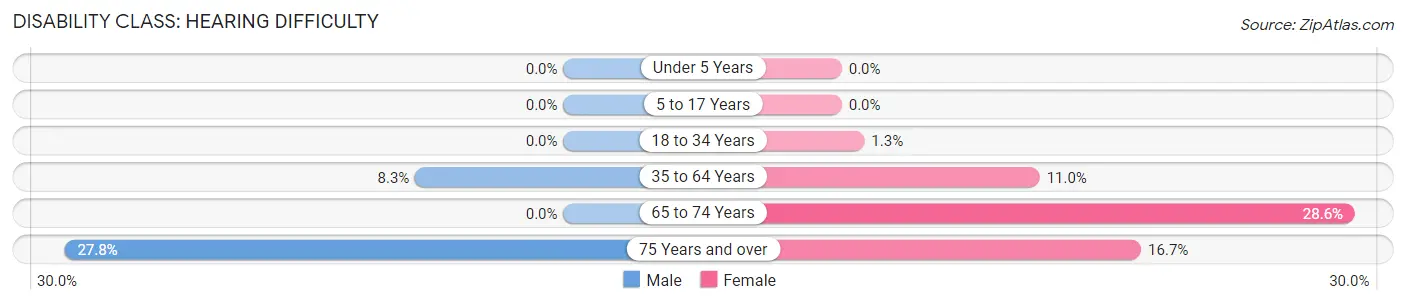
| Age Bracket | Male | Female |
| Under 5 Years | 0 (0.0%) | 0 (0.0%) |
| 5 to 17 Years | 0 (0.0%) | 0 (0.0%) |
| 18 to 34 Years | 0 (0.0%) | 3 (1.3%) |
| 35 to 64 Years | 8 (8.3%) | 13 (11.0%) |
| 65 to 74 Years | 0 (0.0%) | 6 (28.6%) |
| 75 Years and over | 5 (27.8%) | 2 (16.7%) |
Disability Class: Vision Difficulty
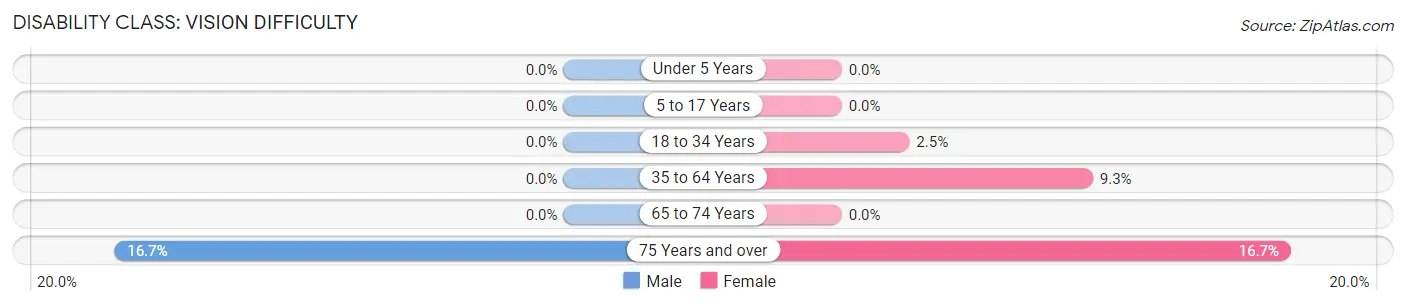
| Age Bracket | Male | Female |
| Under 5 Years | 0 (0.0%) | 0 (0.0%) |
| 5 to 17 Years | 0 (0.0%) | 0 (0.0%) |
| 18 to 34 Years | 0 (0.0%) | 6 (2.5%) |
| 35 to 64 Years | 0 (0.0%) | 11 (9.3%) |
| 65 to 74 Years | 0 (0.0%) | 0 (0.0%) |
| 75 Years and over | 3 (16.7%) | 2 (16.7%) |
Disability Class: Cognitive Difficulty
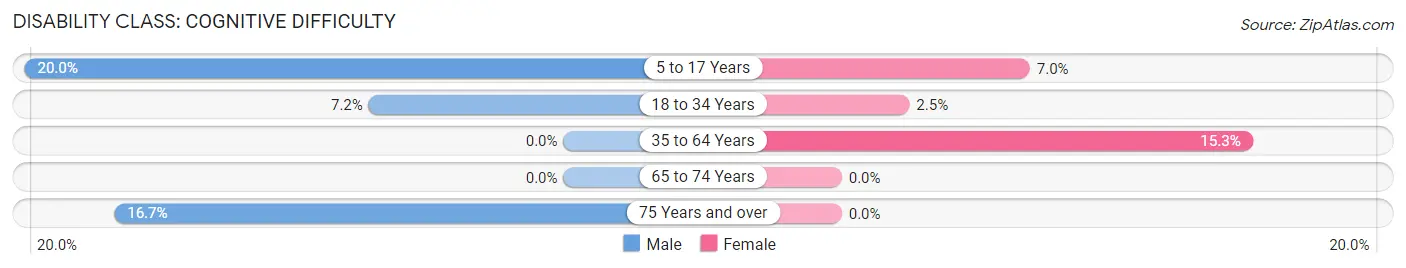
| Age Bracket | Male | Female |
| 5 to 17 Years | 15 (20.0%) | 3 (7.0%) |
| 18 to 34 Years | 12 (7.2%) | 6 (2.5%) |
| 35 to 64 Years | 0 (0.0%) | 18 (15.2%) |
| 65 to 74 Years | 0 (0.0%) | 0 (0.0%) |
| 75 Years and over | 3 (16.7%) | 0 (0.0%) |
Disability Class: Ambulatory Difficulty
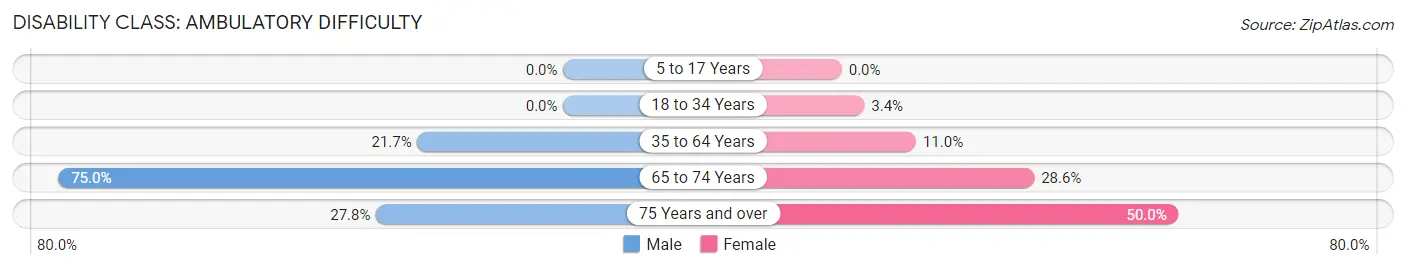
| Age Bracket | Male | Female |
| 5 to 17 Years | 0 (0.0%) | 0 (0.0%) |
| 18 to 34 Years | 0 (0.0%) | 8 (3.4%) |
| 35 to 64 Years | 21 (21.6%) | 13 (11.0%) |
| 65 to 74 Years | 12 (75.0%) | 6 (28.6%) |
| 75 Years and over | 5 (27.8%) | 6 (50.0%) |
Disability Class: Self-Care Difficulty
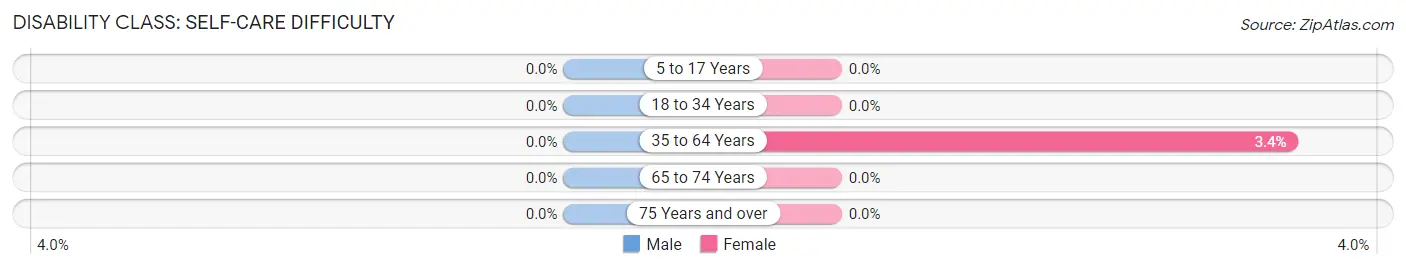
| Age Bracket | Male | Female |
| 5 to 17 Years | 0 (0.0%) | 0 (0.0%) |
| 18 to 34 Years | 0 (0.0%) | 0 (0.0%) |
| 35 to 64 Years | 0 (0.0%) | 4 (3.4%) |
| 65 to 74 Years | 0 (0.0%) | 0 (0.0%) |
| 75 Years and over | 0 (0.0%) | 0 (0.0%) |
Technology Access in Rio Grande
Computing Device Access in Rio Grande
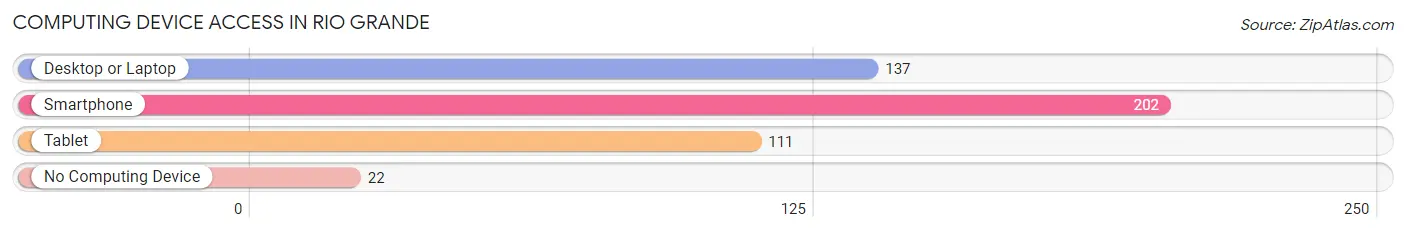
| Device Type | # Households | % Households |
| Desktop or Laptop | 137 | 59.6% |
| Smartphone | 202 | 87.8% |
| Tablet | 111 | 48.3% |
| No Computing Device | 22 | 9.6% |
| Total | 230 | 100.0% |
Internet Access in Rio Grande
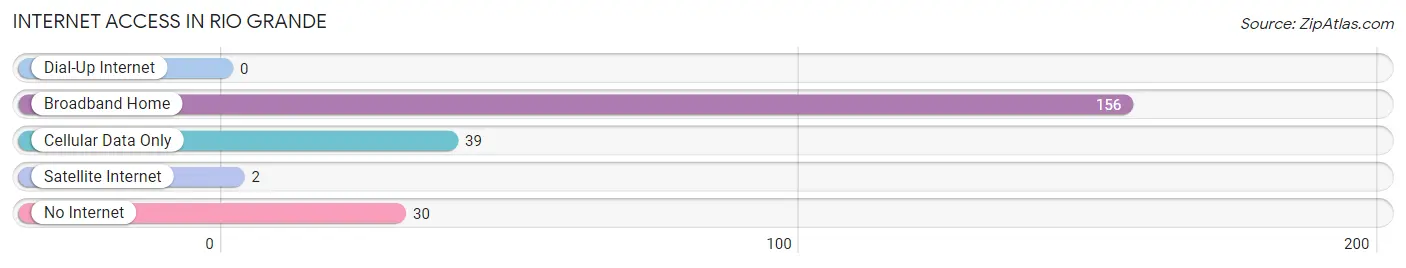
| Internet Type | # Households | % Households |
| Dial-Up Internet | 0 | 0.0% |
| Broadband Home | 156 | 67.8% |
| Cellular Data Only | 39 | 17.0% |
| Satellite Internet | 2 | 0.9% |
| No Internet | 30 | 13.0% |
| Total | 230 | 100.0% |
Rio Grande Summary
Rio Grande, Ohio is a small village located in Gallia County in the southeastern part of the state. It is situated along the Ohio River, just south of the city of Gallipolis. The village has a population of 1,876 people, according to the 2010 census.
History
Rio Grande was founded in 1817 by a group of settlers from the nearby town of Gallipolis. The village was named after the Rio Grande River, which runs through the area. The village was originally a farming community, but it soon became a center for the lumber industry. The village was incorporated in 1837.
In the late 19th century, Rio Grande became a popular tourist destination. The village was home to several resorts, including the Rio Grande Hotel, which was built in 1891. The hotel was a popular destination for wealthy visitors from the East Coast.
In the early 20th century, Rio Grande became a center for the coal mining industry. The village was home to several coal mines, including the Rio Grande Coal Company, which operated from 1906 to 1945.
Geography
Rio Grande is located in southeastern Ohio, along the Ohio River. The village is situated in Gallia County, just south of the city of Gallipolis. The village is located at an elevation of 645 feet above sea level.
The village is located in a rural area, with the nearest major city being Columbus, which is located about 100 miles to the northwest. The village is located in a humid continental climate zone, with hot summers and cold winters.
Economy
Rio Grande’s economy is largely based on agriculture and tourism. The village is home to several farms, which produce a variety of crops, including corn, soybeans, and wheat. The village is also home to several wineries, which produce a variety of wines.
The village is also home to several tourist attractions, including the Rio Grande Hotel, which is listed on the National Register of Historic Places. The village is also home to several antique shops, which attract visitors from all over the region.
Demographics
According to the 2010 census, the population of Rio Grande was 1,876 people. The village is predominantly white, with 95.3% of the population being white. The village is also home to a small Hispanic population, with 2.2% of the population being Hispanic.
The median household income in Rio Grande is $37,917, which is slightly lower than the national median of $51,914. The median age in the village is 41.3 years, which is slightly higher than the national median of 37.4 years.
Conclusion
Rio Grande is a small village located in southeastern Ohio, along the Ohio River. The village has a population of 1,876 people, according to the 2010 census. The village’s economy is largely based on agriculture and tourism. The village is predominantly white, with 95.3% of the population being white. The median household income in Rio Grande is $37,917, which is slightly lower than the national median of $51,914.
Common Questions
What is the Total Population of Rio Grande?
Total Population of Rio Grande is 856.
What is the Total Male Population of Rio Grande?
Total Male Population of Rio Grande is 397.
What is the Total Female Population of Rio Grande?
Total Female Population of Rio Grande is 459.
What is the Ratio of Males per 100 Females in Rio Grande?
There are 86.49 Males per 100 Females in Rio Grande.
What is the Ratio of Females per 100 Males in Rio Grande?
There are 115.62 Females per 100 Males in Rio Grande.
What is the Median Population Age in Rio Grande?
Median Population Age in Rio Grande is 21.8 Years.
What is the Average Family Size in Rio Grande
Average Family Size in Rio Grande is 2.9 People.
What is the Average Household Size in Rio Grande
Average Household Size in Rio Grande is 2.6 People.
What is Per Capita Income in Rio Grande?
Per Capita income in Rio Grande is $17,036.
What is the Median Family Income in Rio Grande?
Median Family Income in Rio Grande is $39,583.
What is the Median Household income in Rio Grande?
Median Household Income in Rio Grande is $39,286.
What is Family Income Deficit in Rio Grande?
Family Income Deficit in Rio Grande is $11,054.
Families that are below poverty line in Rio Grande earn $11,054 less on average than the poverty threshold level.
What is Inequality or Gini Index in Rio Grande?
Inequality or Gini Index in Rio Grande is 0.51.
How Large is the Labor Force in Rio Grande?
There are 336 People in the Labor Forcein in Rio Grande.
What is the Percentage of People in the Labor Force in Rio Grande?
48.6% of People are in the Labor Force in Rio Grande.
What is the Unemployment Rate in Rio Grande?
Unemployment Rate in Rio Grande is 6.0%.