Medford Lakes borough, NJ
Medford Lakes borough Overview
4,263
TOTAL POPULATION
1,856
MALE POPULATION
2,407
FEMALE POPULATION
77.11
MALES / 100 FEMALES
129.69
FEMALES / 100 MALES
44.8
MEDIAN AGE
3.3
AVG FAMILY SIZE
2.9
AVG HOUSEHOLD SIZE
$59,215
PER CAPITA INCOME
$157,434
AVG FAMILY INCOME
$139,879
AVG HOUSEHOLD INCOME
60.0%
WAGE / INCOME GAP [ % ]
40.0¢/ $1
WAGE / INCOME GAP [ $ ]
0.37
INEQUALITY / GINI INDEX
2,167
LABOR FORCE [ PEOPLE ]
63.8%
PERCENT IN LABOR FORCE
3.4%
UNEMPLOYMENT RATE
Race in Medford Lakes borough
The most populous races in Medford Lakes borough are White / Caucasian (3,955 | 92.8%), Two or more Races (210 | 4.9%), and Hispanic or Latino (109 | 2.6%).
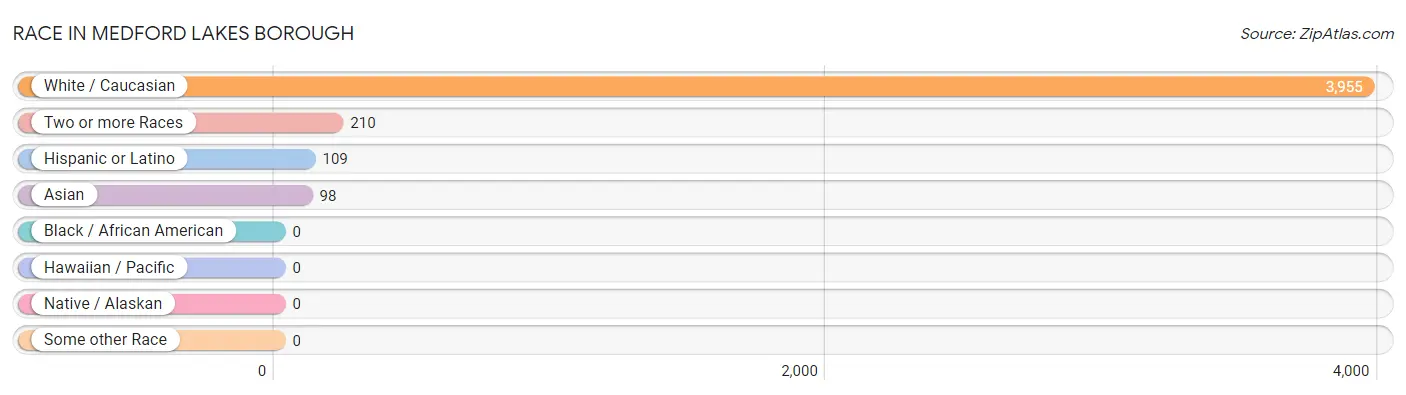
| Race | # Population | % Population |
| Asian | 98 | 2.3% |
| Black / African American | 0 | 0.0% |
| Hawaiian / Pacific | 0 | 0.0% |
| Hispanic or Latino | 109 | 2.6% |
| Native / Alaskan | 0 | 0.0% |
| White / Caucasian | 3,955 | 92.8% |
| Two or more Races | 210 | 4.9% |
| Some other Race | 0 | 0.0% |
| Total | 4,263 | 100.0% |
Ancestry in Medford Lakes borough
The most populous ancestries reported in Medford Lakes borough are Irish (1,365 | 32.0%), Italian (735 | 17.2%), German (607 | 14.2%), English (517 | 12.1%), and Indian (Asian) (273 | 6.4%), together accounting for 82.0% of all Medford Lakes borough residents.
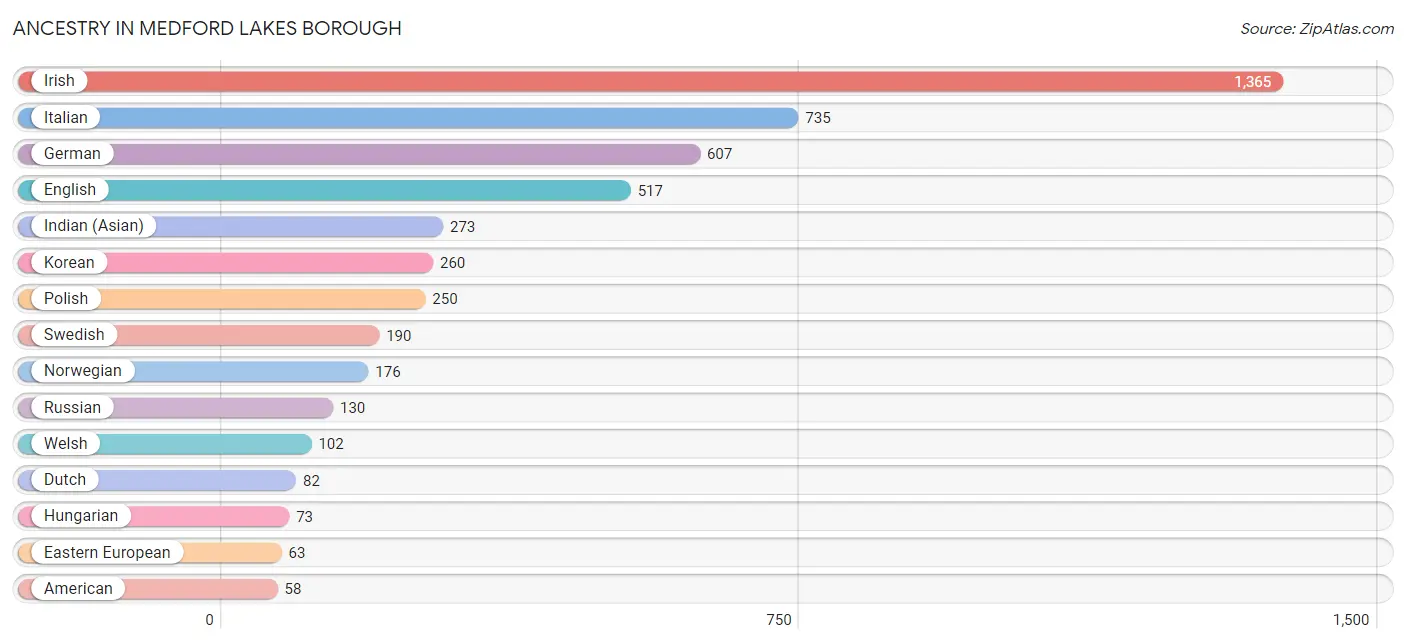
| Ancestry | # Population | % Population |
| American | 58 | 1.4% |
| Armenian | 15 | 0.4% |
| British | 58 | 1.4% |
| Central American | 10 | 0.2% |
| Costa Rican | 10 | 0.2% |
| Cuban | 31 | 0.7% |
| Czech | 7 | 0.2% |
| Danish | 8 | 0.2% |
| Dutch | 82 | 1.9% |
| Eastern European | 63 | 1.5% |
| English | 517 | 12.1% |
| Estonian | 9 | 0.2% |
| European | 7 | 0.2% |
| French | 43 | 1.0% |
| French Canadian | 11 | 0.3% |
| German | 607 | 14.2% |
| Greek | 20 | 0.5% |
| Hungarian | 73 | 1.7% |
| Indian (Asian) | 273 | 6.4% |
| Irish | 1,365 | 32.0% |
| Italian | 735 | 17.2% |
| Korean | 260 | 6.1% |
| Lithuanian | 26 | 0.6% |
| Norwegian | 176 | 4.1% |
| Pennsylvania German | 5 | 0.1% |
| Polish | 250 | 5.9% |
| Portuguese | 5 | 0.1% |
| Puerto Rican | 55 | 1.3% |
| Russian | 130 | 3.0% |
| Scandinavian | 21 | 0.5% |
| Scotch-Irish | 17 | 0.4% |
| Scottish | 58 | 1.4% |
| Slovak | 9 | 0.2% |
| Spanish | 13 | 0.3% |
| Swedish | 190 | 4.5% |
| Ukrainian | 10 | 0.2% |
| Welsh | 102 | 2.4% | View All 37 Rows |
Immigrants in Medford Lakes borough
The most numerous immigrant groups reported in Medford Lakes borough came from Asia (53 | 1.2%), Philippines (40 | 0.9%), South Eastern Asia (40 | 0.9%), Latin America (21 | 0.5%), and Europe (14 | 0.3%), together accounting for 3.9% of all Medford Lakes borough residents.
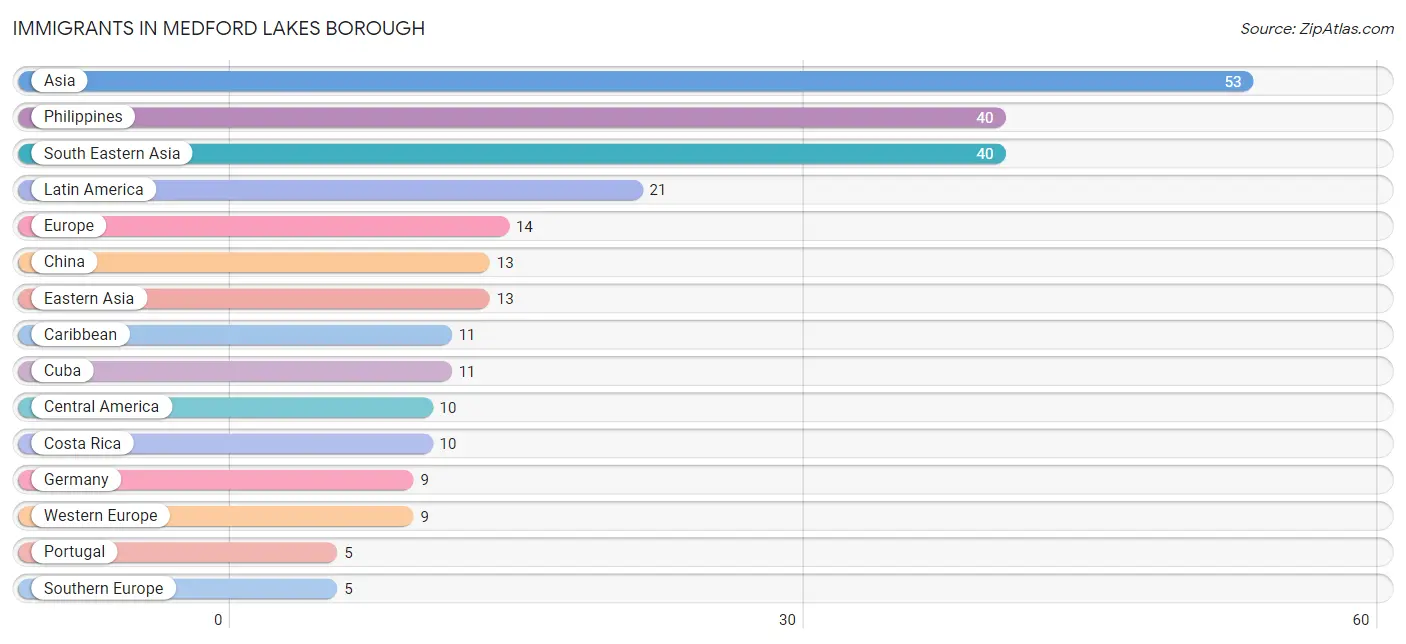
| Immigration Origin | # Population | % Population |
| Asia | 53 | 1.2% |
| Caribbean | 11 | 0.3% |
| Central America | 10 | 0.2% |
| China | 13 | 0.3% |
| Costa Rica | 10 | 0.2% |
| Cuba | 11 | 0.3% |
| Eastern Asia | 13 | 0.3% |
| Europe | 14 | 0.3% |
| Germany | 9 | 0.2% |
| Latin America | 21 | 0.5% |
| Philippines | 40 | 0.9% |
| Portugal | 5 | 0.1% |
| South Eastern Asia | 40 | 0.9% |
| Southern Europe | 5 | 0.1% |
| Western Europe | 9 | 0.2% | View All 15 Rows |
Sex and Age in Medford Lakes borough
Sex and Age in Medford Lakes borough
The most populous age groups in Medford Lakes borough are 55 to 59 Years (204 | 11.0%) for men and 5 to 9 Years (254 | 10.5%) for women.
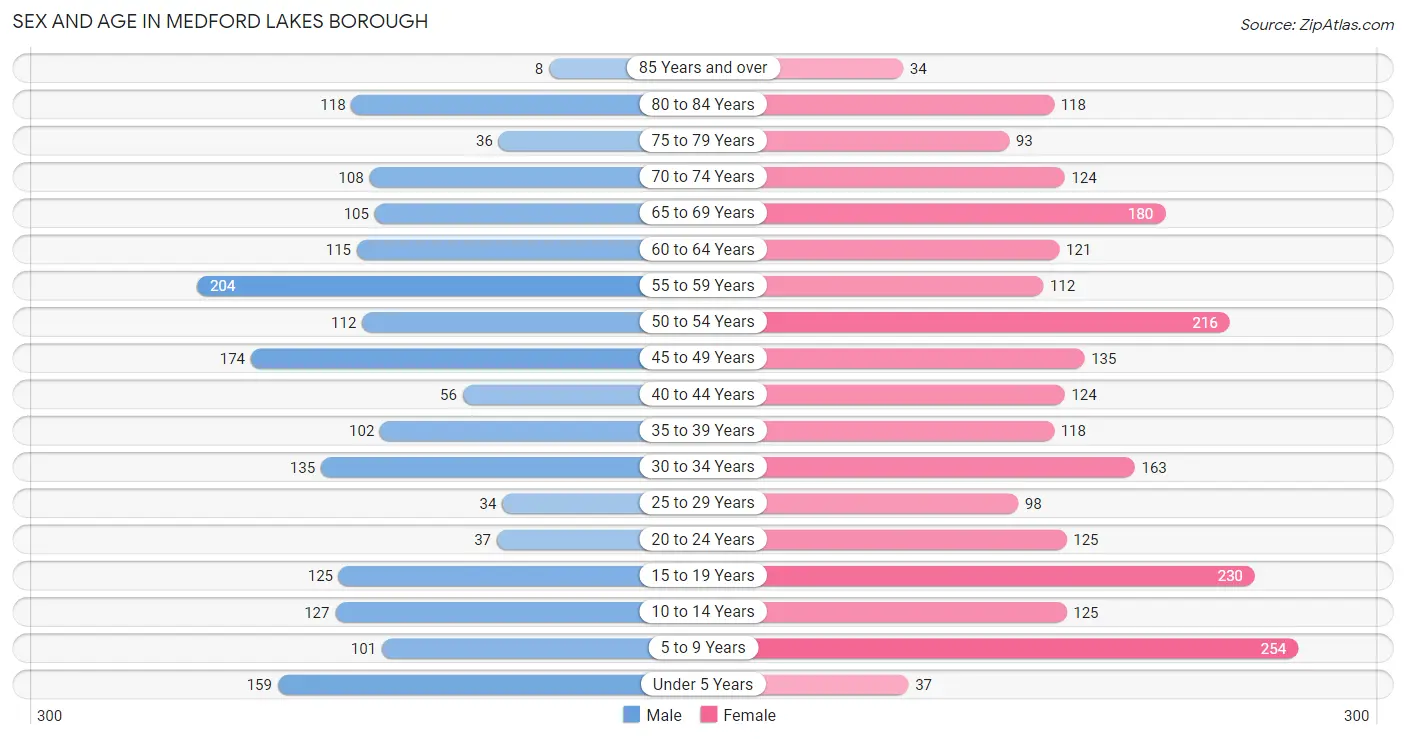
| Age Bracket | Male | Female |
| Under 5 Years | 159 (8.6%) | 37 (1.5%) |
| 5 to 9 Years | 101 (5.4%) | 254 (10.5%) |
| 10 to 14 Years | 127 (6.8%) | 125 (5.2%) |
| 15 to 19 Years | 125 (6.7%) | 230 (9.6%) |
| 20 to 24 Years | 37 (2.0%) | 125 (5.2%) |
| 25 to 29 Years | 34 (1.8%) | 98 (4.1%) |
| 30 to 34 Years | 135 (7.3%) | 163 (6.8%) |
| 35 to 39 Years | 102 (5.5%) | 118 (4.9%) |
| 40 to 44 Years | 56 (3.0%) | 124 (5.1%) |
| 45 to 49 Years | 174 (9.4%) | 135 (5.6%) |
| 50 to 54 Years | 112 (6.0%) | 216 (9.0%) |
| 55 to 59 Years | 204 (11.0%) | 112 (4.6%) |
| 60 to 64 Years | 115 (6.2%) | 121 (5.0%) |
| 65 to 69 Years | 105 (5.7%) | 180 (7.5%) |
| 70 to 74 Years | 108 (5.8%) | 124 (5.1%) |
| 75 to 79 Years | 36 (1.9%) | 93 (3.9%) |
| 80 to 84 Years | 118 (6.4%) | 118 (4.9%) |
| 85 Years and over | 8 (0.4%) | 34 (1.4%) |
| Total | 1,856 (100.0%) | 2,407 (100.0%) |
Families and Households in Medford Lakes borough
Median Family Size in Medford Lakes borough
The median family size in Medford Lakes borough is 3.30 persons per family, with married-couple families (1,021 | 85.4%) accounting for the largest median family size of 3.4 persons per family. On the other hand, single male/father families (69 | 5.8%) represent the smallest median family size with 2.10 persons per family.
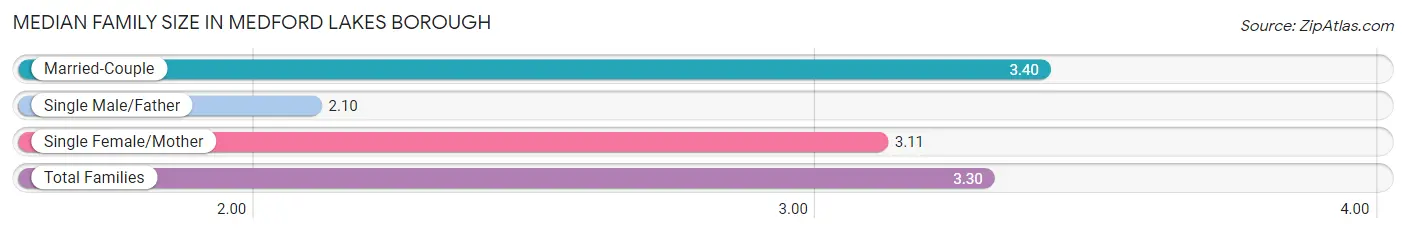
| Family Type | # Families | Family Size |
| Married-Couple | 1,021 (85.4%) | 3.40 |
| Single Male/Father | 69 (5.8%) | 2.10 |
| Single Female/Mother | 105 (8.8%) | 3.11 |
| Total Families | 1,195 (100.0%) | 3.30 |
Median Household Size in Medford Lakes borough
The median household size in Medford Lakes borough is 2.91 persons per household, with married-couple households (1,021 | 69.6%) accounting for the largest median household size of 3.4 persons per household. non-family households (272 | 18.5%) represent the smallest median household size with 1.14 persons per household.
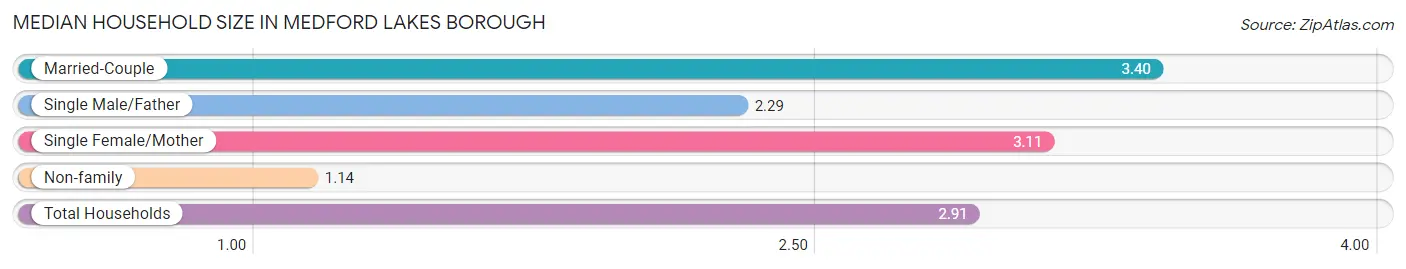
| Household Type | # Households | Household Size |
| Married-Couple | 1,021 (69.6%) | 3.40 |
| Single Male/Father | 69 (4.7%) | 2.29 |
| Single Female/Mother | 105 (7.2%) | 3.11 |
| Non-family | 272 (18.5%) | 1.14 |
| Total Households | 1,467 (100.0%) | 2.91 |
Household Size by Marriage Status in Medford Lakes borough
Out of a total of 1,467 households in Medford Lakes borough, 1,195 (81.5%) are family households, while 272 (18.5%) are nonfamily households. The most numerous type of family households are 2-person households, comprising 436, and the most common type of nonfamily households are 1-person households, comprising 236.
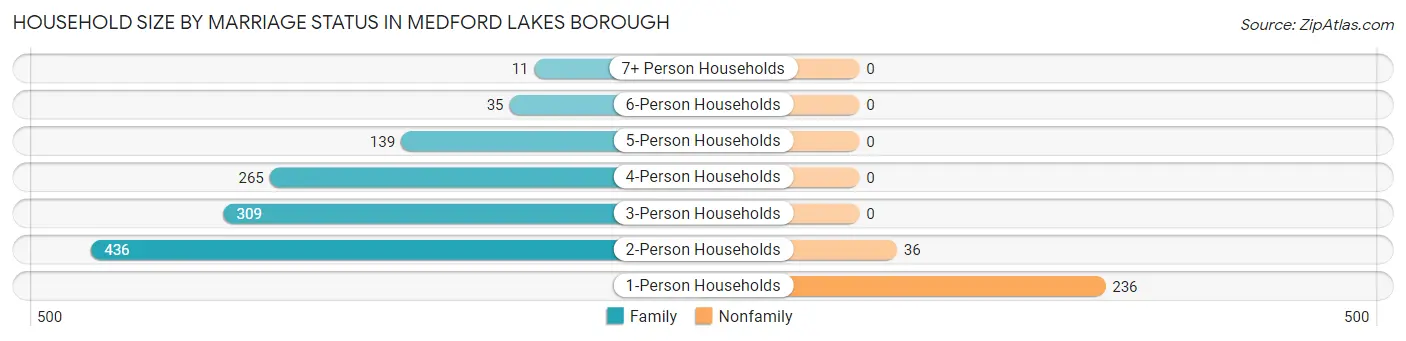
| Household Size | Family Households | Nonfamily Households |
| 1-Person Households | - | 236 (16.1%) |
| 2-Person Households | 436 (29.7%) | 36 (2.5%) |
| 3-Person Households | 309 (21.1%) | 0 (0.0%) |
| 4-Person Households | 265 (18.1%) | 0 (0.0%) |
| 5-Person Households | 139 (9.5%) | 0 (0.0%) |
| 6-Person Households | 35 (2.4%) | 0 (0.0%) |
| 7+ Person Households | 11 (0.7%) | 0 (0.0%) |
| Total | 1,195 (81.5%) | 272 (18.5%) |
Female Fertility in Medford Lakes borough
Fertility by Age in Medford Lakes borough
Average fertility rate in Medford Lakes borough is 17.0 births per 1,000 women. Women in the age bracket of 35 to 50 years have the highest fertility rate with 43.0 births per 1,000 women. Women in the age bracket of 35 to 50 years acount for 100.0% of all women with births.
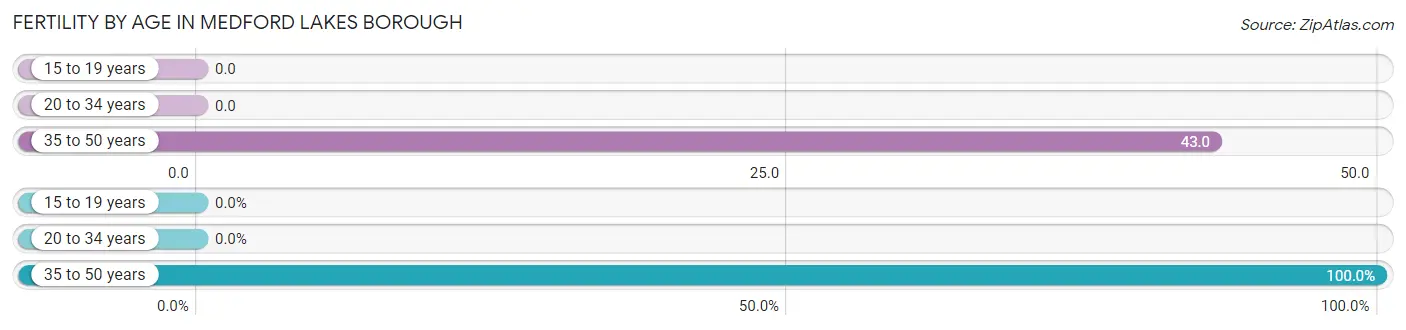
| Age Bracket | Women with Births | Births / 1,000 Women |
| 15 to 19 years | 0 (0.0%) | 0.0 |
| 20 to 34 years | 0 (0.0%) | 0.0 |
| 35 to 50 years | 17 (100.0%) | 43.0 |
| Total | 17 (100.0%) | 17.0 |
Fertility by Age by Marriage Status in Medford Lakes borough
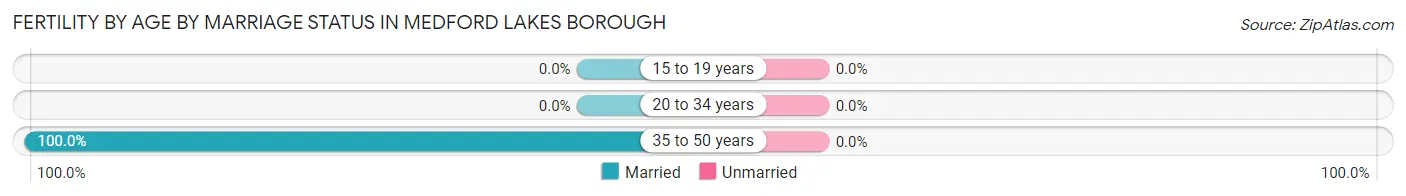
| Age Bracket | Married | Unmarried |
| 15 to 19 years | 0 (0.0%) | 0 (0.0%) |
| 20 to 34 years | 0 (0.0%) | 0 (0.0%) |
| 35 to 50 years | 17 (100.0%) | 0 (0.0%) |
| Total | 17 (100.0%) | 0 (0.0%) |
Fertility by Education in Medford Lakes borough
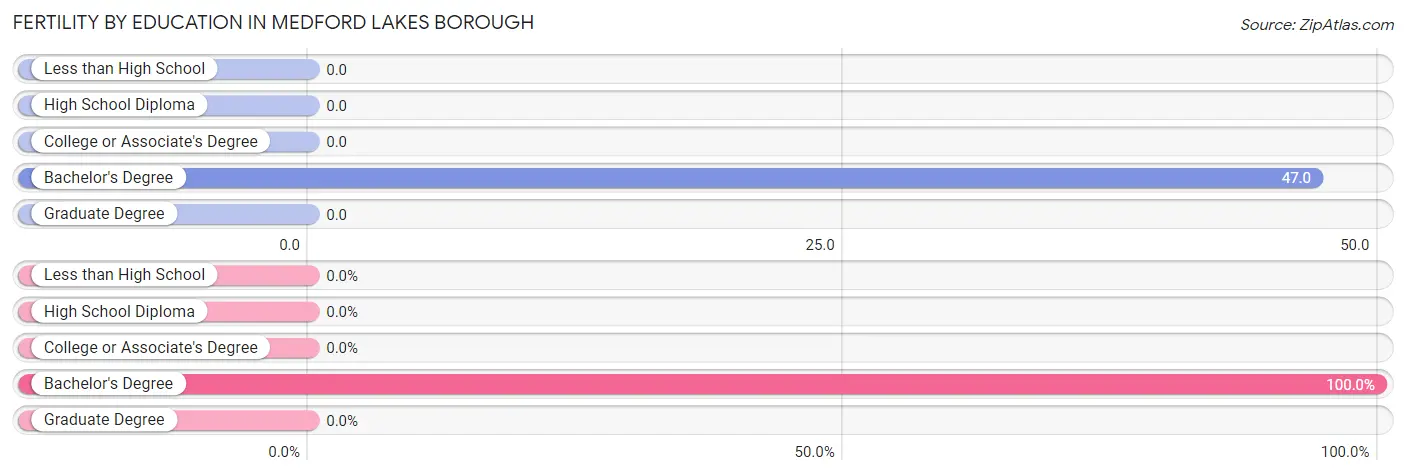
| Educational Attainment | Women with Births | Births / 1,000 Women |
| Less than High School | 0 (0.0%) | 0.0 |
| High School Diploma | 0 (0.0%) | 0.0 |
| College or Associate's Degree | 0 (0.0%) | 0.0 |
| Bachelor's Degree | 17 (100.0%) | 47.0 |
| Graduate Degree | 0 (0.0%) | 0.0 |
| Total | 17 (100.0%) | 17.0 |
Fertility by Education by Marriage Status in Medford Lakes borough
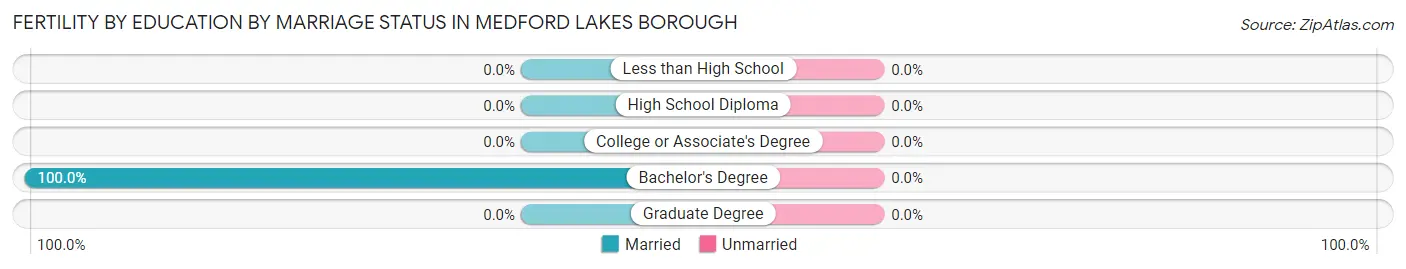
| Educational Attainment | Married | Unmarried |
| Less than High School | 0 (0.0%) | 0 (0.0%) |
| High School Diploma | 0 (0.0%) | 0 (0.0%) |
| College or Associate's Degree | 0 (0.0%) | 0 (0.0%) |
| Bachelor's Degree | 17 (100.0%) | 0 (0.0%) |
| Graduate Degree | 0 (0.0%) | 0 (0.0%) |
| Total | 17 (100.0%) | 0 (0.0%) |
Income in Medford Lakes borough
Income Overview in Medford Lakes borough
Per Capita Income in Medford Lakes borough is $59,215, while median incomes of families and households are $157,434 and $139,879 respectively.
| Characteristic | Number | Measure |
| Per Capita Income | 4,263 | $59,215 |
| Median Family Income | 1,195 | $157,434 |
| Mean Family Income | 1,195 | $187,270 |
| Median Household Income | 1,467 | $139,879 |
| Mean Household Income | 1,467 | $168,020 |
| Income Deficit | 1,195 | $0 |
| Wage / Income Gap (%) | 4,263 | 59.95% |
| Wage / Income Gap ($) | 4,263 | 40.05¢ per $1 |
| Gini / Inequality Index | 4,263 | 0.37 |
Earnings by Sex in Medford Lakes borough
Average Earnings in Medford Lakes borough are $66,080, $92,442 for men and $37,019 for women, a difference of 60.0%.
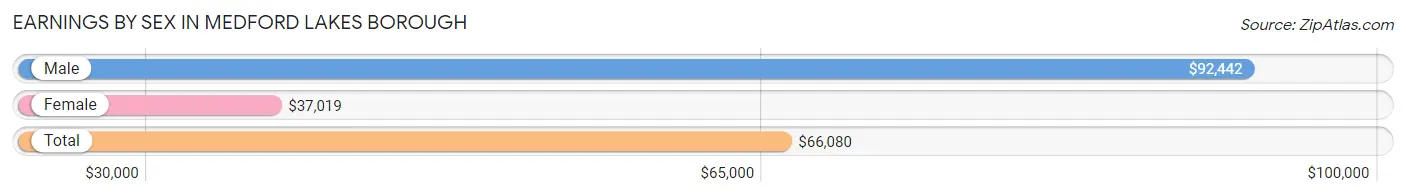
| Sex | Number | Average Earnings |
| Male | 1,044 (45.2%) | $92,442 |
| Female | 1,264 (54.8%) | $37,019 |
| Total | 2,308 (100.0%) | $66,080 |
Earnings by Sex by Income Bracket in Medford Lakes borough
The most common earnings brackets in Medford Lakes borough are $100,000+ for men (455 | 43.6%) and $100,000+ for women (296 | 23.4%).
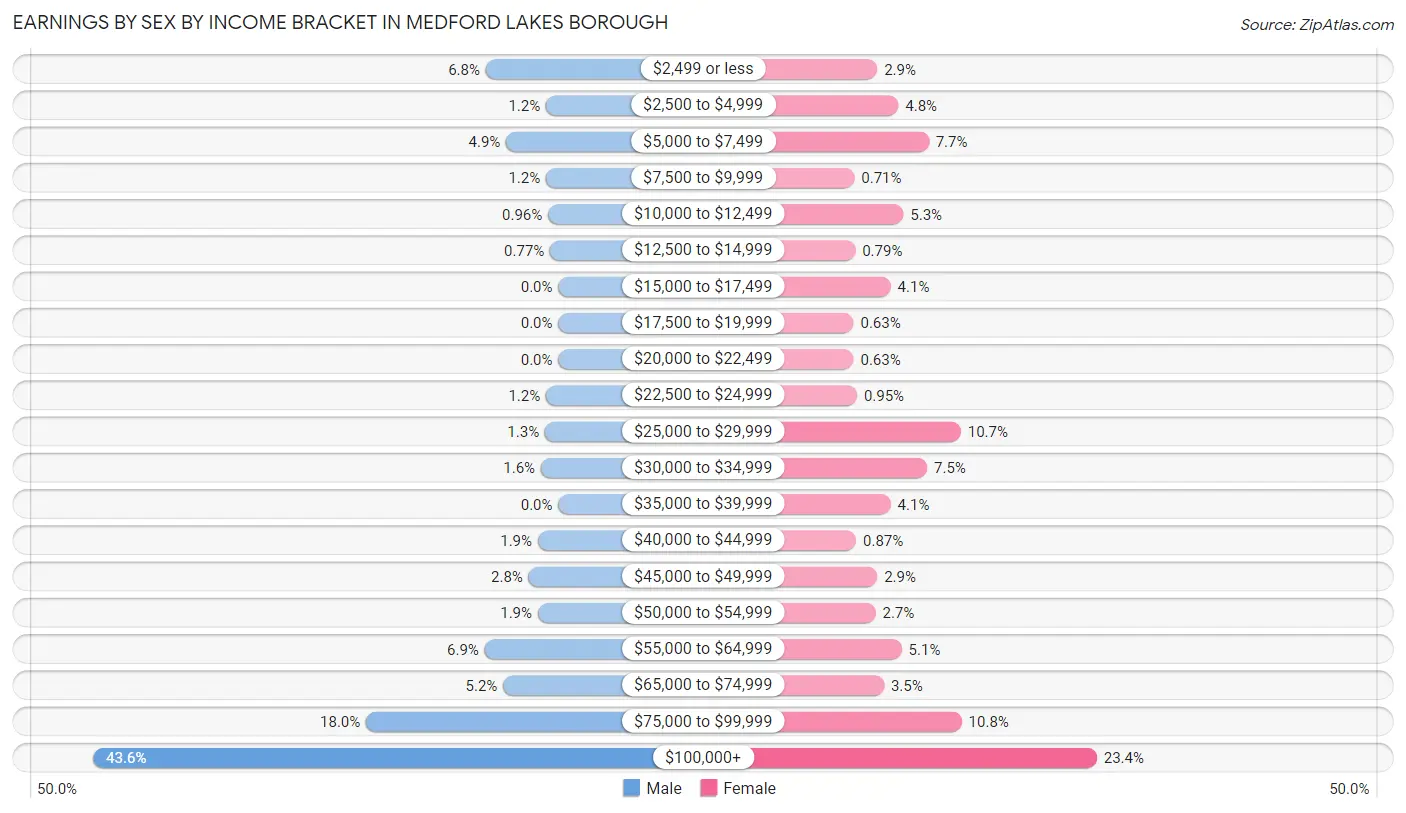
| Income | Male | Female |
| $2,499 or less | 71 (6.8%) | 36 (2.9%) |
| $2,500 to $4,999 | 12 (1.1%) | 61 (4.8%) |
| $5,000 to $7,499 | 51 (4.9%) | 97 (7.7%) |
| $7,500 to $9,999 | 12 (1.1%) | 9 (0.7%) |
| $10,000 to $12,499 | 10 (1.0%) | 67 (5.3%) |
| $12,500 to $14,999 | 8 (0.8%) | 10 (0.8%) |
| $15,000 to $17,499 | 0 (0.0%) | 52 (4.1%) |
| $17,500 to $19,999 | 0 (0.0%) | 8 (0.6%) |
| $20,000 to $22,499 | 0 (0.0%) | 8 (0.6%) |
| $22,500 to $24,999 | 12 (1.1%) | 12 (0.9%) |
| $25,000 to $29,999 | 13 (1.3%) | 135 (10.7%) |
| $30,000 to $34,999 | 17 (1.6%) | 95 (7.5%) |
| $35,000 to $39,999 | 0 (0.0%) | 52 (4.1%) |
| $40,000 to $44,999 | 20 (1.9%) | 11 (0.9%) |
| $45,000 to $49,999 | 29 (2.8%) | 36 (2.9%) |
| $50,000 to $54,999 | 20 (1.9%) | 34 (2.7%) |
| $55,000 to $64,999 | 72 (6.9%) | 65 (5.1%) |
| $65,000 to $74,999 | 54 (5.2%) | 44 (3.5%) |
| $75,000 to $99,999 | 188 (18.0%) | 136 (10.8%) |
| $100,000+ | 455 (43.6%) | 296 (23.4%) |
| Total | 1,044 (100.0%) | 1,264 (100.0%) |
Earnings by Sex by Educational Attainment in Medford Lakes borough
Average earnings in Medford Lakes borough are $97,381 for men and $53,207 for women, a difference of 45.4%. Men with an educational attainment of graduate degree enjoy the highest average annual earnings of $140,635, while those with college or associate's degree education earn the least with $76,250. Women with an educational attainment of graduate degree earn the most with the average annual earnings of $135,278, while those with college or associate's degree education have the smallest earnings of $27,330.
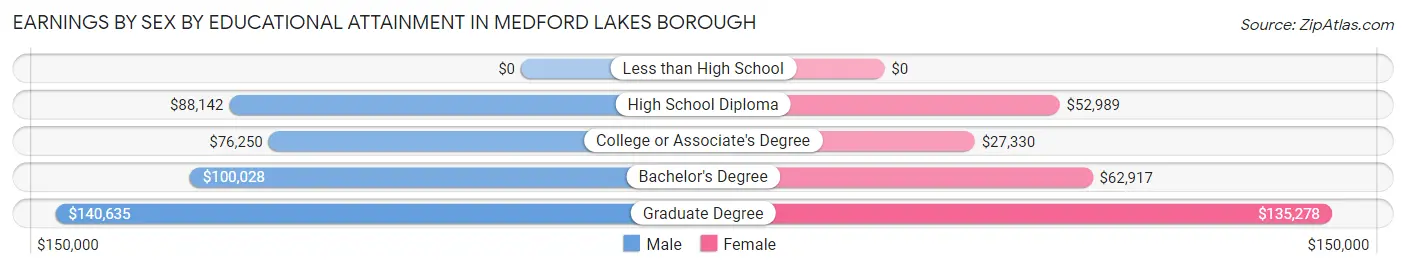
| Educational Attainment | Male Income | Female Income |
| Less than High School | - | - |
| High School Diploma | $88,142 | $52,989 |
| College or Associate's Degree | $76,250 | $27,330 |
| Bachelor's Degree | $100,028 | $62,917 |
| Graduate Degree | $140,635 | $135,278 |
| Total | $97,381 | $53,207 |
Family Income in Medford Lakes borough
Family Income Brackets in Medford Lakes borough
According to the Medford Lakes borough family income data, there are 411 families falling into the $200,000+ income range, which is the most common income bracket and makes up 34.4% of all families.
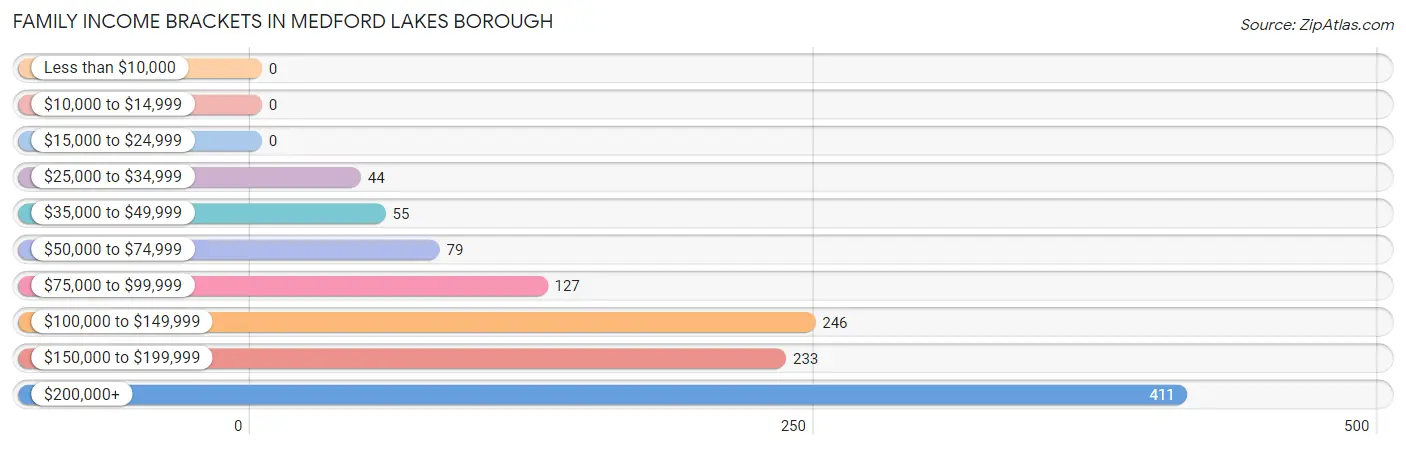
| Income Bracket | # Families | % Families |
| Less than $10,000 | 0 | 0.0% |
| $10,000 to $14,999 | 0 | 0.0% |
| $15,000 to $24,999 | 0 | 0.0% |
| $25,000 to $34,999 | 44 | 3.7% |
| $35,000 to $49,999 | 55 | 4.6% |
| $50,000 to $74,999 | 79 | 6.6% |
| $75,000 to $99,999 | 127 | 10.6% |
| $100,000 to $149,999 | 246 | 20.6% |
| $150,000 to $199,999 | 233 | 19.5% |
| $200,000+ | 411 | 34.4% |
Family Income by Famaliy Size in Medford Lakes borough
4-person families (265 | 22.2%) account for the highest median family income in Medford Lakes borough with $216,639 per family, while 4-person families (265 | 22.2%) have the highest median income of $54,160 per family member.
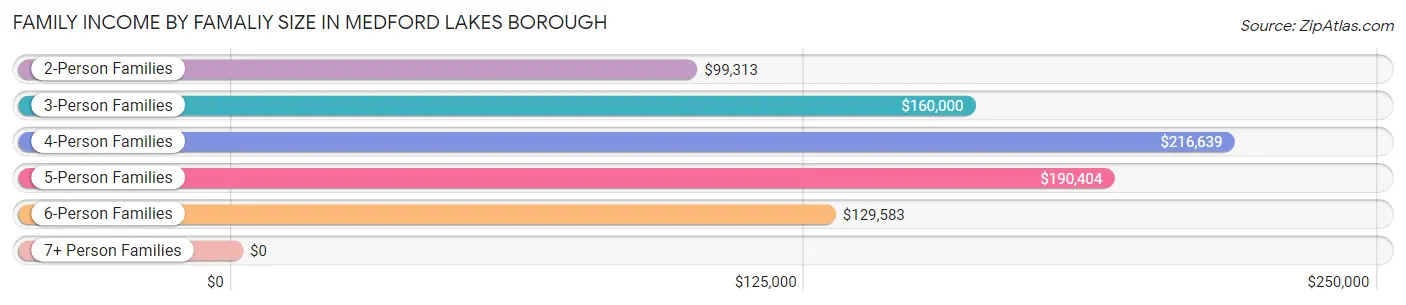
| Income Bracket | # Families | Median Income |
| 2-Person Families | 447 (37.4%) | $99,313 |
| 3-Person Families | 298 (24.9%) | $160,000 |
| 4-Person Families | 265 (22.2%) | $216,639 |
| 5-Person Families | 139 (11.6%) | $190,404 |
| 6-Person Families | 35 (2.9%) | $129,583 |
| 7+ Person Families | 11 (0.9%) | $0 |
| Total | 1,195 (100.0%) | $157,434 |
Family Income by Number of Earners in Medford Lakes borough
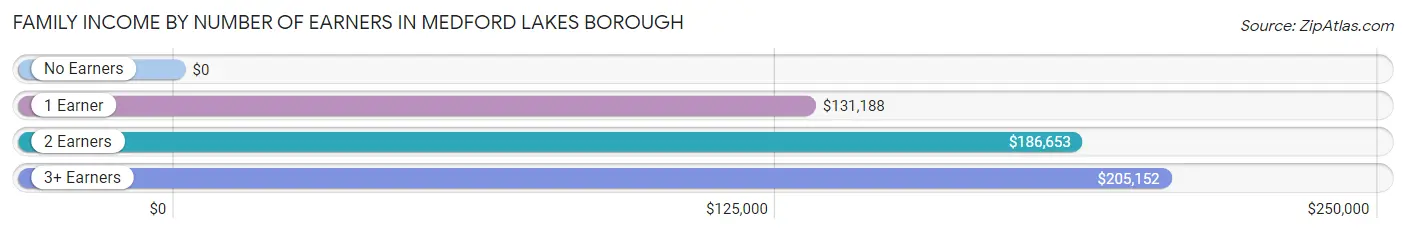
| Number of Earners | # Families | Median Income |
| No Earners | 147 (12.3%) | $0 |
| 1 Earner | 317 (26.5%) | $131,188 |
| 2 Earners | 441 (36.9%) | $186,653 |
| 3+ Earners | 290 (24.3%) | $205,152 |
| Total | 1,195 (100.0%) | $157,434 |
Household Income in Medford Lakes borough
Household Income Brackets in Medford Lakes borough
With 411 households falling in the category, the $200,000+ income range is the most frequent in Medford Lakes borough, accounting for 28.0% of all households.
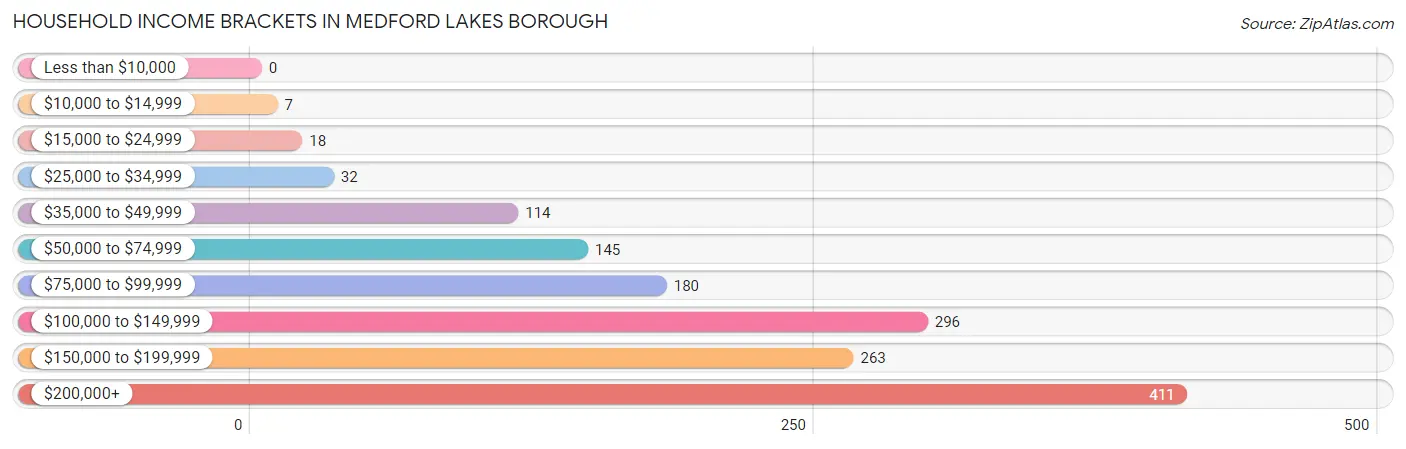
| Income Bracket | # Households | % Households |
| Less than $10,000 | 0 | 0.0% |
| $10,000 to $14,999 | 7 | 0.5% |
| $15,000 to $24,999 | 18 | 1.2% |
| $25,000 to $34,999 | 32 | 2.2% |
| $35,000 to $49,999 | 114 | 7.8% |
| $50,000 to $74,999 | 145 | 9.9% |
| $75,000 to $99,999 | 180 | 12.3% |
| $100,000 to $149,999 | 296 | 20.2% |
| $150,000 to $199,999 | 263 | 17.9% |
| $200,000+ | 411 | 28.0% |
Household Income by Householder Age in Medford Lakes borough
The median household income in Medford Lakes borough is $139,879, with the highest median household income of $179,063 found in the 25 to 44 years age bracket for the primary householder. A total of 342 households (23.3%) fall into this category. Meanwhile, the 15 to 24 years age bracket for the primary householder has the lowest median household income of $0, with 11 households (0.7%) in this group.
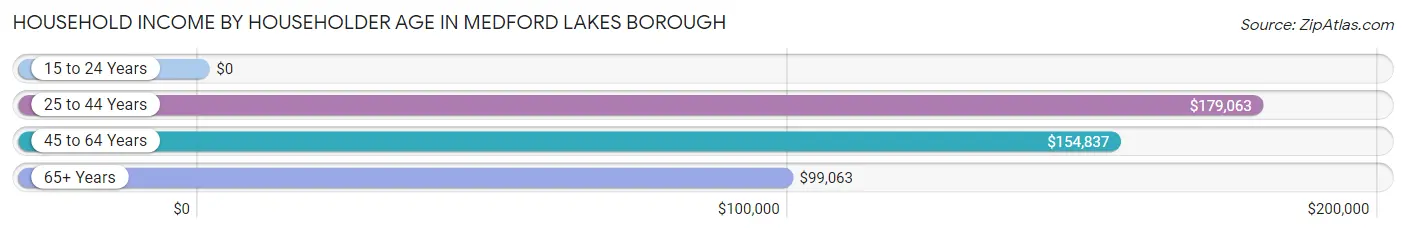
| Income Bracket | # Households | Median Income |
| 15 to 24 Years | 11 (0.7%) | $0 |
| 25 to 44 Years | 342 (23.3%) | $179,063 |
| 45 to 64 Years | 623 (42.5%) | $154,837 |
| 65+ Years | 491 (33.5%) | $99,063 |
| Total | 1,467 (100.0%) | $139,879 |
Poverty in Medford Lakes borough
Income Below Poverty by Sex and Age in Medford Lakes borough
With 0.4% poverty level for males and 0.3% for females among the residents of Medford Lakes borough, 75 year old and over males and 75 year old and over females are the most vulnerable to poverty, with 8 males (4.9%) and 7 females (2.9%) in their respective age groups living below the poverty level.
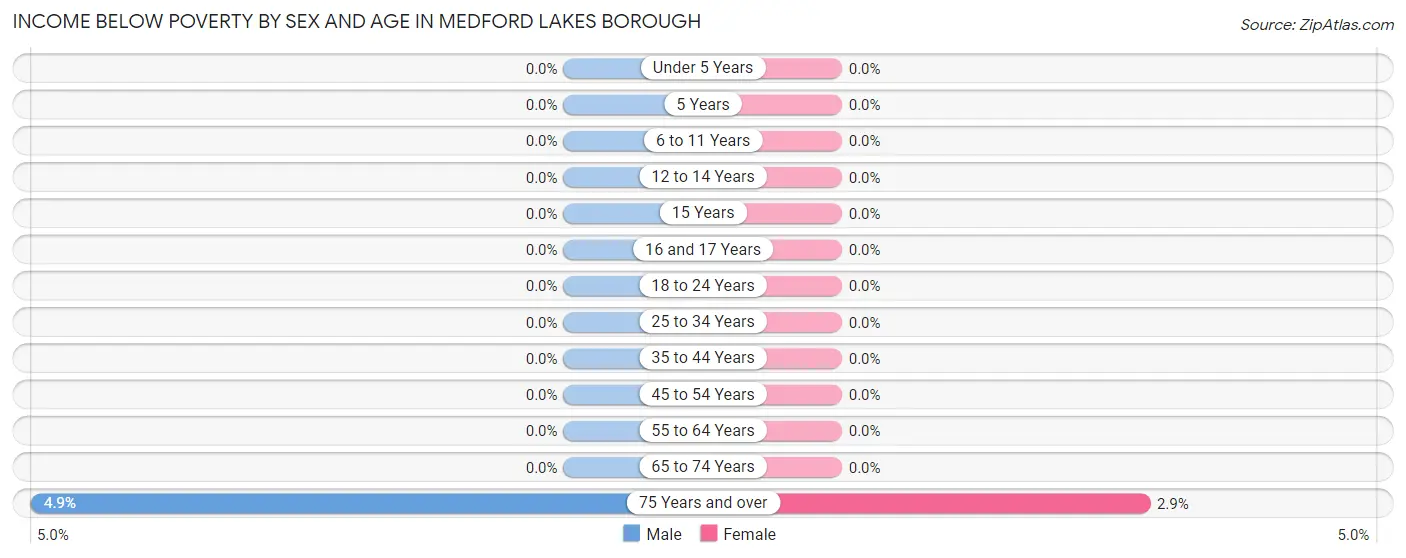
| Age Bracket | Male | Female |
| Under 5 Years | 0 (0.0%) | 0 (0.0%) |
| 5 Years | 0 (0.0%) | 0 (0.0%) |
| 6 to 11 Years | 0 (0.0%) | 0 (0.0%) |
| 12 to 14 Years | 0 (0.0%) | 0 (0.0%) |
| 15 Years | 0 (0.0%) | 0 (0.0%) |
| 16 and 17 Years | 0 (0.0%) | 0 (0.0%) |
| 18 to 24 Years | 0 (0.0%) | 0 (0.0%) |
| 25 to 34 Years | 0 (0.0%) | 0 (0.0%) |
| 35 to 44 Years | 0 (0.0%) | 0 (0.0%) |
| 45 to 54 Years | 0 (0.0%) | 0 (0.0%) |
| 55 to 64 Years | 0 (0.0%) | 0 (0.0%) |
| 65 to 74 Years | 0 (0.0%) | 0 (0.0%) |
| 75 Years and over | 8 (4.9%) | 7 (2.9%) |
| Total | 8 (0.4%) | 7 (0.3%) |
Income Above Poverty by Sex and Age in Medford Lakes borough
According to the poverty statistics in Medford Lakes borough, males aged under 5 years and females aged under 5 years are the age groups that are most secure financially, with 100.0% of males and 100.0% of females in these age groups living above the poverty line.
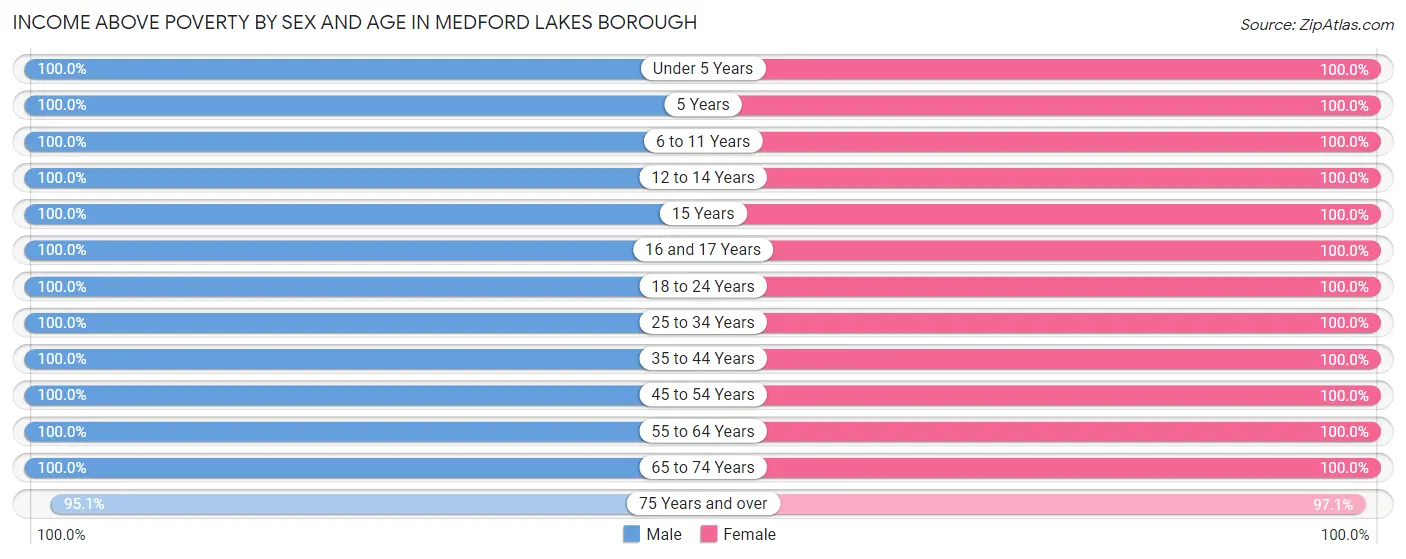
| Age Bracket | Male | Female |
| Under 5 Years | 159 (100.0%) | 37 (100.0%) |
| 5 Years | 7 (100.0%) | 44 (100.0%) |
| 6 to 11 Years | 125 (100.0%) | 264 (100.0%) |
| 12 to 14 Years | 96 (100.0%) | 71 (100.0%) |
| 15 Years | 37 (100.0%) | 27 (100.0%) |
| 16 and 17 Years | 88 (100.0%) | 96 (100.0%) |
| 18 to 24 Years | 37 (100.0%) | 232 (100.0%) |
| 25 to 34 Years | 169 (100.0%) | 261 (100.0%) |
| 35 to 44 Years | 158 (100.0%) | 242 (100.0%) |
| 45 to 54 Years | 286 (100.0%) | 351 (100.0%) |
| 55 to 64 Years | 319 (100.0%) | 233 (100.0%) |
| 65 to 74 Years | 213 (100.0%) | 304 (100.0%) |
| 75 Years and over | 154 (95.1%) | 238 (97.1%) |
| Total | 1,848 (99.6%) | 2,400 (99.7%) |
Income Below Poverty Among Married-Couple Families in Medford Lakes borough
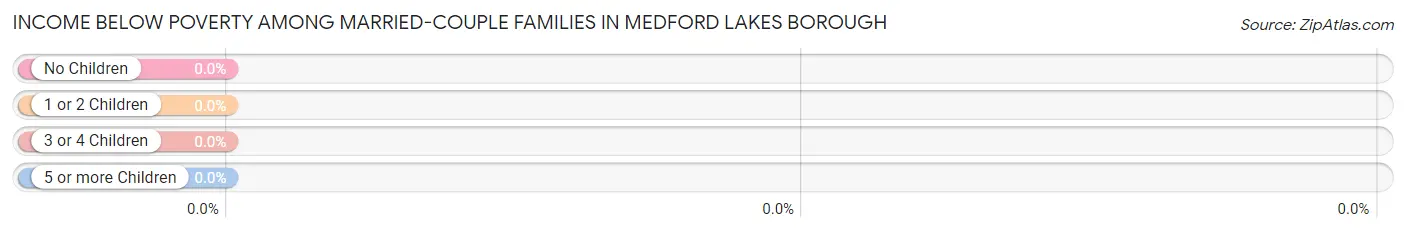
| Children | Above Poverty | Below Poverty |
| No Children | 521 (100.0%) | 0 (0.0%) |
| 1 or 2 Children | 435 (100.0%) | 0 (0.0%) |
| 3 or 4 Children | 54 (100.0%) | 0 (0.0%) |
| 5 or more Children | 11 (100.0%) | 0 (0.0%) |
| Total | 1,021 (100.0%) | 0 (0.0%) |
Income Below Poverty Among Single-Parent Households in Medford Lakes borough
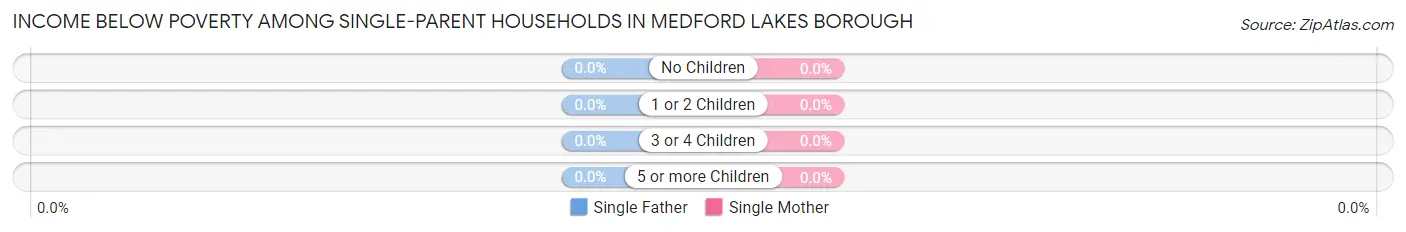
| Children | Single Father | Single Mother |
| No Children | 0 (0.0%) | 0 (0.0%) |
| 1 or 2 Children | 0 (0.0%) | 0 (0.0%) |
| 3 or 4 Children | 0 (0.0%) | 0 (0.0%) |
| 5 or more Children | 0 (0.0%) | 0 (0.0%) |
| Total | 0 (0.0%) | 0 (0.0%) |
Income Below Poverty Among Married-Couple vs Single-Parent Households in Medford Lakes borough
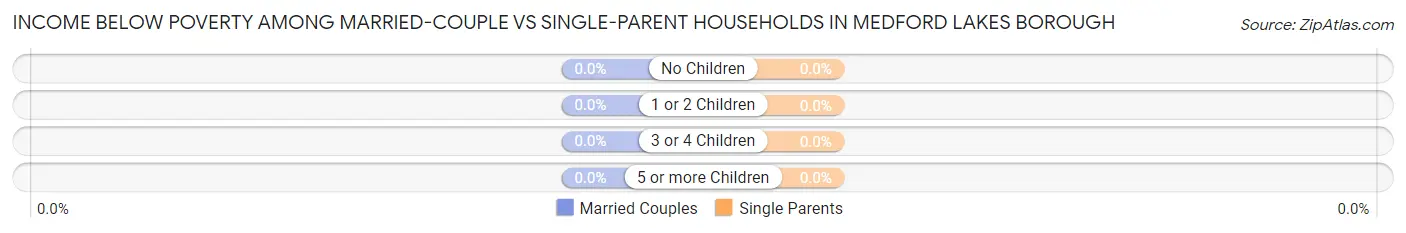
| Children | Married-Couple Families | Single-Parent Households |
| No Children | 0 (0.0%) | 0 (0.0%) |
| 1 or 2 Children | 0 (0.0%) | 0 (0.0%) |
| 3 or 4 Children | 0 (0.0%) | 0 (0.0%) |
| 5 or more Children | 0 (0.0%) | 0 (0.0%) |
| Total | 0 (0.0%) | 0 (0.0%) |
Employment Characteristics in Medford Lakes borough
Employment by Class of Employer in Medford Lakes borough
Among the 2,092 employed individuals in Medford Lakes borough, private company employees (1,270 | 60.7%), not-for-profit organizations (186 | 8.9%), and self-employed (incorporated) (164 | 7.8%) make up the most common classes of employment.
| Employer Class | # Employees | % Employees |
| Private Company Employees | 1,270 | 60.7% |
| Self-Employed (Incorporated) | 164 | 7.8% |
| Self-Employed (Not Incorporated) | 145 | 6.9% |
| Not-for-profit Organizations | 186 | 8.9% |
| Local Government Employees | 145 | 6.9% |
| State Government Employees | 110 | 5.3% |
| Federal Government Employees | 72 | 3.4% |
| Unpaid Family Workers | 0 | 0.0% |
| Total | 2,092 | 100.0% |
Employment Status by Age in Medford Lakes borough
According to the labor force statistics for Medford Lakes borough, out of the total population over 16 years of age (3,396), 63.8% or 2,167 individuals are in the labor force, with 3.4% or 74 of them unemployed. The age group with the highest labor force participation rate is 45 to 54 years, with 100.0% or 637 individuals in the labor force. Within the labor force, the 75 years and over age range has the highest percentage of unemployed individuals, with 100.0% or 10 of them being unemployed.
| Age Bracket | In Labor Force | Unemployed |
| 16 to 19 Years | 88 (30.2%) | 0 (0.0%) |
| 20 to 24 Years | 146 (90.1%) | 19 (13.0%) |
| 25 to 29 Years | 89 (67.4%) | 0 (0.0%) |
| 30 to 34 Years | 283 (95.0%) | 0 (0.0%) |
| 35 to 44 Years | 326 (81.5%) | 0 (0.0%) |
| 45 to 54 Years | 637 (100.0%) | 0 (0.0%) |
| 55 to 59 Years | 268 (84.8%) | 13 (4.9%) |
| 60 to 64 Years | 103 (43.6%) | 20 (19.4%) |
| 65 to 74 Years | 216 (41.8%) | 12 (5.6%) |
| 75 Years and over | 10 (2.5%) | 10 (100.0%) |
| Total | 2,167 (63.8%) | 74 (3.4%) |
Employment Status by Educational Attainment in Medford Lakes borough
According to labor force statistics for Medford Lakes borough, 84.5% of individuals (1,706) out of the total population between 25 and 64 years of age (2,019) are in the labor force, with 1.9% or 32 of them being unemployed. The group with the highest labor force participation rate are those with the educational attainment of less than high school, with 100.0% or 5 individuals in the labor force. Within the labor force, individuals with high school diploma education have the highest percentage of unemployment, with 5.3% or 8 of them being unemployed.
| Educational Attainment | In Labor Force | Unemployed |
| Less than High School | 5 (100.0%) | 0 (0.0%) |
| High School Diploma | 152 (85.4%) | 9 (5.3%) |
| College / Associate Degree | 570 (87.8%) | 0 (0.0%) |
| Bachelor's Degree or higher | 979 (82.5%) | 31 (2.6%) |
| Total | 1,706 (84.5%) | 38 (1.9%) |
Employment Occupations by Sex in Medford Lakes borough
Management, Business, Science and Arts Occupations
The most common Management, Business, Science and Arts occupations in Medford Lakes borough are Management (321 | 15.3%), Community & Social Service (286 | 13.7%), Health Diagnosing & Treating (233 | 11.1%), Business & Financial (193 | 9.2%), and Education Instruction & Library (188 | 9.0%).
Management, Business, Science and Arts Occupations by Sex
Within the Management, Business, Science and Arts occupations in Medford Lakes borough, the most male-oriented occupations are Architecture & Engineering (100.0%), Life, Physical & Social Science (100.0%), and Computers, Engineering & Science (82.8%), while the most female-oriented occupations are Legal Services & Support (100.0%), Health Diagnosing & Treating (81.1%), and Education Instruction & Library (80.8%).
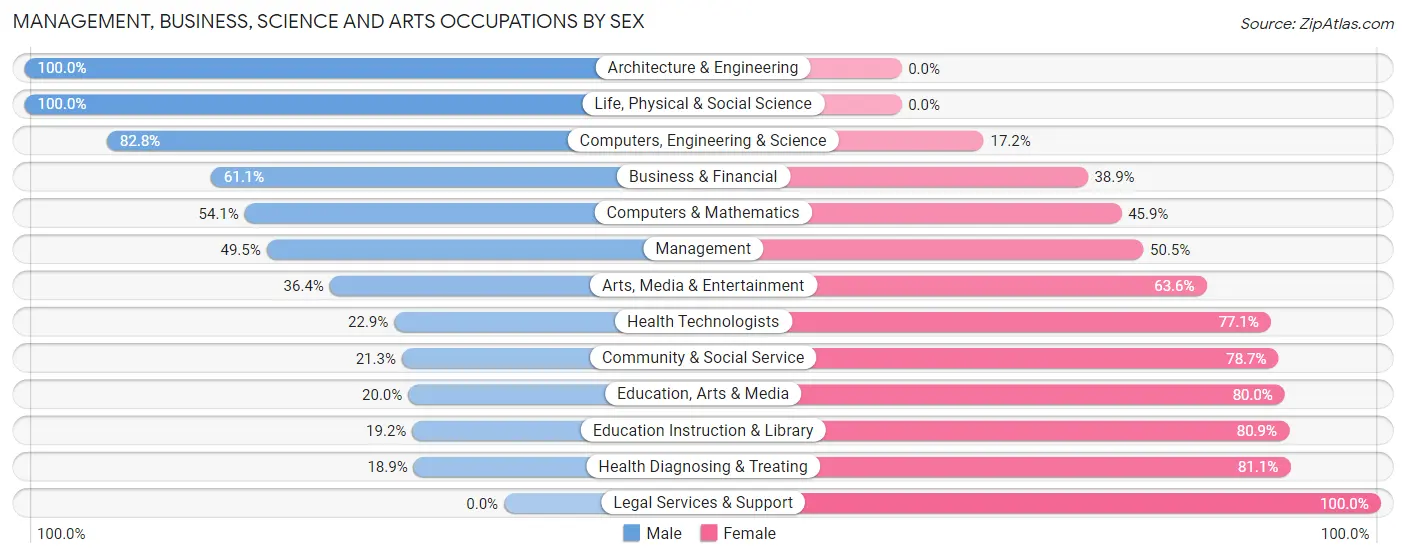
| Occupation | Male | Female |
| Management | 159 (49.5%) | 162 (50.5%) |
| Business & Financial | 118 (61.1%) | 75 (38.9%) |
| Computers, Engineering & Science | 135 (82.8%) | 28 (17.2%) |
| Computers & Mathematics | 33 (54.1%) | 28 (45.9%) |
| Architecture & Engineering | 37 (100.0%) | 0 (0.0%) |
| Life, Physical & Social Science | 65 (100.0%) | 0 (0.0%) |
| Community & Social Service | 61 (21.3%) | 225 (78.7%) |
| Education, Arts & Media | 9 (20.0%) | 36 (80.0%) |
| Legal Services & Support | 0 (0.0%) | 9 (100.0%) |
| Education Instruction & Library | 36 (19.2%) | 152 (80.8%) |
| Arts, Media & Entertainment | 16 (36.4%) | 28 (63.6%) |
| Health Diagnosing & Treating | 44 (18.9%) | 189 (81.1%) |
| Health Technologists | 33 (22.9%) | 111 (77.1%) |
| Total (Category) | 517 (43.2%) | 679 (56.8%) |
| Total (Overall) | 961 (45.9%) | 1,131 (54.1%) |
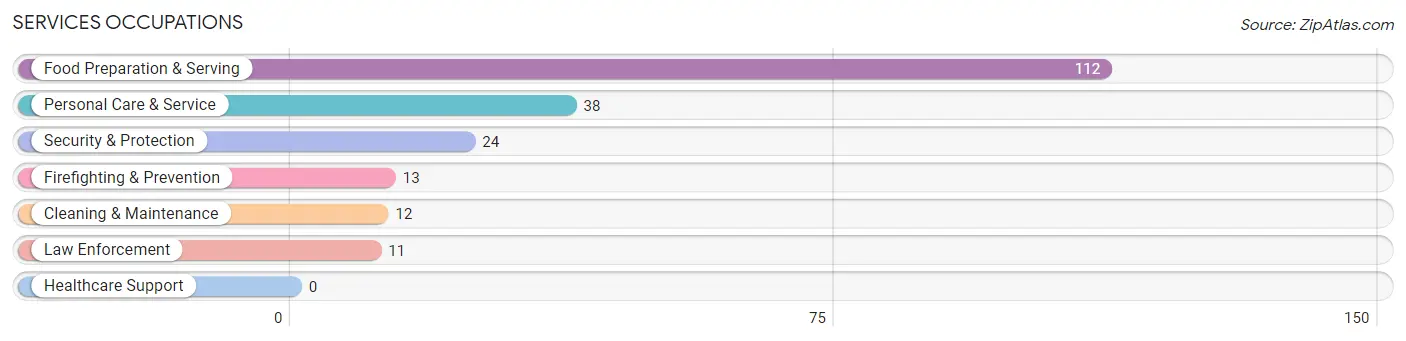
Services Occupations
The most common Services occupations in Medford Lakes borough are Food Preparation & Serving (112 | 5.3%), Personal Care & Service (38 | 1.8%), Security & Protection (24 | 1.1%), Firefighting & Prevention (13 | 0.6%), and Cleaning & Maintenance (12 | 0.6%).
Services Occupations by Sex
Within the Services occupations in Medford Lakes borough, the most male-oriented occupations are Security & Protection (100.0%), Firefighting & Prevention (100.0%), and Law Enforcement (100.0%), while the most female-oriented occupations are Personal Care & Service (100.0%), and Food Preparation & Serving (61.6%).
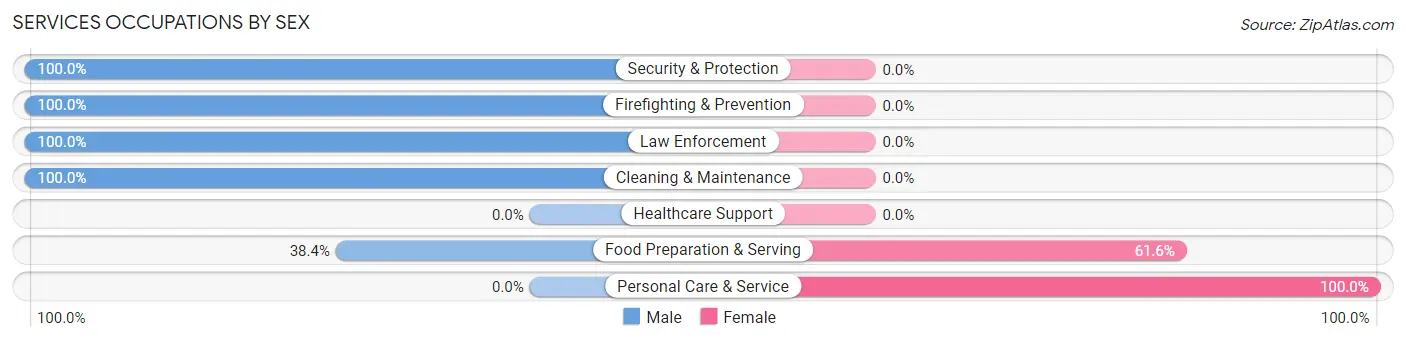
| Occupation | Male | Female |
| Healthcare Support | 0 (0.0%) | 0 (0.0%) |
| Security & Protection | 24 (100.0%) | 0 (0.0%) |
| Firefighting & Prevention | 13 (100.0%) | 0 (0.0%) |
| Law Enforcement | 11 (100.0%) | 0 (0.0%) |
| Food Preparation & Serving | 43 (38.4%) | 69 (61.6%) |
| Cleaning & Maintenance | 12 (100.0%) | 0 (0.0%) |
| Personal Care & Service | 0 (0.0%) | 38 (100.0%) |
| Total (Category) | 79 (42.5%) | 107 (57.5%) |
| Total (Overall) | 961 (45.9%) | 1,131 (54.1%) |
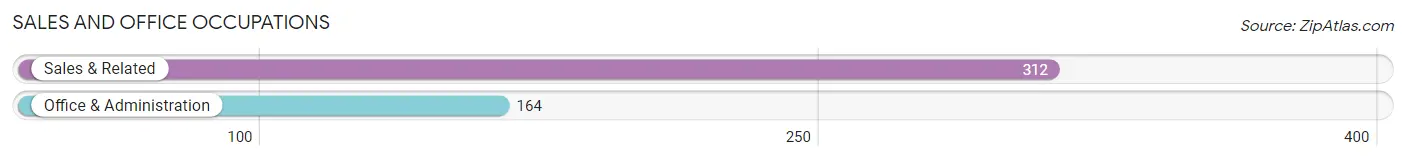
Sales and Office Occupations
The most common Sales and Office occupations in Medford Lakes borough are Sales & Related (312 | 14.9%), and Office & Administration (164 | 7.8%).
Sales and Office Occupations by Sex
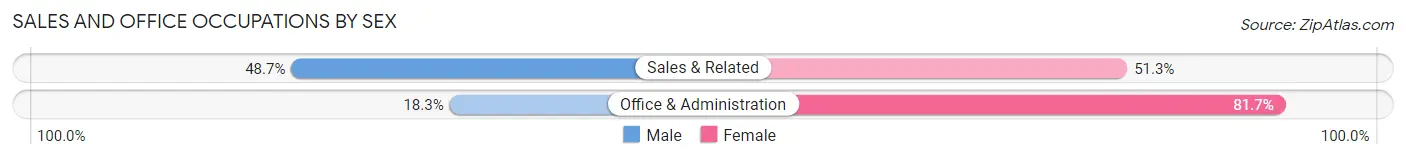
| Occupation | Male | Female |
| Sales & Related | 152 (48.7%) | 160 (51.3%) |
| Office & Administration | 30 (18.3%) | 134 (81.7%) |
| Total (Category) | 182 (38.2%) | 294 (61.8%) |
| Total (Overall) | 961 (45.9%) | 1,131 (54.1%) |
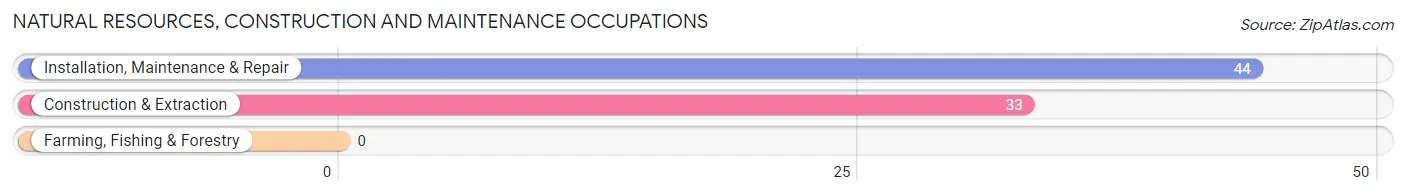
Natural Resources, Construction and Maintenance Occupations
The most common Natural Resources, Construction and Maintenance occupations in Medford Lakes borough are Installation, Maintenance & Repair (44 | 2.1%), and Construction & Extraction (33 | 1.6%).
Natural Resources, Construction and Maintenance Occupations by Sex
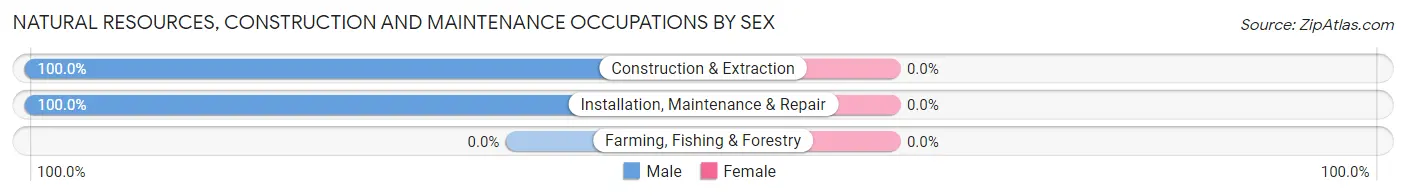
| Occupation | Male | Female |
| Farming, Fishing & Forestry | 0 (0.0%) | 0 (0.0%) |
| Construction & Extraction | 33 (100.0%) | 0 (0.0%) |
| Installation, Maintenance & Repair | 44 (100.0%) | 0 (0.0%) |
| Total (Category) | 77 (100.0%) | 0 (0.0%) |
| Total (Overall) | 961 (45.9%) | 1,131 (54.1%) |
Production, Transportation and Moving Occupations
The most common Production, Transportation and Moving occupations in Medford Lakes borough are Production (78 | 3.7%), Transportation (65 | 3.1%), and Material Moving (14 | 0.7%).
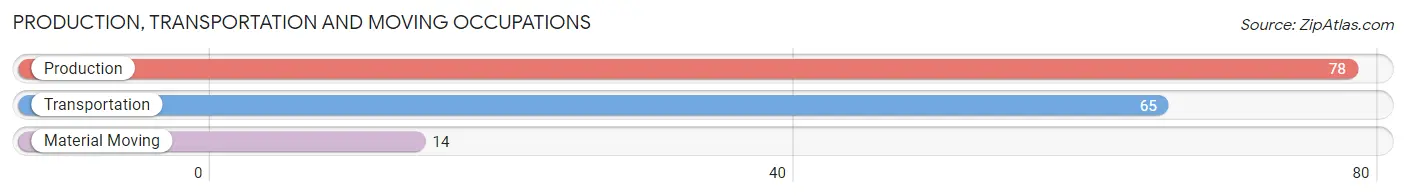
Production, Transportation and Moving Occupations by Sex
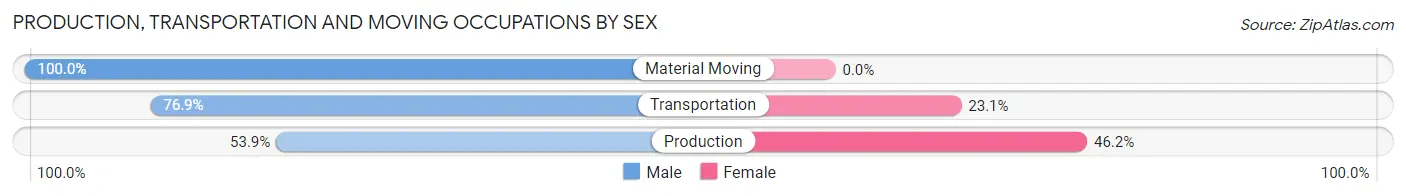
| Occupation | Male | Female |
| Production | 42 (53.8%) | 36 (46.2%) |
| Transportation | 50 (76.9%) | 15 (23.1%) |
| Material Moving | 14 (100.0%) | 0 (0.0%) |
| Total (Category) | 106 (67.5%) | 51 (32.5%) |
| Total (Overall) | 961 (45.9%) | 1,131 (54.1%) |
Employment Industries by Sex in Medford Lakes borough
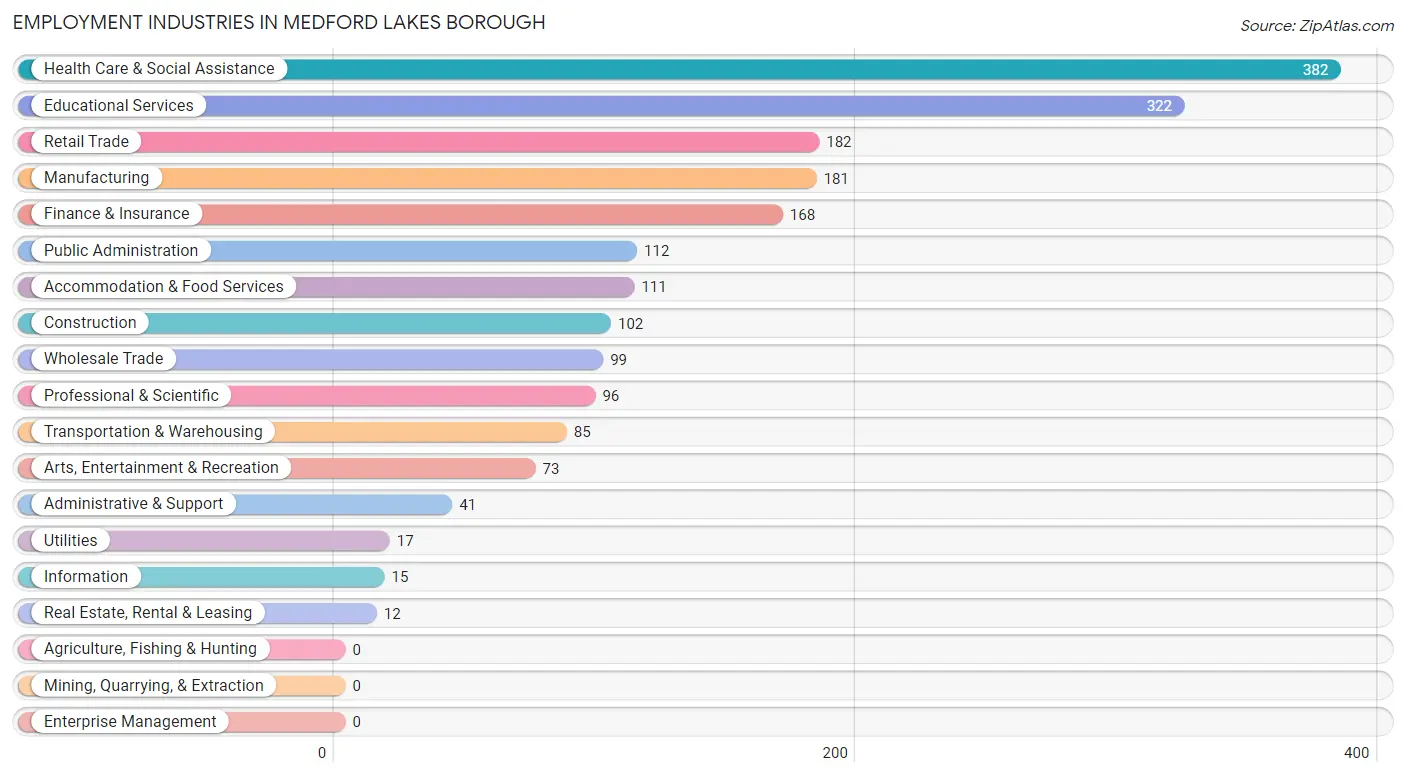
Employment Industries in Medford Lakes borough
The major employment industries in Medford Lakes borough include Health Care & Social Assistance (382 | 18.3%), Educational Services (322 | 15.4%), Retail Trade (182 | 8.7%), Manufacturing (181 | 8.6%), and Finance & Insurance (168 | 8.0%).
Employment Industries by Sex in Medford Lakes borough
The Medford Lakes borough industries that see more men than women are Utilities (100.0%), Public Administration (92.9%), and Construction (87.3%), whereas the industries that tend to have a higher number of women are Real Estate, Rental & Leasing (100.0%), Health Care & Social Assistance (88.5%), and Administrative & Support (80.5%).
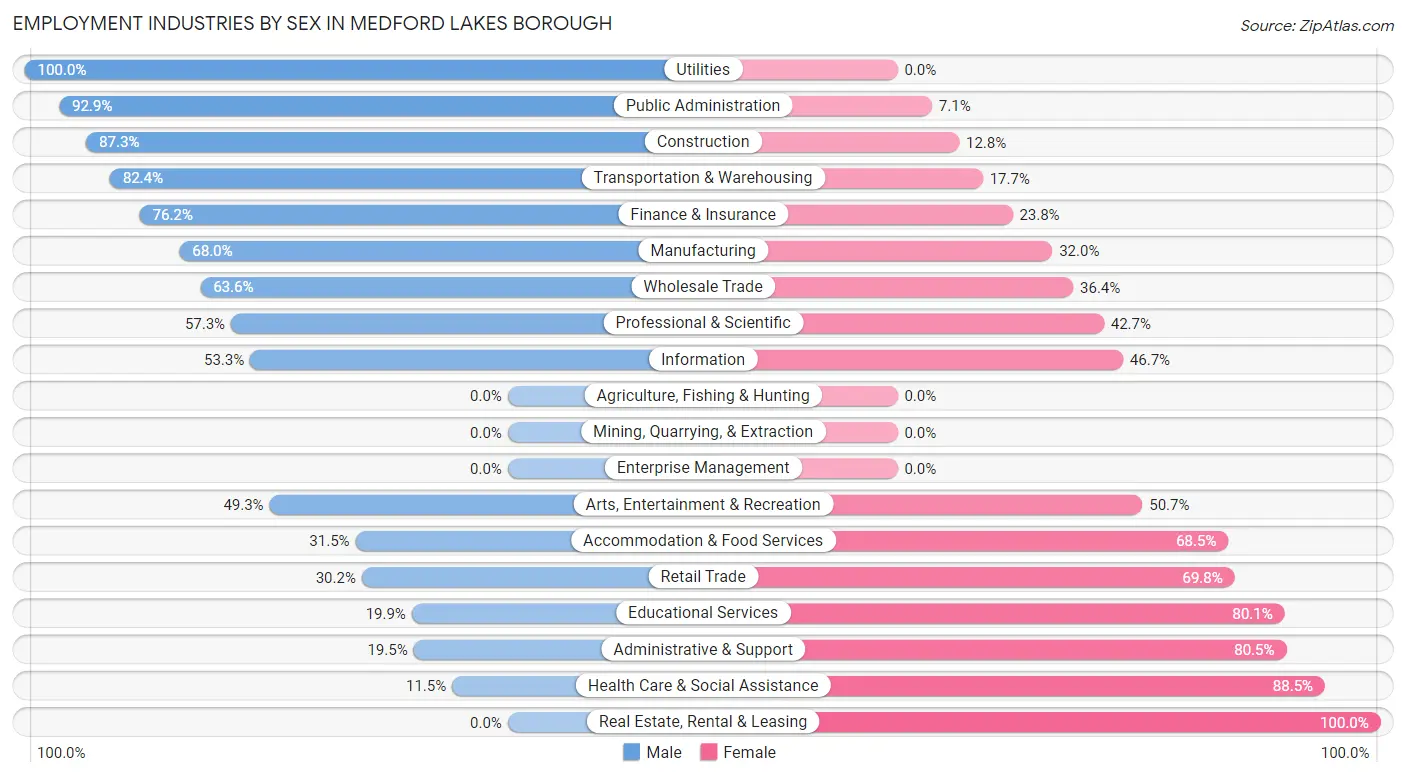
| Industry | Male | Female |
| Agriculture, Fishing & Hunting | 0 (0.0%) | 0 (0.0%) |
| Mining, Quarrying, & Extraction | 0 (0.0%) | 0 (0.0%) |
| Construction | 89 (87.3%) | 13 (12.8%) |
| Manufacturing | 123 (68.0%) | 58 (32.0%) |
| Wholesale Trade | 63 (63.6%) | 36 (36.4%) |
| Retail Trade | 55 (30.2%) | 127 (69.8%) |
| Transportation & Warehousing | 70 (82.4%) | 15 (17.6%) |
| Utilities | 17 (100.0%) | 0 (0.0%) |
| Information | 8 (53.3%) | 7 (46.7%) |
| Finance & Insurance | 128 (76.2%) | 40 (23.8%) |
| Real Estate, Rental & Leasing | 0 (0.0%) | 12 (100.0%) |
| Professional & Scientific | 55 (57.3%) | 41 (42.7%) |
| Enterprise Management | 0 (0.0%) | 0 (0.0%) |
| Administrative & Support | 8 (19.5%) | 33 (80.5%) |
| Educational Services | 64 (19.9%) | 258 (80.1%) |
| Health Care & Social Assistance | 44 (11.5%) | 338 (88.5%) |
| Arts, Entertainment & Recreation | 36 (49.3%) | 37 (50.7%) |
| Accommodation & Food Services | 35 (31.5%) | 76 (68.5%) |
| Public Administration | 104 (92.9%) | 8 (7.1%) |
| Total | 961 (45.9%) | 1,131 (54.1%) |
Education in Medford Lakes borough
School Enrollment in Medford Lakes borough
The most common levels of schooling among the 1,297 students in Medford Lakes borough are high school (397 | 30.6%), elementary school (333 | 25.7%), and middle school (163 | 12.6%).
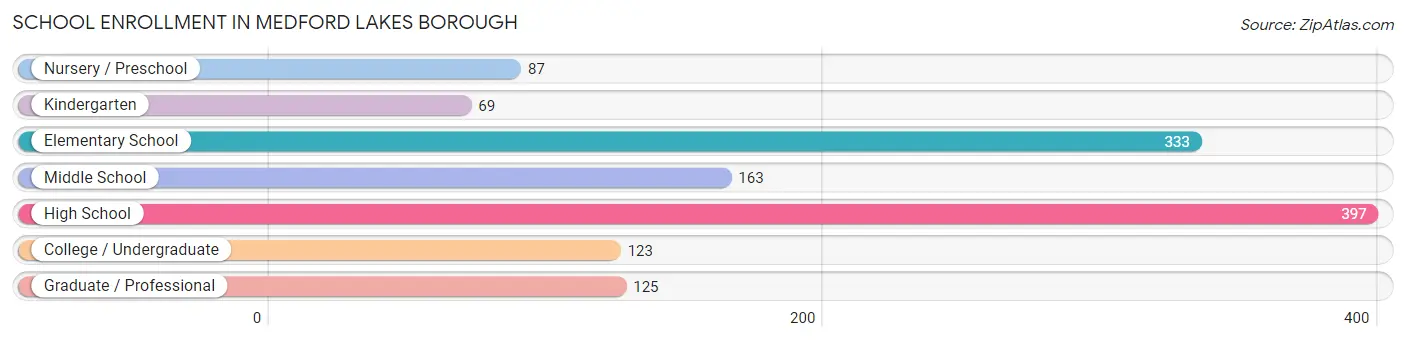
| School Level | # Students | % Students |
| Nursery / Preschool | 87 | 6.7% |
| Kindergarten | 69 | 5.3% |
| Elementary School | 333 | 25.7% |
| Middle School | 163 | 12.6% |
| High School | 397 | 30.6% |
| College / Undergraduate | 123 | 9.5% |
| Graduate / Professional | 125 | 9.6% |
| Total | 1,297 | 100.0% |
School Enrollment by Age by Funding Source in Medford Lakes borough
Out of a total of 1,297 students who are enrolled in schools in Medford Lakes borough, 235 (18.1%) attend a private institution, while the remaining 1,062 (81.9%) are enrolled in public schools. The age group of 25 to 34 year olds has the highest likelihood of being enrolled in private schools, with 45 (100.0% in the age bracket) enrolled. Conversely, the age group of 18 to 19 year olds has the lowest likelihood of being enrolled in a private school, with 107 (100.0% in the age bracket) attending a public institution.
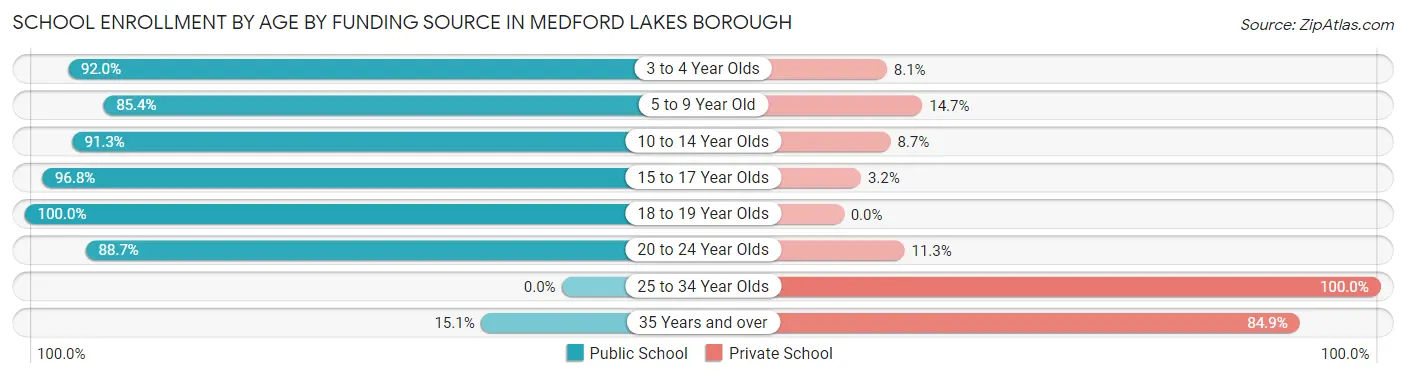
| Age Bracket | Public School | Private School |
| 3 to 4 Year Olds | 80 (91.9%) | 7 (8.1%) |
| 5 to 9 Year Old | 303 (85.4%) | 52 (14.6%) |
| 10 to 14 Year Olds | 230 (91.3%) | 22 (8.7%) |
| 15 to 17 Year Olds | 240 (96.8%) | 8 (3.2%) |
| 18 to 19 Year Olds | 107 (100.0%) | 0 (0.0%) |
| 20 to 24 Year Olds | 86 (88.7%) | 11 (11.3%) |
| 25 to 34 Year Olds | 0 (0.0%) | 45 (100.0%) |
| 35 Years and over | 16 (15.1%) | 90 (84.9%) |
| Total | 1,062 (81.9%) | 235 (18.1%) |
Educational Attainment by Field of Study in Medford Lakes borough
Business (497 | 27.4%), education (323 | 17.8%), social sciences (177 | 9.8%), bio, nature & agricultural (141 | 7.8%), and science & technology (132 | 7.3%) are the most common fields of study among 1,812 individuals in Medford Lakes borough who have obtained a bachelor's degree or higher.
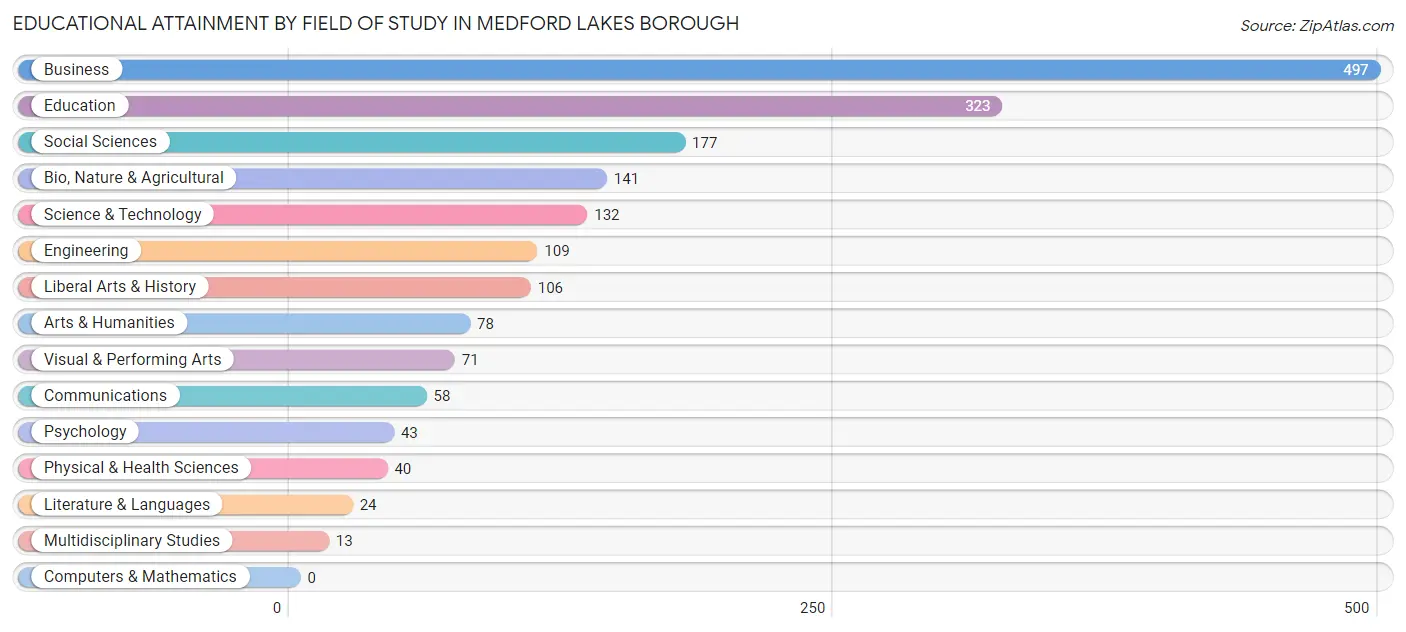
| Field of Study | # Graduates | % Graduates |
| Computers & Mathematics | 0 | 0.0% |
| Bio, Nature & Agricultural | 141 | 7.8% |
| Physical & Health Sciences | 40 | 2.2% |
| Psychology | 43 | 2.4% |
| Social Sciences | 177 | 9.8% |
| Engineering | 109 | 6.0% |
| Multidisciplinary Studies | 13 | 0.7% |
| Science & Technology | 132 | 7.3% |
| Business | 497 | 27.4% |
| Education | 323 | 17.8% |
| Literature & Languages | 24 | 1.3% |
| Liberal Arts & History | 106 | 5.9% |
| Visual & Performing Arts | 71 | 3.9% |
| Communications | 58 | 3.2% |
| Arts & Humanities | 78 | 4.3% |
| Total | 1,812 | 100.0% |
Transportation & Commute in Medford Lakes borough
Vehicle Availability by Sex in Medford Lakes borough
The most prevalent vehicle ownership categories in Medford Lakes borough are males with 2 vehicles (596, accounting for 62.0%) and females with 2 vehicles (517, making up 52.7%).
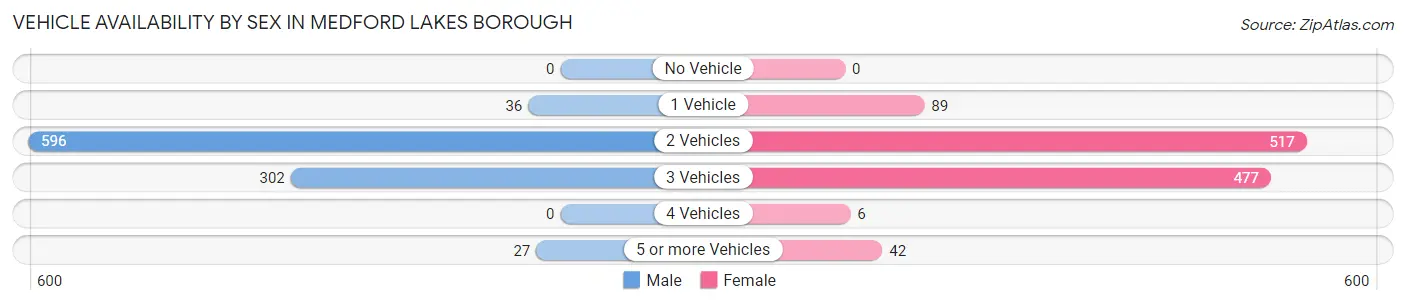
| Vehicles Available | Male | Female |
| No Vehicle | 0 (0.0%) | 0 (0.0%) |
| 1 Vehicle | 36 (3.7%) | 89 (7.9%) |
| 2 Vehicles | 596 (62.0%) | 517 (45.7%) |
| 3 Vehicles | 302 (31.4%) | 477 (42.2%) |
| 4 Vehicles | 0 (0.0%) | 6 (0.5%) |
| 5 or more Vehicles | 27 (2.8%) | 42 (3.7%) |
| Total | 961 (100.0%) | 1,131 (100.0%) |
Commute Time in Medford Lakes borough
The most frequently occuring commute durations in Medford Lakes borough are 30 to 34 minutes (364 commuters, 20.5%), 60 to 89 minutes (294 commuters, 16.5%), and 10 to 14 minutes (227 commuters, 12.8%).
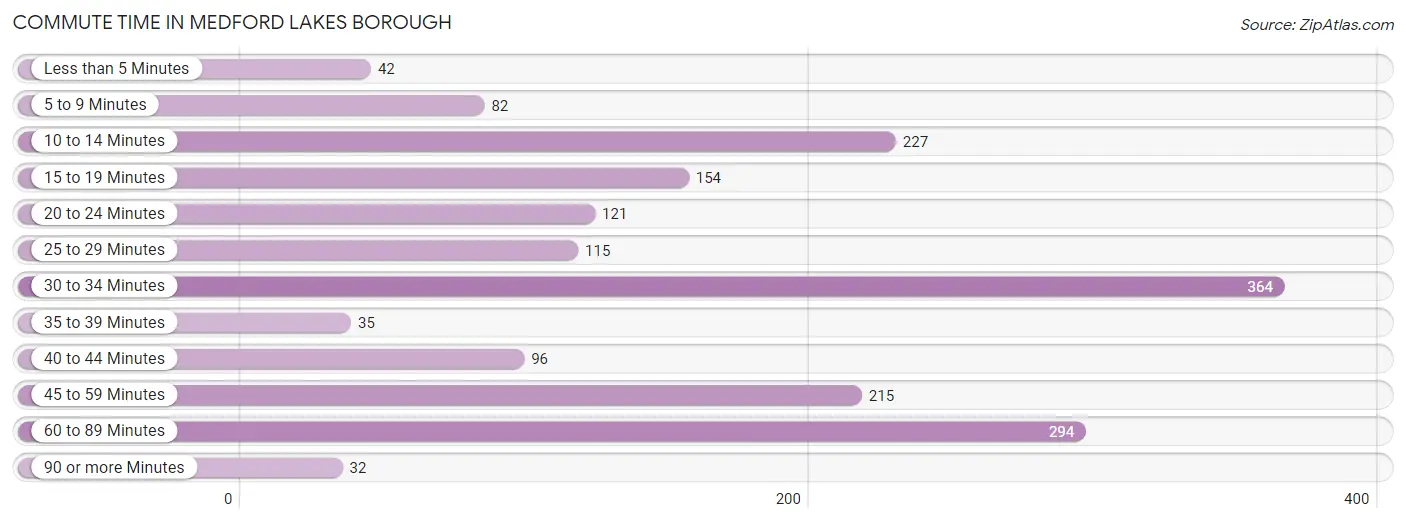
| Commute Time | # Commuters | % Commuters |
| Less than 5 Minutes | 42 | 2.4% |
| 5 to 9 Minutes | 82 | 4.6% |
| 10 to 14 Minutes | 227 | 12.8% |
| 15 to 19 Minutes | 154 | 8.7% |
| 20 to 24 Minutes | 121 | 6.8% |
| 25 to 29 Minutes | 115 | 6.5% |
| 30 to 34 Minutes | 364 | 20.5% |
| 35 to 39 Minutes | 35 | 2.0% |
| 40 to 44 Minutes | 96 | 5.4% |
| 45 to 59 Minutes | 215 | 12.1% |
| 60 to 89 Minutes | 294 | 16.5% |
| 90 or more Minutes | 32 | 1.8% |
Commute Time by Sex in Medford Lakes borough
The most common commute times in Medford Lakes borough are 60 to 89 minutes (195 commuters, 24.6%) for males and 30 to 34 minutes (308 commuters, 31.3%) for females.
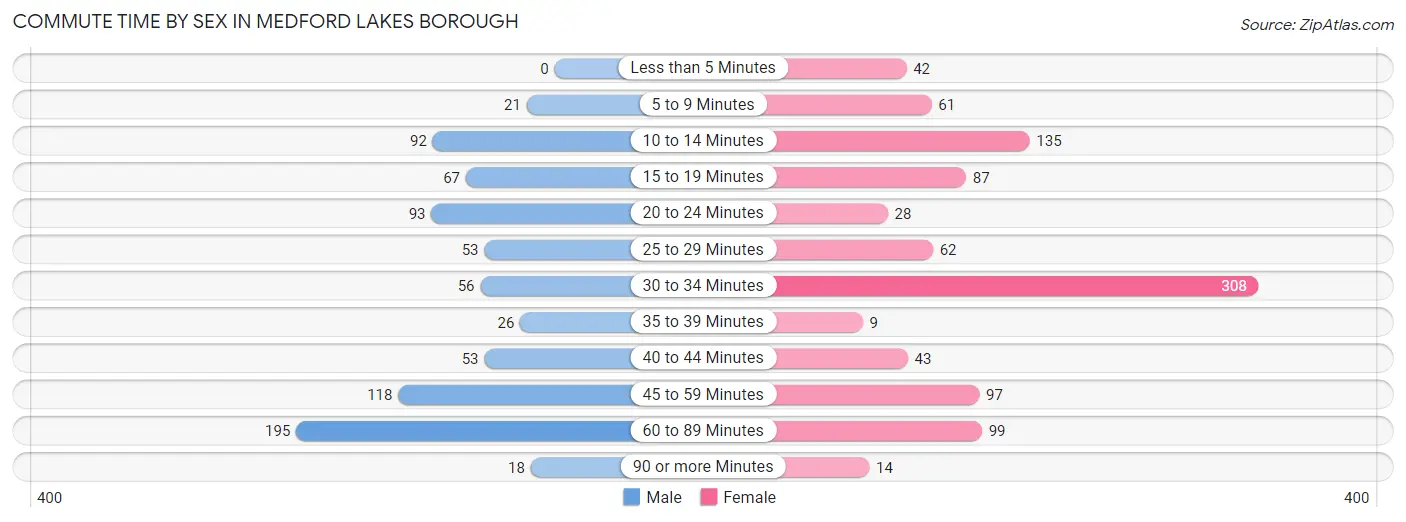
| Commute Time | Male | Female |
| Less than 5 Minutes | 0 (0.0%) | 42 (4.3%) |
| 5 to 9 Minutes | 21 (2.6%) | 61 (6.2%) |
| 10 to 14 Minutes | 92 (11.6%) | 135 (13.7%) |
| 15 to 19 Minutes | 67 (8.5%) | 87 (8.8%) |
| 20 to 24 Minutes | 93 (11.7%) | 28 (2.8%) |
| 25 to 29 Minutes | 53 (6.7%) | 62 (6.3%) |
| 30 to 34 Minutes | 56 (7.1%) | 308 (31.3%) |
| 35 to 39 Minutes | 26 (3.3%) | 9 (0.9%) |
| 40 to 44 Minutes | 53 (6.7%) | 43 (4.4%) |
| 45 to 59 Minutes | 118 (14.9%) | 97 (9.9%) |
| 60 to 89 Minutes | 195 (24.6%) | 99 (10.1%) |
| 90 or more Minutes | 18 (2.3%) | 14 (1.4%) |
Time of Departure to Work by Sex in Medford Lakes borough
The most frequent times of departure to work in Medford Lakes borough are 7:00 AM to 7:29 AM (381, 48.1%) for males and 7:00 AM to 7:29 AM (215, 21.8%) for females.
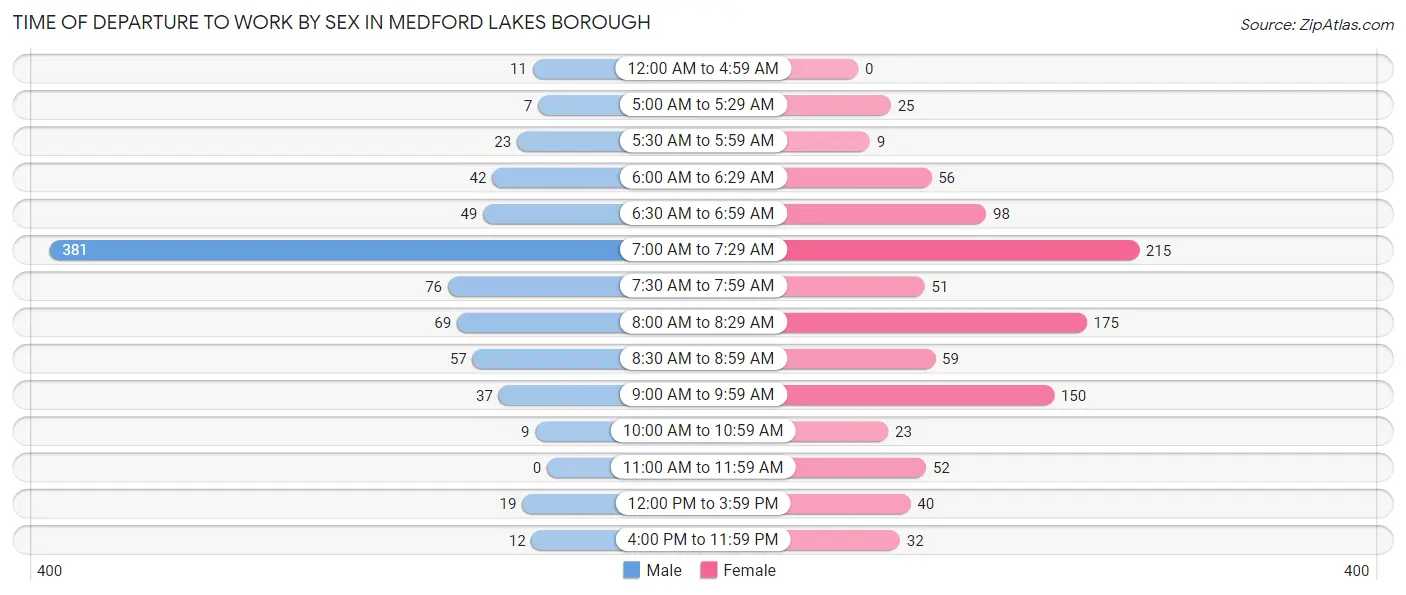
| Time of Departure | Male | Female |
| 12:00 AM to 4:59 AM | 11 (1.4%) | 0 (0.0%) |
| 5:00 AM to 5:29 AM | 7 (0.9%) | 25 (2.5%) |
| 5:30 AM to 5:59 AM | 23 (2.9%) | 9 (0.9%) |
| 6:00 AM to 6:29 AM | 42 (5.3%) | 56 (5.7%) |
| 6:30 AM to 6:59 AM | 49 (6.2%) | 98 (10.0%) |
| 7:00 AM to 7:29 AM | 381 (48.1%) | 215 (21.8%) |
| 7:30 AM to 7:59 AM | 76 (9.6%) | 51 (5.2%) |
| 8:00 AM to 8:29 AM | 69 (8.7%) | 175 (17.8%) |
| 8:30 AM to 8:59 AM | 57 (7.2%) | 59 (6.0%) |
| 9:00 AM to 9:59 AM | 37 (4.7%) | 150 (15.2%) |
| 10:00 AM to 10:59 AM | 9 (1.1%) | 23 (2.3%) |
| 11:00 AM to 11:59 AM | 0 (0.0%) | 52 (5.3%) |
| 12:00 PM to 3:59 PM | 19 (2.4%) | 40 (4.1%) |
| 4:00 PM to 11:59 PM | 12 (1.5%) | 32 (3.3%) |
| Total | 792 (100.0%) | 985 (100.0%) |
Housing Occupancy in Medford Lakes borough
Occupancy by Ownership in Medford Lakes borough
Of the total 1,467 dwellings in Medford Lakes borough, owner-occupied units account for 1,378 (93.9%), while renter-occupied units make up 89 (6.1%).
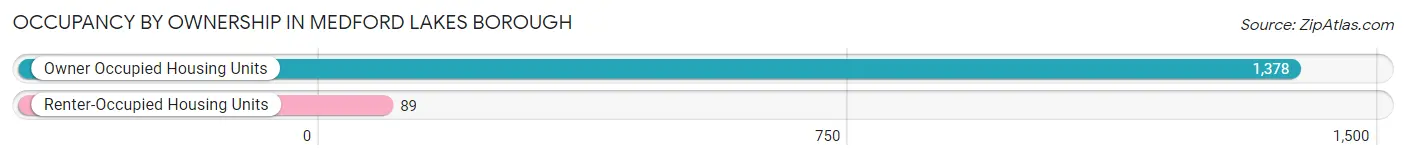
| Occupancy | # Housing Units | % Housing Units |
| Owner Occupied Housing Units | 1,378 | 93.9% |
| Renter-Occupied Housing Units | 89 | 6.1% |
| Total Occupied Housing Units | 1,467 | 100.0% |
Occupancy by Household Size in Medford Lakes borough
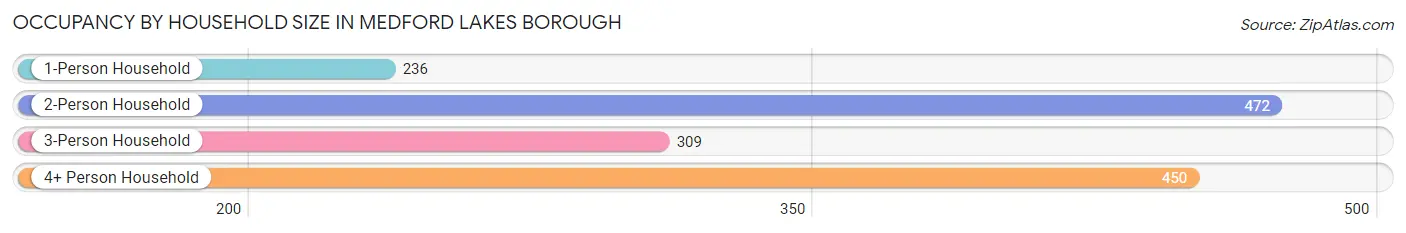
| Household Size | # Housing Units | % Housing Units |
| 1-Person Household | 236 | 16.1% |
| 2-Person Household | 472 | 32.2% |
| 3-Person Household | 309 | 21.1% |
| 4+ Person Household | 450 | 30.7% |
| Total Housing Units | 1,467 | 100.0% |
Occupancy by Ownership by Household Size in Medford Lakes borough
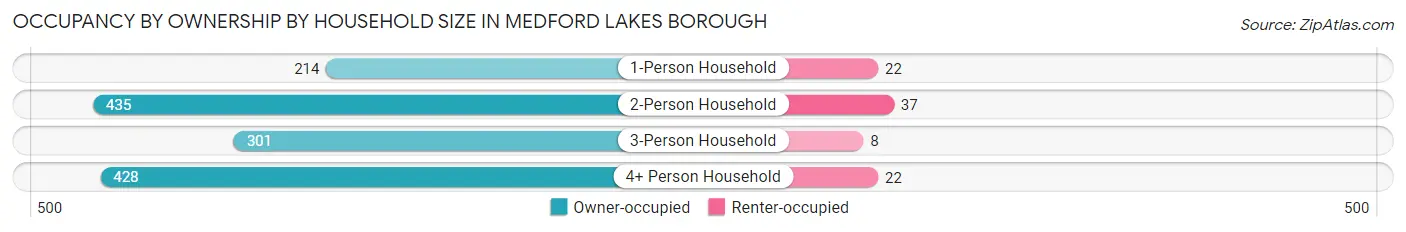
| Household Size | Owner-occupied | Renter-occupied |
| 1-Person Household | 214 (90.7%) | 22 (9.3%) |
| 2-Person Household | 435 (92.2%) | 37 (7.8%) |
| 3-Person Household | 301 (97.4%) | 8 (2.6%) |
| 4+ Person Household | 428 (95.1%) | 22 (4.9%) |
| Total Housing Units | 1,378 (93.9%) | 89 (6.1%) |
Occupancy by Educational Attainment in Medford Lakes borough
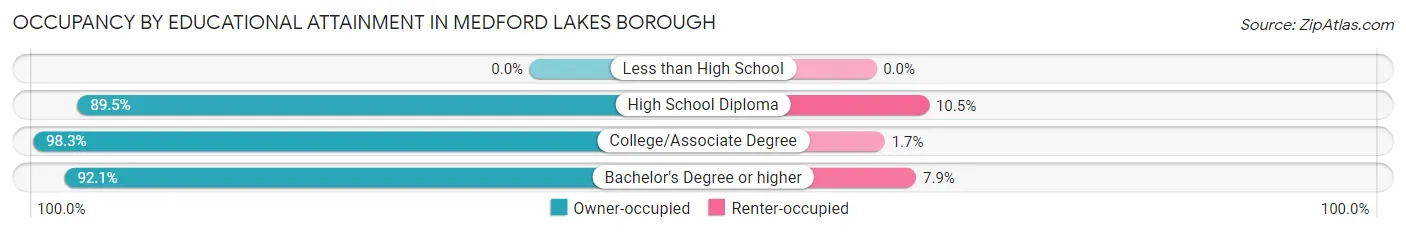
| Household Size | Owner-occupied | Renter-occupied |
| Less than High School | 0 (0.0%) | 0 (0.0%) |
| High School Diploma | 77 (89.5%) | 9 (10.5%) |
| College/Associate Degree | 463 (98.3%) | 8 (1.7%) |
| Bachelor's Degree or higher | 838 (92.1%) | 72 (7.9%) |
Occupancy by Age of Householder in Medford Lakes borough
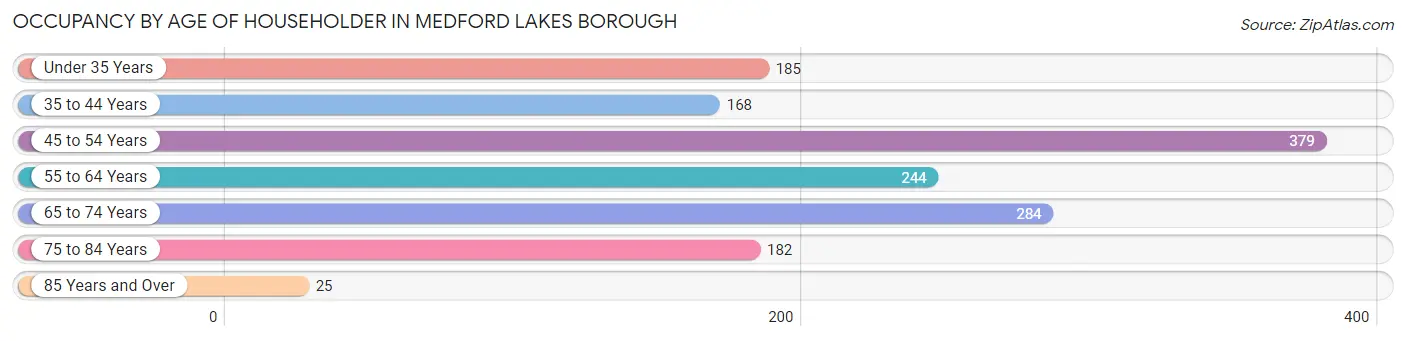
| Age Bracket | # Households | % Households |
| Under 35 Years | 185 | 12.6% |
| 35 to 44 Years | 168 | 11.5% |
| 45 to 54 Years | 379 | 25.8% |
| 55 to 64 Years | 244 | 16.6% |
| 65 to 74 Years | 284 | 19.4% |
| 75 to 84 Years | 182 | 12.4% |
| 85 Years and Over | 25 | 1.7% |
| Total | 1,467 | 100.0% |
Housing Finances in Medford Lakes borough
Median Income by Occupancy in Medford Lakes borough
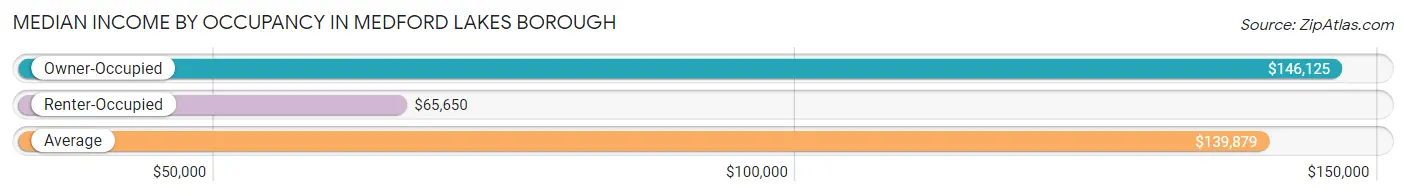
| Occupancy Type | # Households | Median Income |
| Owner-Occupied | 1,378 (93.9%) | $146,125 |
| Renter-Occupied | 89 (6.1%) | $65,650 |
| Average | 1,467 (100.0%) | $139,879 |
Occupancy by Householder Income Bracket in Medford Lakes borough
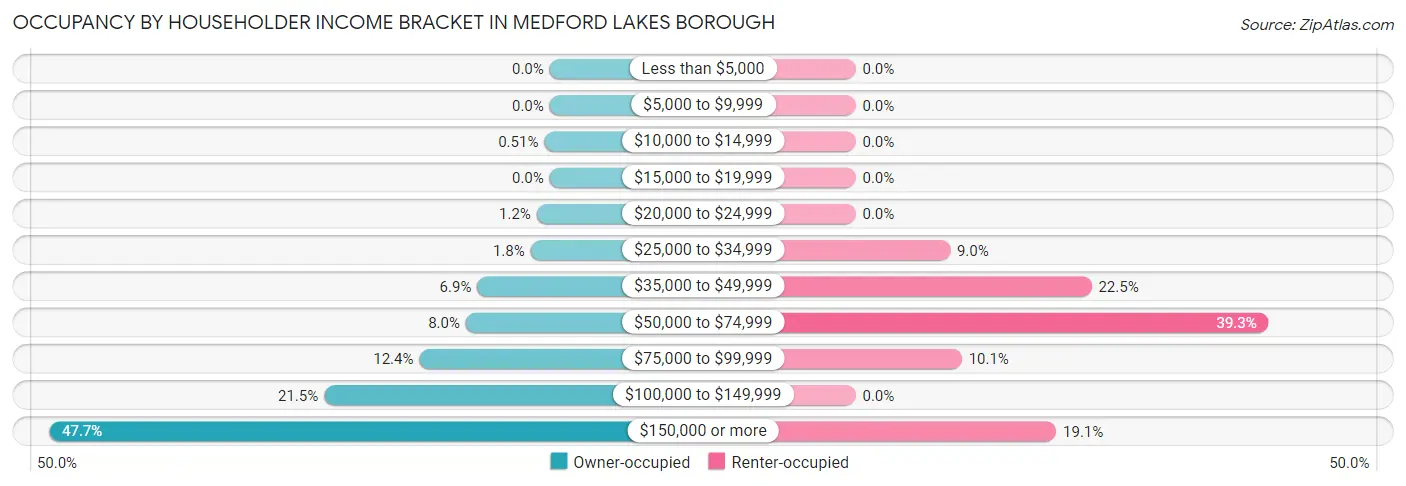
| Income Bracket | Owner-occupied | Renter-occupied |
| Less than $5,000 | 0 (0.0%) | 0 (0.0%) |
| $5,000 to $9,999 | 0 (0.0%) | 0 (0.0%) |
| $10,000 to $14,999 | 7 (0.5%) | 0 (0.0%) |
| $15,000 to $19,999 | 0 (0.0%) | 0 (0.0%) |
| $20,000 to $24,999 | 17 (1.2%) | 0 (0.0%) |
| $25,000 to $34,999 | 25 (1.8%) | 8 (9.0%) |
| $35,000 to $49,999 | 95 (6.9%) | 20 (22.5%) |
| $50,000 to $74,999 | 110 (8.0%) | 35 (39.3%) |
| $75,000 to $99,999 | 171 (12.4%) | 9 (10.1%) |
| $100,000 to $149,999 | 296 (21.5%) | 0 (0.0%) |
| $150,000 or more | 657 (47.7%) | 17 (19.1%) |
| Total | 1,378 (100.0%) | 89 (100.0%) |
Monthly Housing Cost Tiers in Medford Lakes borough
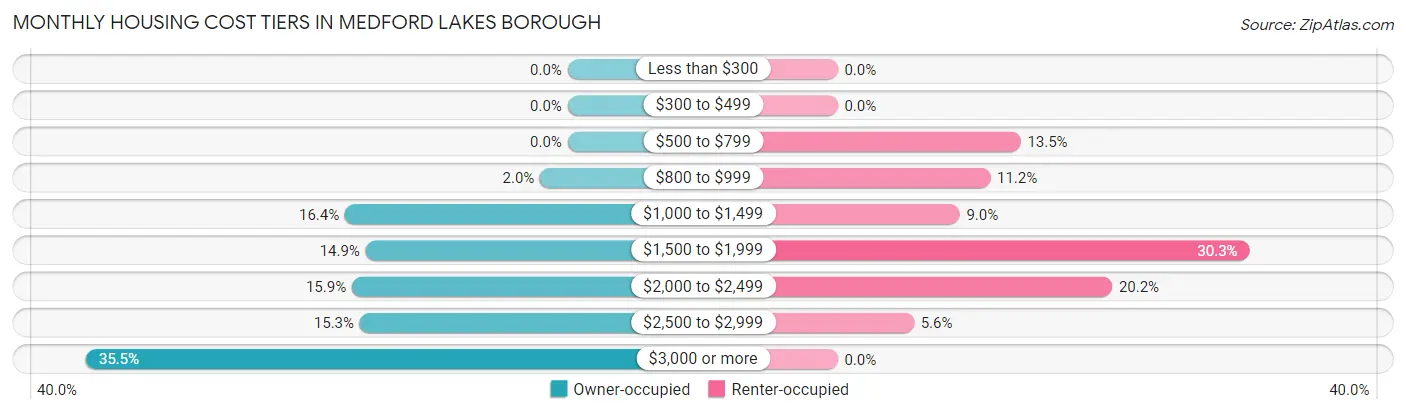
| Monthly Cost | Owner-occupied | Renter-occupied |
| Less than $300 | 0 (0.0%) | 0 (0.0%) |
| $300 to $499 | 0 (0.0%) | 0 (0.0%) |
| $500 to $799 | 0 (0.0%) | 12 (13.5%) |
| $800 to $999 | 28 (2.0%) | 10 (11.2%) |
| $1,000 to $1,499 | 226 (16.4%) | 8 (9.0%) |
| $1,500 to $1,999 | 205 (14.9%) | 27 (30.3%) |
| $2,000 to $2,499 | 219 (15.9%) | 18 (20.2%) |
| $2,500 to $2,999 | 211 (15.3%) | 5 (5.6%) |
| $3,000 or more | 489 (35.5%) | 0 (0.0%) |
| Total | 1,378 (100.0%) | 89 (100.0%) |
Physical Housing Characteristics in Medford Lakes borough
Housing Structures in Medford Lakes borough
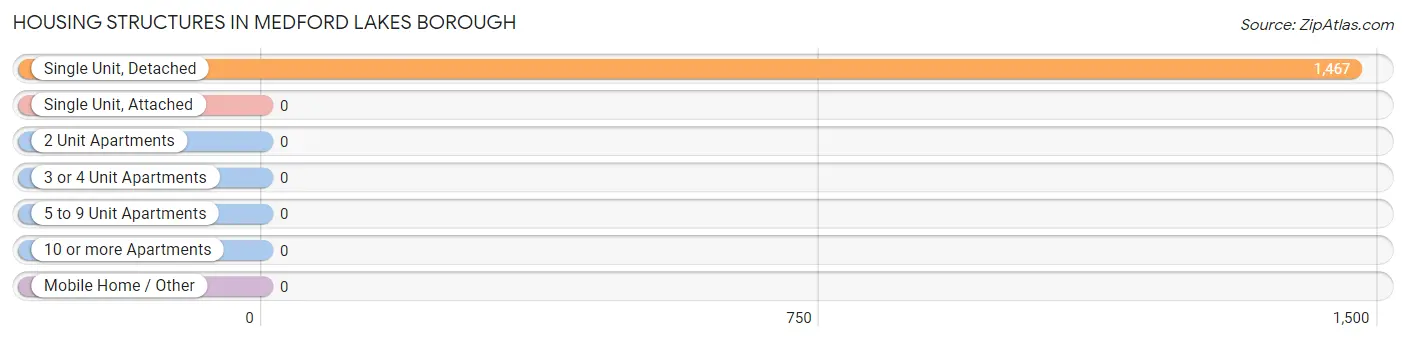
| Structure Type | # Housing Units | % Housing Units |
| Single Unit, Detached | 1,467 | 100.0% |
| Single Unit, Attached | 0 | 0.0% |
| 2 Unit Apartments | 0 | 0.0% |
| 3 or 4 Unit Apartments | 0 | 0.0% |
| 5 to 9 Unit Apartments | 0 | 0.0% |
| 10 or more Apartments | 0 | 0.0% |
| Mobile Home / Other | 0 | 0.0% |
| Total | 1,467 | 100.0% |
Housing Structures by Occupancy in Medford Lakes borough
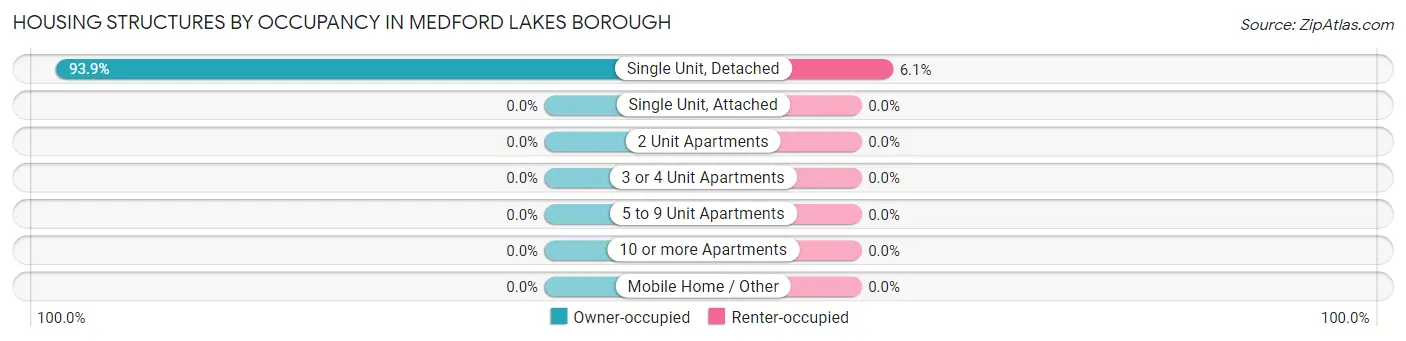
| Structure Type | Owner-occupied | Renter-occupied |
| Single Unit, Detached | 1,378 (93.9%) | 89 (6.1%) |
| Single Unit, Attached | 0 (0.0%) | 0 (0.0%) |
| 2 Unit Apartments | 0 (0.0%) | 0 (0.0%) |
| 3 or 4 Unit Apartments | 0 (0.0%) | 0 (0.0%) |
| 5 to 9 Unit Apartments | 0 (0.0%) | 0 (0.0%) |
| 10 or more Apartments | 0 (0.0%) | 0 (0.0%) |
| Mobile Home / Other | 0 (0.0%) | 0 (0.0%) |
| Total | 1,378 (93.9%) | 89 (6.1%) |
Housing Structures by Number of Rooms in Medford Lakes borough
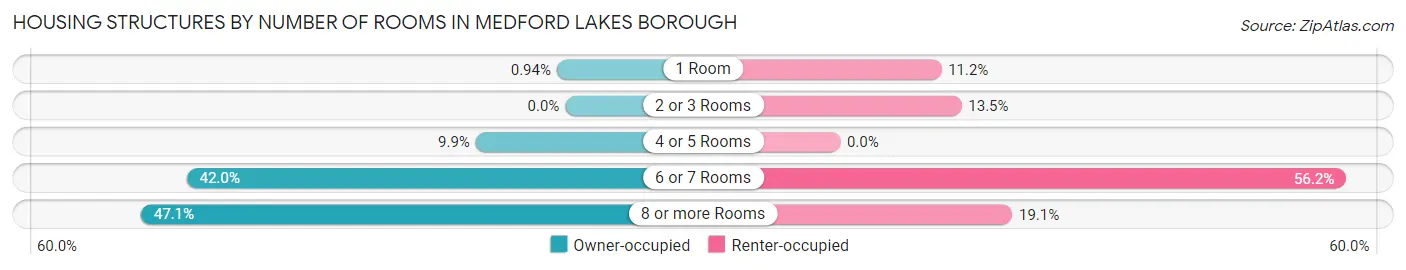
| Number of Rooms | Owner-occupied | Renter-occupied |
| 1 Room | 13 (0.9%) | 10 (11.2%) |
| 2 or 3 Rooms | 0 (0.0%) | 12 (13.5%) |
| 4 or 5 Rooms | 137 (9.9%) | 0 (0.0%) |
| 6 or 7 Rooms | 579 (42.0%) | 50 (56.2%) |
| 8 or more Rooms | 649 (47.1%) | 17 (19.1%) |
| Total | 1,378 (100.0%) | 89 (100.0%) |
Housing Structure by Heating Type in Medford Lakes borough
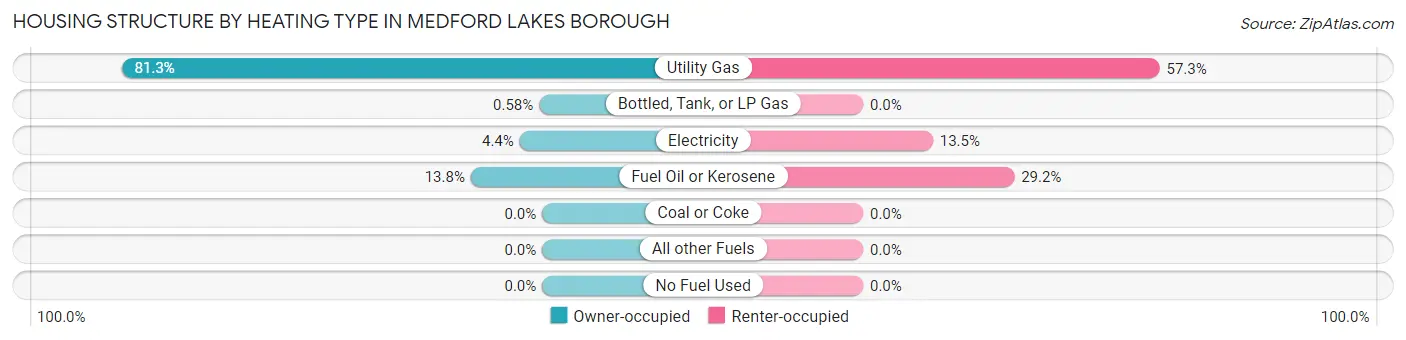
| Heating Type | Owner-occupied | Renter-occupied |
| Utility Gas | 1,120 (81.3%) | 51 (57.3%) |
| Bottled, Tank, or LP Gas | 8 (0.6%) | 0 (0.0%) |
| Electricity | 60 (4.3%) | 12 (13.5%) |
| Fuel Oil or Kerosene | 190 (13.8%) | 26 (29.2%) |
| Coal or Coke | 0 (0.0%) | 0 (0.0%) |
| All other Fuels | 0 (0.0%) | 0 (0.0%) |
| No Fuel Used | 0 (0.0%) | 0 (0.0%) |
| Total | 1,378 (100.0%) | 89 (100.0%) |
Household Vehicle Usage in Medford Lakes borough
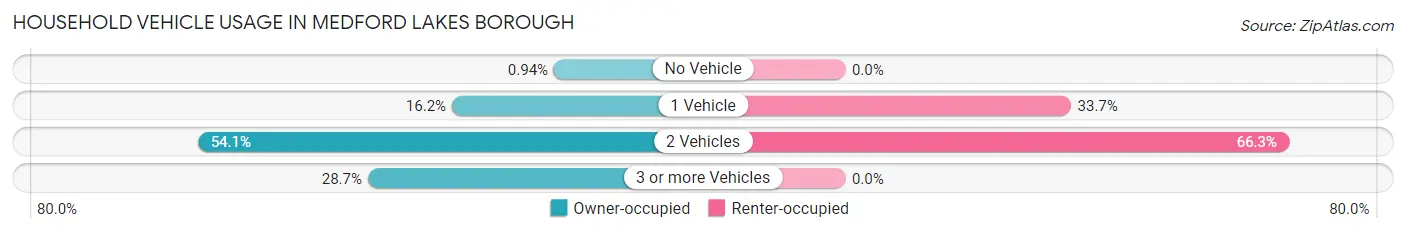
| Vehicles per Household | Owner-occupied | Renter-occupied |
| No Vehicle | 13 (0.9%) | 0 (0.0%) |
| 1 Vehicle | 223 (16.2%) | 30 (33.7%) |
| 2 Vehicles | 746 (54.1%) | 59 (66.3%) |
| 3 or more Vehicles | 396 (28.7%) | 0 (0.0%) |
| Total | 1,378 (100.0%) | 89 (100.0%) |
Real Estate & Mortgages in Medford Lakes borough
Real Estate and Mortgage Overview in Medford Lakes borough
| Characteristic | Without Mortgage | With Mortgage |
| Housing Units | 304 | 1,074 |
| Median Property Value | $351,900 | $361,700 |
| Median Household Income | $78,194 | $615 |
| Monthly Housing Costs | $1,298 | $489 |
| Real Estate Taxes | $9,719 | $8 |
Property Value by Mortgage Status in Medford Lakes borough
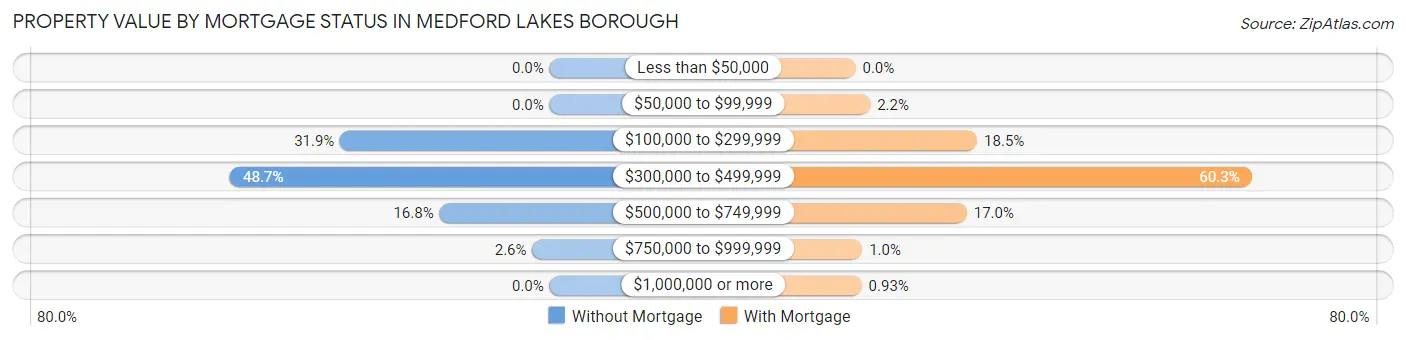
| Property Value | Without Mortgage | With Mortgage |
| Less than $50,000 | 0 (0.0%) | 0 (0.0%) |
| $50,000 to $99,999 | 0 (0.0%) | 24 (2.2%) |
| $100,000 to $299,999 | 97 (31.9%) | 199 (18.5%) |
| $300,000 to $499,999 | 148 (48.7%) | 648 (60.3%) |
| $500,000 to $749,999 | 51 (16.8%) | 182 (17.0%) |
| $750,000 to $999,999 | 8 (2.6%) | 11 (1.0%) |
| $1,000,000 or more | 0 (0.0%) | 10 (0.9%) |
| Total | 304 (100.0%) | 1,074 (100.0%) |
Household Income by Mortgage Status in Medford Lakes borough
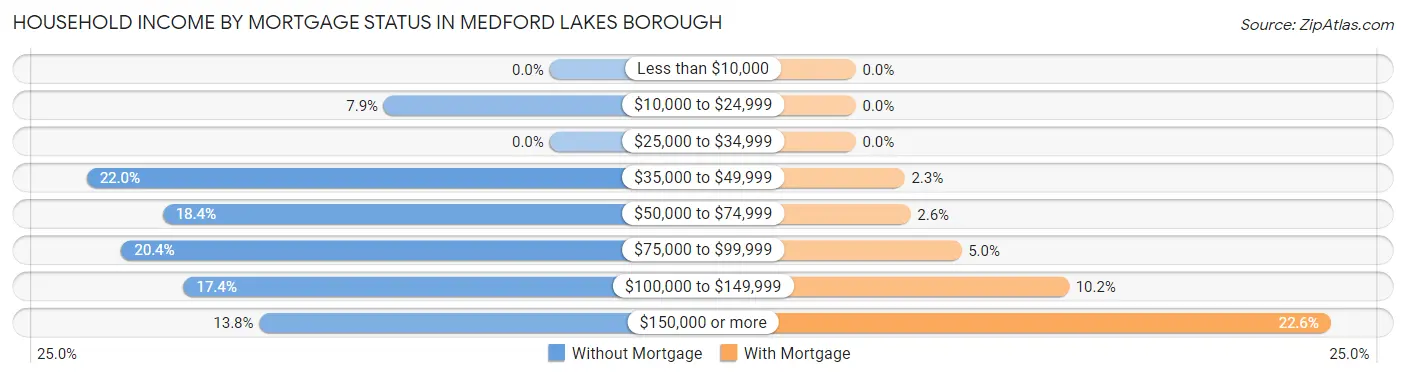
| Household Income | Without Mortgage | With Mortgage |
| Less than $10,000 | 0 (0.0%) | 0 (0.0%) |
| $10,000 to $24,999 | 24 (7.9%) | 0 (0.0%) |
| $25,000 to $34,999 | 0 (0.0%) | 0 (0.0%) |
| $35,000 to $49,999 | 67 (22.0%) | 25 (2.3%) |
| $50,000 to $74,999 | 56 (18.4%) | 28 (2.6%) |
| $75,000 to $99,999 | 62 (20.4%) | 54 (5.0%) |
| $100,000 to $149,999 | 53 (17.4%) | 109 (10.2%) |
| $150,000 or more | 42 (13.8%) | 243 (22.6%) |
| Total | 304 (100.0%) | 1,074 (100.0%) |
Property Value to Household Income Ratio in Medford Lakes borough
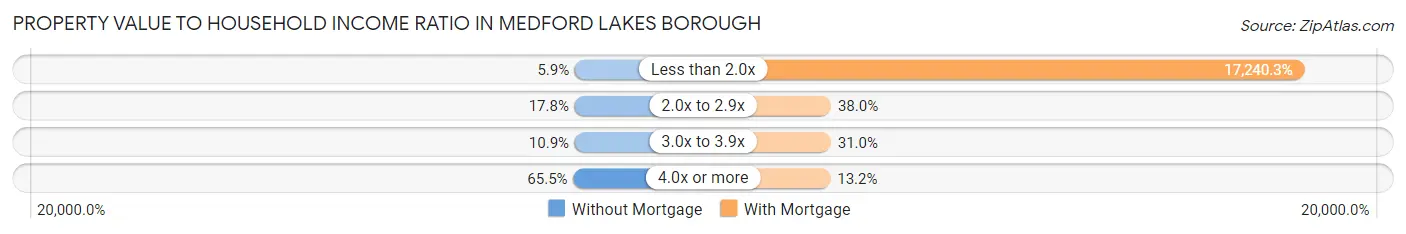
| Value-to-Income Ratio | Without Mortgage | With Mortgage |
| Less than 2.0x | 18 (5.9%) | 185,161 (17,240.3%) |
| 2.0x to 2.9x | 54 (17.8%) | 408 (38.0%) |
| 3.0x to 3.9x | 33 (10.9%) | 333 (31.0%) |
| 4.0x or more | 199 (65.5%) | 142 (13.2%) |
| Total | 304 (100.0%) | 1,074 (100.0%) |
Real Estate Taxes by Mortgage Status in Medford Lakes borough
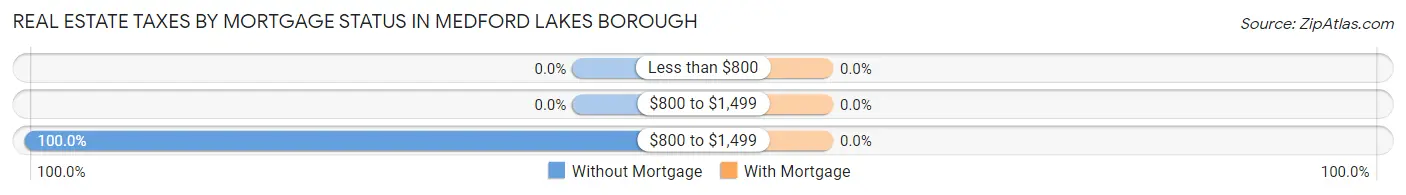
| Property Taxes | Without Mortgage | With Mortgage |
| Less than $800 | 0 (0.0%) | 0 (0.0%) |
| $800 to $1,499 | 0 (0.0%) | 0 (0.0%) |
| $800 to $1,499 | 304 (100.0%) | 0 (0.0%) |
| Total | 304 (100.0%) | 1,074 (100.0%) |
Health & Disability in Medford Lakes borough
Health Insurance Coverage by Age in Medford Lakes borough
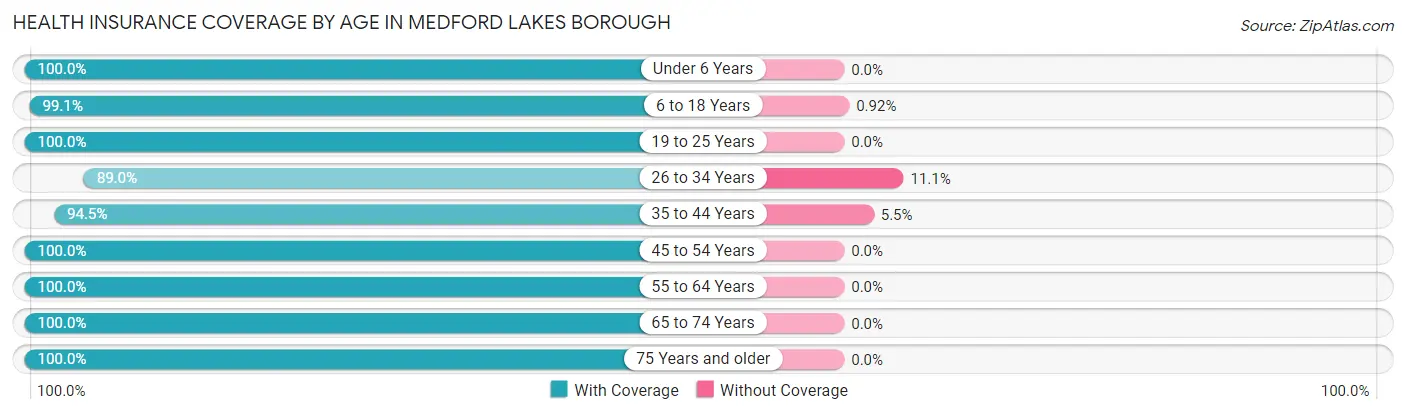
| Age Bracket | With Coverage | Without Coverage |
| Under 6 Years | 247 (100.0%) | 0 (0.0%) |
| 6 to 18 Years | 866 (99.1%) | 8 (0.9%) |
| 19 to 25 Years | 240 (100.0%) | 0 (0.0%) |
| 26 to 34 Years | 346 (88.9%) | 43 (11.1%) |
| 35 to 44 Years | 378 (94.5%) | 22 (5.5%) |
| 45 to 54 Years | 637 (100.0%) | 0 (0.0%) |
| 55 to 64 Years | 552 (100.0%) | 0 (0.0%) |
| 65 to 74 Years | 517 (100.0%) | 0 (0.0%) |
| 75 Years and older | 407 (100.0%) | 0 (0.0%) |
| Total | 4,190 (98.3%) | 73 (1.7%) |
Health Insurance Coverage by Citizenship Status in Medford Lakes borough
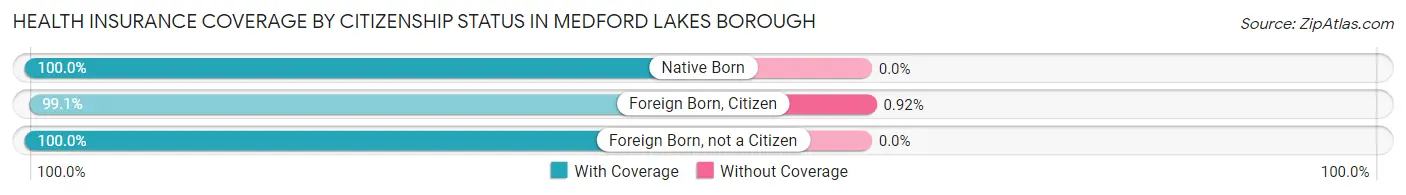
| Citizenship Status | With Coverage | Without Coverage |
| Native Born | 247 (100.0%) | 0 (0.0%) |
| Foreign Born, Citizen | 866 (99.1%) | 8 (0.9%) |
| Foreign Born, not a Citizen | 240 (100.0%) | 0 (0.0%) |
Health Insurance Coverage by Household Income in Medford Lakes borough
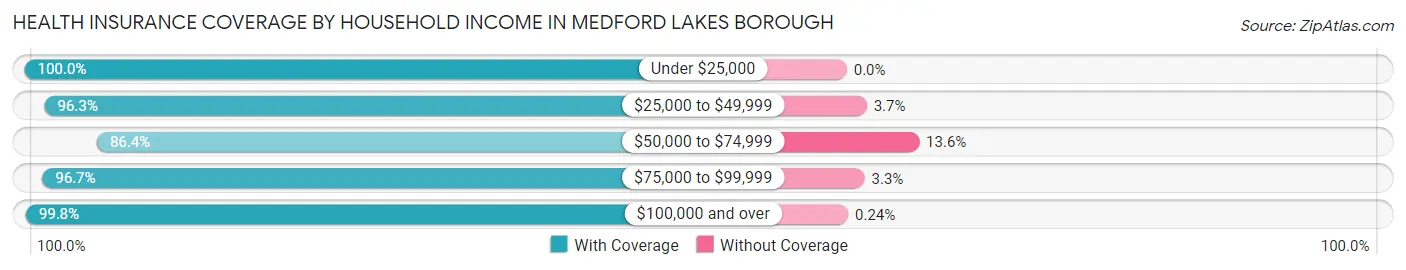
| Household Income | With Coverage | Without Coverage |
| Under $25,000 | 32 (100.0%) | 0 (0.0%) |
| $25,000 to $49,999 | 258 (96.3%) | 10 (3.7%) |
| $50,000 to $74,999 | 274 (86.4%) | 43 (13.6%) |
| $75,000 to $99,999 | 348 (96.7%) | 12 (3.3%) |
| $100,000 and over | 3,278 (99.8%) | 8 (0.2%) |
Public vs Private Health Insurance Coverage by Age in Medford Lakes borough
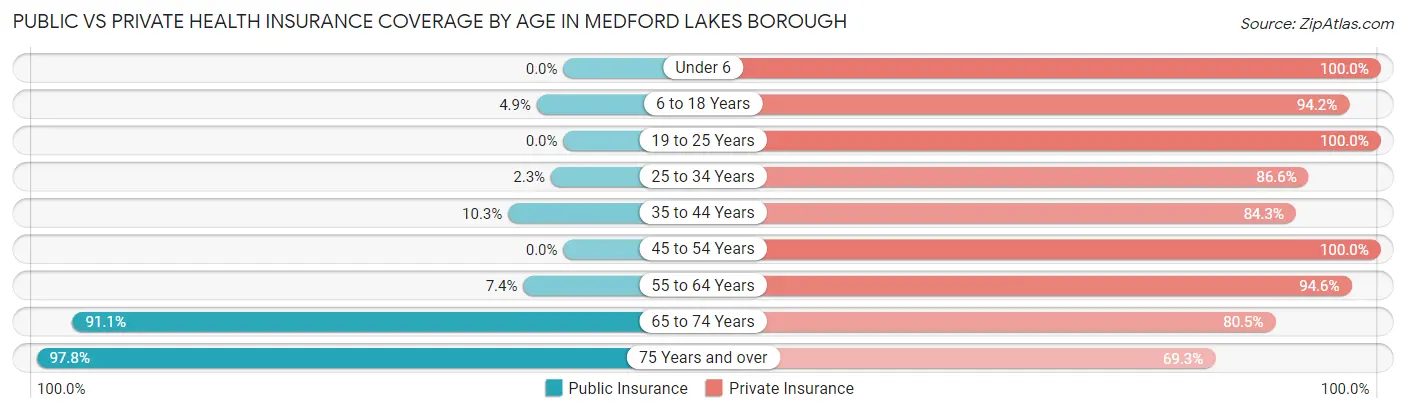
| Age Bracket | Public Insurance | Private Insurance |
| Under 6 | 0 (0.0%) | 247 (100.0%) |
| 6 to 18 Years | 43 (4.9%) | 823 (94.2%) |
| 19 to 25 Years | 0 (0.0%) | 240 (100.0%) |
| 25 to 34 Years | 9 (2.3%) | 337 (86.6%) |
| 35 to 44 Years | 41 (10.2%) | 337 (84.3%) |
| 45 to 54 Years | 0 (0.0%) | 637 (100.0%) |
| 55 to 64 Years | 41 (7.4%) | 522 (94.6%) |
| 65 to 74 Years | 471 (91.1%) | 416 (80.5%) |
| 75 Years and over | 398 (97.8%) | 282 (69.3%) |
| Total | 1,003 (23.5%) | 3,841 (90.1%) |
Disability Status by Sex by Age in Medford Lakes borough
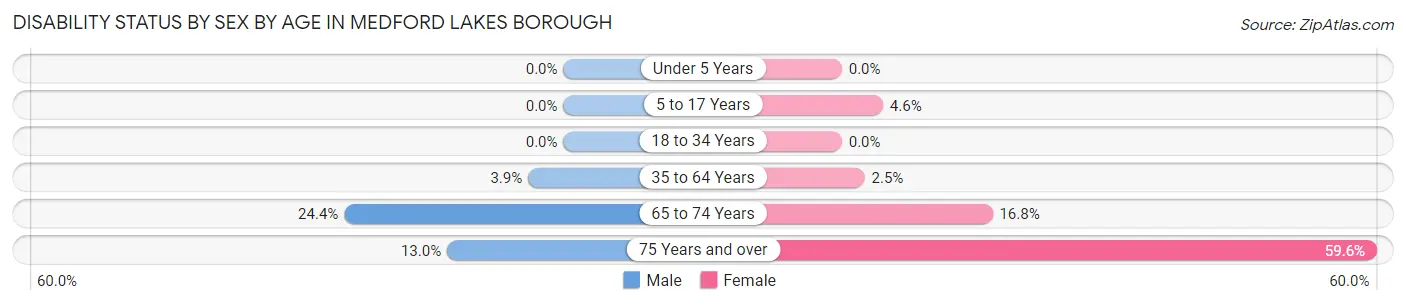
| Age Bracket | Male | Female |
| Under 5 Years | 0 (0.0%) | 0 (0.0%) |
| 5 to 17 Years | 0 (0.0%) | 23 (4.6%) |
| 18 to 34 Years | 0 (0.0%) | 0 (0.0%) |
| 35 to 64 Years | 30 (3.9%) | 21 (2.5%) |
| 65 to 74 Years | 52 (24.4%) | 51 (16.8%) |
| 75 Years and over | 21 (13.0%) | 146 (59.6%) |
Disability Class by Sex by Age in Medford Lakes borough
Disability Class: Hearing Difficulty
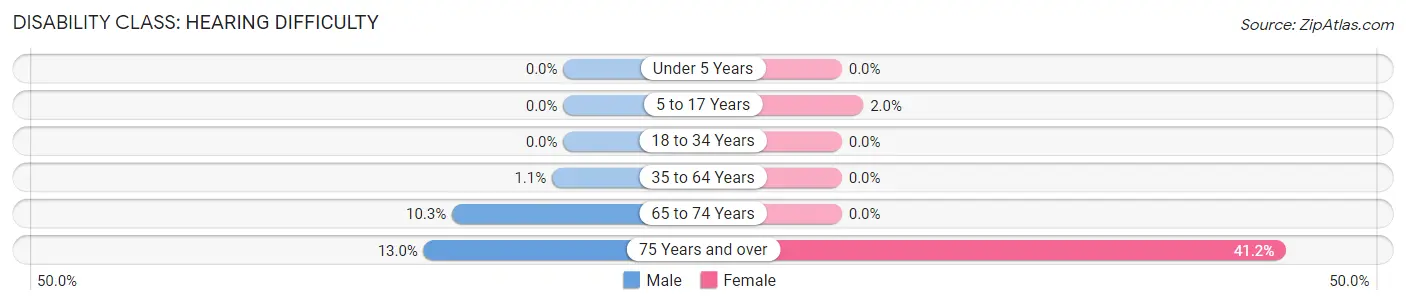
| Age Bracket | Male | Female |
| Under 5 Years | 0 (0.0%) | 0 (0.0%) |
| 5 to 17 Years | 0 (0.0%) | 10 (2.0%) |
| 18 to 34 Years | 0 (0.0%) | 0 (0.0%) |
| 35 to 64 Years | 8 (1.1%) | 0 (0.0%) |
| 65 to 74 Years | 22 (10.3%) | 0 (0.0%) |
| 75 Years and over | 21 (13.0%) | 101 (41.2%) |
Disability Class: Vision Difficulty
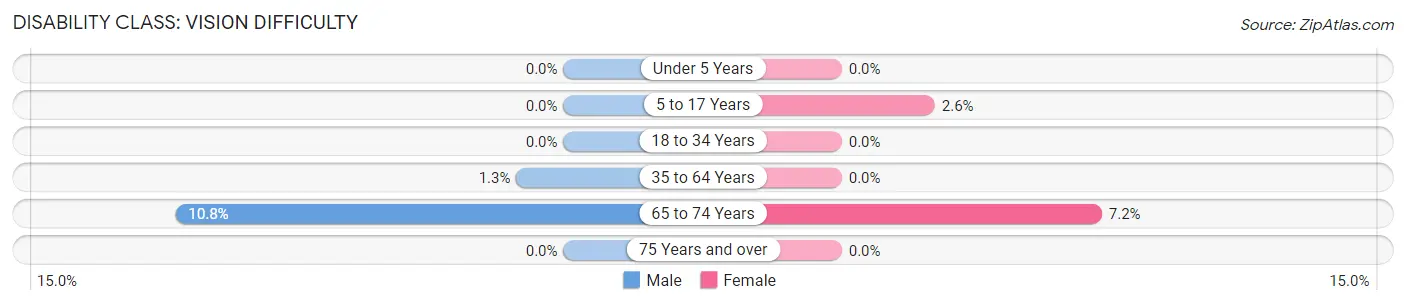
| Age Bracket | Male | Female |
| Under 5 Years | 0 (0.0%) | 0 (0.0%) |
| 5 to 17 Years | 0 (0.0%) | 13 (2.6%) |
| 18 to 34 Years | 0 (0.0%) | 0 (0.0%) |
| 35 to 64 Years | 10 (1.3%) | 0 (0.0%) |
| 65 to 74 Years | 23 (10.8%) | 22 (7.2%) |
| 75 Years and over | 0 (0.0%) | 0 (0.0%) |
Disability Class: Cognitive Difficulty
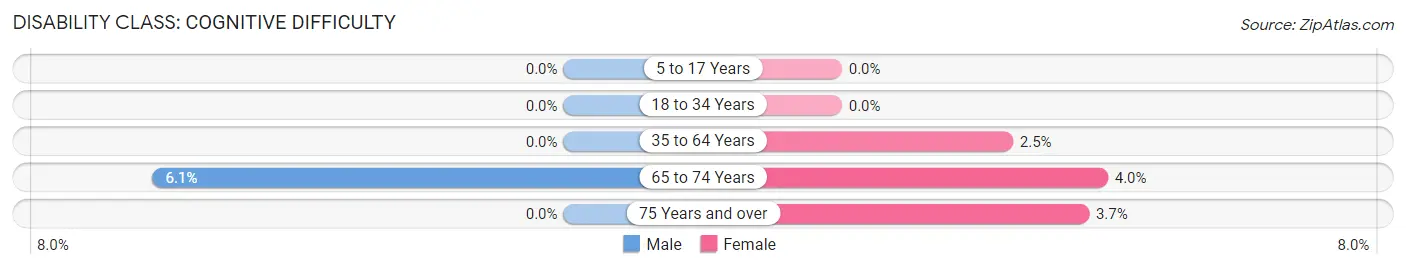
| Age Bracket | Male | Female |
| 5 to 17 Years | 0 (0.0%) | 0 (0.0%) |
| 18 to 34 Years | 0 (0.0%) | 0 (0.0%) |
| 35 to 64 Years | 0 (0.0%) | 21 (2.5%) |
| 65 to 74 Years | 13 (6.1%) | 12 (4.0%) |
| 75 Years and over | 0 (0.0%) | 9 (3.7%) |
Disability Class: Ambulatory Difficulty
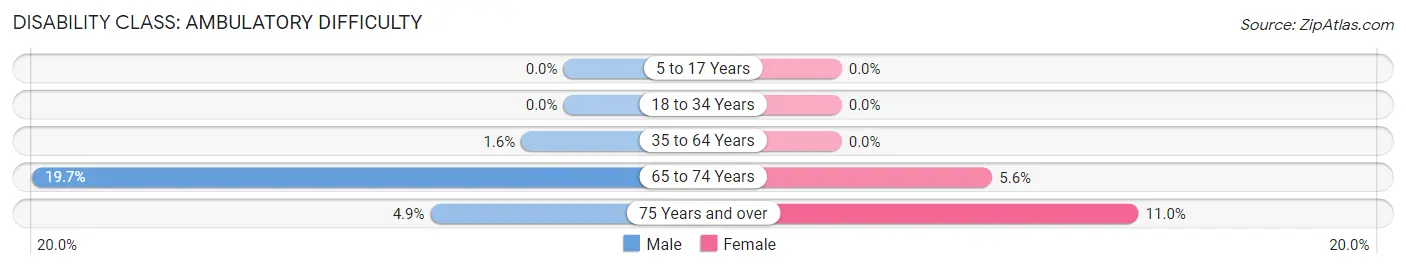
| Age Bracket | Male | Female |
| 5 to 17 Years | 0 (0.0%) | 0 (0.0%) |
| 18 to 34 Years | 0 (0.0%) | 0 (0.0%) |
| 35 to 64 Years | 12 (1.6%) | 0 (0.0%) |
| 65 to 74 Years | 42 (19.7%) | 17 (5.6%) |
| 75 Years and over | 8 (4.9%) | 27 (11.0%) |
Disability Class: Self-Care Difficulty
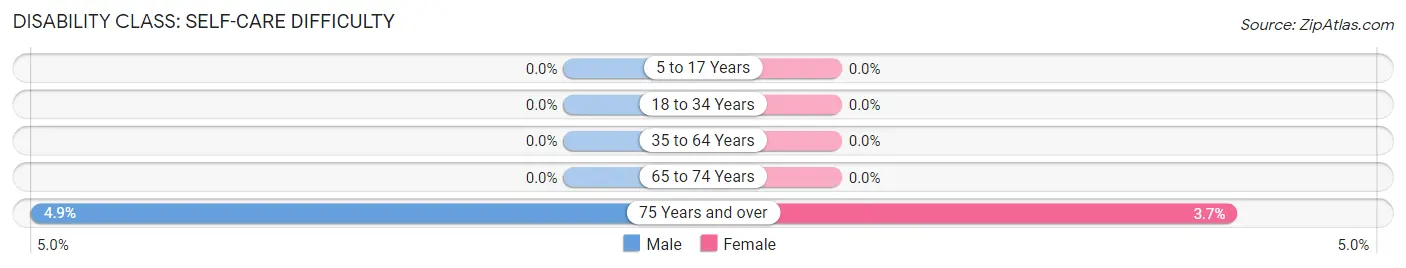
| Age Bracket | Male | Female |
| 5 to 17 Years | 0 (0.0%) | 0 (0.0%) |
| 18 to 34 Years | 0 (0.0%) | 0 (0.0%) |
| 35 to 64 Years | 0 (0.0%) | 0 (0.0%) |
| 65 to 74 Years | 0 (0.0%) | 0 (0.0%) |
| 75 Years and over | 8 (4.9%) | 9 (3.7%) |
Technology Access in Medford Lakes borough
Computing Device Access in Medford Lakes borough
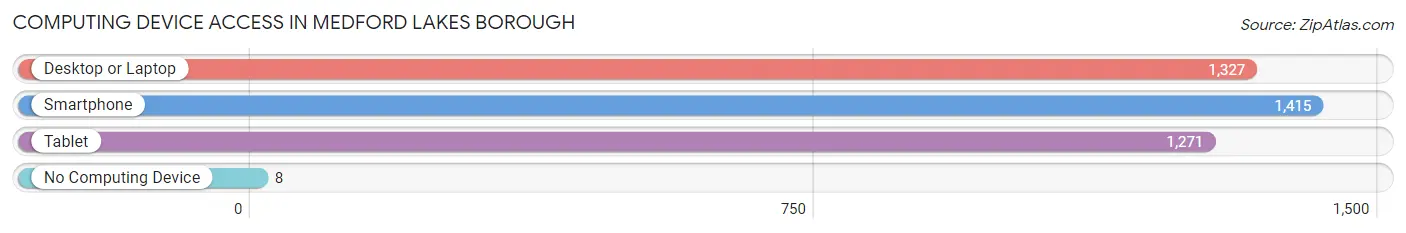
| Device Type | # Households | % Households |
| Desktop or Laptop | 1,327 | 90.5% |
| Smartphone | 1,415 | 96.5% |
| Tablet | 1,271 | 86.6% |
| No Computing Device | 8 | 0.5% |
| Total | 1,467 | 100.0% |
Internet Access in Medford Lakes borough
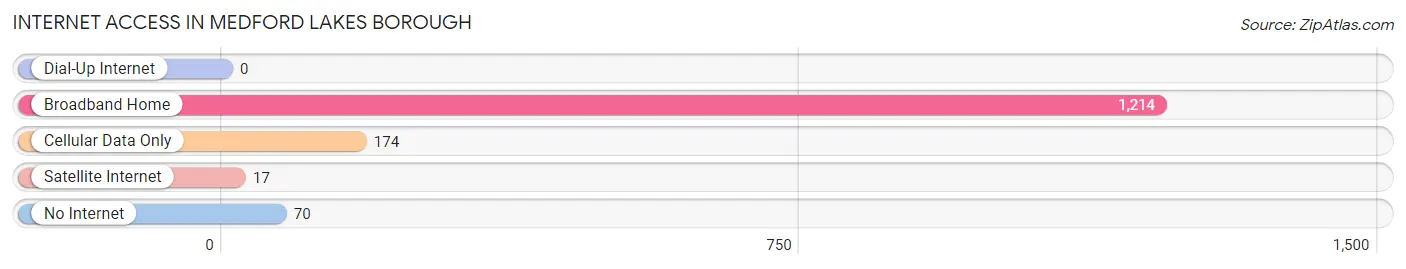
| Internet Type | # Households | % Households |
| Dial-Up Internet | 0 | 0.0% |
| Broadband Home | 1,214 | 82.8% |
| Cellular Data Only | 174 | 11.9% |
| Satellite Internet | 17 | 1.2% |
| No Internet | 70 | 4.8% |
| Total | 1,467 | 100.0% |
Medford Lakes borough Summary
Medford Lakes Borough is a small borough located in Burlington County, New Jersey. It is situated in the heart of the Pine Barrens, a unique and ecologically diverse region of the state. The borough is home to a population of approximately 4,000 people and is known for its picturesque lakes, wooded areas, and historic buildings.
History
The area that is now Medford Lakes Borough was originally inhabited by the Lenape Native Americans. The first European settlers arrived in the area in the late 1600s and established small farms. The area was known as Medford Township until it was incorporated as a borough in 1939. The name “Medford Lakes” was chosen to reflect the numerous lakes in the area.
The borough was originally a summer resort community, with many of the homes being used as vacation homes. In the 1950s, the borough began to transition to a year-round residential community. The borough has since become a popular place to live, with many of the homes being owner-occupied.
Geography
Medford Lakes Borough is located in the heart of the Pine Barrens, a unique and ecologically diverse region of the state. The borough is situated in the northwestern corner of Burlington County, approximately 25 miles east of Philadelphia. The borough is bordered by Medford Township to the north, Shamong Township to the east, Southampton Township to the south, and Tabernacle Township to the west.
The borough is home to a number of lakes, including Aetna Lake, Little Aetna Lake, Big Bear Lake, Little Bear Lake, and Lake Oswego. The borough is also home to a number of wooded areas, including the Medford Lakes Nature Preserve.
Economy
The economy of Medford Lakes Borough is largely based on tourism and retail. The borough is home to a number of small businesses, including restaurants, shops, and other services. The borough is also home to a number of corporate offices, including those of the Medford Lakes Corporation and the Medford Lakes Bank.
The borough is also home to a number of recreational activities, including fishing, boating, swimming, and hiking. The borough is also home to a number of parks, including the Medford Lakes Park and the Medford Lakes Nature Preserve.
Demographics
As of the 2010 census, the population of Medford Lakes Borough was 4,026. The racial makeup of the borough was 94.3% White, 2.2% African American, 0.3% Native American, 1.2% Asian, 0.1% Pacific Islander, 0.7% from other races, and 1.3% from two or more races. Hispanic or Latino of any race were 3.2% of the population.
The median household income in the borough was $90,945, and the median family income was $103,945. The per capita income for the borough was $41,945. About 2.7% of families and 3.3% of the population were below the poverty line, including 4.2% of those under age 18 and 2.2% of those age 65 or over.
Conclusion
Medford Lakes Borough is a small borough located in Burlington County, New Jersey. It is situated in the heart of the Pine Barrens, a unique and ecologically diverse region of the state. The borough is home to a population of approximately 4,000 people and is known for its picturesque lakes, wooded areas, and historic buildings. The economy of the borough is largely based on tourism and retail, and the borough is home to a number of recreational activities. The population of the borough is largely white, with a small percentage of African Americans, Native Americans, Asians, and other races. The median household income in the borough is $90,945, and the per capita income is $41,945.
Common Questions
What is the Total Population of Medford Lakes borough?
Total Population of Medford Lakes borough is 4,263.
What is the Total Male Population of Medford Lakes borough?
Total Male Population of Medford Lakes borough is 1,856.
What is the Total Female Population of Medford Lakes borough?
Total Female Population of Medford Lakes borough is 2,407.
What is the Ratio of Males per 100 Females in Medford Lakes borough?
There are 77.11 Males per 100 Females in Medford Lakes borough.
What is the Ratio of Females per 100 Males in Medford Lakes borough?
There are 129.69 Females per 100 Males in Medford Lakes borough.
What is the Median Population Age in Medford Lakes borough?
Median Population Age in Medford Lakes borough is 44.8 Years.
What is the Average Family Size in Medford Lakes borough
Average Family Size in Medford Lakes borough is 3.3 People.
What is the Average Household Size in Medford Lakes borough
Average Household Size in Medford Lakes borough is 2.9 People.
What is Per Capita Income in Medford Lakes borough?
Per Capita income in Medford Lakes borough is $59,215.
What is the Median Family Income in Medford Lakes borough?
Median Family Income in Medford Lakes borough is $157,434.
What is the Median Household income in Medford Lakes borough?
Median Household Income in Medford Lakes borough is $139,879.
What is Income or Wage Gap in Medford Lakes borough?
Income or Wage Gap in Medford Lakes borough is 60.0%.
Women in Medford Lakes borough earn 40.0 cents for every dollar earned by a man.
What is Inequality or Gini Index in Medford Lakes borough?
Inequality or Gini Index in Medford Lakes borough is 0.37.
How Large is the Labor Force in Medford Lakes borough?
There are 2,167 People in the Labor Forcein in Medford Lakes borough.
What is the Percentage of People in the Labor Force in Medford Lakes borough?
63.8% of People are in the Labor Force in Medford Lakes borough.
What is the Unemployment Rate in Medford Lakes borough?
Unemployment Rate in Medford Lakes borough is 3.4%.