Upper Pohatcong, NJ
Upper Pohatcong Map
Upper Pohatcong Overview
1,773
TOTAL POPULATION
926
MALE POPULATION
847
FEMALE POPULATION
109.33
MALES / 100 FEMALES
91.47
FEMALES / 100 MALES
38.3
MEDIAN AGE
2.7
AVG FAMILY SIZE
2.5
AVG HOUSEHOLD SIZE
$38,370
PER CAPITA INCOME
$106,071
AVG FAMILY INCOME
$95,893
AVG HOUSEHOLD INCOME
53.8%
WAGE / INCOME GAP [ % ]
46.2¢/ $1
WAGE / INCOME GAP [ $ ]
0.31
INEQUALITY / GINI INDEX
1,012
LABOR FORCE [ PEOPLE ]
67.9%
PERCENT IN LABOR FORCE
4.1%
UNEMPLOYMENT RATE
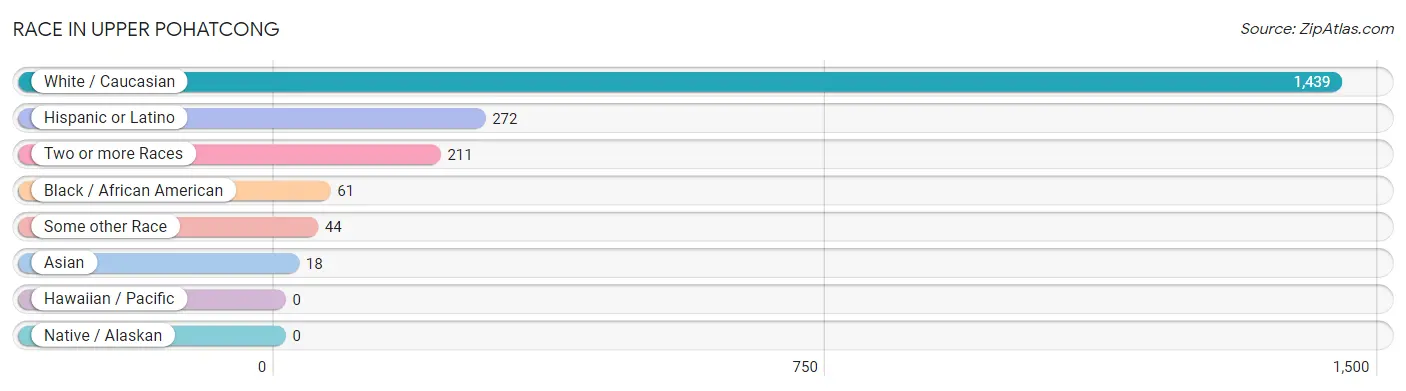
Race in Upper Pohatcong
The most populous races in Upper Pohatcong are White / Caucasian (1,439 | 81.2%), Hispanic or Latino (272 | 15.3%), and Two or more Races (211 | 11.9%).
| Race | # Population | % Population |
| Asian | 18 | 1.0% |
| Black / African American | 61 | 3.4% |
| Hawaiian / Pacific | 0 | 0.0% |
| Hispanic or Latino | 272 | 15.3% |
| Native / Alaskan | 0 | 0.0% |
| White / Caucasian | 1,439 | 81.2% |
| Two or more Races | 211 | 11.9% |
| Some other Race | 44 | 2.5% |
| Total | 1,773 | 100.0% |
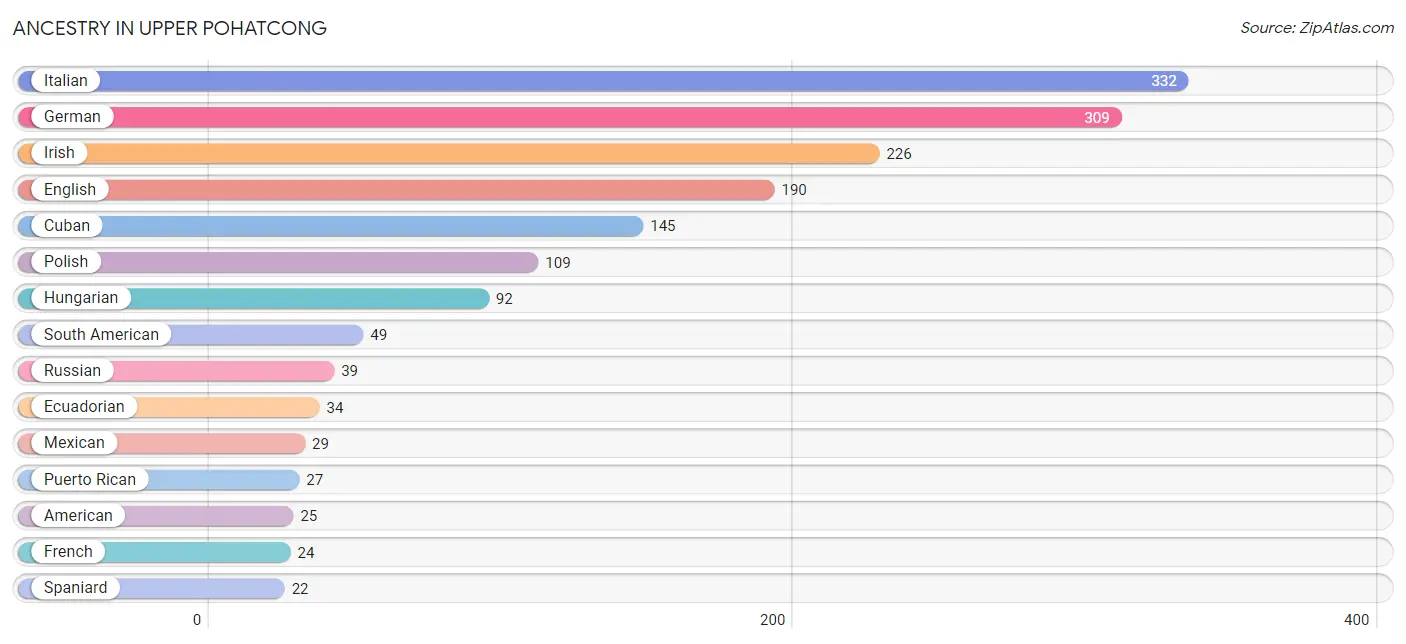
Ancestry in Upper Pohatcong
The most populous ancestries reported in Upper Pohatcong are Italian (332 | 18.7%), German (309 | 17.4%), Irish (226 | 12.8%), English (190 | 10.7%), and Cuban (145 | 8.2%), together accounting for 67.8% of all Upper Pohatcong residents.
| Ancestry | # Population | % Population |
| American | 25 | 1.4% |
| Arab | 12 | 0.7% |
| Burmese | 10 | 0.6% |
| Colombian | 15 | 0.9% |
| Cuban | 145 | 8.2% |
| Danish | 7 | 0.4% |
| Dutch | 10 | 0.6% |
| Ecuadorian | 34 | 1.9% |
| English | 190 | 10.7% |
| European | 12 | 0.7% |
| French | 24 | 1.3% |
| French Canadian | 15 | 0.9% |
| German | 309 | 17.4% |
| Hungarian | 92 | 5.2% |
| Indian (Asian) | 18 | 1.0% |
| Irish | 226 | 12.8% |
| Italian | 332 | 18.7% |
| Lithuanian | 20 | 1.1% |
| Mexican | 29 | 1.6% |
| Polish | 109 | 6.1% |
| Puerto Rican | 27 | 1.5% |
| Romanian | 7 | 0.4% |
| Russian | 39 | 2.2% |
| Scandinavian | 5 | 0.3% |
| Scottish | 13 | 0.7% |
| Slovak | 17 | 1.0% |
| South American | 49 | 2.8% |
| Spaniard | 22 | 1.2% |
| Welsh | 12 | 0.7% |
| West Indian | 10 | 0.6% | View All 30 Rows |
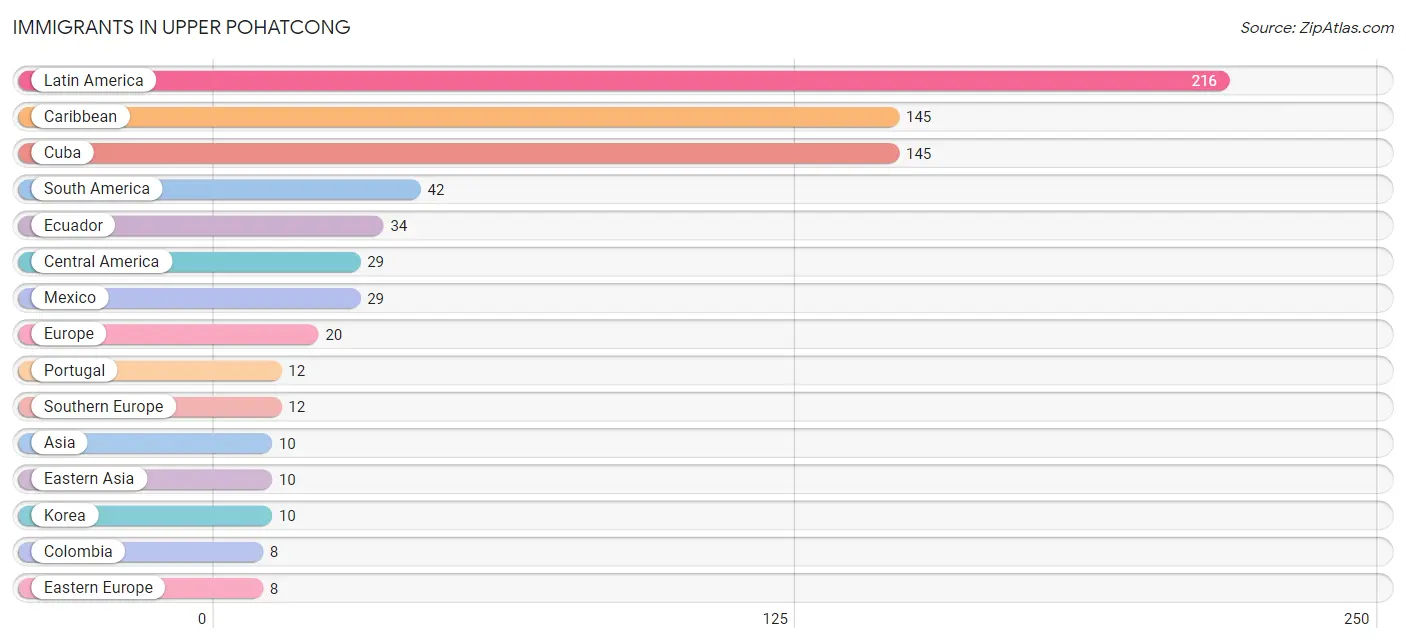
Immigrants in Upper Pohatcong
The most numerous immigrant groups reported in Upper Pohatcong came from Latin America (216 | 12.2%), Caribbean (145 | 8.2%), Cuba (145 | 8.2%), South America (42 | 2.4%), and Ecuador (34 | 1.9%), together accounting for 32.8% of all Upper Pohatcong residents.
| Immigration Origin | # Population | % Population |
| Asia | 10 | 0.6% |
| Caribbean | 145 | 8.2% |
| Central America | 29 | 1.6% |
| Colombia | 8 | 0.4% |
| Cuba | 145 | 8.2% |
| Eastern Asia | 10 | 0.6% |
| Eastern Europe | 8 | 0.4% |
| Ecuador | 34 | 1.9% |
| Europe | 20 | 1.1% |
| Korea | 10 | 0.6% |
| Latin America | 216 | 12.2% |
| Mexico | 29 | 1.6% |
| Poland | 8 | 0.4% |
| Portugal | 12 | 0.7% |
| South America | 42 | 2.4% |
| Southern Europe | 12 | 0.7% | View All 16 Rows |
Sex and Age in Upper Pohatcong
Sex and Age in Upper Pohatcong
The most populous age groups in Upper Pohatcong are 35 to 39 Years (154 | 16.6%) for men and 35 to 39 Years (118 | 13.9%) for women.
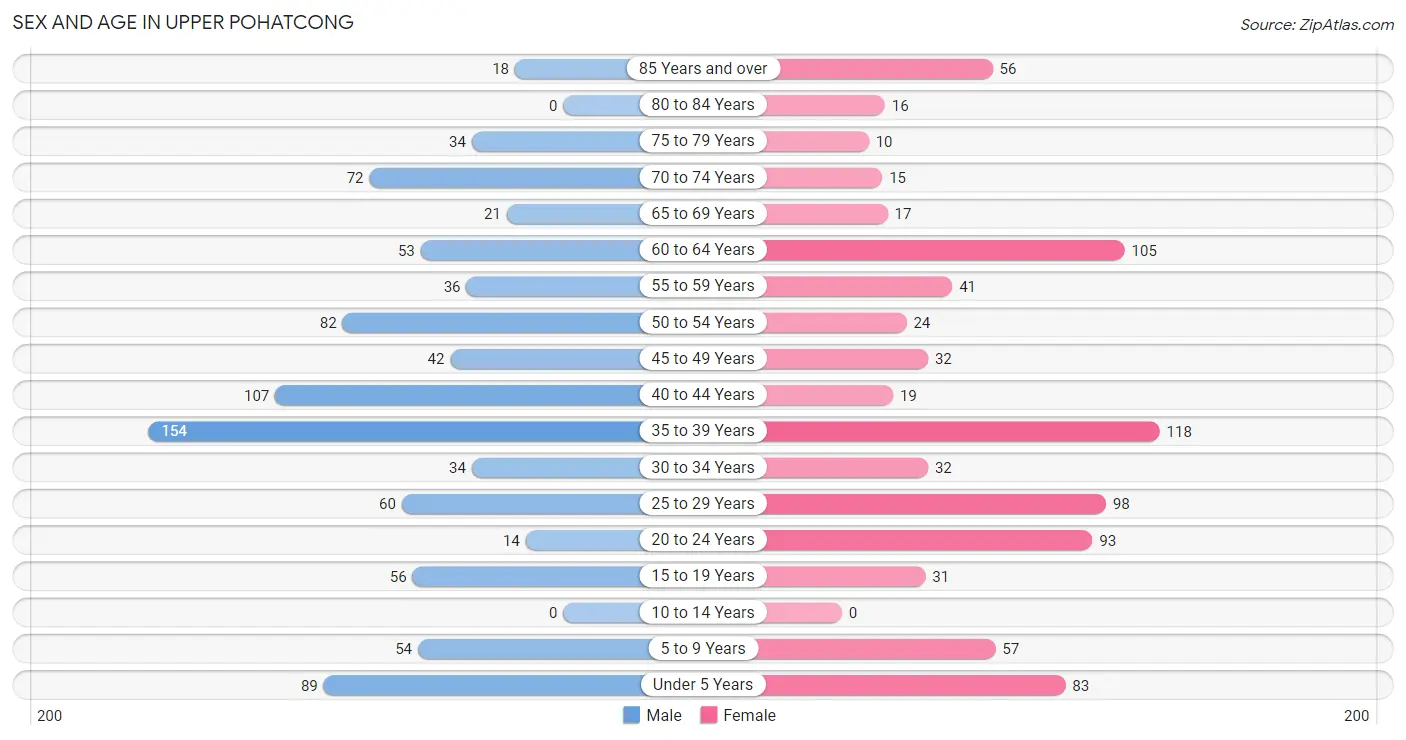
| Age Bracket | Male | Female |
| Under 5 Years | 89 (9.6%) | 83 (9.8%) |
| 5 to 9 Years | 54 (5.8%) | 57 (6.7%) |
| 10 to 14 Years | 0 (0.0%) | 0 (0.0%) |
| 15 to 19 Years | 56 (6.0%) | 31 (3.7%) |
| 20 to 24 Years | 14 (1.5%) | 93 (11.0%) |
| 25 to 29 Years | 60 (6.5%) | 98 (11.6%) |
| 30 to 34 Years | 34 (3.7%) | 32 (3.8%) |
| 35 to 39 Years | 154 (16.6%) | 118 (13.9%) |
| 40 to 44 Years | 107 (11.6%) | 19 (2.2%) |
| 45 to 49 Years | 42 (4.5%) | 32 (3.8%) |
| 50 to 54 Years | 82 (8.9%) | 24 (2.8%) |
| 55 to 59 Years | 36 (3.9%) | 41 (4.8%) |
| 60 to 64 Years | 53 (5.7%) | 105 (12.4%) |
| 65 to 69 Years | 21 (2.3%) | 17 (2.0%) |
| 70 to 74 Years | 72 (7.8%) | 15 (1.8%) |
| 75 to 79 Years | 34 (3.7%) | 10 (1.2%) |
| 80 to 84 Years | 0 (0.0%) | 16 (1.9%) |
| 85 Years and over | 18 (1.9%) | 56 (6.6%) |
| Total | 926 (100.0%) | 847 (100.0%) |
Families and Households in Upper Pohatcong
Median Family Size in Upper Pohatcong
The median family size in Upper Pohatcong is 2.72 persons per family, with single male/father families (92 | 17.2%) accounting for the largest median family size of 2.92 persons per family. On the other hand, single female/mother families (11 | 2.1%) represent the smallest median family size with 2.18 persons per family.
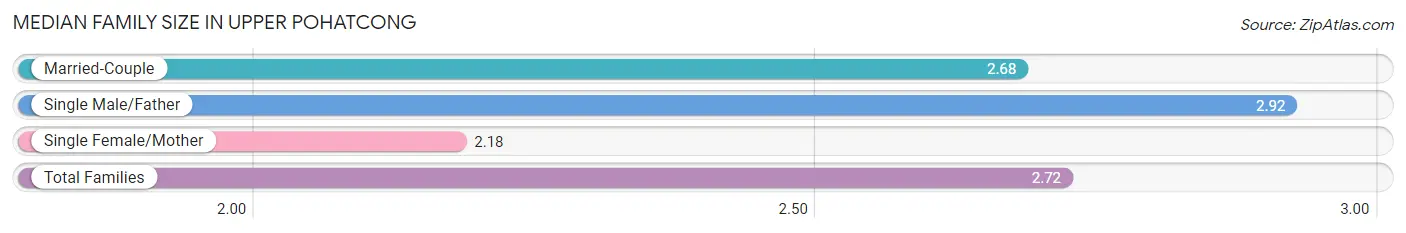
| Family Type | # Families | Family Size |
| Married-Couple | 431 (80.7%) | 2.68 |
| Single Male/Father | 92 (17.2%) | 2.92 |
| Single Female/Mother | 11 (2.1%) | 2.18 |
| Total Families | 534 (100.0%) | 2.72 |
Median Household Size in Upper Pohatcong
The median household size in Upper Pohatcong is 2.47 persons per household, with single male/father households (92 | 12.8%) accounting for the largest median household size of 3.34 persons per household. non-family households (183 | 25.5%) represent the smallest median household size with 1.22 persons per household.
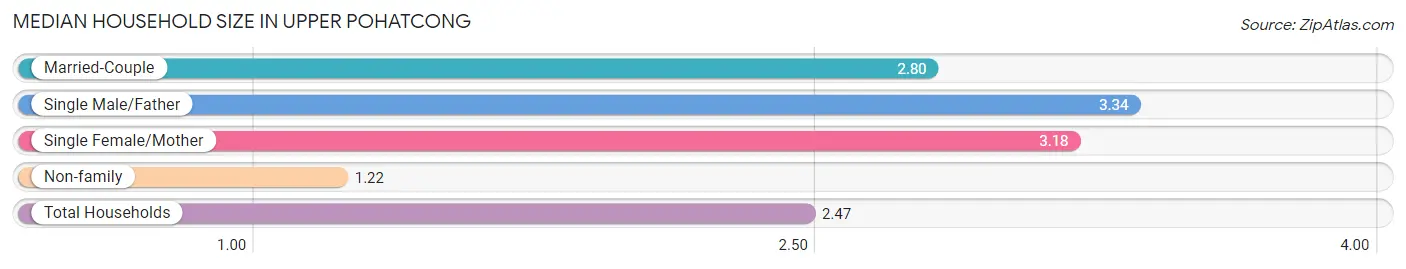
| Household Type | # Households | Household Size |
| Married-Couple | 431 (60.1%) | 2.80 |
| Single Male/Father | 92 (12.8%) | 3.34 |
| Single Female/Mother | 11 (1.5%) | 3.18 |
| Non-family | 183 (25.5%) | 1.22 |
| Total Households | 717 (100.0%) | 2.47 |
Household Size by Marriage Status in Upper Pohatcong
Out of a total of 717 households in Upper Pohatcong, 534 (74.5%) are family households, while 183 (25.5%) are nonfamily households. The most numerous type of family households are 3-person households, comprising 189, and the most common type of nonfamily households are 1-person households, comprising 142.
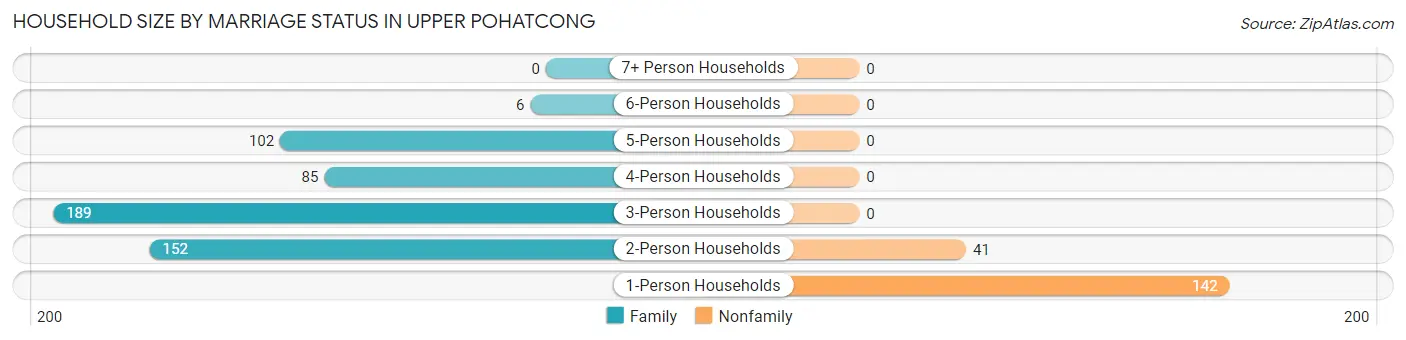
| Household Size | Family Households | Nonfamily Households |
| 1-Person Households | - | 142 (19.8%) |
| 2-Person Households | 152 (21.2%) | 41 (5.7%) |
| 3-Person Households | 189 (26.4%) | 0 (0.0%) |
| 4-Person Households | 85 (11.8%) | 0 (0.0%) |
| 5-Person Households | 102 (14.2%) | 0 (0.0%) |
| 6-Person Households | 6 (0.8%) | 0 (0.0%) |
| 7+ Person Households | 0 (0.0%) | 0 (0.0%) |
| Total | 534 (74.5%) | 183 (25.5%) |
Female Fertility in Upper Pohatcong
Fertility by Age in Upper Pohatcong
Average fertility rate in Upper Pohatcong is 19.0 births per 1,000 women. Women in the age bracket of 20 to 34 years have the highest fertility rate with 36.0 births per 1,000 women. Women in the age bracket of 20 to 34 years acount for 100.0% of all women with births.
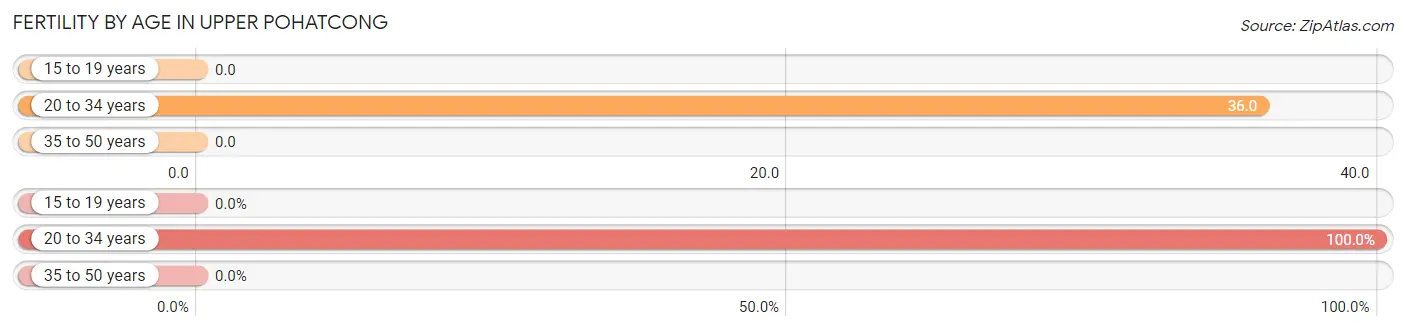
| Age Bracket | Women with Births | Births / 1,000 Women |
| 15 to 19 years | 0 (0.0%) | 0.0 |
| 20 to 34 years | 8 (100.0%) | 36.0 |
| 35 to 50 years | 0 (0.0%) | 0.0 |
| Total | 8 (100.0%) | 19.0 |
Fertility by Age by Marriage Status in Upper Pohatcong
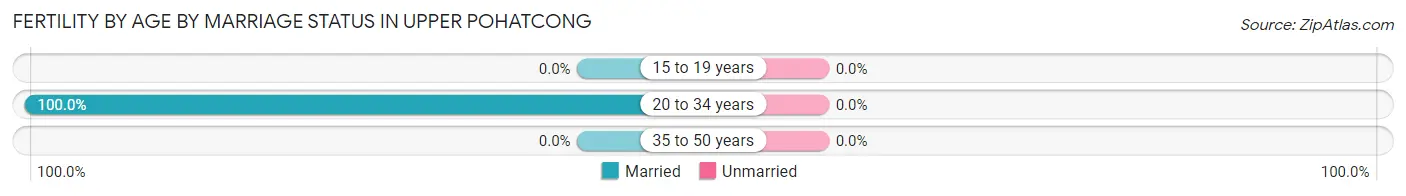
| Age Bracket | Married | Unmarried |
| 15 to 19 years | 0 (0.0%) | 0 (0.0%) |
| 20 to 34 years | 8 (100.0%) | 0 (0.0%) |
| 35 to 50 years | 0 (0.0%) | 0 (0.0%) |
| Total | 8 (100.0%) | 0 (0.0%) |
Fertility by Education in Upper Pohatcong
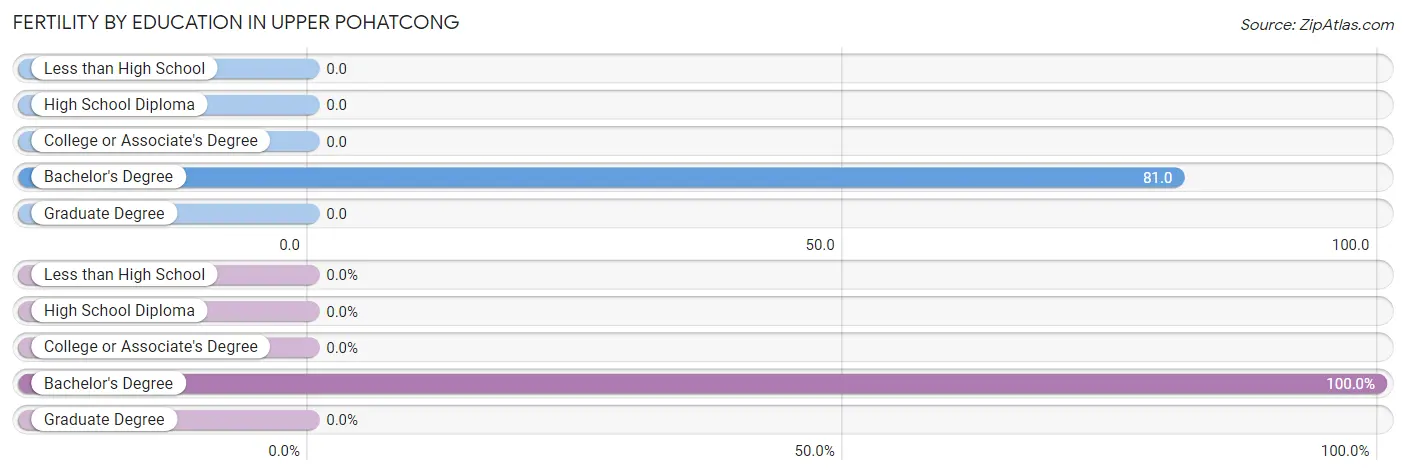
| Educational Attainment | Women with Births | Births / 1,000 Women |
| Less than High School | 0 (0.0%) | 0.0 |
| High School Diploma | 0 (0.0%) | 0.0 |
| College or Associate's Degree | 0 (0.0%) | 0.0 |
| Bachelor's Degree | 8 (100.0%) | 81.0 |
| Graduate Degree | 0 (0.0%) | 0.0 |
| Total | 8 (100.0%) | 19.0 |
Fertility by Education by Marriage Status in Upper Pohatcong
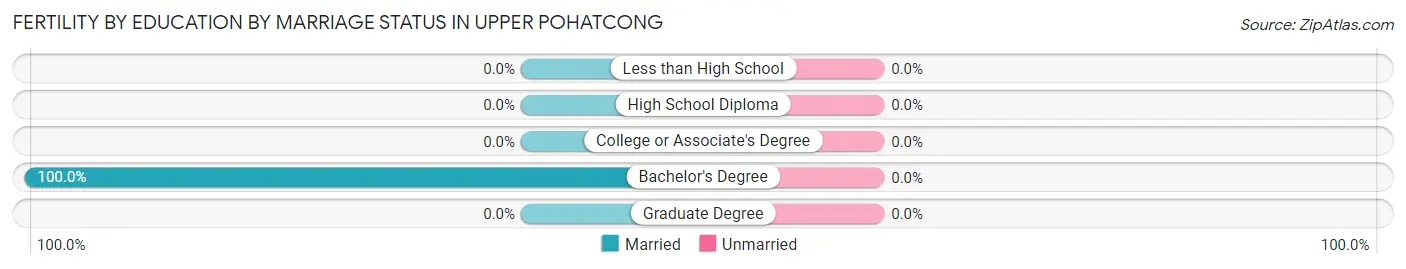
| Educational Attainment | Married | Unmarried |
| Less than High School | 0 (0.0%) | 0 (0.0%) |
| High School Diploma | 0 (0.0%) | 0 (0.0%) |
| College or Associate's Degree | 0 (0.0%) | 0 (0.0%) |
| Bachelor's Degree | 8 (100.0%) | 0 (0.0%) |
| Graduate Degree | 0 (0.0%) | 0 (0.0%) |
| Total | 8 (100.0%) | 0 (0.0%) |
Income in Upper Pohatcong
Income Overview in Upper Pohatcong
Per Capita Income in Upper Pohatcong is $38,370, while median incomes of families and households are $106,071 and $95,893 respectively.
| Characteristic | Number | Measure |
| Per Capita Income | 1,773 | $38,370 |
| Median Family Income | 534 | $106,071 |
| Mean Family Income | 534 | $109,686 |
| Median Household Income | 717 | $95,893 |
| Mean Household Income | 717 | $101,032 |
| Income Deficit | 534 | $0 |
| Wage / Income Gap (%) | 1,773 | 53.76% |
| Wage / Income Gap ($) | 1,773 | 46.24¢ per $1 |
| Gini / Inequality Index | 1,773 | 0.31 |
Earnings by Sex in Upper Pohatcong
Average Earnings in Upper Pohatcong are $46,398, $65,658 for men and $30,362 for women, a difference of 53.8%.
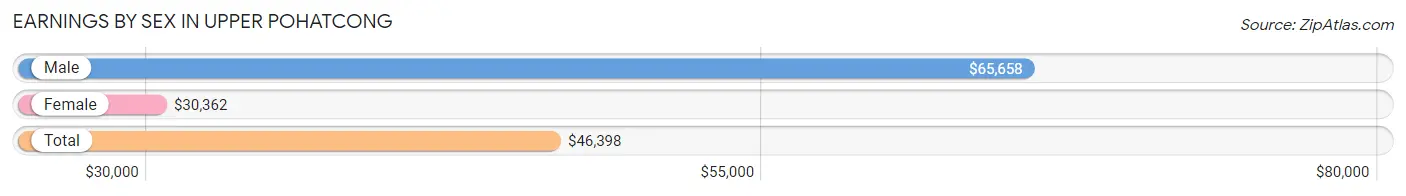
| Sex | Number | Average Earnings |
| Male | 594 (55.9%) | $65,658 |
| Female | 469 (44.1%) | $30,362 |
| Total | 1,063 (100.0%) | $46,398 |
Earnings by Sex by Income Bracket in Upper Pohatcong
The most common earnings brackets in Upper Pohatcong are $75,000 to $99,999 for men (168 | 28.3%) and $22,500 to $24,999 for women (67 | 14.3%).
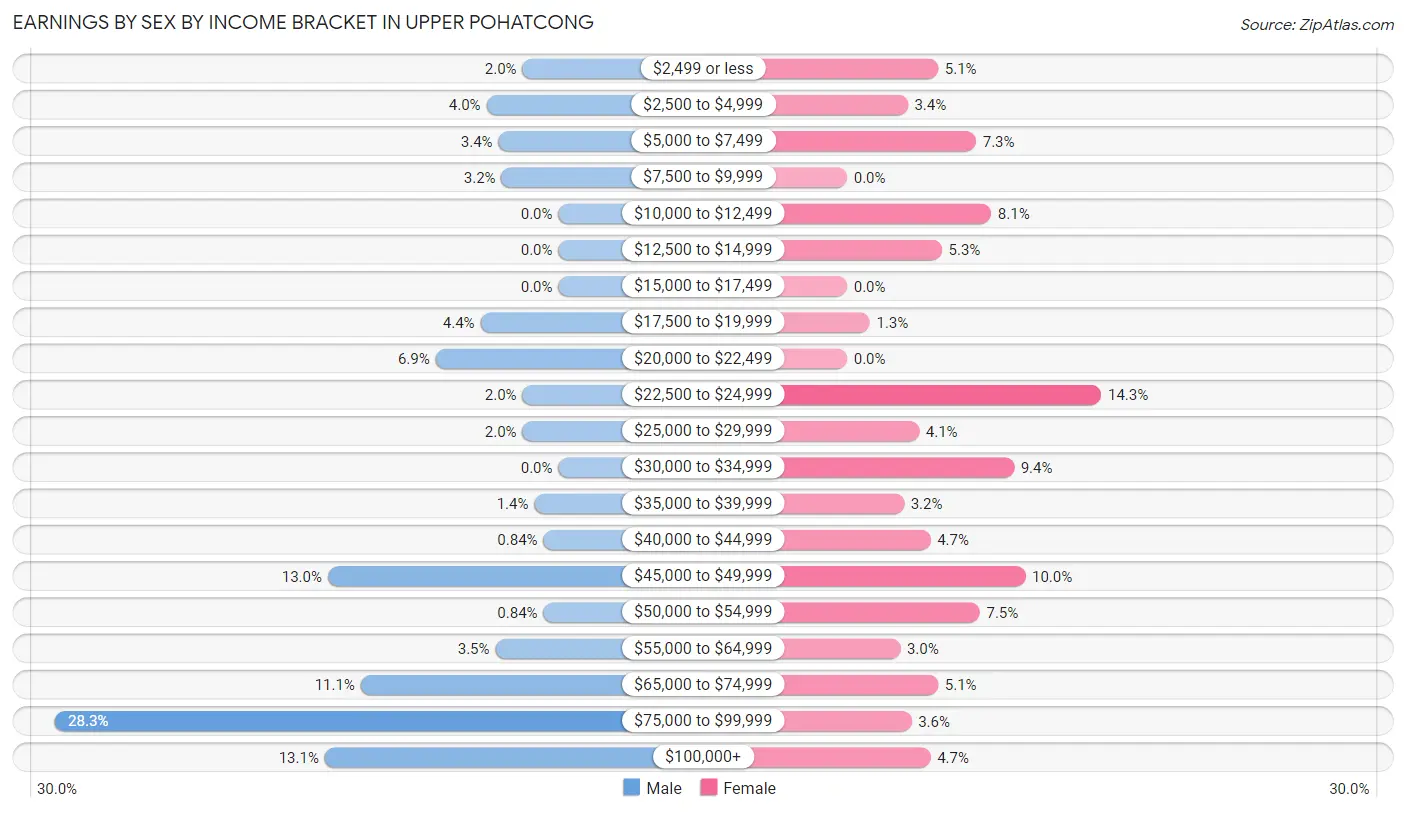
| Income | Male | Female |
| $2,499 or less | 12 (2.0%) | 24 (5.1%) |
| $2,500 to $4,999 | 24 (4.0%) | 16 (3.4%) |
| $5,000 to $7,499 | 20 (3.4%) | 34 (7.2%) |
| $7,500 to $9,999 | 19 (3.2%) | 0 (0.0%) |
| $10,000 to $12,499 | 0 (0.0%) | 38 (8.1%) |
| $12,500 to $14,999 | 0 (0.0%) | 25 (5.3%) |
| $15,000 to $17,499 | 0 (0.0%) | 0 (0.0%) |
| $17,500 to $19,999 | 26 (4.4%) | 6 (1.3%) |
| $20,000 to $22,499 | 41 (6.9%) | 0 (0.0%) |
| $22,500 to $24,999 | 12 (2.0%) | 67 (14.3%) |
| $25,000 to $29,999 | 12 (2.0%) | 19 (4.1%) |
| $30,000 to $34,999 | 0 (0.0%) | 44 (9.4%) |
| $35,000 to $39,999 | 8 (1.3%) | 15 (3.2%) |
| $40,000 to $44,999 | 5 (0.8%) | 22 (4.7%) |
| $45,000 to $49,999 | 77 (13.0%) | 47 (10.0%) |
| $50,000 to $54,999 | 5 (0.8%) | 35 (7.5%) |
| $55,000 to $64,999 | 21 (3.5%) | 14 (3.0%) |
| $65,000 to $74,999 | 66 (11.1%) | 24 (5.1%) |
| $75,000 to $99,999 | 168 (28.3%) | 17 (3.6%) |
| $100,000+ | 78 (13.1%) | 22 (4.7%) |
| Total | 594 (100.0%) | 469 (100.0%) |
Earnings by Sex by Educational Attainment in Upper Pohatcong
Average earnings in Upper Pohatcong are $66,886 for men and $30,066 for women, a difference of 55.0%. Men with an educational attainment of bachelor's degree enjoy the highest average annual earnings of $80,781, while those with high school diploma education earn the least with $67,283. Women with an educational attainment of graduate degree earn the most with the average annual earnings of $60,795, while those with college or associate's degree education have the smallest earnings of $23,906.
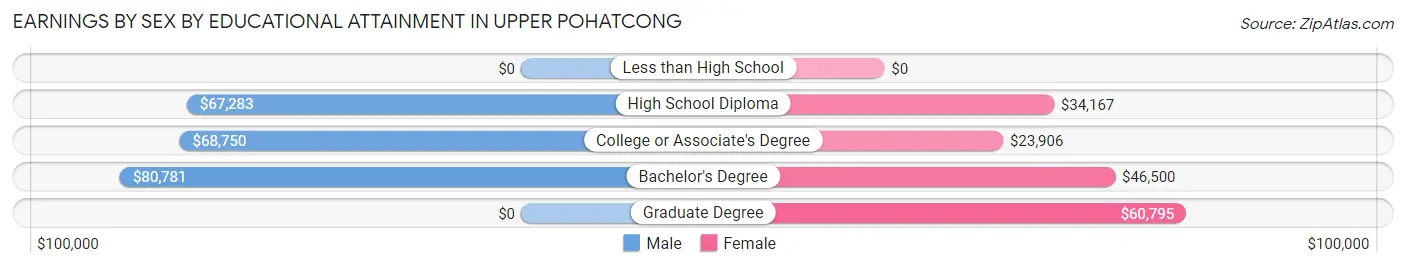
| Educational Attainment | Male Income | Female Income |
| Less than High School | - | - |
| High School Diploma | $67,283 | $34,167 |
| College or Associate's Degree | $68,750 | $23,906 |
| Bachelor's Degree | $80,781 | $46,500 |
| Graduate Degree | - | - |
| Total | $66,886 | $30,066 |
Family Income in Upper Pohatcong
Family Income Brackets in Upper Pohatcong
According to the Upper Pohatcong family income data, there are 122 families falling into the $100,000 to $149,999 income range, which is the most common income bracket and makes up 22.9% of all families.
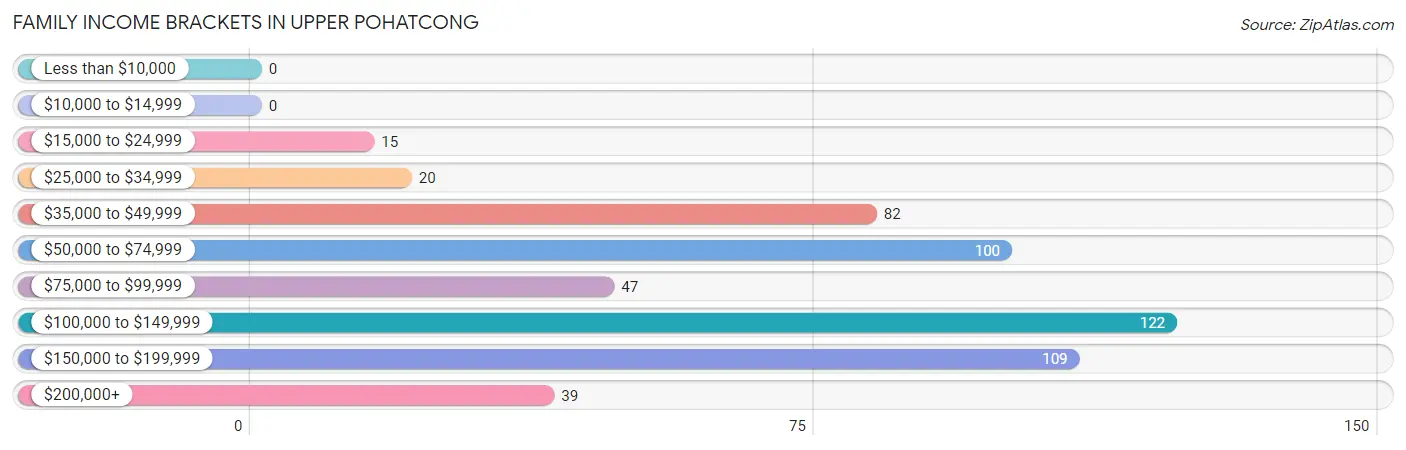
| Income Bracket | # Families | % Families |
| Less than $10,000 | 0 | 0.0% |
| $10,000 to $14,999 | 0 | 0.0% |
| $15,000 to $24,999 | 15 | 2.8% |
| $25,000 to $34,999 | 20 | 3.7% |
| $35,000 to $49,999 | 82 | 15.4% |
| $50,000 to $74,999 | 100 | 18.7% |
| $75,000 to $99,999 | 47 | 8.8% |
| $100,000 to $149,999 | 122 | 22.8% |
| $150,000 to $199,999 | 109 | 20.4% |
| $200,000+ | 39 | 7.3% |
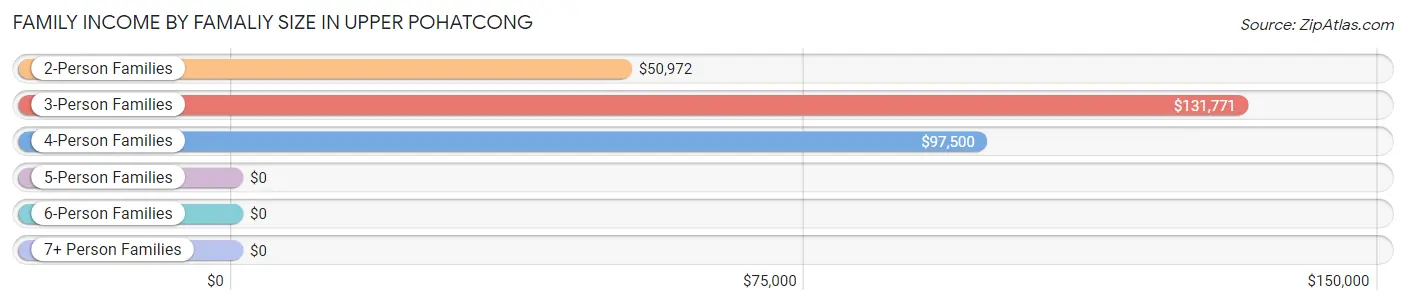
Family Income by Famaliy Size in Upper Pohatcong
3-person families (133 | 24.9%) account for the highest median family income in Upper Pohatcong with $131,771 per family, while 3-person families (133 | 24.9%) have the highest median income of $43,924 per family member.
| Income Bracket | # Families | Median Income |
| 2-Person Families | 211 (39.5%) | $50,972 |
| 3-Person Families | 133 (24.9%) | $131,771 |
| 4-Person Families | 134 (25.1%) | $97,500 |
| 5-Person Families | 56 (10.5%) | $0 |
| 6-Person Families | 0 (0.0%) | $0 |
| 7+ Person Families | 0 (0.0%) | $0 |
| Total | 534 (100.0%) | $106,071 |
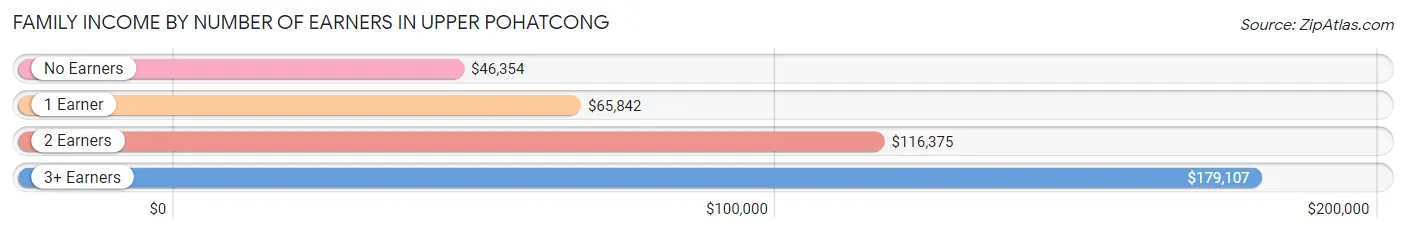
Family Income by Number of Earners in Upper Pohatcong
The median family income in Upper Pohatcong is $106,071, with families comprising 3+ earners (104) having the highest median family income of $179,107, while families with no earners (104) have the lowest median family income of $46,354, accounting for 19.5% and 19.5% of families, respectively.
| Number of Earners | # Families | Median Income |
| No Earners | 104 (19.5%) | $46,354 |
| 1 Earner | 129 (24.2%) | $65,842 |
| 2 Earners | 197 (36.9%) | $116,375 |
| 3+ Earners | 104 (19.5%) | $179,107 |
| Total | 534 (100.0%) | $106,071 |
Household Income in Upper Pohatcong
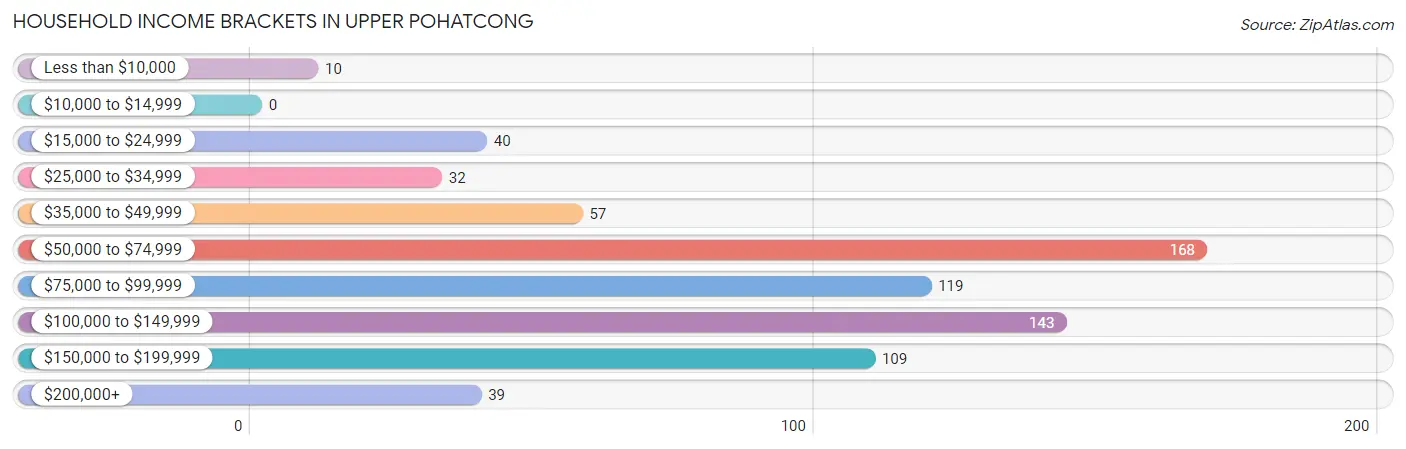
Household Income Brackets in Upper Pohatcong
With 168 households falling in the category, the $50,000 to $74,999 income range is the most frequent in Upper Pohatcong, accounting for 23.4% of all households.
| Income Bracket | # Households | % Households |
| Less than $10,000 | 10 | 1.4% |
| $10,000 to $14,999 | 0 | 0.0% |
| $15,000 to $24,999 | 40 | 5.6% |
| $25,000 to $34,999 | 32 | 4.5% |
| $35,000 to $49,999 | 57 | 7.9% |
| $50,000 to $74,999 | 168 | 23.4% |
| $75,000 to $99,999 | 119 | 16.6% |
| $100,000 to $149,999 | 143 | 19.9% |
| $150,000 to $199,999 | 109 | 15.2% |
| $200,000+ | 39 | 5.4% |
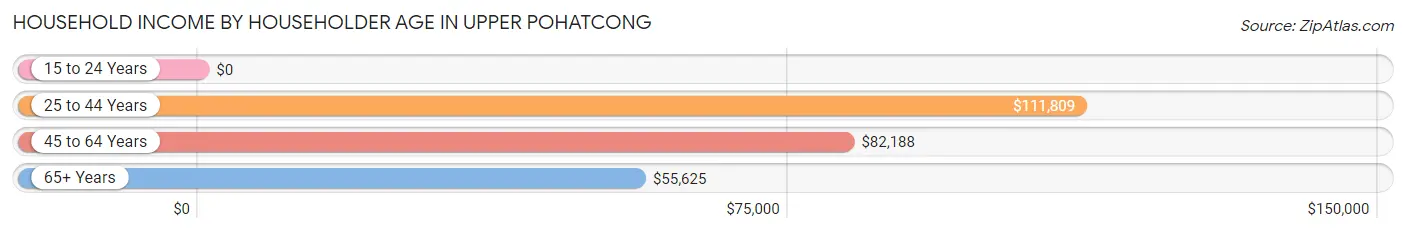
Household Income by Householder Age in Upper Pohatcong
The median household income in Upper Pohatcong is $95,893, with the highest median household income of $111,809 found in the 25 to 44 years age bracket for the primary householder. A total of 291 households (40.6%) fall into this category.
| Income Bracket | # Households | Median Income |
| 15 to 24 Years | 0 (0.0%) | $0 |
| 25 to 44 Years | 291 (40.6%) | $111,809 |
| 45 to 64 Years | 261 (36.4%) | $82,188 |
| 65+ Years | 165 (23.0%) | $55,625 |
| Total | 717 (100.0%) | $95,893 |
Poverty in Upper Pohatcong
Income Below Poverty by Sex and Age in Upper Pohatcong
With 6.8% poverty level for males and 5.4% for females among the residents of Upper Pohatcong, 6 to 11 year old males and 18 to 24 year old females are the most vulnerable to poverty, with 13 males (24.1%) and 17 females (15.6%) in their respective age groups living below the poverty level.
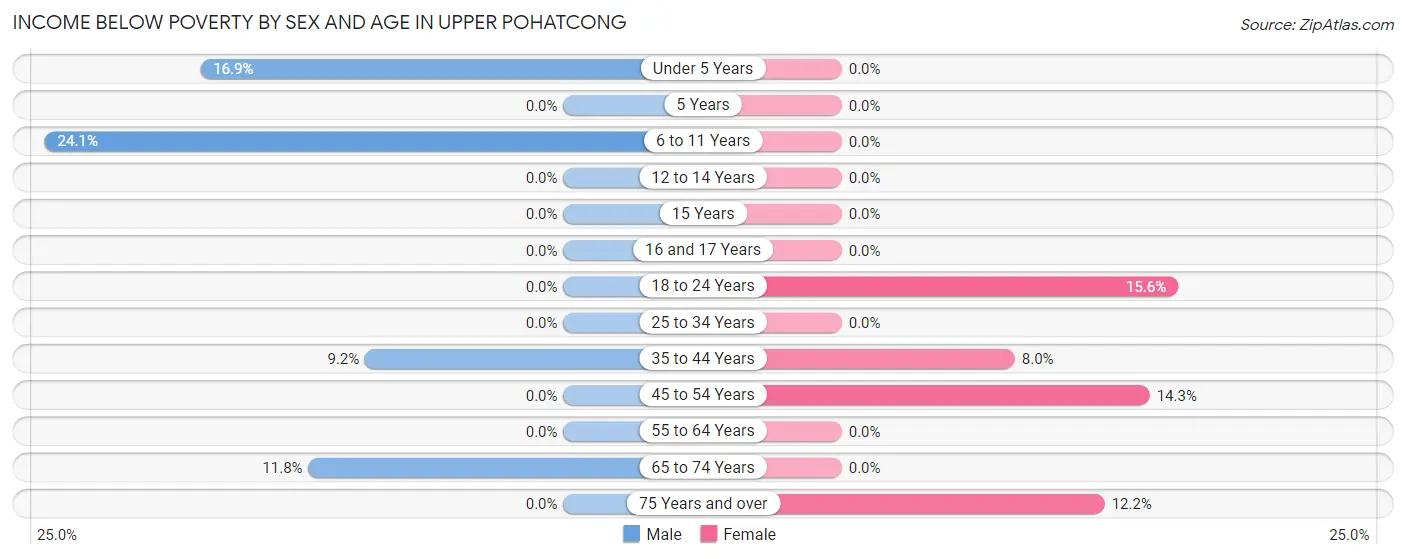
| Age Bracket | Male | Female |
| Under 5 Years | 15 (16.9%) | 0 (0.0%) |
| 5 Years | 0 (0.0%) | 0 (0.0%) |
| 6 to 11 Years | 13 (24.1%) | 0 (0.0%) |
| 12 to 14 Years | 0 (0.0%) | 0 (0.0%) |
| 15 Years | 0 (0.0%) | 0 (0.0%) |
| 16 and 17 Years | 0 (0.0%) | 0 (0.0%) |
| 18 to 24 Years | 0 (0.0%) | 17 (15.6%) |
| 25 to 34 Years | 0 (0.0%) | 0 (0.0%) |
| 35 to 44 Years | 24 (9.2%) | 11 (8.0%) |
| 45 to 54 Years | 0 (0.0%) | 8 (14.3%) |
| 55 to 64 Years | 0 (0.0%) | 0 (0.0%) |
| 65 to 74 Years | 11 (11.8%) | 0 (0.0%) |
| 75 Years and over | 0 (0.0%) | 10 (12.2%) |
| Total | 63 (6.8%) | 46 (5.4%) |
Income Above Poverty by Sex and Age in Upper Pohatcong
According to the poverty statistics in Upper Pohatcong, males aged 16 and 17 years and females aged under 5 years are the age groups that are most secure financially, with 100.0% of males and 100.0% of females in these age groups living above the poverty line.
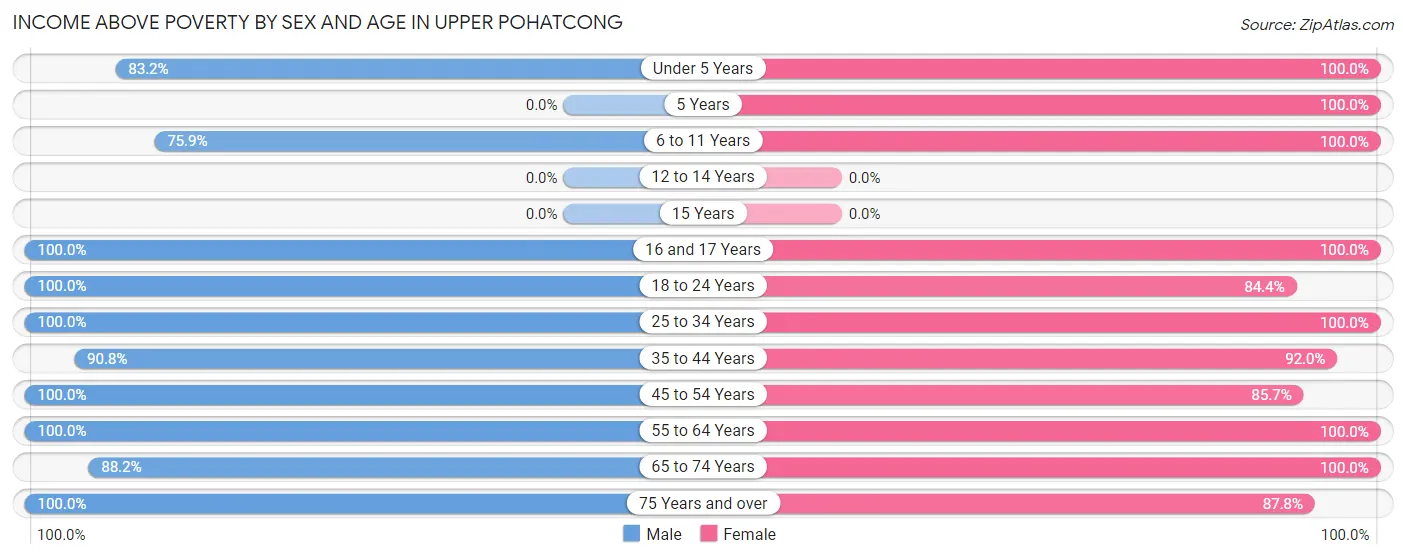
| Age Bracket | Male | Female |
| Under 5 Years | 74 (83.2%) | 83 (100.0%) |
| 5 Years | 0 (0.0%) | 40 (100.0%) |
| 6 to 11 Years | 41 (75.9%) | 17 (100.0%) |
| 12 to 14 Years | 0 (0.0%) | 0 (0.0%) |
| 15 Years | 0 (0.0%) | 0 (0.0%) |
| 16 and 17 Years | 14 (100.0%) | 15 (100.0%) |
| 18 to 24 Years | 56 (100.0%) | 92 (84.4%) |
| 25 to 34 Years | 94 (100.0%) | 130 (100.0%) |
| 35 to 44 Years | 237 (90.8%) | 126 (92.0%) |
| 45 to 54 Years | 124 (100.0%) | 48 (85.7%) |
| 55 to 64 Years | 89 (100.0%) | 146 (100.0%) |
| 65 to 74 Years | 82 (88.2%) | 32 (100.0%) |
| 75 Years and over | 52 (100.0%) | 72 (87.8%) |
| Total | 863 (93.2%) | 801 (94.6%) |
Income Below Poverty Among Married-Couple Families in Upper Pohatcong
The poverty statistics for married-couple families in Upper Pohatcong show that 3.5% or 15 of the total 431 families live below the poverty line. Families with 1 or 2 children have the highest poverty rate of 10.3%, comprising of 15 families. On the other hand, families with no children have the lowest poverty rate of 0.0%, which includes 0 families.
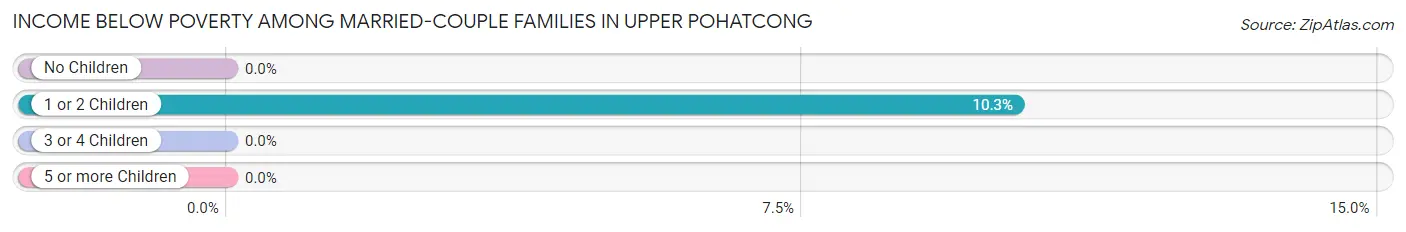
| Children | Above Poverty | Below Poverty |
| No Children | 285 (100.0%) | 0 (0.0%) |
| 1 or 2 Children | 131 (89.7%) | 15 (10.3%) |
| 3 or 4 Children | 0 (0.0%) | 0 (0.0%) |
| 5 or more Children | 0 (0.0%) | 0 (0.0%) |
| Total | 416 (96.5%) | 15 (3.5%) |
Income Below Poverty Among Single-Parent Households in Upper Pohatcong
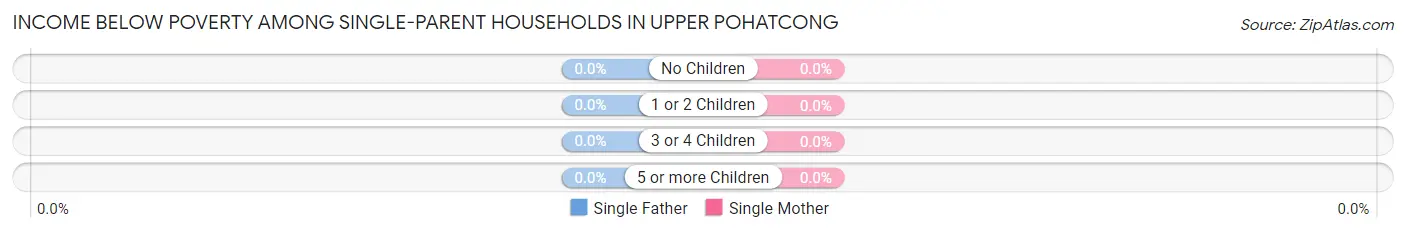
| Children | Single Father | Single Mother |
| No Children | 0 (0.0%) | 0 (0.0%) |
| 1 or 2 Children | 0 (0.0%) | 0 (0.0%) |
| 3 or 4 Children | 0 (0.0%) | 0 (0.0%) |
| 5 or more Children | 0 (0.0%) | 0 (0.0%) |
| Total | 0 (0.0%) | 0 (0.0%) |
Income Below Poverty Among Married-Couple vs Single-Parent Households in Upper Pohatcong
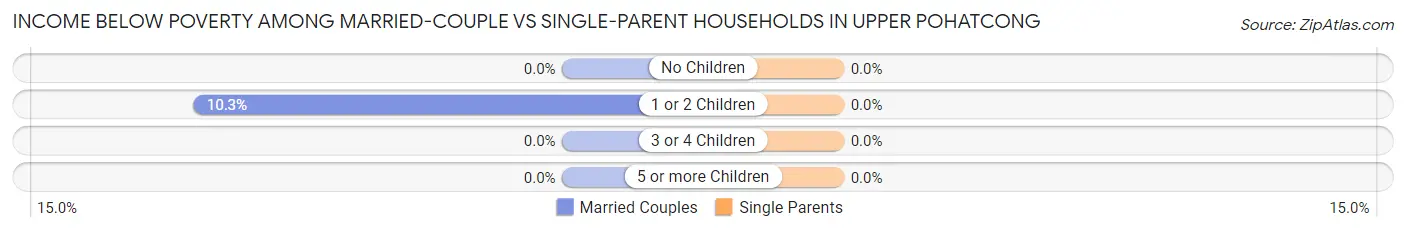
| Children | Married-Couple Families | Single-Parent Households |
| No Children | 0 (0.0%) | 0 (0.0%) |
| 1 or 2 Children | 15 (10.3%) | 0 (0.0%) |
| 3 or 4 Children | 0 (0.0%) | 0 (0.0%) |
| 5 or more Children | 0 (0.0%) | 0 (0.0%) |
| Total | 15 (3.5%) | 0 (0.0%) |
Employment Characteristics in Upper Pohatcong
Employment by Class of Employer in Upper Pohatcong
Among the 940 employed individuals in Upper Pohatcong, private company employees (546 | 58.1%), local government employees (228 | 24.3%), and not-for-profit organizations (103 | 11.0%) make up the most common classes of employment.
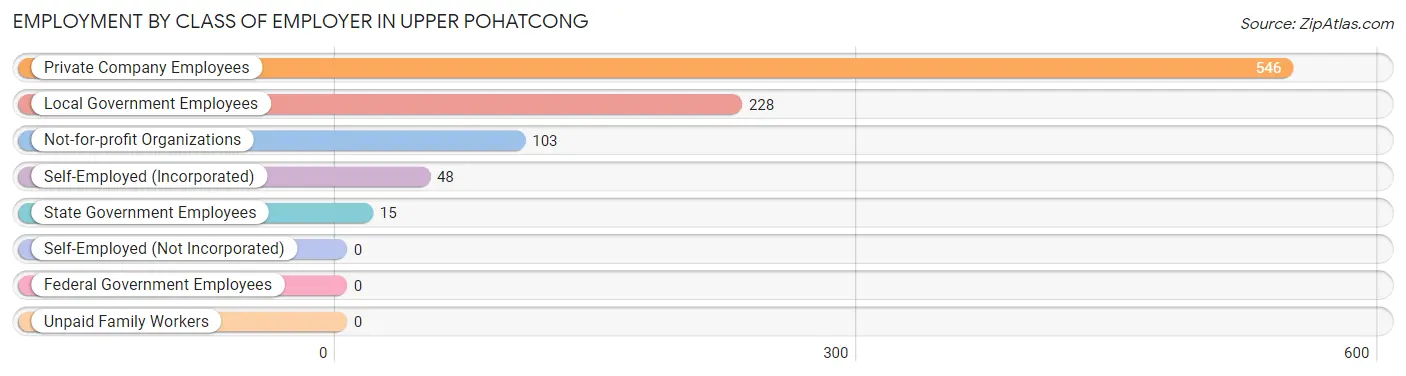
| Employer Class | # Employees | % Employees |
| Private Company Employees | 546 | 58.1% |
| Self-Employed (Incorporated) | 48 | 5.1% |
| Self-Employed (Not Incorporated) | 0 | 0.0% |
| Not-for-profit Organizations | 103 | 11.0% |
| Local Government Employees | 228 | 24.3% |
| State Government Employees | 15 | 1.6% |
| Federal Government Employees | 0 | 0.0% |
| Unpaid Family Workers | 0 | 0.0% |
| Total | 940 | 100.0% |
Employment Status by Age in Upper Pohatcong
According to the labor force statistics for Upper Pohatcong, out of the total population over 16 years of age (1,490), 67.9% or 1,012 individuals are in the labor force, with 4.1% or 41 of them unemployed. The age group with the highest labor force participation rate is 25 to 29 years, with 100.0% or 158 individuals in the labor force. Within the labor force, the 65 to 74 years age range has the highest percentage of unemployed individuals, with 50.0% or 6 of them being unemployed.
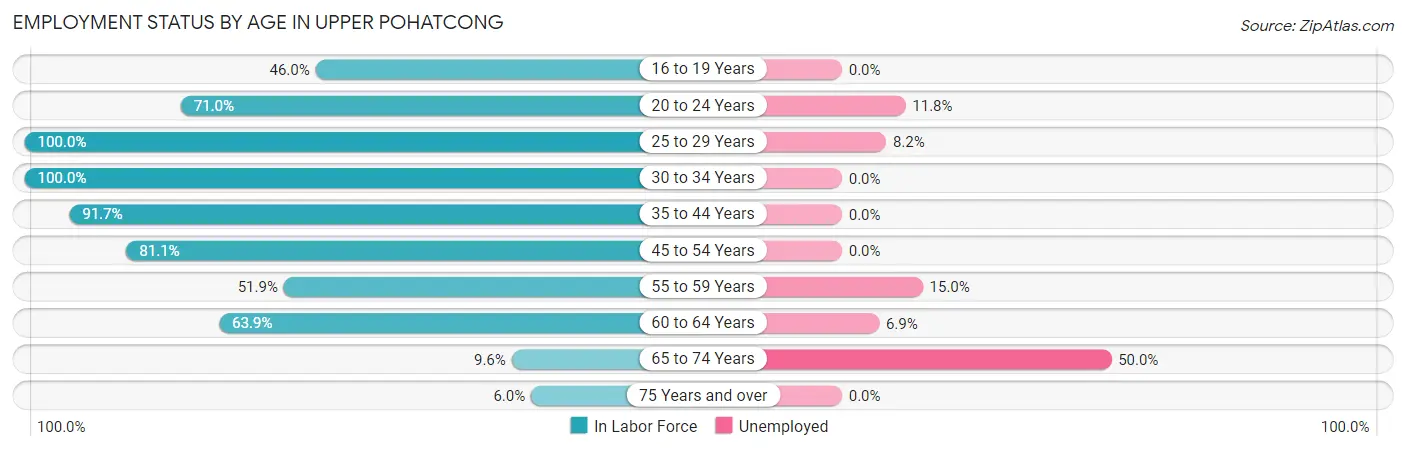
| Age Bracket | In Labor Force | Unemployed |
| 16 to 19 Years | 40 (46.0%) | 0 (0.0%) |
| 20 to 24 Years | 76 (71.0%) | 9 (11.8%) |
| 25 to 29 Years | 158 (100.0%) | 13 (8.2%) |
| 30 to 34 Years | 66 (100.0%) | 0 (0.0%) |
| 35 to 44 Years | 365 (91.7%) | 0 (0.0%) |
| 45 to 54 Years | 146 (81.1%) | 0 (0.0%) |
| 55 to 59 Years | 40 (51.9%) | 6 (15.0%) |
| 60 to 64 Years | 101 (63.9%) | 7 (6.9%) |
| 65 to 74 Years | 12 (9.6%) | 6 (50.0%) |
| 75 Years and over | 8 (6.0%) | 0 (0.0%) |
| Total | 1,012 (67.9%) | 41 (4.1%) |
Employment Status by Educational Attainment in Upper Pohatcong
According to labor force statistics for Upper Pohatcong, 84.5% of individuals (876) out of the total population between 25 and 64 years of age (1,037) are in the labor force, with 3.0% or 26 of them being unemployed. The group with the highest labor force participation rate are those with the educational attainment of less than high school, with 100.0% or 37 individuals in the labor force. Within the labor force, individuals with bachelor's degree or higher education have the highest percentage of unemployment, with 8.4% or 20 of them being unemployed.
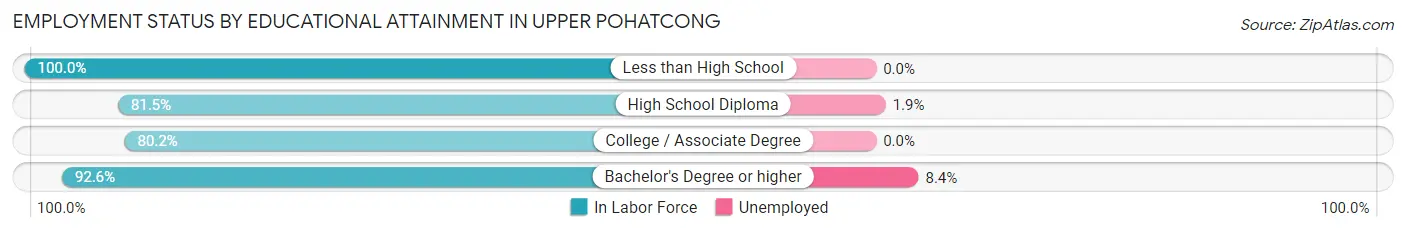
| Educational Attainment | In Labor Force | Unemployed |
| Less than High School | 37 (100.0%) | 0 (0.0%) |
| High School Diploma | 318 (81.5%) | 7 (1.9%) |
| College / Associate Degree | 283 (80.2%) | 0 (0.0%) |
| Bachelor's Degree or higher | 238 (92.6%) | 22 (8.4%) |
| Total | 876 (84.5%) | 31 (3.0%) |
Employment Occupations by Sex in Upper Pohatcong
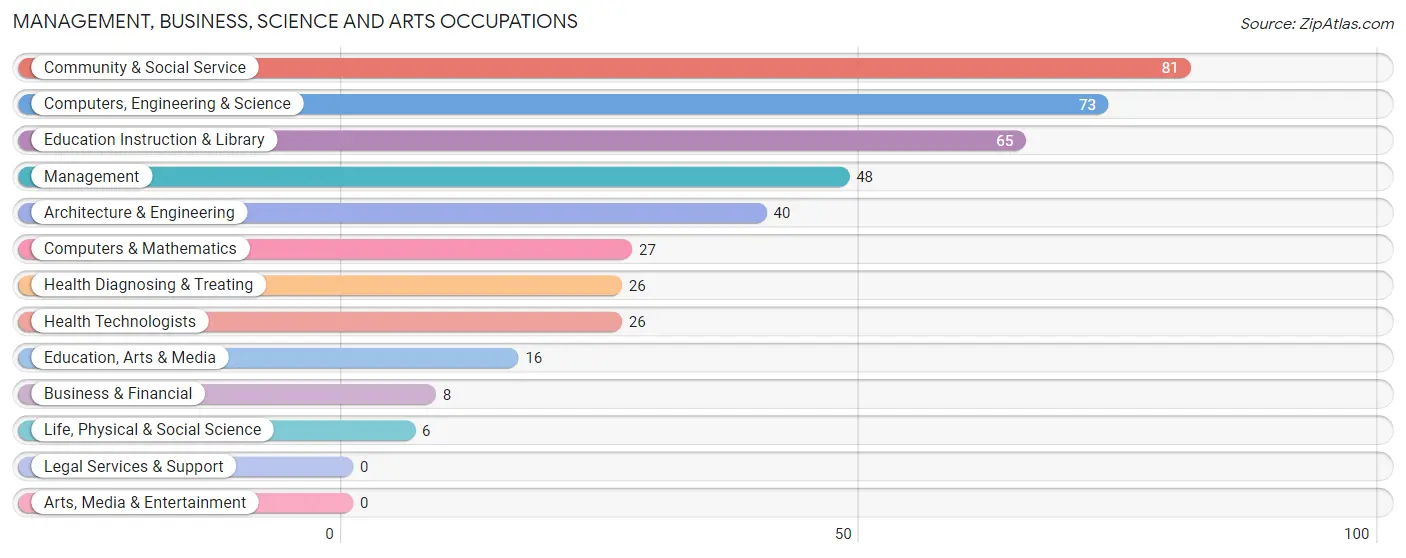
Management, Business, Science and Arts Occupations
The most common Management, Business, Science and Arts occupations in Upper Pohatcong are Community & Social Service (81 | 8.3%), Computers, Engineering & Science (73 | 7.5%), Education Instruction & Library (65 | 6.7%), Management (48 | 4.9%), and Architecture & Engineering (40 | 4.1%).
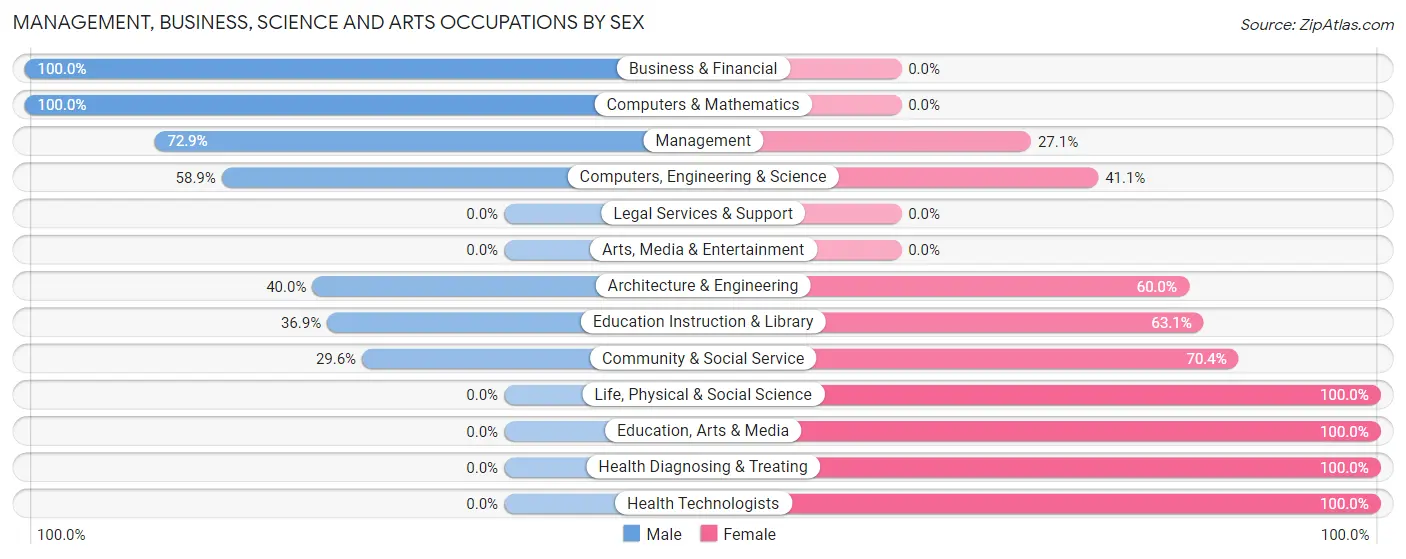
Management, Business, Science and Arts Occupations by Sex
Within the Management, Business, Science and Arts occupations in Upper Pohatcong, the most male-oriented occupations are Business & Financial (100.0%), Computers & Mathematics (100.0%), and Management (72.9%), while the most female-oriented occupations are Life, Physical & Social Science (100.0%), Education, Arts & Media (100.0%), and Health Diagnosing & Treating (100.0%).
| Occupation | Male | Female |
| Management | 35 (72.9%) | 13 (27.1%) |
| Business & Financial | 8 (100.0%) | 0 (0.0%) |
| Computers, Engineering & Science | 43 (58.9%) | 30 (41.1%) |
| Computers & Mathematics | 27 (100.0%) | 0 (0.0%) |
| Architecture & Engineering | 16 (40.0%) | 24 (60.0%) |
| Life, Physical & Social Science | 0 (0.0%) | 6 (100.0%) |
| Community & Social Service | 24 (29.6%) | 57 (70.4%) |
| Education, Arts & Media | 0 (0.0%) | 16 (100.0%) |
| Legal Services & Support | 0 (0.0%) | 0 (0.0%) |
| Education Instruction & Library | 24 (36.9%) | 41 (63.1%) |
| Arts, Media & Entertainment | 0 (0.0%) | 0 (0.0%) |
| Health Diagnosing & Treating | 0 (0.0%) | 26 (100.0%) |
| Health Technologists | 0 (0.0%) | 26 (100.0%) |
| Total (Category) | 110 (46.6%) | 126 (53.4%) |
| Total (Overall) | 558 (57.5%) | 413 (42.5%) |
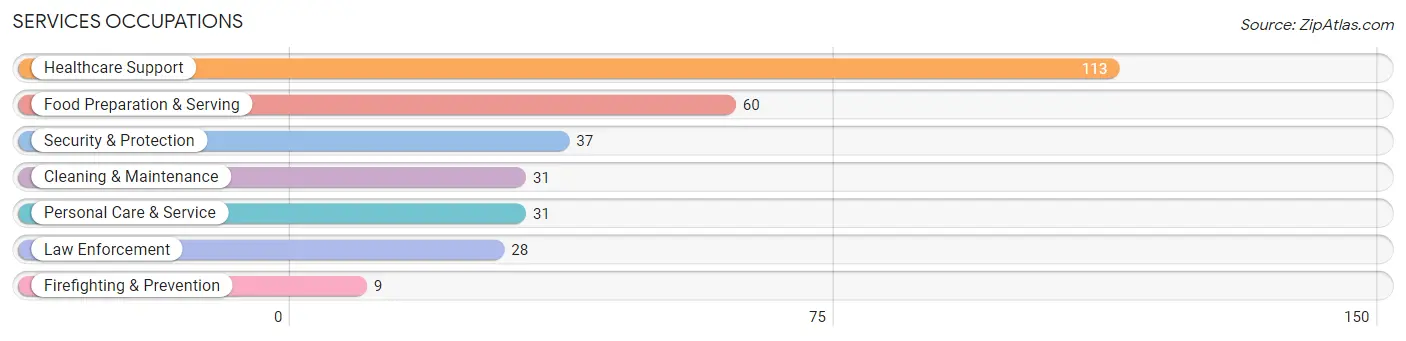
Services Occupations
The most common Services occupations in Upper Pohatcong are Healthcare Support (113 | 11.6%), Food Preparation & Serving (60 | 6.2%), Security & Protection (37 | 3.8%), Cleaning & Maintenance (31 | 3.2%), and Personal Care & Service (31 | 3.2%).
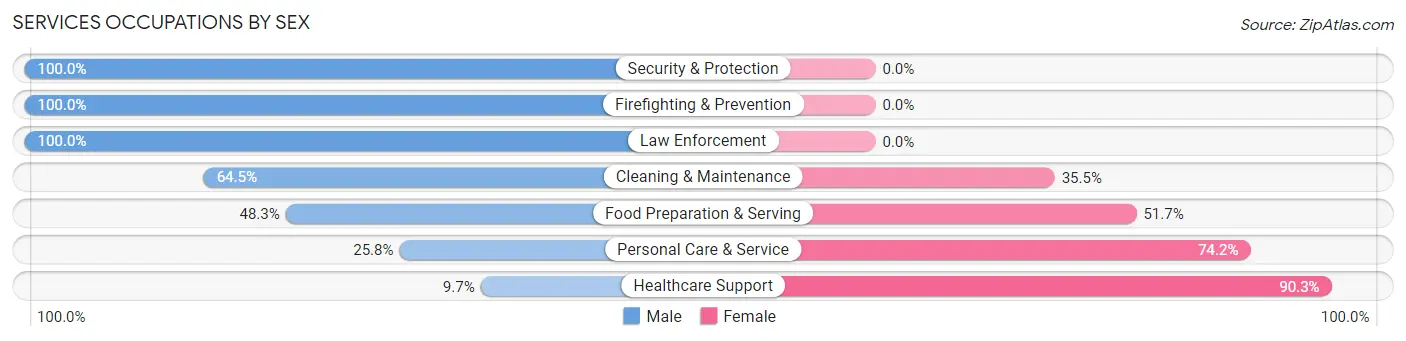
Services Occupations by Sex
Within the Services occupations in Upper Pohatcong, the most male-oriented occupations are Security & Protection (100.0%), Firefighting & Prevention (100.0%), and Law Enforcement (100.0%), while the most female-oriented occupations are Healthcare Support (90.3%), Personal Care & Service (74.2%), and Food Preparation & Serving (51.7%).
| Occupation | Male | Female |
| Healthcare Support | 11 (9.7%) | 102 (90.3%) |
| Security & Protection | 37 (100.0%) | 0 (0.0%) |
| Firefighting & Prevention | 9 (100.0%) | 0 (0.0%) |
| Law Enforcement | 28 (100.0%) | 0 (0.0%) |
| Food Preparation & Serving | 29 (48.3%) | 31 (51.7%) |
| Cleaning & Maintenance | 20 (64.5%) | 11 (35.5%) |
| Personal Care & Service | 8 (25.8%) | 23 (74.2%) |
| Total (Category) | 105 (38.6%) | 167 (61.4%) |
| Total (Overall) | 558 (57.5%) | 413 (42.5%) |
Sales and Office Occupations
The most common Sales and Office occupations in Upper Pohatcong are Sales & Related (67 | 6.9%), and Office & Administration (65 | 6.7%).
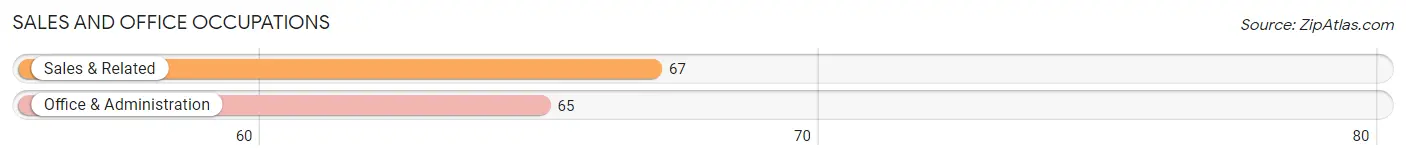
Sales and Office Occupations by Sex
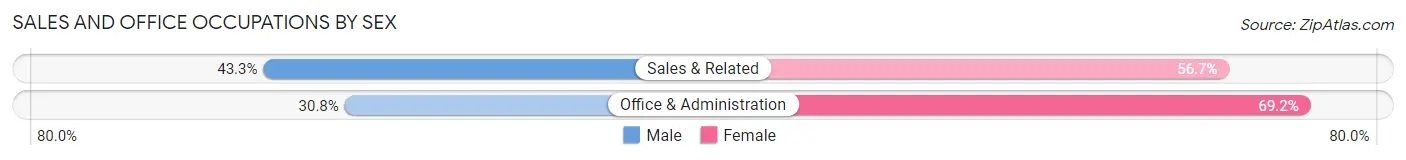
| Occupation | Male | Female |
| Sales & Related | 29 (43.3%) | 38 (56.7%) |
| Office & Administration | 20 (30.8%) | 45 (69.2%) |
| Total (Category) | 49 (37.1%) | 83 (62.9%) |
| Total (Overall) | 558 (57.5%) | 413 (42.5%) |
Natural Resources, Construction and Maintenance Occupations
The most common Natural Resources, Construction and Maintenance occupations in Upper Pohatcong are Construction & Extraction (90 | 9.3%), and Installation, Maintenance & Repair (74 | 7.6%).
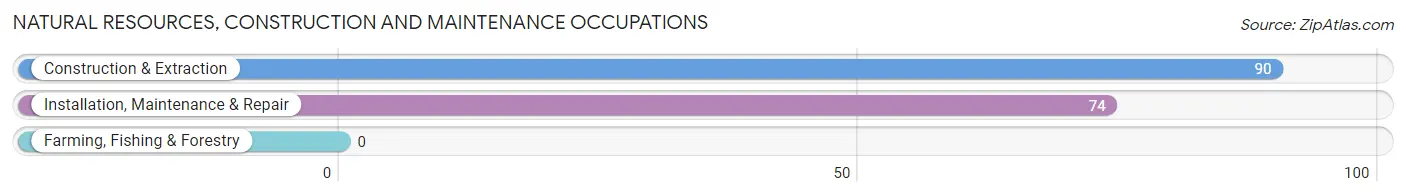
Natural Resources, Construction and Maintenance Occupations by Sex
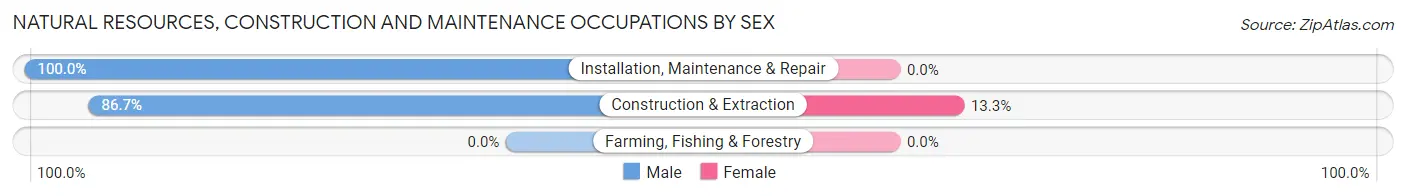
| Occupation | Male | Female |
| Farming, Fishing & Forestry | 0 (0.0%) | 0 (0.0%) |
| Construction & Extraction | 78 (86.7%) | 12 (13.3%) |
| Installation, Maintenance & Repair | 74 (100.0%) | 0 (0.0%) |
| Total (Category) | 152 (92.7%) | 12 (7.3%) |
| Total (Overall) | 558 (57.5%) | 413 (42.5%) |
Production, Transportation and Moving Occupations
The most common Production, Transportation and Moving occupations in Upper Pohatcong are Transportation (93 | 9.6%), Production (44 | 4.5%), and Material Moving (30 | 3.1%).
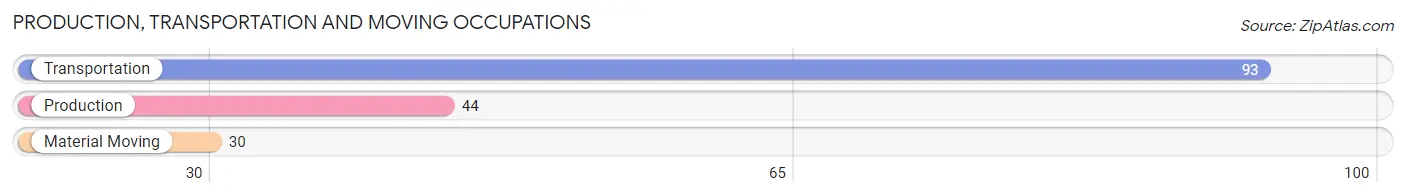
Production, Transportation and Moving Occupations by Sex
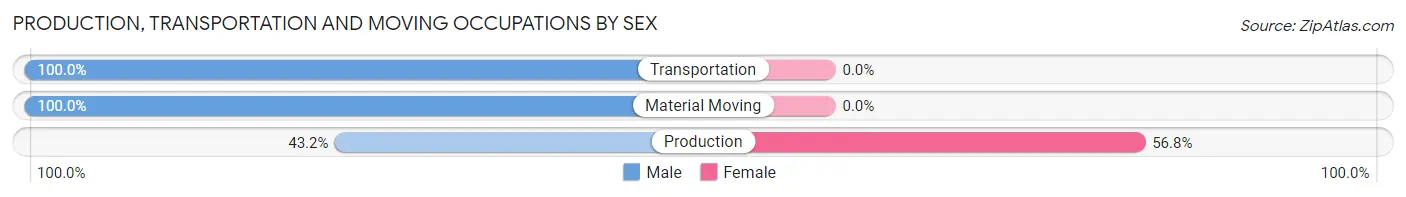
| Occupation | Male | Female |
| Production | 19 (43.2%) | 25 (56.8%) |
| Transportation | 93 (100.0%) | 0 (0.0%) |
| Material Moving | 30 (100.0%) | 0 (0.0%) |
| Total (Category) | 142 (85.0%) | 25 (15.0%) |
| Total (Overall) | 558 (57.5%) | 413 (42.5%) |
Employment Industries by Sex in Upper Pohatcong
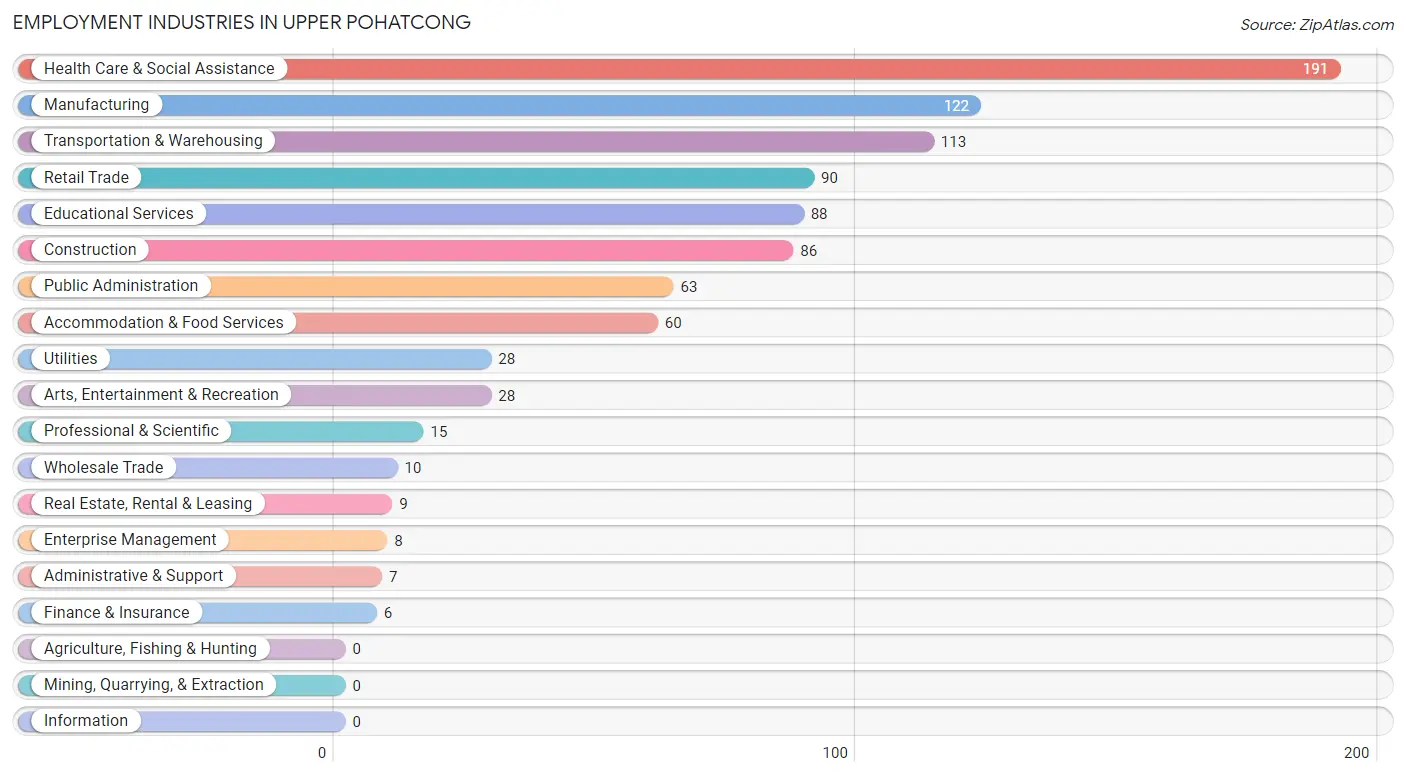
Employment Industries in Upper Pohatcong
The major employment industries in Upper Pohatcong include Health Care & Social Assistance (191 | 19.7%), Manufacturing (122 | 12.6%), Transportation & Warehousing (113 | 11.6%), Retail Trade (90 | 9.3%), and Educational Services (88 | 9.1%).
Employment Industries by Sex in Upper Pohatcong
The Upper Pohatcong industries that see more men than women are Transportation & Warehousing (100.0%), Utilities (100.0%), and Real Estate, Rental & Leasing (100.0%), whereas the industries that tend to have a higher number of women are Wholesale Trade (100.0%), Finance & Insurance (100.0%), and Professional & Scientific (100.0%).
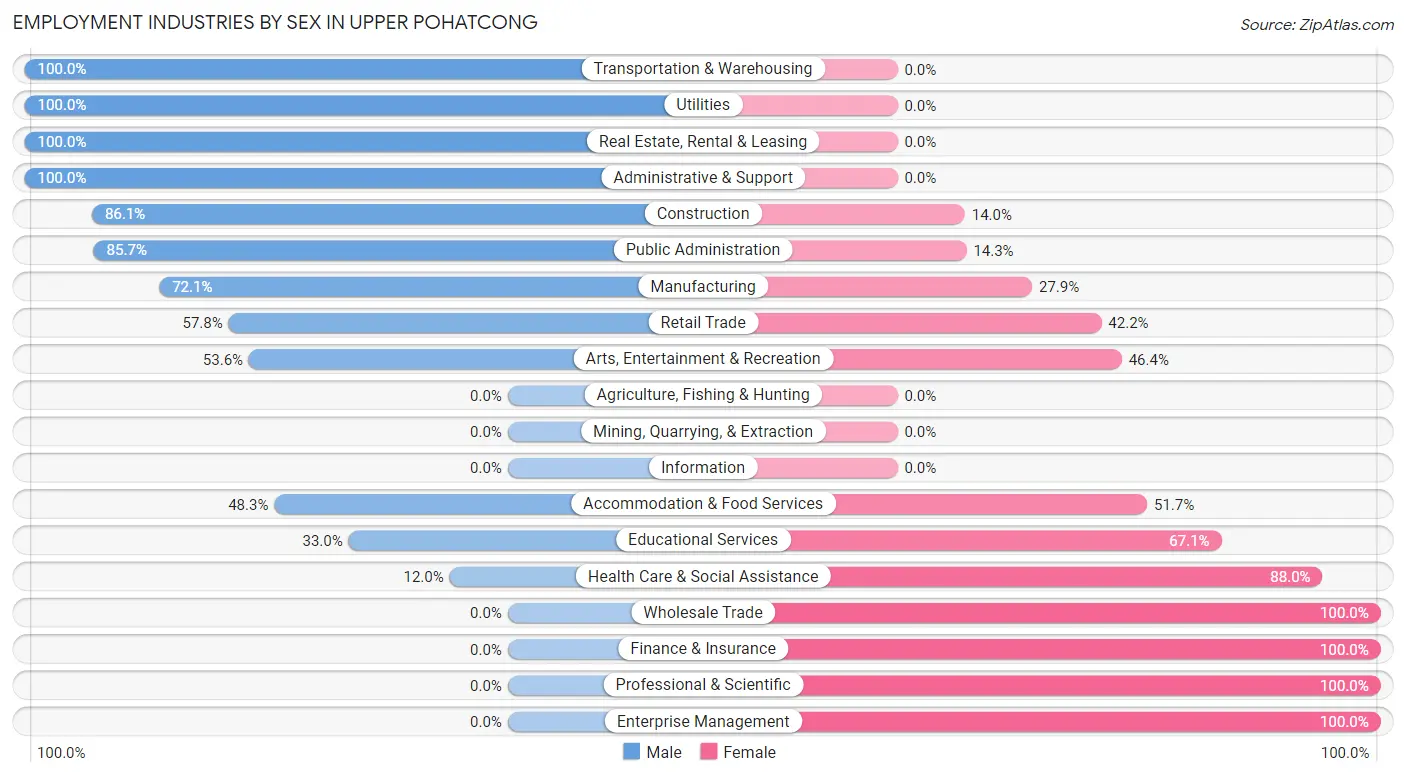
| Industry | Male | Female |
| Agriculture, Fishing & Hunting | 0 (0.0%) | 0 (0.0%) |
| Mining, Quarrying, & Extraction | 0 (0.0%) | 0 (0.0%) |
| Construction | 74 (86.1%) | 12 (14.0%) |
| Manufacturing | 88 (72.1%) | 34 (27.9%) |
| Wholesale Trade | 0 (0.0%) | 10 (100.0%) |
| Retail Trade | 52 (57.8%) | 38 (42.2%) |
| Transportation & Warehousing | 113 (100.0%) | 0 (0.0%) |
| Utilities | 28 (100.0%) | 0 (0.0%) |
| Information | 0 (0.0%) | 0 (0.0%) |
| Finance & Insurance | 0 (0.0%) | 6 (100.0%) |
| Real Estate, Rental & Leasing | 9 (100.0%) | 0 (0.0%) |
| Professional & Scientific | 0 (0.0%) | 15 (100.0%) |
| Enterprise Management | 0 (0.0%) | 8 (100.0%) |
| Administrative & Support | 7 (100.0%) | 0 (0.0%) |
| Educational Services | 29 (33.0%) | 59 (67.0%) |
| Health Care & Social Assistance | 23 (12.0%) | 168 (88.0%) |
| Arts, Entertainment & Recreation | 15 (53.6%) | 13 (46.4%) |
| Accommodation & Food Services | 29 (48.3%) | 31 (51.7%) |
| Public Administration | 54 (85.7%) | 9 (14.3%) |
| Total | 558 (57.5%) | 413 (42.5%) |
Education in Upper Pohatcong
School Enrollment in Upper Pohatcong
The most common levels of schooling among the 345 students in Upper Pohatcong are college / undergraduate (124 | 35.9%), elementary school (71 | 20.6%), and high school (61 | 17.7%).
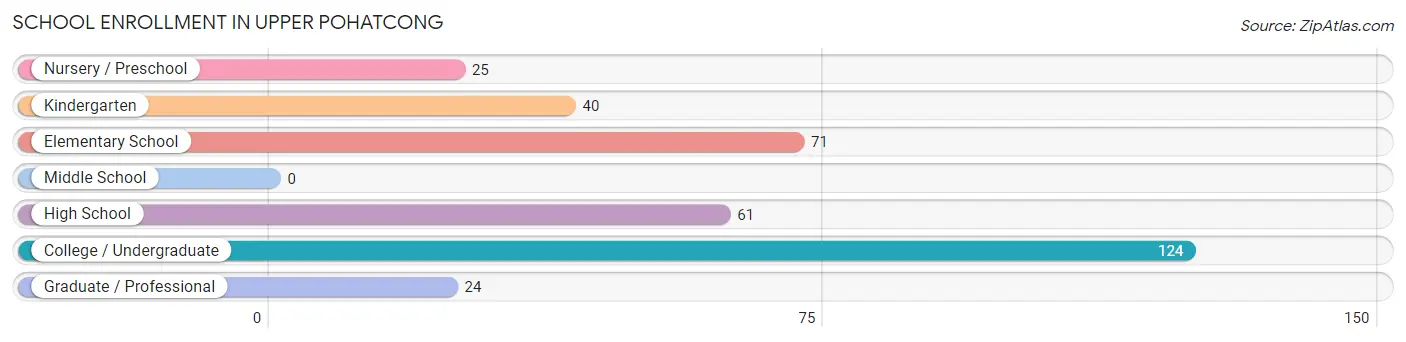
| School Level | # Students | % Students |
| Nursery / Preschool | 25 | 7.2% |
| Kindergarten | 40 | 11.6% |
| Elementary School | 71 | 20.6% |
| Middle School | 0 | 0.0% |
| High School | 61 | 17.7% |
| College / Undergraduate | 124 | 35.9% |
| Graduate / Professional | 24 | 7.0% |
| Total | 345 | 100.0% |
School Enrollment by Age by Funding Source in Upper Pohatcong
Out of a total of 345 students who are enrolled in schools in Upper Pohatcong, 40 (11.6%) attend a private institution, while the remaining 305 (88.4%) are enrolled in public schools. The age group of 25 to 34 year olds has the highest likelihood of being enrolled in private schools, with 11 (100.0% in the age bracket) enrolled. Conversely, the age group of 15 to 17 year olds has the lowest likelihood of being enrolled in a private school, with 29 (100.0% in the age bracket) attending a public institution.
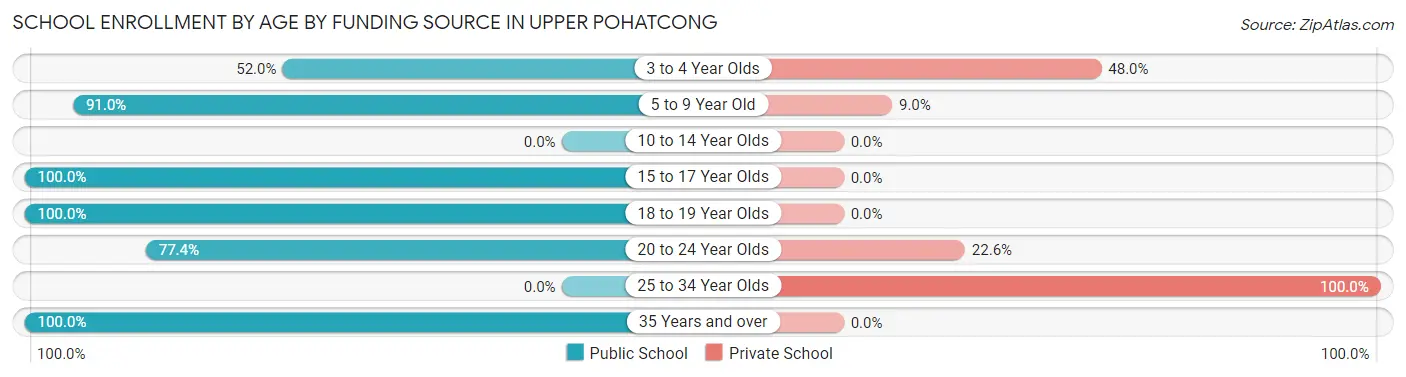
| Age Bracket | Public School | Private School |
| 3 to 4 Year Olds | 13 (52.0%) | 12 (48.0%) |
| 5 to 9 Year Old | 101 (91.0%) | 10 (9.0%) |
| 10 to 14 Year Olds | 0 (0.0%) | 0 (0.0%) |
| 15 to 17 Year Olds | 29 (100.0%) | 0 (0.0%) |
| 18 to 19 Year Olds | 58 (100.0%) | 0 (0.0%) |
| 20 to 24 Year Olds | 24 (77.4%) | 7 (22.6%) |
| 25 to 34 Year Olds | 0 (0.0%) | 11 (100.0%) |
| 35 Years and over | 80 (100.0%) | 0 (0.0%) |
| Total | 305 (88.4%) | 40 (11.6%) |
Educational Attainment by Field of Study in Upper Pohatcong
Education (67 | 22.1%), arts & humanities (59 | 19.5%), computers & mathematics (39 | 12.9%), psychology (28 | 9.2%), and liberal arts & history (24 | 7.9%) are the most common fields of study among 303 individuals in Upper Pohatcong who have obtained a bachelor's degree or higher.
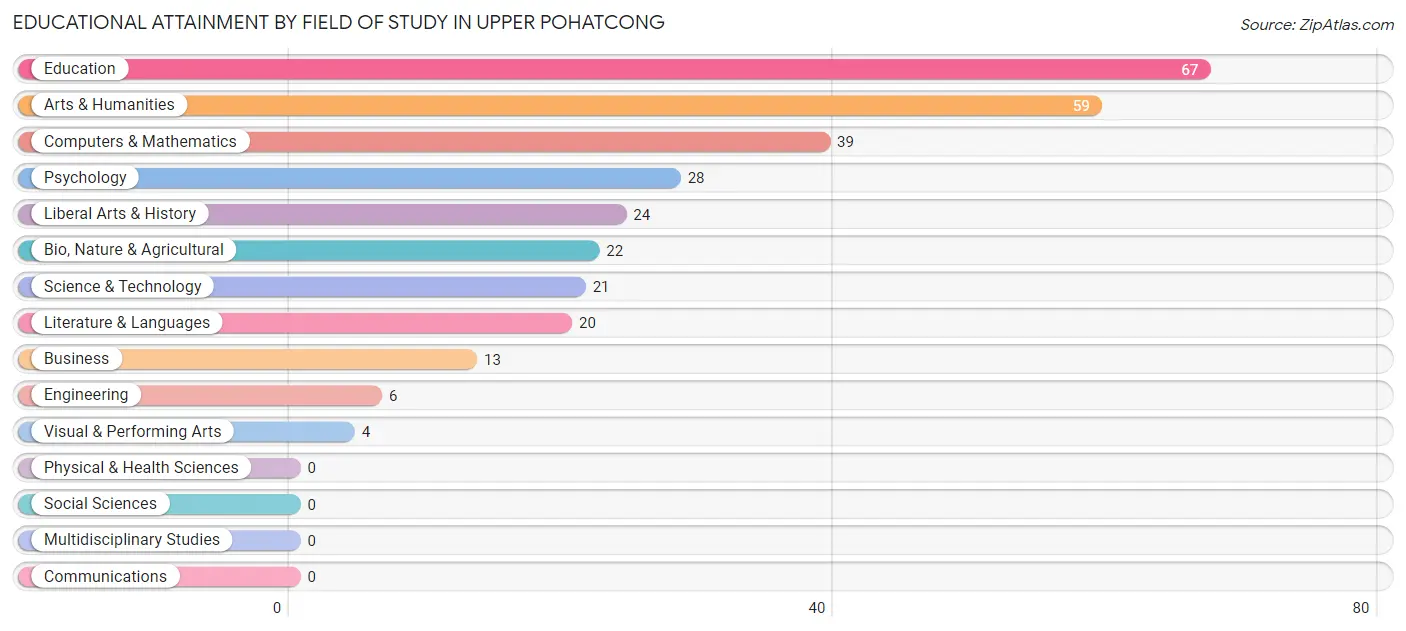
| Field of Study | # Graduates | % Graduates |
| Computers & Mathematics | 39 | 12.9% |
| Bio, Nature & Agricultural | 22 | 7.3% |
| Physical & Health Sciences | 0 | 0.0% |
| Psychology | 28 | 9.2% |
| Social Sciences | 0 | 0.0% |
| Engineering | 6 | 2.0% |
| Multidisciplinary Studies | 0 | 0.0% |
| Science & Technology | 21 | 6.9% |
| Business | 13 | 4.3% |
| Education | 67 | 22.1% |
| Literature & Languages | 20 | 6.6% |
| Liberal Arts & History | 24 | 7.9% |
| Visual & Performing Arts | 4 | 1.3% |
| Communications | 0 | 0.0% |
| Arts & Humanities | 59 | 19.5% |
| Total | 303 | 100.0% |
Transportation & Commute in Upper Pohatcong
Vehicle Availability by Sex in Upper Pohatcong
The most prevalent vehicle ownership categories in Upper Pohatcong are males with 2 vehicles (222, accounting for 41.5%) and females with 2 vehicles (158, making up 54.8%).
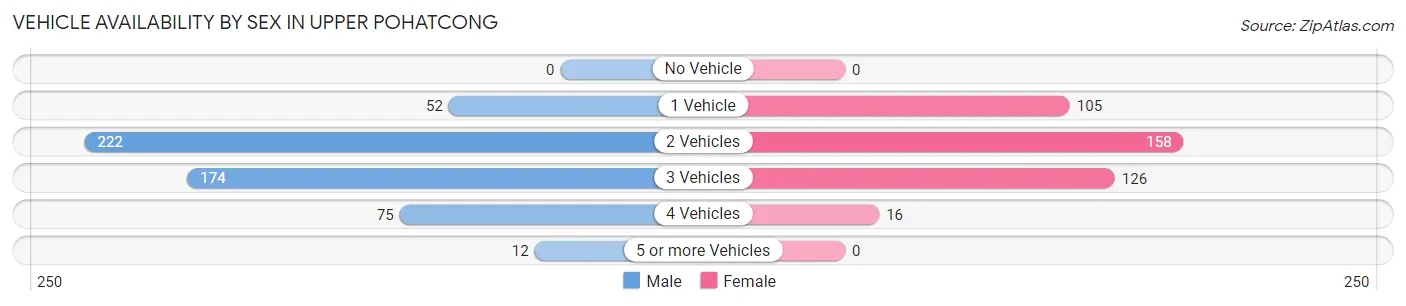
| Vehicles Available | Male | Female |
| No Vehicle | 0 (0.0%) | 0 (0.0%) |
| 1 Vehicle | 52 (9.7%) | 105 (25.9%) |
| 2 Vehicles | 222 (41.5%) | 158 (39.0%) |
| 3 Vehicles | 174 (32.5%) | 126 (31.1%) |
| 4 Vehicles | 75 (14.0%) | 16 (4.0%) |
| 5 or more Vehicles | 12 (2.2%) | 0 (0.0%) |
| Total | 535 (100.0%) | 405 (100.0%) |
Commute Time in Upper Pohatcong
The most frequently occuring commute durations in Upper Pohatcong are 5 to 9 minutes (177 commuters, 20.1%), 45 to 59 minutes (163 commuters, 18.5%), and 60 to 89 minutes (108 commuters, 12.3%).
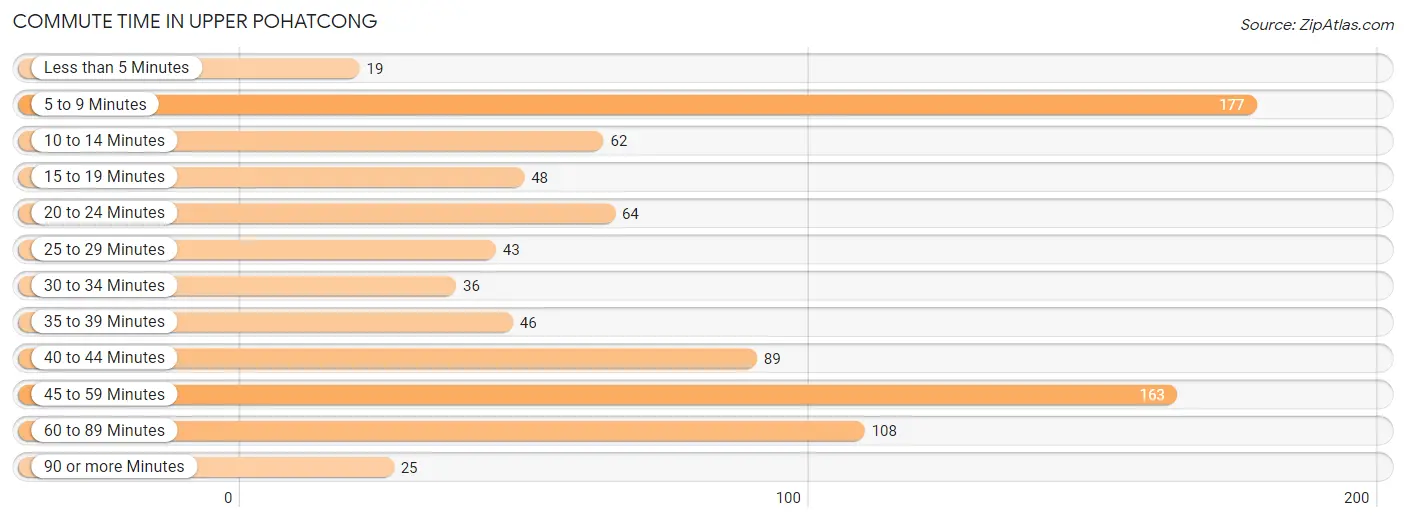
| Commute Time | # Commuters | % Commuters |
| Less than 5 Minutes | 19 | 2.2% |
| 5 to 9 Minutes | 177 | 20.1% |
| 10 to 14 Minutes | 62 | 7.0% |
| 15 to 19 Minutes | 48 | 5.4% |
| 20 to 24 Minutes | 64 | 7.3% |
| 25 to 29 Minutes | 43 | 4.9% |
| 30 to 34 Minutes | 36 | 4.1% |
| 35 to 39 Minutes | 46 | 5.2% |
| 40 to 44 Minutes | 89 | 10.1% |
| 45 to 59 Minutes | 163 | 18.5% |
| 60 to 89 Minutes | 108 | 12.3% |
| 90 or more Minutes | 25 | 2.8% |
Commute Time by Sex in Upper Pohatcong
The most common commute times in Upper Pohatcong are 5 to 9 minutes (105 commuters, 20.9%) for males and 5 to 9 minutes (72 commuters, 19.1%) for females.
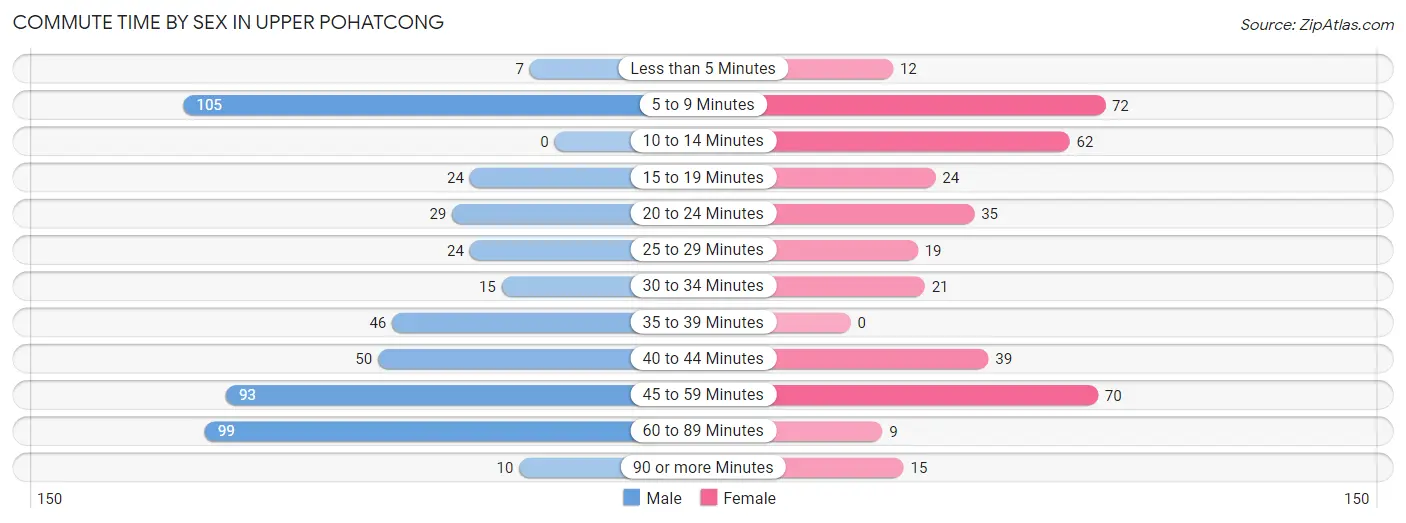
| Commute Time | Male | Female |
| Less than 5 Minutes | 7 (1.4%) | 12 (3.2%) |
| 5 to 9 Minutes | 105 (20.9%) | 72 (19.1%) |
| 10 to 14 Minutes | 0 (0.0%) | 62 (16.4%) |
| 15 to 19 Minutes | 24 (4.8%) | 24 (6.4%) |
| 20 to 24 Minutes | 29 (5.8%) | 35 (9.3%) |
| 25 to 29 Minutes | 24 (4.8%) | 19 (5.0%) |
| 30 to 34 Minutes | 15 (3.0%) | 21 (5.6%) |
| 35 to 39 Minutes | 46 (9.2%) | 0 (0.0%) |
| 40 to 44 Minutes | 50 (10.0%) | 39 (10.3%) |
| 45 to 59 Minutes | 93 (18.5%) | 70 (18.5%) |
| 60 to 89 Minutes | 99 (19.7%) | 9 (2.4%) |
| 90 or more Minutes | 10 (2.0%) | 15 (4.0%) |
Time of Departure to Work by Sex in Upper Pohatcong
The most frequent times of departure to work in Upper Pohatcong are 6:00 AM to 6:29 AM (111, 22.1%) for males and 12:00 PM to 3:59 PM (83, 22.0%) for females.
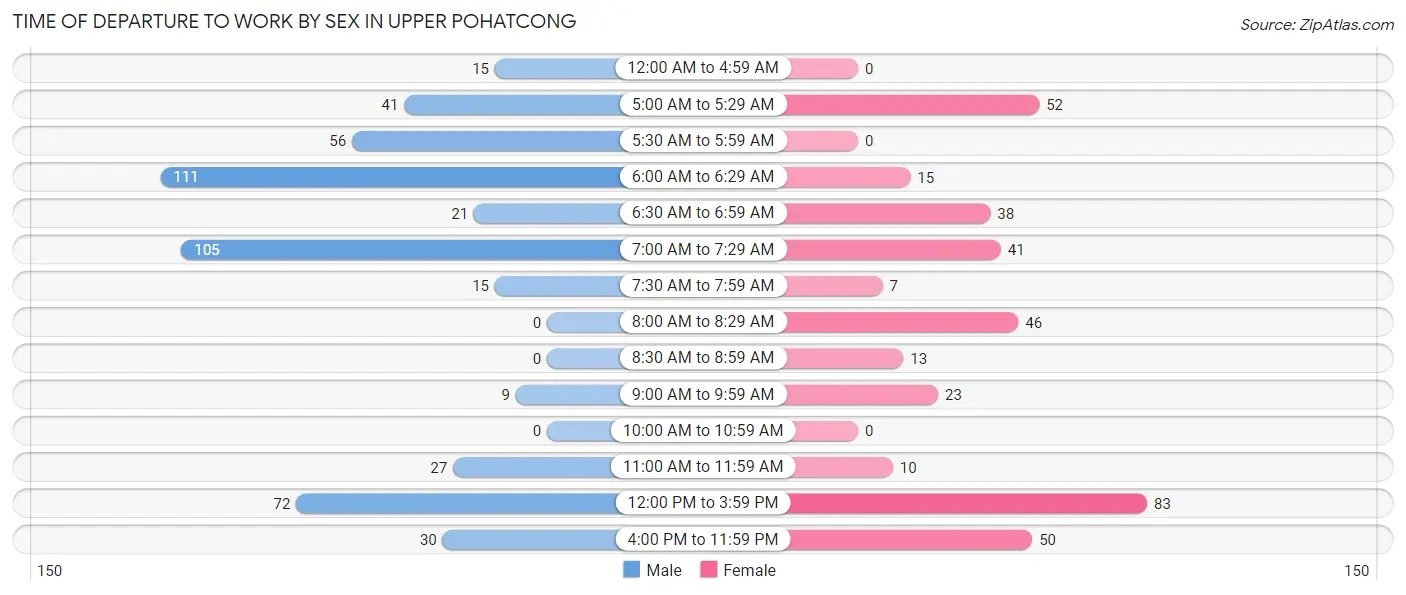
| Time of Departure | Male | Female |
| 12:00 AM to 4:59 AM | 15 (3.0%) | 0 (0.0%) |
| 5:00 AM to 5:29 AM | 41 (8.2%) | 52 (13.8%) |
| 5:30 AM to 5:59 AM | 56 (11.2%) | 0 (0.0%) |
| 6:00 AM to 6:29 AM | 111 (22.1%) | 15 (4.0%) |
| 6:30 AM to 6:59 AM | 21 (4.2%) | 38 (10.1%) |
| 7:00 AM to 7:29 AM | 105 (20.9%) | 41 (10.8%) |
| 7:30 AM to 7:59 AM | 15 (3.0%) | 7 (1.8%) |
| 8:00 AM to 8:29 AM | 0 (0.0%) | 46 (12.2%) |
| 8:30 AM to 8:59 AM | 0 (0.0%) | 13 (3.4%) |
| 9:00 AM to 9:59 AM | 9 (1.8%) | 23 (6.1%) |
| 10:00 AM to 10:59 AM | 0 (0.0%) | 0 (0.0%) |
| 11:00 AM to 11:59 AM | 27 (5.4%) | 10 (2.6%) |
| 12:00 PM to 3:59 PM | 72 (14.3%) | 83 (22.0%) |
| 4:00 PM to 11:59 PM | 30 (6.0%) | 50 (13.2%) |
| Total | 502 (100.0%) | 378 (100.0%) |
Housing Occupancy in Upper Pohatcong
Occupancy by Ownership in Upper Pohatcong
Of the total 717 dwellings in Upper Pohatcong, owner-occupied units account for 637 (88.8%), while renter-occupied units make up 80 (11.2%).
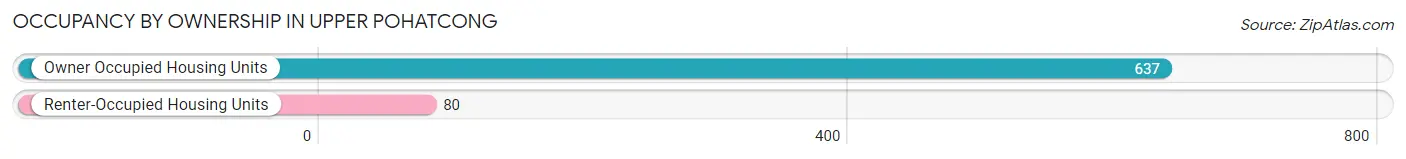
| Occupancy | # Housing Units | % Housing Units |
| Owner Occupied Housing Units | 637 | 88.8% |
| Renter-Occupied Housing Units | 80 | 11.2% |
| Total Occupied Housing Units | 717 | 100.0% |
Occupancy by Household Size in Upper Pohatcong
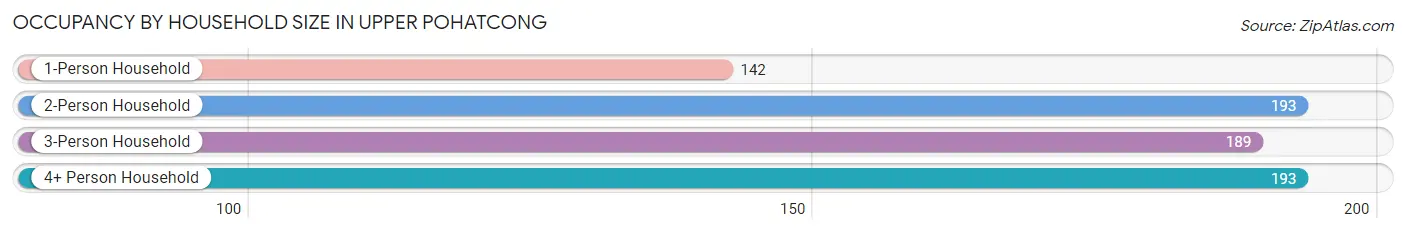
| Household Size | # Housing Units | % Housing Units |
| 1-Person Household | 142 | 19.8% |
| 2-Person Household | 193 | 26.9% |
| 3-Person Household | 189 | 26.4% |
| 4+ Person Household | 193 | 26.9% |
| Total Housing Units | 717 | 100.0% |
Occupancy by Ownership by Household Size in Upper Pohatcong
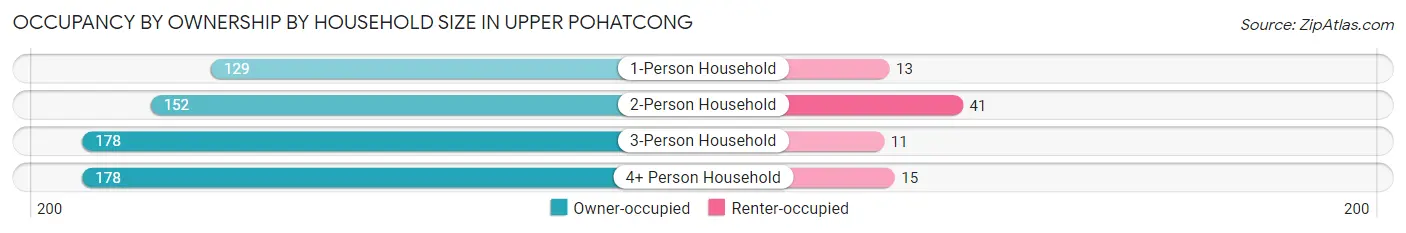
| Household Size | Owner-occupied | Renter-occupied |
| 1-Person Household | 129 (90.8%) | 13 (9.1%) |
| 2-Person Household | 152 (78.8%) | 41 (21.2%) |
| 3-Person Household | 178 (94.2%) | 11 (5.8%) |
| 4+ Person Household | 178 (92.2%) | 15 (7.8%) |
| Total Housing Units | 637 (88.8%) | 80 (11.2%) |
Occupancy by Educational Attainment in Upper Pohatcong
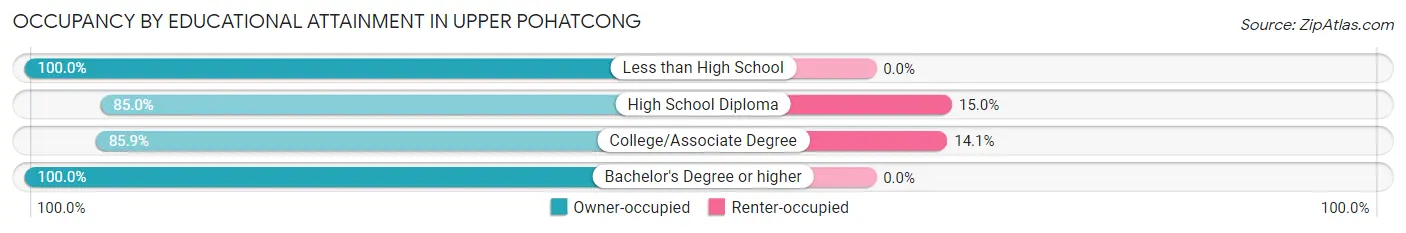
| Household Size | Owner-occupied | Renter-occupied |
| Less than High School | 9 (100.0%) | 0 (0.0%) |
| High School Diploma | 209 (85.0%) | 37 (15.0%) |
| College/Associate Degree | 262 (85.9%) | 43 (14.1%) |
| Bachelor's Degree or higher | 157 (100.0%) | 0 (0.0%) |
Occupancy by Age of Householder in Upper Pohatcong
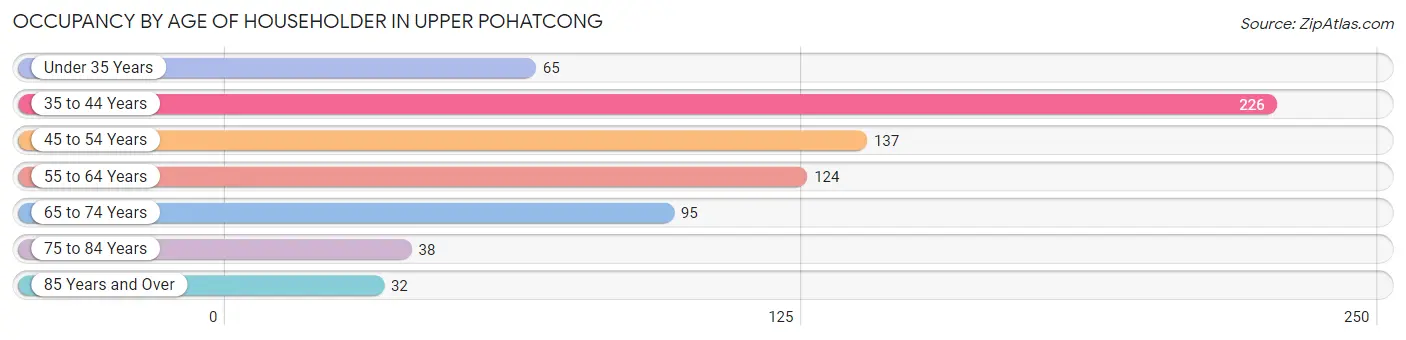
| Age Bracket | # Households | % Households |
| Under 35 Years | 65 | 9.1% |
| 35 to 44 Years | 226 | 31.5% |
| 45 to 54 Years | 137 | 19.1% |
| 55 to 64 Years | 124 | 17.3% |
| 65 to 74 Years | 95 | 13.3% |
| 75 to 84 Years | 38 | 5.3% |
| 85 Years and Over | 32 | 4.5% |
| Total | 717 | 100.0% |
Housing Finances in Upper Pohatcong
Median Income by Occupancy in Upper Pohatcong
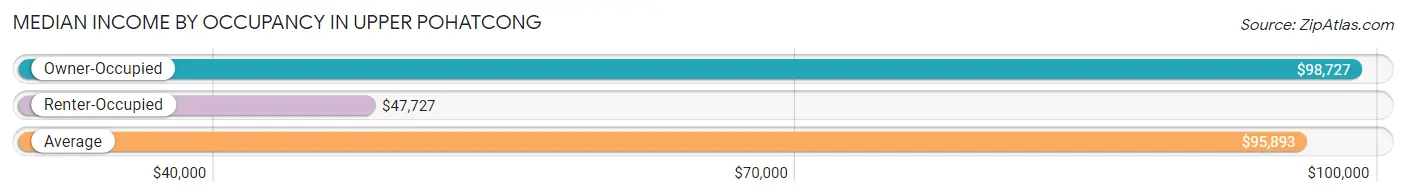
| Occupancy Type | # Households | Median Income |
| Owner-Occupied | 637 (88.8%) | $98,727 |
| Renter-Occupied | 80 (11.2%) | $47,727 |
| Average | 717 (100.0%) | $95,893 |
Occupancy by Householder Income Bracket in Upper Pohatcong
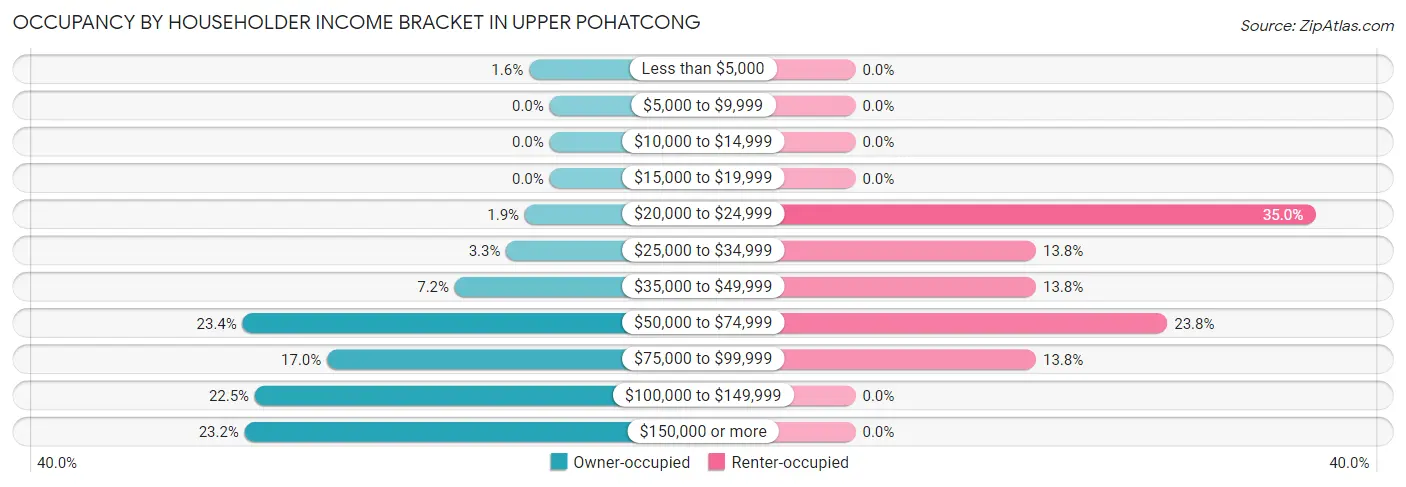
| Income Bracket | Owner-occupied | Renter-occupied |
| Less than $5,000 | 10 (1.6%) | 0 (0.0%) |
| $5,000 to $9,999 | 0 (0.0%) | 0 (0.0%) |
| $10,000 to $14,999 | 0 (0.0%) | 0 (0.0%) |
| $15,000 to $19,999 | 0 (0.0%) | 0 (0.0%) |
| $20,000 to $24,999 | 12 (1.9%) | 28 (35.0%) |
| $25,000 to $34,999 | 21 (3.3%) | 11 (13.8%) |
| $35,000 to $49,999 | 46 (7.2%) | 11 (13.8%) |
| $50,000 to $74,999 | 149 (23.4%) | 19 (23.7%) |
| $75,000 to $99,999 | 108 (17.0%) | 11 (13.8%) |
| $100,000 to $149,999 | 143 (22.5%) | 0 (0.0%) |
| $150,000 or more | 148 (23.2%) | 0 (0.0%) |
| Total | 637 (100.0%) | 80 (100.0%) |
Monthly Housing Cost Tiers in Upper Pohatcong
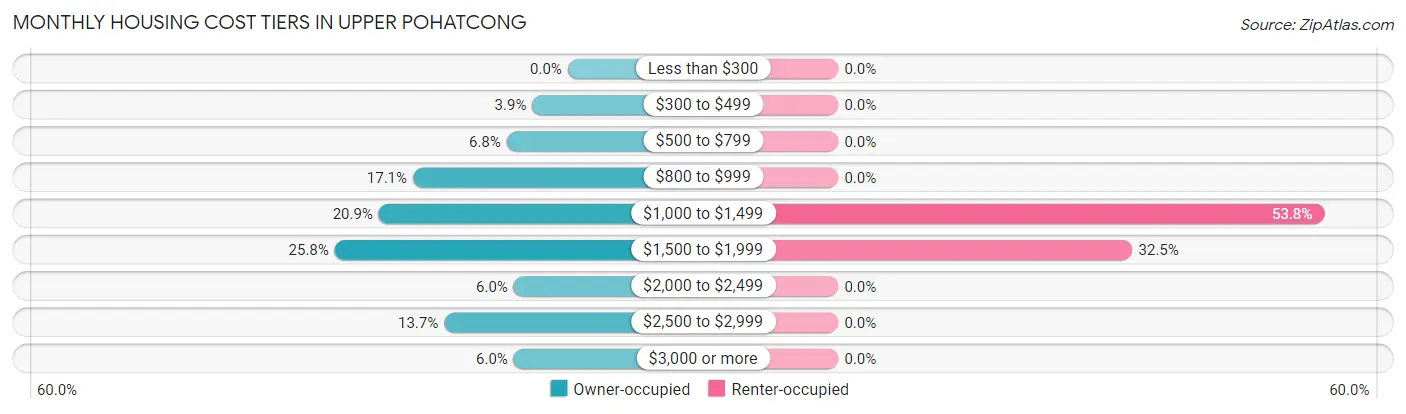
| Monthly Cost | Owner-occupied | Renter-occupied |
| Less than $300 | 0 (0.0%) | 0 (0.0%) |
| $300 to $499 | 25 (3.9%) | 0 (0.0%) |
| $500 to $799 | 43 (6.8%) | 0 (0.0%) |
| $800 to $999 | 109 (17.1%) | 0 (0.0%) |
| $1,000 to $1,499 | 133 (20.9%) | 43 (53.7%) |
| $1,500 to $1,999 | 164 (25.8%) | 26 (32.5%) |
| $2,000 to $2,499 | 38 (6.0%) | 0 (0.0%) |
| $2,500 to $2,999 | 87 (13.7%) | 0 (0.0%) |
| $3,000 or more | 38 (6.0%) | 0 (0.0%) |
| Total | 637 (100.0%) | 80 (100.0%) |
Physical Housing Characteristics in Upper Pohatcong
Housing Structures in Upper Pohatcong
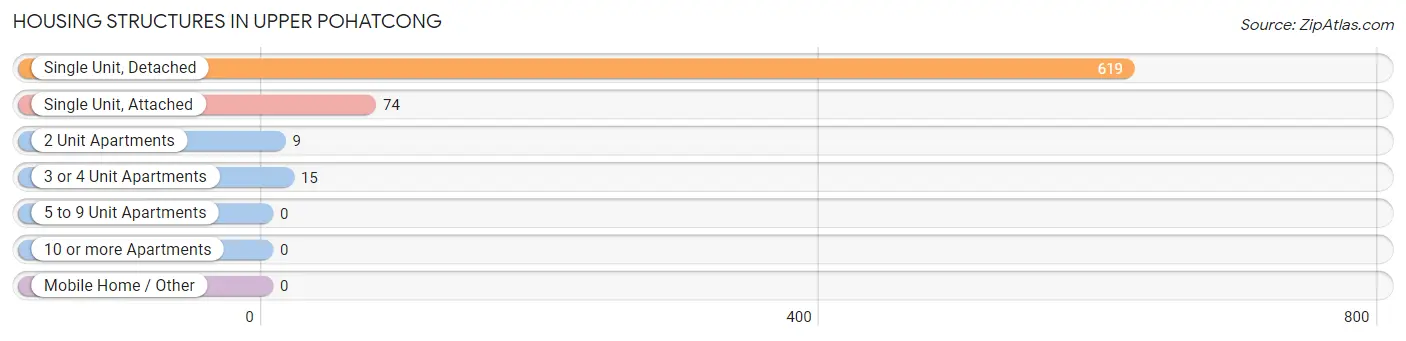
| Structure Type | # Housing Units | % Housing Units |
| Single Unit, Detached | 619 | 86.3% |
| Single Unit, Attached | 74 | 10.3% |
| 2 Unit Apartments | 9 | 1.3% |
| 3 or 4 Unit Apartments | 15 | 2.1% |
| 5 to 9 Unit Apartments | 0 | 0.0% |
| 10 or more Apartments | 0 | 0.0% |
| Mobile Home / Other | 0 | 0.0% |
| Total | 717 | 100.0% |
Housing Structures by Occupancy in Upper Pohatcong
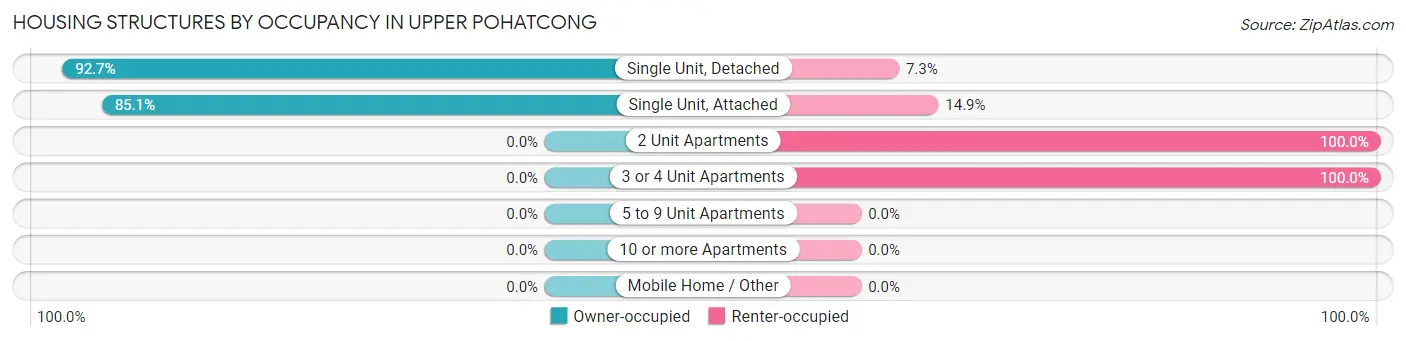
| Structure Type | Owner-occupied | Renter-occupied |
| Single Unit, Detached | 574 (92.7%) | 45 (7.3%) |
| Single Unit, Attached | 63 (85.1%) | 11 (14.9%) |
| 2 Unit Apartments | 0 (0.0%) | 9 (100.0%) |
| 3 or 4 Unit Apartments | 0 (0.0%) | 15 (100.0%) |
| 5 to 9 Unit Apartments | 0 (0.0%) | 0 (0.0%) |
| 10 or more Apartments | 0 (0.0%) | 0 (0.0%) |
| Mobile Home / Other | 0 (0.0%) | 0 (0.0%) |
| Total | 637 (88.8%) | 80 (11.2%) |
Housing Structures by Number of Rooms in Upper Pohatcong
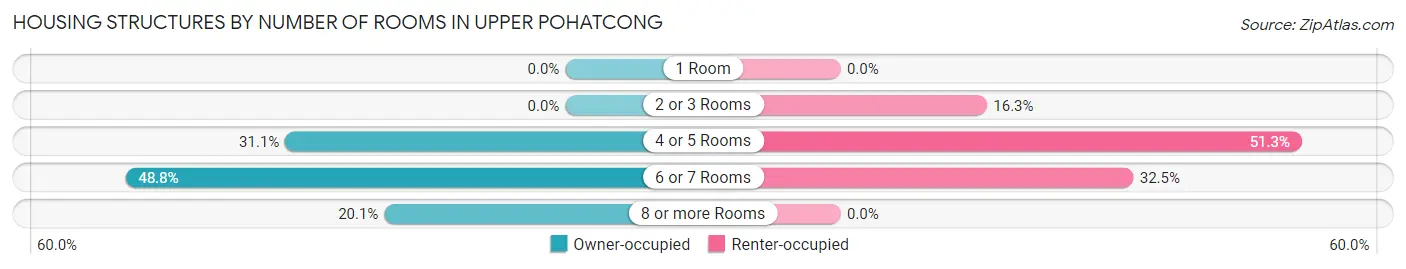
| Number of Rooms | Owner-occupied | Renter-occupied |
| 1 Room | 0 (0.0%) | 0 (0.0%) |
| 2 or 3 Rooms | 0 (0.0%) | 13 (16.3%) |
| 4 or 5 Rooms | 198 (31.1%) | 41 (51.2%) |
| 6 or 7 Rooms | 311 (48.8%) | 26 (32.5%) |
| 8 or more Rooms | 128 (20.1%) | 0 (0.0%) |
| Total | 637 (100.0%) | 80 (100.0%) |
Housing Structure by Heating Type in Upper Pohatcong
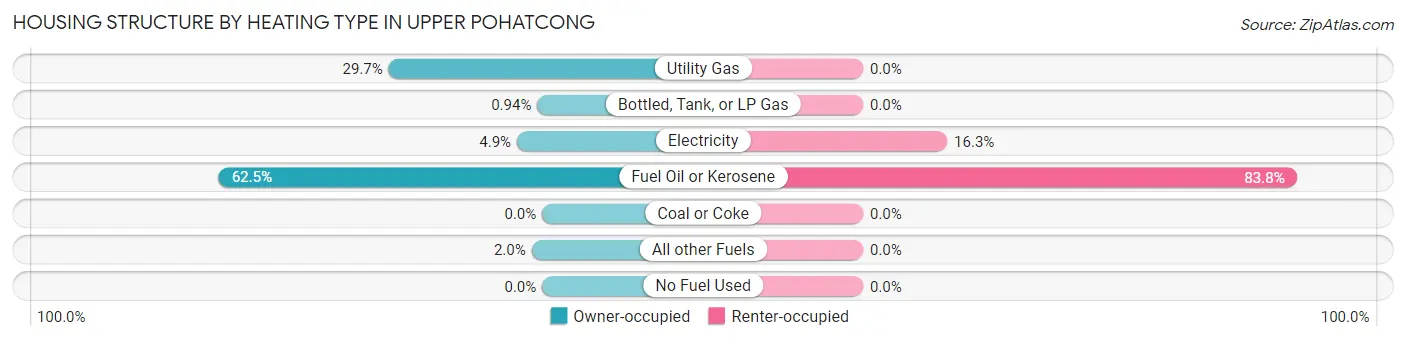
| Heating Type | Owner-occupied | Renter-occupied |
| Utility Gas | 189 (29.7%) | 0 (0.0%) |
| Bottled, Tank, or LP Gas | 6 (0.9%) | 0 (0.0%) |
| Electricity | 31 (4.9%) | 13 (16.3%) |
| Fuel Oil or Kerosene | 398 (62.5%) | 67 (83.8%) |
| Coal or Coke | 0 (0.0%) | 0 (0.0%) |
| All other Fuels | 13 (2.0%) | 0 (0.0%) |
| No Fuel Used | 0 (0.0%) | 0 (0.0%) |
| Total | 637 (100.0%) | 80 (100.0%) |
Household Vehicle Usage in Upper Pohatcong
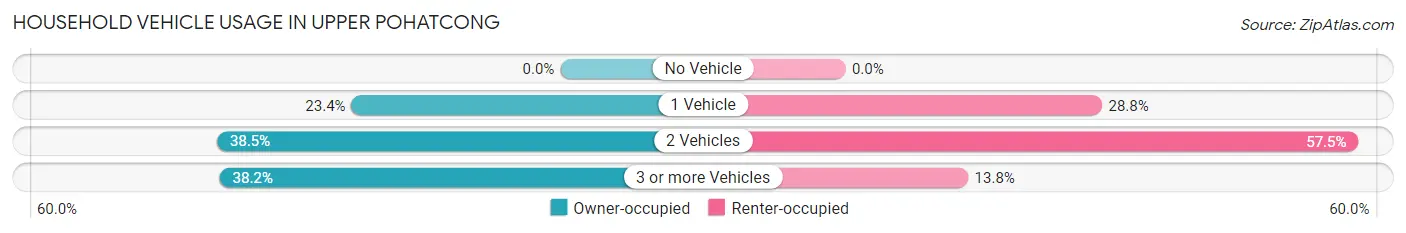
| Vehicles per Household | Owner-occupied | Renter-occupied |
| No Vehicle | 0 (0.0%) | 0 (0.0%) |
| 1 Vehicle | 149 (23.4%) | 23 (28.7%) |
| 2 Vehicles | 245 (38.5%) | 46 (57.5%) |
| 3 or more Vehicles | 243 (38.2%) | 11 (13.8%) |
| Total | 637 (100.0%) | 80 (100.0%) |
Real Estate & Mortgages in Upper Pohatcong
Real Estate and Mortgage Overview in Upper Pohatcong
| Characteristic | Without Mortgage | With Mortgage |
| Housing Units | 159 | 478 |
| Median Property Value | $179,900 | $238,500 |
| Median Household Income | $65,568 | $124 |
| Monthly Housing Costs | $874 | $38 |
| Real Estate Taxes | $6,635 | $11 |
Property Value by Mortgage Status in Upper Pohatcong
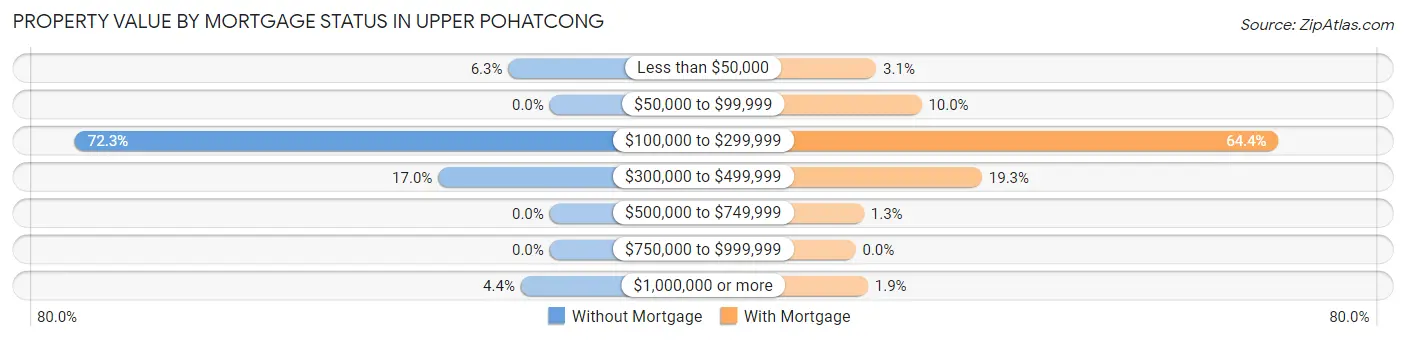
| Property Value | Without Mortgage | With Mortgage |
| Less than $50,000 | 10 (6.3%) | 15 (3.1%) |
| $50,000 to $99,999 | 0 (0.0%) | 48 (10.0%) |
| $100,000 to $299,999 | 115 (72.3%) | 308 (64.4%) |
| $300,000 to $499,999 | 27 (17.0%) | 92 (19.3%) |
| $500,000 to $749,999 | 0 (0.0%) | 6 (1.3%) |
| $750,000 to $999,999 | 0 (0.0%) | 0 (0.0%) |
| $1,000,000 or more | 7 (4.4%) | 9 (1.9%) |
| Total | 159 (100.0%) | 478 (100.0%) |
Household Income by Mortgage Status in Upper Pohatcong
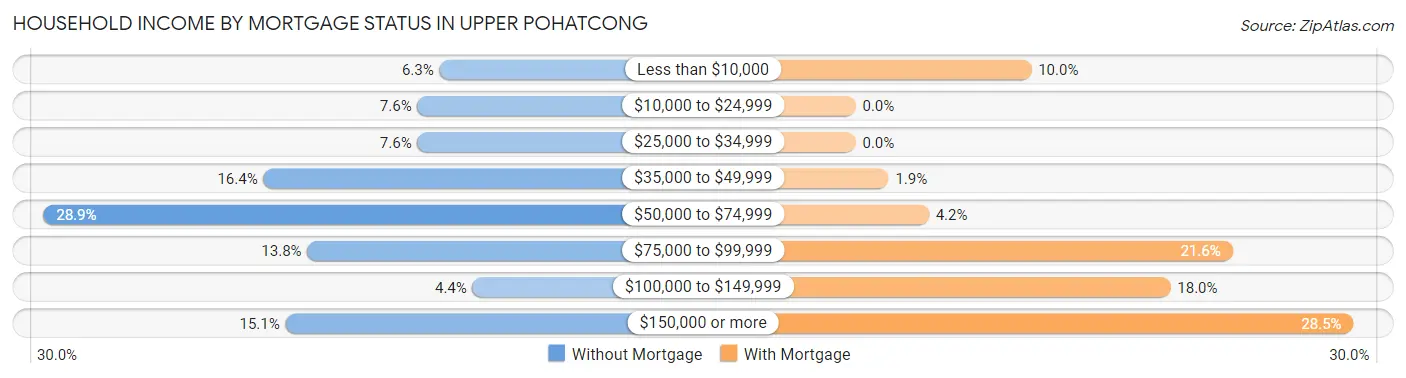
| Household Income | Without Mortgage | With Mortgage |
| Less than $10,000 | 10 (6.3%) | 48 (10.0%) |
| $10,000 to $24,999 | 12 (7.5%) | 0 (0.0%) |
| $25,000 to $34,999 | 12 (7.5%) | 0 (0.0%) |
| $35,000 to $49,999 | 26 (16.4%) | 9 (1.9%) |
| $50,000 to $74,999 | 46 (28.9%) | 20 (4.2%) |
| $75,000 to $99,999 | 22 (13.8%) | 103 (21.5%) |
| $100,000 to $149,999 | 7 (4.4%) | 86 (18.0%) |
| $150,000 or more | 24 (15.1%) | 136 (28.4%) |
| Total | 159 (100.0%) | 478 (100.0%) |
Property Value to Household Income Ratio in Upper Pohatcong
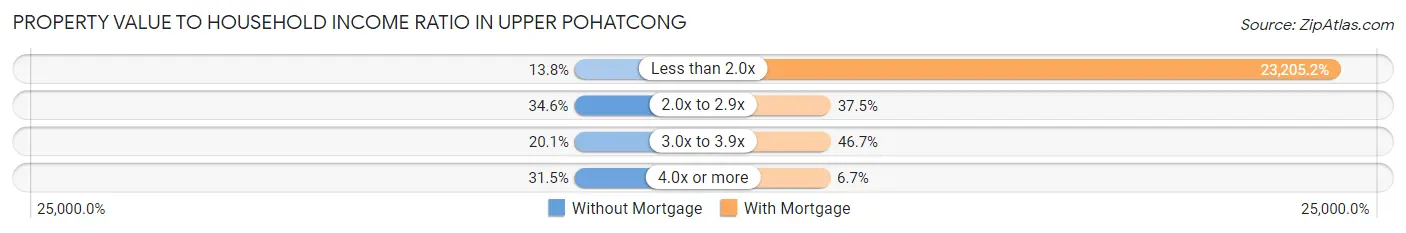
| Value-to-Income Ratio | Without Mortgage | With Mortgage |
| Less than 2.0x | 22 (13.8%) | 110,921 (23,205.2%) |
| 2.0x to 2.9x | 55 (34.6%) | 179 (37.4%) |
| 3.0x to 3.9x | 32 (20.1%) | 223 (46.7%) |
| 4.0x or more | 50 (31.5%) | 32 (6.7%) |
| Total | 159 (100.0%) | 478 (100.0%) |
Real Estate Taxes by Mortgage Status in Upper Pohatcong
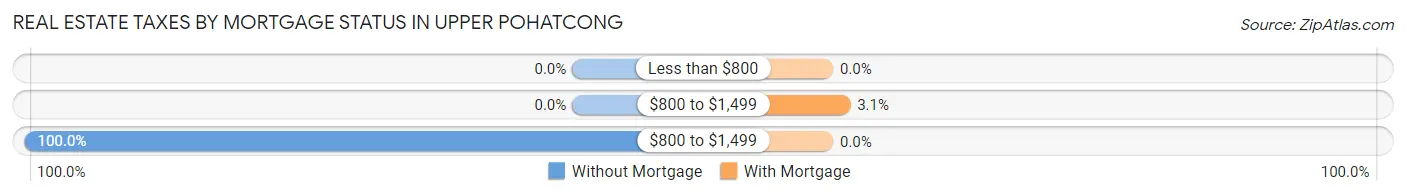
| Property Taxes | Without Mortgage | With Mortgage |
| Less than $800 | 0 (0.0%) | 0 (0.0%) |
| $800 to $1,499 | 0 (0.0%) | 15 (3.1%) |
| $800 to $1,499 | 159 (100.0%) | 0 (0.0%) |
| Total | 159 (100.0%) | 478 (100.0%) |
Health & Disability in Upper Pohatcong
Health Insurance Coverage by Age in Upper Pohatcong
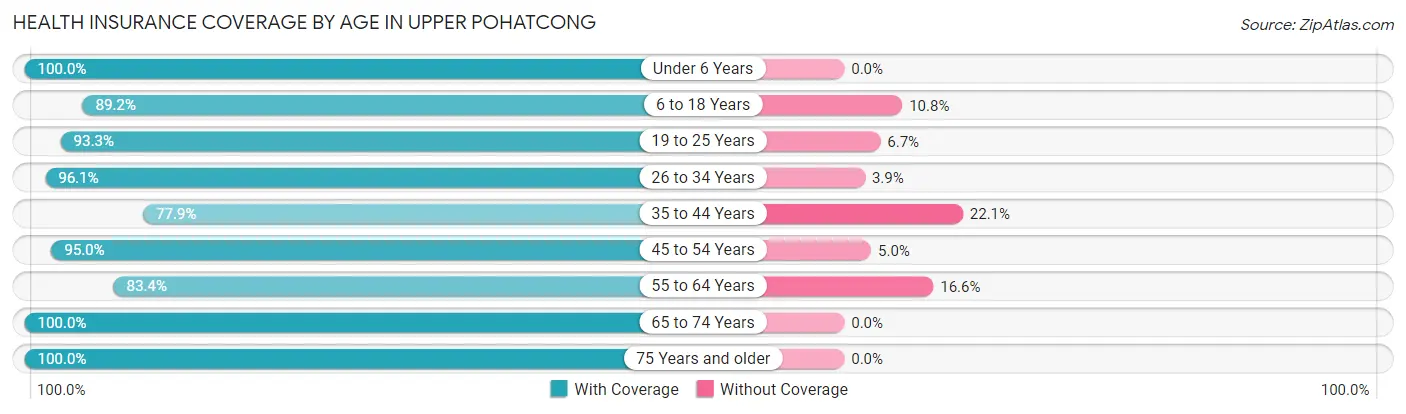
| Age Bracket | With Coverage | Without Coverage |
| Under 6 Years | 212 (100.0%) | 0 (0.0%) |
| 6 to 18 Years | 132 (89.2%) | 16 (10.8%) |
| 19 to 25 Years | 125 (93.3%) | 9 (6.7%) |
| 26 to 34 Years | 199 (96.1%) | 8 (3.9%) |
| 35 to 44 Years | 310 (77.9%) | 88 (22.1%) |
| 45 to 54 Years | 171 (95.0%) | 9 (5.0%) |
| 55 to 64 Years | 196 (83.4%) | 39 (16.6%) |
| 65 to 74 Years | 125 (100.0%) | 0 (0.0%) |
| 75 Years and older | 134 (100.0%) | 0 (0.0%) |
| Total | 1,604 (90.5%) | 169 (9.5%) |
Health Insurance Coverage by Citizenship Status in Upper Pohatcong
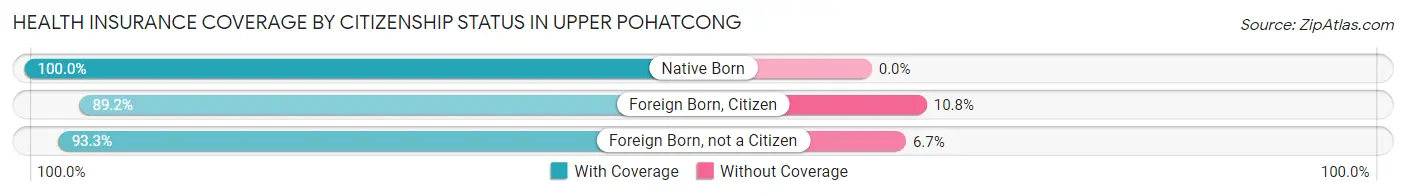
| Citizenship Status | With Coverage | Without Coverage |
| Native Born | 212 (100.0%) | 0 (0.0%) |
| Foreign Born, Citizen | 132 (89.2%) | 16 (10.8%) |
| Foreign Born, not a Citizen | 125 (93.3%) | 9 (6.7%) |
Health Insurance Coverage by Household Income in Upper Pohatcong
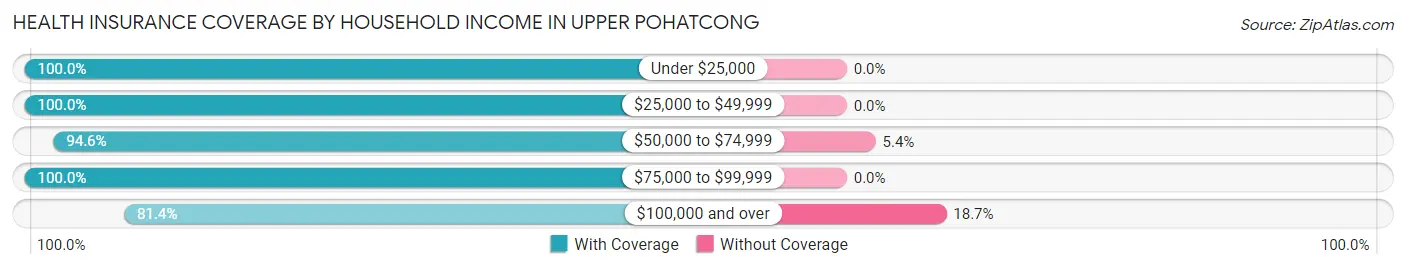
| Household Income | With Coverage | Without Coverage |
| Under $25,000 | 89 (100.0%) | 0 (0.0%) |
| $25,000 to $49,999 | 162 (100.0%) | 0 (0.0%) |
| $50,000 to $74,999 | 298 (94.6%) | 17 (5.4%) |
| $75,000 to $99,999 | 392 (100.0%) | 0 (0.0%) |
| $100,000 and over | 663 (81.4%) | 152 (18.6%) |
Public vs Private Health Insurance Coverage by Age in Upper Pohatcong
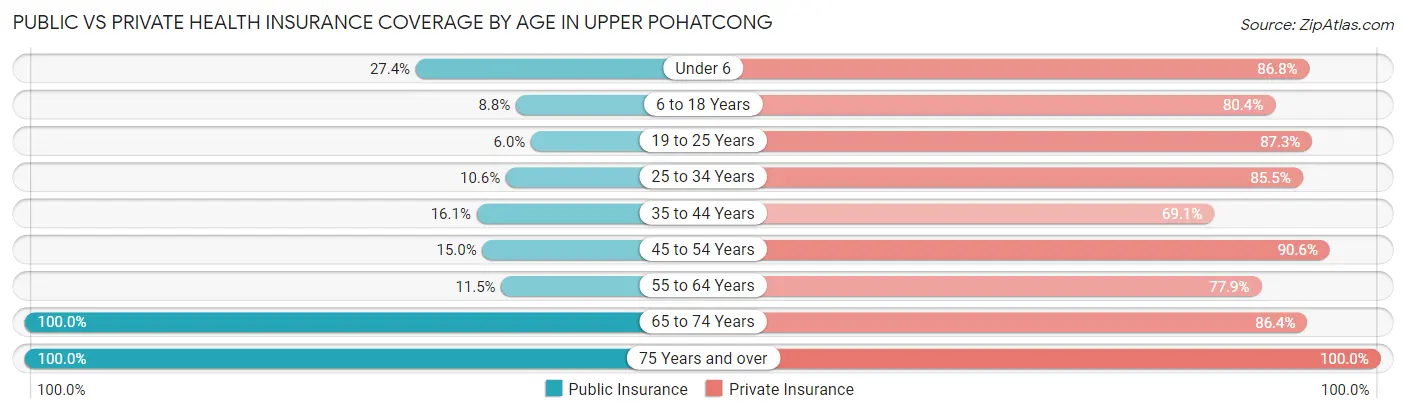
| Age Bracket | Public Insurance | Private Insurance |
| Under 6 | 58 (27.4%) | 184 (86.8%) |
| 6 to 18 Years | 13 (8.8%) | 119 (80.4%) |
| 19 to 25 Years | 8 (6.0%) | 117 (87.3%) |
| 25 to 34 Years | 22 (10.6%) | 177 (85.5%) |
| 35 to 44 Years | 64 (16.1%) | 275 (69.1%) |
| 45 to 54 Years | 27 (15.0%) | 163 (90.6%) |
| 55 to 64 Years | 27 (11.5%) | 183 (77.9%) |
| 65 to 74 Years | 125 (100.0%) | 108 (86.4%) |
| 75 Years and over | 134 (100.0%) | 134 (100.0%) |
| Total | 478 (27.0%) | 1,460 (82.4%) |
Disability Status by Sex by Age in Upper Pohatcong
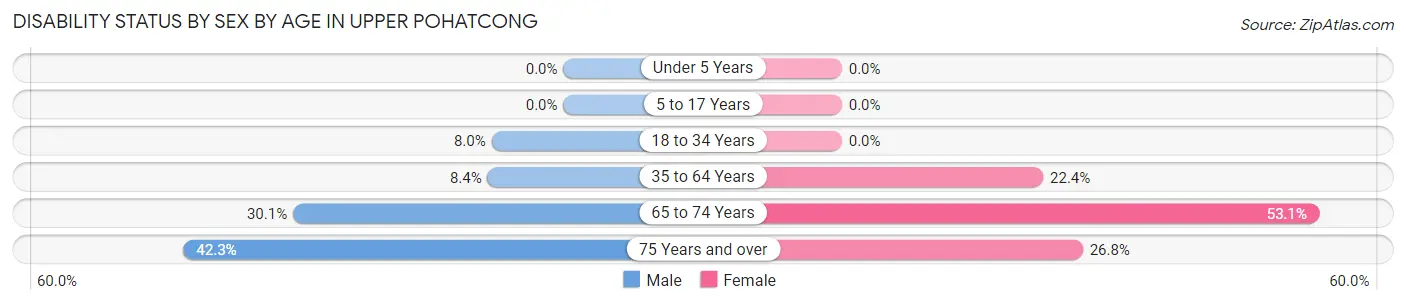
| Age Bracket | Male | Female |
| Under 5 Years | 0 (0.0%) | 0 (0.0%) |
| 5 to 17 Years | 0 (0.0%) | 0 (0.0%) |
| 18 to 34 Years | 12 (8.0%) | 0 (0.0%) |
| 35 to 64 Years | 40 (8.4%) | 76 (22.4%) |
| 65 to 74 Years | 28 (30.1%) | 17 (53.1%) |
| 75 Years and over | 22 (42.3%) | 22 (26.8%) |
Disability Class by Sex by Age in Upper Pohatcong
Disability Class: Hearing Difficulty
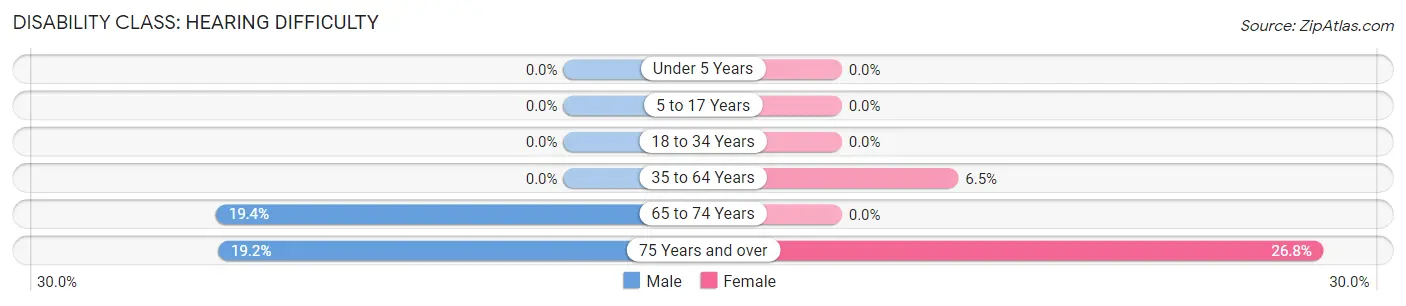
| Age Bracket | Male | Female |
| Under 5 Years | 0 (0.0%) | 0 (0.0%) |
| 5 to 17 Years | 0 (0.0%) | 0 (0.0%) |
| 18 to 34 Years | 0 (0.0%) | 0 (0.0%) |
| 35 to 64 Years | 0 (0.0%) | 22 (6.5%) |
| 65 to 74 Years | 18 (19.4%) | 0 (0.0%) |
| 75 Years and over | 10 (19.2%) | 22 (26.8%) |
Disability Class: Vision Difficulty
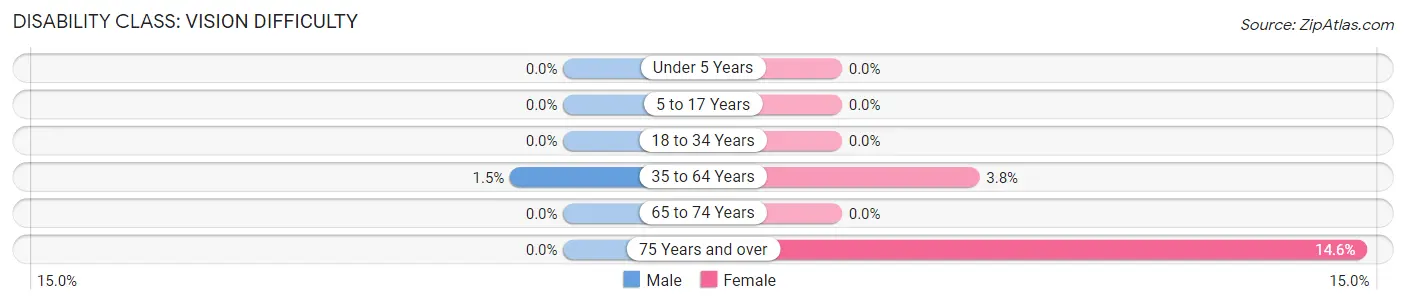
| Age Bracket | Male | Female |
| Under 5 Years | 0 (0.0%) | 0 (0.0%) |
| 5 to 17 Years | 0 (0.0%) | 0 (0.0%) |
| 18 to 34 Years | 0 (0.0%) | 0 (0.0%) |
| 35 to 64 Years | 7 (1.5%) | 13 (3.8%) |
| 65 to 74 Years | 0 (0.0%) | 0 (0.0%) |
| 75 Years and over | 0 (0.0%) | 12 (14.6%) |
Disability Class: Cognitive Difficulty
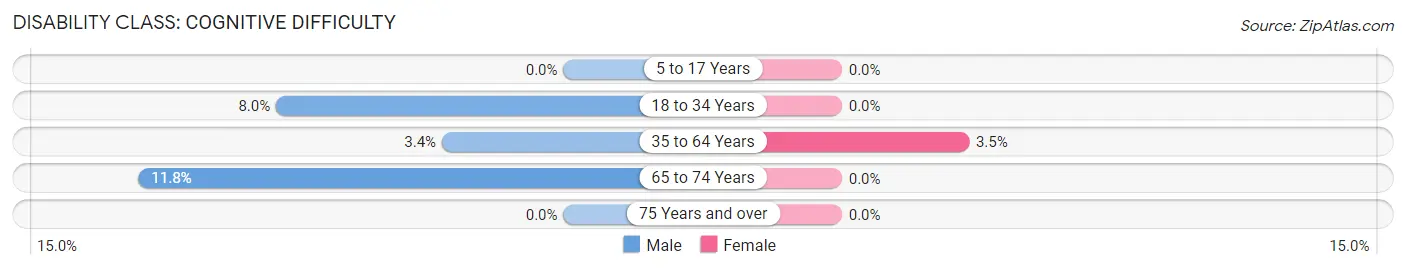
| Age Bracket | Male | Female |
| 5 to 17 Years | 0 (0.0%) | 0 (0.0%) |
| 18 to 34 Years | 12 (8.0%) | 0 (0.0%) |
| 35 to 64 Years | 16 (3.4%) | 12 (3.5%) |
| 65 to 74 Years | 11 (11.8%) | 0 (0.0%) |
| 75 Years and over | 0 (0.0%) | 0 (0.0%) |
Disability Class: Ambulatory Difficulty
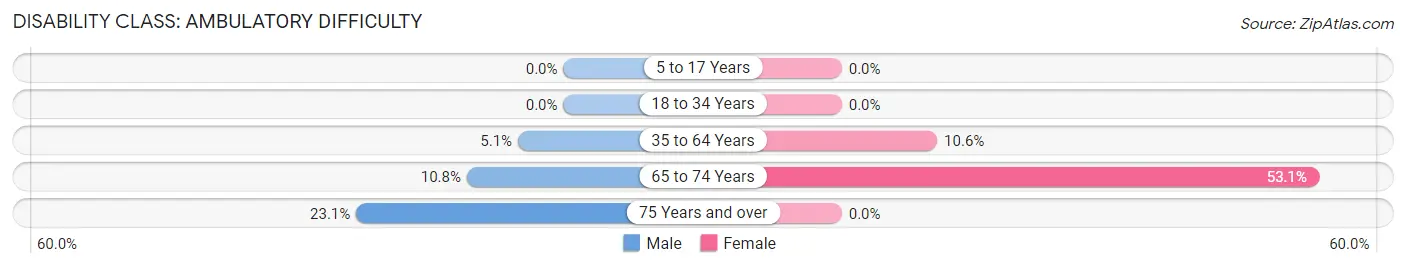
| Age Bracket | Male | Female |
| 5 to 17 Years | 0 (0.0%) | 0 (0.0%) |
| 18 to 34 Years | 0 (0.0%) | 0 (0.0%) |
| 35 to 64 Years | 24 (5.1%) | 36 (10.6%) |
| 65 to 74 Years | 10 (10.7%) | 17 (53.1%) |
| 75 Years and over | 12 (23.1%) | 0 (0.0%) |
Disability Class: Self-Care Difficulty
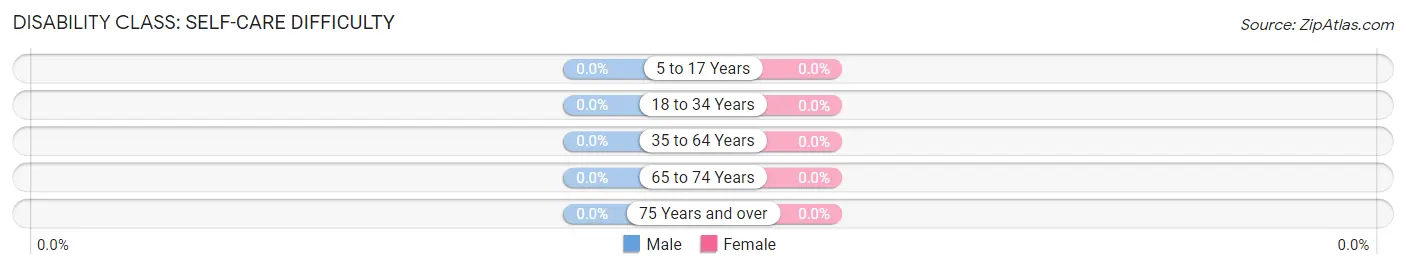
| Age Bracket | Male | Female |
| 5 to 17 Years | 0 (0.0%) | 0 (0.0%) |
| 18 to 34 Years | 0 (0.0%) | 0 (0.0%) |
| 35 to 64 Years | 0 (0.0%) | 0 (0.0%) |
| 65 to 74 Years | 0 (0.0%) | 0 (0.0%) |
| 75 Years and over | 0 (0.0%) | 0 (0.0%) |
Technology Access in Upper Pohatcong
Computing Device Access in Upper Pohatcong
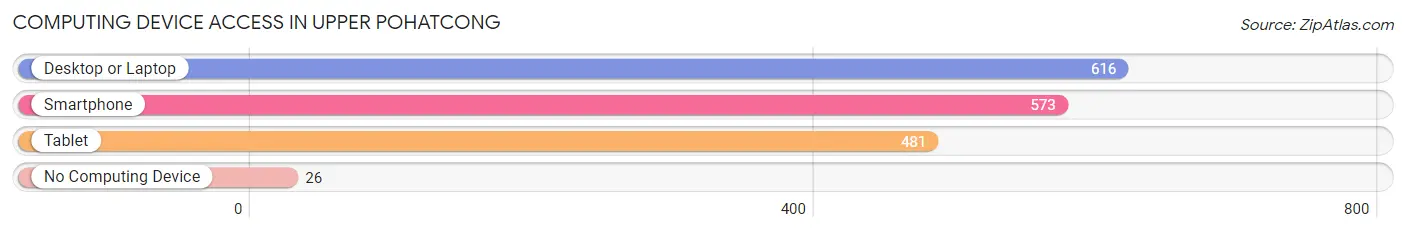
| Device Type | # Households | % Households |
| Desktop or Laptop | 616 | 85.9% |
| Smartphone | 573 | 79.9% |
| Tablet | 481 | 67.1% |
| No Computing Device | 26 | 3.6% |
| Total | 717 | 100.0% |
Internet Access in Upper Pohatcong
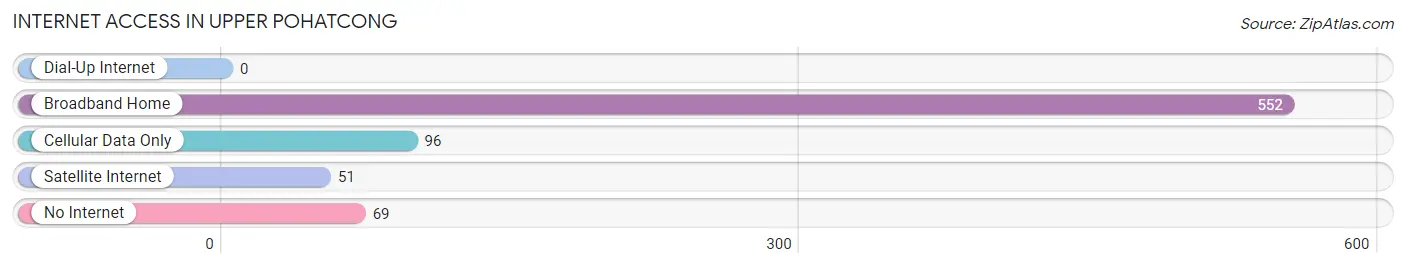
| Internet Type | # Households | % Households |
| Dial-Up Internet | 0 | 0.0% |
| Broadband Home | 552 | 77.0% |
| Cellular Data Only | 96 | 13.4% |
| Satellite Internet | 51 | 7.1% |
| No Internet | 69 | 9.6% |
| Total | 717 | 100.0% |
Upper Pohatcong Summary
Upper Pohatcong is a small unincorporated community located in Warren County, New Jersey. It is situated in the northwest corner of the county, near the border with Pennsylvania. The community is part of the Phillipsburg Metropolitan Statistical Area, and is located approximately 10 miles from the city of Phillipsburg.
History
Upper Pohatcong was first settled in the late 1700s by German immigrants. The area was originally known as “Upper Pohatcong” due to its location at the top of the Pohatcong Creek. The community was officially established in 1845, when the first post office was opened.
The area was primarily agricultural, with many farms and orchards. In the late 1800s, the area began to industrialize, with the opening of several factories. These included a silk mill, a paper mill, and a brickyard.
Geography
Upper Pohatcong is located in the northwest corner of Warren County, near the border with Pennsylvania. The community is situated on the banks of the Pohatcong Creek, which flows through the area. The area is mostly rural, with rolling hills and forests.
The climate in Upper Pohatcong is typical of the Northeastern United States, with cold winters and hot, humid summers. The average annual temperature is around 50 degrees Fahrenheit.
Economy
Upper Pohatcong is primarily a residential community, with no major industries. The area is home to several small businesses, including a few restaurants, a gas station, and a few retail stores.
The area is also home to several farms, which produce a variety of crops, including corn, soybeans, and hay. The area is also home to several wineries, which produce a variety of wines.
Demographics
As of the 2010 census, the population of Upper Pohatcong was 1,845. The racial makeup of the community was 94.3% White, 2.2% African American, 0.3% Native American, 0.7% Asian, and 2.5% from other races.
The median household income in Upper Pohatcong was $60,938, and the median family income was $68,750. The per capita income was $25,945. The unemployment rate was 5.2%.
Conclusion
Upper Pohatcong is a small unincorporated community located in Warren County, New Jersey. It is situated in the northwest corner of the county, near the border with Pennsylvania. The community is part of the Phillipsburg Metropolitan Statistical Area, and is located approximately 10 miles from the city of Phillipsburg. The area was first settled in the late 1700s by German immigrants, and was officially established in 1845. The area is mostly rural, with rolling hills and forests, and is primarily a residential community. The population of Upper Pohatcong was 1,845 as of the 2010 census, and the median household income was $60,938. The area is home to several small businesses, farms, and wineries.
Common Questions
What is the Total Population of Upper Pohatcong?
Total Population of Upper Pohatcong is 1,773.
What is the Total Male Population of Upper Pohatcong?
Total Male Population of Upper Pohatcong is 926.
What is the Total Female Population of Upper Pohatcong?
Total Female Population of Upper Pohatcong is 847.
What is the Ratio of Males per 100 Females in Upper Pohatcong?
There are 109.33 Males per 100 Females in Upper Pohatcong.
What is the Ratio of Females per 100 Males in Upper Pohatcong?
There are 91.47 Females per 100 Males in Upper Pohatcong.
What is the Median Population Age in Upper Pohatcong?
Median Population Age in Upper Pohatcong is 38.3 Years.
What is the Average Family Size in Upper Pohatcong
Average Family Size in Upper Pohatcong is 2.7 People.
What is the Average Household Size in Upper Pohatcong
Average Household Size in Upper Pohatcong is 2.5 People.
What is Per Capita Income in Upper Pohatcong?
Per Capita income in Upper Pohatcong is $38,370.
What is the Median Family Income in Upper Pohatcong?
Median Family Income in Upper Pohatcong is $106,071.
What is the Median Household income in Upper Pohatcong?
Median Household Income in Upper Pohatcong is $95,893.
What is Income or Wage Gap in Upper Pohatcong?
Income or Wage Gap in Upper Pohatcong is 53.8%.
Women in Upper Pohatcong earn 46.2 cents for every dollar earned by a man.
What is Inequality or Gini Index in Upper Pohatcong?
Inequality or Gini Index in Upper Pohatcong is 0.31.
How Large is the Labor Force in Upper Pohatcong?
There are 1,012 People in the Labor Forcein in Upper Pohatcong.
What is the Percentage of People in the Labor Force in Upper Pohatcong?
67.9% of People are in the Labor Force in Upper Pohatcong.
What is the Unemployment Rate in Upper Pohatcong?
Unemployment Rate in Upper Pohatcong is 4.1%.