Panther Valley, NJ
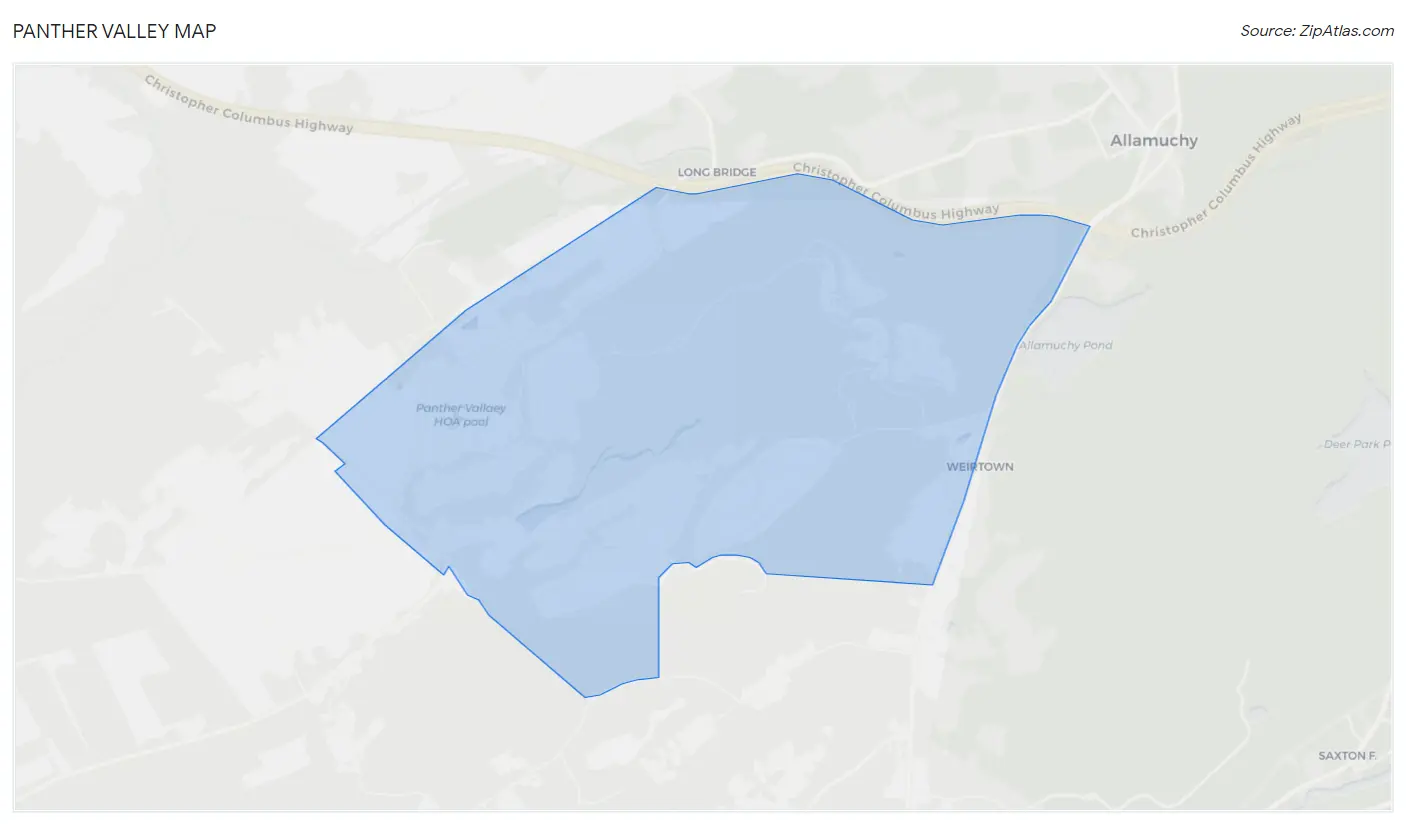
Panther Valley Map
Panther Valley Overview
4,562
TOTAL POPULATION
2,103
MALE POPULATION
2,459
FEMALE POPULATION
85.52
MALES / 100 FEMALES
116.93
FEMALES / 100 MALES
49.8
MEDIAN AGE
3.0
AVG FAMILY SIZE
2.2
AVG HOUSEHOLD SIZE
$65,314
PER CAPITA INCOME
$172,597
AVG FAMILY INCOME
$124,035
AVG HOUSEHOLD INCOME
29.5%
WAGE / INCOME GAP [ % ]
70.5¢/ $1
WAGE / INCOME GAP [ $ ]
0.37
INEQUALITY / GINI INDEX
2,519
LABOR FORCE [ PEOPLE ]
66.7%
PERCENT IN LABOR FORCE
8.3%
UNEMPLOYMENT RATE
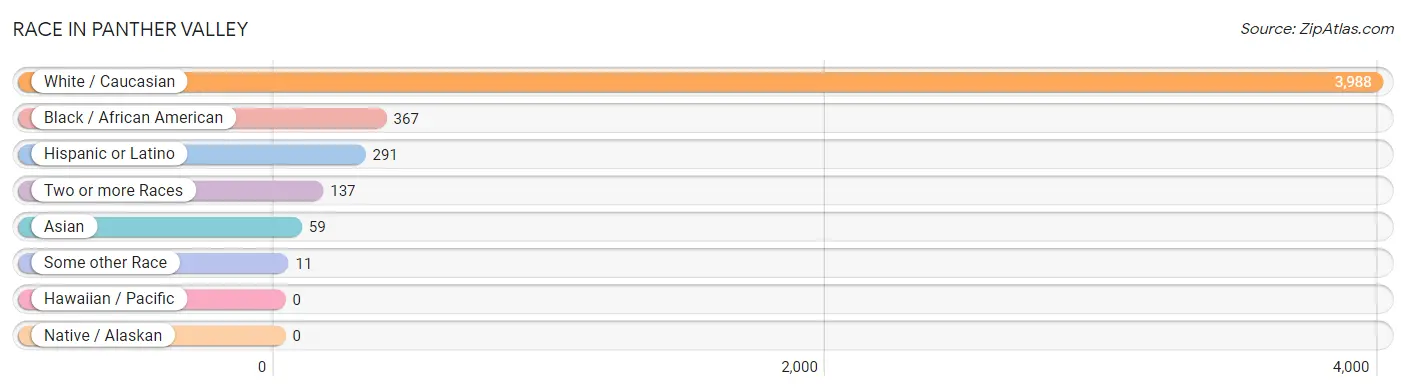
Race in Panther Valley
The most populous races in Panther Valley are White / Caucasian (3,988 | 87.4%), Black / African American (367 | 8.0%), and Hispanic or Latino (291 | 6.4%).
| Race | # Population | % Population |
| Asian | 59 | 1.3% |
| Black / African American | 367 | 8.0% |
| Hawaiian / Pacific | 0 | 0.0% |
| Hispanic or Latino | 291 | 6.4% |
| Native / Alaskan | 0 | 0.0% |
| White / Caucasian | 3,988 | 87.4% |
| Two or more Races | 137 | 3.0% |
| Some other Race | 11 | 0.2% |
| Total | 4,562 | 100.0% |
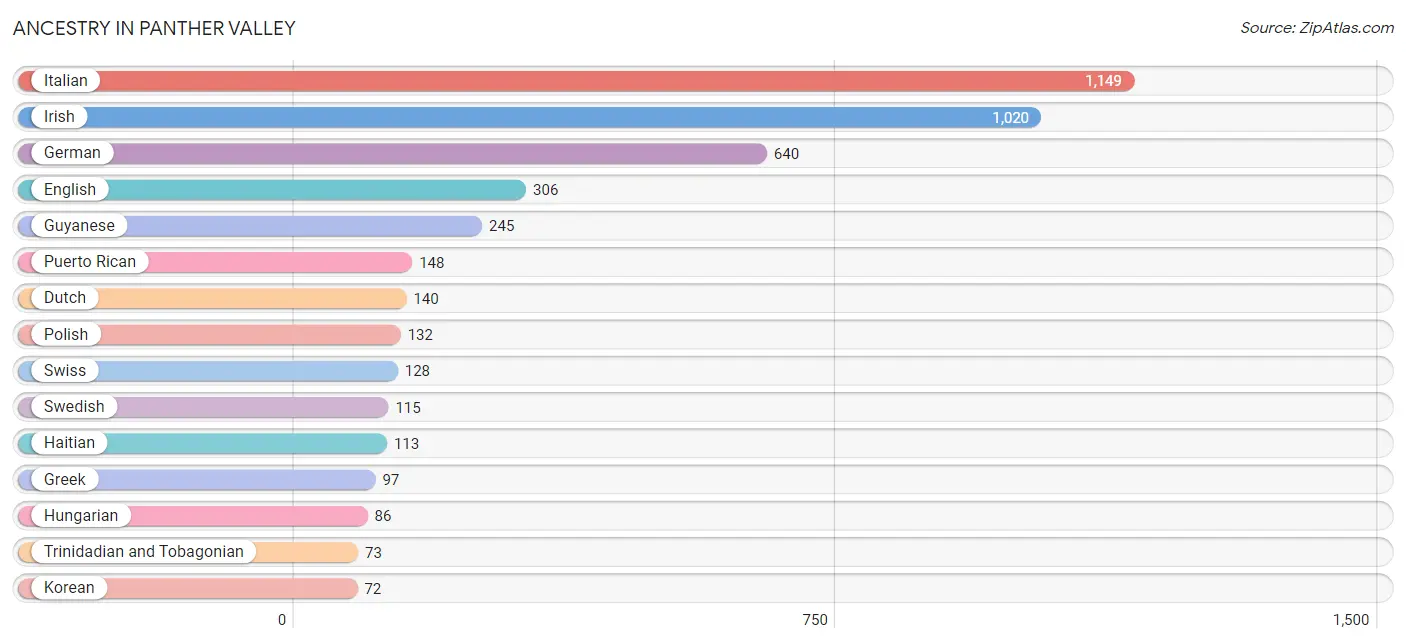
Ancestry in Panther Valley
The most populous ancestries reported in Panther Valley are Italian (1,149 | 25.2%), Irish (1,020 | 22.4%), German (640 | 14.0%), English (306 | 6.7%), and Guyanese (245 | 5.4%), together accounting for 73.7% of all Panther Valley residents.
| Ancestry | # Population | % Population |
| African | 23 | 0.5% |
| American | 60 | 1.3% |
| Arab | 9 | 0.2% |
| Armenian | 15 | 0.3% |
| Brazilian | 8 | 0.2% |
| Canadian | 24 | 0.5% |
| Central American | 21 | 0.5% |
| Colombian | 27 | 0.6% |
| Costa Rican | 21 | 0.5% |
| Cuban | 11 | 0.2% |
| Danish | 11 | 0.2% |
| Dominican | 32 | 0.7% |
| Dutch | 140 | 3.1% |
| Eastern European | 40 | 0.9% |
| English | 306 | 6.7% |
| Estonian | 23 | 0.5% |
| European | 30 | 0.7% |
| French | 20 | 0.4% |
| French Canadian | 19 | 0.4% |
| German | 640 | 14.0% |
| Greek | 97 | 2.1% |
| Guyanese | 245 | 5.4% |
| Haitian | 113 | 2.5% |
| Hungarian | 86 | 1.9% |
| Irish | 1,020 | 22.4% |
| Italian | 1,149 | 25.2% |
| Korean | 72 | 1.6% |
| Lebanese | 9 | 0.2% |
| Mexican | 37 | 0.8% |
| Norwegian | 26 | 0.6% |
| Pennsylvania German | 10 | 0.2% |
| Polish | 132 | 2.9% |
| Portuguese | 47 | 1.0% |
| Puerto Rican | 148 | 3.2% |
| Romanian | 45 | 1.0% |
| Russian | 14 | 0.3% |
| Scandinavian | 69 | 1.5% |
| Scotch-Irish | 5 | 0.1% |
| Scottish | 50 | 1.1% |
| Slavic | 8 | 0.2% |
| South American | 27 | 0.6% |
| Spaniard | 15 | 0.3% |
| Subsaharan African | 23 | 0.5% |
| Swedish | 115 | 2.5% |
| Swiss | 128 | 2.8% |
| Trinidadian and Tobagonian | 73 | 1.6% |
| Ukrainian | 53 | 1.2% |
| Welsh | 26 | 0.6% | View All 48 Rows |
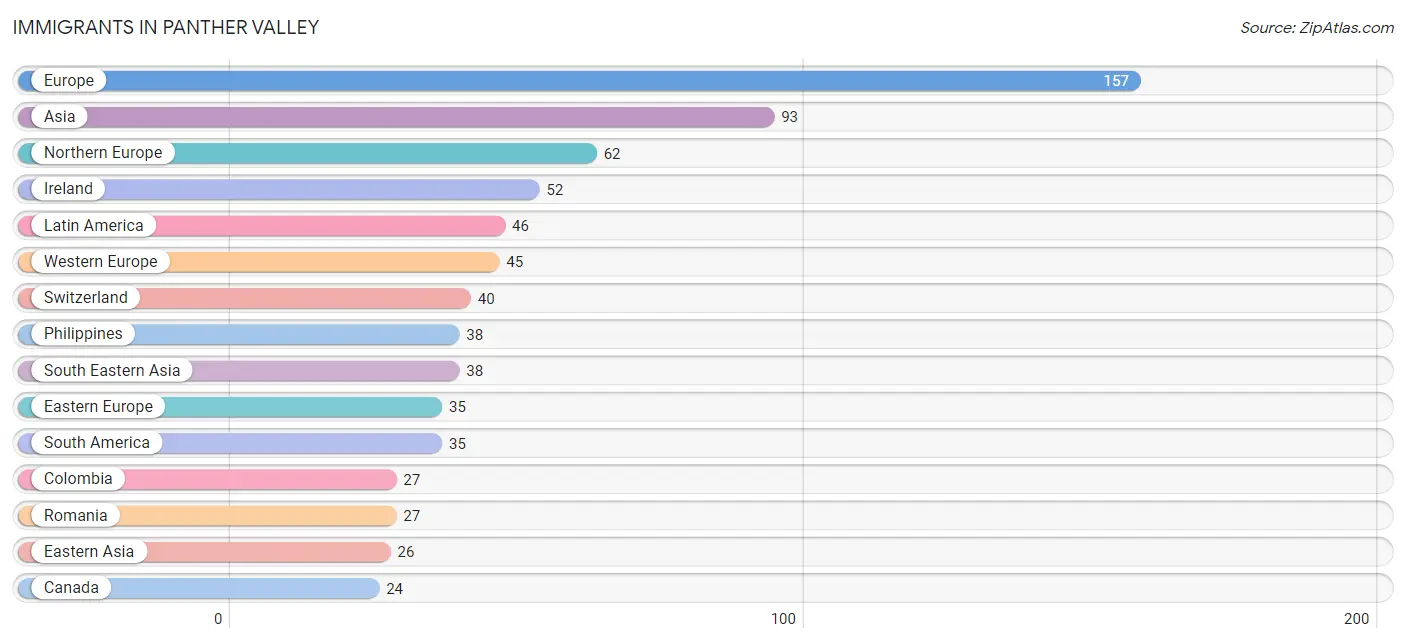
Immigrants in Panther Valley
The most numerous immigrant groups reported in Panther Valley came from Europe (157 | 3.4%), Asia (93 | 2.0%), Northern Europe (62 | 1.4%), Ireland (52 | 1.1%), and Latin America (46 | 1.0%), together accounting for 9.0% of all Panther Valley residents.
| Immigration Origin | # Population | % Population |
| Africa | 12 | 0.3% |
| Armenia | 15 | 0.3% |
| Asia | 93 | 2.0% |
| Brazil | 8 | 0.2% |
| Canada | 24 | 0.5% |
| Caribbean | 11 | 0.2% |
| China | 10 | 0.2% |
| Colombia | 27 | 0.6% |
| Cuba | 11 | 0.2% |
| Eastern Asia | 26 | 0.6% |
| Eastern Europe | 35 | 0.8% |
| England | 10 | 0.2% |
| Europe | 157 | 3.4% |
| Germany | 5 | 0.1% |
| Ghana | 12 | 0.3% |
| Ireland | 52 | 1.1% |
| Japan | 16 | 0.4% |
| Latin America | 46 | 1.0% |
| Northern Europe | 62 | 1.4% |
| Philippines | 38 | 0.8% |
| Romania | 27 | 0.6% |
| South America | 35 | 0.8% |
| South Central Asia | 14 | 0.3% |
| South Eastern Asia | 38 | 0.8% |
| Southern Europe | 15 | 0.3% |
| Spain | 15 | 0.3% |
| Switzerland | 40 | 0.9% |
| Ukraine | 8 | 0.2% |
| Uzbekistan | 14 | 0.3% |
| Western Africa | 12 | 0.3% |
| Western Asia | 15 | 0.3% |
| Western Europe | 45 | 1.0% | View All 32 Rows |
Sex and Age in Panther Valley
Sex and Age in Panther Valley
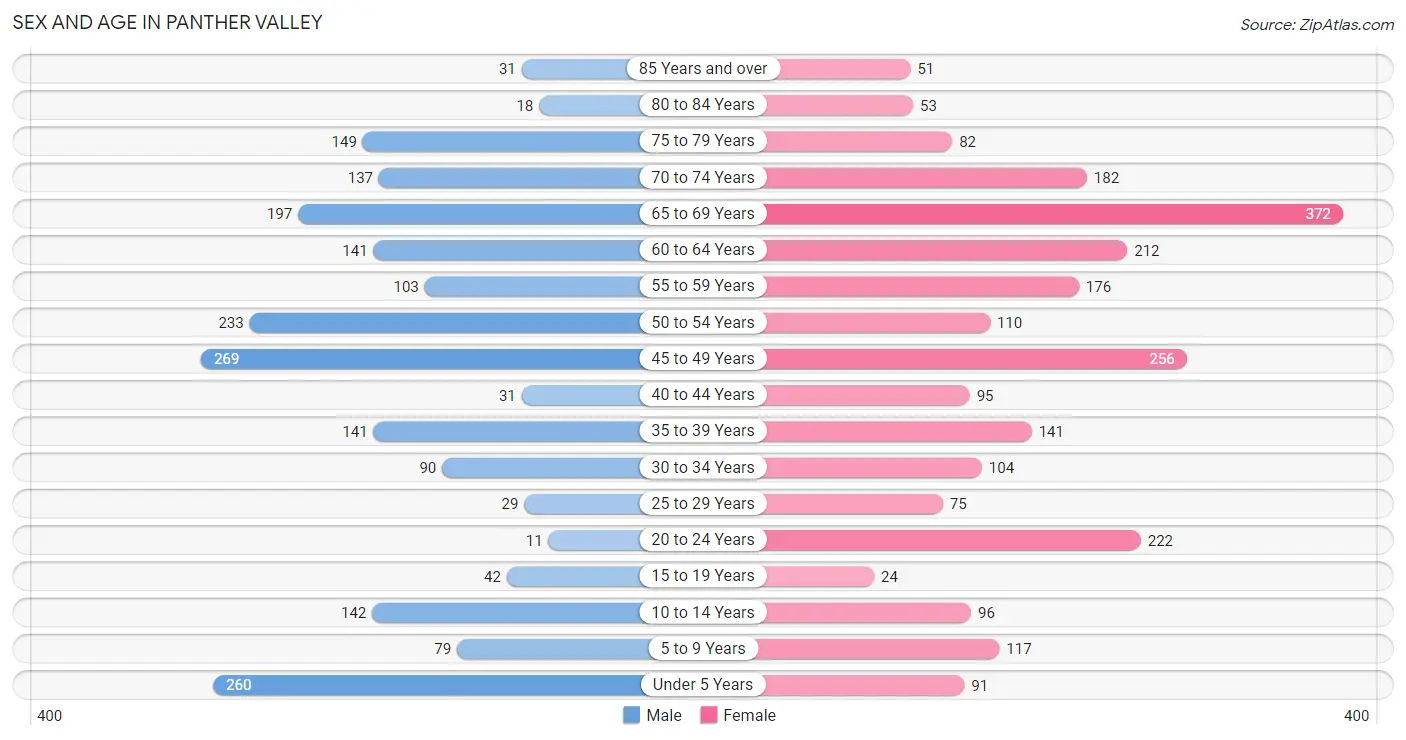
The most populous age groups in Panther Valley are 45 to 49 Years (269 | 12.8%) for men and 65 to 69 Years (372 | 15.1%) for women.
| Age Bracket | Male | Female |
| Under 5 Years | 260 (12.4%) | 91 (3.7%) |
| 5 to 9 Years | 79 (3.8%) | 117 (4.8%) |
| 10 to 14 Years | 142 (6.8%) | 96 (3.9%) |
| 15 to 19 Years | 42 (2.0%) | 24 (1.0%) |
| 20 to 24 Years | 11 (0.5%) | 222 (9.0%) |
| 25 to 29 Years | 29 (1.4%) | 75 (3.0%) |
| 30 to 34 Years | 90 (4.3%) | 104 (4.2%) |
| 35 to 39 Years | 141 (6.7%) | 141 (5.7%) |
| 40 to 44 Years | 31 (1.5%) | 95 (3.9%) |
| 45 to 49 Years | 269 (12.8%) | 256 (10.4%) |
| 50 to 54 Years | 233 (11.1%) | 110 (4.5%) |
| 55 to 59 Years | 103 (4.9%) | 176 (7.2%) |
| 60 to 64 Years | 141 (6.7%) | 212 (8.6%) |
| 65 to 69 Years | 197 (9.4%) | 372 (15.1%) |
| 70 to 74 Years | 137 (6.5%) | 182 (7.4%) |
| 75 to 79 Years | 149 (7.1%) | 82 (3.3%) |
| 80 to 84 Years | 18 (0.9%) | 53 (2.2%) |
| 85 Years and over | 31 (1.5%) | 51 (2.1%) |
| Total | 2,103 (100.0%) | 2,459 (100.0%) |
Families and Households in Panther Valley
Median Family Size in Panther Valley
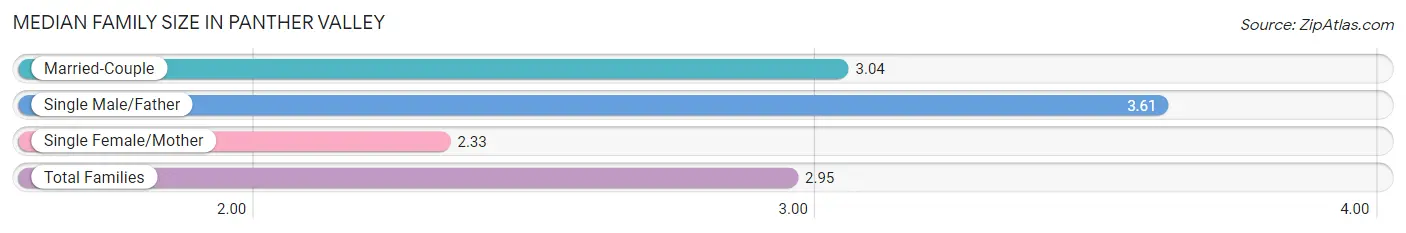
The median family size in Panther Valley is 2.95 persons per family, with single male/father families (36 | 3.0%) accounting for the largest median family size of 3.61 persons per family. On the other hand, single female/mother families (175 | 14.4%) represent the smallest median family size with 2.33 persons per family.
| Family Type | # Families | Family Size |
| Married-Couple | 1,003 (82.6%) | 3.04 |
| Single Male/Father | 36 (3.0%) | 3.61 |
| Single Female/Mother | 175 (14.4%) | 2.33 |
| Total Families | 1,214 (100.0%) | 2.95 |
Median Household Size in Panther Valley
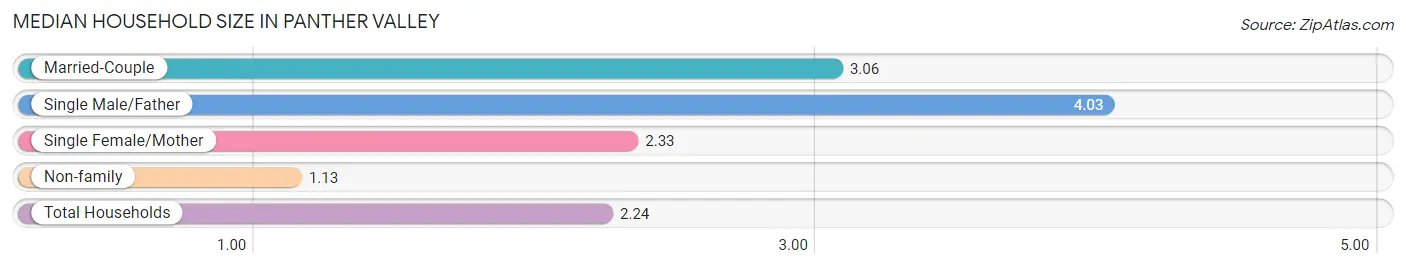
The median household size in Panther Valley is 2.24 persons per household, with single male/father households (36 | 1.8%) accounting for the largest median household size of 4.03 persons per household. non-family households (819 | 40.3%) represent the smallest median household size with 1.13 persons per household.
| Household Type | # Households | Household Size |
| Married-Couple | 1,003 (49.3%) | 3.06 |
| Single Male/Father | 36 (1.8%) | 4.03 |
| Single Female/Mother | 175 (8.6%) | 2.33 |
| Non-family | 819 (40.3%) | 1.13 |
| Total Households | 2,033 (100.0%) | 2.24 |
Household Size by Marriage Status in Panther Valley
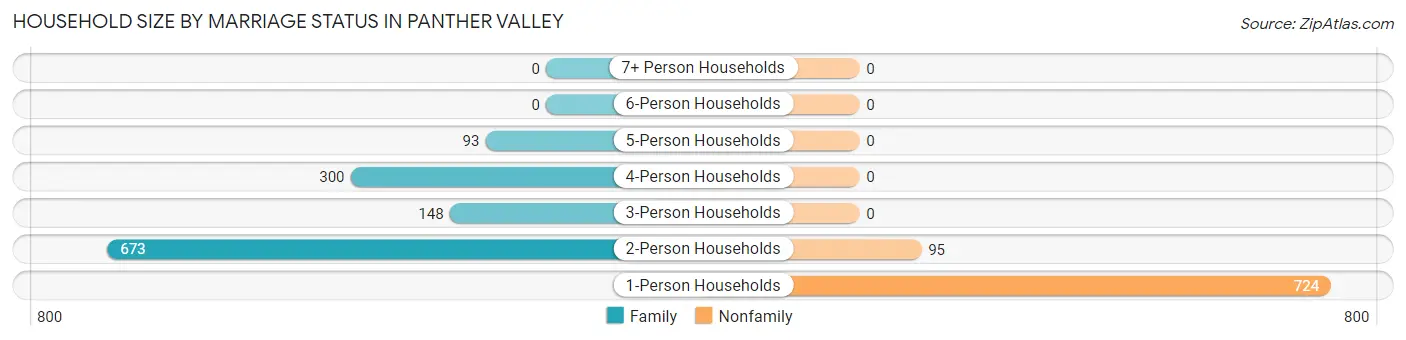
Out of a total of 2,033 households in Panther Valley, 1,214 (59.7%) are family households, while 819 (40.3%) are nonfamily households. The most numerous type of family households are 2-person households, comprising 673, and the most common type of nonfamily households are 1-person households, comprising 724.
| Household Size | Family Households | Nonfamily Households |
| 1-Person Households | - | 724 (35.6%) |
| 2-Person Households | 673 (33.1%) | 95 (4.7%) |
| 3-Person Households | 148 (7.3%) | 0 (0.0%) |
| 4-Person Households | 300 (14.8%) | 0 (0.0%) |
| 5-Person Households | 93 (4.6%) | 0 (0.0%) |
| 6-Person Households | 0 (0.0%) | 0 (0.0%) |
| 7+ Person Households | 0 (0.0%) | 0 (0.0%) |
| Total | 1,214 (59.7%) | 819 (40.3%) |
Female Fertility in Panther Valley
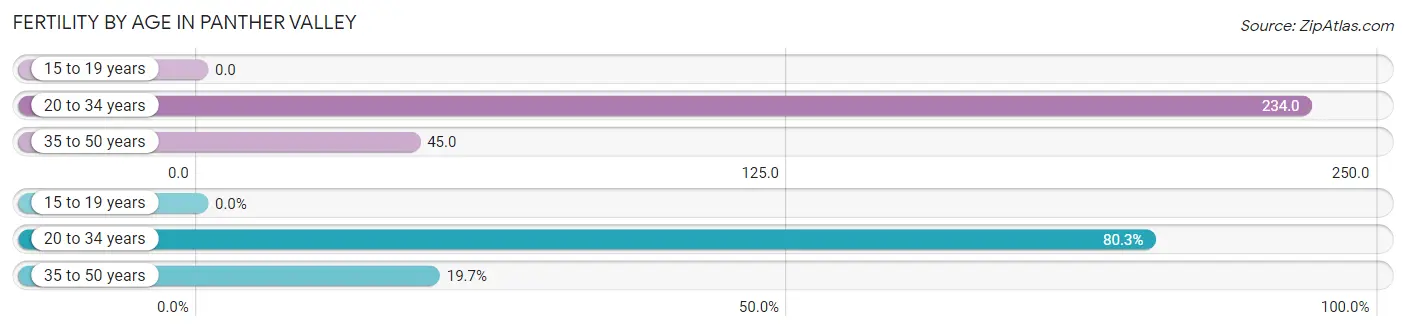
Fertility by Age in Panther Valley
Average fertility rate in Panther Valley is 125.0 births per 1,000 women. Women in the age bracket of 20 to 34 years have the highest fertility rate with 234.0 births per 1,000 women. Women in the age bracket of 20 to 34 years acount for 80.3% of all women with births.
| Age Bracket | Women with Births | Births / 1,000 Women |
| 15 to 19 years | 0 (0.0%) | 0.0 |
| 20 to 34 years | 94 (80.3%) | 234.0 |
| 35 to 50 years | 23 (19.7%) | 45.0 |
| Total | 117 (100.0%) | 125.0 |
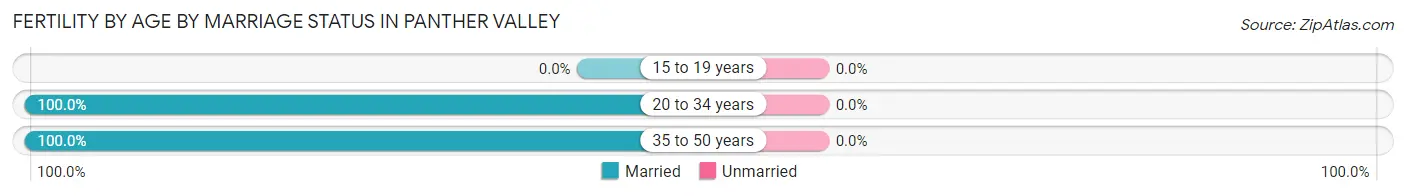
Fertility by Age by Marriage Status in Panther Valley
| Age Bracket | Married | Unmarried |
| 15 to 19 years | 0 (0.0%) | 0 (0.0%) |
| 20 to 34 years | 94 (100.0%) | 0 (0.0%) |
| 35 to 50 years | 23 (100.0%) | 0 (0.0%) |
| Total | 117 (100.0%) | 0 (0.0%) |
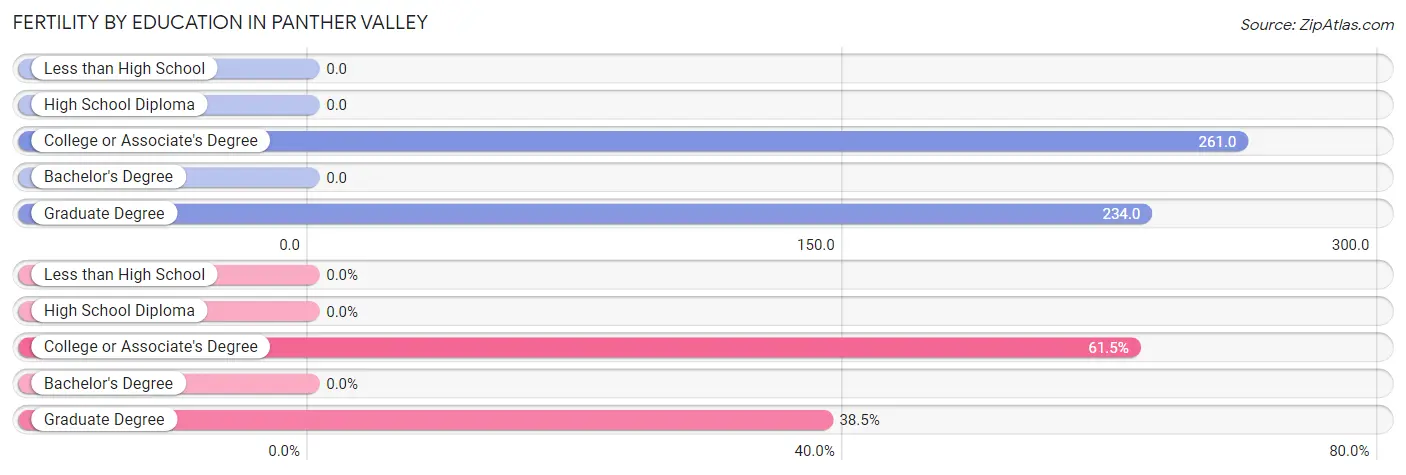
Fertility by Education in Panther Valley
| Educational Attainment | Women with Births | Births / 1,000 Women |
| Less than High School | 0 (0.0%) | 0.0 |
| High School Diploma | 0 (0.0%) | 0.0 |
| College or Associate's Degree | 72 (61.5%) | 261.0 |
| Bachelor's Degree | 0 (0.0%) | 0.0 |
| Graduate Degree | 45 (38.5%) | 234.0 |
| Total | 117 (100.0%) | 125.0 |
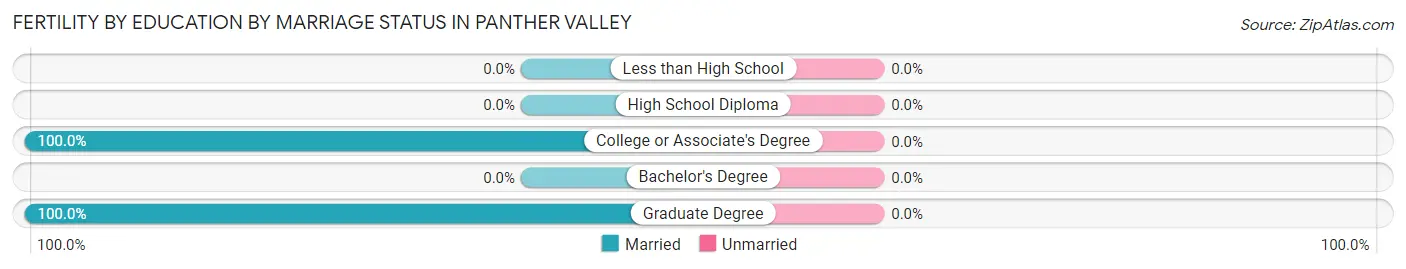
Fertility by Education by Marriage Status in Panther Valley
| Educational Attainment | Married | Unmarried |
| Less than High School | 0 (0.0%) | 0 (0.0%) |
| High School Diploma | 0 (0.0%) | 0 (0.0%) |
| College or Associate's Degree | 72 (100.0%) | 0 (0.0%) |
| Bachelor's Degree | 0 (0.0%) | 0 (0.0%) |
| Graduate Degree | 45 (100.0%) | 0 (0.0%) |
| Total | 117 (100.0%) | 0 (0.0%) |
Income in Panther Valley
Income Overview in Panther Valley
Per Capita Income in Panther Valley is $65,314, while median incomes of families and households are $172,597 and $124,035 respectively.
| Characteristic | Number | Measure |
| Per Capita Income | 4,562 | $65,314 |
| Median Family Income | 1,214 | $172,597 |
| Mean Family Income | 1,214 | $178,403 |
| Median Household Income | 2,033 | $124,035 |
| Mean Household Income | 2,033 | $142,333 |
| Income Deficit | 1,214 | $0 |
| Wage / Income Gap (%) | 4,562 | 29.48% |
| Wage / Income Gap ($) | 4,562 | 70.52¢ per $1 |
| Gini / Inequality Index | 4,562 | 0.37 |
Earnings by Sex in Panther Valley
Average Earnings in Panther Valley are $69,706, $81,123 for men and $57,206 for women, a difference of 29.5%.
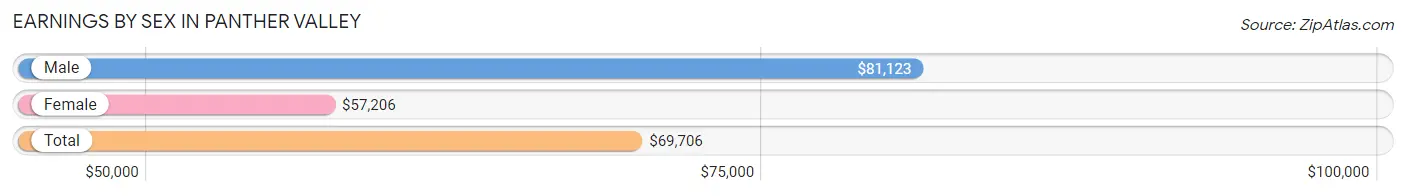
| Sex | Number | Average Earnings |
| Male | 1,183 (45.3%) | $81,123 |
| Female | 1,426 (54.7%) | $57,206 |
| Total | 2,609 (100.0%) | $69,706 |
Earnings by Sex by Income Bracket in Panther Valley
The most common earnings brackets in Panther Valley are $100,000+ for men (452 | 38.2%) and $75,000 to $99,999 for women (304 | 21.3%).
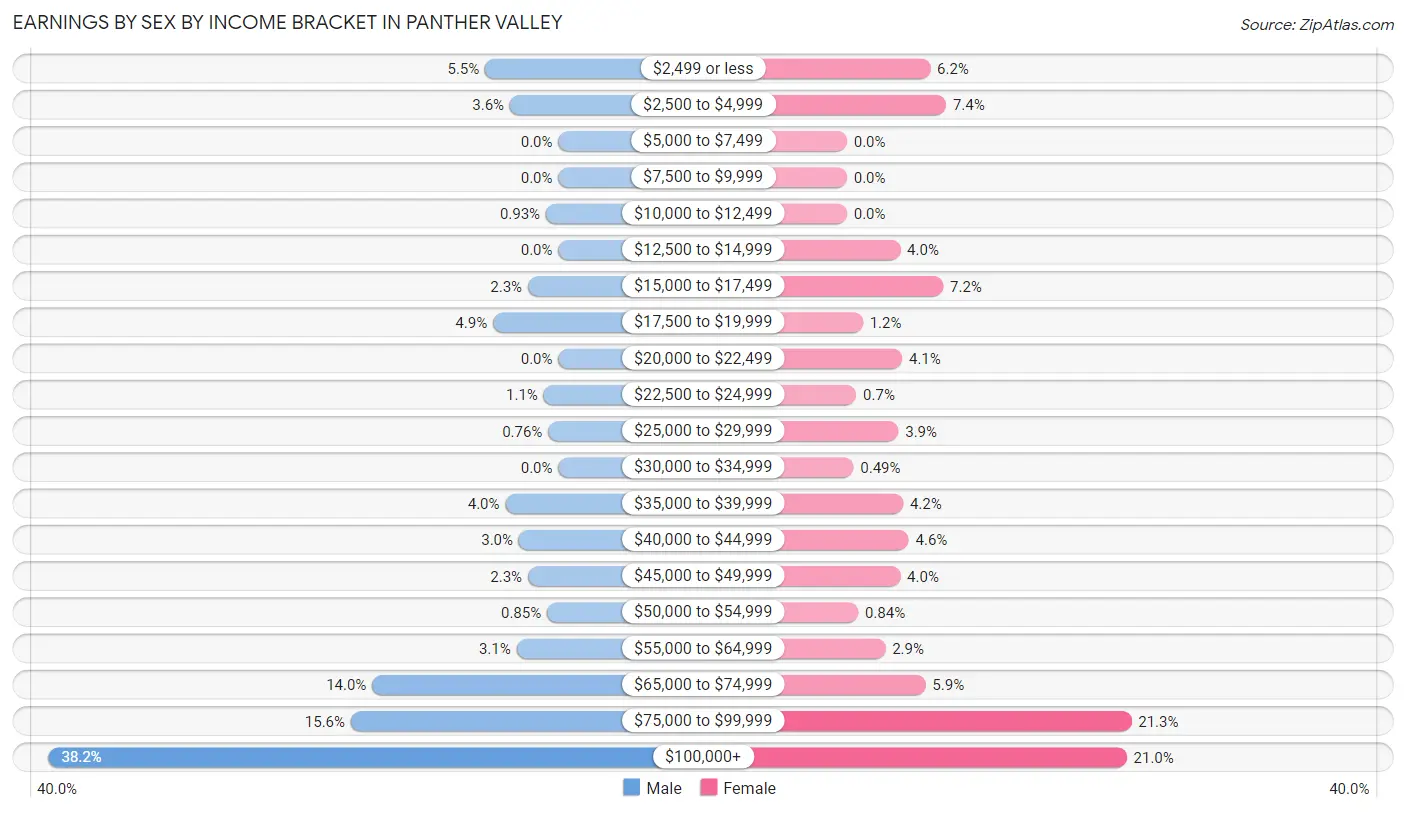
| Income | Male | Female |
| $2,499 or less | 65 (5.5%) | 89 (6.2%) |
| $2,500 to $4,999 | 43 (3.6%) | 106 (7.4%) |
| $5,000 to $7,499 | 0 (0.0%) | 0 (0.0%) |
| $7,500 to $9,999 | 0 (0.0%) | 0 (0.0%) |
| $10,000 to $12,499 | 11 (0.9%) | 0 (0.0%) |
| $12,500 to $14,999 | 0 (0.0%) | 57 (4.0%) |
| $15,000 to $17,499 | 27 (2.3%) | 103 (7.2%) |
| $17,500 to $19,999 | 58 (4.9%) | 17 (1.2%) |
| $20,000 to $22,499 | 0 (0.0%) | 59 (4.1%) |
| $22,500 to $24,999 | 13 (1.1%) | 10 (0.7%) |
| $25,000 to $29,999 | 9 (0.8%) | 55 (3.9%) |
| $30,000 to $34,999 | 0 (0.0%) | 7 (0.5%) |
| $35,000 to $39,999 | 47 (4.0%) | 60 (4.2%) |
| $40,000 to $44,999 | 35 (3.0%) | 66 (4.6%) |
| $45,000 to $49,999 | 27 (2.3%) | 57 (4.0%) |
| $50,000 to $54,999 | 10 (0.9%) | 12 (0.8%) |
| $55,000 to $64,999 | 37 (3.1%) | 41 (2.9%) |
| $65,000 to $74,999 | 165 (14.0%) | 84 (5.9%) |
| $75,000 to $99,999 | 184 (15.5%) | 304 (21.3%) |
| $100,000+ | 452 (38.2%) | 299 (21.0%) |
| Total | 1,183 (100.0%) | 1,426 (100.0%) |
Earnings by Sex by Educational Attainment in Panther Valley
Average earnings in Panther Valley are $81,788 for men and $75,401 for women, a difference of 7.8%. Men with an educational attainment of graduate degree enjoy the highest average annual earnings of $114,037, while those with bachelor's degree education earn the least with $69,229. Women with an educational attainment of bachelor's degree earn the most with the average annual earnings of $88,917, while those with high school diploma education have the smallest earnings of $39,787.
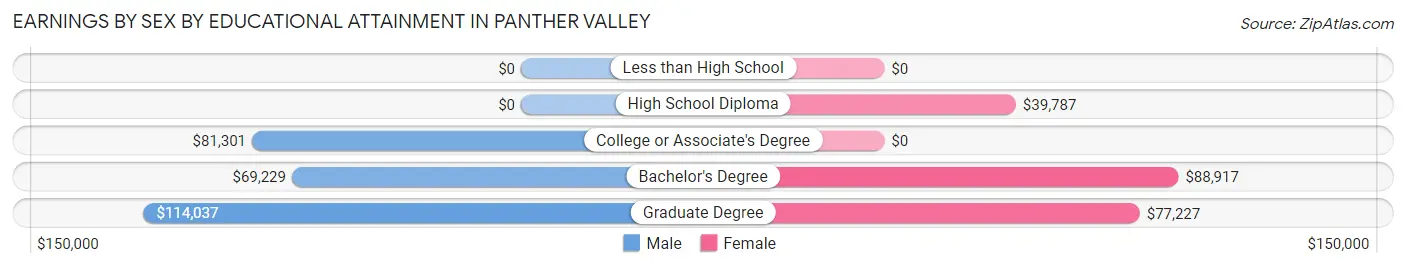
| Educational Attainment | Male Income | Female Income |
| Less than High School | - | - |
| High School Diploma | - | - |
| College or Associate's Degree | $81,301 | $0 |
| Bachelor's Degree | $69,229 | $88,917 |
| Graduate Degree | $114,037 | $77,227 |
| Total | $81,788 | $75,401 |
Family Income in Panther Valley
Family Income Brackets in Panther Valley
According to the Panther Valley family income data, there are 382 families falling into the $200,000+ income range, which is the most common income bracket and makes up 31.5% of all families.
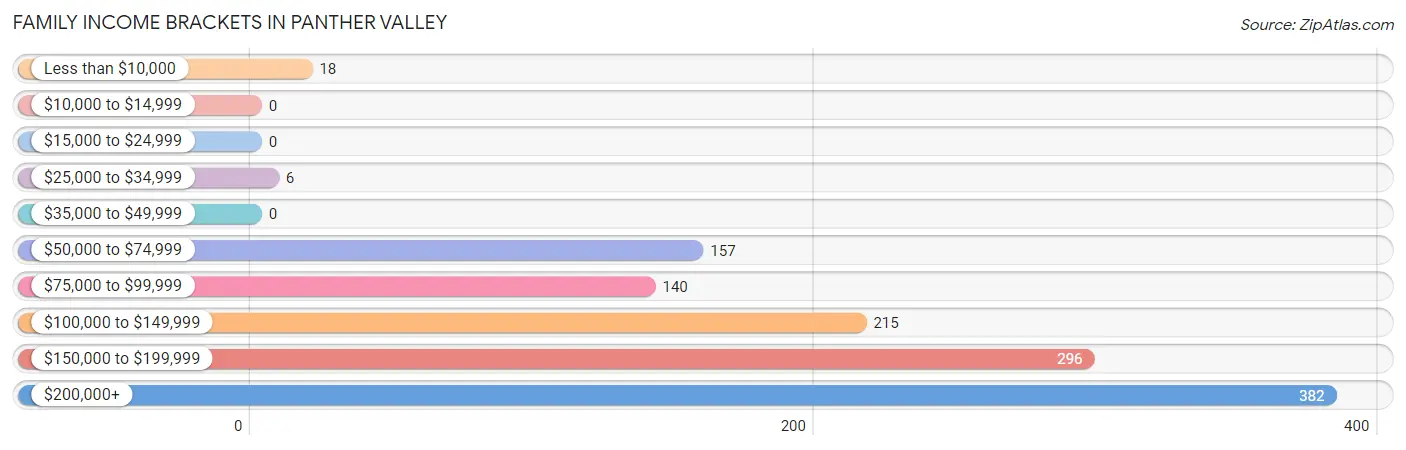
| Income Bracket | # Families | % Families |
| Less than $10,000 | 18 | 1.5% |
| $10,000 to $14,999 | 0 | 0.0% |
| $15,000 to $24,999 | 0 | 0.0% |
| $25,000 to $34,999 | 6 | 0.5% |
| $35,000 to $49,999 | 0 | 0.0% |
| $50,000 to $74,999 | 157 | 12.9% |
| $75,000 to $99,999 | 140 | 11.5% |
| $100,000 to $149,999 | 215 | 17.7% |
| $150,000 to $199,999 | 296 | 24.4% |
| $200,000+ | 382 | 31.5% |
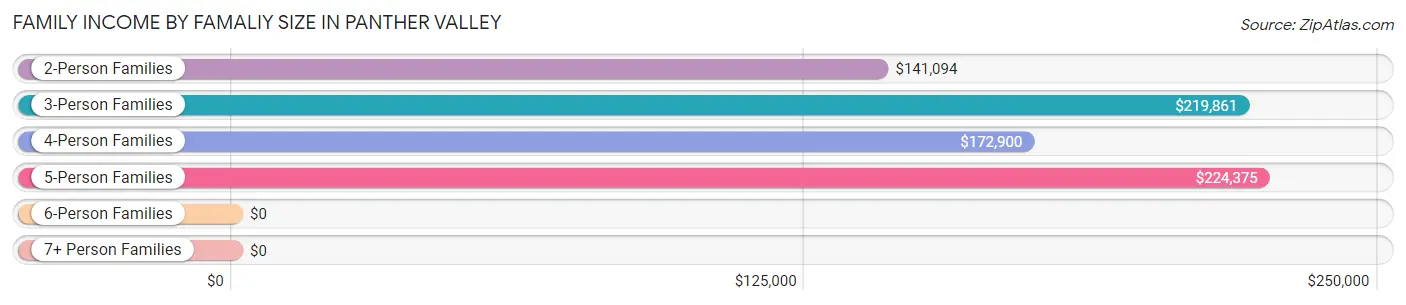
Family Income by Famaliy Size in Panther Valley
5-person families (93 | 7.7%) account for the highest median family income in Panther Valley with $224,375 per family, while 3-person families (166 | 13.7%) have the highest median income of $73,287 per family member.
| Income Bracket | # Families | Median Income |
| 2-Person Families | 682 (56.2%) | $141,094 |
| 3-Person Families | 166 (13.7%) | $219,861 |
| 4-Person Families | 273 (22.5%) | $172,900 |
| 5-Person Families | 93 (7.7%) | $224,375 |
| 6-Person Families | 0 (0.0%) | $0 |
| 7+ Person Families | 0 (0.0%) | $0 |
| Total | 1,214 (100.0%) | $172,597 |
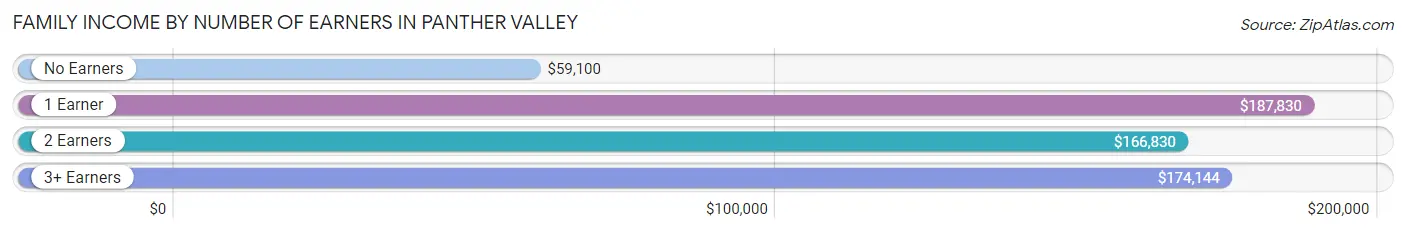
Family Income by Number of Earners in Panther Valley
The median family income in Panther Valley is $172,597, with families comprising 1 earner (433) having the highest median family income of $187,830, while families with no earners (124) have the lowest median family income of $59,100, accounting for 35.7% and 10.2% of families, respectively.
| Number of Earners | # Families | Median Income |
| No Earners | 124 (10.2%) | $59,100 |
| 1 Earner | 433 (35.7%) | $187,830 |
| 2 Earners | 491 (40.4%) | $166,830 |
| 3+ Earners | 166 (13.7%) | $174,144 |
| Total | 1,214 (100.0%) | $172,597 |
Household Income in Panther Valley
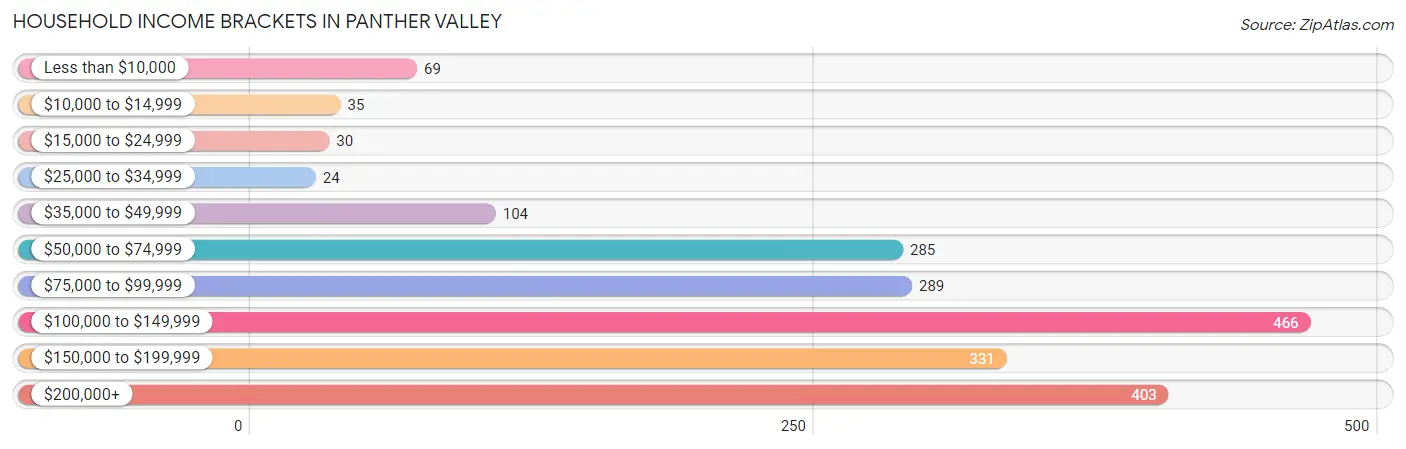
Household Income Brackets in Panther Valley
With 466 households falling in the category, the $100,000 to $149,999 income range is the most frequent in Panther Valley, accounting for 22.9% of all households. In contrast, only 24 households (1.2%) fall into the $25,000 to $34,999 income bracket, making it the least populous group.
| Income Bracket | # Households | % Households |
| Less than $10,000 | 69 | 3.4% |
| $10,000 to $14,999 | 35 | 1.7% |
| $15,000 to $24,999 | 30 | 1.5% |
| $25,000 to $34,999 | 24 | 1.2% |
| $35,000 to $49,999 | 104 | 5.1% |
| $50,000 to $74,999 | 285 | 14.0% |
| $75,000 to $99,999 | 289 | 14.2% |
| $100,000 to $149,999 | 466 | 22.9% |
| $150,000 to $199,999 | 331 | 16.3% |
| $200,000+ | 403 | 19.8% |
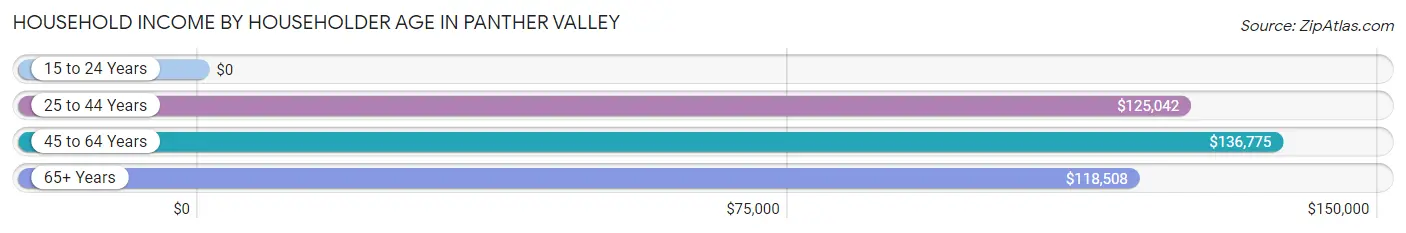
Household Income by Householder Age in Panther Valley
The median household income in Panther Valley is $124,035, with the highest median household income of $136,775 found in the 45 to 64 years age bracket for the primary householder. A total of 937 households (46.1%) fall into this category.
| Income Bracket | # Households | Median Income |
| 15 to 24 Years | 0 (0.0%) | $0 |
| 25 to 44 Years | 285 (14.0%) | $125,042 |
| 45 to 64 Years | 937 (46.1%) | $136,775 |
| 65+ Years | 811 (39.9%) | $118,508 |
| Total | 2,033 (100.0%) | $124,035 |
Poverty in Panther Valley
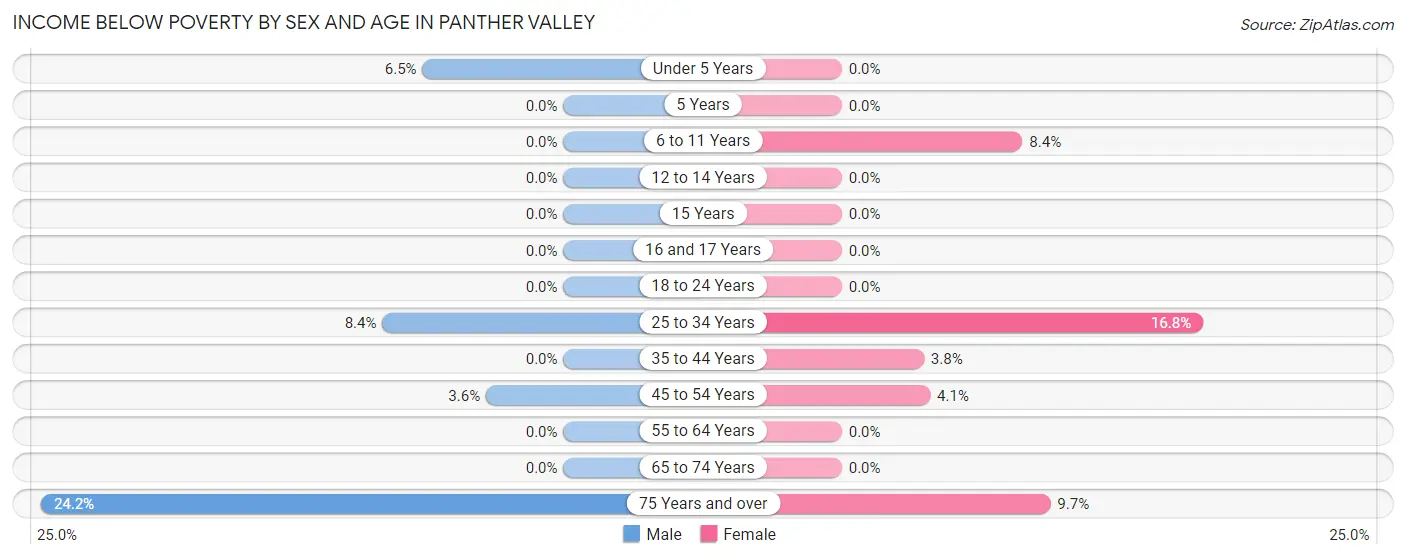
Income Below Poverty by Sex and Age in Panther Valley
With 4.4% poverty level for males and 3.5% for females among the residents of Panther Valley, 75 year old and over males and 25 to 34 year old females are the most vulnerable to poverty, with 48 males (24.2%) and 30 females (16.8%) in their respective age groups living below the poverty level.
| Age Bracket | Male | Female |
| Under 5 Years | 17 (6.5%) | 0 (0.0%) |
| 5 Years | 0 (0.0%) | 0 (0.0%) |
| 6 to 11 Years | 0 (0.0%) | 15 (8.4%) |
| 12 to 14 Years | 0 (0.0%) | 0 (0.0%) |
| 15 Years | 0 (0.0%) | 0 (0.0%) |
| 16 and 17 Years | 0 (0.0%) | 0 (0.0%) |
| 18 to 24 Years | 0 (0.0%) | 0 (0.0%) |
| 25 to 34 Years | 10 (8.4%) | 30 (16.8%) |
| 35 to 44 Years | 0 (0.0%) | 9 (3.8%) |
| 45 to 54 Years | 18 (3.6%) | 15 (4.1%) |
| 55 to 64 Years | 0 (0.0%) | 0 (0.0%) |
| 65 to 74 Years | 0 (0.0%) | 0 (0.0%) |
| 75 Years and over | 48 (24.2%) | 18 (9.7%) |
| Total | 93 (4.4%) | 87 (3.5%) |
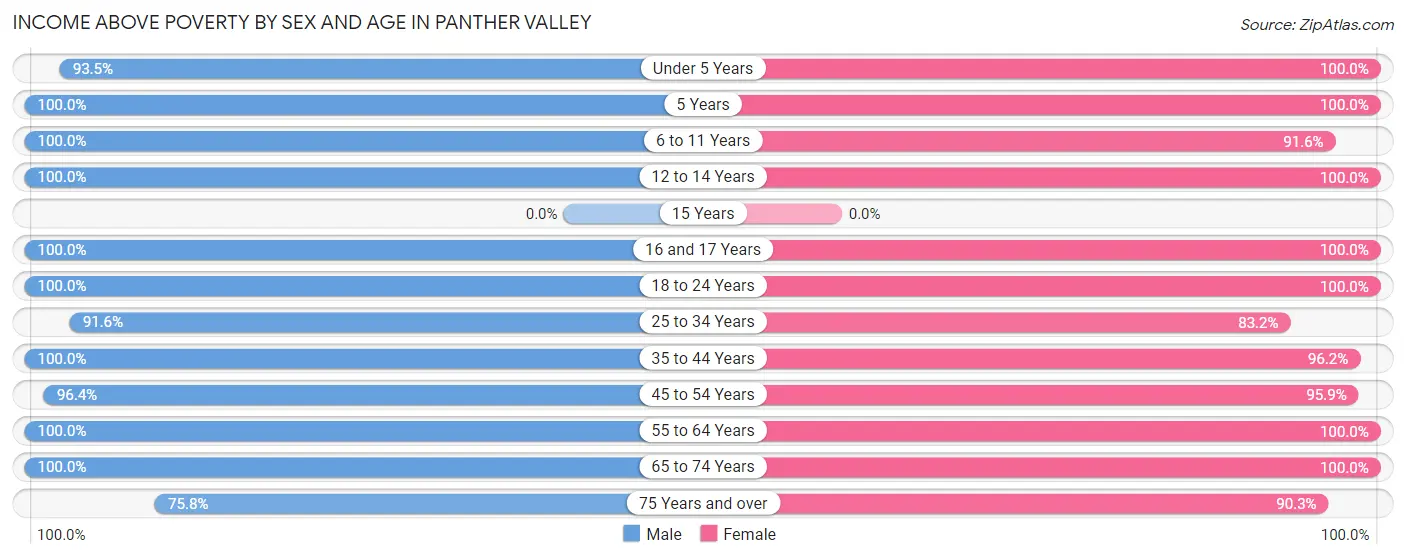
Income Above Poverty by Sex and Age in Panther Valley
According to the poverty statistics in Panther Valley, males aged 5 years and females aged under 5 years are the age groups that are most secure financially, with 100.0% of males and 100.0% of females in these age groups living above the poverty line.
| Age Bracket | Male | Female |
| Under 5 Years | 243 (93.5%) | 91 (100.0%) |
| 5 Years | 17 (100.0%) | 24 (100.0%) |
| 6 to 11 Years | 91 (100.0%) | 164 (91.6%) |
| 12 to 14 Years | 113 (100.0%) | 10 (100.0%) |
| 15 Years | 0 (0.0%) | 0 (0.0%) |
| 16 and 17 Years | 42 (100.0%) | 24 (100.0%) |
| 18 to 24 Years | 11 (100.0%) | 222 (100.0%) |
| 25 to 34 Years | 109 (91.6%) | 149 (83.2%) |
| 35 to 44 Years | 172 (100.0%) | 227 (96.2%) |
| 45 to 54 Years | 484 (96.4%) | 351 (95.9%) |
| 55 to 64 Years | 244 (100.0%) | 388 (100.0%) |
| 65 to 74 Years | 334 (100.0%) | 554 (100.0%) |
| 75 Years and over | 150 (75.8%) | 168 (90.3%) |
| Total | 2,010 (95.6%) | 2,372 (96.5%) |
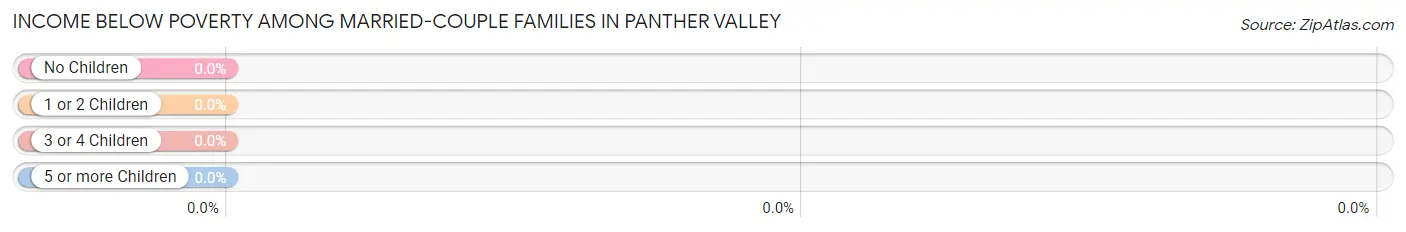
Income Below Poverty Among Married-Couple Families in Panther Valley
| Children | Above Poverty | Below Poverty |
| No Children | 637 (100.0%) | 0 (0.0%) |
| 1 or 2 Children | 291 (100.0%) | 0 (0.0%) |
| 3 or 4 Children | 75 (100.0%) | 0 (0.0%) |
| 5 or more Children | 0 (0.0%) | 0 (0.0%) |
| Total | 1,003 (100.0%) | 0 (0.0%) |
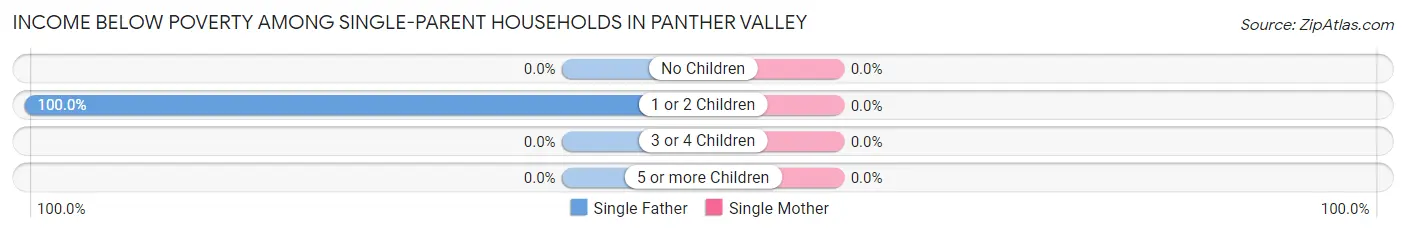
Income Below Poverty Among Single-Parent Households in Panther Valley
| Children | Single Father | Single Mother |
| No Children | 0 (0.0%) | 0 (0.0%) |
| 1 or 2 Children | 18 (100.0%) | 0 (0.0%) |
| 3 or 4 Children | 0 (0.0%) | 0 (0.0%) |
| 5 or more Children | 0 (0.0%) | 0 (0.0%) |
| Total | 18 (50.0%) | 0 (0.0%) |
Income Below Poverty Among Married-Couple vs Single-Parent Households in Panther Valley
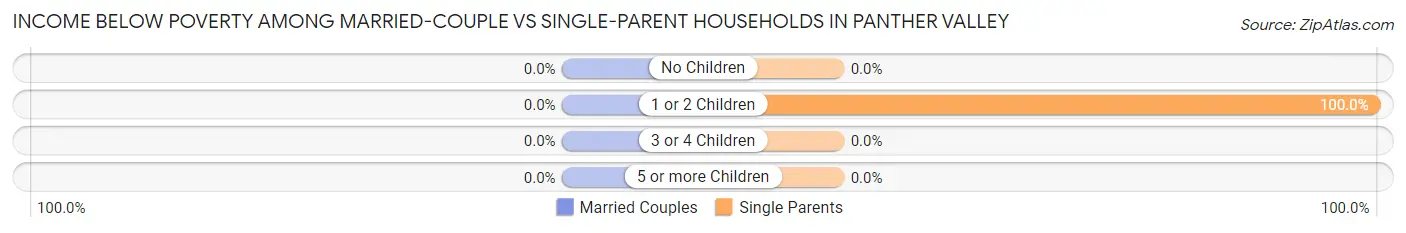
| Children | Married-Couple Families | Single-Parent Households |
| No Children | 0 (0.0%) | 0 (0.0%) |
| 1 or 2 Children | 0 (0.0%) | 18 (100.0%) |
| 3 or 4 Children | 0 (0.0%) | 0 (0.0%) |
| 5 or more Children | 0 (0.0%) | 0 (0.0%) |
| Total | 0 (0.0%) | 18 (8.5%) |
Employment Characteristics in Panther Valley
Employment by Class of Employer in Panther Valley
Among the 2,290 employed individuals in Panther Valley, private company employees (1,423 | 62.1%), local government employees (265 | 11.6%), and not-for-profit organizations (238 | 10.4%) make up the most common classes of employment.
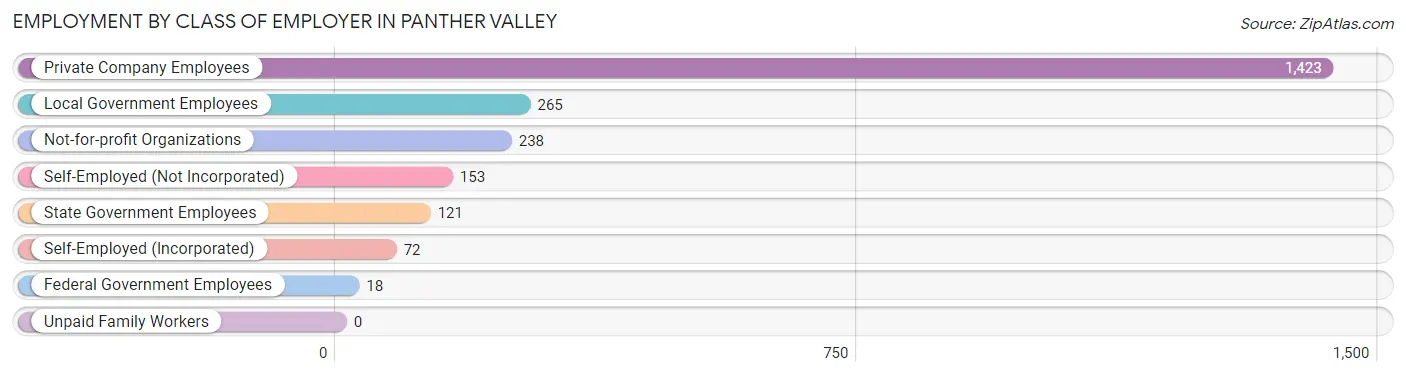
| Employer Class | # Employees | % Employees |
| Private Company Employees | 1,423 | 62.1% |
| Self-Employed (Incorporated) | 72 | 3.1% |
| Self-Employed (Not Incorporated) | 153 | 6.7% |
| Not-for-profit Organizations | 238 | 10.4% |
| Local Government Employees | 265 | 11.6% |
| State Government Employees | 121 | 5.3% |
| Federal Government Employees | 18 | 0.8% |
| Unpaid Family Workers | 0 | 0.0% |
| Total | 2,290 | 100.0% |
Employment Status by Age in Panther Valley
According to the labor force statistics for Panther Valley, out of the total population over 16 years of age (3,777), 66.7% or 2,519 individuals are in the labor force, with 8.3% or 209 of them unemployed. The age group with the highest labor force participation rate is 20 to 24 years, with 100.0% or 233 individuals in the labor force. Within the labor force, the 20 to 24 years age range has the highest percentage of unemployed individuals, with 40.8% or 95 of them being unemployed.
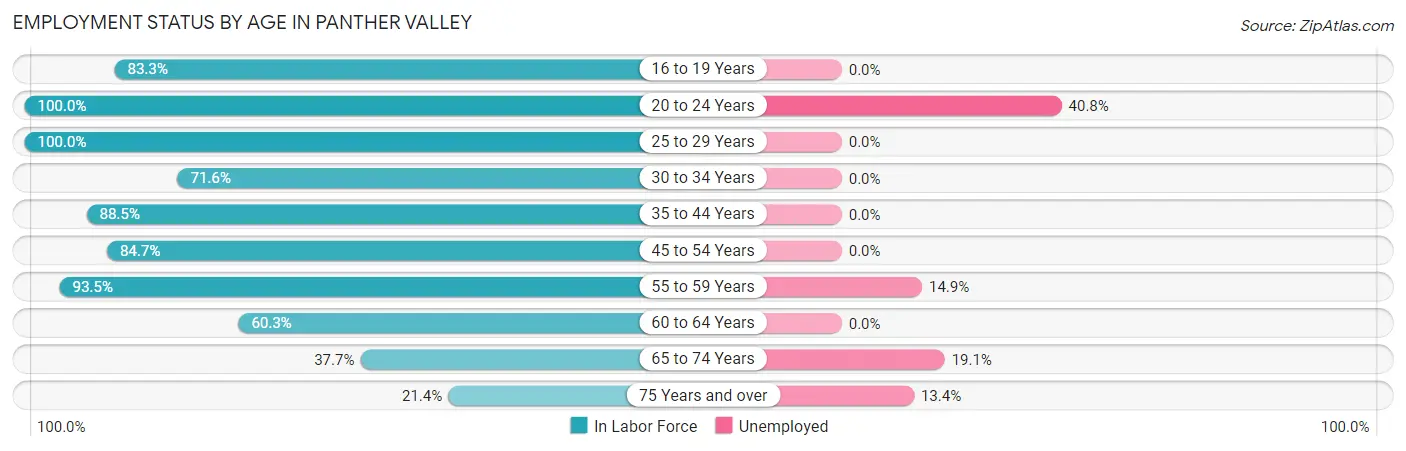
| Age Bracket | In Labor Force | Unemployed |
| 16 to 19 Years | 55 (83.3%) | 0 (0.0%) |
| 20 to 24 Years | 233 (100.0%) | 95 (40.8%) |
| 25 to 29 Years | 104 (100.0%) | 0 (0.0%) |
| 30 to 34 Years | 139 (71.6%) | 0 (0.0%) |
| 35 to 44 Years | 361 (88.5%) | 0 (0.0%) |
| 45 to 54 Years | 735 (84.7%) | 0 (0.0%) |
| 55 to 59 Years | 261 (93.5%) | 39 (14.9%) |
| 60 to 64 Years | 213 (60.3%) | 0 (0.0%) |
| 65 to 74 Years | 335 (37.7%) | 64 (19.1%) |
| 75 Years and over | 82 (21.4%) | 11 (13.4%) |
| Total | 2,519 (66.7%) | 209 (8.3%) |
Employment Status by Educational Attainment in Panther Valley
According to labor force statistics for Panther Valley, 82.2% of individuals (1,813) out of the total population between 25 and 64 years of age (2,206) are in the labor force, with 2.2% or 40 of them being unemployed. The group with the highest labor force participation rate are those with the educational attainment of bachelor's degree or higher, with 91.0% or 1,122 individuals in the labor force. Within the labor force, individuals with high school diploma education have the highest percentage of unemployment, with 7.9% or 23 of them being unemployed.
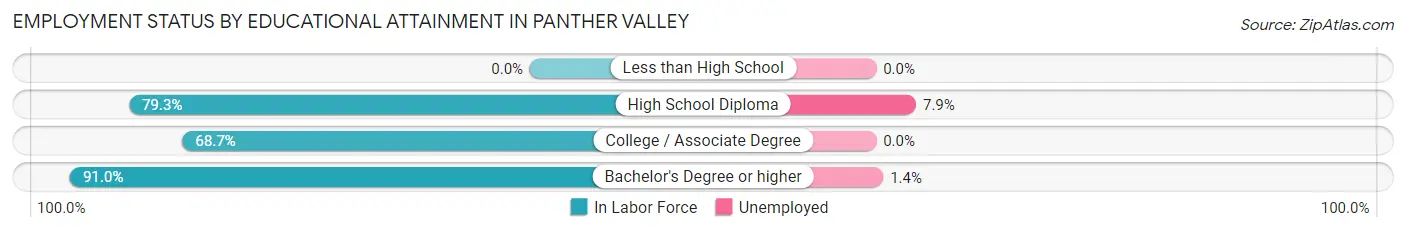
| Educational Attainment | In Labor Force | Unemployed |
| Less than High School | 0 (0.0%) | 0 (0.0%) |
| High School Diploma | 292 (79.3%) | 29 (7.9%) |
| College / Associate Degree | 399 (68.7%) | 0 (0.0%) |
| Bachelor's Degree or higher | 1,122 (91.0%) | 17 (1.4%) |
| Total | 1,813 (82.2%) | 49 (2.2%) |
Employment Occupations by Sex in Panther Valley
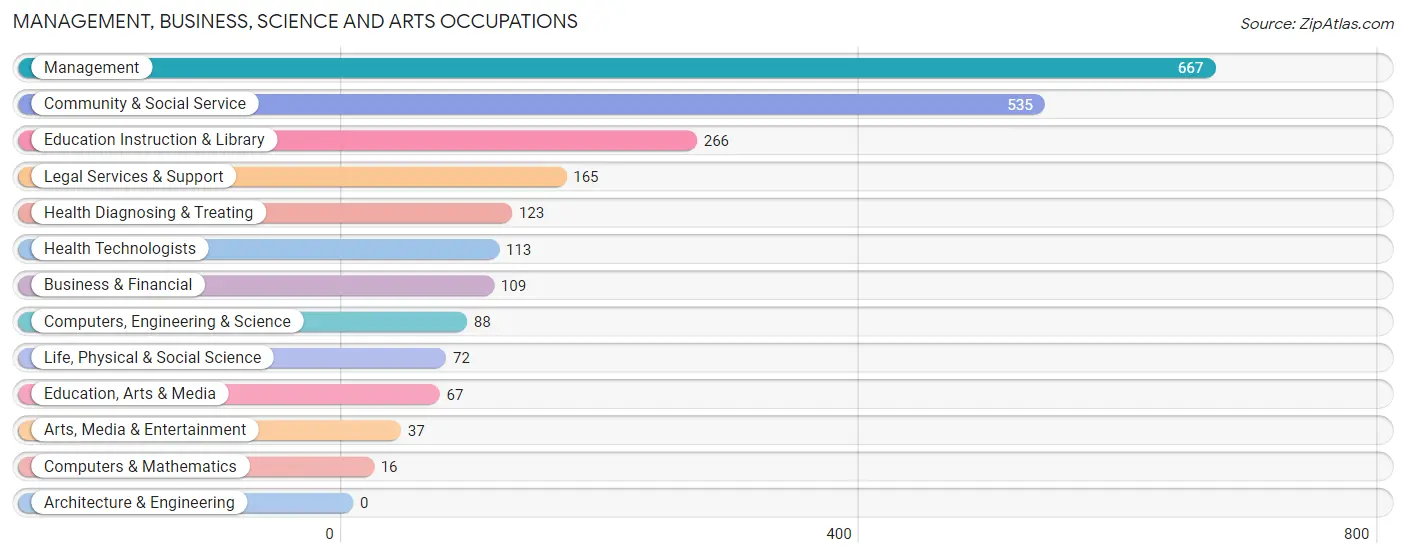
Management, Business, Science and Arts Occupations
The most common Management, Business, Science and Arts occupations in Panther Valley are Management (667 | 28.9%), Community & Social Service (535 | 23.2%), Education Instruction & Library (266 | 11.5%), Legal Services & Support (165 | 7.1%), and Health Diagnosing & Treating (123 | 5.3%).
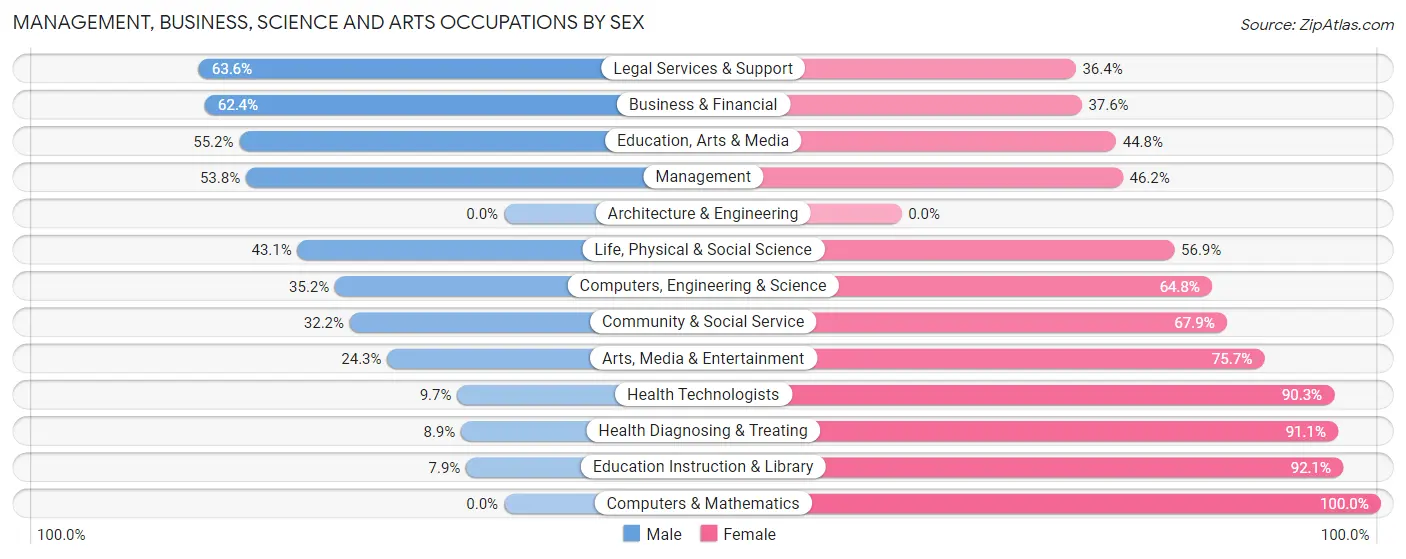
Management, Business, Science and Arts Occupations by Sex
Within the Management, Business, Science and Arts occupations in Panther Valley, the most male-oriented occupations are Legal Services & Support (63.6%), Business & Financial (62.4%), and Education, Arts & Media (55.2%), while the most female-oriented occupations are Computers & Mathematics (100.0%), Education Instruction & Library (92.1%), and Health Diagnosing & Treating (91.1%).
| Occupation | Male | Female |
| Management | 359 (53.8%) | 308 (46.2%) |
| Business & Financial | 68 (62.4%) | 41 (37.6%) |
| Computers, Engineering & Science | 31 (35.2%) | 57 (64.8%) |
| Computers & Mathematics | 0 (0.0%) | 16 (100.0%) |
| Architecture & Engineering | 0 (0.0%) | 0 (0.0%) |
| Life, Physical & Social Science | 31 (43.1%) | 41 (56.9%) |
| Community & Social Service | 172 (32.2%) | 363 (67.8%) |
| Education, Arts & Media | 37 (55.2%) | 30 (44.8%) |
| Legal Services & Support | 105 (63.6%) | 60 (36.4%) |
| Education Instruction & Library | 21 (7.9%) | 245 (92.1%) |
| Arts, Media & Entertainment | 9 (24.3%) | 28 (75.7%) |
| Health Diagnosing & Treating | 11 (8.9%) | 112 (91.1%) |
| Health Technologists | 11 (9.7%) | 102 (90.3%) |
| Total (Category) | 641 (42.1%) | 881 (57.9%) |
| Total (Overall) | 1,063 (46.0%) | 1,246 (54.0%) |
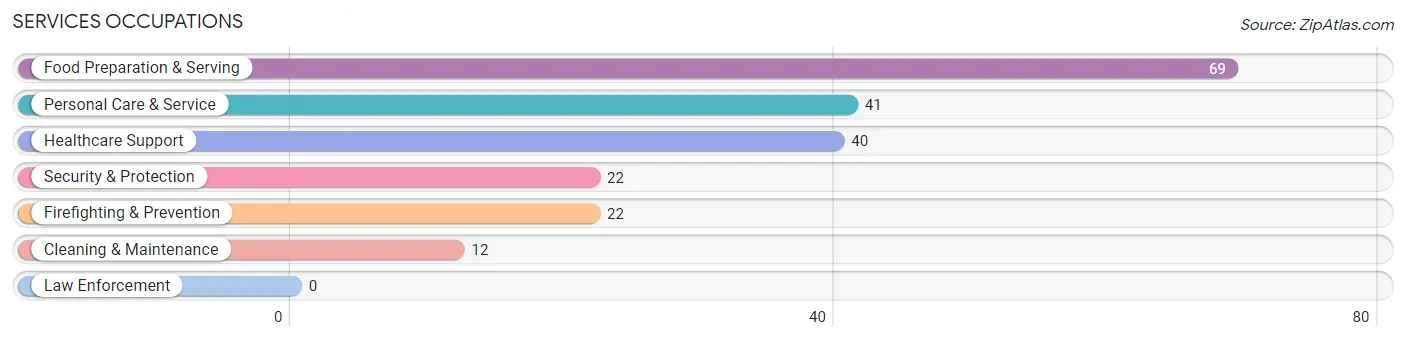
Services Occupations
The most common Services occupations in Panther Valley are Food Preparation & Serving (69 | 3.0%), Personal Care & Service (41 | 1.8%), Healthcare Support (40 | 1.7%), Security & Protection (22 | 0.9%), and Firefighting & Prevention (22 | 0.9%).
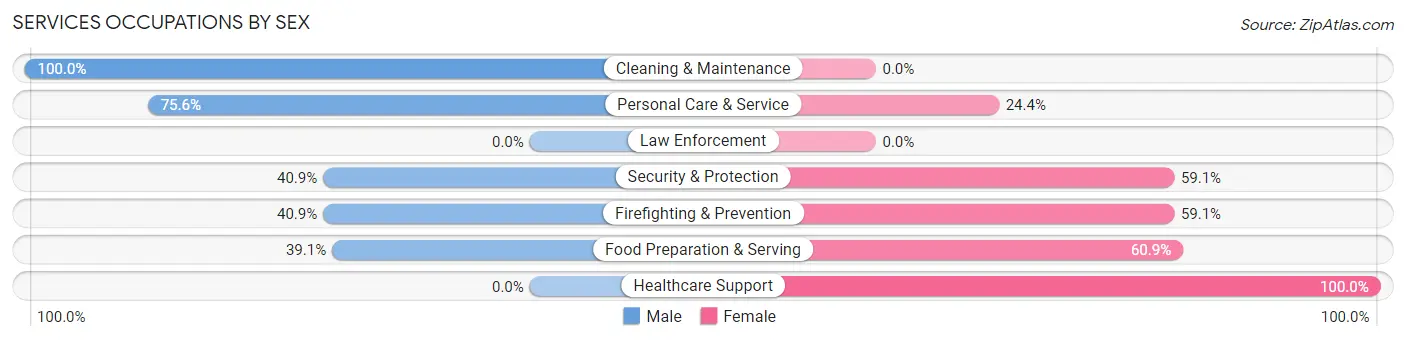
Services Occupations by Sex
Within the Services occupations in Panther Valley, the most male-oriented occupations are Cleaning & Maintenance (100.0%), Personal Care & Service (75.6%), and Security & Protection (40.9%), while the most female-oriented occupations are Healthcare Support (100.0%), Food Preparation & Serving (60.9%), and Security & Protection (59.1%).
| Occupation | Male | Female |
| Healthcare Support | 0 (0.0%) | 40 (100.0%) |
| Security & Protection | 9 (40.9%) | 13 (59.1%) |
| Firefighting & Prevention | 9 (40.9%) | 13 (59.1%) |
| Law Enforcement | 0 (0.0%) | 0 (0.0%) |
| Food Preparation & Serving | 27 (39.1%) | 42 (60.9%) |
| Cleaning & Maintenance | 12 (100.0%) | 0 (0.0%) |
| Personal Care & Service | 31 (75.6%) | 10 (24.4%) |
| Total (Category) | 79 (42.9%) | 105 (57.1%) |
| Total (Overall) | 1,063 (46.0%) | 1,246 (54.0%) |
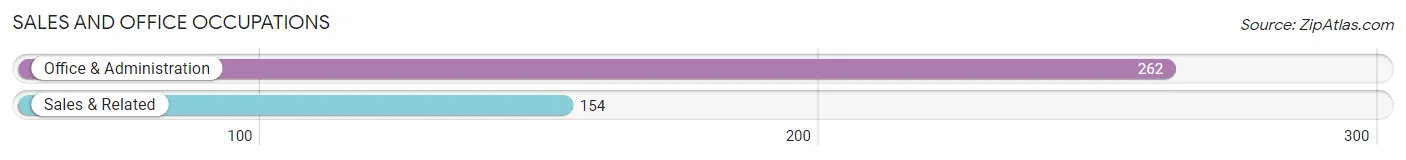
Sales and Office Occupations
The most common Sales and Office occupations in Panther Valley are Office & Administration (262 | 11.4%), and Sales & Related (154 | 6.7%).
Sales and Office Occupations by Sex
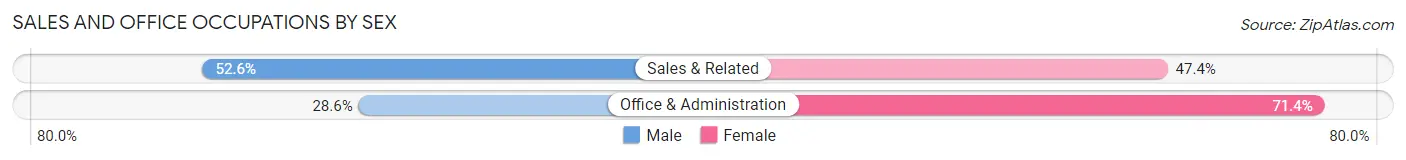
| Occupation | Male | Female |
| Sales & Related | 81 (52.6%) | 73 (47.4%) |
| Office & Administration | 75 (28.6%) | 187 (71.4%) |
| Total (Category) | 156 (37.5%) | 260 (62.5%) |
| Total (Overall) | 1,063 (46.0%) | 1,246 (54.0%) |
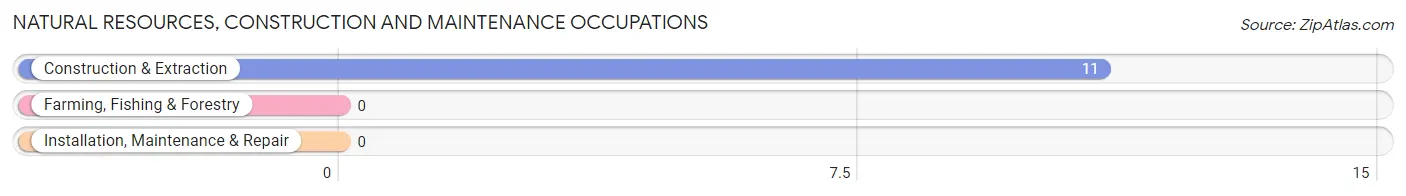
Natural Resources, Construction and Maintenance Occupations
The most common Natural Resources, Construction and Maintenance occupations in Panther Valley are , and Construction & Extraction (11 | 0.5%).
Natural Resources, Construction and Maintenance Occupations by Sex
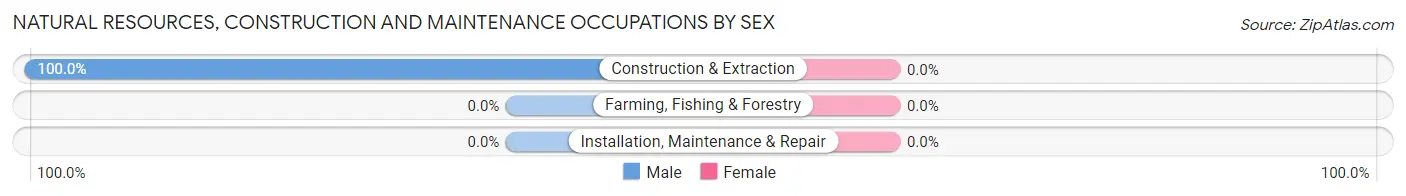
| Occupation | Male | Female |
| Farming, Fishing & Forestry | 0 (0.0%) | 0 (0.0%) |
| Construction & Extraction | 11 (100.0%) | 0 (0.0%) |
| Installation, Maintenance & Repair | 0 (0.0%) | 0 (0.0%) |
| Total (Category) | 11 (100.0%) | 0 (0.0%) |
| Total (Overall) | 1,063 (46.0%) | 1,246 (54.0%) |
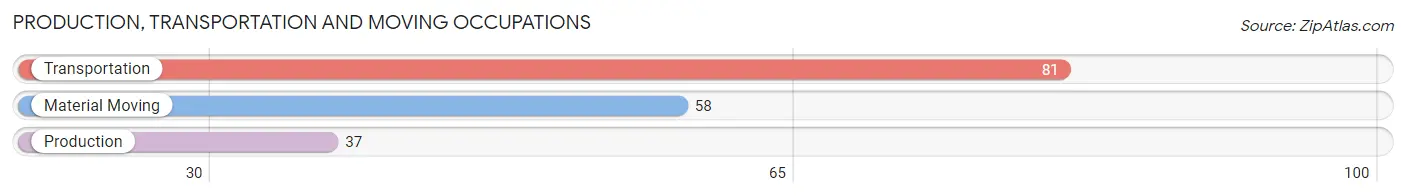
Production, Transportation and Moving Occupations
The most common Production, Transportation and Moving occupations in Panther Valley are Transportation (81 | 3.5%), Material Moving (58 | 2.5%), and Production (37 | 1.6%).
Production, Transportation and Moving Occupations by Sex
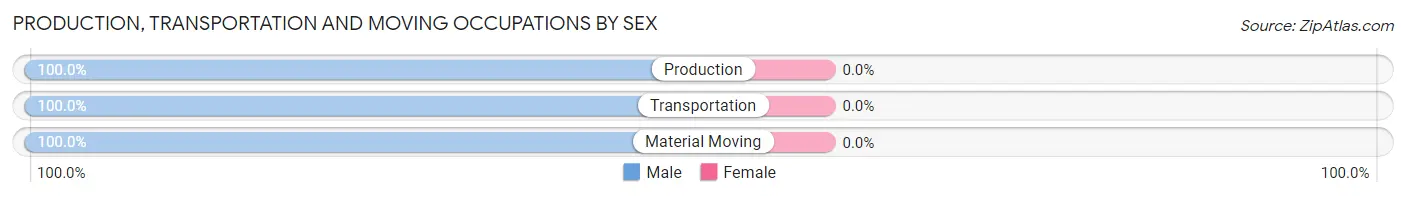
| Occupation | Male | Female |
| Production | 37 (100.0%) | 0 (0.0%) |
| Transportation | 81 (100.0%) | 0 (0.0%) |
| Material Moving | 58 (100.0%) | 0 (0.0%) |
| Total (Category) | 176 (100.0%) | 0 (0.0%) |
| Total (Overall) | 1,063 (46.0%) | 1,246 (54.0%) |
Employment Industries by Sex in Panther Valley
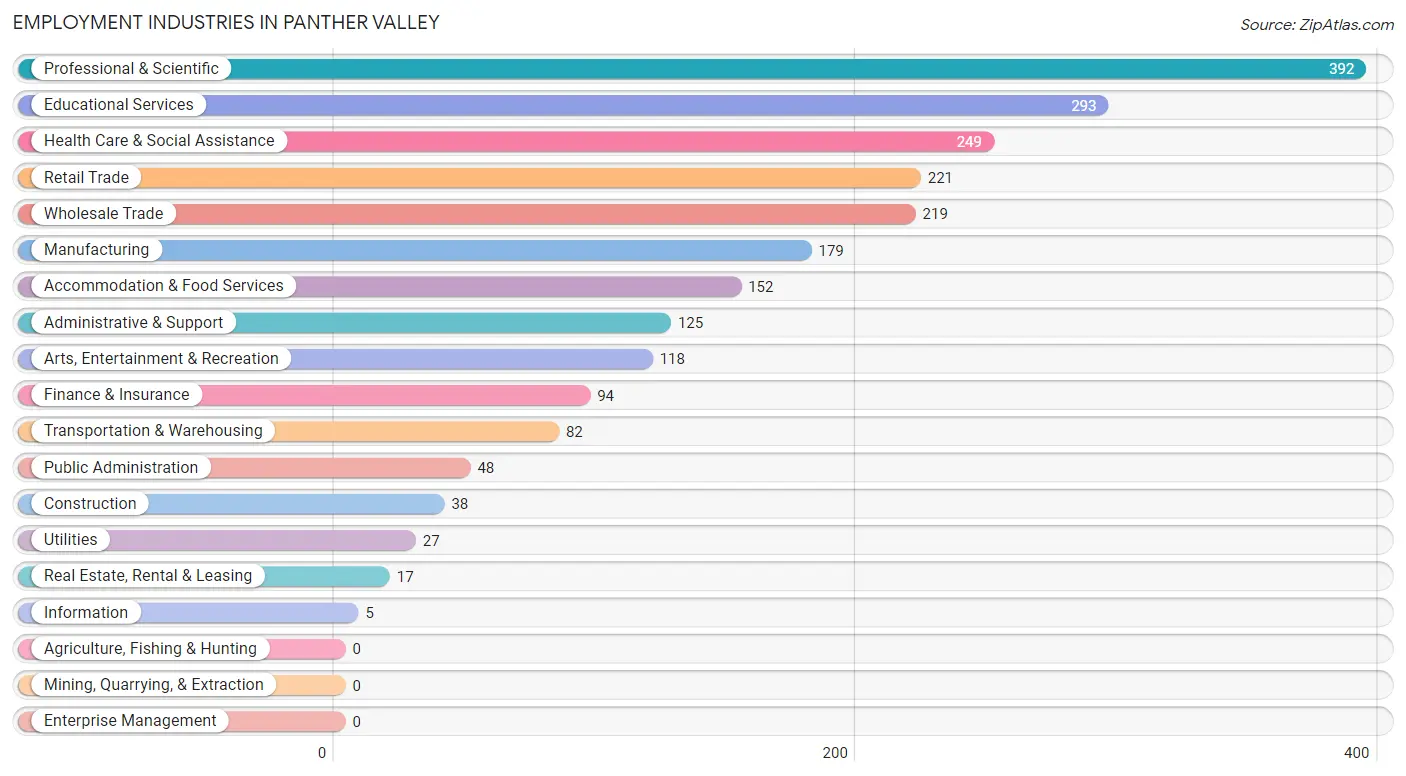
Employment Industries in Panther Valley
The major employment industries in Panther Valley include Professional & Scientific (392 | 17.0%), Educational Services (293 | 12.7%), Health Care & Social Assistance (249 | 10.8%), Retail Trade (221 | 9.6%), and Wholesale Trade (219 | 9.5%).
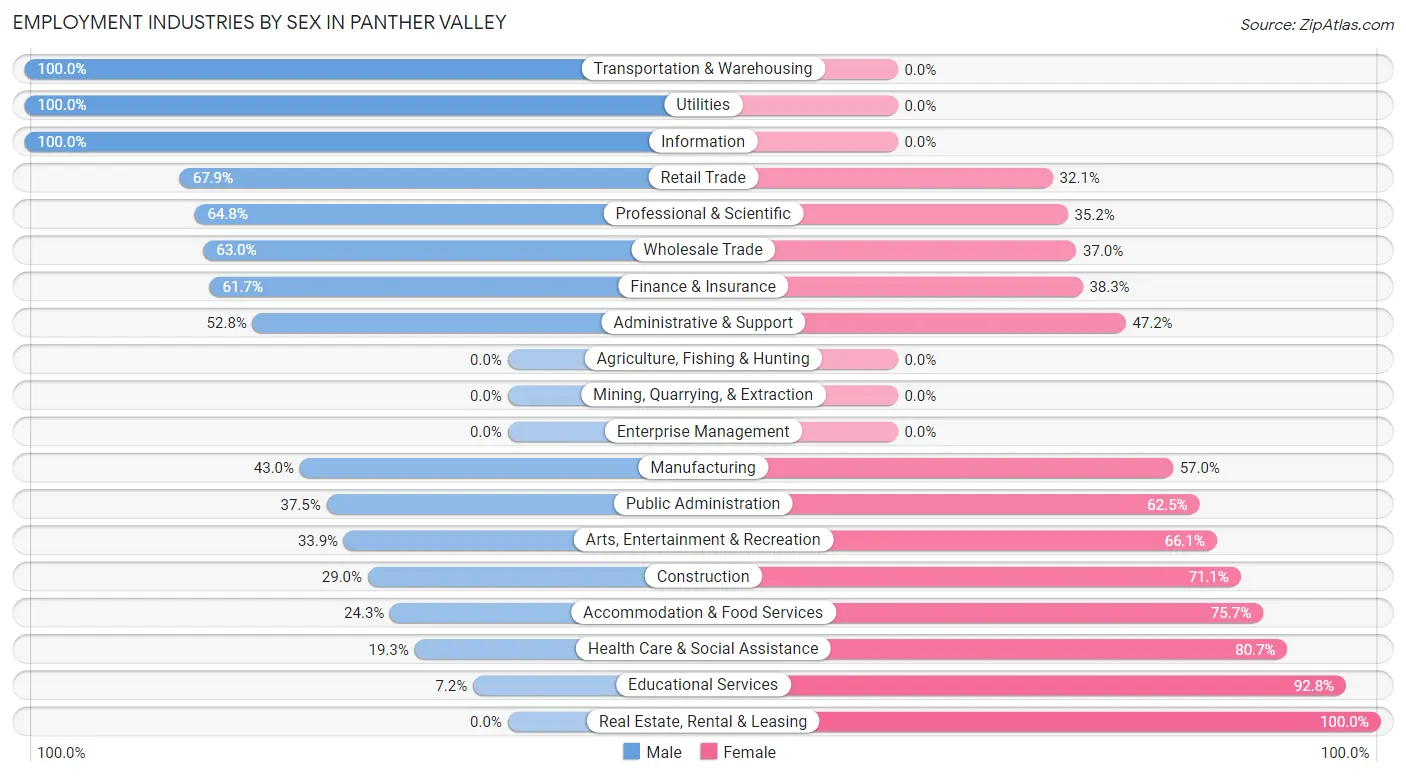
Employment Industries by Sex in Panther Valley
The Panther Valley industries that see more men than women are Transportation & Warehousing (100.0%), Utilities (100.0%), and Information (100.0%), whereas the industries that tend to have a higher number of women are Real Estate, Rental & Leasing (100.0%), Educational Services (92.8%), and Health Care & Social Assistance (80.7%).
| Industry | Male | Female |
| Agriculture, Fishing & Hunting | 0 (0.0%) | 0 (0.0%) |
| Mining, Quarrying, & Extraction | 0 (0.0%) | 0 (0.0%) |
| Construction | 11 (28.9%) | 27 (71.1%) |
| Manufacturing | 77 (43.0%) | 102 (57.0%) |
| Wholesale Trade | 138 (63.0%) | 81 (37.0%) |
| Retail Trade | 150 (67.9%) | 71 (32.1%) |
| Transportation & Warehousing | 82 (100.0%) | 0 (0.0%) |
| Utilities | 27 (100.0%) | 0 (0.0%) |
| Information | 5 (100.0%) | 0 (0.0%) |
| Finance & Insurance | 58 (61.7%) | 36 (38.3%) |
| Real Estate, Rental & Leasing | 0 (0.0%) | 17 (100.0%) |
| Professional & Scientific | 254 (64.8%) | 138 (35.2%) |
| Enterprise Management | 0 (0.0%) | 0 (0.0%) |
| Administrative & Support | 66 (52.8%) | 59 (47.2%) |
| Educational Services | 21 (7.2%) | 272 (92.8%) |
| Health Care & Social Assistance | 48 (19.3%) | 201 (80.7%) |
| Arts, Entertainment & Recreation | 40 (33.9%) | 78 (66.1%) |
| Accommodation & Food Services | 37 (24.3%) | 115 (75.7%) |
| Public Administration | 18 (37.5%) | 30 (62.5%) |
| Total | 1,063 (46.0%) | 1,246 (54.0%) |
Education in Panther Valley
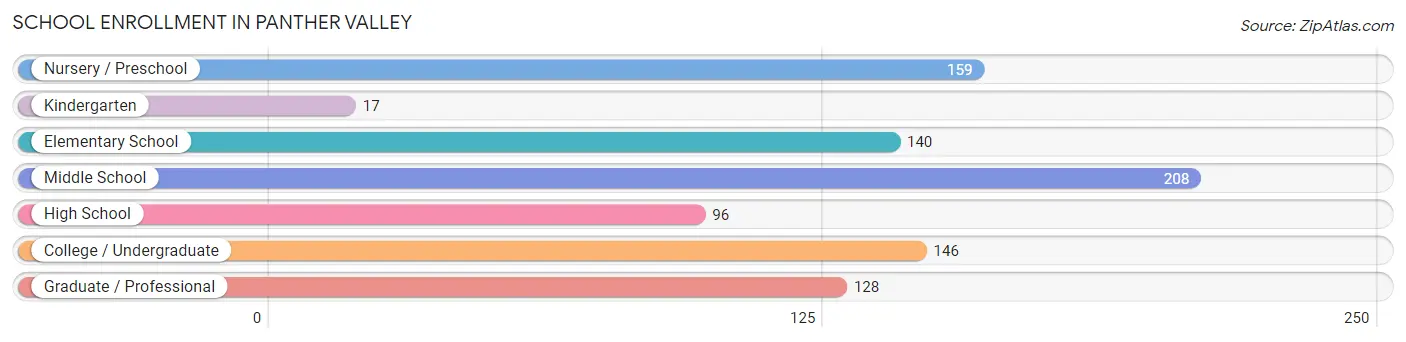
School Enrollment in Panther Valley
The most common levels of schooling among the 894 students in Panther Valley are middle school (208 | 23.3%), nursery / preschool (159 | 17.8%), and college / undergraduate (146 | 16.3%).
| School Level | # Students | % Students |
| Nursery / Preschool | 159 | 17.8% |
| Kindergarten | 17 | 1.9% |
| Elementary School | 140 | 15.7% |
| Middle School | 208 | 23.3% |
| High School | 96 | 10.7% |
| College / Undergraduate | 146 | 16.3% |
| Graduate / Professional | 128 | 14.3% |
| Total | 894 | 100.0% |
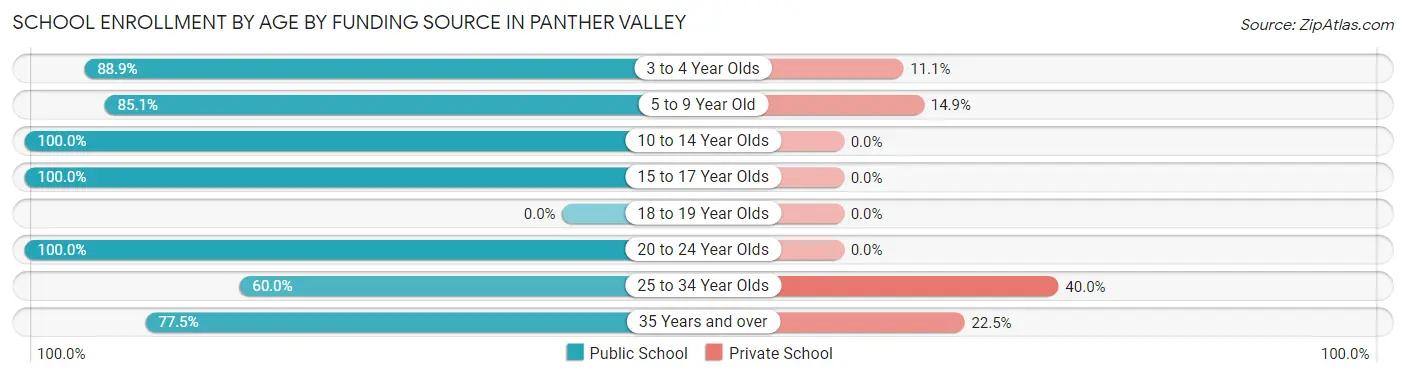
School Enrollment by Age by Funding Source in Panther Valley
Out of a total of 894 students who are enrolled in schools in Panther Valley, 88 (9.8%) attend a private institution, while the remaining 806 (90.2%) are enrolled in public schools. The age group of 25 to 34 year olds has the highest likelihood of being enrolled in private schools, with 10 (40.0% in the age bracket) enrolled. Conversely, the age group of 10 to 14 year olds has the lowest likelihood of being enrolled in a private school, with 238 (100.0% in the age bracket) attending a public institution.
| Age Bracket | Public School | Private School |
| 3 to 4 Year Olds | 120 (88.9%) | 15 (11.1%) |
| 5 to 9 Year Old | 154 (85.1%) | 27 (14.9%) |
| 10 to 14 Year Olds | 238 (100.0%) | 0 (0.0%) |
| 15 to 17 Year Olds | 66 (100.0%) | 0 (0.0%) |
| 18 to 19 Year Olds | 0 (0.0%) | 0 (0.0%) |
| 20 to 24 Year Olds | 89 (100.0%) | 0 (0.0%) |
| 25 to 34 Year Olds | 15 (60.0%) | 10 (40.0%) |
| 35 Years and over | 124 (77.5%) | 36 (22.5%) |
| Total | 806 (90.2%) | 88 (9.8%) |
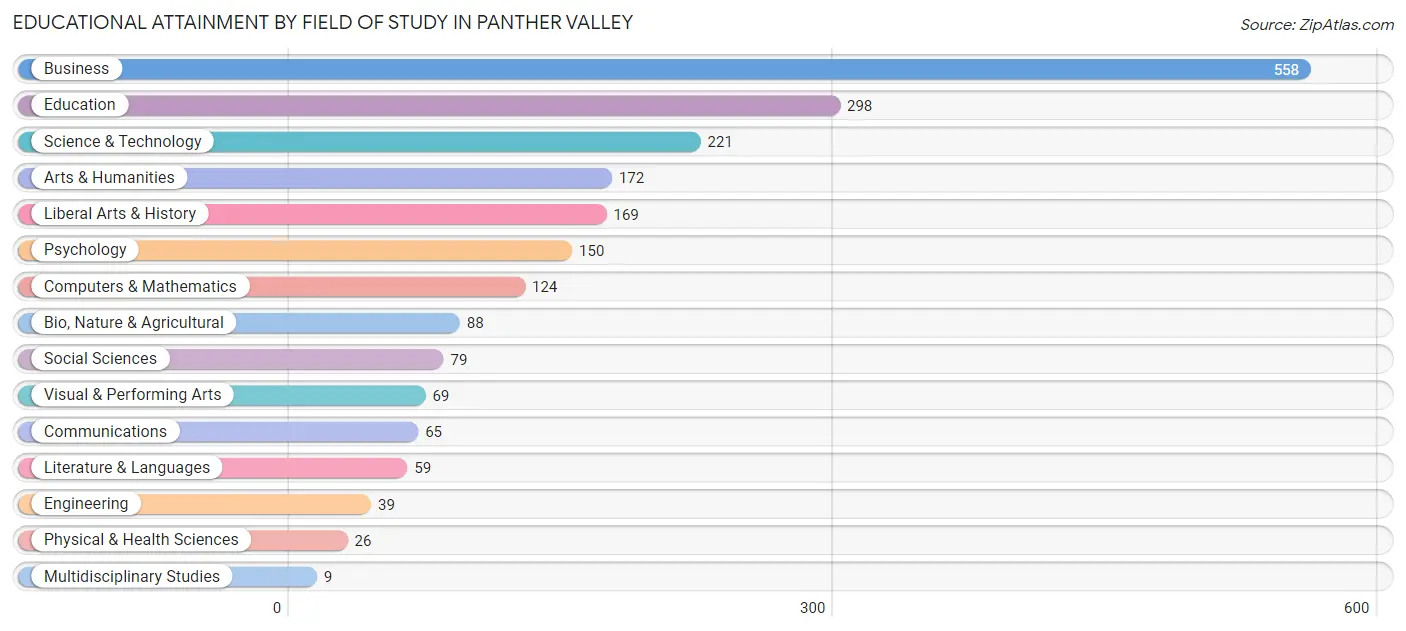
Educational Attainment by Field of Study in Panther Valley
Business (558 | 26.3%), education (298 | 14.0%), science & technology (221 | 10.4%), arts & humanities (172 | 8.1%), and liberal arts & history (169 | 8.0%) are the most common fields of study among 2,126 individuals in Panther Valley who have obtained a bachelor's degree or higher.
| Field of Study | # Graduates | % Graduates |
| Computers & Mathematics | 124 | 5.8% |
| Bio, Nature & Agricultural | 88 | 4.1% |
| Physical & Health Sciences | 26 | 1.2% |
| Psychology | 150 | 7.1% |
| Social Sciences | 79 | 3.7% |
| Engineering | 39 | 1.8% |
| Multidisciplinary Studies | 9 | 0.4% |
| Science & Technology | 221 | 10.4% |
| Business | 558 | 26.3% |
| Education | 298 | 14.0% |
| Literature & Languages | 59 | 2.8% |
| Liberal Arts & History | 169 | 8.0% |
| Visual & Performing Arts | 69 | 3.3% |
| Communications | 65 | 3.1% |
| Arts & Humanities | 172 | 8.1% |
| Total | 2,126 | 100.0% |
Transportation & Commute in Panther Valley
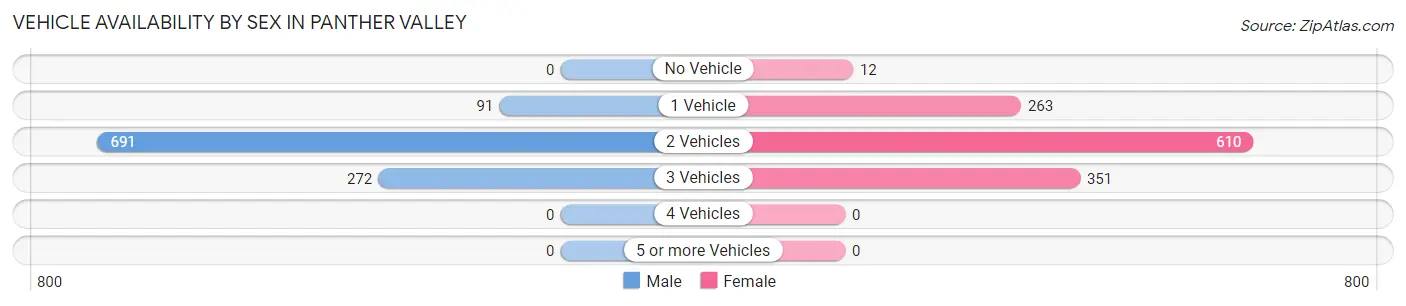
Vehicle Availability by Sex in Panther Valley
The most prevalent vehicle ownership categories in Panther Valley are males with 2 vehicles (691, accounting for 65.6%) and females with 2 vehicles (610, making up 55.9%).
| Vehicles Available | Male | Female |
| No Vehicle | 0 (0.0%) | 12 (1.0%) |
| 1 Vehicle | 91 (8.6%) | 263 (21.3%) |
| 2 Vehicles | 691 (65.6%) | 610 (49.3%) |
| 3 Vehicles | 272 (25.8%) | 351 (28.4%) |
| 4 Vehicles | 0 (0.0%) | 0 (0.0%) |
| 5 or more Vehicles | 0 (0.0%) | 0 (0.0%) |
| Total | 1,054 (100.0%) | 1,236 (100.0%) |
Commute Time in Panther Valley
The most frequently occuring commute durations in Panther Valley are 60 to 89 minutes (348 commuters, 18.4%), 45 to 59 minutes (323 commuters, 17.1%), and 15 to 19 minutes (293 commuters, 15.5%).
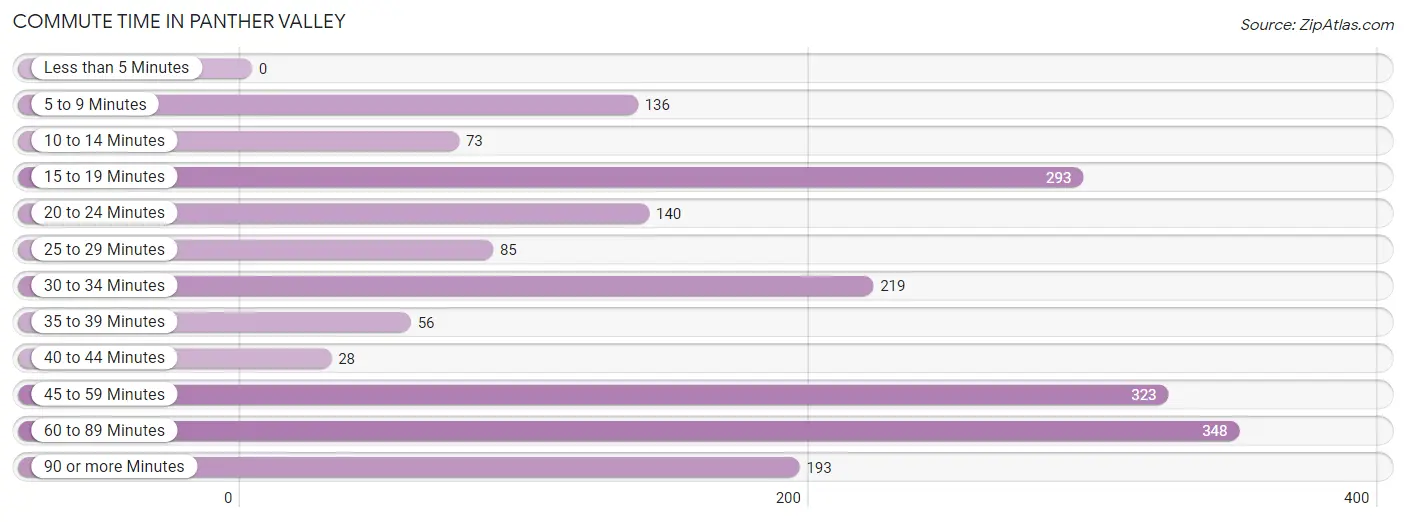
| Commute Time | # Commuters | % Commuters |
| Less than 5 Minutes | 0 | 0.0% |
| 5 to 9 Minutes | 136 | 7.2% |
| 10 to 14 Minutes | 73 | 3.8% |
| 15 to 19 Minutes | 293 | 15.5% |
| 20 to 24 Minutes | 140 | 7.4% |
| 25 to 29 Minutes | 85 | 4.5% |
| 30 to 34 Minutes | 219 | 11.6% |
| 35 to 39 Minutes | 56 | 3.0% |
| 40 to 44 Minutes | 28 | 1.5% |
| 45 to 59 Minutes | 323 | 17.1% |
| 60 to 89 Minutes | 348 | 18.4% |
| 90 or more Minutes | 193 | 10.2% |
Commute Time by Sex in Panther Valley
The most common commute times in Panther Valley are 60 to 89 minutes (276 commuters, 30.4%) for males and 15 to 19 minutes (273 commuters, 27.7%) for females.
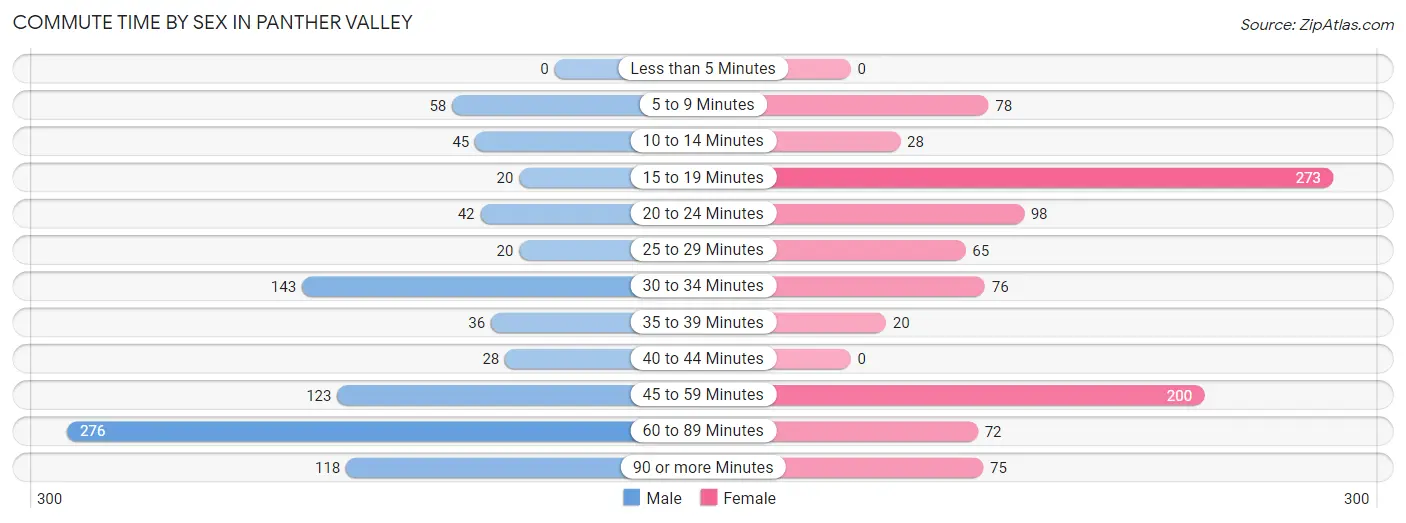
| Commute Time | Male | Female |
| Less than 5 Minutes | 0 (0.0%) | 0 (0.0%) |
| 5 to 9 Minutes | 58 (6.4%) | 78 (7.9%) |
| 10 to 14 Minutes | 45 (5.0%) | 28 (2.8%) |
| 15 to 19 Minutes | 20 (2.2%) | 273 (27.7%) |
| 20 to 24 Minutes | 42 (4.6%) | 98 (10.0%) |
| 25 to 29 Minutes | 20 (2.2%) | 65 (6.6%) |
| 30 to 34 Minutes | 143 (15.7%) | 76 (7.7%) |
| 35 to 39 Minutes | 36 (4.0%) | 20 (2.0%) |
| 40 to 44 Minutes | 28 (3.1%) | 0 (0.0%) |
| 45 to 59 Minutes | 123 (13.5%) | 200 (20.3%) |
| 60 to 89 Minutes | 276 (30.4%) | 72 (7.3%) |
| 90 or more Minutes | 118 (13.0%) | 75 (7.6%) |
Time of Departure to Work by Sex in Panther Valley
The most frequent times of departure to work in Panther Valley are 12:00 AM to 4:59 AM (278, 30.6%) for males and 8:30 AM to 8:59 AM (179, 18.2%) for females.
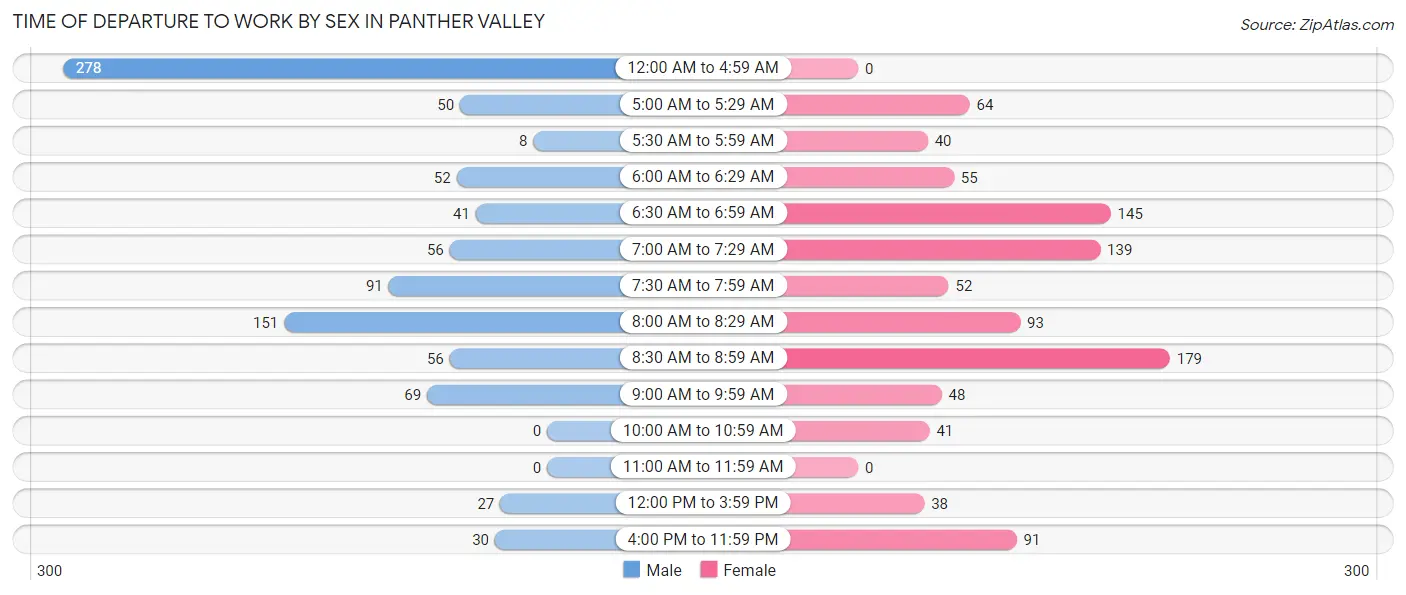
| Time of Departure | Male | Female |
| 12:00 AM to 4:59 AM | 278 (30.6%) | 0 (0.0%) |
| 5:00 AM to 5:29 AM | 50 (5.5%) | 64 (6.5%) |
| 5:30 AM to 5:59 AM | 8 (0.9%) | 40 (4.1%) |
| 6:00 AM to 6:29 AM | 52 (5.7%) | 55 (5.6%) |
| 6:30 AM to 6:59 AM | 41 (4.5%) | 145 (14.7%) |
| 7:00 AM to 7:29 AM | 56 (6.2%) | 139 (14.1%) |
| 7:30 AM to 7:59 AM | 91 (10.0%) | 52 (5.3%) |
| 8:00 AM to 8:29 AM | 151 (16.6%) | 93 (9.4%) |
| 8:30 AM to 8:59 AM | 56 (6.2%) | 179 (18.2%) |
| 9:00 AM to 9:59 AM | 69 (7.6%) | 48 (4.9%) |
| 10:00 AM to 10:59 AM | 0 (0.0%) | 41 (4.2%) |
| 11:00 AM to 11:59 AM | 0 (0.0%) | 0 (0.0%) |
| 12:00 PM to 3:59 PM | 27 (3.0%) | 38 (3.9%) |
| 4:00 PM to 11:59 PM | 30 (3.3%) | 91 (9.2%) |
| Total | 909 (100.0%) | 985 (100.0%) |
Housing Occupancy in Panther Valley
Occupancy by Ownership in Panther Valley
Of the total 2,033 dwellings in Panther Valley, owner-occupied units account for 1,755 (86.3%), while renter-occupied units make up 278 (13.7%).
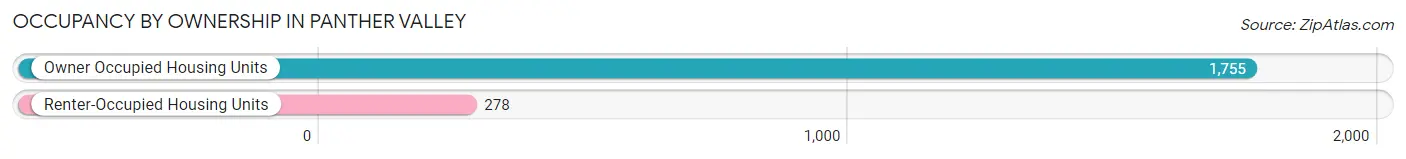
| Occupancy | # Housing Units | % Housing Units |
| Owner Occupied Housing Units | 1,755 | 86.3% |
| Renter-Occupied Housing Units | 278 | 13.7% |
| Total Occupied Housing Units | 2,033 | 100.0% |
Occupancy by Household Size in Panther Valley
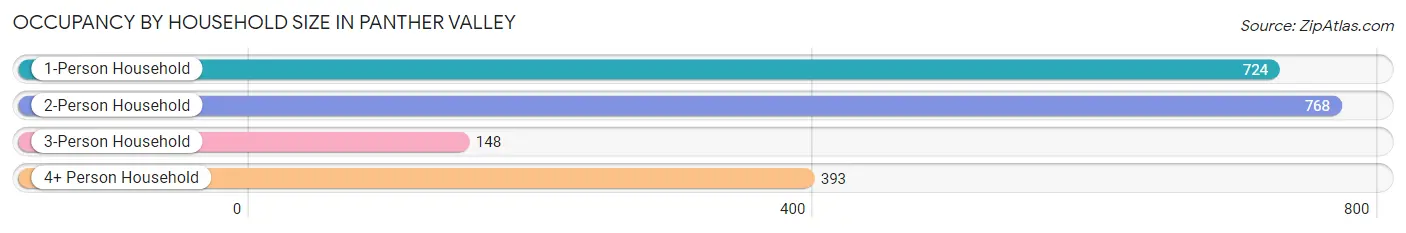
| Household Size | # Housing Units | % Housing Units |
| 1-Person Household | 724 | 35.6% |
| 2-Person Household | 768 | 37.8% |
| 3-Person Household | 148 | 7.3% |
| 4+ Person Household | 393 | 19.3% |
| Total Housing Units | 2,033 | 100.0% |
Occupancy by Ownership by Household Size in Panther Valley
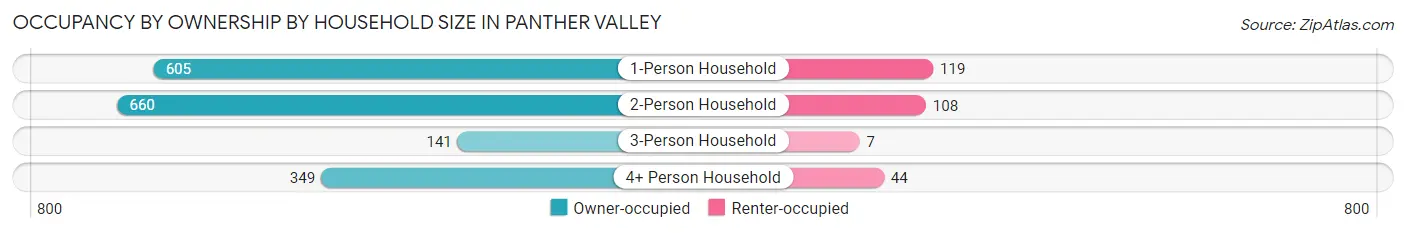
| Household Size | Owner-occupied | Renter-occupied |
| 1-Person Household | 605 (83.6%) | 119 (16.4%) |
| 2-Person Household | 660 (85.9%) | 108 (14.1%) |
| 3-Person Household | 141 (95.3%) | 7 (4.7%) |
| 4+ Person Household | 349 (88.8%) | 44 (11.2%) |
| Total Housing Units | 1,755 (86.3%) | 278 (13.7%) |
Occupancy by Educational Attainment in Panther Valley
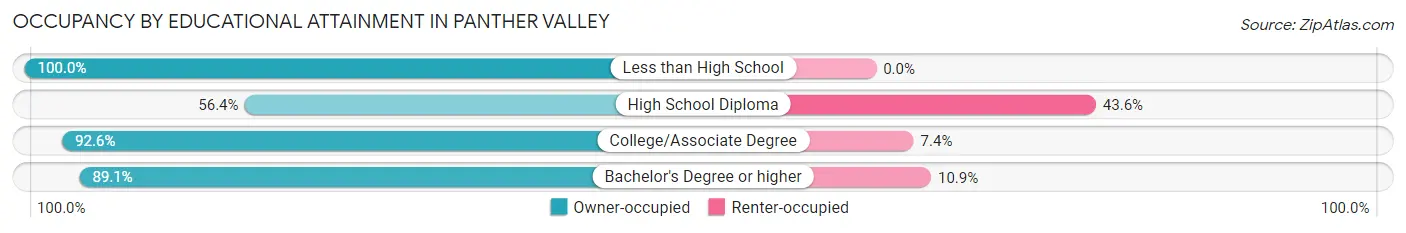
| Household Size | Owner-occupied | Renter-occupied |
| Less than High School | 9 (100.0%) | 0 (0.0%) |
| High School Diploma | 136 (56.4%) | 105 (43.6%) |
| College/Associate Degree | 561 (92.6%) | 45 (7.4%) |
| Bachelor's Degree or higher | 1,049 (89.1%) | 128 (10.9%) |
Occupancy by Age of Householder in Panther Valley
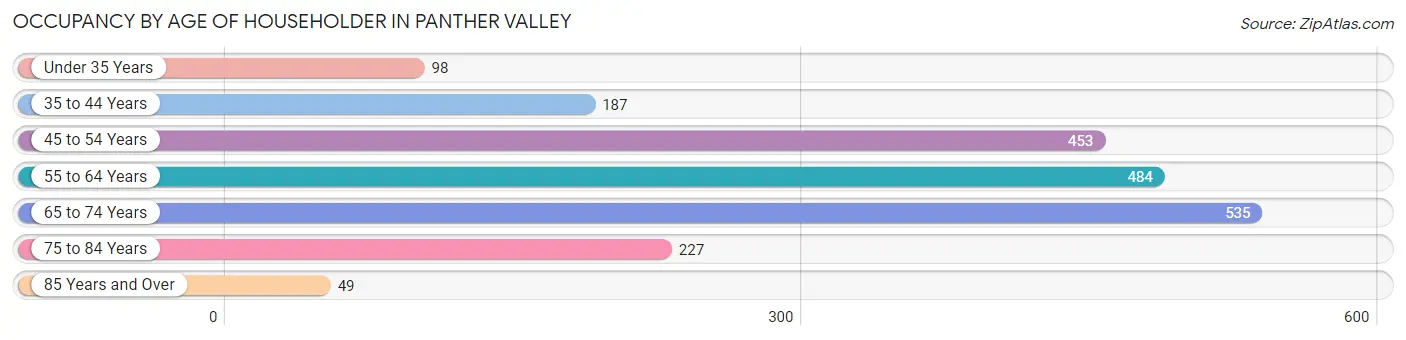
| Age Bracket | # Households | % Households |
| Under 35 Years | 98 | 4.8% |
| 35 to 44 Years | 187 | 9.2% |
| 45 to 54 Years | 453 | 22.3% |
| 55 to 64 Years | 484 | 23.8% |
| 65 to 74 Years | 535 | 26.3% |
| 75 to 84 Years | 227 | 11.2% |
| 85 Years and Over | 49 | 2.4% |
| Total | 2,033 | 100.0% |
Housing Finances in Panther Valley
Median Income by Occupancy in Panther Valley
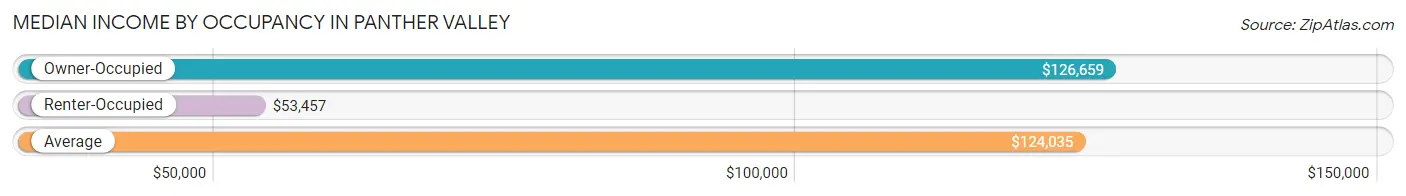
| Occupancy Type | # Households | Median Income |
| Owner-Occupied | 1,755 (86.3%) | $126,659 |
| Renter-Occupied | 278 (13.7%) | $53,457 |
| Average | 2,033 (100.0%) | $124,035 |
Occupancy by Householder Income Bracket in Panther Valley
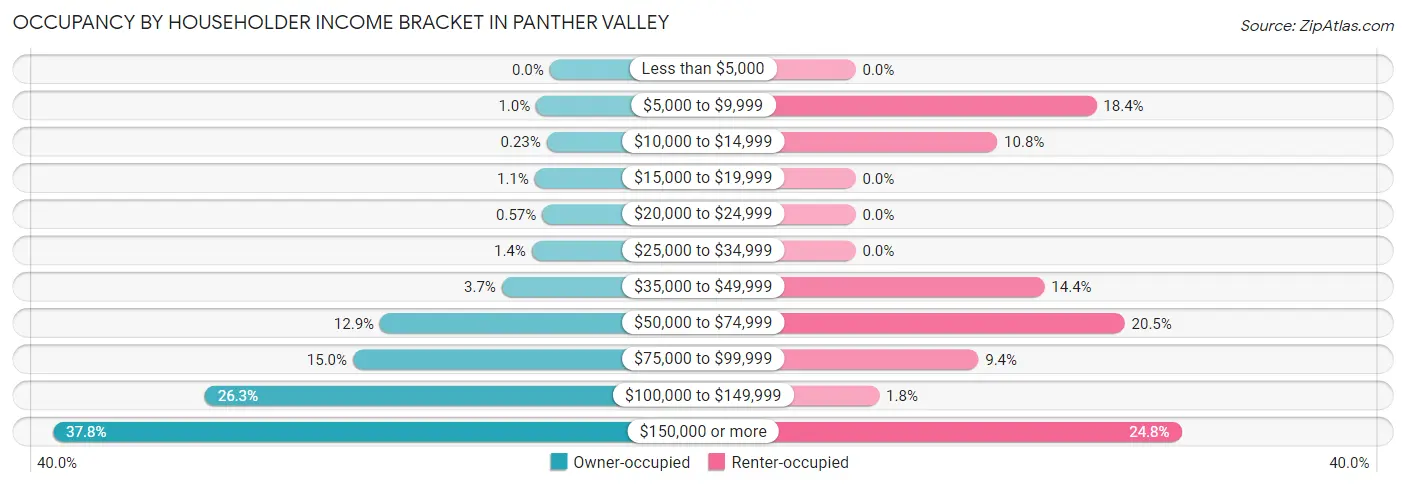
| Income Bracket | Owner-occupied | Renter-occupied |
| Less than $5,000 | 0 (0.0%) | 0 (0.0%) |
| $5,000 to $9,999 | 18 (1.0%) | 51 (18.3%) |
| $10,000 to $14,999 | 4 (0.2%) | 30 (10.8%) |
| $15,000 to $19,999 | 20 (1.1%) | 0 (0.0%) |
| $20,000 to $24,999 | 10 (0.6%) | 0 (0.0%) |
| $25,000 to $34,999 | 24 (1.4%) | 0 (0.0%) |
| $35,000 to $49,999 | 64 (3.6%) | 40 (14.4%) |
| $50,000 to $74,999 | 227 (12.9%) | 57 (20.5%) |
| $75,000 to $99,999 | 263 (15.0%) | 26 (9.3%) |
| $100,000 to $149,999 | 461 (26.3%) | 5 (1.8%) |
| $150,000 or more | 664 (37.8%) | 69 (24.8%) |
| Total | 1,755 (100.0%) | 278 (100.0%) |
Monthly Housing Cost Tiers in Panther Valley
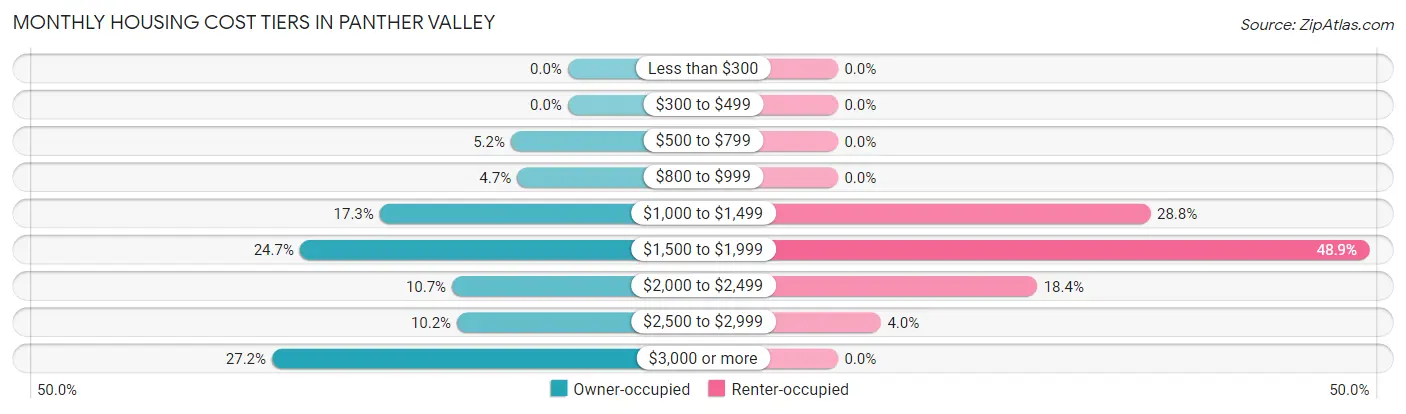
| Monthly Cost | Owner-occupied | Renter-occupied |
| Less than $300 | 0 (0.0%) | 0 (0.0%) |
| $300 to $499 | 0 (0.0%) | 0 (0.0%) |
| $500 to $799 | 92 (5.2%) | 0 (0.0%) |
| $800 to $999 | 82 (4.7%) | 0 (0.0%) |
| $1,000 to $1,499 | 304 (17.3%) | 80 (28.8%) |
| $1,500 to $1,999 | 433 (24.7%) | 136 (48.9%) |
| $2,000 to $2,499 | 187 (10.7%) | 51 (18.3%) |
| $2,500 to $2,999 | 179 (10.2%) | 11 (4.0%) |
| $3,000 or more | 478 (27.2%) | 0 (0.0%) |
| Total | 1,755 (100.0%) | 278 (100.0%) |
Physical Housing Characteristics in Panther Valley
Housing Structures in Panther Valley
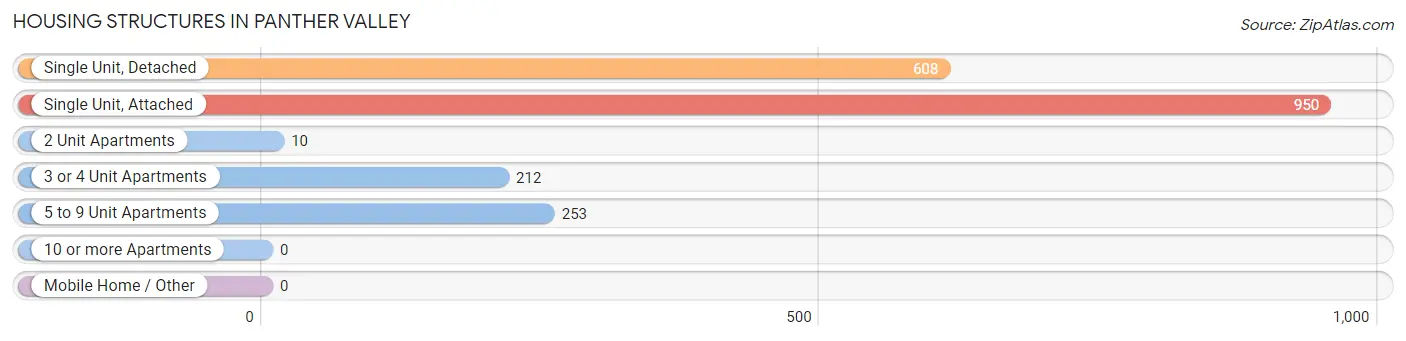
| Structure Type | # Housing Units | % Housing Units |
| Single Unit, Detached | 608 | 29.9% |
| Single Unit, Attached | 950 | 46.7% |
| 2 Unit Apartments | 10 | 0.5% |
| 3 or 4 Unit Apartments | 212 | 10.4% |
| 5 to 9 Unit Apartments | 253 | 12.4% |
| 10 or more Apartments | 0 | 0.0% |
| Mobile Home / Other | 0 | 0.0% |
| Total | 2,033 | 100.0% |
Housing Structures by Occupancy in Panther Valley
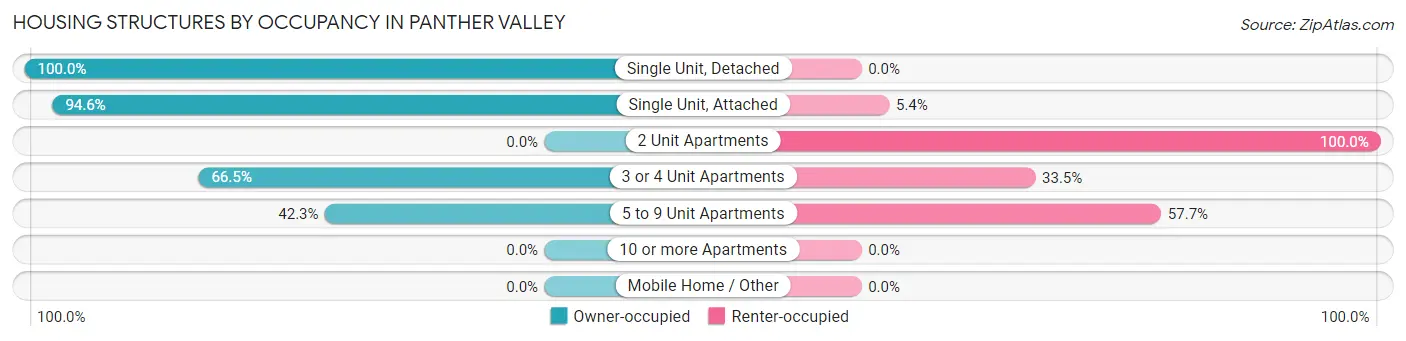
| Structure Type | Owner-occupied | Renter-occupied |
| Single Unit, Detached | 608 (100.0%) | 0 (0.0%) |
| Single Unit, Attached | 899 (94.6%) | 51 (5.4%) |
| 2 Unit Apartments | 0 (0.0%) | 10 (100.0%) |
| 3 or 4 Unit Apartments | 141 (66.5%) | 71 (33.5%) |
| 5 to 9 Unit Apartments | 107 (42.3%) | 146 (57.7%) |
| 10 or more Apartments | 0 (0.0%) | 0 (0.0%) |
| Mobile Home / Other | 0 (0.0%) | 0 (0.0%) |
| Total | 1,755 (86.3%) | 278 (13.7%) |
Housing Structures by Number of Rooms in Panther Valley
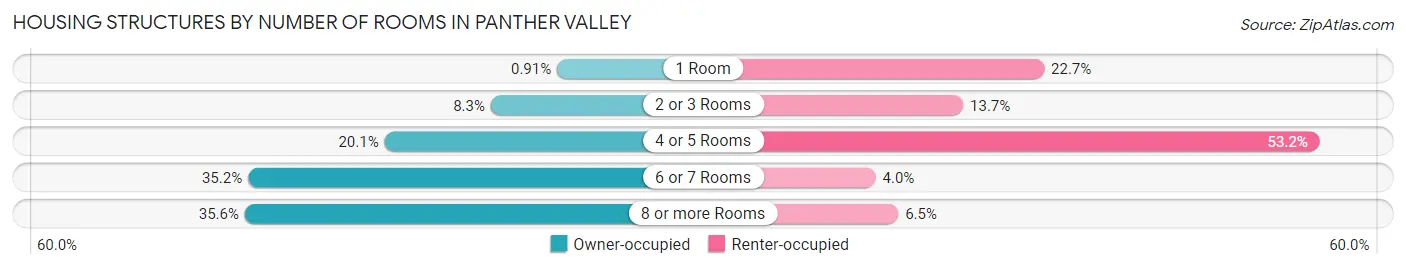
| Number of Rooms | Owner-occupied | Renter-occupied |
| 1 Room | 16 (0.9%) | 63 (22.7%) |
| 2 or 3 Rooms | 145 (8.3%) | 38 (13.7%) |
| 4 or 5 Rooms | 352 (20.1%) | 148 (53.2%) |
| 6 or 7 Rooms | 618 (35.2%) | 11 (4.0%) |
| 8 or more Rooms | 624 (35.6%) | 18 (6.5%) |
| Total | 1,755 (100.0%) | 278 (100.0%) |
Housing Structure by Heating Type in Panther Valley
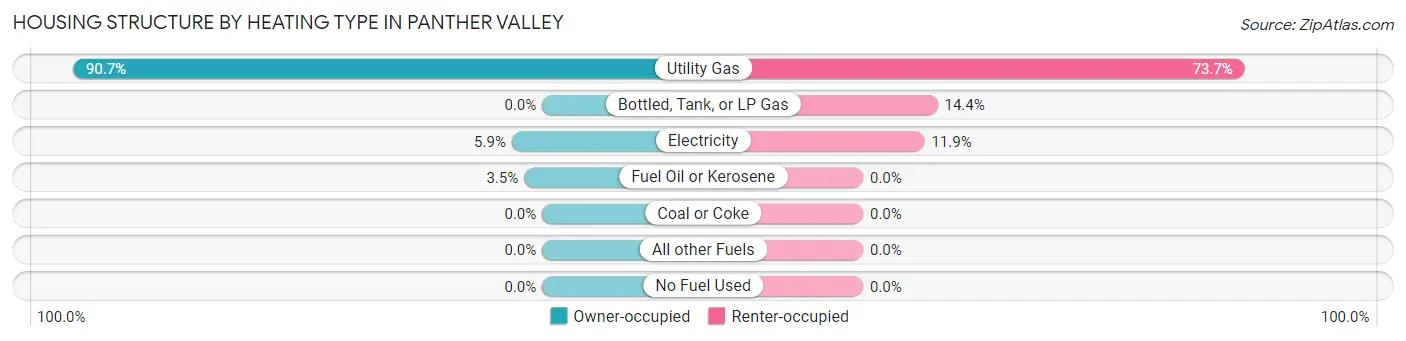
| Heating Type | Owner-occupied | Renter-occupied |
| Utility Gas | 1,591 (90.7%) | 205 (73.7%) |
| Bottled, Tank, or LP Gas | 0 (0.0%) | 40 (14.4%) |
| Electricity | 103 (5.9%) | 33 (11.9%) |
| Fuel Oil or Kerosene | 61 (3.5%) | 0 (0.0%) |
| Coal or Coke | 0 (0.0%) | 0 (0.0%) |
| All other Fuels | 0 (0.0%) | 0 (0.0%) |
| No Fuel Used | 0 (0.0%) | 0 (0.0%) |
| Total | 1,755 (100.0%) | 278 (100.0%) |
Household Vehicle Usage in Panther Valley
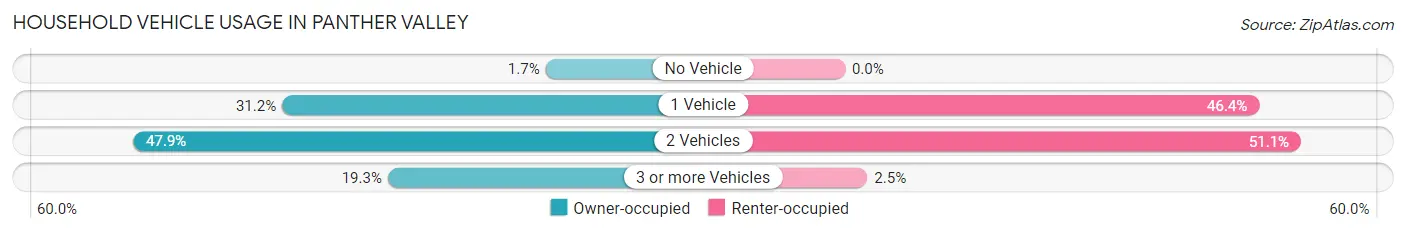
| Vehicles per Household | Owner-occupied | Renter-occupied |
| No Vehicle | 29 (1.7%) | 0 (0.0%) |
| 1 Vehicle | 547 (31.2%) | 129 (46.4%) |
| 2 Vehicles | 840 (47.9%) | 142 (51.1%) |
| 3 or more Vehicles | 339 (19.3%) | 7 (2.5%) |
| Total | 1,755 (100.0%) | 278 (100.0%) |
Real Estate & Mortgages in Panther Valley
Real Estate and Mortgage Overview in Panther Valley
| Characteristic | Without Mortgage | With Mortgage |
| Housing Units | 453 | 1,302 |
| Median Property Value | $329,500 | $345,900 |
| Median Household Income | $119,034 | $534 |
| Monthly Housing Costs | $1,206 | $478 |
| Real Estate Taxes | $7,917 | $68 |
Property Value by Mortgage Status in Panther Valley
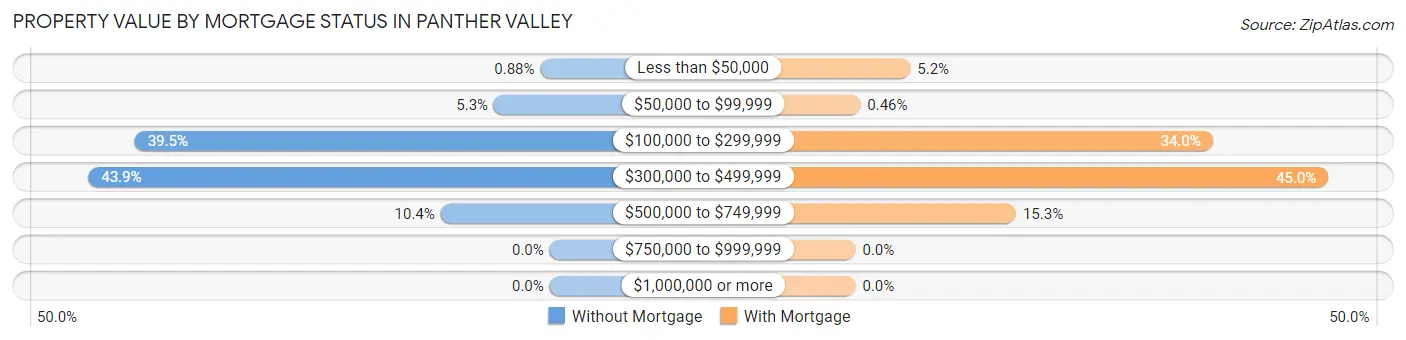
| Property Value | Without Mortgage | With Mortgage |
| Less than $50,000 | 4 (0.9%) | 68 (5.2%) |
| $50,000 to $99,999 | 24 (5.3%) | 6 (0.5%) |
| $100,000 to $299,999 | 179 (39.5%) | 443 (34.0%) |
| $300,000 to $499,999 | 199 (43.9%) | 586 (45.0%) |
| $500,000 to $749,999 | 47 (10.4%) | 199 (15.3%) |
| $750,000 to $999,999 | 0 (0.0%) | 0 (0.0%) |
| $1,000,000 or more | 0 (0.0%) | 0 (0.0%) |
| Total | 453 (100.0%) | 1,302 (100.0%) |
Household Income by Mortgage Status in Panther Valley
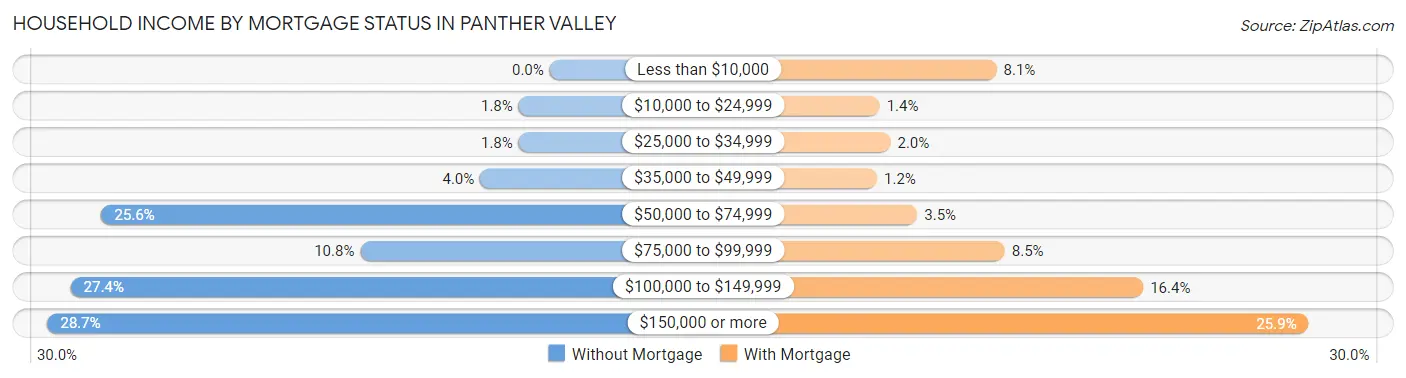
| Household Income | Without Mortgage | With Mortgage |
| Less than $10,000 | 0 (0.0%) | 105 (8.1%) |
| $10,000 to $24,999 | 8 (1.8%) | 18 (1.4%) |
| $25,000 to $34,999 | 8 (1.8%) | 26 (2.0%) |
| $35,000 to $49,999 | 18 (4.0%) | 16 (1.2%) |
| $50,000 to $74,999 | 116 (25.6%) | 46 (3.5%) |
| $75,000 to $99,999 | 49 (10.8%) | 111 (8.5%) |
| $100,000 to $149,999 | 124 (27.4%) | 214 (16.4%) |
| $150,000 or more | 130 (28.7%) | 337 (25.9%) |
| Total | 453 (100.0%) | 1,302 (100.0%) |
Property Value to Household Income Ratio in Panther Valley
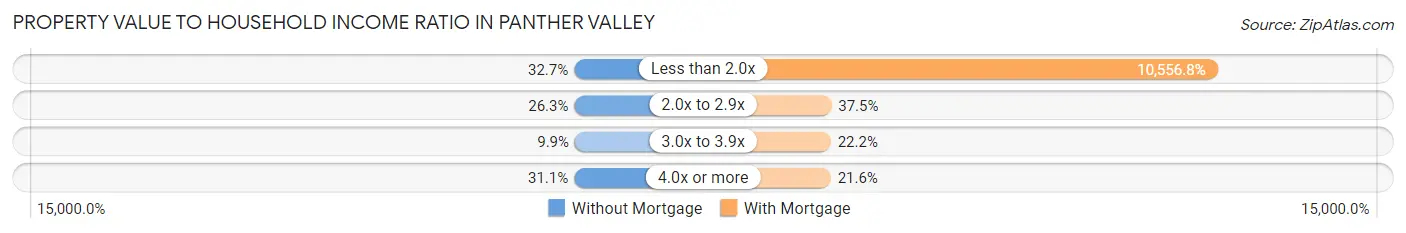
| Value-to-Income Ratio | Without Mortgage | With Mortgage |
| Less than 2.0x | 148 (32.7%) | 137,450 (10,556.8%) |
| 2.0x to 2.9x | 119 (26.3%) | 488 (37.5%) |
| 3.0x to 3.9x | 45 (9.9%) | 289 (22.2%) |
| 4.0x or more | 141 (31.1%) | 281 (21.6%) |
| Total | 453 (100.0%) | 1,302 (100.0%) |
Real Estate Taxes by Mortgage Status in Panther Valley
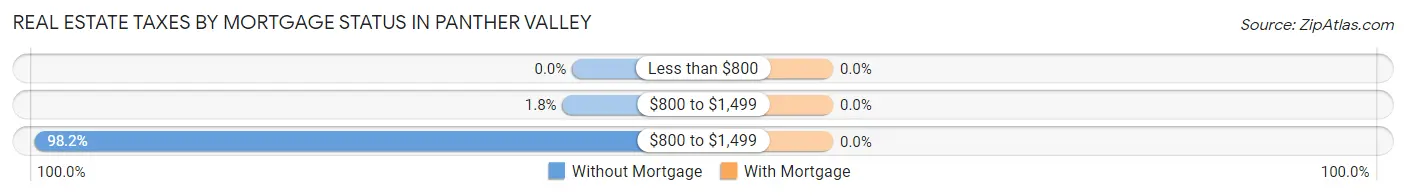
| Property Taxes | Without Mortgage | With Mortgage |
| Less than $800 | 0 (0.0%) | 0 (0.0%) |
| $800 to $1,499 | 8 (1.8%) | 0 (0.0%) |
| $800 to $1,499 | 445 (98.2%) | 0 (0.0%) |
| Total | 453 (100.0%) | 1,302 (100.0%) |
Health & Disability in Panther Valley
Health Insurance Coverage by Age in Panther Valley
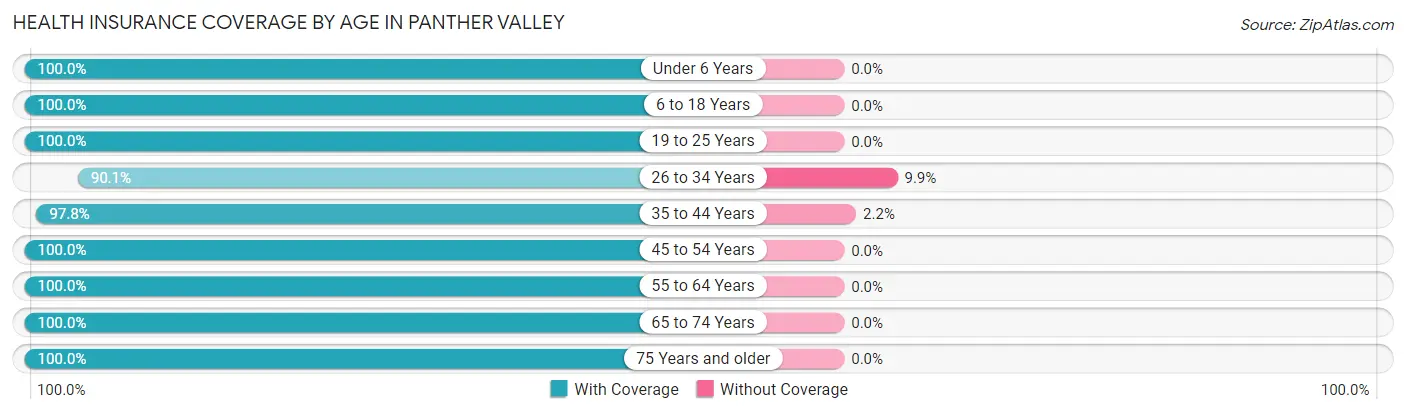
| Age Bracket | With Coverage | Without Coverage |
| Under 6 Years | 392 (100.0%) | 0 (0.0%) |
| 6 to 18 Years | 459 (100.0%) | 0 (0.0%) |
| 19 to 25 Years | 259 (100.0%) | 0 (0.0%) |
| 26 to 34 Years | 245 (90.1%) | 27 (9.9%) |
| 35 to 44 Years | 399 (97.8%) | 9 (2.2%) |
| 45 to 54 Years | 868 (100.0%) | 0 (0.0%) |
| 55 to 64 Years | 632 (100.0%) | 0 (0.0%) |
| 65 to 74 Years | 888 (100.0%) | 0 (0.0%) |
| 75 Years and older | 384 (100.0%) | 0 (0.0%) |
| Total | 4,526 (99.2%) | 36 (0.8%) |
Health Insurance Coverage by Citizenship Status in Panther Valley
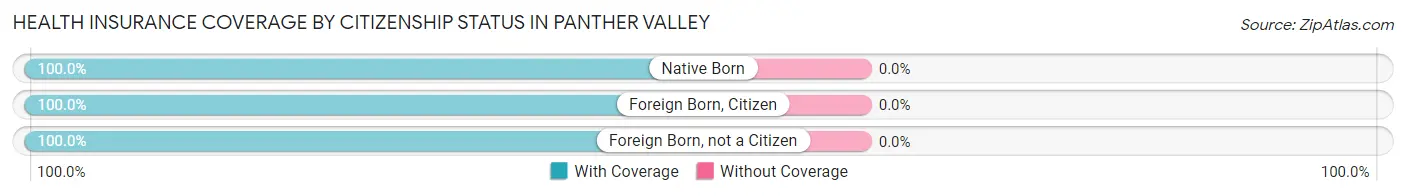
| Citizenship Status | With Coverage | Without Coverage |
| Native Born | 392 (100.0%) | 0 (0.0%) |
| Foreign Born, Citizen | 459 (100.0%) | 0 (0.0%) |
| Foreign Born, not a Citizen | 259 (100.0%) | 0 (0.0%) |
Health Insurance Coverage by Household Income in Panther Valley
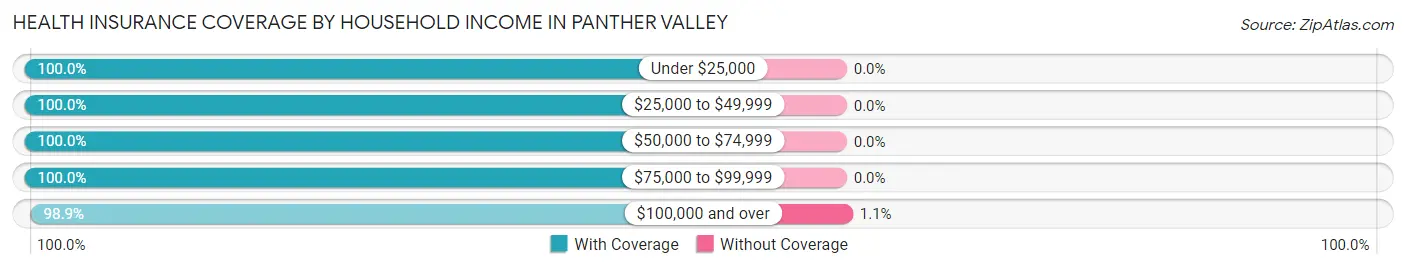
| Household Income | With Coverage | Without Coverage |
| Under $25,000 | 180 (100.0%) | 0 (0.0%) |
| $25,000 to $49,999 | 133 (100.0%) | 0 (0.0%) |
| $50,000 to $74,999 | 467 (100.0%) | 0 (0.0%) |
| $75,000 to $99,999 | 599 (100.0%) | 0 (0.0%) |
| $100,000 and over | 3,132 (98.9%) | 36 (1.1%) |
Public vs Private Health Insurance Coverage by Age in Panther Valley
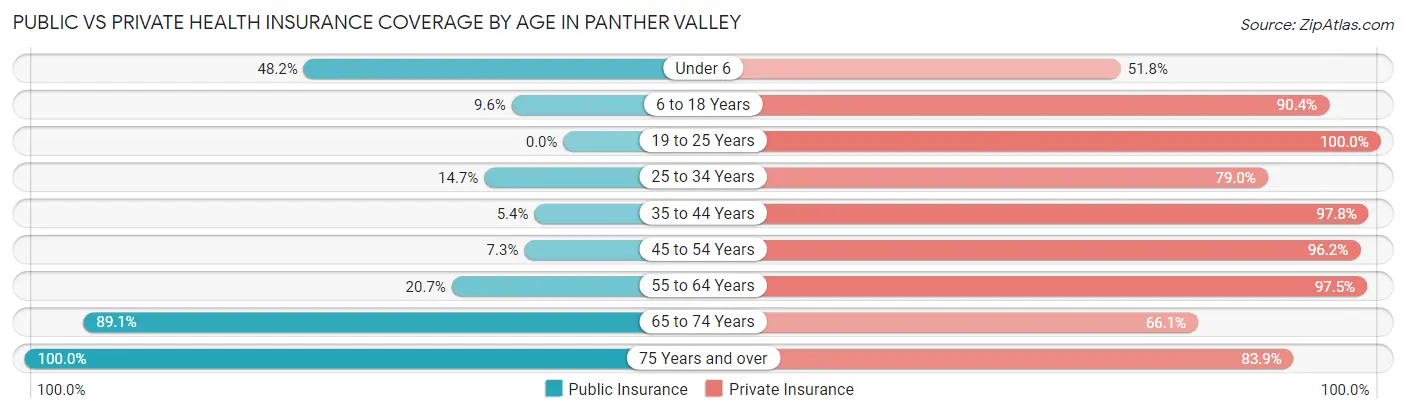
| Age Bracket | Public Insurance | Private Insurance |
| Under 6 | 189 (48.2%) | 203 (51.8%) |
| 6 to 18 Years | 44 (9.6%) | 415 (90.4%) |
| 19 to 25 Years | 0 (0.0%) | 259 (100.0%) |
| 25 to 34 Years | 40 (14.7%) | 215 (79.0%) |
| 35 to 44 Years | 22 (5.4%) | 399 (97.8%) |
| 45 to 54 Years | 63 (7.3%) | 835 (96.2%) |
| 55 to 64 Years | 131 (20.7%) | 616 (97.5%) |
| 65 to 74 Years | 791 (89.1%) | 587 (66.1%) |
| 75 Years and over | 384 (100.0%) | 322 (83.9%) |
| Total | 1,664 (36.5%) | 3,851 (84.4%) |
Disability Status by Sex by Age in Panther Valley
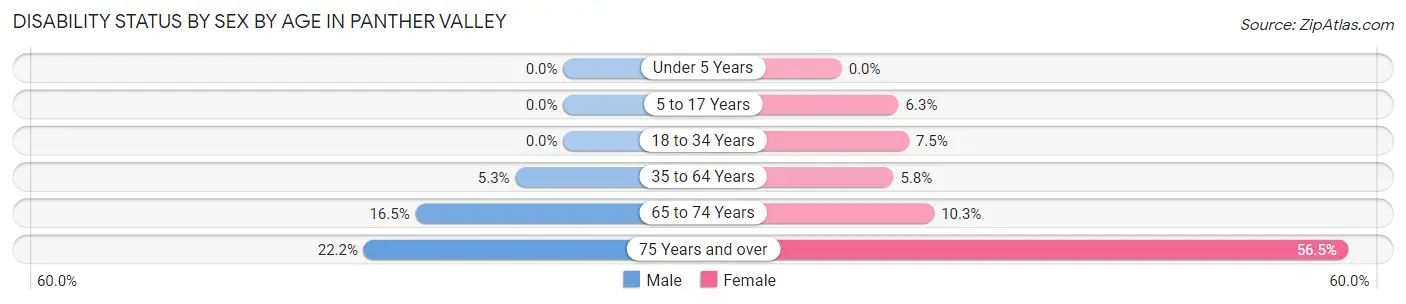
| Age Bracket | Male | Female |
| Under 5 Years | 0 (0.0%) | 0 (0.0%) |
| 5 to 17 Years | 0 (0.0%) | 15 (6.3%) |
| 18 to 34 Years | 0 (0.0%) | 30 (7.5%) |
| 35 to 64 Years | 49 (5.3%) | 57 (5.8%) |
| 65 to 74 Years | 55 (16.5%) | 57 (10.3%) |
| 75 Years and over | 44 (22.2%) | 105 (56.5%) |
Disability Class by Sex by Age in Panther Valley
Disability Class: Hearing Difficulty
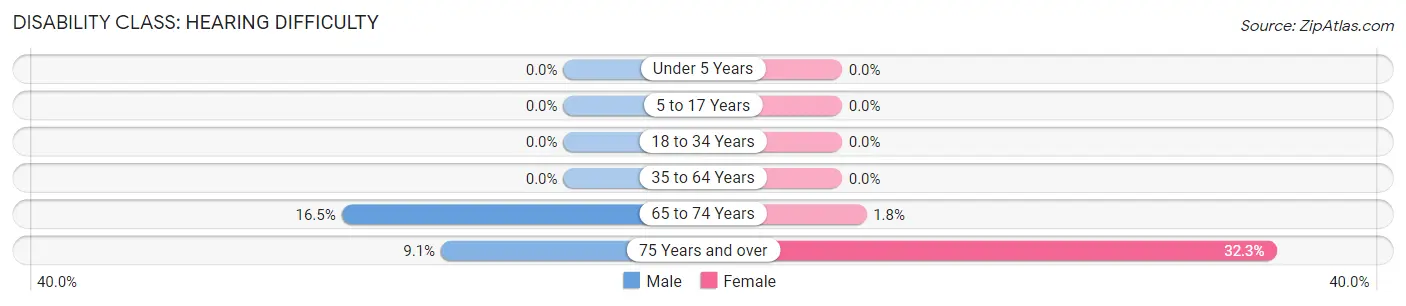
| Age Bracket | Male | Female |
| Under 5 Years | 0 (0.0%) | 0 (0.0%) |
| 5 to 17 Years | 0 (0.0%) | 0 (0.0%) |
| 18 to 34 Years | 0 (0.0%) | 0 (0.0%) |
| 35 to 64 Years | 0 (0.0%) | 0 (0.0%) |
| 65 to 74 Years | 55 (16.5%) | 10 (1.8%) |
| 75 Years and over | 18 (9.1%) | 60 (32.3%) |
Disability Class: Vision Difficulty
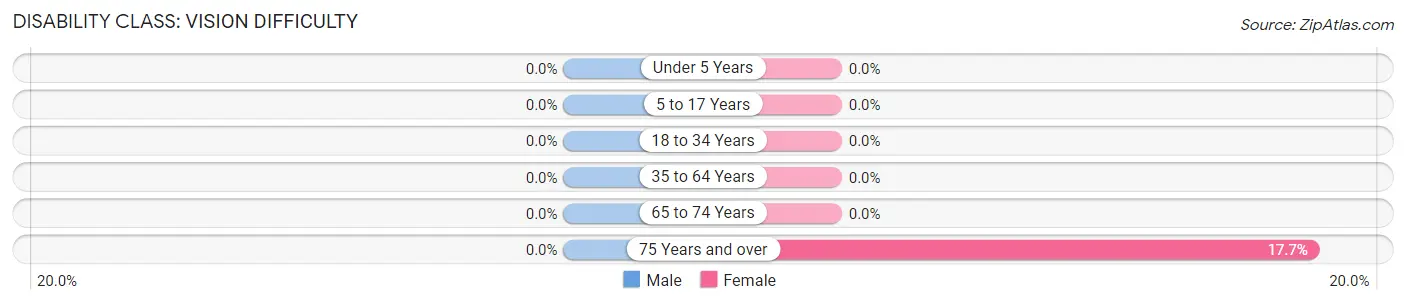
| Age Bracket | Male | Female |
| Under 5 Years | 0 (0.0%) | 0 (0.0%) |
| 5 to 17 Years | 0 (0.0%) | 0 (0.0%) |
| 18 to 34 Years | 0 (0.0%) | 0 (0.0%) |
| 35 to 64 Years | 0 (0.0%) | 0 (0.0%) |
| 65 to 74 Years | 0 (0.0%) | 0 (0.0%) |
| 75 Years and over | 0 (0.0%) | 33 (17.7%) |
Disability Class: Cognitive Difficulty
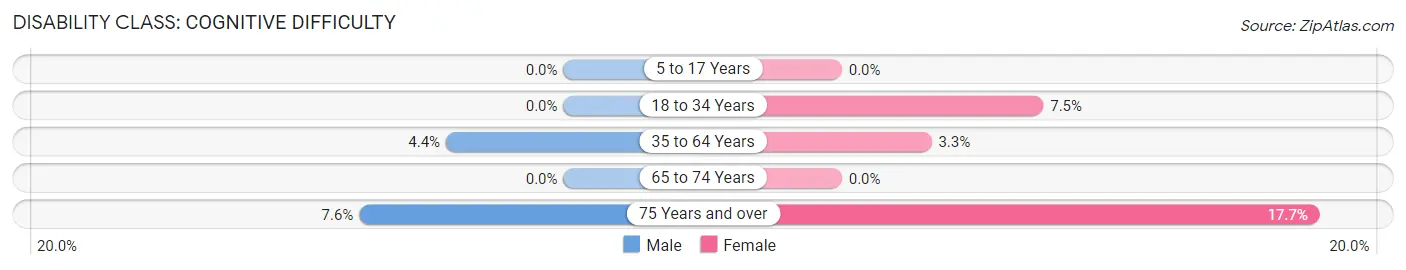
| Age Bracket | Male | Female |
| 5 to 17 Years | 0 (0.0%) | 0 (0.0%) |
| 18 to 34 Years | 0 (0.0%) | 30 (7.5%) |
| 35 to 64 Years | 40 (4.4%) | 33 (3.3%) |
| 65 to 74 Years | 0 (0.0%) | 0 (0.0%) |
| 75 Years and over | 15 (7.6%) | 33 (17.7%) |
Disability Class: Ambulatory Difficulty
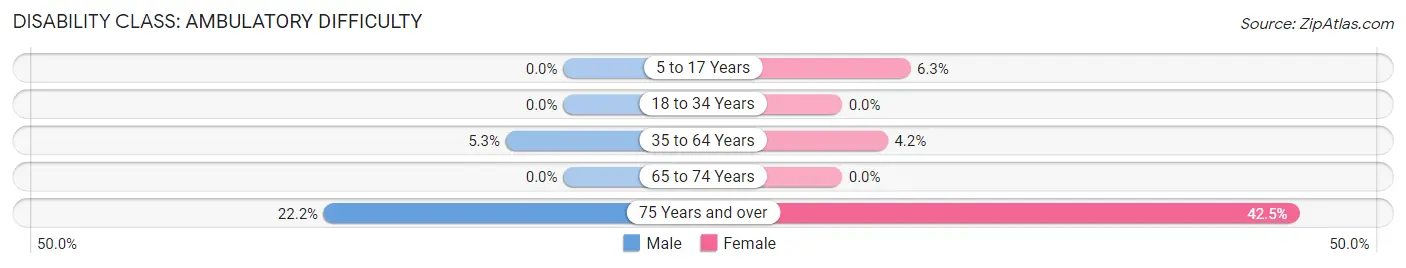
| Age Bracket | Male | Female |
| 5 to 17 Years | 0 (0.0%) | 15 (6.3%) |
| 18 to 34 Years | 0 (0.0%) | 0 (0.0%) |
| 35 to 64 Years | 49 (5.3%) | 42 (4.2%) |
| 65 to 74 Years | 0 (0.0%) | 0 (0.0%) |
| 75 Years and over | 44 (22.2%) | 79 (42.5%) |
Disability Class: Self-Care Difficulty
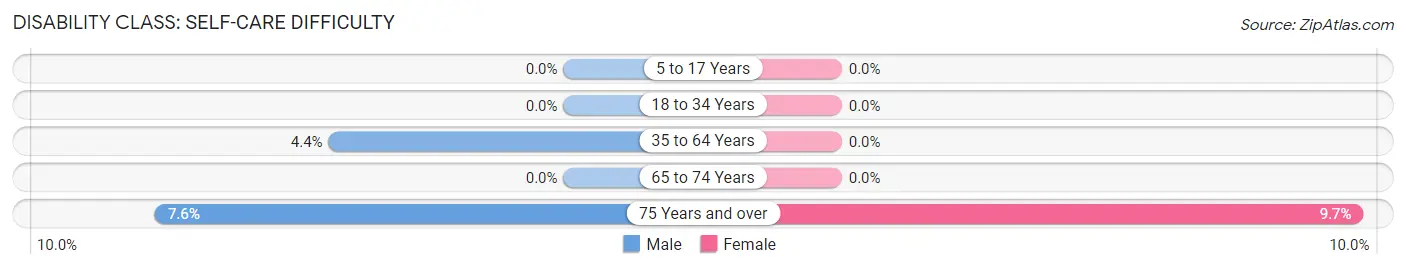
| Age Bracket | Male | Female |
| 5 to 17 Years | 0 (0.0%) | 0 (0.0%) |
| 18 to 34 Years | 0 (0.0%) | 0 (0.0%) |
| 35 to 64 Years | 40 (4.4%) | 0 (0.0%) |
| 65 to 74 Years | 0 (0.0%) | 0 (0.0%) |
| 75 Years and over | 15 (7.6%) | 18 (9.7%) |
Technology Access in Panther Valley
Computing Device Access in Panther Valley
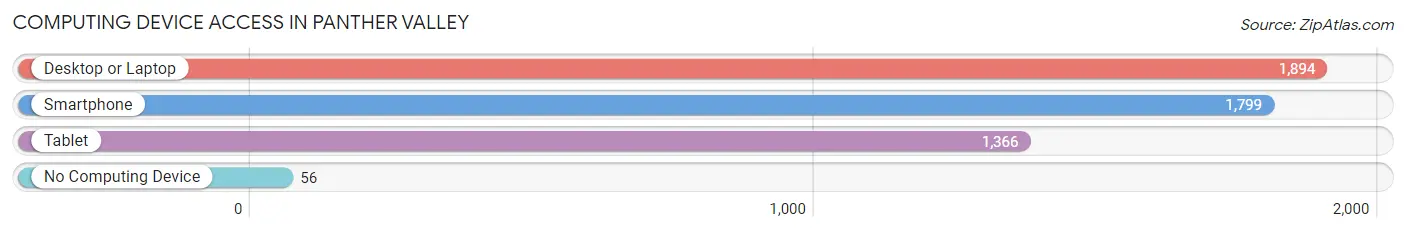
| Device Type | # Households | % Households |
| Desktop or Laptop | 1,894 | 93.2% |
| Smartphone | 1,799 | 88.5% |
| Tablet | 1,366 | 67.2% |
| No Computing Device | 56 | 2.8% |
| Total | 2,033 | 100.0% |
Internet Access in Panther Valley
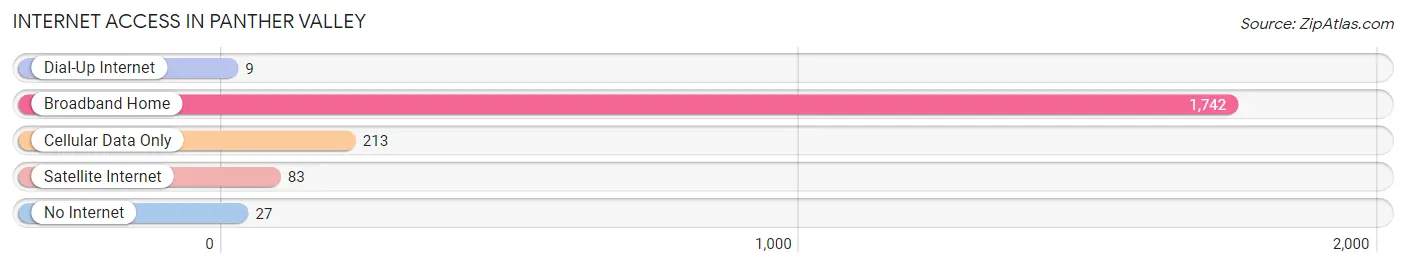
| Internet Type | # Households | % Households |
| Dial-Up Internet | 9 | 0.4% |
| Broadband Home | 1,742 | 85.7% |
| Cellular Data Only | 213 | 10.5% |
| Satellite Internet | 83 | 4.1% |
| No Internet | 27 | 1.3% |
| Total | 2,033 | 100.0% |
Panther Valley Summary
Panther Valley is a census-designated place located in Allamuchy Township, Warren County, New Jersey. It is situated in the Kittatinny Valley, a region of the Great Appalachian Valley that stretches from Canada to Alabama. Panther Valley is located in the northwest corner of Warren County, approximately 50 miles northwest of New York City.
Geography
Panther Valley is located at 40°54'45" North, 74°59'45" West (40.912500, -74.995833). It is situated in the Kittatinny Valley, a region of the Great Appalachian Valley that stretches from Canada to Alabama. Panther Valley is located in the northwest corner of Warren County, approximately 50 miles northwest of New York City.
The area is characterized by rolling hills and valleys, with elevations ranging from 500 to 1,000 feet above sea level. The terrain is mostly forested, with some open fields and meadows. The area is drained by the Musconetcong River, which flows through Panther Valley and is a tributary of the Delaware River.
Demographics
As of the 2010 United States Census, Panther Valley had a population of 1,945. The racial makeup of the CDP was 94.2% White, 2.2% African American, 0.2% Native American, 0.9% Asian, 0.1% Pacific Islander, 0.9% from other races, and 1.5% from two or more races. Hispanic or Latino of any race were 3.7% of the population.
The median household income in Panther Valley was $68,750 in 2019, up from $63,750 in 2010. The median home value was $310,000 in 2019, up from $280,000 in 2010.
Economy
The economy of Panther Valley is largely based on agriculture and tourism. The area is home to several farms, including dairy farms, vegetable farms, and apple orchards. The area is also popular with tourists, who come to enjoy the scenic views, hiking trails, and fishing opportunities.
The area is also home to several small businesses, including restaurants, retail stores, and service providers. The area is served by the Panther Valley Mall, which features a variety of stores and restaurants.
History
Panther Valley was first settled in the late 1700s by German and Dutch immigrants. The area was originally known as "Panther Valley" due to the presence of panthers in the area. The area was largely agricultural, with farms producing dairy, vegetables, and apples.
In the late 1800s, the area began to develop as a tourist destination. The area was served by the Delaware, Lackawanna and Western Railroad, which brought visitors from New York City and other cities. The area was also home to several resorts, including the Panther Valley Inn and the Panther Valley Hotel.
In the early 1900s, the area began to develop as a residential community. The area was served by the Panther Valley School District, which was established in 1921. The area continued to grow throughout the 20th century, and today Panther Valley is a thriving residential community.
Common Questions
What is the Total Population of Panther Valley?
Total Population of Panther Valley is 4,562.
What is the Total Male Population of Panther Valley?
Total Male Population of Panther Valley is 2,103.
What is the Total Female Population of Panther Valley?
Total Female Population of Panther Valley is 2,459.
What is the Ratio of Males per 100 Females in Panther Valley?
There are 85.52 Males per 100 Females in Panther Valley.
What is the Ratio of Females per 100 Males in Panther Valley?
There are 116.93 Females per 100 Males in Panther Valley.
What is the Median Population Age in Panther Valley?
Median Population Age in Panther Valley is 49.8 Years.
What is the Average Family Size in Panther Valley
Average Family Size in Panther Valley is 3.0 People.
What is the Average Household Size in Panther Valley
Average Household Size in Panther Valley is 2.2 People.
What is Per Capita Income in Panther Valley?
Per Capita income in Panther Valley is $65,314.
What is the Median Family Income in Panther Valley?
Median Family Income in Panther Valley is $172,597.
What is the Median Household income in Panther Valley?
Median Household Income in Panther Valley is $124,035.
What is Income or Wage Gap in Panther Valley?
Income or Wage Gap in Panther Valley is 29.5%.
Women in Panther Valley earn 70.5 cents for every dollar earned by a man.
What is Inequality or Gini Index in Panther Valley?
Inequality or Gini Index in Panther Valley is 0.37.
How Large is the Labor Force in Panther Valley?
There are 2,519 People in the Labor Forcein in Panther Valley.
What is the Percentage of People in the Labor Force in Panther Valley?
66.7% of People are in the Labor Force in Panther Valley.
What is the Unemployment Rate in Panther Valley?
Unemployment Rate in Panther Valley is 8.3%.